Abstract
Large amounts of aerosols remain in the residual layer (RL) after sunset, which may be the source of the next day’s pollutants. However, the characteristics of the nocturnal residual layer height (RLH) and its effect on urban environment pollution are unknown. In this study, the characteristics of the RLH and its effect on fine particles with diameters <2.5 μm (PM2.5) were investigated using lidar data from January 2017 to December 2019. The results show that the RLH is highest in summer (1.55 ± 0.55 km), followed by spring (1.40 ± 0.58 km) and autumn (1.26 ± 0.47 km), and is lowest in winter (1.11 ± 0.44 km). The effect of surface meteorological factors on the RLH were also studied. The correlation coefficients (R) between the RLH and the temperature, relative humidity, wind speed, and pressure were 0.38, −0.18, 0.15, and −0.36, respectively. The results indicate that the surface meteorological parameters exhibit a slight correlation with the RLH, but the high relative humidity was accompanied by a low RLH and high PM2.5 concentrations. Finally, the influence of the RLH on PM2.5 was discussed under different aerosol-loading periods. The aerosol optical depth (AOD) was employed to represent the total amount of pollutants. The results show that the RLH has an effect on PM2.5 when the AOD is small but has almost no effect on PM2.5 when the AOD is high. In addition, the R between the nighttime mean RLH and the following daytime PM2.5 at low AOD is −0.49, suggesting that the RLH may affect the following daytime surface PM2.5. The results of this study have a guiding significance for understanding the interaction between aerosols and the boundary layer.
1. Introduction
The residual layer (RL) is a neutral layer suspended above the stable boundary layer (SBL) at night [1,2]. The SBL hinders the exchange of pollutants and energy between the surface and the free atmosphere; thus, most of the energy and pollutants in the daytime mixing layer are retained in the RL [3]. The RL can retain large amounts of aerosols, which may be the source of the next day’s pollutants and may further affect the surface environment [4,5]. The environmental pollution caused by high fine particles with diameters <2.5 μm (PM2.5) leads to low visibility, climate change, and health effects [6,7,8]. Moreover, the chemical reactions in the RL directly increase the near-surface nitrate concentration, which has adverse effects on people’s health and damages human organs [9,10,11]. Therefore, the characteristics of the RL are worthy of research.
In recent years, a number of studies have characterized the residual layer [12,13,14]. The RL is evolved from the daytime mixing layer. The mixing layer evolves into the RL and the SBL after sunset. Liu et al. [3] investigated the effect of RL transport on air pollution in Beijing on the basis of the ceilometer measurement and pointed out that a large number of pollutants are stored in the RL, which would be transported into the daytime mixing layer with increasing turbulence. Sun et al. [4] studied the vertical distribution of PM2.5 within the boundary layer during summer haze in Beijing and found that the long-distance transport in the RL at night results in high aerosol retention. Liu et al. [5] studied the nocturnal residual layer height (RLH) and the aerosol loading in the RL over Wuhan on the basis of the lidar observations. They found that the aerosol in the RL is positively correlated with the RLH, and that the correlation coefficient (R2) is approximately 0.58. These studies prove that large amounts of pollutants can be stored in the residual layer. However, the relationship between the RL and the surface PM2.5 is not clear and warrants further investigation. Shi et al. [15] assessed the relationship between aerosol and PM2.5 by using Cloud-Aerosol Lidar and Infrared Pathfinder Satellite Observation data. They found that high aerosol loading in the RL increases the concentration of the surface PM2.5. Liakakou et al. [16] analyzed the concurrent effects of the mixing layer height and wind speed on black carbon concentrations in Athens, revealing the dispersion and dilution processes of the pollutants. Dumka et al. [17,18] analyzed the influence of the mixing layer height variations on pollutants and carbonaceous aerosol concentrations in Delhi. These studies have improved our understanding of the relationship between the RL and pollutants. However, there is no further analysis discussing the impact of the RLH on the surface PM2.5 concentrations. Therefore, the variations in RLHs, the parameters affecting RLHs, and their influence on PM2.5 concentrations needs to be studied.
In this study, the characteristics of the nocturnal RLH and its effects on the surface PM2.5 over Wuhan were investigated using long-term lidar observation data from January 2017 to December 2019. The variations in the RLH obtained from lidar data inversion and other meteorological parameters were analyzed, and the relationship among these parameters was investigated. The relationship between the RLH and PM2.5 at the corresponding time and the next day was also researched. The rest of this article is organized as follows: Section 2 introduces the study area and the data. Section 3 explains the RLH and introduces aerosol optical depth (AOD) retrieval methods. In Section 4, the experiments are described, and the results and discussion are presented. Section 5 summarizes this work.
2. Materials and Data
2.1. Observation Site
Wuhan is an important industrial city that is under large-scale urban construction and rapid expansion [19], as shown in Figure 1. Wuhan can represent the urban development process that most Chinese cities have undergone or are going through [20]. An atmospheric observatory was set up at Wuhan University (114°21′E, 30°32′N). It is inside the Wuhan city, surrounded by buildings and stadiums. The atmospheric observatory is equipped with a series of instruments, such as a lidar system and a microwave radiometer [21].
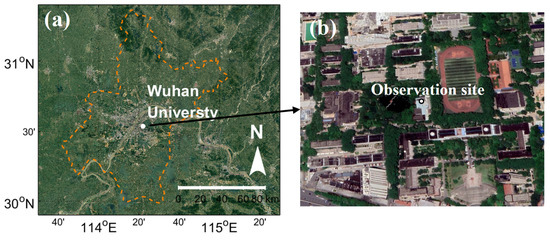
Figure 1.
Study area of (a) Wuhan, Hubei Province; and (b) observation site.
2.2. Lidar Data
A Mie lidar system was used to observe the vertical distribution of aerosols. The wavelength and repetition frequencies of the lidar system were 532 nm and 20 Hz, respectively. Moreover, the vertical resolution and time interval of the raw data were 3.75 m and 1 min, respectively. Detailed parameters of the lidar system have been reported in previous research [21]. The system can measure the aerosol backscatter and extinction coefficients. Because the RL appears at nighttime, the lidar data were collected from 20:00 local time (LT) to 5:00 LT (next day). The data period was from January 2017 to December 2019. In addition, because of the elevated aerosol layers and the fact that clouds may affect the detection of the RL, the days with rain, clouds, and elevated aerosol layers were removed. The raw data were averaged in 1-h intervals to reduce the effects of background noise. The total number of hourly mean samples was 1433.
2.3. Ground Surface PM2.5 Data
Surface PM2.5 data were obtained from the China National Environmental Monitoring Center (CNEMC), which are available on the website (http://www.cnemc.cn (accessed on 18 November 2021)). The CNEMC can provide hourly values of the PM2.5 in stations and cities. Hourly PM2.5 is thought to have relatively high credibility [22,23]. In this study, the hourly average PM2.5 was used to represent the surface PM2.5. The PM2.5 data were collected from January 2017 to December 2019. The PM2.5 data corresponding to the lidar data is the hourly average. In addition, the average PM2.5 value from 12:00 to 16:00 LT on the next day was calculated to represent the PM2.5 concentrations on the next day. This value was used to study the effect of the RLH on the following daytime PM2.5.
2.4. Other Meteorological Data
Other meteorological data were obtained from the China Meteorological Data Service Center (CMDC), which are available on the website (http://data.cma.cn (accessed on 18 November 2021)). The CMDC can provide hourly values of temperature (Temp), relative humidity (RH), atmospheric pressure (Pres), and wind direction and wind speed (WS) in stations and cities [24,25]. Meteorological data were also collected from January 2017 to December 2019. The meteorological data matched with the lidar data at the corresponding time.
3. Methods
3.1. Retrieval of AOD
The AOD is an important parameter that can directly reflect the aerosol loading in the atmosphere. It was calculated from the aerosol extinction coefficient. According to the Fernald method [26], the aerosol extinction coefficient can be calculated by the lidar equation:
where C is a calibration constant; P0 is the output pulse energy; βm(r) and αm(r) are the backscatter and extinction coefficients of the molecules, respectively. These two parameters can be calculated by the standard atmosphere model [18]. βa(r) and αa(r) are the backscatter and extinction coefficients of the aerosols, respectively. These two parameters need to be retrieved by the Fernald method [26]. Following previous studies [5,21], the aerosol lidar ratio was set as 50 sr in the 0–6 km atmospheric layer over Wuhan, and 6 km was defined as the calibration height. Finally, the aerosol extinction coefficient was obtained by backward iteration.
The AOD value was the integral of the extinction coefficient along the optical path between r1 and r2 [5]:
where α(r) represents the atmospheric extinction coefficient, and r1 and r2 represent the start and end points, respectively. Given the effect of the overlap factor, since the overlap height of the lidar system was 150 m [21], the lidar signals from 0 to 150 m were removed. In here, the r1 and r2 were set to 3 and 0.15 km, respectively. The AOD was calculated from 0.15 to 3 km.
3.2. Retrieval of RLH
The vertical structure of the atmosphere boundary layer has obvious diurnal variations. It consisted of the mixed layer during the day, and of the SBL and the RL at nighttime [1,20]. Because the RL appears at nighttime, the RLH is calculated from 20:00 local time (LT) to 5:00 LT (next day). Before calculating the backscattering coefficient profiles, we screened the profile data on the basis of the gradient change of the range-corrected signal. After removing the profiles with clouds and elevated aerosol layers, the hourly mean profiles of the backscattering coefficients at nighttime were produced and are shown in Figure 2. Therefore, the RLH can be extracted from the backscatter profile by using the ideal profile fitting method [27]. This method fits an idealized backscatter profile, B(z), to the observed backscatter profile, b(z), by minimizing the measure of agreement between the two profiles. The ideal contour model consists of four undetermined parameters. One such form of an idealized backscatter profile B(z) is:
where Bm is the average value of the mixed layer backscatter; Bu is the average value of the backscatter in the air immediately above the mixed layer; zm is the mixed layer depth; and s is related to the thickness of the entrainment layer. This so-called “entrainment layer” is defined as that layer in which the mixing ratio of the boundary layer and the overlying air lies in the range of 0.05–0.95 [28]. The four idealized backscatter profile parameters can be determined by minimizing the root-mean-square deviation between B(z) and b(z). z is the detection height, and erf is the Gauss error function.
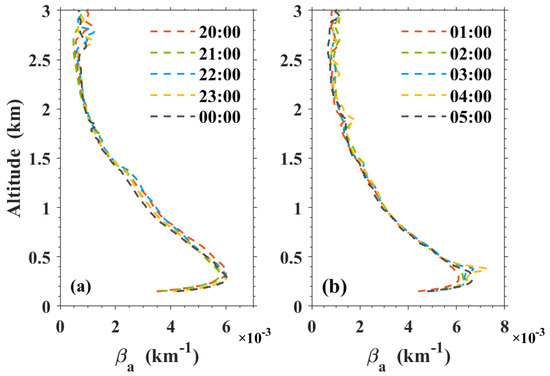
Figure 2.
Hourly mean profiles of backscattering coefficients at nighttime from January 2017 to December 2019. Hourly backscattering coefficients profiles from (a) 20:00 to 00:00 LT and from (b) 01:00 to 05:00 LT.
4. Results and Discussion
4.1. Variations of RLH
In this section, the variations in the hourly average RLHs, AODs, PM2.5, and meteorological parameters during the whole study period are analyzed. In addition, the seasonal variation of each parameter and the seasonal distribution of the RLH are analyzed based on the hourly average data.
Figure 3 shows the variations in the hourly mean AODs, PM2.5, RLHs, Temp, RHs, Pres, and WSs from 2017 to 2019. The AOD ranged from 0 to 2, and the PM2.5 ranged from 0 to 250 μg/m3 (Figure 3a). The variation trends of the AODs and the PM2.5 were not the same, especially during 2018. The AOD loading was large, whereas the surface PM2.5 concentrations were low. This result may have been caused by two reasons. On the one hand, the AOD only indicates the total amount of aerosols and pollutants, and the surface PM2.5 concentrations are also affected by vertical and horizontal diffusion [5]. On the other hand, the elevated aerosol layer, which is above the mixing layer, does not affect the surface PM2.5 concentrations [29,30]. As shown in Figure 3b, the PM2.5 concentrations were low when the RLH was large, which is similar to the relationship between the BLH and PM2.5, as previously reported [31,32]. Figure 3c shows the variations in the temperatures and the RHs. The RH was mostly greater than 80%, indicating that Wuhan is in a high-humidity environment. The Temp trend was opposite to that of the PM2.5 concentrations but was similar to that of the RLHs. The increase in Temp can increase the RLH, which will improve the diffusion ability of the aerosols and decrease PM2.5 concentrations [5]. The variation range of the Pres was approximately 1000 hPa to 1050 hPa, and the variation range of the WS was 0 to 6 m/s (Figure 3d). A decrease in the WS is not conducive to the diffusion of pollutants, and the PM2.5 concentration increases [33].
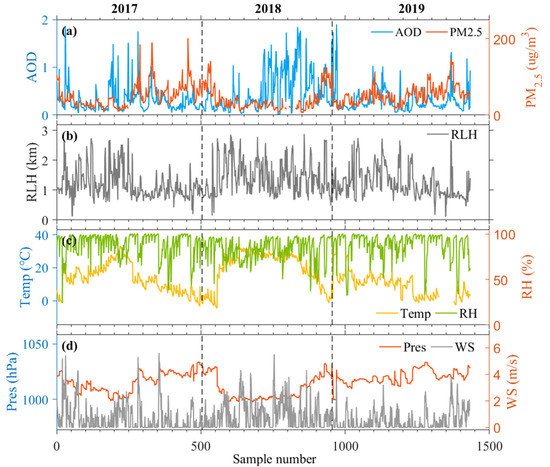
Figure 3.
Hourly mean variations of (a) AOD, PM2.5; (b) RLH; (c) Temp, RH; and (d) Pres and WS, from January 2017 to December 2019.
Figure 4 shows the seasonal distribution of the PM2.5, RLH, AOD, Temp, RH, and WS from 2017 to 2019. As shown in Figure 4a, the RLH was higher in summer (1.55 ± 0.55 km), followed by spring (1.40 ± 0.58 km) and autumn (1.26 ± 0.47 km), while it was the lowest in winter (1.11 ± 0.44 km). This is similar to the results observed by Wang et al. [33] in Beijing, and Liu et al. [5] in Wuhan. The PM2.5 concentrations were the highest in winter and the lowest in summer (Figure 4b). This seasonal variation is similar to the study by Hao et al. [34] in Wuhan. This phenomenon was also observed by Wang et al. [33] in Beijing. The difference is that the pollution level in Wuhan is lower than that in Beijing. Figure 4c shows that the AOD was the highest in summer, followed by autumn and winter, and was the lowest in spring. This result is consistent with the findings of Liu, which report that dust transport during summer increases the total amount of pollutants in Wuhan [5]. Shi et al. [15] also observed the high AOD in summer over the North China Plain. The hygroscopic growth of fine-mode-aerosol and biomass burning contribute to the high AOD in summer [35], and the secondary aerosol formation promoted by high temperature and humidity also contribute to the high aerosol loading [36]. The seasonal distribution of the Temp and WS were close to that of the RLH. The distribution of the RH was close to that of the PM2.5. These results indicate that, although the total amount of pollutants in summer is high, the surface PM2.5 concentrations are relatively low because of the better vertical (high RLH) and horizontal (high WS) diffusion conditions. However, in winter, the unfavorable weather (high RH) and diffusion (low RLH) conditions can easily cause haze.
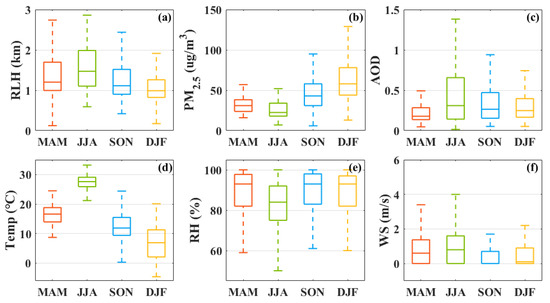
Figure 4.
Seasonal distribution of (a) RLH; (b) PM2.5; (c) AOD; (d) Temp; (e) RH; and (f) WS, from January 2017 to December 2019. The middle horizontal line of each bin represents the median value of each part, whereas the upper and lower ends of the box represent 25% and 75%, respectively, and the top and bottom of the dotted line represent 5% and 95%, respectively.
4.2. Influence of Meteorological Parameters
In this section, the effects of the meteorological parameters on the RLH and PM2.5 were studied. First, the correlation coefficients of the RLH, Temp, RH, WS, and Pres were calculated. The frequency distributions of the RLH and PM2.5 under different RH and WS conditions were then studied.
Figure 5 shows the correlation between different meteorological parameters and the RLH from January 2017 to December 2019, and this is used to study the influence of the meteorological parameters. The orange, blue, green, and red dots represent the spring, summer, autumn, and winter seasons, respectively. The correlation coefficients between the RLH and the Temp, RH, WS, and Pres were 0.38, −0.18, 0.15, and −0.36, respectively. They all pass the significance test (p < 0.05). Previous studies have indicated that Temp and WS exert positive influences on the variation in the mixing layer height [37]. This is due to the fact that a high Temp and WS increase the turbulence processes within the mixing layer and have a positive feedback on the mixing layer height. High pressure leads to subsidence and is negative feedback for the mixing layer height [38]. Guo et al. [39] also point out that the soil moisture has a negative association with the mixing layer height. Soil moisture can affect the variation in the surface heat flux and further affect the evolution of the mixing layer. However, the RLH is the generalized boundary layer height which is more closed to the mixing layer height during the previous daytime [40]. Our results show that Temp (Pres) exhibits a slight positive (negative) correlation with the RLH, and the results pass the significance test (p < 0.05). Thus, the surface meteorological parameters may slightly affect the variation in the RLH. The changes in the RLH may be more related to wind shear and large eddy turbulence in the boundary layer [41]. Strong wind shear and large eddy turbulence can maintain the RLH.
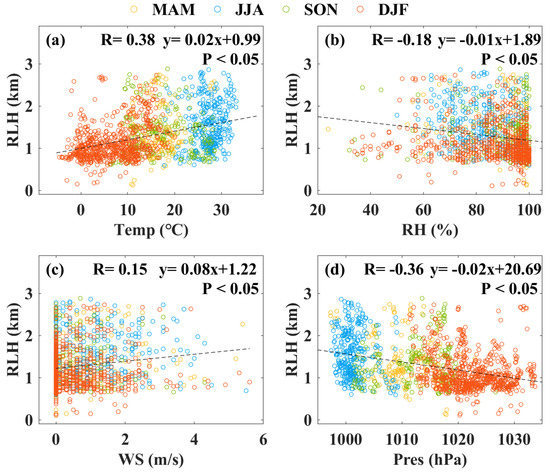
Figure 5.
Correlations between different surface meteorological parameters and the RLH over Wuhan: (a) Temp; (b) RH; (c) WS; and (d) Pres. Statistical samples are hourly mean data. Black dotted line represents the linear fitting curve. Correlation coefficients (R) and fitted function are provided in the top of each panel. Yellow, blue, green, and red dots represent spring, summer, autumn, and winter, respectively.
Figure 6 shows the frequency distribution of the RLH and PM2.5 under different RHs and WSs from January 2017 to December 2019. The samples were divided into high (>90%) and low (<90%) RH conditions. Under the high RH condition, most of the RLHs (60%) were below 1 km, and more than half of the PM2.5 was larger than 50 µg/m3. By contrast, more cases of the RLHs were higher than 1 km, and the PM2.5 was more distributed below 50 μg/m3 under the low RH condition. These results indicate that the high RH was also accompanied by a low RLH and high PM2.5 concentrations. A high RH would promote the hygroscopic growth of aerosol particles, resulting in the formation of secondary pollutants [42]. In addition, the foggy days and subsidence of aerosols under stable weather conditions can also cause this phenomenon [29]. The samples were also divided into high (>1 m/s) and low (<1 m/s) WS conditions. The high RLH occurred more in the high WS condition, and the PM2.5 concentrations were more distributed below 50 μg/m3 under the high WS condition. The high wind speed indicates the strong horizontal diffusion ability and is conducive to reducing the PM2.5 concentrations [43,44]. Approximately 10% of the PM2.5 exceeded 100 µg/m3, even in the high WS periods. This result may indicate the transmission of regional pollution.
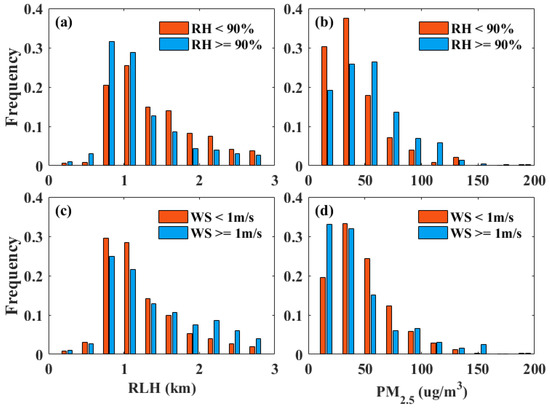
Figure 6.
Frequency distribution of RLHs under different (a) RH, and (c) WS conditions. Frequency distribution of PM2.5 concentrations under different (b) RH, and (d) WS conditions.
4.3. Effect of RLH on PM2.5
In this section, the influence of the RLH on PM2.5 concentrations was further investigated. The average hourly RLHs and PM2.5 were used to investigate the relationship between the RLH and PM2.5. Moreover, the relationship between the daily mean RLH and the average PM2.5 value on the next daytime was also investigated.
Figure 7 shows the relationship between the RLH and PM2.5 with changes in the AOD and WS at different periods. The number of samples of hourly and daily average data were 1433 and 176, respectively. The AODs calculated from the lidar represent the total amount of pollutants within 0.15–3 km. As shown in Figure 7a (hourly average data), the PM2.5 concentrations decreased as the RLH increased when the AOD was low. However, the PM2.5 concentrations did not change with the increase in the RLH when the AOD was high. This phenomenon also occurred in the comparison of daily average results (Figure 7b). Combined with Figure 8a, it shows the correlation coefficients between the hourly mean RLHs and the PM2.5 with changes in different AOD thresholds. The sample points are the data whose AOD is less than the threshold. The correlation coefficients between the hourly mean RLH and the PM2.5 was approximately −0.38 when the thresholdAOD was less than 0.5. By contrast, when the thresholdAOD was larger than 0.5, the correlation coefficient between the RLH and the PM2.5 decreased with the increase in the thresholdAOD. These results indicate that the impact of the total amount of pollutants must be considered when discussing the relationship between the RLH and PM2.5. Figure 7c,d shows that most of the PM2.5 values were less than 50 µg/m3 when the WS was large. Moreover, Figure 8b shows the correlation coefficients between the hourly mean RLH and the PM2.5 with changes in different WS thresholds. The sample points are the data whose AOD is less than 0.5 and where the WS is larger than the threshold. The correlation coefficient between the RLH and the PM2.5 is increased with the increase in the thresholdWS. These results suggest that horizontal diffusion also plays an important role in the reduction of PM2.5 concentrations.
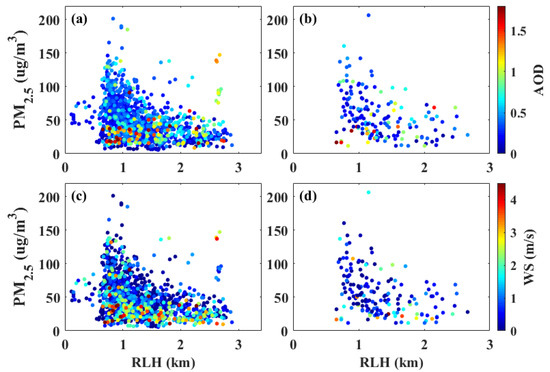
Figure 7.
Relationship between hourly mean RLHs and PM2.5 with changes in (a) AOD, and (c) WS. Relationship between daily mean RLHs and PM2.5 on the next day with changes in (b) AOD, and (d) WS.
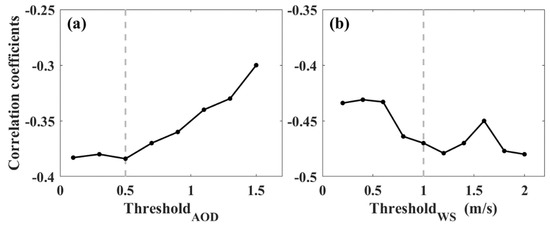
Figure 8.
Correlation coefficients between hourly mean RLHs and PM2.5 under different (a) thresholdAOD and (b) thresholdWS values.
To further study the relationship between the RLH and PM2.5, the AOD = 0.5 and WS = 1 m/s were used as thresholds to divide the samples. Figure 9 shows the correlation between the hourly mean RLH and the PM2.5 at the corresponding time under different AOD and WS conditions. When the AOD was low (<0.5), the correlation coefficient (R) between the RLH and the PM2.5 at the corresponding time was −0.38 (Figure 9a). By contrast, the correlation coefficient between the RLH and the PM2.5 was −0.05 when the AOD was high (Figure 9b). It needs to be noted that the statistical significance is low (p > 0.05). This result shows that the vertical diffusion ability of the RLH to the PM2.5 is limited. When the total amount of pollutants (AOD) was small, the RLH exerted obvious effects on the PM2.5. However, the RLH had almost no effect on the PM2.5 when the total amount of pollutants was at a high level. Under this condition, the variation in the PM2.5 was affected by the terrain or horizontal transmission [45]. Considering the impact of horizontal diffusion, we divided the samples with AOD < 0.5 into high (>1 m/s) and low (<1 m/s) WS conditions. The correlation coefficients (R) between the RLH and the PM2.5 at high and low WS periods were −0.33 and −0.46, respectively. This result suggests that an increase in the WS strengthens the horizontal diffusion ability of PM2.5 when the total amount of pollutants is within a controllable range. Previous studies also indicate that clean wind can improve the diffusion of pollutants [35,36].
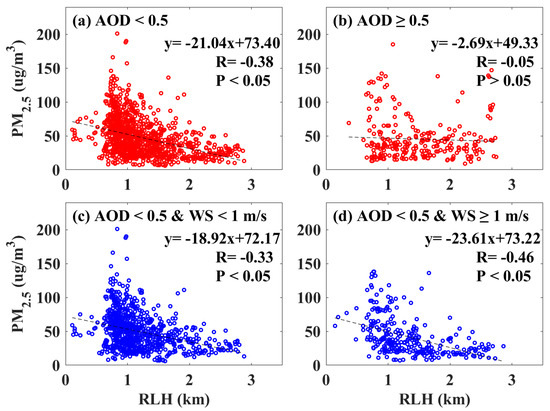
Figure 9.
Correlations between hourly mean RLHs and PM2.5 at (a) low, and (b) high AOD periods. Correlations between hourly mean RLHs and PM2.5 at low AOD periods with (c) WS < 1 m/s, and (d) WS ≥ 1 m/s. The black dotted line represents the linear fitting curve. The correlation coefficients (R) and fitted function are provided in the higher right corner of each panel.
Figure 10 shows the correlation between the RLH and the PM2.5 on the following day under different AOD and WS conditions, where the RLH is the nighttime average from 20:00 to 05:00 LT, and the PM2.5 is averaged from 12:00 to 14:00 LT on the following day. Shi et al. [15] and Bourgeois et al. [46] indicate that a large fraction of the aerosol mass remains in the RL during the night, which may then act as a source of aerosols for the mixing layer forming the following day. Here, we find that the correlation coefficients (R) between the nighttime mean RLH and the PM2.5 at low and high AOD periods were −0.49 and −0.01, respectively. Again, the statistical significance is low at high AOD periods. Under the low AOD period, the correlation coefficients (R) between the nighttime mean RLH and the PM2.5 at high and low WS periods were −0.5 and −0.47, respectively. These results are similar to those in Figure 9. The horizontal and vertical diffusion play an important role in the reduction of PM2.5 concentrations. However, the effect of the RLH on the PM2.5 was slight when the AOD was large. This is because the vertical diffusion ability of the RLH to the PM2.5 is limited. In addition, the results indicate that the RLH at night affects the daytime PM2.5 on the second day. Liu et al. [5] indicate that, since the height of the SBL at night is relatively low, the RLH determines the depth of the RL. The large depth of the RL in the vertical direction would increase the amount of space for aerosols. These aerosols in the RL would be the source of pollutants on the second day, which would consequently affect the surface PM2.5 [15,47,48].
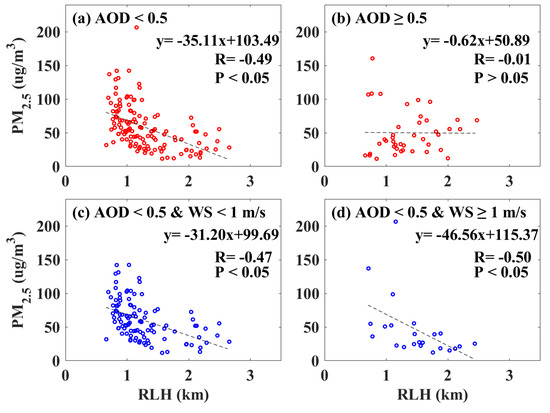
Figure 10.
Similar to Figure 9, but for the relationship between the nighttime mean RLH and the average PM2.5 value on the next daytime.
5. Conclusions
The characteristics of the nocturnal RLH and its effect on urban pollution were investigated using lidar data from January 2017 to December 2019 in Wuhan, China. The variations in the RLH, AOD, PM2.5, and meteorological parameters were analyzed. The meteorological parameters affecting the RLH and the PM2.5 were analyzed.
The variation in the RLH has obvious seasonal changes. The RLH is the highest in summer (1.55 ± 0.55 km), followed by spring (1.40 ± 0.58 km) and autumn (1.26 ± 0.47 km), and is the lowest in winter (1.11 ± 0.44 km). The RLH is the generalized boundary layer height, which is affected by the daytime mixing layer height. Therefore, it has the same seasonal variation as the mixing layer height. Moreover, correlation analysis showed that the correlation coefficients (R) of the RLH with the Temp, RH, WS, and Pres were 0.38, −0.18, 0.15, and −0.36, respectively. Thus, the surface meteorological parameters may slightly affect the variations in the RLH. The changes in the RLH may be related to wind shear and large eddy turbulence in the boundary layer. The results also indicate that the high RH was accompanied by a low RLH and high PM2.5 concentrations. Finally, the relationship between the RLH and the PM2.5 was investigated under different atmospheric conditions. The analysis results show that the correlation coefficients of the RLH and PM2.5 under low and high AOD periods were −0.38 and −0.05, respectively. This result suggests that the vertical diffusion ability of the RLH to the PM2.5 is limited. When the AOD was small, the RLH exerted obvious effects on the PM2.5, but it had almost no effect on the PM2.5 when the aerosol loading was large. Considering the impact of horizontal diffusion under the low AOD condition, the correlation coefficients of the RLH and PM2.5 under low and high WS periods were −0.33 and −0.46, respectively. This result suggests that an increase in the WS will strengthen the horizontal diffusion ability of the PM2.5 when the aerosol loading is within a controllable range. In addition, the correlation coefficients of the nighttime mean RLH and next daytime mean PM2.5 were −0.49 under the low AOD period. Thus, the RLH influences the following daytime surface PM2.5 concentrations.
This study investigated the temporal distribution characteristics of the RLH and PM2.5 in Wuhan and the related influencing factors. The results of this study could serve as a reference for the study of atmospheric structure and environmental pollution in Wuhan. In the future, we will further investigate the factors that affect PM2.5.
Author Contributions
Conceptualization, B.L.; methodology, X.M. and W.J.; software, W.J.; validation, B.L. and W.J.; formal analysis, B.L.; investigation, W.J.; resources, B.L.; data curation, W.J.; writing—original draft preparation, W.J.; writing—review and editing, B.L., H.L. and S.J.; visualization, W.J.; supervision, B.L.; project administration, W.G.; funding acquisition, B.L. and Y.M. All authors have read and agreed to the published version of the manuscript.
Funding
This work was financially supported by the National Natural Science Foundation of China under grant 42001291, 42171464, 41901274, 41971283 and the Project funded by the China Postdoctoral Science Foundation, 2020M682485.
Acknowledgments
We sincerely appreciate the surface PM2.5 data that were provided by the China National Environmental Monitoring Center (CNEMC). The lidar data over Wuhan provided by the atmospheric remote sensing team of Wuhan University are highly appreciated as well.
Conflicts of Interest
The authors declare that they have no known competing financial interest or personal relationships that could have appeared to influence the work reported in this paper.
References
- Stull, R.B. An Introduction to Boundary Layer Meteorology; Springer Science & Business Media: Berlin, Germany, 1988; Volume 13. [Google Scholar]
- Jiang, Y.; Xin, J.; Zhao, D.; Jia, D.; Tang, G.; Quan, J.; Wang, M.; Dai, L. Analysis of differences between thermodynamic and material boundary layer structure: Comparison of detection by ceilometer and microwave radiometer. Atmos. Res. 2021, 248, 105179. [Google Scholar] [CrossRef]
- Liu, Y.; Tang, G.; Wang, M.; Liu, B.; Hu, B.; Chen, Q.; Wang, Y. Impact of residual layer transport on air pollution in Beijing, China. Environ. Pollut. 2021, 271, 116325. [Google Scholar] [CrossRef] [PubMed]
- Sun, Y.; Song, T.; Tang, G.; Wang, Y. The vertical distribution of PM2.5 and boundary-layer structure during summer haze in Beijing. Atmos. Environ. 2013, 74, 413–421. [Google Scholar] [CrossRef]
- Liu, B.; Ma, Y.; Shi, Y.; Jin, S.; Jin, Y.; Gong, W. The characteristics and sources of the aerosols within the nocturnal residual layer over Wuhan, China. Atmos. Res. 2020, 241, 104959. [Google Scholar] [CrossRef]
- Tao, M.; Chen, L.; Su, L.; Tao, J. Satellite observation of regional haze pollution over the North China Plain. J. Geophys. Res. Space Phys. 2012, 117, 117. [Google Scholar] [CrossRef]
- Kan, H.; Chen, R.; Tong, S. Ambient air pollution, climate change, and population health in China. Environ. Int. 2012, 42, 10–19. [Google Scholar] [CrossRef]
- Zhao, D.; Xin, J.; Gong, C.; Quan, J.; Wang, Y.; Tang, G.; Ma, Y.; Dai, L.; Wu, X.; Liu, G.; et al. The impact threshold of the aerosol radiative forcing on the boundary layer structure in the pollution region. Atmos. Chem. Phys. Discuss. 2021, 21, 5739–5753. [Google Scholar] [CrossRef]
- Miller, L.; Xu, X. Ambient PM2.5 human health effects—Findings in China and research directions. Atmosphere 2018, 9, 424. [Google Scholar] [CrossRef] [Green Version]
- Zhang, K.; Nie, D.; Chen, M.; Wu, Y.; Ge, X.; Hu, J.; Ge, P.; Li, W.; Huang, B.; Yuan, Y.; et al. Chemical Characterization of Two Seasonal PM2.5 Samples in Nanjing and Its Toxicological Properties in Three Human Cell Lines. Environments 2019, 6, 42. [Google Scholar] [CrossRef] [Green Version]
- Prabhakar, G.; Parworth, C.L.; Zhang, X.; Kim, H.; Young, D.E.; Beyersdorf, A.J.; Ziemba, L.D.; Nowak, J.B.; Bertram, T.H.; Faloona, I.C.; et al. Observational assessment of the role of nocturnal residual-layer chemistry in determining daytime surface particulate nitrate concentrations. Atmos. Chem. Phys. Discuss. 2017, 17, 14747–14770. [Google Scholar] [CrossRef] [Green Version]
- Tang, G.; Wang, Y.; Liu, Y.; Wu, S.; Huang, X.; Yang, Y.; Wang, Y.; Ma, J.; Bao, X.; Liu, Z.; et al. Low particulate nitrate in the residual layer in autumn over the North China Plain. Sci. Total Environ. 2021, 782, 146845. [Google Scholar] [CrossRef]
- Venzac, H.; Sellegri, K.; Villani, P.; Picard, D.; Laj, P. Seasonal variation of aerosol size distributions in the free troposphere and residual layer at the puy de Dôme station, France. Atmos. Chem. Phys. Discuss. 2009, 9, 1465–1478. [Google Scholar] [CrossRef] [Green Version]
- Zaveri, R.A.; Shilling, J.E.; Fast, J.D.; Springston, S.R. Efficient Nighttime Biogenic SOA Formation in a Polluted Residual Layer. J. Geophys. Res. Atmos. 2020, 125, e2019JD031583. [Google Scholar] [CrossRef]
- Shi, Y.; Liu, B.; Chen, S.; Gong, W.; Ma, Y.; Zhang, M.; Jin, S.; Jin, Y. Characteristics of aerosol within the nocturnal residual layer and its effects on surface PM2.5 over China. Atmos. Environ. 2020, 241, 117841. [Google Scholar] [CrossRef]
- Liakakou, E.; Stavroulas, I.; Kaskaoutis, D.; Grivas, G.; Paraskevopoulou, D.; Dumka, U.; Tsagkaraki, M.; Bougiatioti, A.; Oikonomou, K.; Sciare, J.; et al. Long-term variability, source apportionment and spectral properties of black carbon at an urban background site in Athens, Greece. Atmos. Environ. 2020, 222, 117137. [Google Scholar] [CrossRef]
- Dumka, U.C.; Tiwari, S.; Kaskaoutis, D.G.; Soni, V.K.; Safai, P.D.; Attri, S.D. Aerosol and pollutant characteristics in Delhi during a winter research campaign. Environ. Sci. Pollut. Res. 2019, 26, 3771–3794. [Google Scholar] [CrossRef]
- Dumka, U.C.; Kaskaoutis, D.; Devara, P.; Kumar, R.; Kumar, S.; Tiwari, S.; Gerasopoulos, E.; Mihalopoulos, N. Year-long variability of the fossil fuel and wood burning black carbon components at a rural site in southern Delhi outskirts. Atmos. Res. 2019, 216, 11–25. [Google Scholar] [CrossRef]
- Zhang, M.; Wang, L.; Gong, W.; Ma, Y.; Liu, B. Aerosol Optical Properties and Direct Radiative Effects over Central China. Remote Sens. 2017, 9, 997. [Google Scholar] [CrossRef] [Green Version]
- Xu, H.; Chen, H. Impact of urban morphology on the spatial and temporal distribution of PM2.5 concentration: A numerical simulation with WRF/CMAQ model in Wuhan, China. J. Environ. Manag. 2021, 290, 112427. [Google Scholar] [CrossRef]
- Liu, B.; Ma, Y.; Gong, W.; Zhang, M. Observations of aerosol color ratio and depolarization ratio over Wuhan. Atmos. Pollut. Res. 2017, 8, 1113–1122. [Google Scholar] [CrossRef]
- Liang, X.; Li, S.; Zhang, S.; Huang, H.; Chen, S.X. PM2.5data reliability, consistency, and air quality assessment in five Chinese cities. J. Geophys. Res. Atmos. 2016, 121, 10220–10236. [Google Scholar] [CrossRef]
- Wang, W.; He, J.; Miao, Z.; Du, L. Space-Time Linear Mixed-Effects (STLME) model for mapping hourly fine particulate loadings in the Beijing-Tianjin-Hebei region, China. J. Clean. Prod. 2021, 292, 125993. [Google Scholar] [CrossRef]
- Shi, T.; Han, G.; Ma, X.; Gong, W.; Chen, W.; Liu, J.; Zhang, X.; Pei, Z.; Gou, H.; Bu, L. Quantifying CO2 uptakes over oceans using LIDAR: A tentative experiment in Bohai bay. Geophys. Res. Lett. 2021, 48, e2020GL091160. [Google Scholar] [CrossRef]
- Guo, J.; Liu, B.; Gong, W.; Shi, L.; Zhang, Y.; Ma, Y.; Zhang, J.; Chen, T.; Bai, K.; Stoffelen, A.; et al. First comparison of wind observations from ESA’s satellite mission Aeolus and ground-based radar wind profiler network of China. Atmos. Chem. Phys. 2021, 21, 2945–2958. [Google Scholar] [CrossRef]
- Fernald, F.G. Analysis of atmospheric lidar observations: Some comments. Appl. Opt. 1984, 23, 652–653. [Google Scholar] [CrossRef]
- Steyn, D.G.; Baldi, M.; Hoff, R.M. The Detection of Mixed Layer Depth and Entrainment Zone Thickness from Lidar Backscatter Profiles. J. Atmos. Ocean. Technol. 1999, 16, 953–959. [Google Scholar] [CrossRef]
- Nelson, E.; Stull, R.; Eloranta, E. A Prognostic Relationship for Entrainment Zone Thickness. J. Appl. Meteorol. 1989, 28, 885–903. [Google Scholar] [CrossRef] [Green Version]
- Liu, B.; Ma, Y.; Gong, W.; Zhang, M.; Yang, J. Study of continuous air pollution in winter over Wuhan based on ground-based and satellite observations. Atmos. Pollut. Res. 2018, 9, 156–165. [Google Scholar] [CrossRef]
- Sinha, P.; Gupta, P.; Kaskaoutis, D.; Sahu, L.; Nagendra, N.; Manchanda, R.K.; Kumar, Y.B.; Sreenivasan, S. Estimation of particulate matter from satellite- and ground-based observations over Hyderabad, India. Int. J. Remote Sens. 2015, 36, 6192–6213. [Google Scholar] [CrossRef]
- Zhang, Y.; Li, Z. Remote sensing of atmospheric fine particulate matter (PM2.5) mass concentration near the ground from satellite observation. Remote Sens. Environ. 2015, 160, 252–262. [Google Scholar] [CrossRef]
- Li, Z.; Zhang, Y.; Shao, J.; Li, B.; Hong, J.; Liu, D.; Li, D.; Wei, P.; Li, W.; Li, L.; et al. Remote sensing of atmospheric particulate mass of dry PM2.5 near the ground: Method validation using ground-based measurements. Remote Sens. Environ. 2016, 173, 59–68. [Google Scholar] [CrossRef]
- Wang, H.; Li, Z.; Lv, Y.; Xu, H.; Li, K.; Li, D.; Hou, W.; Zheng, F.; Wei, Y.; Ge, B. Observational study of aerosol-induced impact on planetary boundary layer based on lidar and sunphotometer in Beijing. Environ. Pollut. 2019, 252, 897–906. [Google Scholar] [CrossRef] [PubMed]
- Hao, H.; Guo, Q. Spatial and temporal characteristics of PM2.5 and source apportionment in Wuhan. In Proceedings of the IOP Conference Series: Earth and Environmental Science, Banda Aceh, Indonesia, 26–27 September 2018; IOP Publishing: Bristol, UK, 2018; Volume 121, p. 032019. [Google Scholar]
- Cheng, T.; Xu, C.; Duan, J.; Wang, Y.; Leng, C.; Tao, J.; Che, H.; He, Q.; Wu, Y.; Zhang, R.; et al. Seasonal variation and difference of aerosol optical properties in columnar and surface atmospheres over Shanghai. Atmos. Environ. 2015, 123, 315–326. [Google Scholar] [CrossRef]
- Li, Z.; Lau, W.M.; Ramanathan, V.; Wu, G.; Ding, Y.; Manoj, M.G.; Liu, J.; Qian, Y.; Li, J.; Zhou, T.; et al. Aerosol and monsoon climate interactions over Asia. Rev. Geophys. 2016, 54, 866–929. [Google Scholar] [CrossRef]
- Wang, W.; Mao, F.; Gong, W.; Pan, Z.; Du, L. Evaluating the Governing Factors of Variability in Nocturnal Boundary Layer Height Based on Elastic Lidar in Wuhan. Int. J. Environ. Res. Public Health 2016, 13, 1071. [Google Scholar] [CrossRef] [PubMed] [Green Version]
- Guo, J.; Miao, Y.; Zhang, Y.; Liu, H.; Li, Z.; Zhang, W.; He, J.; Lou, M.; Yan, Y.; Bian, L.; et al. The climatology of planetary boundary layer height in China derived from radiosonde and reanalysis data. Atmos. Chem. Phys. 2016, 16, 13309–13319. [Google Scholar] [CrossRef] [Green Version]
- Guo, J.; Li, Y.; Cohen, J.B.; Li, J.; Chen, D.; Xu, H.; Liu, L.; Yin, J.; Hu, K.; Zhai, P. Shift in the Temporal Trend of Boundary Layer Height in China Using Long--Term (1979–2016) Radiosonde Data. Geophys. Res. Lett. 2019, 46, 6080–6089. [Google Scholar] [CrossRef] [Green Version]
- Liu, B.; Ma, Y.; Gong, W.; Zhang, M.; Yang, J. Improved two-wavelength Lidar algorithm for retrieving atmospheric boundary layer height. J. Quant. Spectrosc. Radiat. Transf. 2018, 224, 55–61. [Google Scholar] [CrossRef]
- Liu, C.; Fedorovich, E.; Huang, J. Revisiting entrainment relationships for shear-free and sheared convective boundary layers through large-eddy simulations. Q. J. R. Meteorol. Soc. 2018, 144, 2182–2195. [Google Scholar] [CrossRef]
- Yang, Y.R.; Liu, X.G.; Qu, Y.; An, J.L.; Jiang, R.; Zhang, Y.H.; Sun, Y.L.; Wu, Z.J.; Zhang, F.; Xu, W.Q.; et al. Characteristics and formation mechanism of continuous hazes in China: A case study during the autumn of 2014 in the North China Plain. Atmos. Chem. Phys. Discuss. 2015, 15, 8165–8178. [Google Scholar] [CrossRef] [Green Version]
- Wang, Y.; Yao, L.; Wang, L.; Liu, Z.; Ji, D.; Tang, G.; Zhang, J.; Sun, Y.; Hu, B.; Xin, J. Mechanism for the formation of the January 2013 heavy haze pollution episode over central and eastern China. Sci. China Earth Sci. 2014, 57, 14–25. [Google Scholar] [CrossRef]
- Hu, J.; Chen, J.; Ying, Q.; Zhang, H. One-year simulation of ozone and particulate matter in China using WRF/CMAQ modeling system. Atmos. Chem. Phys. 2016, 16, 10333–10350. [Google Scholar] [CrossRef] [Green Version]
- Su, T.; Li, Z.; Kahn, R. Relationships between the planetary boundary layer height and surface pollutants derived from lidar observations over China: Regional pattern and influencing factors. Atmos. Chem. Phys. 2018, 18, 15921–15935. [Google Scholar] [CrossRef] [Green Version]
- Bourgeois, Q.; Ekman, A.M.L.; Renard, J.-B.; Krejci, R.; Devasthale, A.; Bender, F.A.-M.; Riipinen, I.; Berthet, G.; Tackett, J.L. How much of the global aerosol optical depth is found in the boundary layer and free troposphere? Atmos. Chem. Phys. 2018, 18, 7709–7720. [Google Scholar] [CrossRef] [Green Version]
- Fan, W.; Qin, K.; Xu, J.; Yuan, L.; Li, D.; Jin, Z.; Zhang, K. Aerosol vertical distribution and sources estimation at a site of the Yangtze River Delta region of China. Atmos. Res. 2019, 217, 128–136. [Google Scholar] [CrossRef] [Green Version]
- Yang, J.; Yang, S.; Zhang, Y.; Shi, S.; Du, L. Improving characteristic band selection in leaf biochemical property estimation considering interrelations among biochemical parameters based on the PROSPECT-D model. Optics Express 2021, 29, 400–414. [Google Scholar] [CrossRef]
Publisher’s Note: MDPI stays neutral with regard to jurisdictional claims in published maps and institutional affiliations. |
© 2021 by the authors. Licensee MDPI, Basel, Switzerland. This article is an open access article distributed under the terms and conditions of the Creative Commons Attribution (CC BY) license (https://creativecommons.org/licenses/by/4.0/).