Article

Canopy Volume Extraction of Citrus reticulate Blanco cv. Shatangju Trees Using UAV Image-Based Point Cloud Deep Learning

1
College of Engineering, South China Agricultural University, Guangzhou 510642, China
2
National Center for International Collaboration Research on Precision Agricultural Aviation Pesticide Spraying Technology, Guangzhou 510642, China
3
Department of Rural and Biosystems Engineering, Chonnam National University, Gwangju 500-757, Korea
4
College of Electronic Engineering and College of Artificial Intelligence, South China Agricultural University, Guangzhou 510642, China
*
Author to whom correspondence should be addressed.
Remote Sens. 2021, 13(17), 3437; https://doi.org/10.3390/rs13173437
Submission received: 22 July 2021 / Revised: 22 August 2021 / Accepted: 26 August 2021 / Published: 30 August 2021
(This article belongs to the Special Issue 3D Modelling and Mapping for Precision Agriculture)

Abstract

:
Automatic acquisition of the canopy volume parameters of the Citrus reticulate Blanco cv. Shatangju tree is of great significance to precision management of the orchard. This research combined the point cloud deep learning algorithm with the volume calculation algorithm to segment the canopy of the Citrus reticulate Blanco cv. Shatangju trees. The 3D (Three-Dimensional) point cloud model of a Citrus reticulate Blanco cv. Shatangju orchard was generated using UAV tilt photogrammetry images. The segmentation effects of three deep learning models, PointNet++, MinkowskiNet and FPConv, on Shatangju trees and the ground were compared. The following three volume algorithms: convex hull by slices, voxel-based method and 3D convex hull were applied to calculate the volume of Shatangju trees. Model accuracy was evaluated using the coefficient of determination (R2) and Root Mean Square Error (RMSE). The results show that the overall accuracy of the MinkowskiNet model (94.57%) is higher than the other two models, which indicates the best segmentation effect. The 3D convex hull algorithm received the highest R2 (0.8215) and the lowest RMSE (0.3186 m3) for the canopy volume calculation, which best reflects the real volume of Citrus reticulate Blanco cv. Shatangju trees. The proposed method is capable of rapid and automatic acquisition for the canopy volume of Citrus reticulate Blanco cv. Shatangju trees.

1. Introduction

Citrus have a long history of cultivation in China, especially in the southern hilly areas, where there are abundant citrus planting resources and various varieties. Among them, Citrus reticulate Blanco cv. Shatangju is one of the famous and superior varieties of citrus. It is well liked by the public and is a common cash crop in south China. Fertile planting land and high-quality orchard management are required to ensure the stable and increased production of Citrus reticulate Blanco cv. Shatangju. Among them, the volume and external structure of the canopy of Citrus reticulate Blanco cv. Shatangju trees are important indicators to measure the growth and biological characteristics of the fruit trees [1,2,3,4]. The fruit growers can judge the nutrient required by the trees and the number of fruits in the fruiting period according to the volume of the canopy. Moreover, the canopy volume is closely related to water evaporation. These factors have a direct impact on the precision management and economic benefits of the orchard [5,6]. Therefore, the automatic acquisition of the canopy volume of the Citrus reticulate Blanco cv. Shatangju tree are of great significance to the precision management of the orchard.
The traditional manual measurement of tree canopy is time-consuming, labor-intensive and inefficient. Ground machinery relies on expensive LiDAR (Light Detection and Ranging) [7], infrared photoelectric sensors [8], ultrasonic sensors [9], etc. for data acquisition and canopy structure evaluation from the side of the trees. In recent years, scholars have carried out wide research on UAV (Unmanned Aerial Vehicle) tilt photogrammetry images acquisition using multi-angle photogrammetry and point cloud modeling of trees. Qin et al. [10] segmented individual trees over large forest areas with airborne LiDAR 3D (Three-dimensional) point cloud and very high-resolution optical imagery and obtained phenotypes characteristics at the individual tree level successfully. Tian et al. [11] compared point cloud data obtained from ground-based laser scanner and UAV images to conduct a feasibility analysis of the canopy height extraction of a planted coniferous forest. Gülci [12] established a canopy height model with UAV remote sensing technology to estimate the number, height and canopy coverage of pine trees. On the basis of UAV tilt photogrammetry images and point cloud reconstruction, Jurado et al. [13] developed an automatic detection method of grapevine trunk using 3D point cloud data with good robustness. Camarretta et al. [14] used UAV-LiDAR for rapid phenotyping of eucalyptus trees to study inter-species differences in productivity and differences in key features of tree structure. Wang et al. [15] combined UAV tilt photogrammetry and machine learning classification algorithms to classify street tree species, in which the BP (Back Propagation) neural network showed the best segmentation effect. UAV tilt photogrammetry images combined with point cloud data processing has become the most popular method of individual tree volume assessment.
In the whole orchard or the forest scenario, it is first necessary to locate and segment each tree to measure the canopy volume of a single tree. The extraction of single tree information mainly includes single tree identification and single tree canopy extraction. With the continuous development of deep learning, the segmentation and extraction of trees is also constantly improving. For the segmentation of 2D (Two-Dimensional) images, scholars have tended to use a convolutional neural network in deep learning [16,17,18] from traditional segmentation methods based on edge detection, threshold, region and specific theoretical tools. For example, Martins et al. [19] segmented the trees in the urban environment image, Yan et al. [20] identified different tree species and Chadwick et al. [21] extracted the height of the crown of a single coniferous tree. However, 2D images have problems such as insufficient spatial information and occlusion. Therefore, 3D point cloud data containing rich spatial information is gradually dominating. Deep learning point cloud semantic segmentation has become a research hotspot in the fields of autonomous driving, navigation and positioning, smart city and medical image segmentation [22,23,24,25]. However, there is relatively less research in the field of tree segmentation, especially in the orchard scenario. In addition, fruit tree parameters include tree height, canopy diameter and canopy volume. Due to the fractal nature of plants, the definition of fruit tree volume is quite subjective [26]. At present, the volume calculation algorithms of trees are mainly geometric calculation methods and voxel-based methods. The geometric calculation method treats the acquired point cloud data as a geometric body, and directly takes the volume of the geometric body as the volume of the canopy. Among them, the most commonly used geometric calculation method is the 3D convex hull algorithm, which has been applied in many studies [27,28,29]. Fernández-Sarría et al. [30] improved the overall 3D convex hull algorithm by using a height interval of 5 cm for segmentation. By applying the 3D convex hull, the volume of each segmented block was calculated and then the volumes of the small blocks were summed to obtain the canopy volume. The slicing convex hull method can also be adopted to calculate the canopy volume by dividing the plane area of a single canopy slice into small pieces, and then adding the convex hull volume of the slices to obtain the canopy volume [31]. The voxel-based method [32,33] uses conventional 3D grids to represent discrete canopy point clouds. For example, Wu et al. [34] applied the voxel-based method to separate the canopy and trunk of a single tree from the point cloud data, and estimated the tree height, canopy diameter and canopy height. However, the volume calculation algorithms mentioned above are all results of a single tree, ignoring the importance of the segmentation of the entire orchard or forest. Therefore, the point cloud deep learning algorithm combined with the volume calculation algorithm is used to segment the canopy of the Citrus reticulate Blanco cv. Shatangju trees. In this way, the advantages of both can be effectively combined to quickly, automatically and accurately obtain the canopy volume of a single Shatangju tree.
A set of methods to extract the canopy volume parameters of an individual Citrus reticulate Blanco cv. Shatangju tree using UAV tilt photogrammetry images and point cloud deep learning was proposed in this study, in order to provide a reference for the precision management of an orchard. UAV tilt photogrammetry images of Citrus reticulate Blanco cv. Shatangju trees were acquired to generate a 3D point cloud model of the orchard. Point cloud deep learning algorithms were applied to the model for the segmentation of individual trees. The height, canopy width and volume of each tree were calculated and then compared by different volume algorithms.

2. Materials and Methods

2.1. Point Cloud Data Acquisition

2.1.1. Experimental Site

The experimental site of this study is located in an orchard of Sihui City, Guangdong Province, with geographical coordinates of 112.68°E and 23.36°N (Figure 1). This area has a subtropical monsoon climate with an average annual temperature of about 21.9 °C and an average precipitation of about 1716 mm. A total of 160 Citrus reticulate Blanco cv. Shatangju trees in 16 rows × 10 columns were selected for this study, of which 128 trees were determined as the training set and 32 trees as the validation set. A total of four trials were conducted with an interval of about 20 days in order to collect canopy data of Citrus reticulate Blanco cv. Shatangju trees in different growth periods. Experiments were conducted on sunny days with low wind speed to ensure the accuracy of the images captured using the UAV.

2.1.2. Acquisition of UAV Tilt Photogrammetry Images

The acquisition platform is DJI Phantom 4 RTK (Real Time Kinematic) UAV (DJI, Shenzhen, China), which is equipped with a 20-megapixel CMOS (Complementary Metal-Oxide-Semiconductor) sensor. The RTK and six-way vision sensors allow the flight of the UAV safer and more stable [35,36,37]. The Phantom 4 RTK has a maximum take-off weight of 1391 g, and a maximum horizontal flight speed of 14 m/s. Its maximum ascent and descent speed is 5 and 3 m/s, respectively. The pitch angle range of the camera is approximately −90° to +30°. UAV tilt photogrammetry images were acquired with a flight height of 10 m and a cruise speed of 1 m/s. The overlap of flight path is 85% in both the side and heading directions. The image resolution is 5472 pixels × 3648 pixels, and the ground resolution is 0.37 cm. The DJI platform and the UAV tilt photogrammetry image acquisition scene are shown in Figure 2.
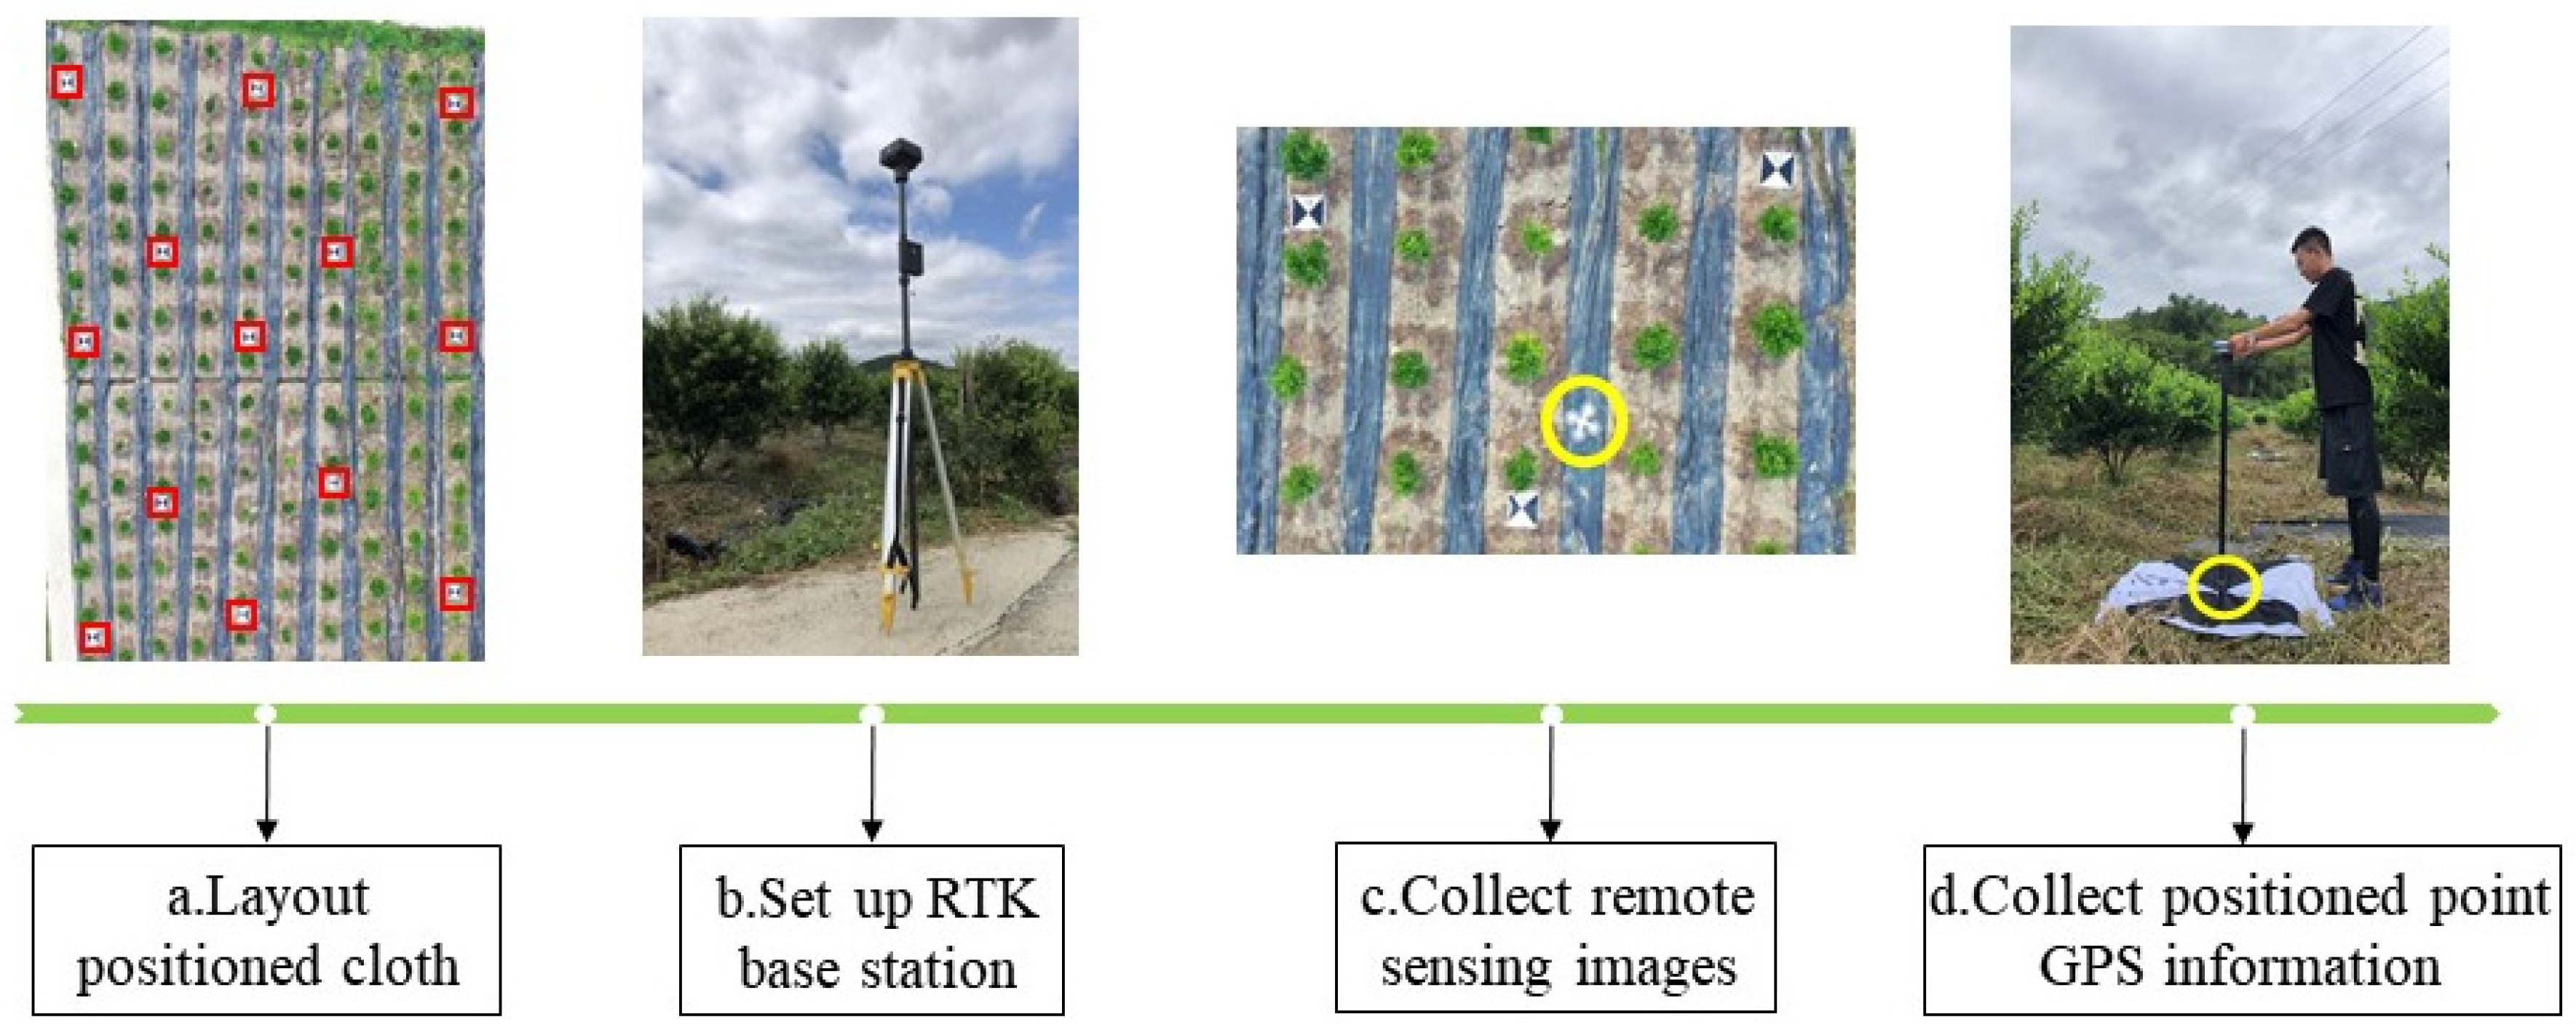
Ground Control Points (GCPs) were added and RTK base station were set up in this experiment to ensure the accuracy of the subsequent point cloud information. The horizontal accuracy of RTK base station is 1 cm + 1 ppm, and the vertical accuracy is 2 cm + 1 ppm (1 ppm means that the accuracy deteriorates 1 mm with every 1 km increase). The high-precision GPS (Global Positioning System) information of the locating points was obtained using a punter (Figure 3). This method can control the error within 6 cm between point cloud analysis and the true value from manual measurement.

2.1.3. Reconstruction of 3D Point Cloud

Pix4Dmapper was applied to process the tilt photogrammetry images obtained using the UAV. This software can quickly and automatically convert thousands of images into professional and accurate planar maps or 3D models. Pix4Dmapper obtains point cloud data and carries out post-process through the principle of multi-angle reconstruction of photogrammetry and aerial photographs. It is widely used in the fields of aerial and engineering photogrammetry, computer animation and remote sensing [38].
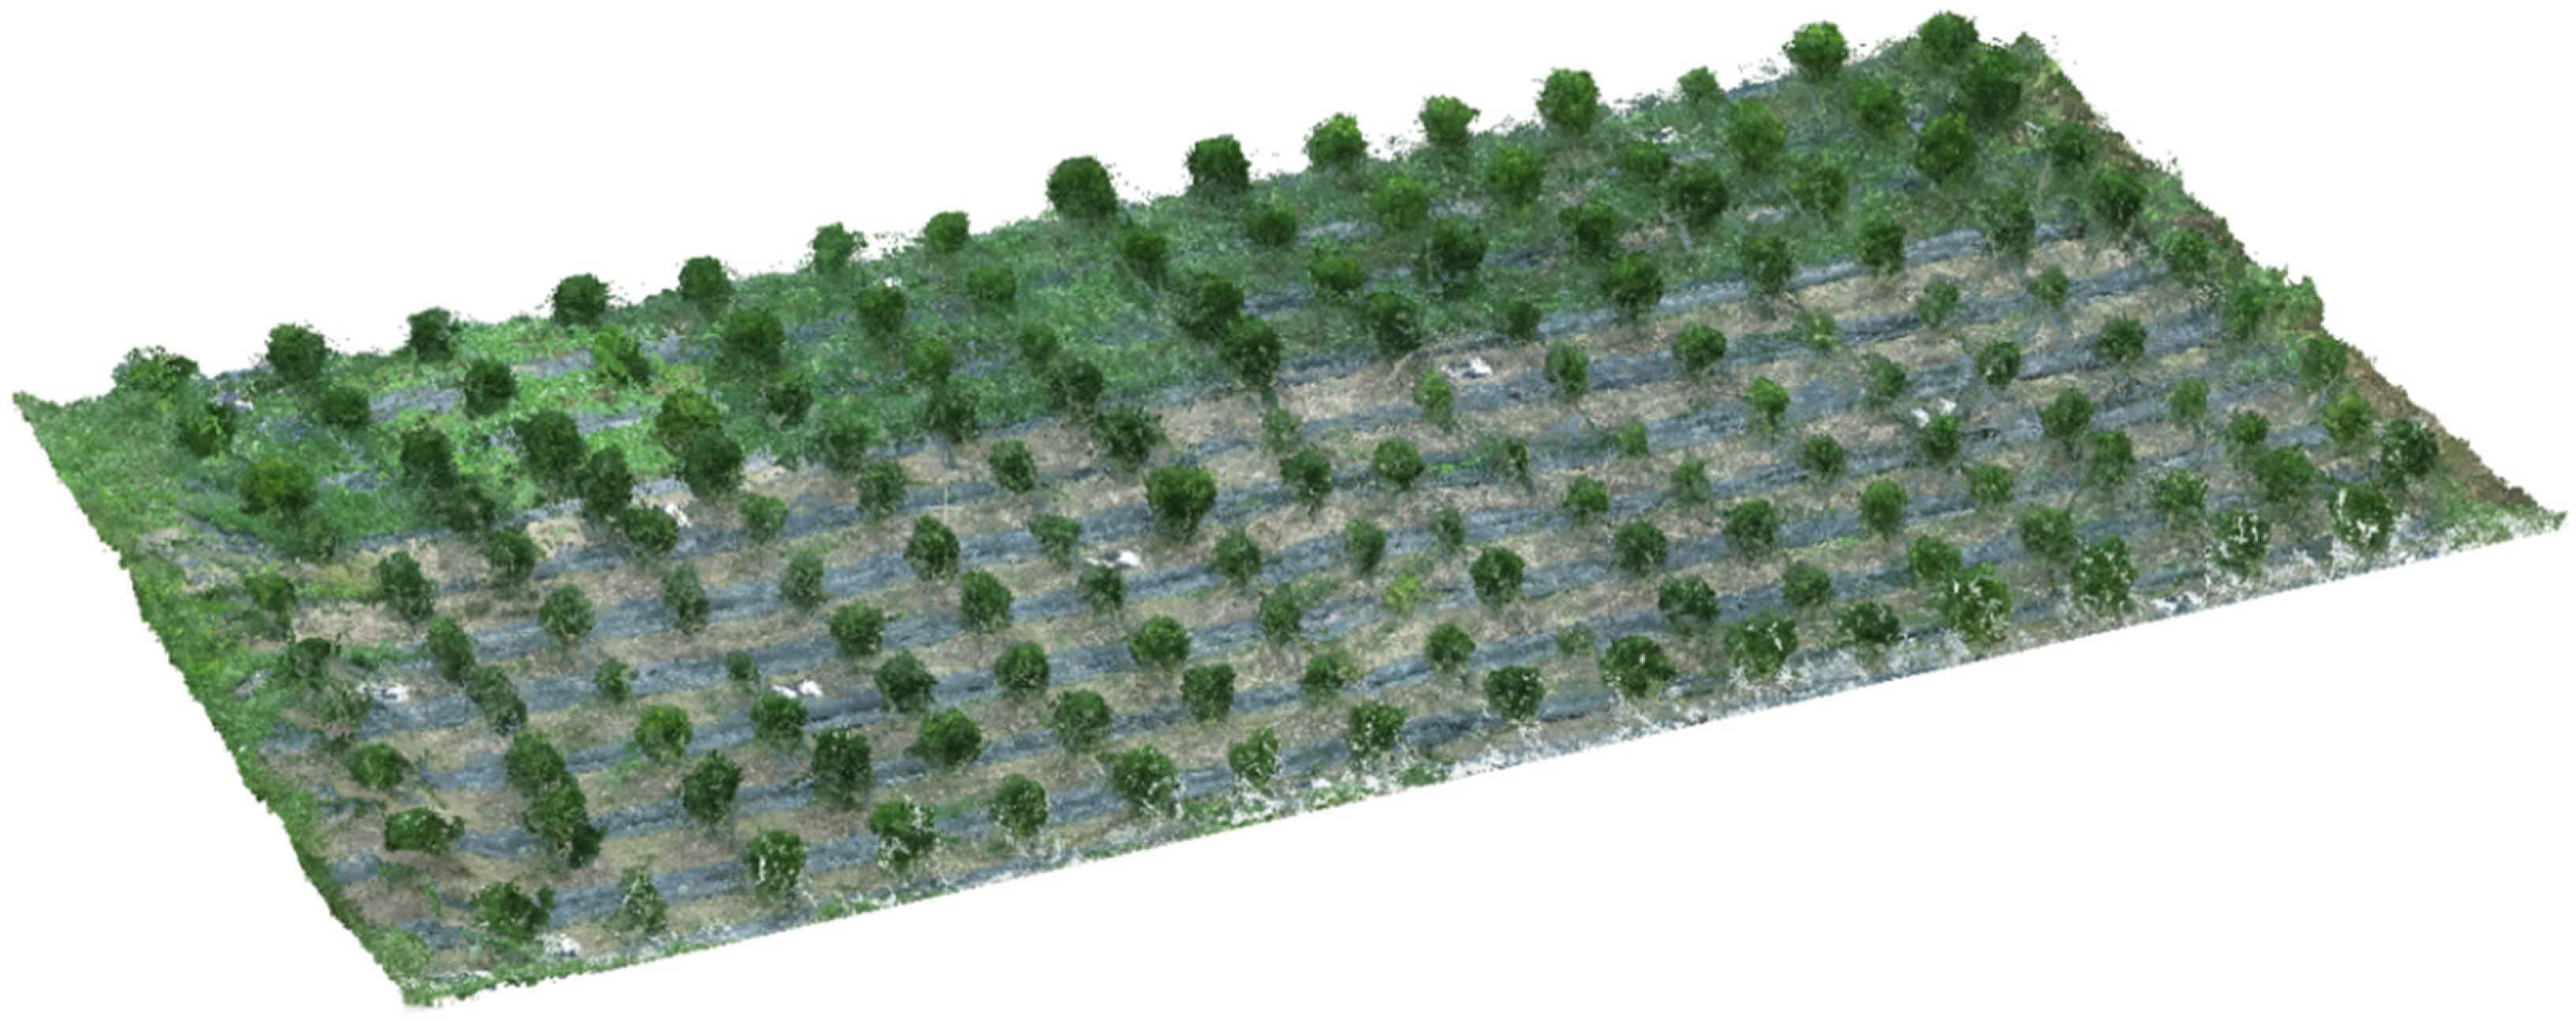
After importing the image data obtained in this experiment into Pix4Dmapper, the software automatically reads the pose information of the images based on the selected coordinate system. WGS 84 (World Geodetic System-1984)/UTM (Universal Transverse Mercator) Zone 50N projection coordinate system is used by default. The software first monitors the regional integrity and data quality of aerial photogrammetry, then marks control points, and automatically generates point cloud and texture information, and finally generates 3D textured mesh to form a 3D model of the experimental site (Figure 4).
In CloudCompare software, the point cloud cropping tool was used to manually separate the trees from the land of the whole experimental site, and remove point cloud noise. The samples for training and validation were determined as well.

2.2. Deep Learning Algorithms for Point Clouds Data

2.2.1. Deep Learning Algorithms

Point cloud semantic segmentation is a technology to divide the point cloud into several specific regions with unique properties, and to identify the point cloud information [39]. Traditional point cloud feature extraction methods are mainly classified into local features [22], regional features [23], global features and multi-scale features [40,41]. Direct classification of point cloud data is ideal to avoid transformation error. Researchers have proposed many point-cloud-based 3D deep learning architectures, among which the PointNet algorithm first proposed by Qi et al. [42] has become the most classical deep learning algorithm for point cloud segmentation due to its fewer model parameters and faster training speed. In this study, a classical point cloud deep learning network and two recent innovative network models were selected to carry out semantic segmentation on the point clouds of fruit trees and non-fruit trees. The algorithms suitable for this scenario were compared as well.
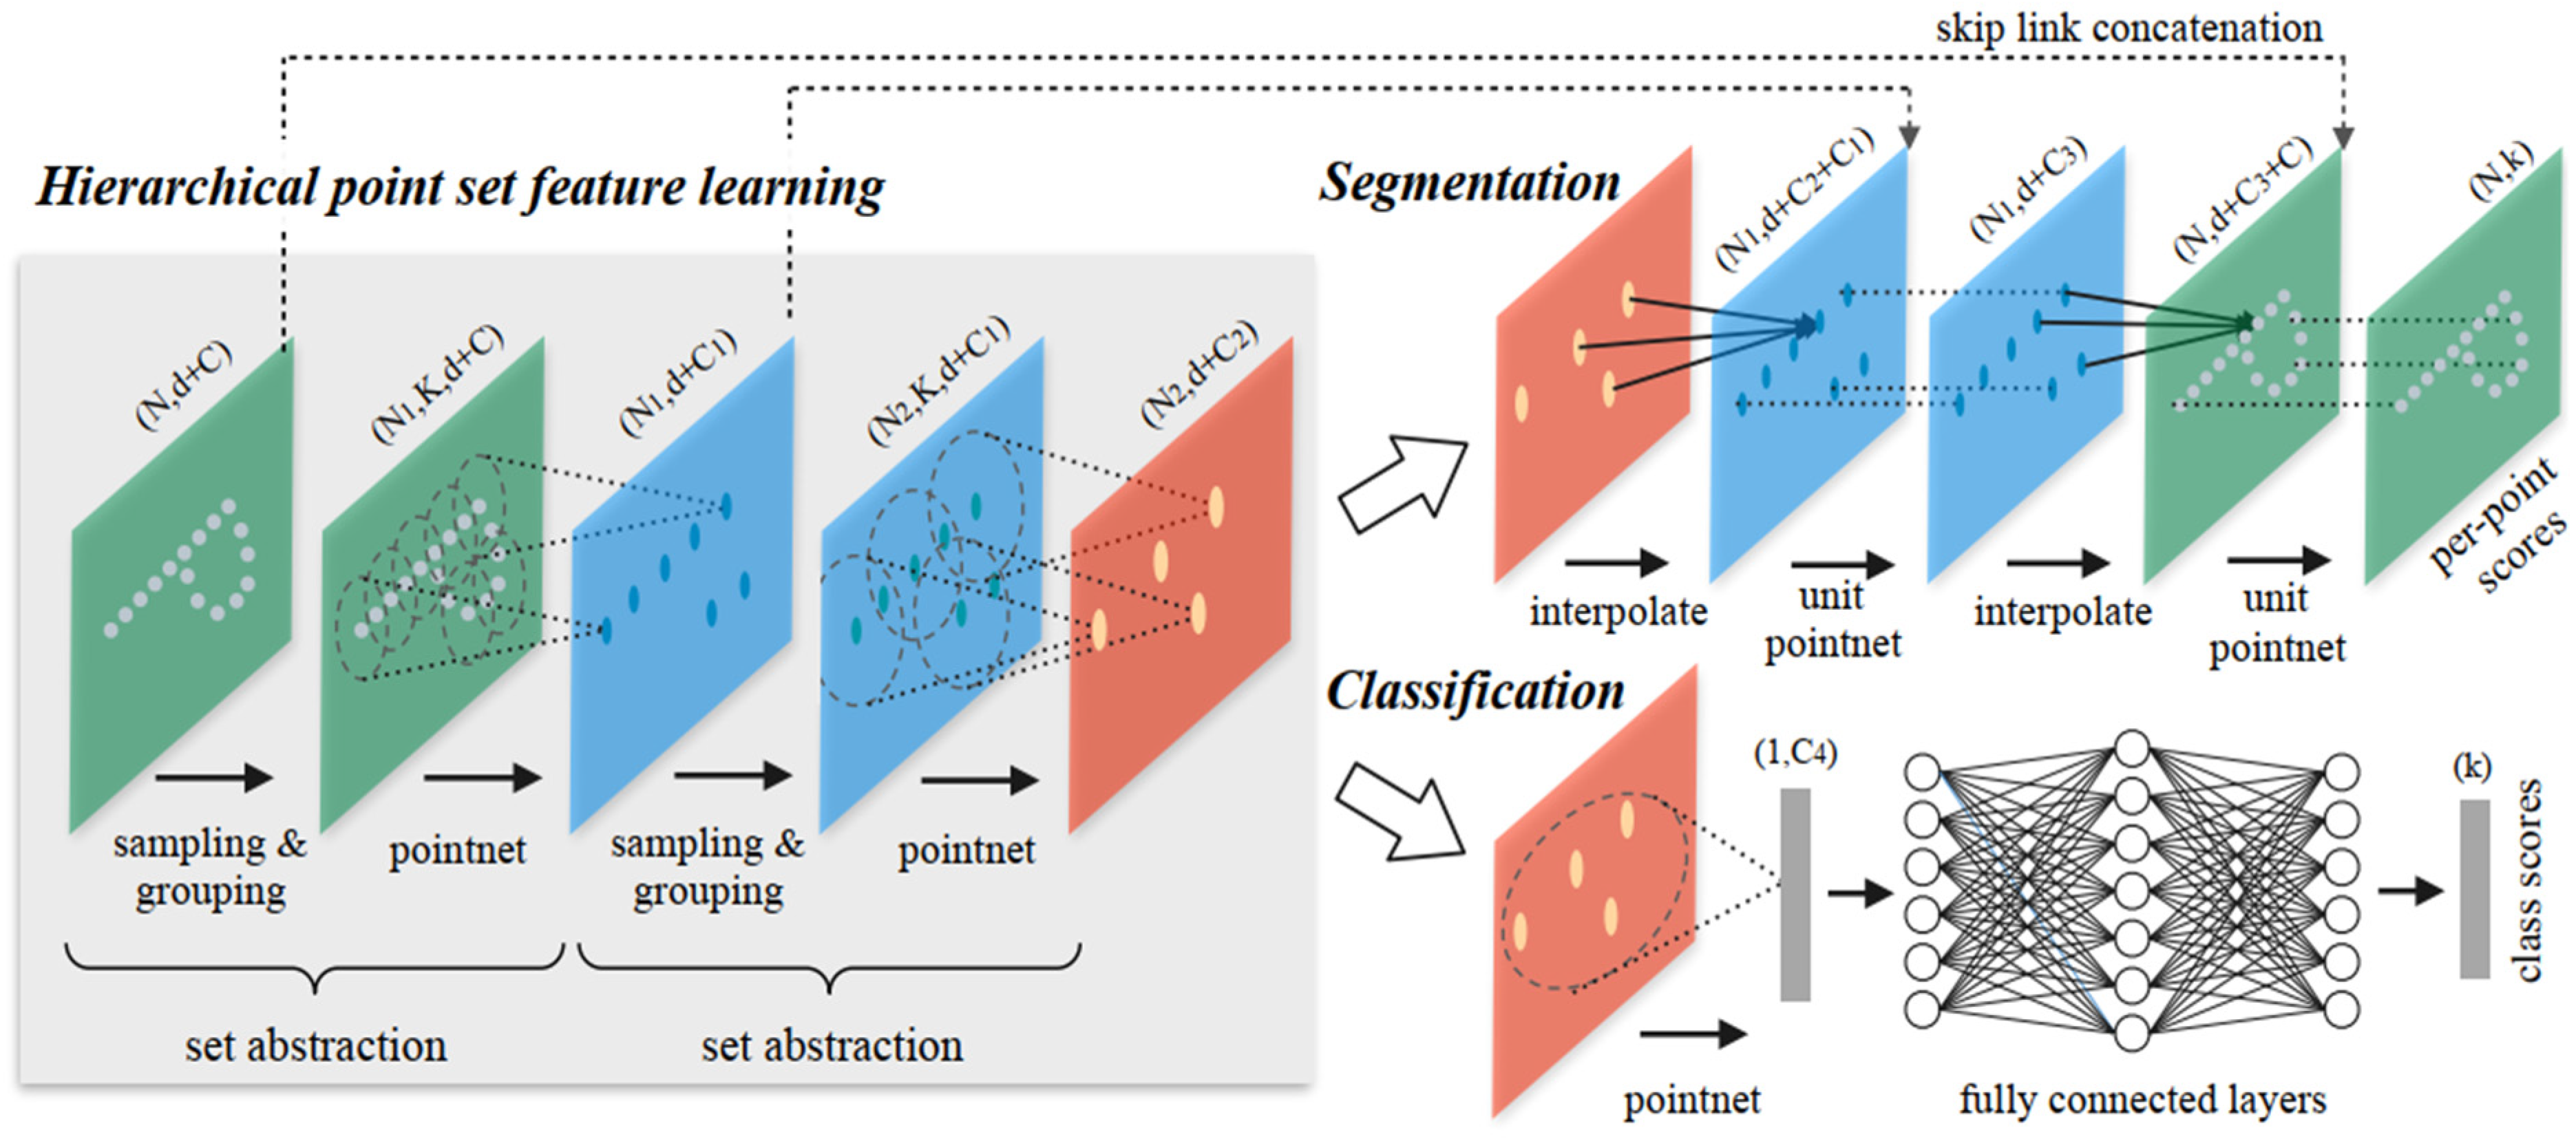
PointNet++ [43] is an extension of the architecture of PointNet with an additional hierarchical structure, which performs hierarchical feature extraction by building a pyramid-like aggregation scheme to combine features at multiple scales. Its network structure is divided into sampling layer, grouping layer and PointNet layer. Figure 5 shows the overall network architecture of PointNet++.
In the sampling layer, Farthest Point Sampling (FPS) method is selected in the input point cloud samples in order to cover the whole 3D spatial point cloud as much as possible. The principle of FPS method is as follows: firstly, a starting point is selected from the N points of the input point cloud data and denoted as K0; secondly, the Euclidean distance between the remaining N-1 points and the starting point is calculated, and the point with the largest distance is recorded as K1; then the shortest Euclidean distance between N-2 points and K0 and K1 is calculated and summed up, respectively, and the point with the largest distance is recorded as K2, etc. until the specified number of points is reached. In the grouping layer, PointNet++ implements the grouping of point clouds through K neighborhood algorithm and Ball query algorithm. K-neighborhood algorithm finds the nearest neighbors around the center point and creates multiple subsets of the point cloud according to the number of points. Ball query algorithm selects a central point and regards the points in a spherical region within a certain radius of the center point as a local region. The input sample point cloud is divided into overlapping local regions by sampling and layering/grouping operations. PointNet network is then used to convolve and pool the point clouds to obtain higher-order feature representations of these point cloud subsets. In addition, a density-adaptive entry layer is added to the PointNet layer to learn the features of different scale regions when the input sampling density is changed.
The PointNet++ network solves the problem of uneven sampling of point cloud data and considers the distance measurement between points at the same time. It learns local regional features of point clouds through the hierarchical structure, which makes the network structure faster and more stable. However, PointNet++ has the same problem as PointNet network, which is that is extracts the local features of points individually without establishing the connection between points. The learning of point cloud data is not sufficient.
MinkowskiNet is a generalized sparse 3D convolutional algorithm proposed by Choy et al. [44] for efficient processing of high-dimensional data, which solves the problem of low efficiency in the application of dense convolutional neural networks on spatial sparse data with better accuracy than 2D (Two-dimensional) or hybrid deep learning algorithms.
Convolution is a fundamental operation in many fields. This network adopts convolution on sparse tensors, and proposes a generalized convolution on sparse tensors. Originally, the most common representations for extracting feature-intensive data were vectors, matrices and tensors. However, for 3D or even higher dimensional space, such intensive representations are inefficient and the effective information occupies only a small portion of that space, resulting in a waste of resources. Therefore, information can only be stored in non-empty regions of the space, as if it is stored in a sparse matrix. This representation is the N-dimensional extension of the sparse matrix, which is called the sparse tensor. MinkowskiNet network defines neural networks specific to these input sparse tensor networks, which process and generate sparse tensors. To build a sparse tensor network, all standard neural network layers are constructed in the same way as those defined on dense tensors and implemented in the network model, such as MLP (Muti-Layer Perception), nonlinear, convolution, pooling and other operations.
Generalized sparse convolution treats all discrete convolutions as its subclass, which is crucial for high-dimensional perception. It calculates only the outputs of predefined coordinates and saves them into a compact sparse tensor. MinkowskiNet network convolves universal input and output coordinates and arbitrary kernel shapes. It allows the sparse tensor network to extend to very high spaces and dynamically generate task coordinates, especially for high-dimensional data, which can serve as a memory and computation saver. The operational flow of the MinkowskiNet network is specified in Figure 6.
The MinkowskiNet network starts with data processing to generate the sparse tensor, which uses batch indexing to expand the sparse tensor coordinates, converting them into unique coordinates, associative features and optional labels during training semantic segmentation. Then, the output coordinates Cout are generated by inputting the given coordinates Cin. This process requires the addition of kernel mapping on the basis of the convolutional step size, the input coordinates and the step size (minimum distance between coordinates) of the input sparse tensor, as it defines how to map the input to the output through the kernel. Since the pooling process of this method may remove the density information, a variant is proposed that does not divide the number of inputs and is named the total pool, dividing the merged elements by the number of inputs mapped to each output. Finally, a generalized sparse convolution is used to create a high-dimensional network, which makes the network easier and more universal. For the U-shaped variant, multiple cross-sparse convolutions and cross-sparse transposed convolutions are added to the basic residual network, and the layers with the same span size are connected using skip connections. Figure 6 shows the overall network architecture of MinkowskiNet.
FPConv [45] is a 2D convolution algorithm that can directly process the surface geometry of a point cloud without converting it to an intermediate representation (e.g., a 3D grid or graph). FPConv is able to apply regular 2D convolution to effective feature learning by automatically learning weight maps to gently project surrounding points onto a 2D grid for local expansion. This network model cleverly maps the local point cloud into a 2D plane through interpolation, and finally uses 2D convolution to compute the features.
FPConv maps N points within a point neighborhood into a 2D plane of Mw×Mh, with Mw and Mh denoting the width and height of the plane, respectively. Then, PointNet algorithm is applied to calculate the local features of the relative coordinates of the N points, and the local features are mosaicked together with the coordinates of each point. Each position on the plane can be filled with a new feature obtained by feature interpolation of the N points. Interpolation is essentially a weighted sum of the N features. A network is then built to learn and obtain the weights of the corresponding weighted sum at each position. Since there are N points, each position corresponds to N weight parameters, which are obtained through the MLP network. There are Mw×Mh positions on the mapping plane; therefore, there is a total of N×(Mw×Mh) parameters to learn. After learning these parameters, the features of N points can be used to interpolate Mw×Mh features. Finally, the interpolation result is considered as a 2D picture, and a feature is computed to represent the point features using traditional 2D convolutional network and pooling operation. Figure 7 shows the network architecture of FPConv.

2.2.2. Accuracy Evaluation of Algorithms

In this study, the performance of the semantic segmentation model is evaluated by accuracy and mIoU (mean Intersection over Union). The segmentation accuracy is implemented based on the confusion matrix by dividing the sum of the diagonals of the confusion matrix by the sum of the elements of this matrix. The mIoU calculates the average value of the IoU (Intersection over Union) for each class, while IoU is obtained by measuring the ratio of intersection and union between the actual and model annotations. The two evaluation indexes are calculated as follows:
A c c u r a c y = T P + T N T P + T N + F P + F N  
m I o U = 1 C i = 1 C p i i j = 1 C p i j + j = 1 C p j i p i i  
where TP denotes correct classification of detection target, TN denotes correct classification of background, FP denotes wrong classification of background as detection target, FN denotes wrong classification of detection target as background, C is category and pij is the number of objects or points that belong to the i-th category but are predicted to be in the j-th category.

2.3. Tree Phenotype Parameter Extraction and Accuracy Evaluation

2.3.1. Manual Calculation Method

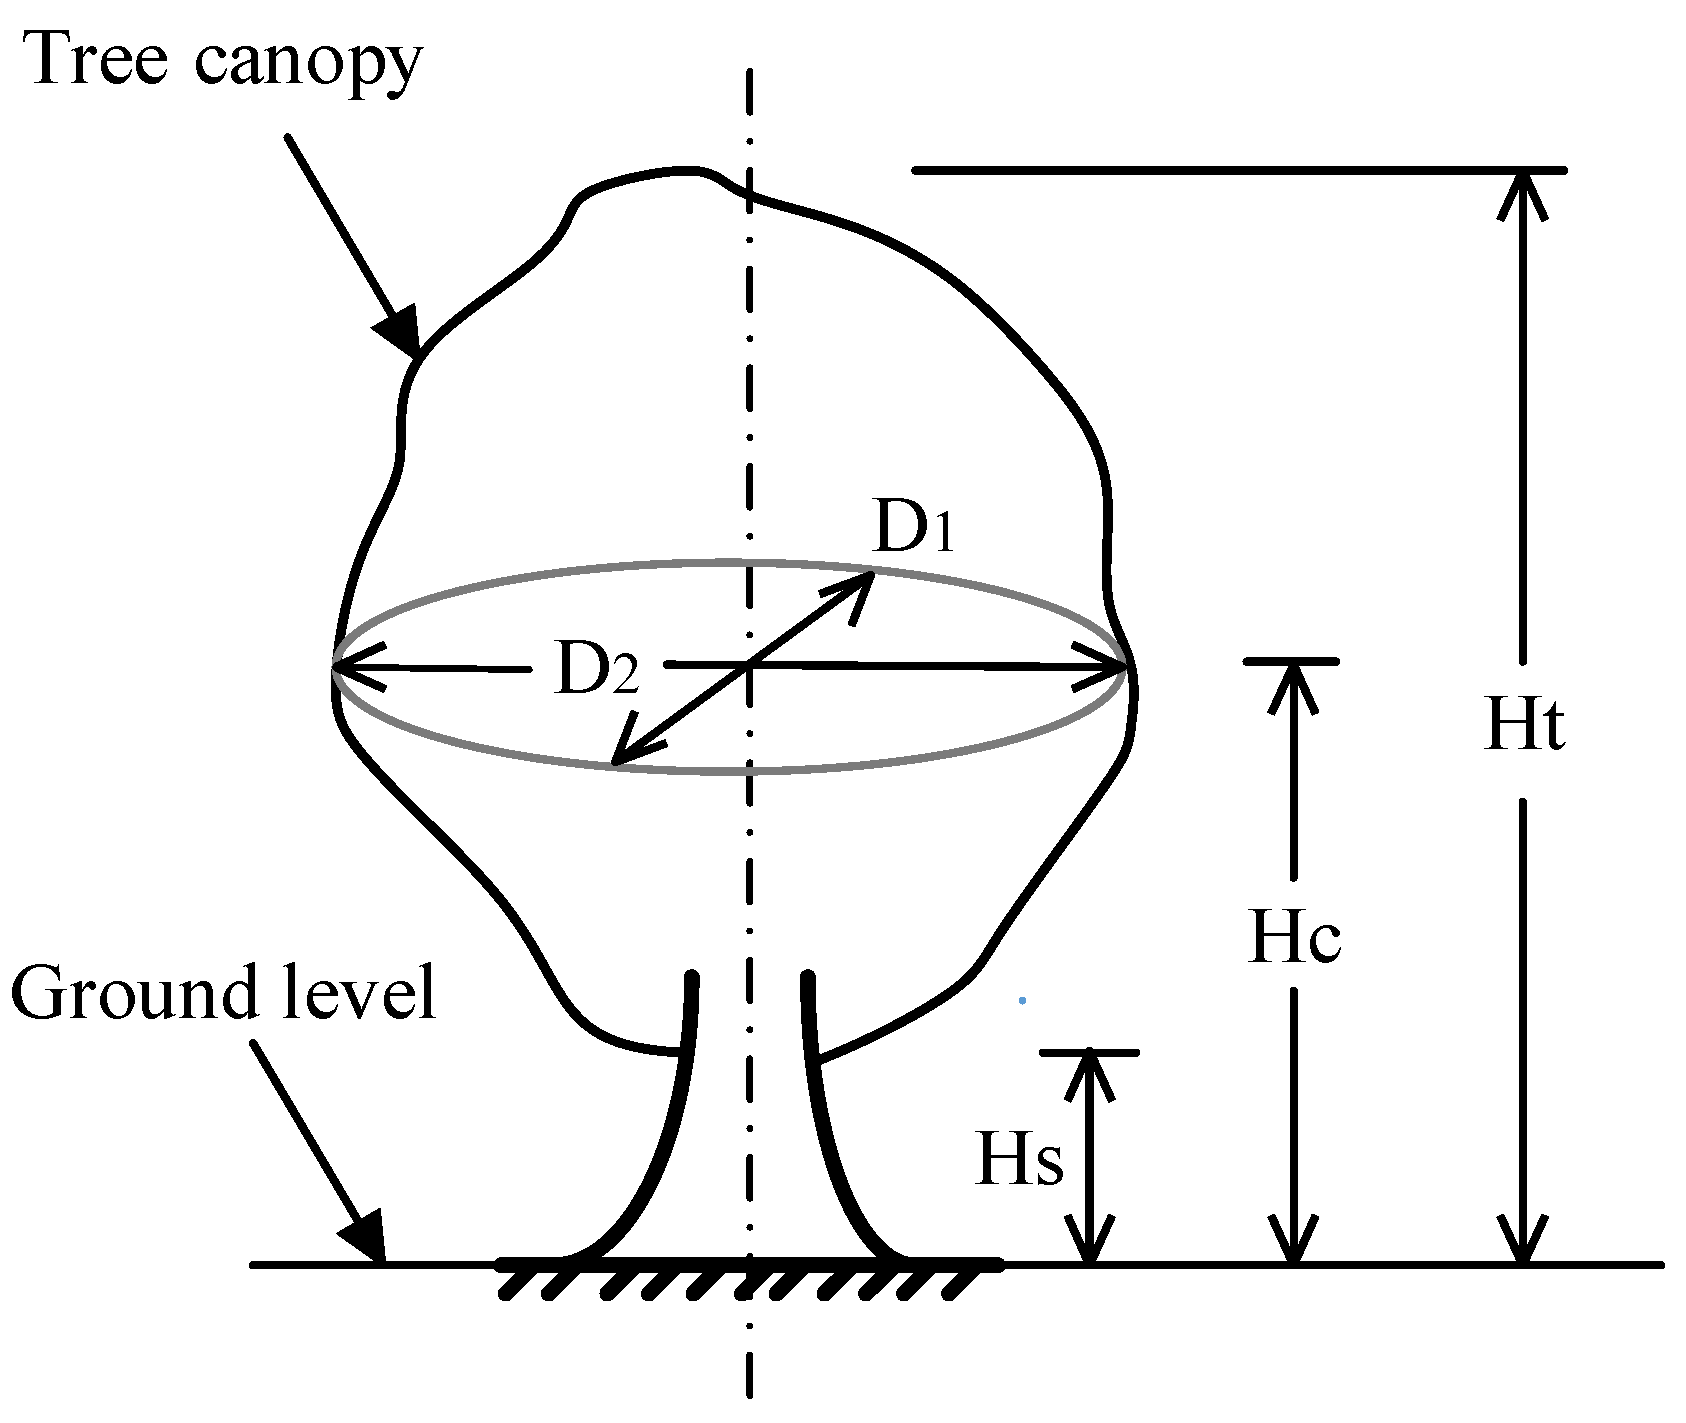
This experiment requires large amount of manual measurement, which is time-consuming and laborious. Thirty-two Citrus reticulate Blanco cv. Shatangju trees were selected for manual measurement. A total of four trials were taken with a field rod and tape measure. Figure 8 shows the measured parameters. Since the Shatangju trees in this study are nearly spherical in shape, the volume of spherical canopy was calculated using the following equation [46,47]:
V M = π D 2 4 [ 2 ( H t H c ) 3 + ( H c H s ) ]
where VM is manually measured volume (m3), D is mean maximum diameter (m), Ht is total canopy height (m), Hc is height from the ground to the maximum diameter of the canopy (m) and Hs is height from the ground to the bottom of the canopy (m).

2.3.2. Phenotypic Parameters Obtained by the Algorithms

Point cloud data of the Citrus reticulate Blanco cv. Shatangju trees is placed in the Cartesian coordinate system, where the value of the highest point in the Z direction is Zmax, the value of the lowest point is Zmin and the difference between them is the height of tree, Ht, in meters (m).
H t = Z m a x Z m i n
The canopy width is usually divided into width in east–west direction, D1, and north–south direction, D2. Since the coordinate system in the Pix4Dmapper software is WGS 84, the X and Y axes of the point cloud data in the 3D coordinate system correspond to the east–west and north–south directions in the geographic location, respectively. After projecting 3D point cloud data onto a 2D plane, the maximum distance in the two directions is calculated, and then the average value is taken as the average maximum diameter, D.
D 1 = X m a x X m i n
D 2 = Y m a x Y m i n
D = D 1 + D 2 2
The key to the precision spraying with agricultural UAVs in orchards lies in the accurate volume calculation. In this study, the following three algorithms were selected with reference to the relatively well-researched volume algorithms: convex hull by slices, voxel-based method and 3D convex hull.
Convex hull by slices method divides the point cloud into several irregular polyhedrons and an irregular cone at the top layer according to the composition shape of the canopy point cloud. The whole canopy point cloud is stratified in the direction of the Z axis according to a certain interval Δh. The setting of the parameter Δh is related to the density of the point cloud; if Δh is too large, the volume estimation is not accurate; if Δh is too small, the calculation is complicated and inefficient. In actual data processing, it is usually set to 1 to 5 times the average point cloud spacing. The Δh in this study was finally set to 2 cm. The contour points of each layer of slices are extracted, and the vertices of the convex hull are connected in turn to form a closed polygon. Then, the convex hull area, Si, of each point cloud slice is calculated, and the volume of each part is calculated by using the volume calculation equation of polyhedron and cone. Finally, the overall canopy volume is obtained by summing up the volumes of each part [31,48]. A schematic diagram of convex hull using the slices method is shown in Figure 9.
Voxel-based method allows simple and efficient segmentation of a point cloud and represents it as a group of volume elements [32,34]. A voxel is a cuboid building block whose geometry is defined by length, width and height. Voxel-based method can transform discrete points with disordered distribution into voxel filtering with topological relations [33]. Firstly, the maximum and minimum values of the point cloud data in the X, Y and Z directions are calculated to determine a cuboid block that encloses the overall canopy point cloud. Secondly, the three-dimensional space of this block is equally divided to n small cubes (the step size in this study was set to 1 cm in all three directions). Then, the coordinates of the point cloud data are traversed to determine whether each small cube contains point cloud data. If it does, a small cube is created with that grid point as the center; otherwise, no small cubes are built. Finally, all grid points are iterated and the number of cubes containing point cloud is counted. The canopy volume of the Shatangju tree can be calculated given the volume of each cube. The schematic diagram of this method is shown in Figure 10a.
The 3D convex hull method involves the creation of a minimal convex hull that encloses all point clouds in 3D space for the point cloud data of Shatangju trees, which is defined by the set of external small planes that wrap the entire point cloud [27,48]. The merge is performed to ensure that the whole shape is convex and does not contain errors caused by non-convex solutions. The volume of the convex hull is then calculated using the small planes as boundaries. Its boundary consists of many Delaunay triangles. The internal gaps of the convex hull are filled to generate the solids (Figure 10b). Generally, convex hulls are mainly calculated using the incremental algorithm, gift-wrapping algorithm, divide-and-conquer method and quick-hull algorithm [28,29]. The quick-hull algorithm was selected in this study. Its algorithm steps are as follows:
1.
The point cloud of the Shatangju tree canopy was converted to .txt format data. Six coordinate points in the point cloud (including the maximum and minimum values of the coordinates) were selected to generate an irregular octahedron and form the initial convex hull model. At this moment, there were some points outside the octahedron. These points formed the new convex hull boundary, which were divided into eight separate regions by the octahedron. The point cloud inside the initial convex hull was removed when the polyhedron was built.
2.
Among the points in the eight regions that were divided, the vertical distances of these points to the corresponding planes were compared and the point with the largest distance in each region was selected. The points selected in step 1 were merged with the newly selected points to form a new triangle and convex hull. Again, the points inside the new convex packet were deleted.
3.
By repeating step 2, the point farthest from each new triangular plane was selected to create a new convex hull. The points inside the convex hull were deleted until there were no points outside the convex hull. Finally, an n-sided convex hull is formed, and the volume of this 3D convex hull model was taken as the volume of the tree canopy.

2.3.3. Evaluation of Model Accuracy

The accuracy of the model in this study is evaluated by the following two indicators: coefficient of determination (R2) and Root Mean Square Error (RMSE). An R2 value close to 1 indicates a better fit of the volume calculation. The smaller the RMSE is, the smaller the deviation of the predicted value is from the true value, i.e., the closer the calculated value of the volumetric algorithm is to the true value of the manual measurement, the higher the prediction accuracy of the model is. The calculation equation is as follows.
R 2 = 1 S S E S S T        
RMSE = 1 M j = 1 M ( Y j X j ) 2
where SSE is the Sum of Squares for Error, SST is the Sum of Square for total, Yj is the sample predicted value, Xj is the sample true value and M is the number of samples.

3. Results

3.1. Segementation Accuracy of Deep Learning

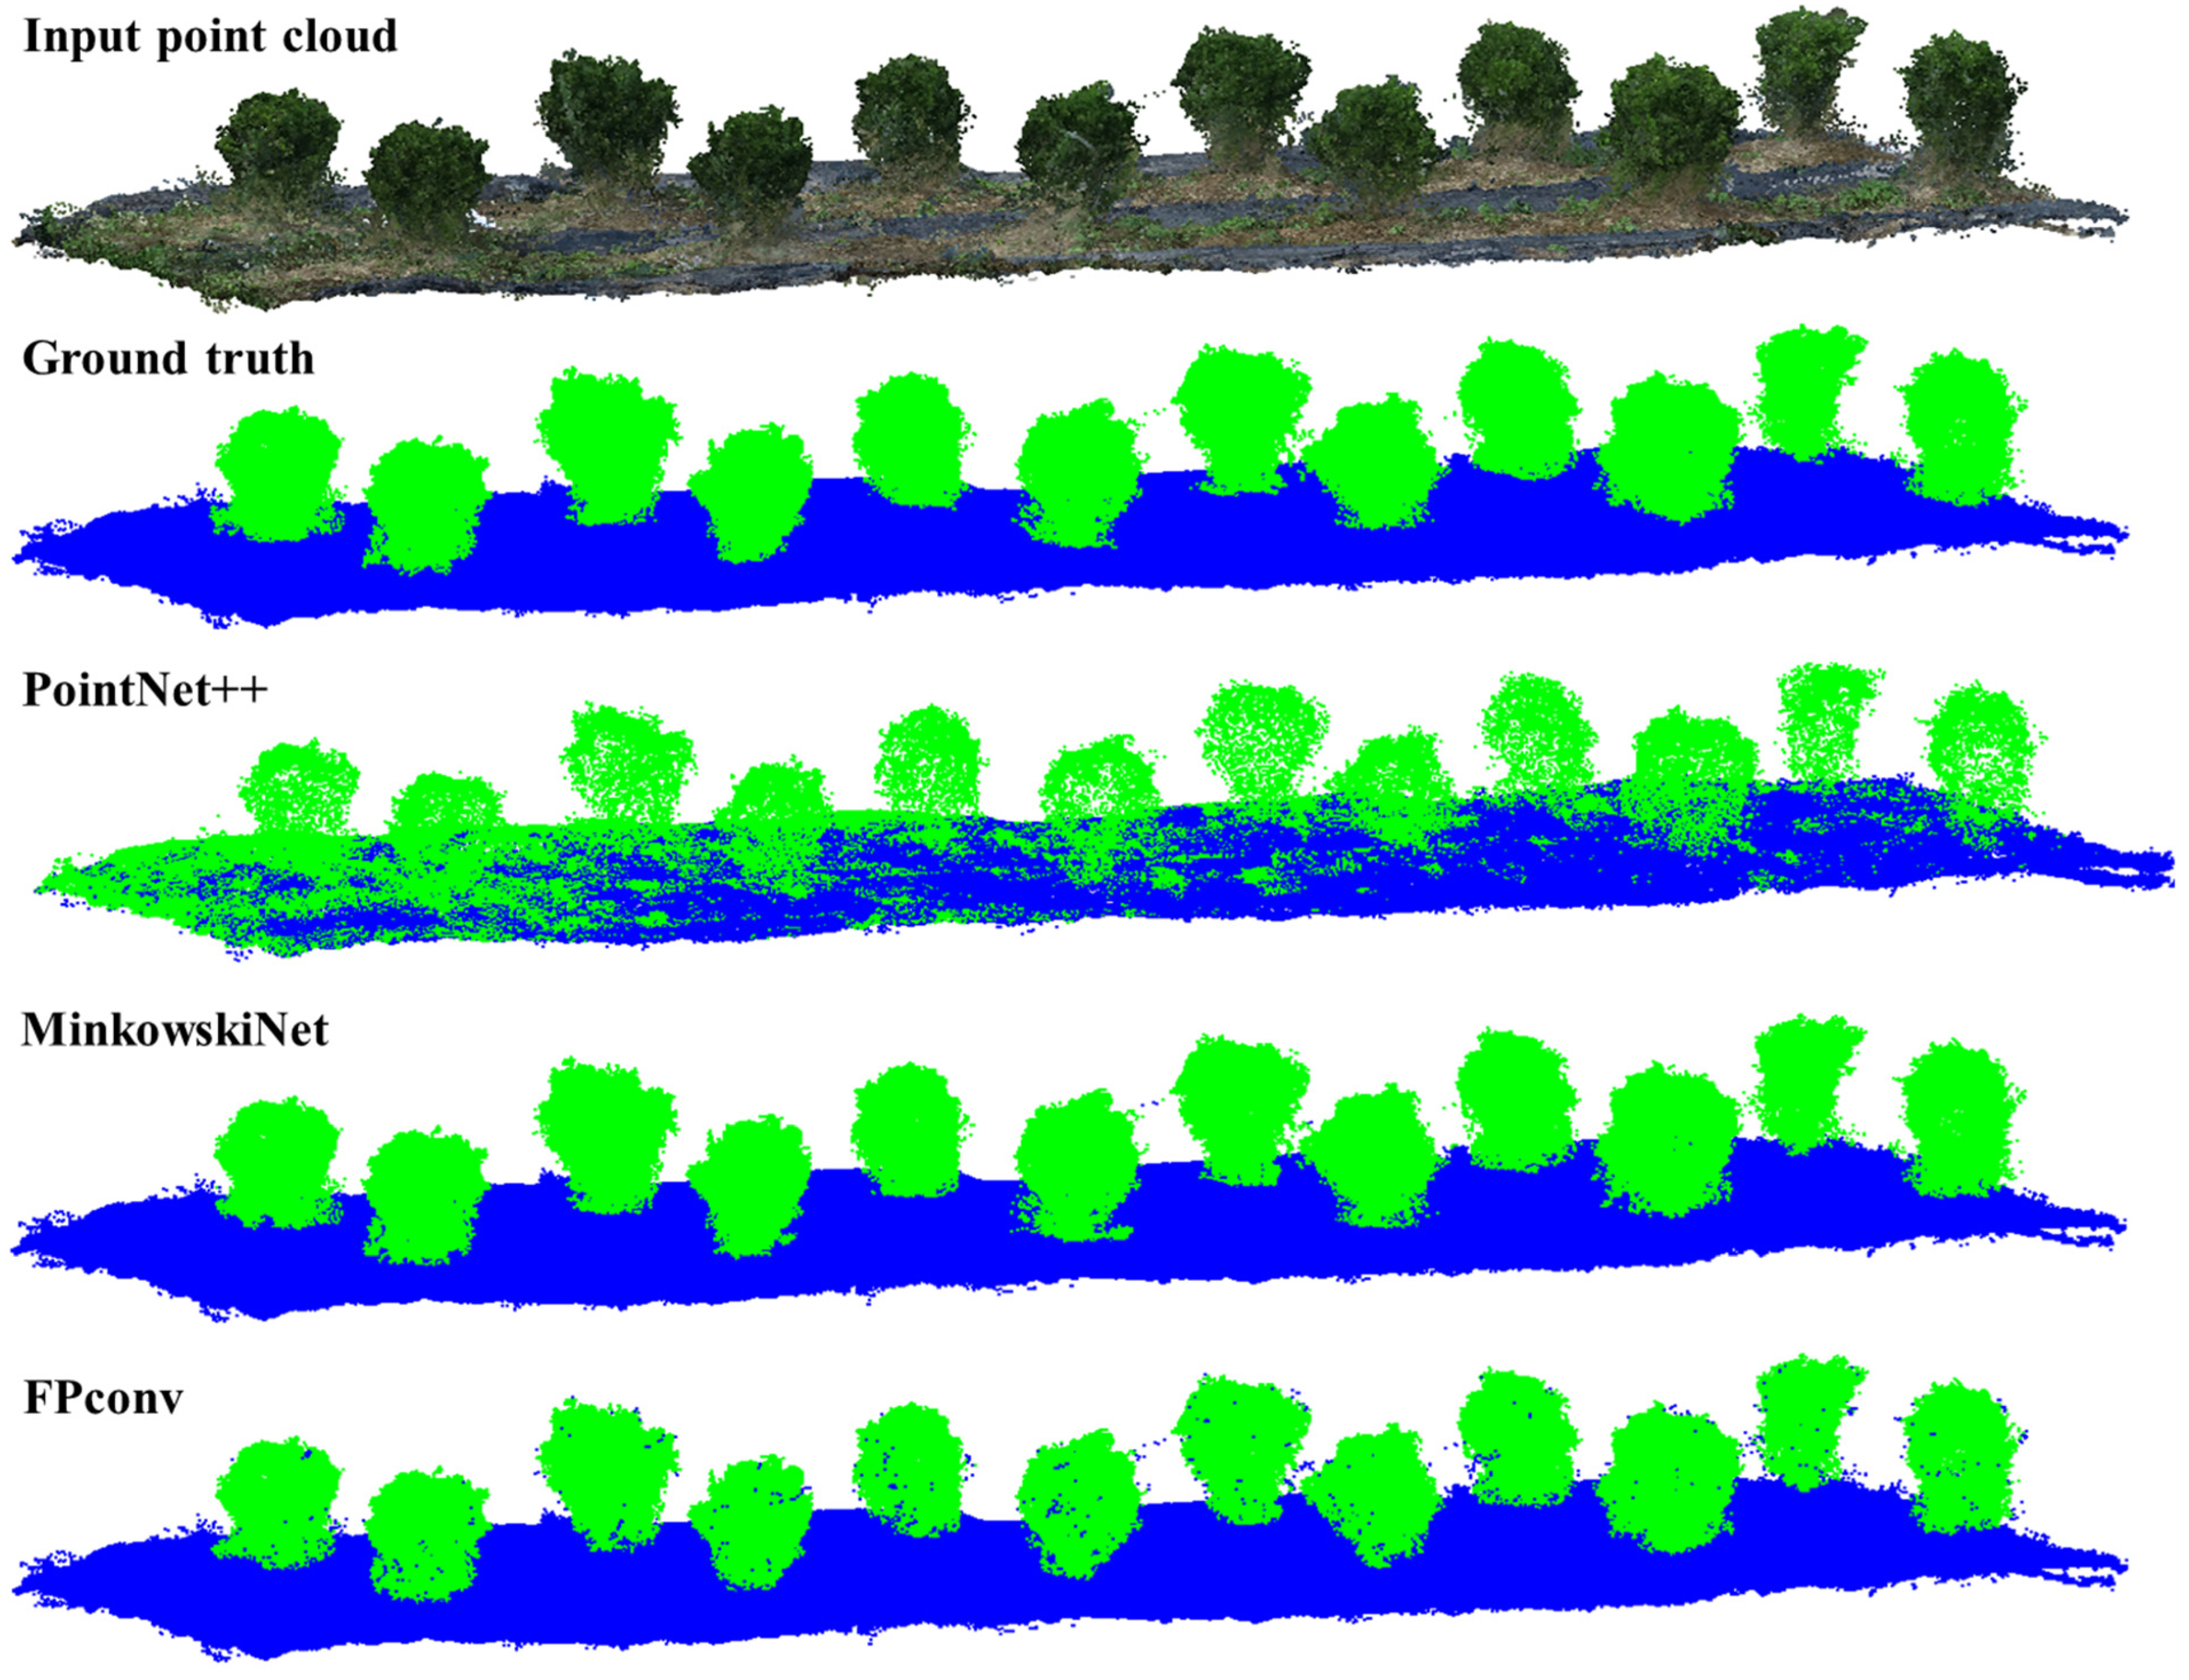
Three deep learning models were applied to classify orchard point cloud data as described previously. Table 1 shows the prediction performance of each model based on the validation set of mIoU. The PointNet++ model has the lowest value in all three evaluation indexes, where the segmentation accuracy of trees is only 27.78%. The MinkowskiNet model achieved the highest value in all three evaluation indexes, with a mIoU value as high as 94.57%, and the best segmentation effect. The FPConv model also has a better classification, but the segmentation accuracy of trees is slightly lower. MinkowskiNet has a higher accuracy than PointNet++ for both trees and ground. The latter only uses the spatial information of the point cloud, while the former can learn the spatial information and color information of each point.
In the training process (Figure 11), the accuracy of the PointNet++ model started to fluctuate as it converged from the 100th epoch, and almost converged after the 200th epoch, but there were still small fluctuations in the later stages. The accuracy of the MinkowskiNet model was as high as 80% in the initial training and converged after the 50th pass. The accuracy of the FPConv model in the initial training was 57% for the initial training and increased rapidly between the 180th and 200th epoch, and basically converged after the 200th time. By comparing the three deep learning models, it can be seen that the MinkowskiNet model requires fewer training epochs, and it is faster and more stable as well.
The qualitative results of the three segmentation models are shown in Figure 12. Each point represents a classified component (tree or ground). The segmentation accuracy of the PointNet++ model is relatively low. There were points of the ground incorrectly segmented as points of the trees, and most of the incorrectly segmented points were concentrated on the left side of the figure. There were missed segmentations of points of each tree; therefore, its segmentation accuracy of trees was low. The segmentation accuracy of both the trees and the ground in the MinkowskiNet model was very high, only some points of individual trees were incorrectly segmented as points of the ground. The ground segmentation accuracy of the FPConv model was relatively high, and each tree had points that were wrongly divided into ground points. Therefore, it can be concluded that the MinkowskiNet model has the best effects for the point segmentation of the trees and the ground.
In conclusion, the MinkowskiNet model achieved the best results among the three deep learning models with the highest segmentation accuracy and the least convergent training times.

3.2. Accuracy of Phenotypic Parameters Acquisition Model

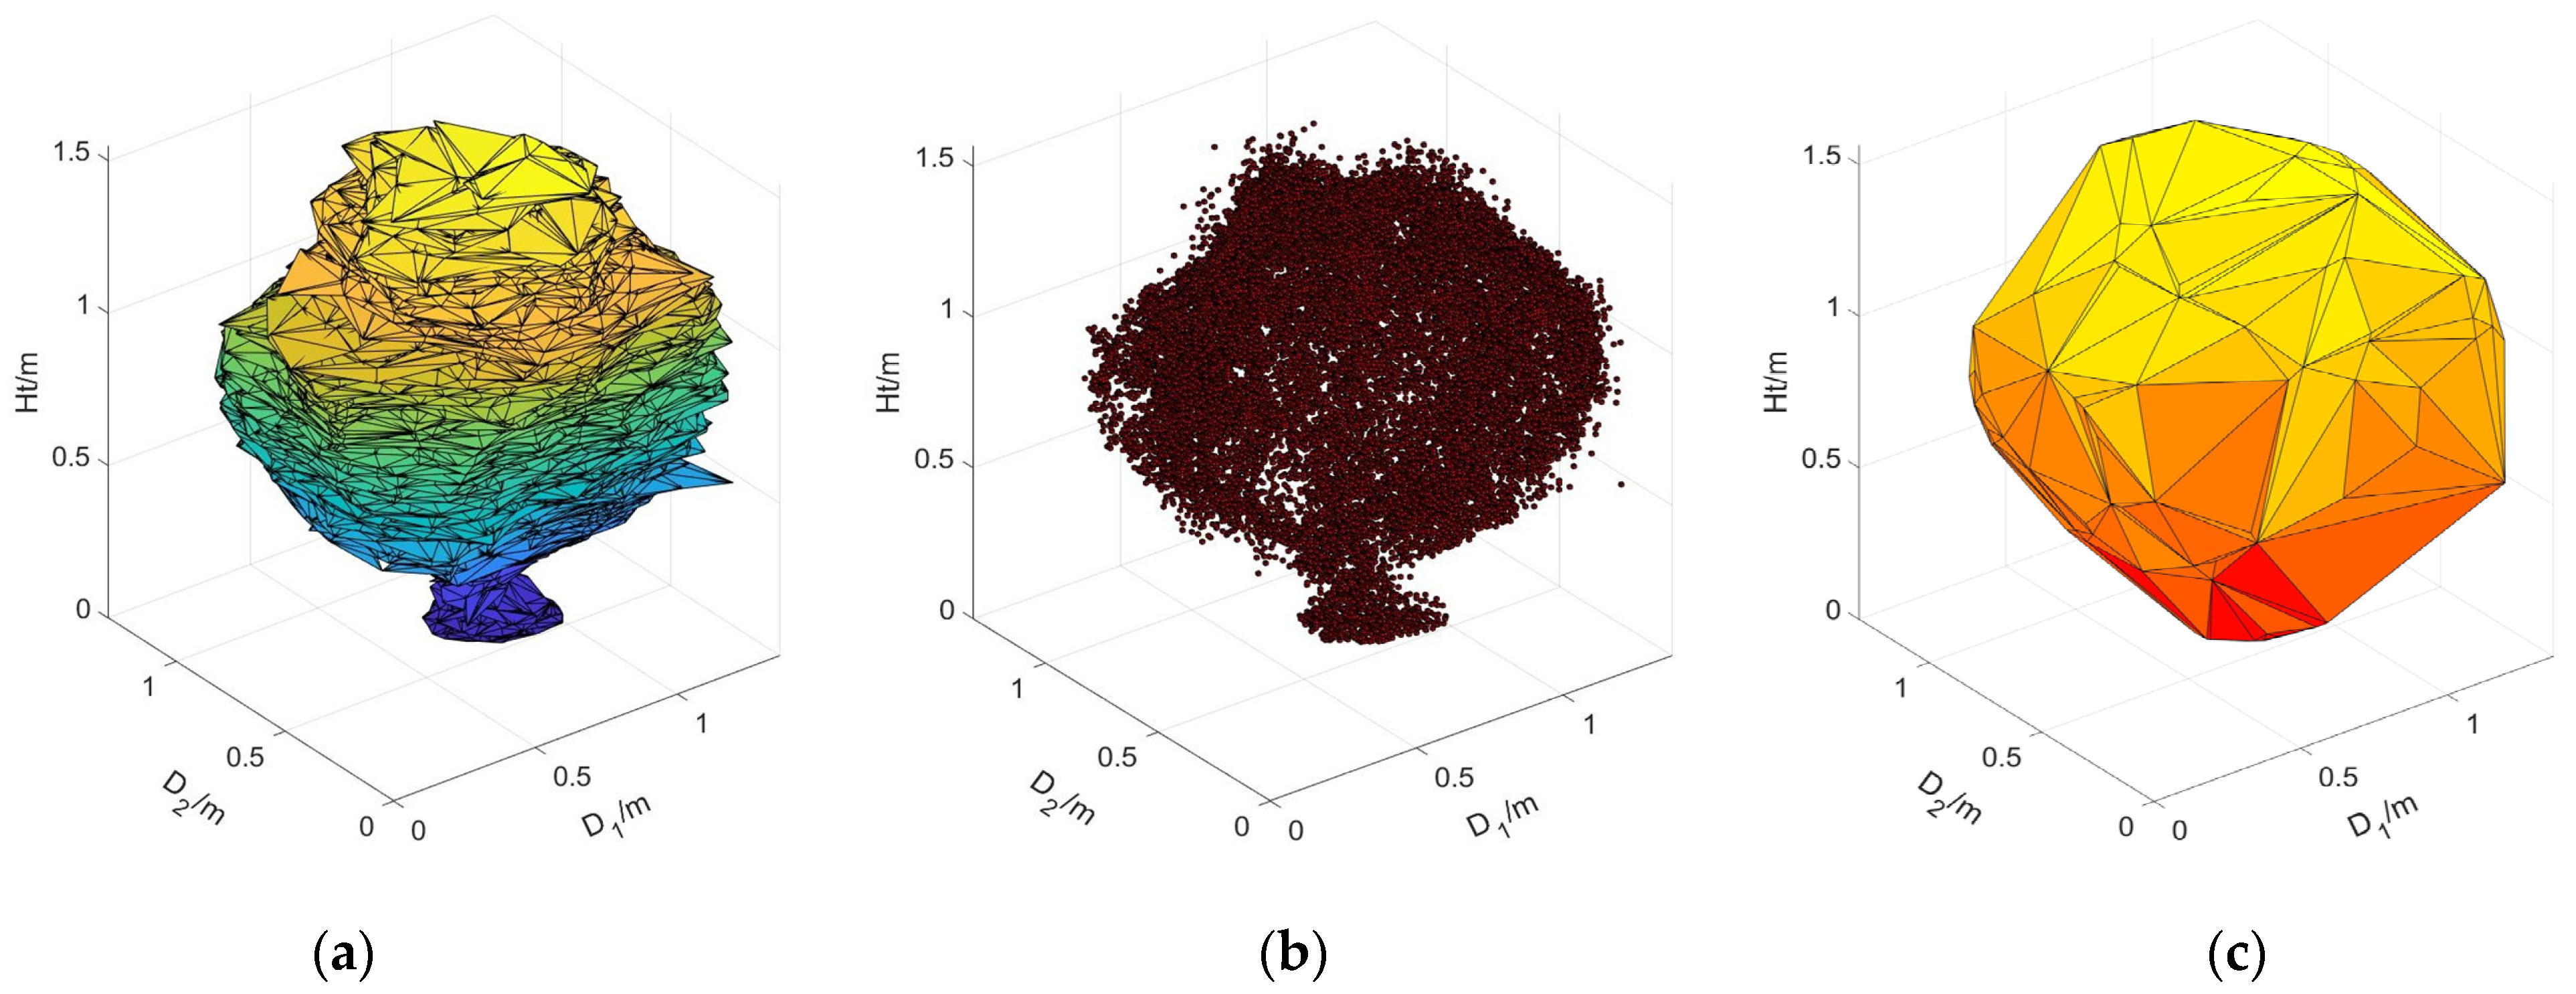
The canopy volumes of 32 sample trees were calculated using the four calculation methods proposed in Section 2.3. The results of the three volume algorithms are shown schematically in Figure 13, which demonstrates the volume morphology of the Shatangju trees. The calculation results of the measurement sample in the first trial are listed in Table 2. The statistics of the total results of the four trials show that the height of the Shatangju trees ranged in 1.06–2.15 m and the tree canopy width ranged in 0.92–1.94 m. In addition, the volumes calculated from the manual measurement, convex hull by slices algorithm, voxel-based method and 3D convex hull algorithm were 0.53–4.28, 0.48–4.64, 0.40–2.94 and 0.46–4.02 m3, respectively. For the same tree, the volume calculated using the convex hull by slices algorithm was the largest value, followed by the voxel-based method and the 3D convex hull algorithm. The significant differences in the calculated results are closely related to the acquired point clouds of the trees and the characteristics of the different algorithms.
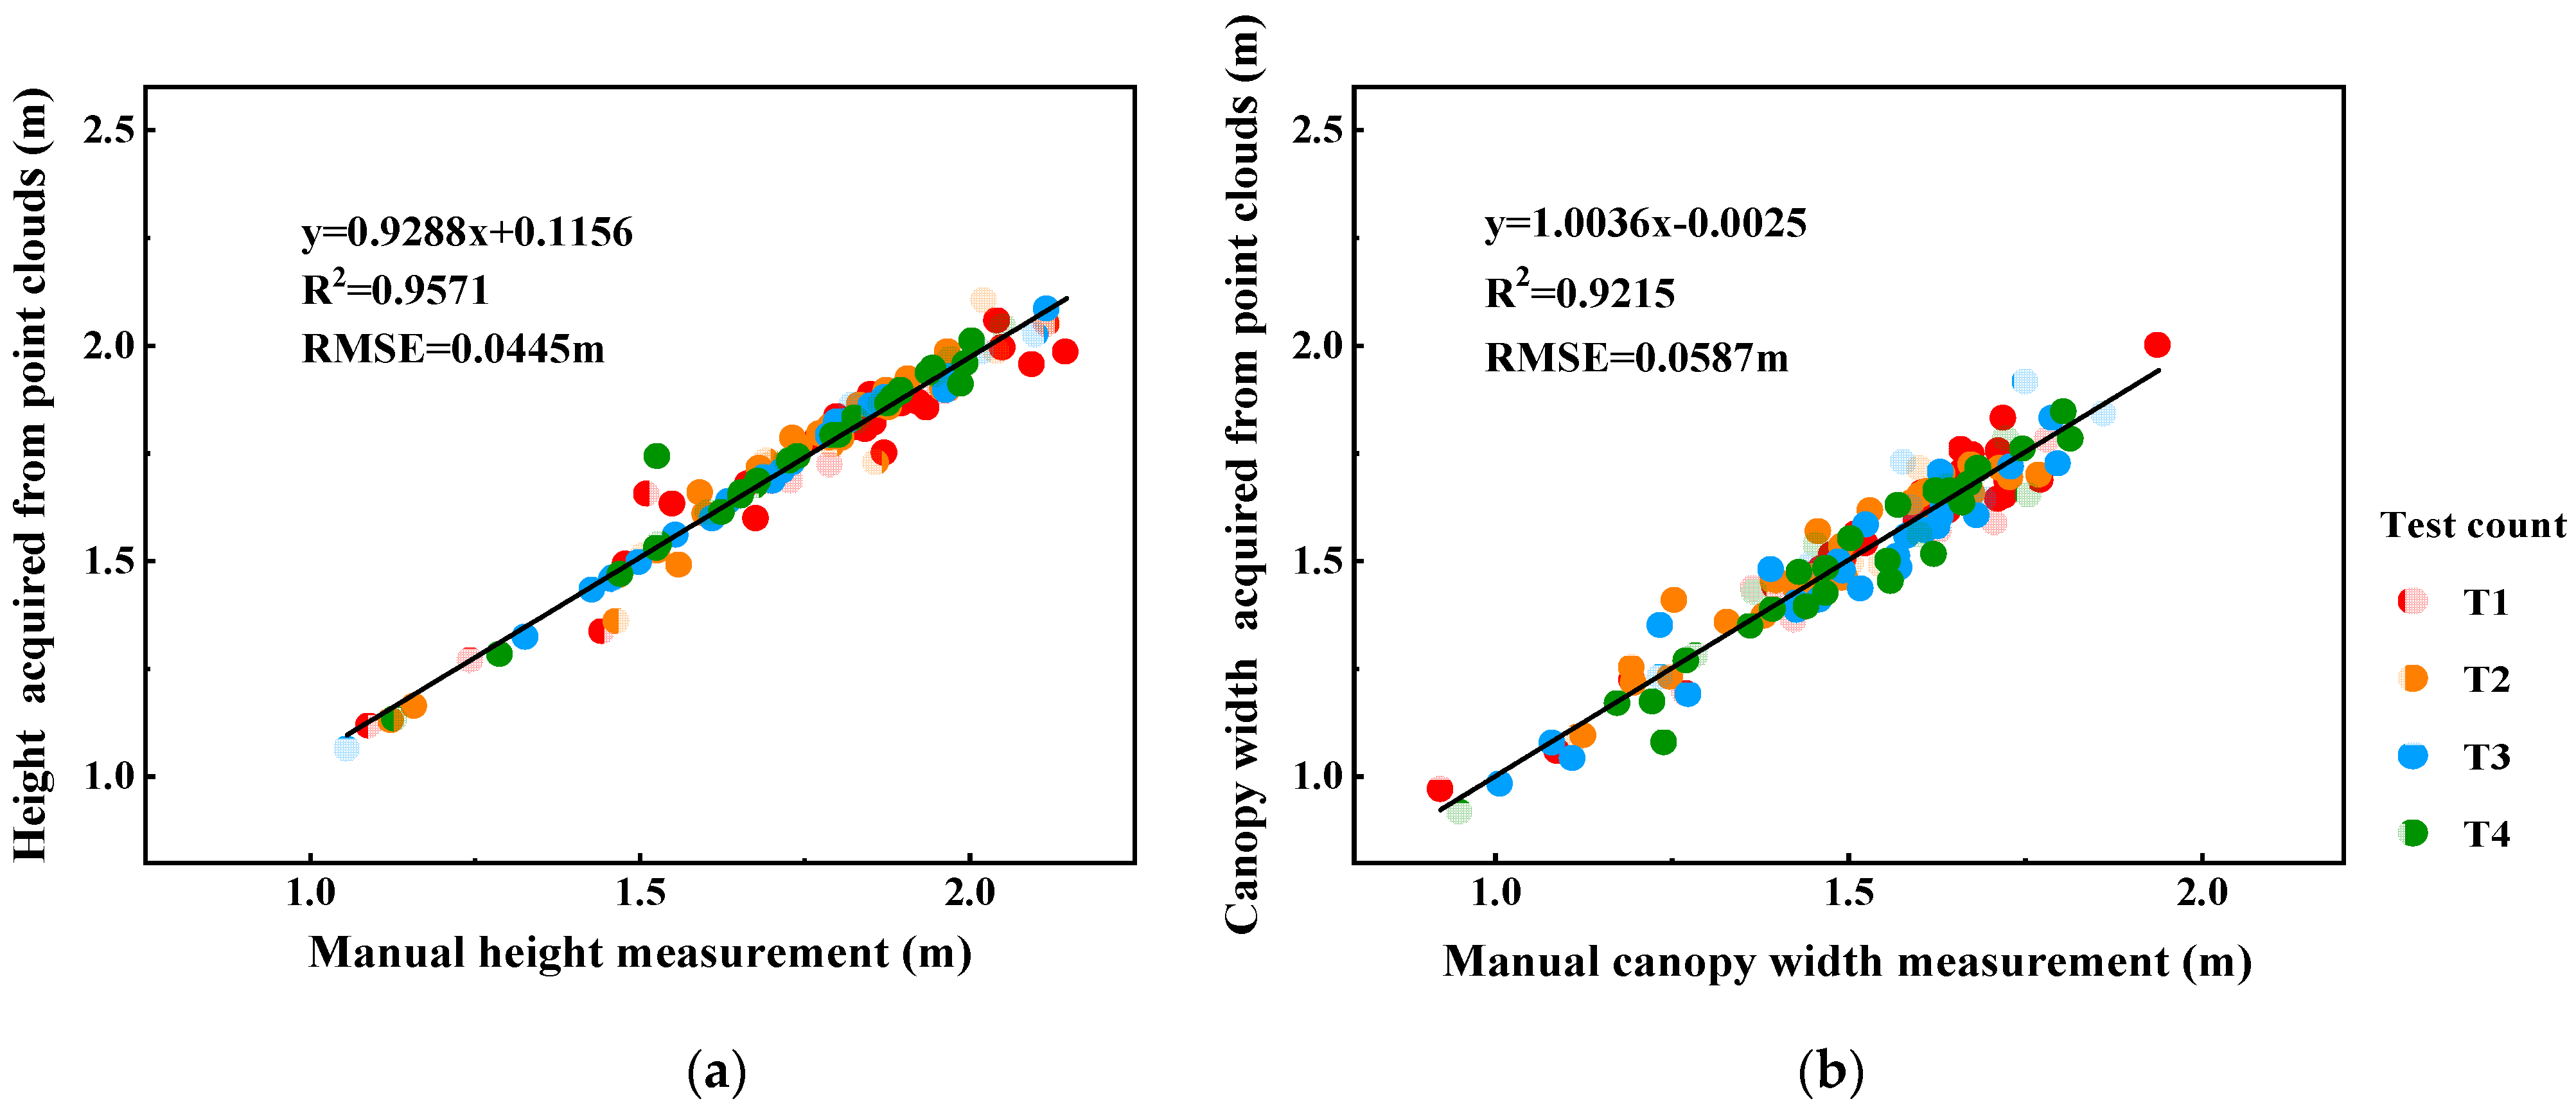
Regression models between each attribute and the manually obtained true values were analyzed to verify whether the point cloud results obtained from trees reliably represent the canopy structure. The manually measured height and diameter mean values were taken as true values. The point cloud heights and canopy widths acquired in CloudCompare software were compared with the true values. From the results shown in Figure 14, it can be seen that the R2 between the heights acquired based on the point clouds and the manually measured height is 0.9571 with an RMSE of 0.0445 m. The R2 between the canopy width acquired from the point clouds and the manually measured diameter is 0.9215 with an RMSE of 0.0587 m. It indicates that the Shatangju tree parameters obtained from the point clouds can reliably reflect the real tree height and canopy width. There was a high correlation between the different growth periods. Therefore, in order to automate the calculation of volume parameters, the point cloud data can be directly applied as true values for volume calculation.
In order to select the optimal algorithm for Shatangju tree volume calculation, linear regression analysis was also performed between each of the three volume algorithms and the manual measurement. The calculated volume value of the spherical canopy was taken as the true value, and the calculation of different volume algorithms was used as the comparison value. From the results in Figure 15, it can be seen that the volume of the trees as calculated using the convex hull by slice algorithm showed an R2 of 0.8004 and RMSE of 0.3833 m3 compared with the manually measured data. It exceeded the voxel-based method with an R2 and RMSE of 0.5925 and 0.3406 m3, respectively. However, the 3D convex hull algorithm performed the best with the strongest correlation (0.8215) and the lowest RMSE (0.3186 m3). That is, the 3D convex hull algorithm achieved the highest correlation that was close to one, followed by the convex hull by slices algorithm. The correlation of the voxel-based method was poor. Based on the analysis of Figure 13c, it can be observed that the 3D convex hull algorithm encloses the whole canopy, and its principle is closest to the formula for calculating the volume of the spherical canopy. However, due to the fact that the triangular planes that enclosed the canopy were not smooth spherical surfaces, the calculated volume of the 3D convex hull algorithm is slightly smaller than the true value of volume. The convex hull by slices algorithm (Figure 13a) took part of the point cloud as the calculation object, and there were still a large number of gaps in the established sliced convex hull and the segmented body, resulting in the fact that the computed volume is larger than the actual canopy volume. The voxel-based algorithm (Figure 13b) built the point cloud into small cubes with a known volume and calculated the tree volume by counting the number of small cubes. However, since the point cloud itself was built based on the surface of images and missed the internal point cloud information, the computed volume was less than the true value. The correlation was also poor. Therefore, the 3D convex hull algorithm was determined as the algorithm to automatically calculate the volume of Shatangju trees.

4. Discussion

The results indicate that it is feasible to use the point cloud deep learning algorithm combined with the volume calculation algorithm to automatically obtain the canopy volume parameters of the Citrus reticulate Blanco cv. Shatangju tree. With the development of UAV technology, UAV images have also been widely used [49,50,51,52,53,54,55,56]. Studies [10,11,12,13] have shown that UAV tilt photogrammetry can quickly and conveniently obtain images and texture information of forests, pine trees, eucalyptus, etc. UAV tilt photogrammetry is also suitable to obtain the image of the Citrus reticulate Blanco cv. Shatangju orchard, in order to further establish the 3D model of the orchard. It saves time and labor compared to manual measurement and provides a low-cost solution compared to ground mechanical sensors. For the acquisition of the canopy volume of a single Citrus reticulate Blanco cv. Shatangju tree, the proposed method in this research considers the segmentation optimization of the whole orchard, and uses the cutting-edge point cloud deep learning segmentation algorithm. Moreover, the point cloud data obtained by segmentation is directly input into the volume algorithm to improve the accuracy of the volume calculation of a single tree.
In this study, tilt photogrammetry images of Citrus reticulate Blanco cv. Shatangju trees were acquired with a DJI UAV. Experiments should be conducted at noon, when no shadow was in the image affecting the accuracy of the 3D point cloud model. However, data acquisition could not be completed within a short period of time at noon due to the large area of the experimental site. In this case, a time period with better light conditions in the daytime was selected for UAV tilt photogrammetry image acquisition in this study. In addition, Citrus reticulate Blanco cv. Shatangju trees were easily obscured by branches and leaves of adjacent trees during UAV tilt photogrammetry [15], resulting in the occlusion of the lower part and bottom of the trees. Therefore, the angle of the camera and the flight path need to be adjusted. Different head angles of −90°, −60°, −45° and −30°, as well as a flight path of 30° east of north, were set in the experiments to ensure that the bottom of the trees could be photographed.
Pix4Dmapper software was applied to build the 3D point cloud model of the experimental site based on UAV tilt photogrammetry images. In order to reduce the computational complexity and noise error in the preprocessing process, three network models, PointNet++, MinkowskiNet and FPConv, were selected for the feature information extraction directly. Although PointNet++ solves the problem of the uneven sampling of point cloud data, it is the same as the PointNet network with insufficient learning of local features, resulting in misclassification with large error. MinkowskiNet makes use of sparse 3D convolution and takes all the discrete convolutions as its subclasses to enhance the information interaction between points and to better distinguish the high-dimensional data. Therefore, MinkowskiNet was able to produce high-quality segmentation effects for the 3D point cloud data in this study. FPConv also achieved good segmentation results, especially for the orchard ground, because its local features were mosaicked with the coordinate information of each point. However, fewer points of trees were classified as ground, possibly because the 2D surface convolution lost a small part of the 3D information of the point cloud. In this study, only the above three network models were adopted for learning. A variety of network models should be investigated in subsequent studies for comparative analysis to determine the most suitable deep learning network for orchard scenes.
The canopy volume and internal structure of Shatangju trees are important indicators for their growth volume and biological characteristics, which provide scientific reference for precision spraying. After the point cloud deep learning algorithm segments a single tree, the height, canopy width and volume of the Shatangju tree are then automatically calculated using volume algorithms. The height and canopy width of the point cloud showed high correlation with the manual measurement values, and the volume algorithm also presented high correlation, except for the voxel-based method. However, as the manual measurement calculated the hull volume through the outermost branches of the canopy, there were certain gaps and holes in the canopy. As a result, the calculated volume could be larger than the true value of the tree canopy without removing these spaces [48]. For the error caused by manual measurement, LiDAR scan data can be used as the true value instead to explore whether there is a certain linear relationship between the point cloud models established using UAV tilt photogrammetry images [49]. The LiDAR point cloud could be applied to calculate a more accurate volume of Shatangju trees, in order to improve the accuracy of spraying volume in pesticide applications.
The purpose of this study is to automatically obtain the canopy volume of the Citrus reticulate Blanco cv. Shatangju trees, in order to provide a reference for the precision management of an orchard. The canopy volume parameters of a single tree were automatically obtained using UAV tilt photogrammetry, deep learning and the volume algorithm. A volume grading map can be achieved to present the growth information of the orchard based on the results in this study. In agricultural practice, producers can transform the growth information map of the orchard into an operational prescription map based on their spraying experience and decision making to achieve precision spraying by plant protection UAVs. Subsequent research is suggested to use this dataset to explore algorithms of generating a prescription map for pesticides application. A transmission protocol is also required to transfer the prescription map to plant protection UAVs in order to guide the practical pesticides spraying applications.

5. Conclusions

This study established a set of automatic acquisition methods for the canopy volume of Citrus reticulate Blanco cv. Shatangju trees. The point cloud model established based on UAV tilt photogrammetry images was trained by three deep learning networks, PointNet++, MinkowskiNet and FPConv. The results show that the MinkowskiNet model works best for point segmentation between Citrus reticulate Blanco cv. Shatangju trees and the ground. The overall accuracy of the MinkowskiNet model was higher than that of the other two models, with an average mIoU of 94.57%. The segmentation accuracy of the MinkowskiNet model was 90.82 and 98.32% for trees and ground, respectively. The MinkowskiNet model achieved an accuracy as high as 80% for the first training epoch, and it converged after the 50th epoch. It required less training steps, and it was faster and more stable as well.
Both the height and canopy width obtained from the point cloud were highly correlated with the manually measured values and were not affected by the growth period of the Citrus reticulate Blanco cv. Shatangju trees. The R2 and RMSE values for the height and canopy width were 0.9571 and 0.0445 m, and 0.9215 and 0.0587 m, respectively. The accuracy evaluation of the proposed point cloud model indicates that the model has high estimation accuracy and can be used to obtain the volume values of Citrus reticulate Blanco cv. Shatangju trees by volume algorithms.
From the results of linear regression analysis between each of the three volume algorithms and the manual volume measurement, it is clear that the 3D convex hull algorithm achieved the highest R2 of 0.8215, followed by the convex hull by slices algorithm and the voxel-based method. Therefore, the 3D convex hull algorithm was selected as the optimal algorithm for automatic volume of Citrus reticulate Blanco cv. Shatangju trees.

Author Contributions

Conceptualization, Y.Z., K.-H.L. and Y.L.; methodology, Y.Q., X.D. and P.C.; software, Y.Q., X.D. and X.L.; validation, Y.Q., X.D. and X.L.; formal analysis, Y.Q., X.D. and X.L.; investigation, Y.Q. and X.L.; resources, Y.Z., R.J. and J.D.; data curation, Y.Q. and X.L.; writing—original draft preparation, Y.Q.; writing—review and editing, Y.Z., P.C. and X.L.; visualization, Y.Q. and X.D.; supervision, Y.Z., K.-H.L. and J.D.; project administration, Y.Z. and Y.L.; funding acquisition, Y.Z. and Y.L. All authors have read and agreed to the published version of the manuscript.

Funding

This research was funded by Guangdong Science and Technology Plan Project, grant number 2018A050506073, Guangdong Modern Agricultural Industry Generic Key Technology Research and Development Innovation Team Project, grant number 2020KJ133, National Key Research and Development Program, grant number 2018YFD0201506 and the 111 Project, grant number D18019.

Conflicts of Interest

The authors declare no conflict of interest.

References

  1. Wang, W.; Hong, T.; Li, J.; Zhang, F.; Lu, Y. Review of the pesticide precision orchard spraying technologies. Trans. Chin. Soc. Agric. Eng. 2004, 20, 98–101. [Google Scholar]
  2. Zhou, L.; Xue, X.; Zhou, L.; Zhang, L.; Ding, S.; Chang, C.; Zhang, X.; Chen, C. Research situation and progress analysis on orchard variable rate spraying technology. Trans. Chin. Soc. Agric. Eng. 2017, 33, 80–92. [Google Scholar]
  3. Fox, R.D.; Derksen, R.C.; Zhu, H.; Brazee, R.D.; Svensson, S.A. A History of Air-Blast Sprayer Development and Future Prospects. Trans. ASABE 2008, 51, 405–410. [Google Scholar] [CrossRef]
  4. Feng, Z.; Luo, X.; Ma, Q.; Hao, X.; Chen, X.; Zhao, L. An estimation of tree canopy biomass based on 3D laser scanning imag-ing system. J. Beijing For. Univ. 2007, 29, 52–56. [Google Scholar]
  5. Wei, X.; Wang, Y.; Zheng, J.; Wang, M.; Feng, Z. Tree crown volume calculation based on 3-D laser scanning point clouds data. Trans. Chin. Soc. Agric. Mach. 2013, 44, 235–240. [Google Scholar]
  6. Ding, W.; Zhao, S.; Zhao, S.; Gu, J.; Qiu, W.; Guo, B. Measurement methods of fruit tree canopy volume based on machine vision. Trans. Chin. Soc. Agric. Mach. 2016, 47, 1–10. [Google Scholar]
  7. Wallace, L.; Lucieer, A.; Watson, C.; Turner, D. Development of a UAV-LiDAR system with application to forest inventory. Remote Sens. 2012, 4, 1519–1543. [Google Scholar] [CrossRef] [Green Version]
  8. MacFaden, S.W.; O’Neil-Dunne, J.P.; Royar, A.R.; Lu, J.W.; Rundle, A. High-resolution tree canopy mapping for New York City using LIDAR and object-based image analysis. J. Appl. Remote Sens. 2012, 6, 63567. [Google Scholar] [CrossRef]
  9. Gangadharan, S.; Burks, T.F.; Schueller, J.K. A comparison of approaches for citrus canopy profile generation using ultrasonic and Leddar® sensors. Comput. Electron. Agric. 2019, 156, 71–83. [Google Scholar] [CrossRef]
  10. Qin, Y.; Ferraz, A.; Mallet, C.; Iovan, C. Individual tree segmentation over large areas using airborne LiDAR point cloud and very high resolution optical imagery. In Proceedings of the 2014 IEEE Geoscience and Remote Sensing Symposium, Quebec City, QC, Canada, 13–18 July 2014; pp. 800–803. [Google Scholar] [CrossRef]
  11. Tian, J.; Dai, T.; Li, H.; Liao, C.; Teng, W.; Hu, Q.; Ma, W.; Xu, Y. A Novel Tree Height Extraction Approach for Individual Trees by Combining TLS and UAV Image-Based Point Cloud Integration. Forests 2019, 10, 537. [Google Scholar] [CrossRef] [Green Version]
  12. Gülci, S. The determination of some stand parameters using SfM-based spatial 3D point cloud in forestry studies: An analysis of data production in pure coniferous young forest stands. Environ. Monit. Assess. 2019, 191, 495. [Google Scholar] [CrossRef]
  13. Jurado, J.; Pádua, L.; Feito, F.; Sousa, J. Automatic Grapevine Trunk Detection on UAV-Based Point Cloud. Remote. Sens. 2020, 12, 3043. [Google Scholar] [CrossRef]
  14. Camarretta, N.; Harrison, P.A.; Lucieer, A.; Potts, B.M.; Davidson, N.; Hunt, M. From drones to phenotype: Using UAV-LiDAR to de-tect species and provenance variation in tree productivity and structure. Remote Sens. 2020, 12, 3184. [Google Scholar] [CrossRef]
  15. Wang, Y.; Wang, J.; Chang, S.; Sun, L.; An, L.; Chen, Y.; Xu, J. Classification of street tree species using UAV tilt photogramme-try. Remote Sens. 2021, 13, 216. [Google Scholar] [CrossRef]
  16. Zamboni, P.; Junior, J.; Silva, J.; Miyoshi, G.; Matsubara, E.; Nogueira, K.; Gonçalves, W. Benchmarking Anchor-Based and Anchor-Free State-of-the-Art Deep Learning Methods for Individual Tree Detection in RGB High-Resolution Images. Remote. Sens. 2021, 13, 2482. [Google Scholar] [CrossRef]
  17. Egli, S.; Höpke, M. CNN-Based Tree Species Classification Using High Resolution RGB Image Data from Automated UAV Observations. Remote. Sens. 2020, 12, 3892. [Google Scholar] [CrossRef]
  18. Nezami, S.; Khoramshahi, E.; Nevalainen, O.; Pölönen, I.; Honkavaara, E. Tree Species Classification of Drone Hyperspectral and RGB Imagery with Deep Learning Convolutional Neural Networks. Remote Sens. 2020, 12, 1070. [Google Scholar] [CrossRef] [Green Version]
  19. Martins, J.; Nogueira, K.; Osco, L.; Gomes, F.; Furuya, D.; Gonçalves, W.; Sant’Ana, D.; Ramos, A.; Liesenberg, V.; dos Santos, J.; et al. Semantic Segmentation of Tree-Canopy in Urban Environment with Pixel-Wise Deep Learning. Remote Sens. 2021, 13, 3054. [Google Scholar] [CrossRef]
  20. Yan, S.; Jing, L.; Wang, H. A New Individual Tree Species Recognition Method Based on a Convolutional Neural Network and High-Spatial Resolution Remote Sensing Imagery. Remote Sens. 2021, 13, 479. [Google Scholar] [CrossRef]
  21. Chadwick, A.; Goodbody, T.; Coops, N.; Hervieux, A.; Bater, C.; Martens, L.; White, B.; Röeser, D. Automatic Delineation and Height Measurement of Regenerating Conifer Crowns under Leaf-Off Conditions Using UAV Imagery. Remote Sens. 2020, 12, 4104. [Google Scholar] [CrossRef]
  22. Rusu, R.B.; Blodow, N.; Beetz, M. Fast Point Feature Histograms (FPFH) for 3D registration. In Proceedings of the 2009 IEEE International Conference on Robotics and Automation, Kobe, Japan, 12–17 May 2009; pp. 3212–3217. [Google Scholar]
  23. Joachim, N.; Franz, R.; Uwe, S. Contextual classification of LiDAR data and building object detection in urban areas. ISPRS J. Photogramm. 2014, 87, 152–165. [Google Scholar]
  24. Shen, Z.; Liang, H.; Lin, L.; Wang, Z.; Huang, W.; Yu, J. Fast Ground Segmentation for 3D LiDAR Point Cloud Based on Jump-Convolution-Process. Remote Sens. 2021, 13, 3239. [Google Scholar] [CrossRef]
  25. Aboutaleb, A.; El-Wakeel, A.; Elghamrawy, H.; Noureldin, A. LiDAR/RISS/GNSS Dynamic Integration for Land Vehicle Robust Positioning in Challenging GNSS Environments. Remote Sens. 2020, 12, 2323. [Google Scholar] [CrossRef]
  26. Phattaralerphong, J.; Sinoquet, H. A method for 3D reconstruction of tree crown volume from photographs: Assessment with 3D-digitized plants. Tree Physiol. 2005, 25, 1229–1242. [Google Scholar] [CrossRef] [PubMed] [Green Version]
  27. Olsoy, P.J.; Glenn, N.F.; Clark, P.E.; Derryberry, D.R. Aboveground total and green biomass of dryland shrub derived from terrestrial laser scanning. ISPRS J. Photogramm. Remote Sens. 2014, 88, 166–173. [Google Scholar] [CrossRef] [Green Version]
  28. Lauri, K.; Jari, V.; Anni, V.; Aarne, H.; Ilkka, K. Estimation of tree crown volume from airborne lidar data using computational geometry. Int. J. Remote Sens. 2013, 34, 7236–7248. [Google Scholar]
  29. Lin, W.; Meng, Y.; Qiu, Z.; Zhang, S.; Wu, J. Measurement and calculation of crown projection area and crown volume of individual trees based on 3D laser-scanned point-cloud data. Int. J. Remote Sens. 2017, 38, 1083–1100. [Google Scholar] [CrossRef]
  30. Fernández-Sarría, A.; Martínez, L.; Velázquez-Martí, B.; Sajdak, M.; Estornell, J.; Recio, J.A. Different methodologies for cal-culating crown volumes of Platanus hispanica trees using terrestrial laser scanner and a comparison with classical dendro-metric measurements. Comput. Electron. Agric. 2013, 90, 176–185. [Google Scholar] [CrossRef]
  31. Li, L.; Li, D.; Zhu, H.; Li, Y. A dual growing method for the automatic extraction of individual trees from mobile laser scanning data. ISPRS J. Photogramm. 2016, 120, 37–52. [Google Scholar] [CrossRef]
  32. Popescu, S.C.; Zhao, K. A voxel-based lidar method for estimating crown base height for deciduous and pine trees. Remote Sens. Environ. 2008, 112, 767–781. [Google Scholar] [CrossRef]
  33. Wang, Y.; Cheng, L.; Chen, Y.; Wu, Y.; Li, M. Building Point Detection from Vehicle-Borne LiDAR Data Based on Voxel Group and Horizontal Hollow Analysis. Remote Sens. 2016, 8, 419. [Google Scholar] [CrossRef] [Green Version]
  34. Wu, B.; Yu, B.; Yue, W.; Shu, S.; Tan, W.; Hu, C.; Huang, Y.; Wu, J.; Liu, H. A coxel-based method for automated identification and morphological parameters estimation of individual street trees from mobile laser scanning data. Remote Sens. 2013, 5, 584–611. [Google Scholar] [CrossRef] [Green Version]
  35. Castro-Arvizu, J.; Medina, D.; Ziebold, R.; Vilà-Valls, J.; Chaumette, E.; Closas, P. Precision-Aided Partial Ambiguity Resolution Scheme for Instantaneous RTK Positioning. Remote Sens. 2021, 13, 2904. [Google Scholar] [CrossRef]
  36. Nakata, Y.; Hayamizu, M.; Ishiyama, N.; Torita, H. Observation of Diurnal Ground Surface Changes Due to Freeze-Thaw Action by Real-Time Kinematic Unmanned Aerial Vehicle. Remote Sens. 2021, 13, 2167. [Google Scholar] [CrossRef]
  37. Cheng, Q.; Chen, P.; Sun, R.; Wang, J.; Mao, Y.; Ochieng, W. A New Faulty GNSS Measurement Detection and Exclusion Algorithm for Urban Vehicle Positioning. Remote Sens. 2021, 13, 2117. [Google Scholar] [CrossRef]
  38. Barbasiewicz, A.; Widerski, T.; Daliga, K. The analysis of the accuracy of spatial models using photogrammetric software: Agisoft Photoscan and Pix4D. E3S Web Conf. 2018, 26, 00012. [Google Scholar] [CrossRef]
  39. Koguciuk, D.; Chechliński, Ł.; El-Gaaly, T. 3D object recognition with ensemble learning-a study of point cloud-based deep learning models. In Advances in Visual Computing; Springer: Cham, Switzerland, 2019; pp. 100–114. [Google Scholar]
  40. Zhang, Z.; Zhang, L.; Tong, X.; Mathiopoulos, P.T.; Guo, B.; Huang, X.; Wang, Z.; Wang, Y. A Multilevel Point-Cluster-Based Discriminative Feature for ALS Point Cloud Classification. IEEE Trans. Geosci. Remote Sens. 2016, 54, 3309–3321. [Google Scholar] [CrossRef]
  41. Chen, G.; Maggioni, M. Multiscale geometric dictionaries for point-cloud data. In Proceedings of the International Conference on Sampling Theory and Applications, Singapore, 2–6 May 2011; pp. 1–4. [Google Scholar]
  42. Qi, C.R.; Su, H.; Mo, K.; Guibas, L.J. PointNet: Ddeep learning on point sets for 3D classification and segmentation. In Proceedings of the IEEE Conference on Computer Vision and Pattern Recognition, Honolulu, HI, USA, 21–26 July 2017. [Google Scholar]
  43. Qi, C.R.; Yi, L.; Su, H.; Guibas, L.J. PointNet++: Deep hierarchical feature learning on point sets in a metric space. In Proceedings of the 31st Conference on Neural Information Processing Systems (NIPS 2017), Long Beach, CA, USA, 8 December 2017. [Google Scholar]
  44. Choy, C.; Gwak, J.; Savarese, S. 4D Spatio-Temporal ConvNets: Minkowski Convolutional Neural Networks. In Proceedings of the 2019 IEEE/CVF Conference on Computer Vision and Pattern Recognition (CVPR), Beach, CA, USA, 16–20 June 2019; pp. 3070–3079. [Google Scholar]
  45. Lin, Y.; Yan, Z.; Huang, H.; Du, D.; Liu, L.; Cui, S.; Han, X. FPConv: Learning Local Flattening for Point Convolution. In Proceedings of the 2020 IEEE/CVF Conference on Computer Vision and Pattern Recognition (CVPR), Seattle, WA, USA, 13–19 June 2020; pp. 4292–4301. [Google Scholar]
  46. Tumbo, S.D.; Salyani, M.; Whitney, J.D.; Wheaton, T.A.; Miller, W.M. Investigation of laser and ultrasonic ranging sensors for measurements of citrus canopy volume. Appl. Eng. Agric. 2002, 18, 367. [Google Scholar] [CrossRef]
  47. Zaman, Q.-U.; Schumann, A.W. Performance of an Ultrasonic Tree Volume Measurement System in Commercial Citrus Groves. Precis. Agric. 2005, 6, 467–480. [Google Scholar] [CrossRef]
  48. Yan, Z.; Liu, R.; Cheng, L.; Zhou, X.; Ruan, X.; Xiao, Y. A concave hull methodology for calculating the crown volume of Indi-vidual Trees Based on Vehicle-Borne LiDAR Data. Remote Sens. 2019, 11, 623. [Google Scholar] [CrossRef] [Green Version]
  49. Parmehr, E.G.; Amati, M. Individual Tree Canopy Parameters Estimation Using UAV-Based Photogrammetric and LiDAR Point Clouds in an Urban Park. Remote Sens. 2021, 13, 2062. [Google Scholar] [CrossRef]
  50. Aeberli, A.; Johansen, K.; Robson, A.; Lamb, D.; Phinn, S. Detection of Banana Plants Using Multi-Temporal Multispectral UAV Imagery. Remote Sens. 2021, 13, 2123. [Google Scholar] [CrossRef]
  51. Weiss, M.; Jacob, F.; Duveiller, G. Remote sensing for agricultural applications: A meta-review. Remote Sens. Environ. 2020, 236, 111402. [Google Scholar] [CrossRef]
  52. Lim, P.-C.; Rhee, S.; Seo, J.; Kim, J.-I.; Chi, J.; Lee, S.-B.; Kim, T. An Optimal Image–Selection Algorithm for Large-Scale Stereoscopic Mapping of UAV Images. Remote Sens. 2021, 13, 2118. [Google Scholar] [CrossRef]
  53. Lim, P.C.; Seo, J.; Son, J.; Kim, T. Feasibility study for 1:1000 scale map generation from various UAV images. In Proceedings of the International Symposium on Remote Sensing, Taipei, Taiwan, 17–19 April 2019. [Google Scholar]
  54. Rhee, S.; Hwang, Y.; Kim, S. A study on point cloud generation method from UAV image using incremental bundle adjust-ment and stereo image matching technique. Korean J. Remote Sens. 2019, 34, 941–951. [Google Scholar]
  55. Zhou, Y.; Rupnik, E.; Meynard, C.; Thom, C.; Pierrot-Deseilligny, M. Simulation and Analysis of Photogrammetric UAV Im-age Blocks—Influence of Camera Calibration Error. Remote Sens. 2019, 12, 22. [Google Scholar] [CrossRef] [Green Version]
  56. Dai, Y.; Gong, J.; Li, Y.; Feng, Q. Building segmentation and outline extraction from UAV image-derived point clouds by a line growing algorithm. Int. J. Digit. Earth 2017, 10, 1077–1097. [Google Scholar] [CrossRef]
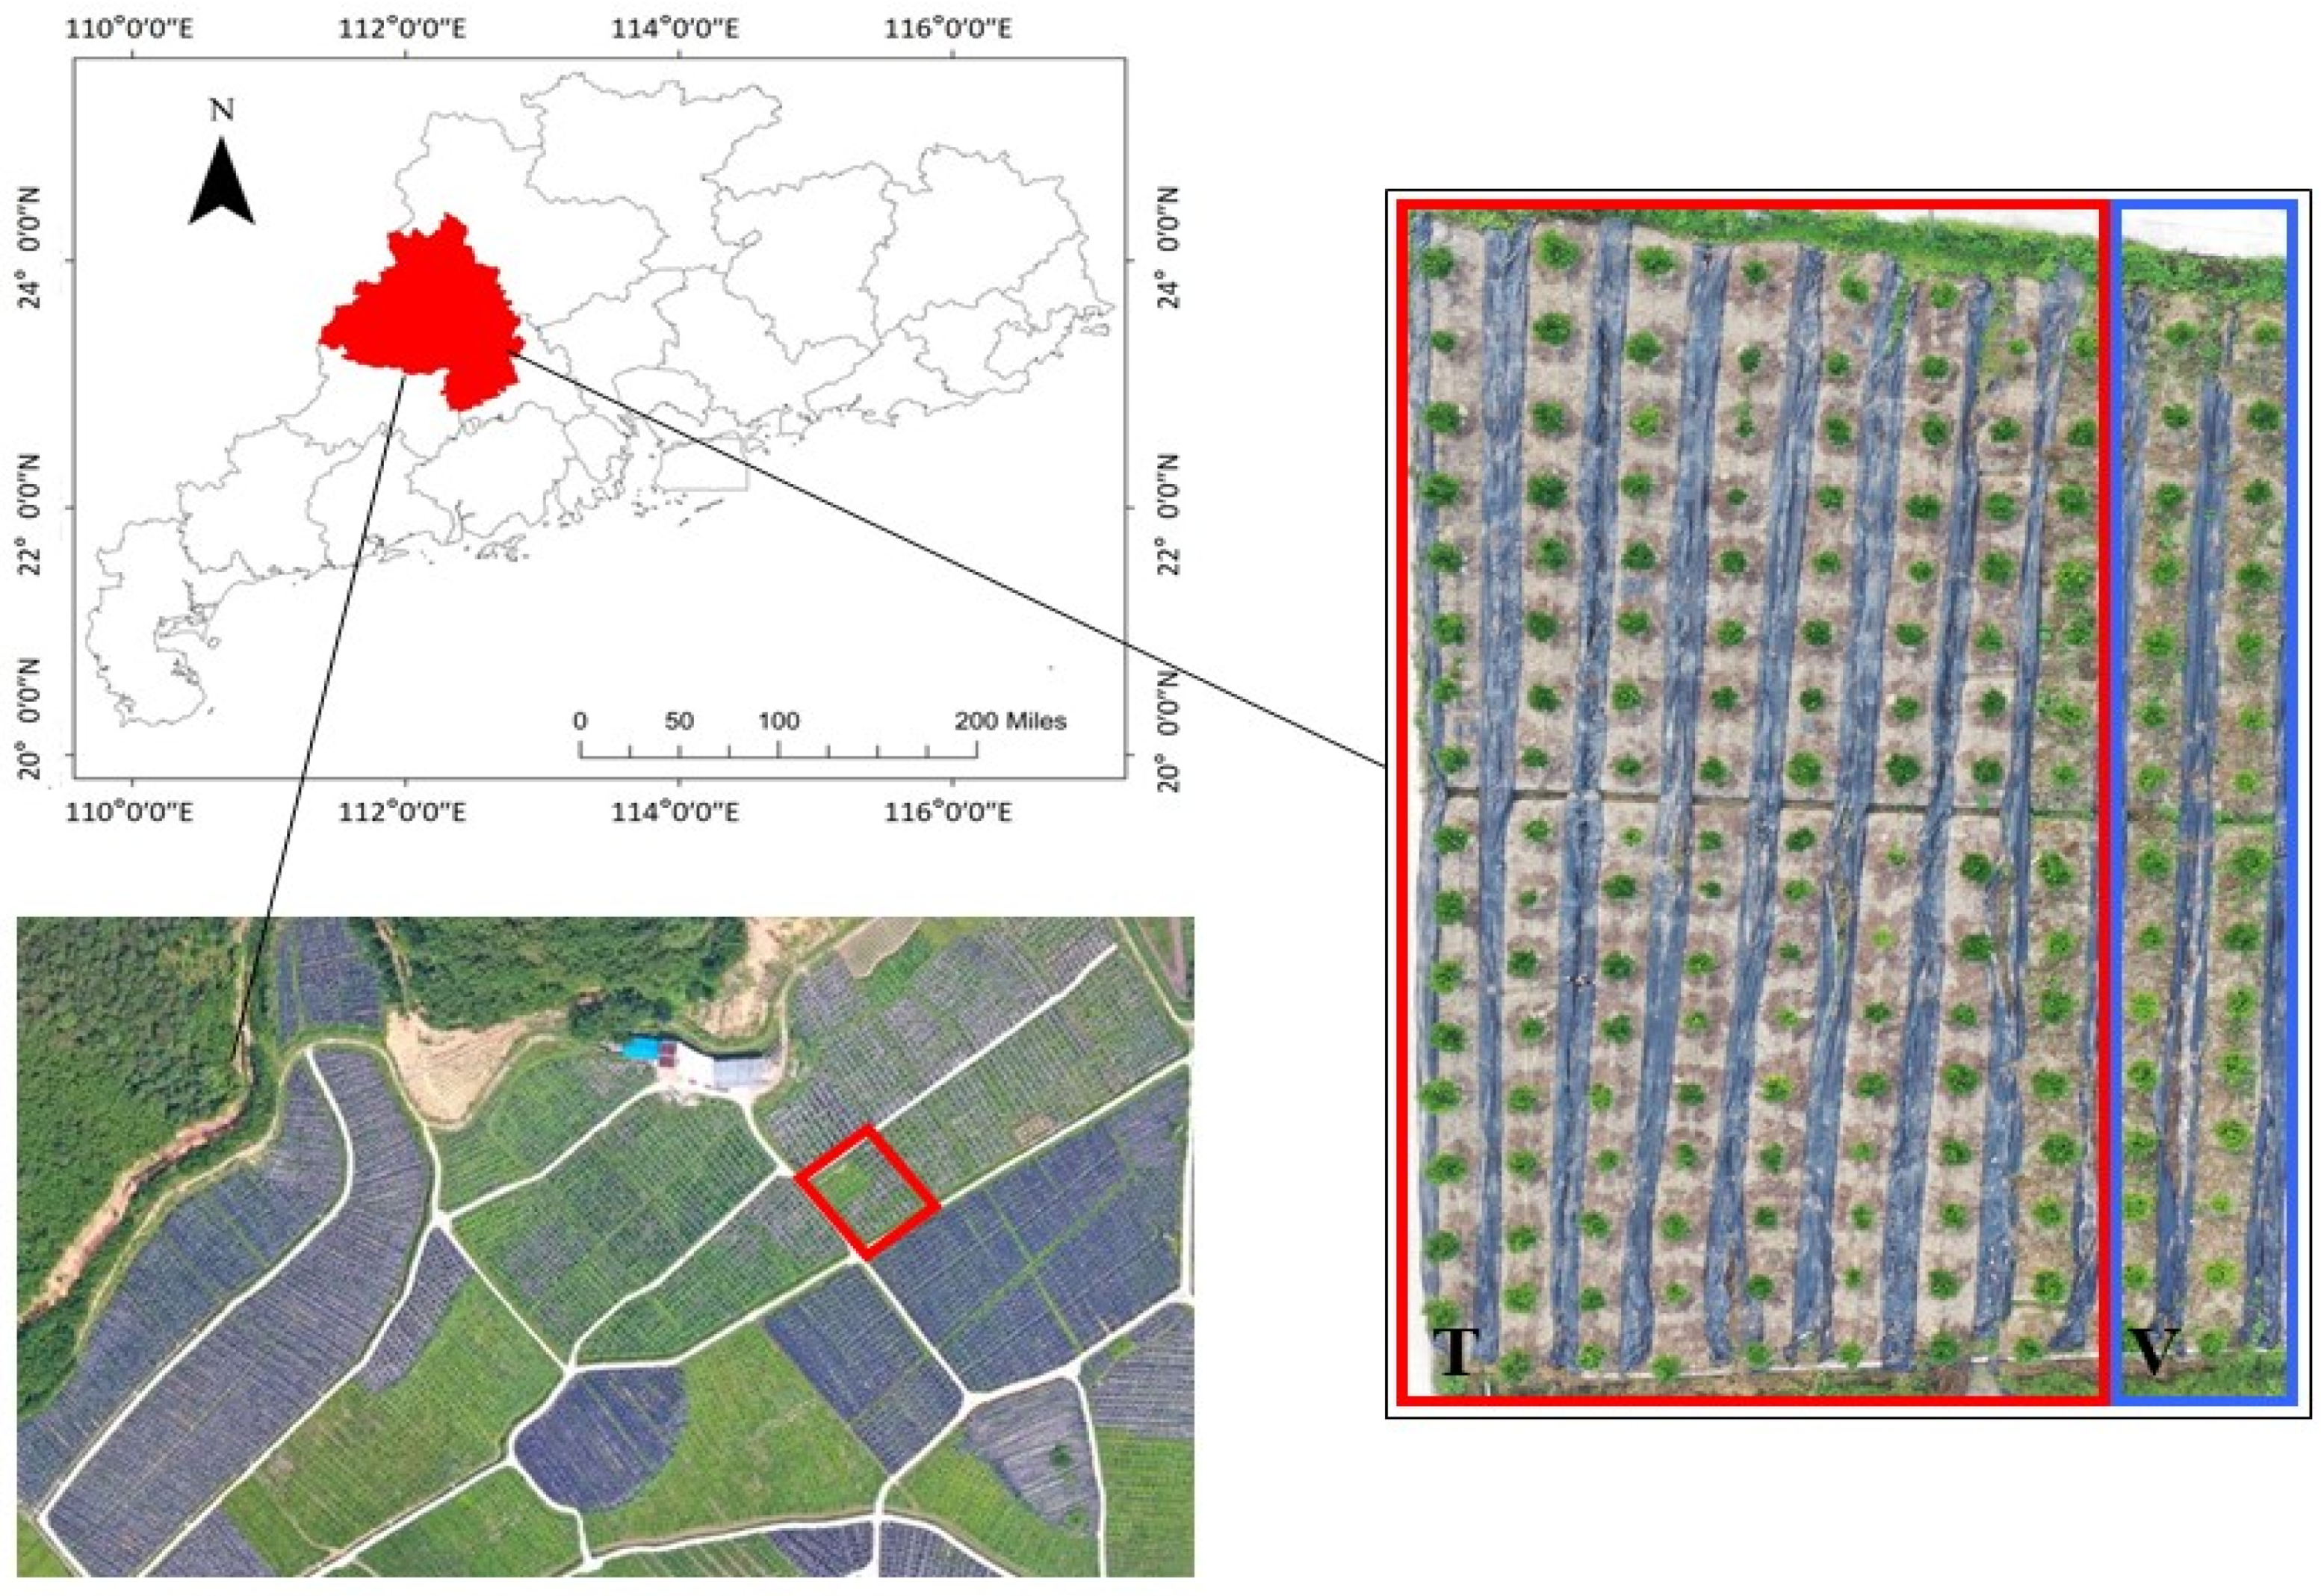
Figure 1. Experimental site.
Remotesensing 13 03437 g001
Figure 2. UAV tilt photogrammetry images acquisition: (a) DJI Phantom 4 RTK UAV; (b) Image acquisition in orchard.
Remotesensing 13 03437 g002
Figure 3. Flow chart of data acquisition.
Remotesensing 13 03437 g003
Figure 4. Point cloud results of the experimental site.
Remotesensing 13 03437 g004
Figure 5. PointNet++ network architecture. Reprinted with permission from ref. [43], 2017, Cornell University.
Remotesensing 13 03437 g005
Figure 6. Overall network architecture of MinkowskiNet.
Remotesensing 13 03437 g006
Figure 7. Network architecture diagram of FPConv. Reprinted with permission from ref. [45], 2020, CVPR 2020.
Remotesensing 13 03437 g007
Figure 8. Schematic diagram of Citrus reticulate Blanco cv. Shatangju tree measurement parameters.
Remotesensing 13 03437 g008
Figure 9. Schematic diagram of convex hull by slices algorithm.
Remotesensing 13 03437 g009
Figure 10. Schematic diagram of (a) voxel-based method and (b) 3D convex hull method.
Remotesensing 13 03437 g010
Figure 11. Visualization of the training process.
Remotesensing 13 03437 g011
Figure 12. Semantic segmentation results for the orchard dataset.
Remotesensing 13 03437 g012
Figure 13. Schematic diagram of the results of three volume algorithms: (a) Convex hull by slices; (b) Voxel-based method; (c) 3D convex hull.
Remotesensing 13 03437 g013
Figure 14. Scatter plot of manual measurements and point cloud data: (a) Height acquired from point clouds vs. manual height measurement; (b) Canopy width acquired from point clouds vs. manual canopy width measurement.
Remotesensing 13 03437 g014
Figure 15. Scatter plot of volume calculated using three volume algorithms vs. manual calculation: (a) Convex hull by slices; (b) Voxel-based method; (c) 3D convex hull.
Remotesensing 13 03437 g015
Table 1. Mean Intersection over Union (mIoU) (%) of the segmentation results.
MethodmIoUSegmentation Accuracy
TreeGround
PointNet++53.7227.7879.67
MinkowskiNet94.5790.8298.32
FPConv81.9268.6895.16
Table 2. Canopy volumes obtained using the four calculation methods.
Tree NumberHeight Ht (m)Diameter D (m)Volume (m3)
M1M2M3M4
11.831.612.292.461.292.05
21.511.090.920.960.750.75
31.851.712.632.711.562.21
42.051.783.663.521.952.91
51.901.602.612.591.662.25
61.791.723.283.161.852.55
71.831.372.011.711.241.45
81.811.612.752.671.772.42
92.001.642.603.152.052.46
101.951.713.723.462.373.06
111.771.662.862.851.982.26
121.731.632.112.011.912.09
132.051.944.284.642.903.98
142.101.773.284.082.533.57
151.861.512.332.661.812.28
161.951.683.043.802.283.15
172.101.723.073.241.753.19
181.901.712.633.131.632.78
191.951.492.402.701.592.41
202.201.733.053.612.203.18
211.981.662.682.711.642.38
221.871.482.292.351.511.96
231.901.602.472.691.602.28
241.461.270.881.251.051.18
251.531.461.901.741.211.70
261.110.920.570.590.400.48
271.851.522.242.321.592.17
281.391.190.991.110.791.03
291.601.441.562.021.241.71
301.731.401.752.061.531.91
311.791.421.692.021.351.71
321.931.462.052.251.662.21
Max2.201.944.284.642.903.98
Min1.110.920.880.590.400.48
Mean1.781.552.392.571.642.25
S.D.0.240.210.850.910.520.77
Definitions: M1, Manual measurement; M2, Convex hull by slices; M3, Voxel-based method; M4, 3D convex hull; S.D., Standard deviation.
Publisher’s Note: MDPI stays neutral with regard to jurisdictional claims in published maps and institutional affiliations.