Technical Note

EddyGraph: The Tracking of Mesoscale Eddy Splitting and Merging Events in the Northwest Pacific Ocean

1
Department of Marine Technology, Institute for Advanced Ocean Study, Ocean University of China, No.238 Songling Road, Qingdao 266100, China
2
Qingdao National Laboratory for Marine Science and Technology, No.1 Wenhai Road, Qingdao 266200, China
*
Author to whom correspondence should be addressed.
Remote Sens. 2021, 13(17), 3435; https://doi.org/10.3390/rs13173435
Submission received: 22 June 2021 / Revised: 21 August 2021 / Accepted: 24 August 2021 / Published: 30 August 2021

Abstract

:
This paper proposes an algorithm named EddyGraph for tracking mesoscale eddy splitting and merging events. Twenty-seven years (January 1993–December 2019) of sea level anomaly (SLA) data are analyzed in the Northwest Pacific Ocean (105°E–165°W, 0°N–60°N). First, we propose a multilevel eddy identification method based on SLA to obtain an eddytree data set, representing a spatial topological tree structure of closed SLA contours with mononuclear eddies, multicore eddies and eddy seeds as the leaf nodes and eddygroups (reflecting the spatial topological relationship among eddies) as the intermediate nodes. The EddyGraph tracking algorithm is applied to the eddytree data set, which results in eddy-directed acyclic graphs (Eddy-DAGs). Only eddies contained within a common eddygroup are tracked as sources in merging events or sinks in splitting events. Furthermore, we extract typical splitting and merging events and composite the sea surface temperature anomalies (SSTAs) inside the eddygroups and eddies during these events. The results confirm that merging eddies in the same eddygroup degenerate into a single eddy and that a splitting eddy evolves into eddies within the same parent eddygroup. Moreover, we match a merging event of cyclonic eddies with in situ data of both drifters and loopers in Lagrangian trajectories. Finally, we present EddyGraph, a data set of mesoscale eddy tracking in the Northwest Pacific Ocean (105°E–165°W, 0°N–60°N).

Graphical Abstract

1. Introduction

Mesoscale eddies play important roles in the exchange of energy and the mass transport of heat, nutrients, salt and other seawater chemical elements throughout the ocean [1,2,3,4,5,6,7,8,9,10,11,12]. These types of eddies, in which fluid parcels can be trapped and transported, are compact rotating water bodies that are extensively present in the global ocean and propagate through complex and changeable ocean environments [7,10]. Automated algorithms for identifying and linearly tracking mesoscale eddies in which survival and extinction are the only outcomes of eddy development have essentially reached maturity. There are three main kinds of eddy identification methods: (1) physical parameter-based methods [12,13,14,15]; (2) eddy geometry-based methods [16,17,18,19,20], including the eddy-induced sea level anomaly (SLA)-based method; and (3) hybrid, physical and geometrical detection methods [21,22,23,24,25]. Another method based on Lagrangian coherent structure (LCS) was proposed for eddies in turbulent flows [26]. Common eddy tracking methods include the similarity method and distance limiting method. Penven et al. [21] first used the Euclidean distance of nondimensional eddy properties to match the similarities between eddies in two successive time steps; this method and its improved version have been widely used to track mesoscale eddies globally [17,18,19,27,28]. Alternatively, the distance limiting method tracks the state of an eddy in the next time step by finding the closest eddy center or by using loose limitations to constrain the search results [15,29].
Moreover, eddies are not always independent bodies of water. Separate eddies may merge into a single new eddy, and an eddy may split into multiple eddies in specific marine environments [30,31]. Hence, in addition to survival and extinction, the merging and splitting of eddies should be included in the time-dependent behavior of ocean eddies. Nevertheless, at present, few automated algorithms track eddies that split and merge. Furthermore, no corresponding data set of eddy trajectories that considers splitting and merging behaviors has been published, and no data validation has been presented. Existing studies [32,33] on algorithms based on SLA that can automatically track splitting and merging eddies postulated that eddies always exhibit one local sea level anomaly (SLA) maxima/minima during splitting and merging events, indicating that each local SLA maxima/minima point of a multicore eddy structure corresponds to one eddy. Consequently, the main problem in these studies [32,33] is how to relate the multicore eddy structures to the eddies during splitting and merging events. Li et al. [32] proposed the Genealogical Evolution Model (GEM), a dynamic tracking model in which a watershed strategy is adopted to split a multicore eddy into multiple eddies with one local SLA maximum/minimum. Cui et al. [33] presented a method to define multicore structures in eddy–eddy interactions and took them as tracking objects for eddy splitting and merging events. This multicore structure reflected the spatial connection of local SLA maxima/minima points during splitting and merging events as the overall structure, but the local structure of each eddy was not determined. However, the above methods [32,33] could not clearly establish the spatial topological connection of interrelated eddies during splitting and merging events. Therefore, it remains difficult to conduct normalized verification experiments, which are standard operations for validating the eddy-induced heat transport [1,8,9], to determine how multiple eddies merge into a new eddy and how a single eddy splits into different eddies. Another automated method, the Angular Momentum Eddy Detection and Tracking Algorithm (AMEDA), based on velocity fields was also proposed [23]. Their method detected eddies that split and merge by the shared velocity field contour presenting the eddy–eddy interaction. However, no normalized verification experiments were conducted in their research [23].
This study makes the following four contributions. (1) We propose an SLA-based multilevel eddy identification method to establish the eddytree data set, a spatial topological tree structure of closed SLA contours with eddies as the leaf nodes and eddygroups as the intermediate nodes. The spatial topological relationships among eddies (mononuclear eddies, multicore eddies and eddy seeds) can be constructed in the eddytree data set as eddygroups. (2) We propose the EddyGraph tracking method for eddy splitting and merging events. Only eddies within a common eddygroup can be tracked as the sources in merging events or the sinks in splitting events. Furthermore, the eddies during the study period are tracked in time-oriented graphs that include three trajectory levels: segment, branch and eddy-directed acyclic graph (Eddy-DAG). (3) We verify the authenticity of our tracking data set with sea surface temperature anomaly (SSTA) remote sensing images and in situ data of drifters and looper trajectories. The results confirm that merging eddies in the same eddygroup degenerate into a single eddy and that a splitting eddy evolves into eddies within the same eddygroup. (4) We present EddyGraph, a data set of mesoscale eddy trajectories in the Northwest Pacific (105°E–165°W, 0°N–60°N), and analyze the geographical distribution of typical eddy splitting and merging events.
The remainder of this paper is organized as follows: Section 2 introduces the data adopted and the methods for identifying and tracking eddies. Section 3 describes the results, including statistics of the tracking data set and extraction of typical events. Section 4 describes the validation with remote sensing observations and in situ data. Finally, the discussions and conclusions are presented in Section 5.

2. Data and Methods

2.1. Data

This paper applies the EddyGraph algorithm to the Northwest Pacific (105°E–165°W, 0°N–60°N) to analyze the trajectories of eddy splitting and merging events. In this study, daily SLA images with a spatial resolution of 0.25° × 0.25° from January 1993 to December 2019 derived from all-sat-merged delayed altimeter products provided by the Copernicus Marine Service (CMEMS) are used to identify eddies (https://resources.marine.copernicus.eu/) (accessed on 1 October 2020). Daily SSTA maps (also with a spatial resolution of 0.25° × 0.25°) from January 1996 to December 2019 provided by the National Oceanic and Atmospheric Administration (NOAA)-Advanced Very High-Resolution Radiometer (AVHRR) are adopted for a composite analysis for validation (https://www.ncei.noaa.gov/data/sea-surface-temperature-optimum-interpolation/) (accessed on 7 March 2021). In addition, data (https://www.aoml.noaa.gov/phod/gdp/loopers.php) (accessed on 29 April 2021) of drifters and of looper trajectories identified from the Global Drifter Program data set [34] are used to match the splitting and merging events detected by our tracking algorithm, where the looper trajectories identified by an automated algorithm are considered loopers in Lagrangian trajectories, which complete at least two drifter orbits [34].

2.2. Eddytree: Eddy Identification with Spatial Topological Relationship

In this paper, mononuclear eddies, multicore eddies and eddy seeds are considered eddy signals in splitting and merging events. For eddy splitting and merging tracking, we propose a multilevel mesoscale eddy identification method based on SLA. In our method, the whole study area in a daily SLA image can be detected as the spatial topological tree structure of closed SLA contours with eddies as the leaf nodes and eddygroups related to eddy spatial topology as the intermediate nodes (Figure 1).

2.2.1. Eddytree

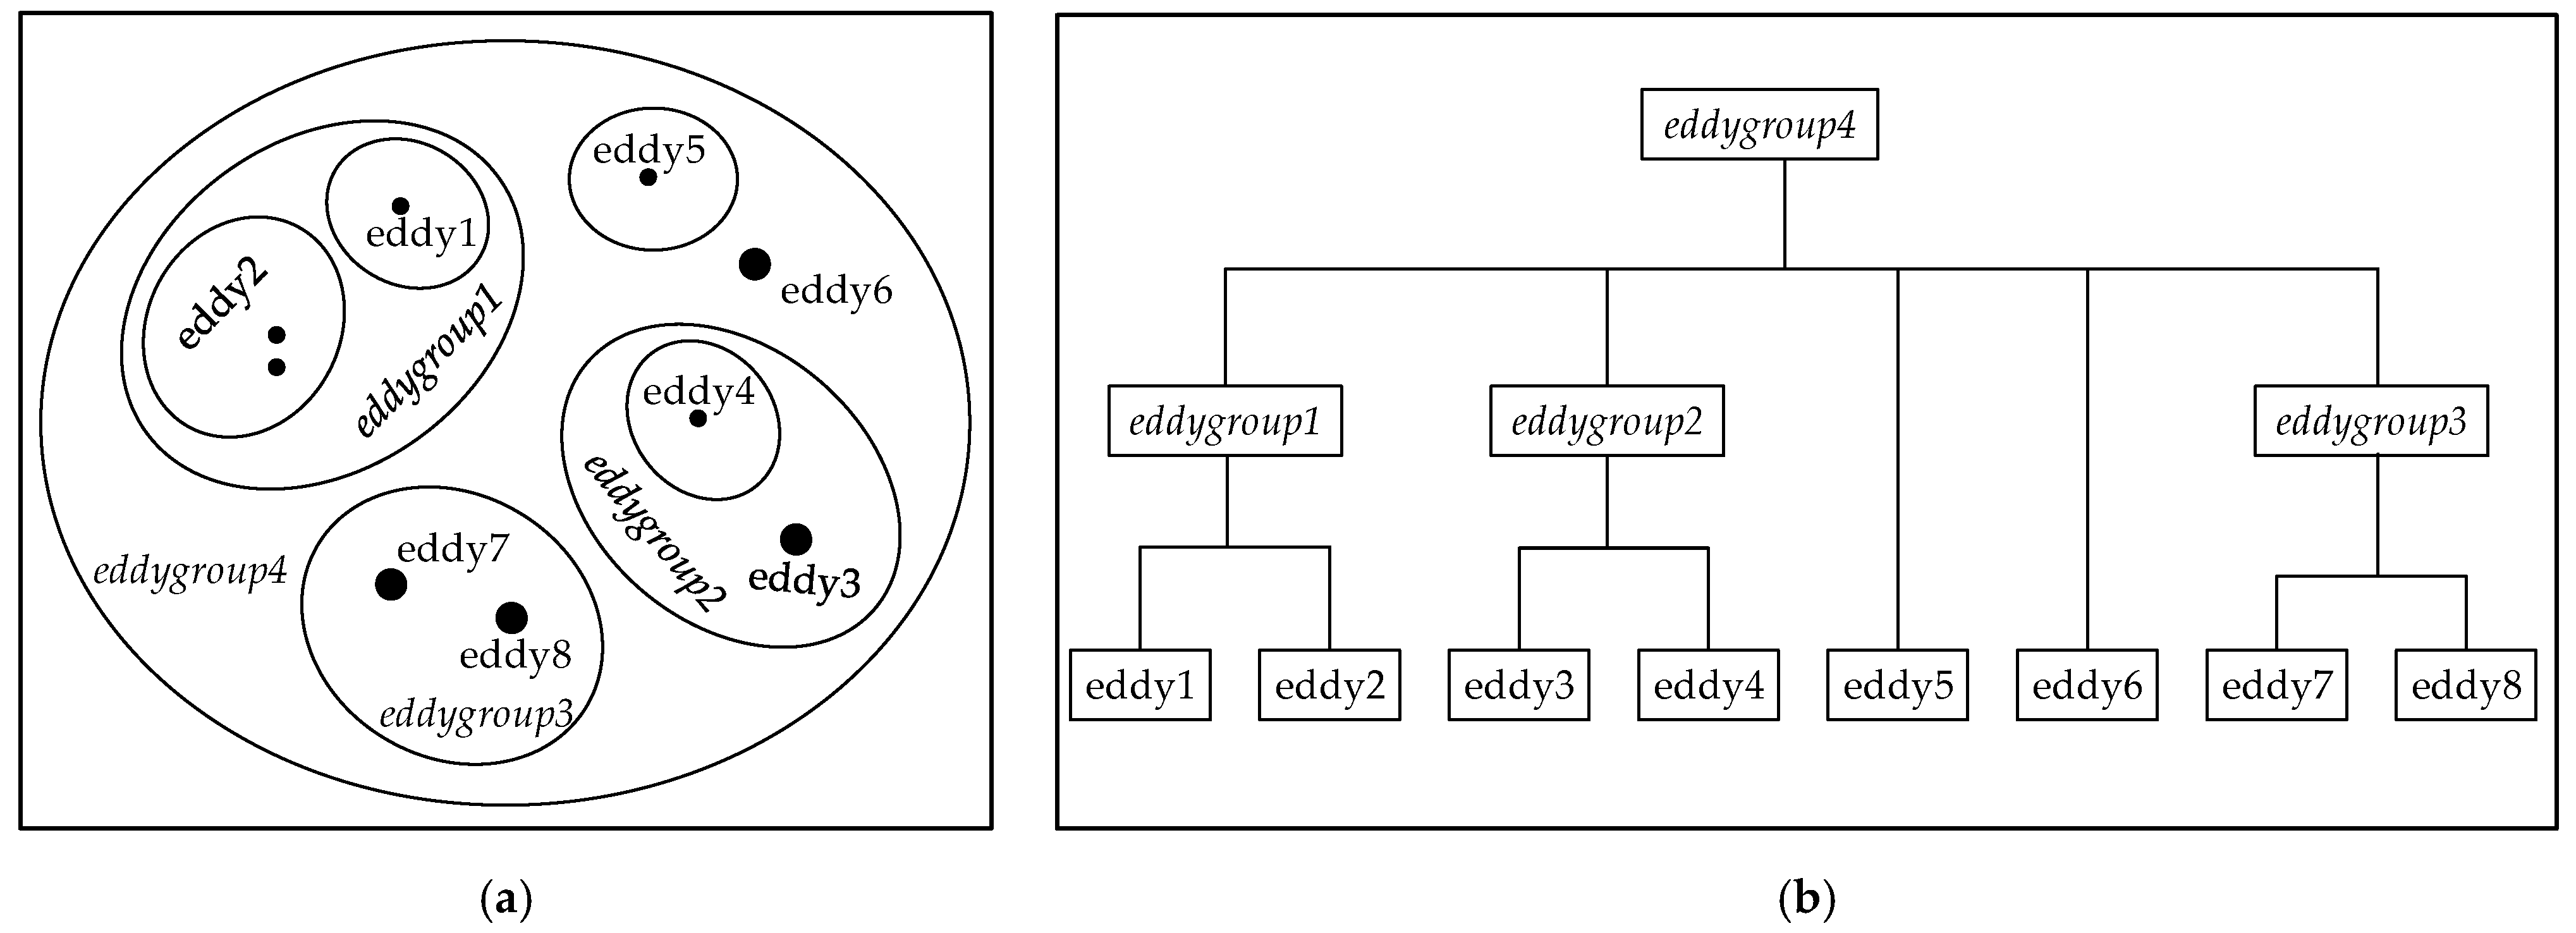
Figure 2 shows the structure of an eddytree, a spatial topological tree of closed SLA contours with eddies as the leaf nodes and eddygroups as the intermediate nodes. Eddies and eddygroups with the same parents are siblings. The leaf node layer of the eddytree in Figure 2 consists of mononuclear eddies (eddy1, eddy4 and eddy5), multicore eddies (eddy2) and eddy seeds (eddy3, eddy6, eddy7 and eddy8).

2.2.2. Eddygroup

As the intermediate nodes of eddytrees, eddygroups are the closed SLA contours related to eddy spatial topology, which means eddygroups could contain eddies or eddygroups to reflect the spatial topological relationship among eddies.
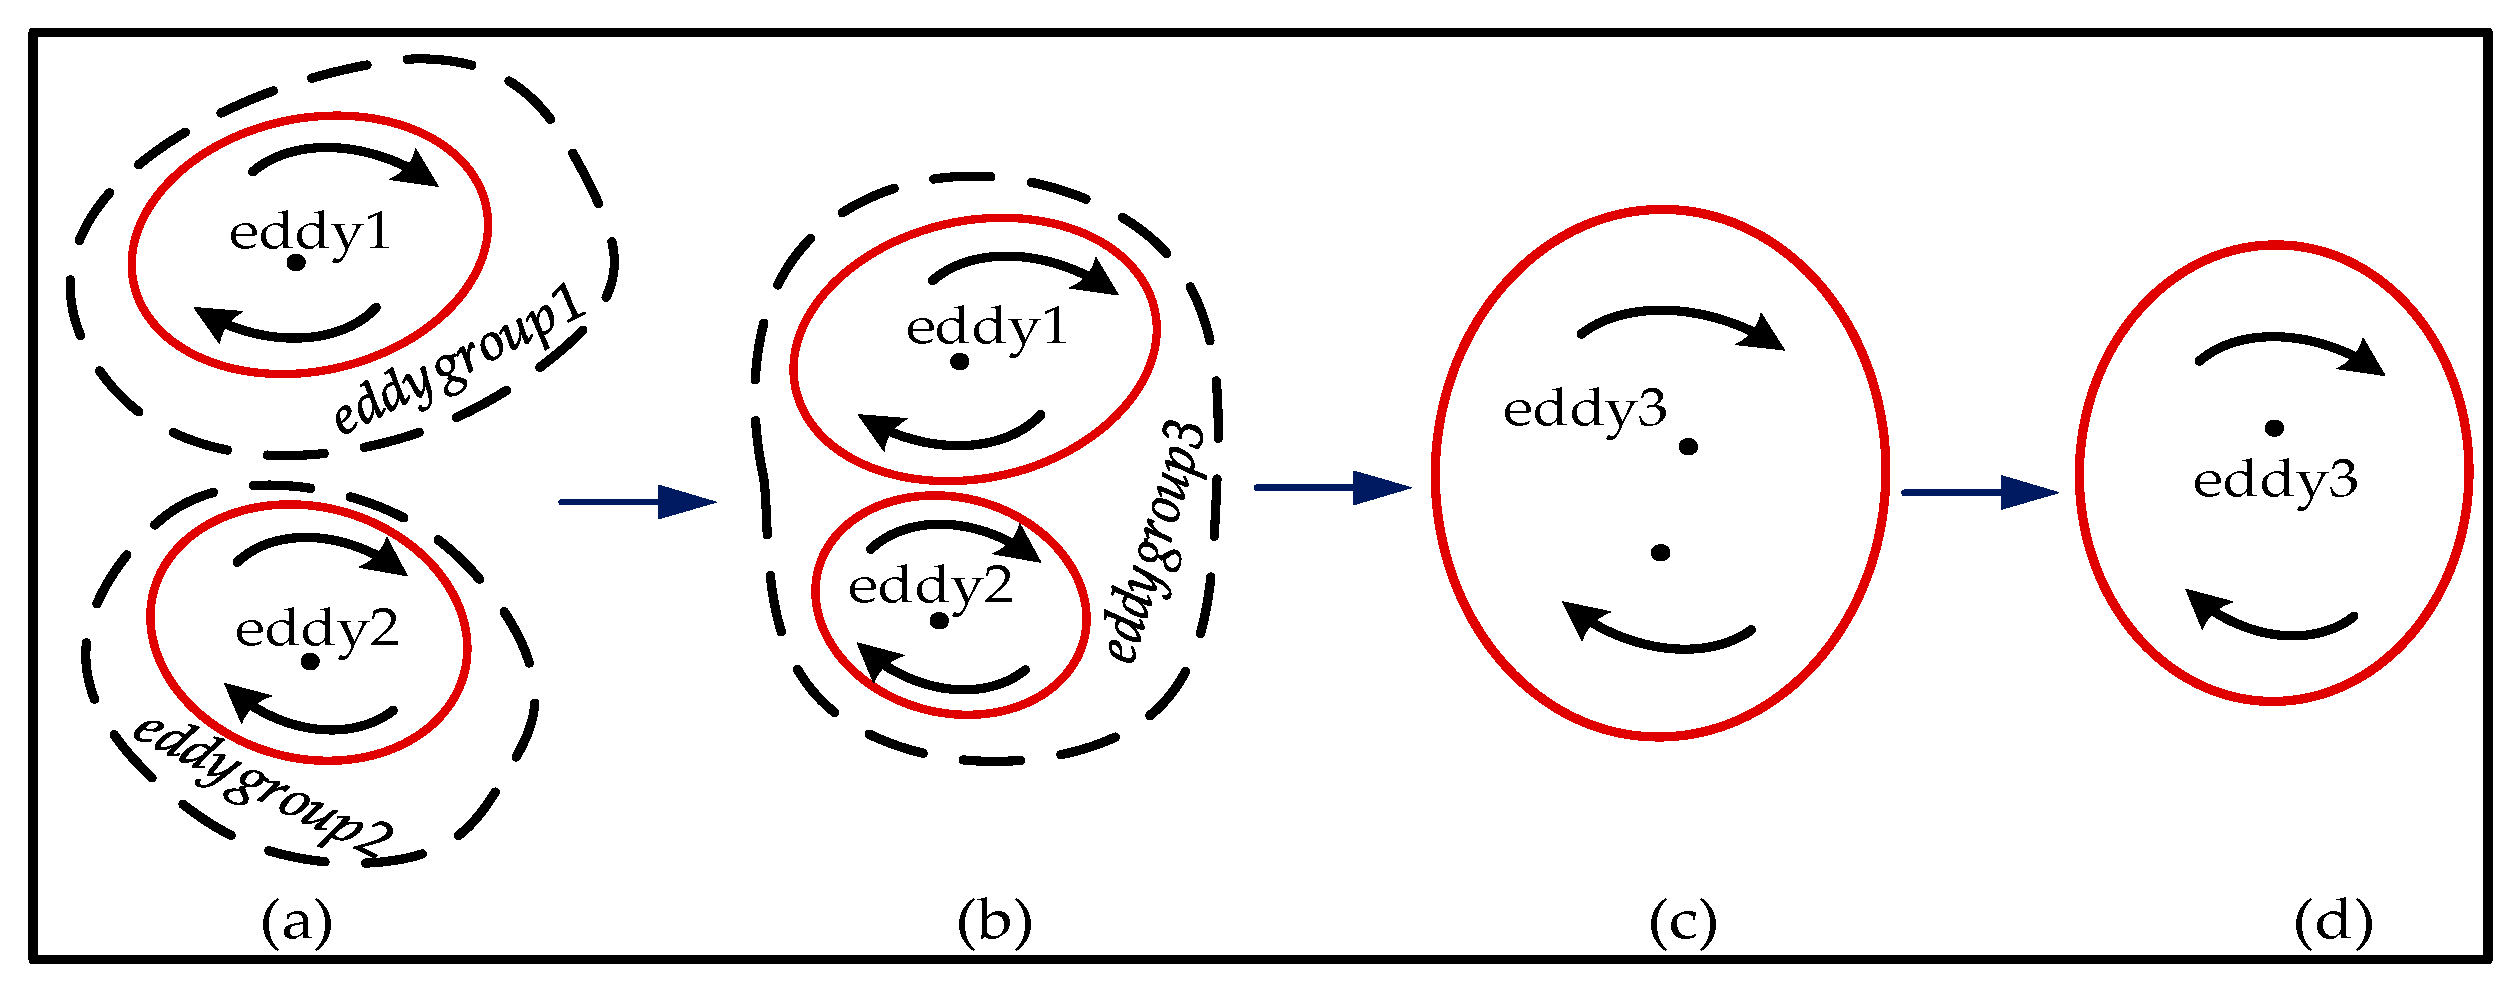
An eddy is a compact fluid structure in the ocean. Consequently, splitting or merging events cannot occur in a single moment; rather, these processes often span more than one day [35,36], which allows us to identify and track eddy splitting and merging events from satellite altimeter measurements with a temporal resolution of one day. Ocean eddies that split and merge aggregate within the same closed SLA contour and form an eddygroup, which is actually a closed fluid structure for the geostrophic relationships between the geostrophic velocity anomaly components (u, v) and SLA [12]. The eddies in the same eddygroup are components (i.e., local fluid structures) of the whole fluid structure of the eddygroup. When eddies of the same polarity encounter one another within an eddygroup, they can interact with each other and eventually merge into a new eddy due to the reverse-direction contact current between them (Figure 3). Taking a merging event as an example, two interacting eddies form a closed fluid structure, namely a new eddygroup (Figure 3). Moreover, the eddies in the process of merging change gradually [35,36], which means they should be in a common eddygroup before merging completely (Figure 3). On this basis, it is easy to understand that the eddies generated from the splitting of an eddy should be close to each other and are contained within the same eddygroup after splitting completely. Therefore, only eddies contained within a common eddygroup can be tracked as the sources of merging or the sinks of splitting in our tracking algorithm.

2.2.3. Eddy Identification Criteria

(i)
Mononuclear eddy
The boundaries of mononuclear eddies should satisfy criteria similar to that used in [19,20,28]:
(1)
Only one local SLA maxima/minima point is contained.
(2)
There are I pixels (0.25° × 0.25°), where 4 ≤ I < ≤ 2000.
(3)
The amplitude A ≥ 0.25 cm, where A = |h1 − h0|, h1 is the SLA value at the local maxima/minima point in the eddy and h0 is the SLA value on the outermost closed SLA contour that defines the eddy perimeter.
(ii)
Multicore eddy
The boundaries of multicore eddies should satisfy the following criteria:
(1)
Multiple local SLA maxima/minima points are contained.
(2)
Multicore eddies are independent of mononuclear eddies: multicore eddies do not contain any mononuclear eddies, which means that any local maxima/minima point within a multicore eddy cannot be identified as a mononuclear eddy.
(3)
The amplitude A ≥ 0.25 cm, where A =|hmh0|, hm is the SLA value at the local maxima/minima point with the largest A among all the local maxima/minima points in the eddy and h0 is the SLA value on the outermost closed SLA contour that defines the eddy perimeter.
(iii)
Eddy seed
Eddy seeds are local maxima/minima points that are not the cores of either mononuclear eddies or multicore eddies. An eddy may disappear when the signal of the eddy core is too weak to be spotted as an eddy on the SLA map [18]. Meanwhile, the noise and/or the spatiotemporal heterogeneity of the altimetric tracks could generate a temporary distortion of the shapes or could introduce a lack of detection of these eddies [23,25]. Consequently, eddy seeds can be not only manifestations of eddies during splitting and merging events but also weakened eddy signals to reduce eddy disappearance and trajectory discontinuities.

2.3. EddyGraph: Eddy Splitting and Merging Tracking

This paper regards the eddies during the study period as complex time-oriented graphs consisting of three trajectory levels: segment, branch and Eddy-DAG.

2.3.1. Criteria

(i)
Segment
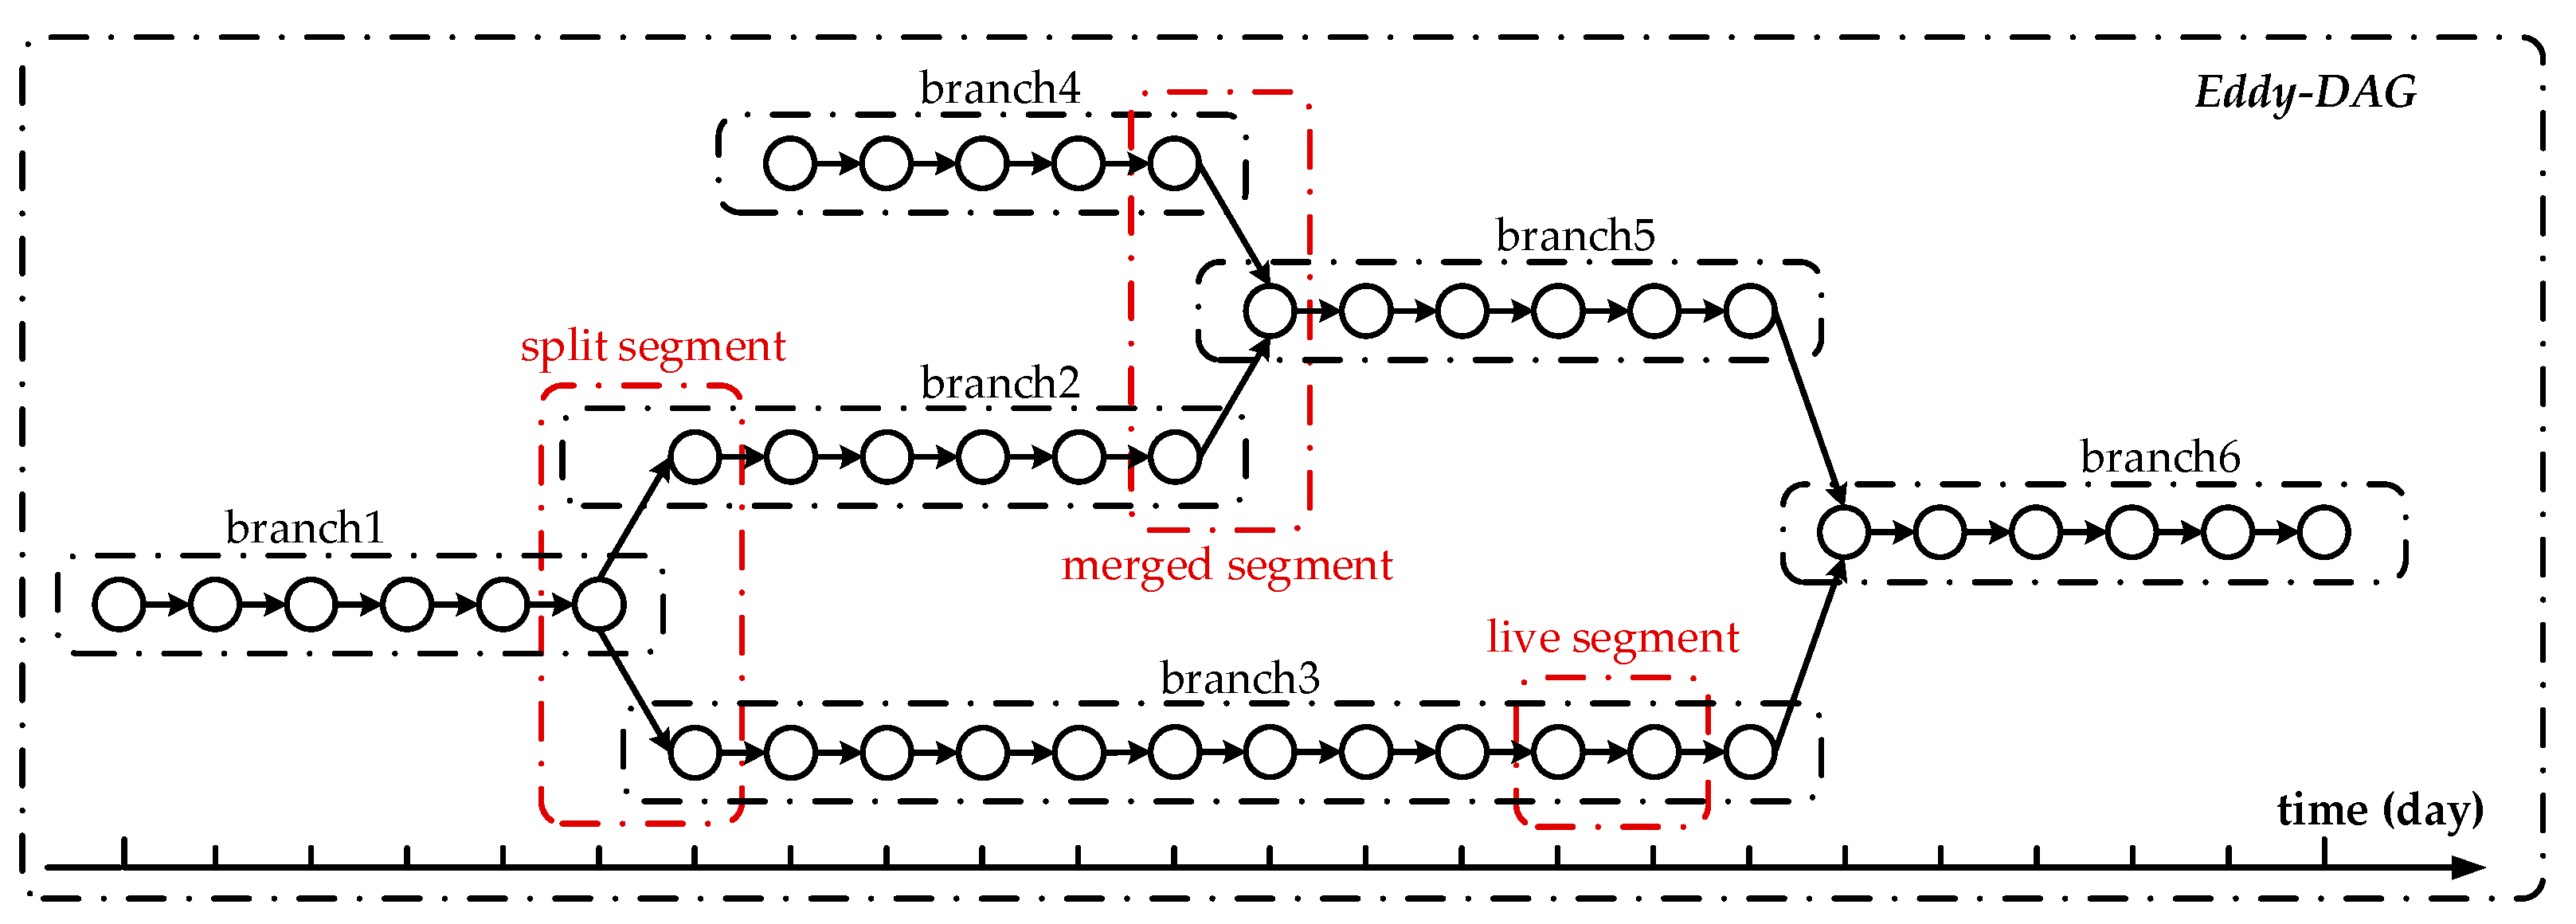
As the basic unit in the eddy space–time graph, a segment is the relationship (including live, dead, split and merge) between eddies in adjacent time steps. As shown in Figure 4, segments are classified into four types, including linear segments (live segments and dead segments) and nonlinear segments (split segments and merged segments).
(ii)
Branch
A branch is a time series of live segments (Figure 5), which is actually an eddy with a lifetime of N days.
(iii)
Eddy-DAG
The structure of an Eddy-DAG is shown in Figure 5. Splitting and merging branches (isolated branches) form a nonlinear Eddy-DAG (a linear Eddy-DAG) with an energy cascade, in which the energy of eddies is transferred [12,31]. In addition, a splitting or merging event can be regarded as a combination of source branch(es) and sink branch(es). Because a branch is an eddy with a lifetime of N days, the eddy may die after surviving for N days, such as branch6, or it may correspond to splitting or merging events. For example, branch2 is not only one source branch of a merging event but also, in the reverse sense, the sink branch of a splitting event.

2.3.2. Tracking for Eddy Splitting and Merging

(i)
Segment
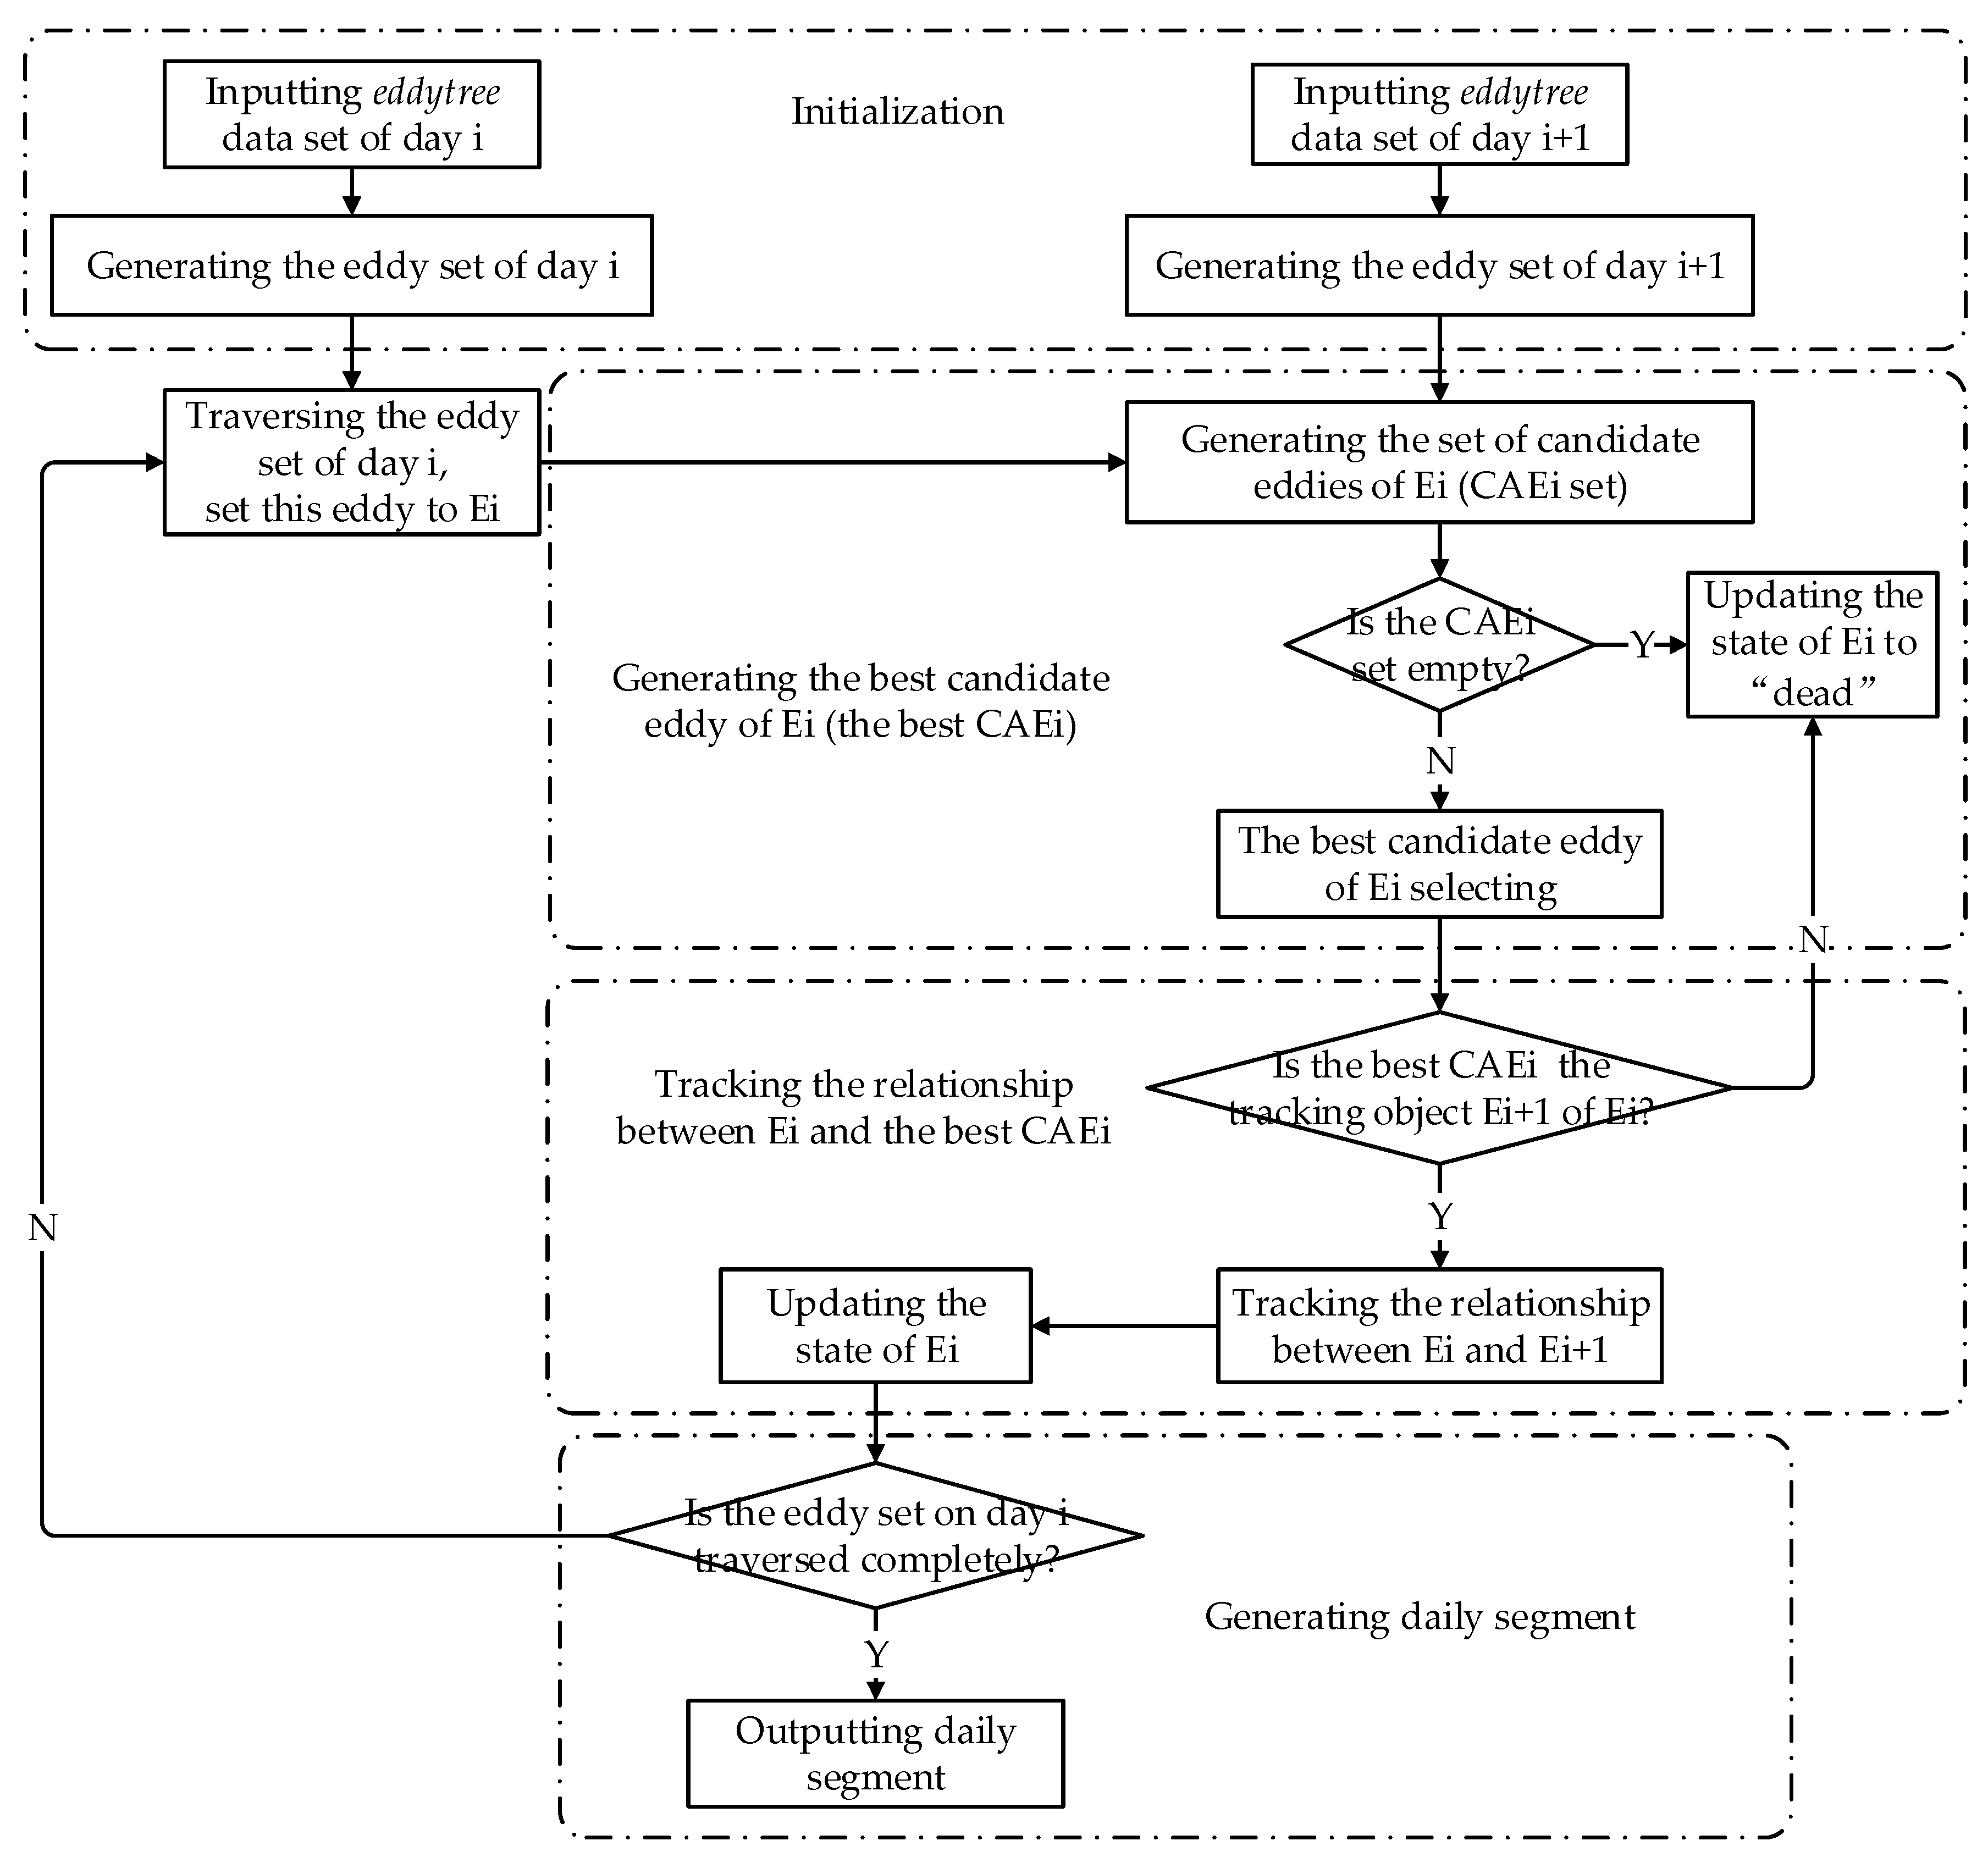
Figure 6 shows a flowchart depicting the tracking workflow for daily segments in detail.
(1)
Initialization: First, the eddy sets for day i and day i + 1 are generated from the eddytree data set. Then, the eddy set on day i will be traversed (set this eddy to Ei).
(2)
Generating the best candidate eddy of Ei (the best CAEi): If Ei is not dead on day i + 1, the tracking object Ei + 1 of Ei should be within the search circle with a radius of 0.5° [27] and the eddy core of Ei as the center, based on which the set of candidate eddies of Ei (the CAEi set) is retrieved from the eddy set of day i + 1. If the CAEi set is empty, Ei is dead on day i + 1. If the CAEi set is a nonempty set, the best CAEi is selected based on the largest overlapping area principle and the nearest principle. When one of the best CAEi and Ei is an eddy seed and the other is a multicore eddy/mononuclear eddy, the best CAEi is the tracking object Ei + 1 of Ei only if eddy seed is within in the boundary of a multicore eddy/mononuclear eddy. For the other classification of the best CAEi and Ei, the best CAEi is the tracking object Ei + 1 of Ei.
(3)
Tracking the relationship between Ei and the best CAEi: If the best CAEi is not the tracking object Ei + 1 of Ei, Ei is dead on day i + 1. Otherwise, based on the common eddygroup, the splitting and merging relationships between Ei and Ei + 1 are tracked by the similarity method with the area overlap ratio as the similarity parameter [31]:
r 1 = S 12 / S 1
r 2 = S 12 / S 2
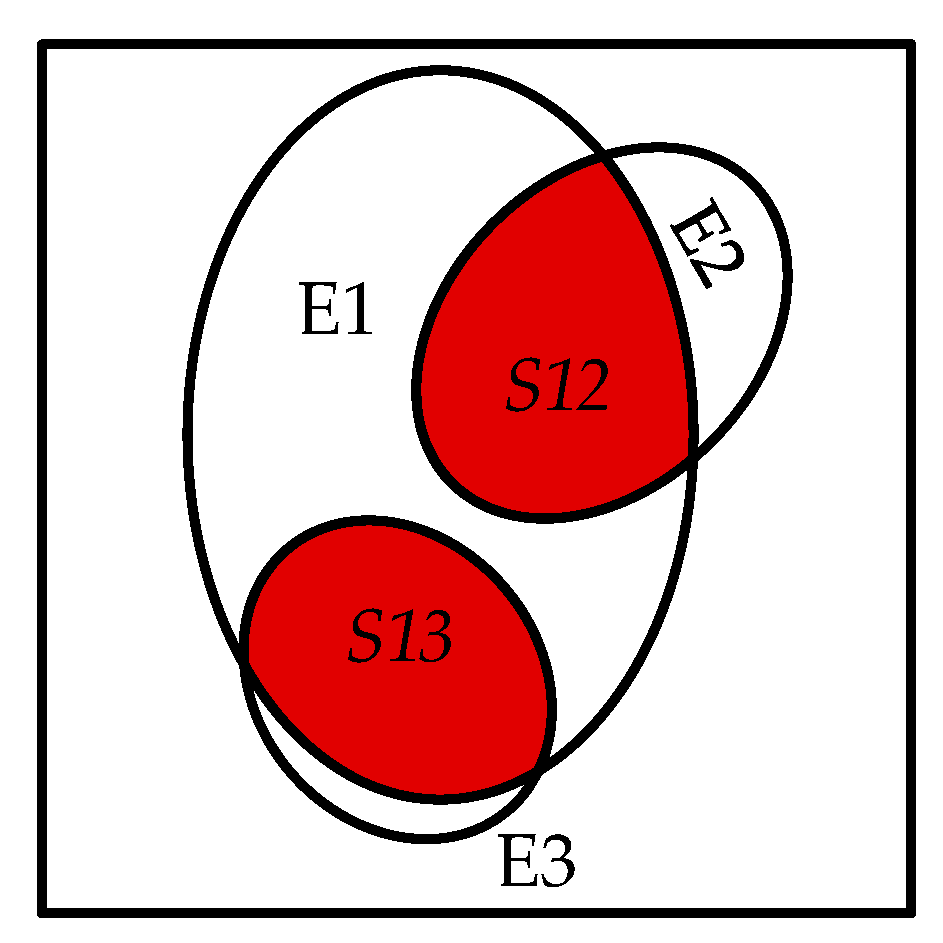
where S1 is the area of eddy E1 and S2 is the area of eddy E2. Moreover, S12 is the area of overlap between E1 and E2. The area overlap ratio of eddy E1 with E2 can be represented by r1, whereas the area overlap ratio of eddy E2 with E1 is r2. E2 is the part from E1 when r2 ≥ 2/3 (Figure 7) [24]. (On the contrary, E1 is the part from E2 when r1 ≥ 2/3. In this paper, we take r2 ≥ 2/3 as an example.) In this study, r2 should be no less than 2/3 when eddy E2 is split from eddy E1. Similarly, r3 should also be no less than 2/3 when eddy E3 merges into eddy E1 (Figure 7). If no splitting or merging occurs between them, Ei + 1 is alive from Ei. Figure 4a,c,d show the possible relationships between Ei and Ei + 1. A sink eddy Ei + 1 generated from splitting is either an eddy seed within the boundary of Ei or a mononuclear eddy/multicore eddy with its area overlap ratio with Ei being no less than 2/3 and must be in the common eddygroup with its sibling eddy (Figure 4c). A source eddy Ei merging into Ei + 1 is either a mononuclear eddy/multicore eddy with its area overlap ratio with Ei + 1 being no less than 2/3 or an eddy seed within the boundary of Ei + 1 and must be in the common eddygroup with its sibling eddy (Figure 4d). Ei + 1 with no splitting or merging relationship with Ei is alive from Ei (Figure 4a).
(4)
Generating daily segment: Finally, when the traversal of the eddy set of day i terminates, the process of tracking the segments for the eddies on day i is finished.
(ii)
Branch
Live segments are continuously added to the branch in chronological order until a split segment, merged segment or dead segment appears (Figure 8).
(iii)
Eddy-DAG
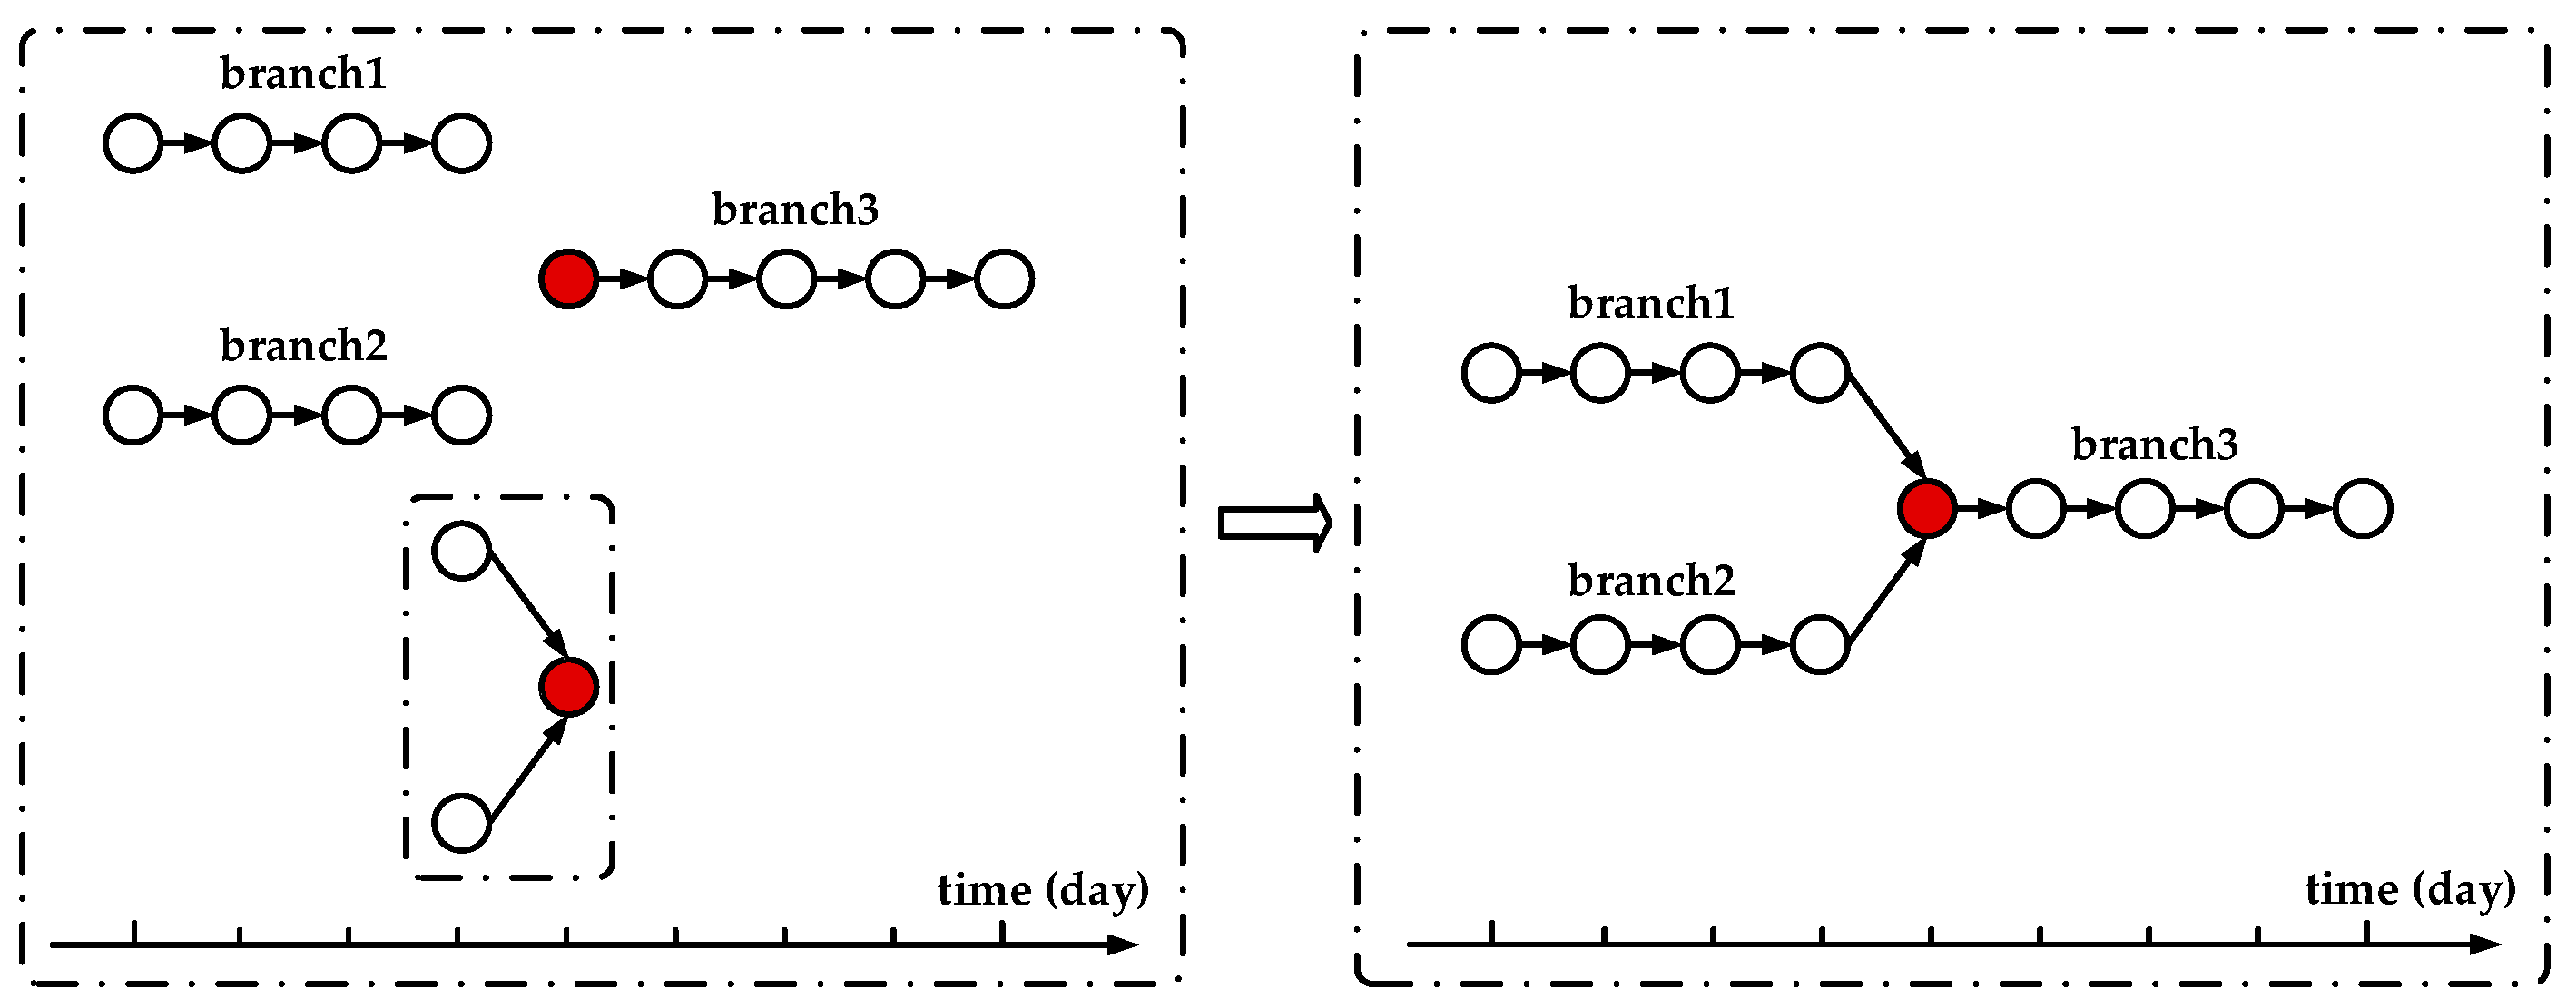
Nonlinear Eddy-DAGs are tracked by establishing the splitting and merging relationships of branches. Specifically, the splitting and merging relationships between branches are established by the segment, taking the eddy(eddies) on the first day of the life(s) of sink branch(es) as the sink(s) and the eddy(eddies) on the last day of the life(s) of source branch(es) as the source(s). Figure 9 reveals the details of constructing a nonlinear Eddy-DAG.

3. Results

3.1. Statistics of the Tracking Data Set

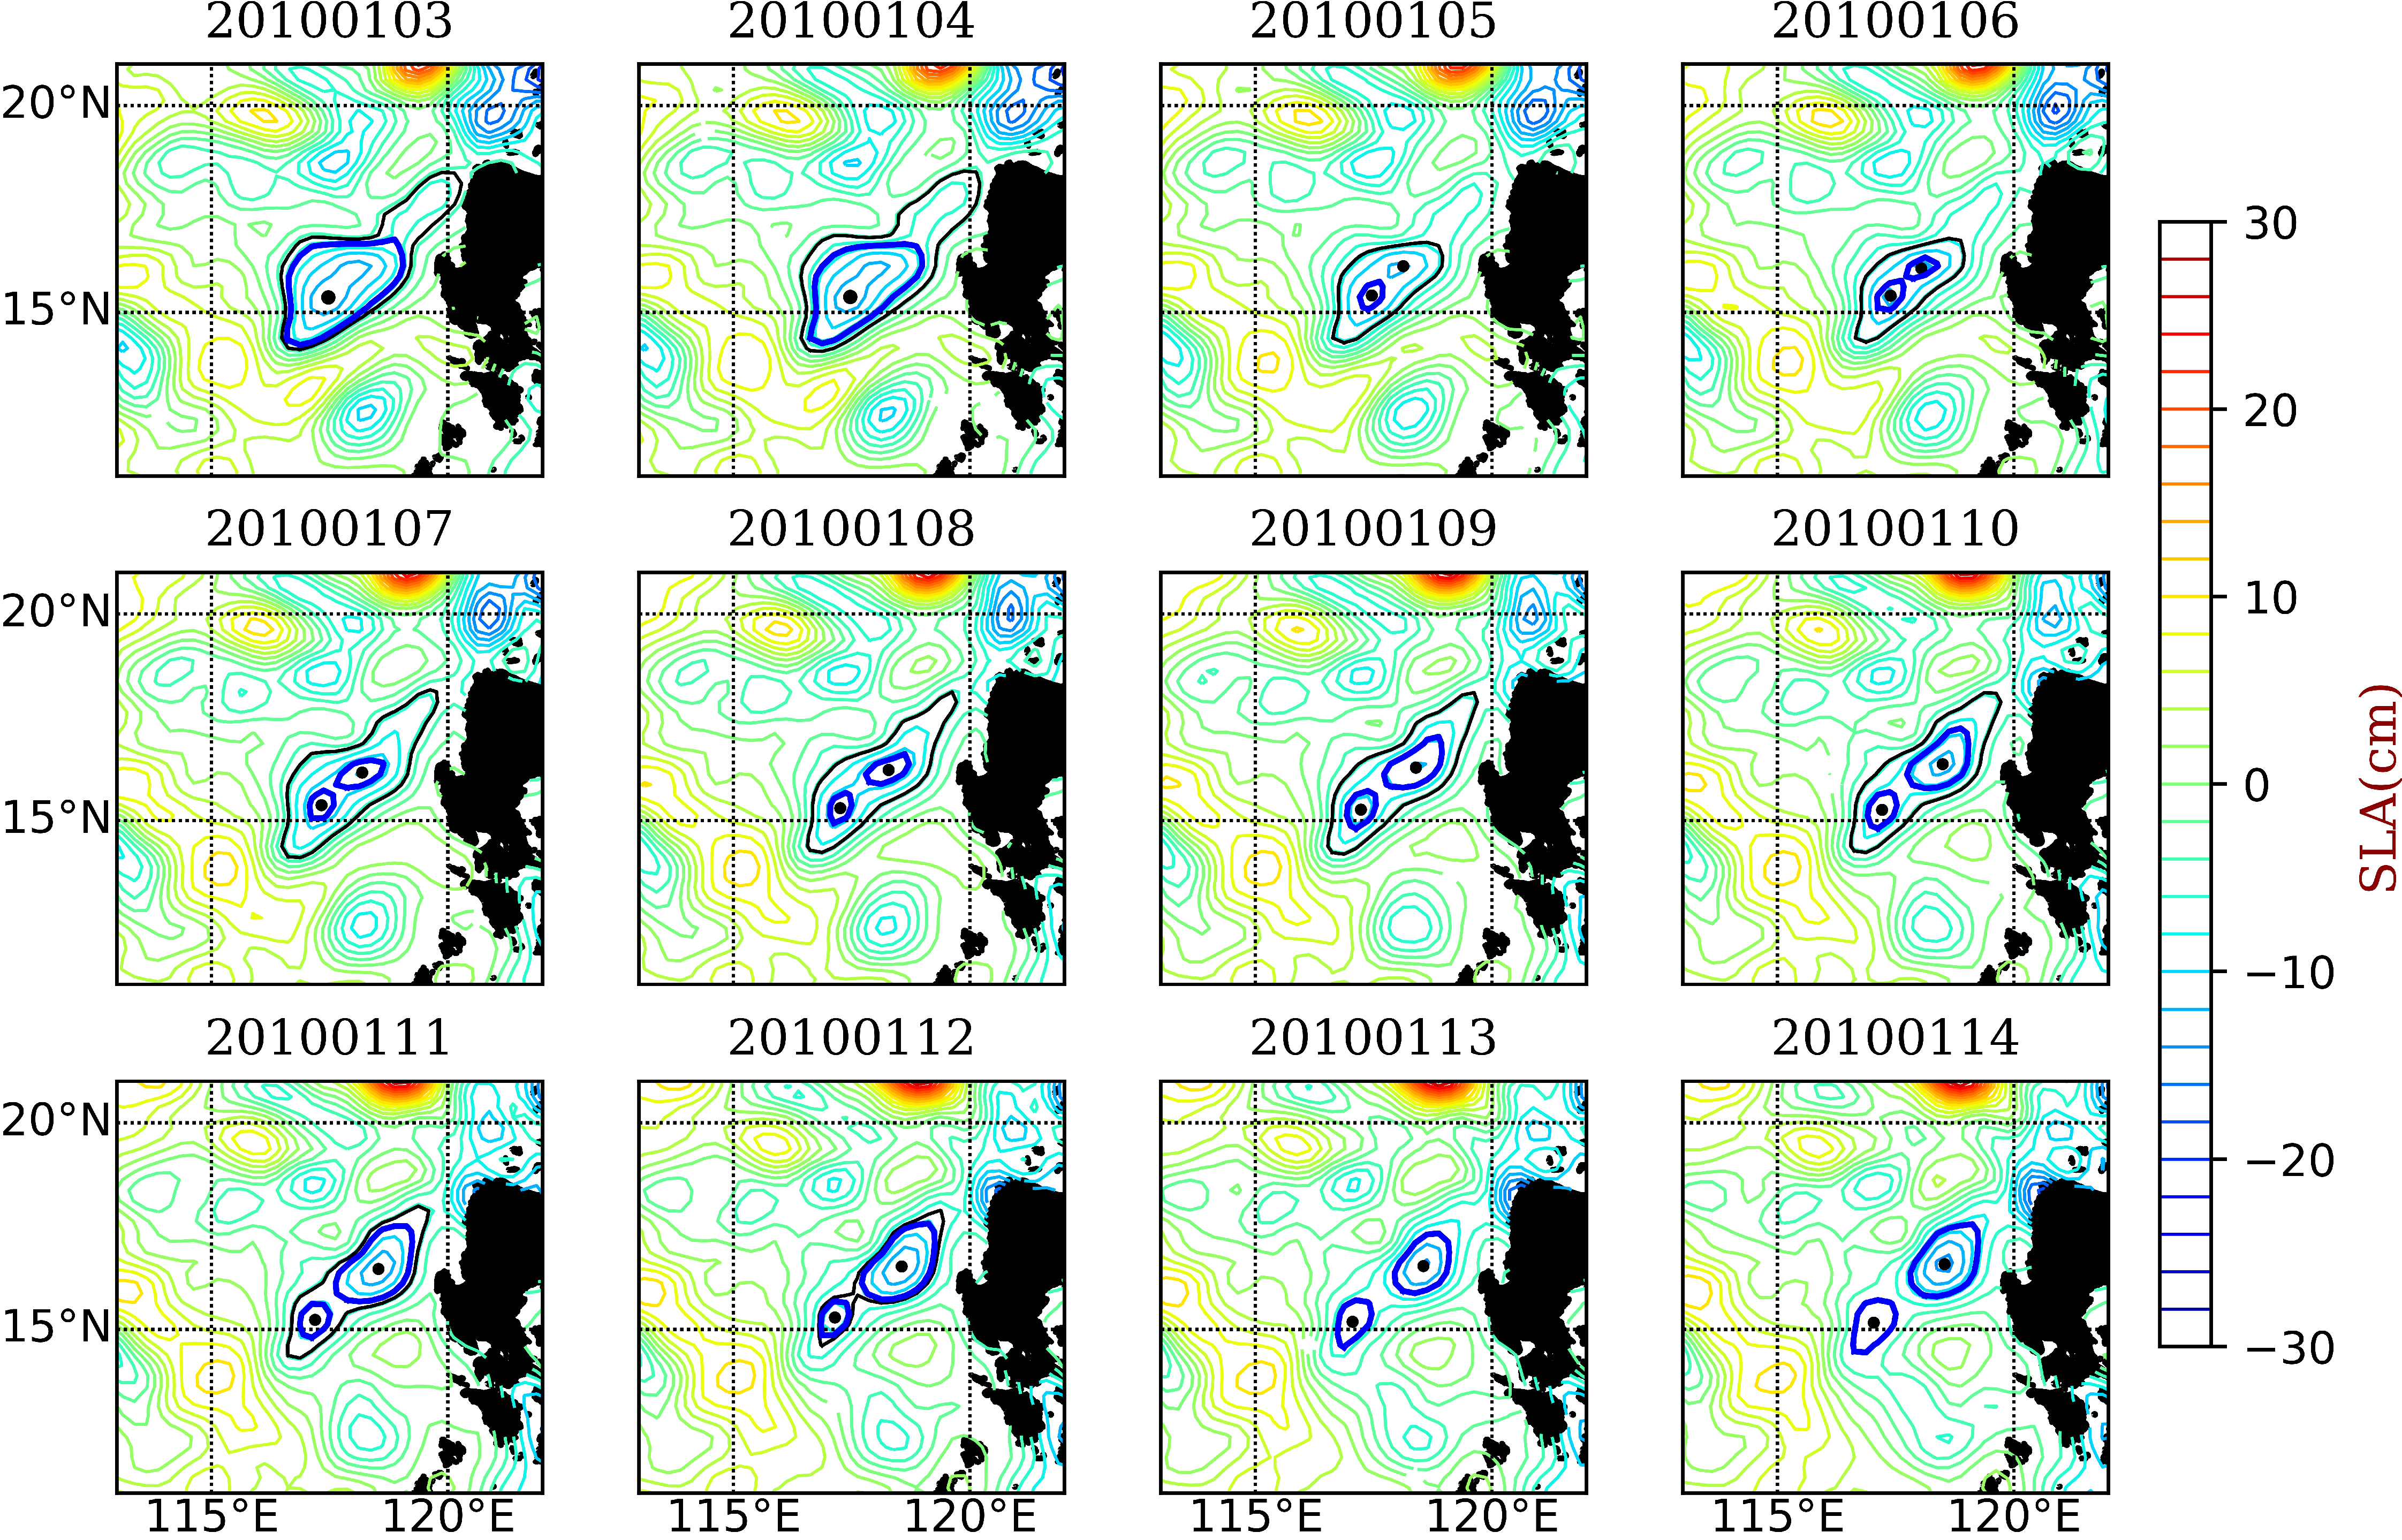
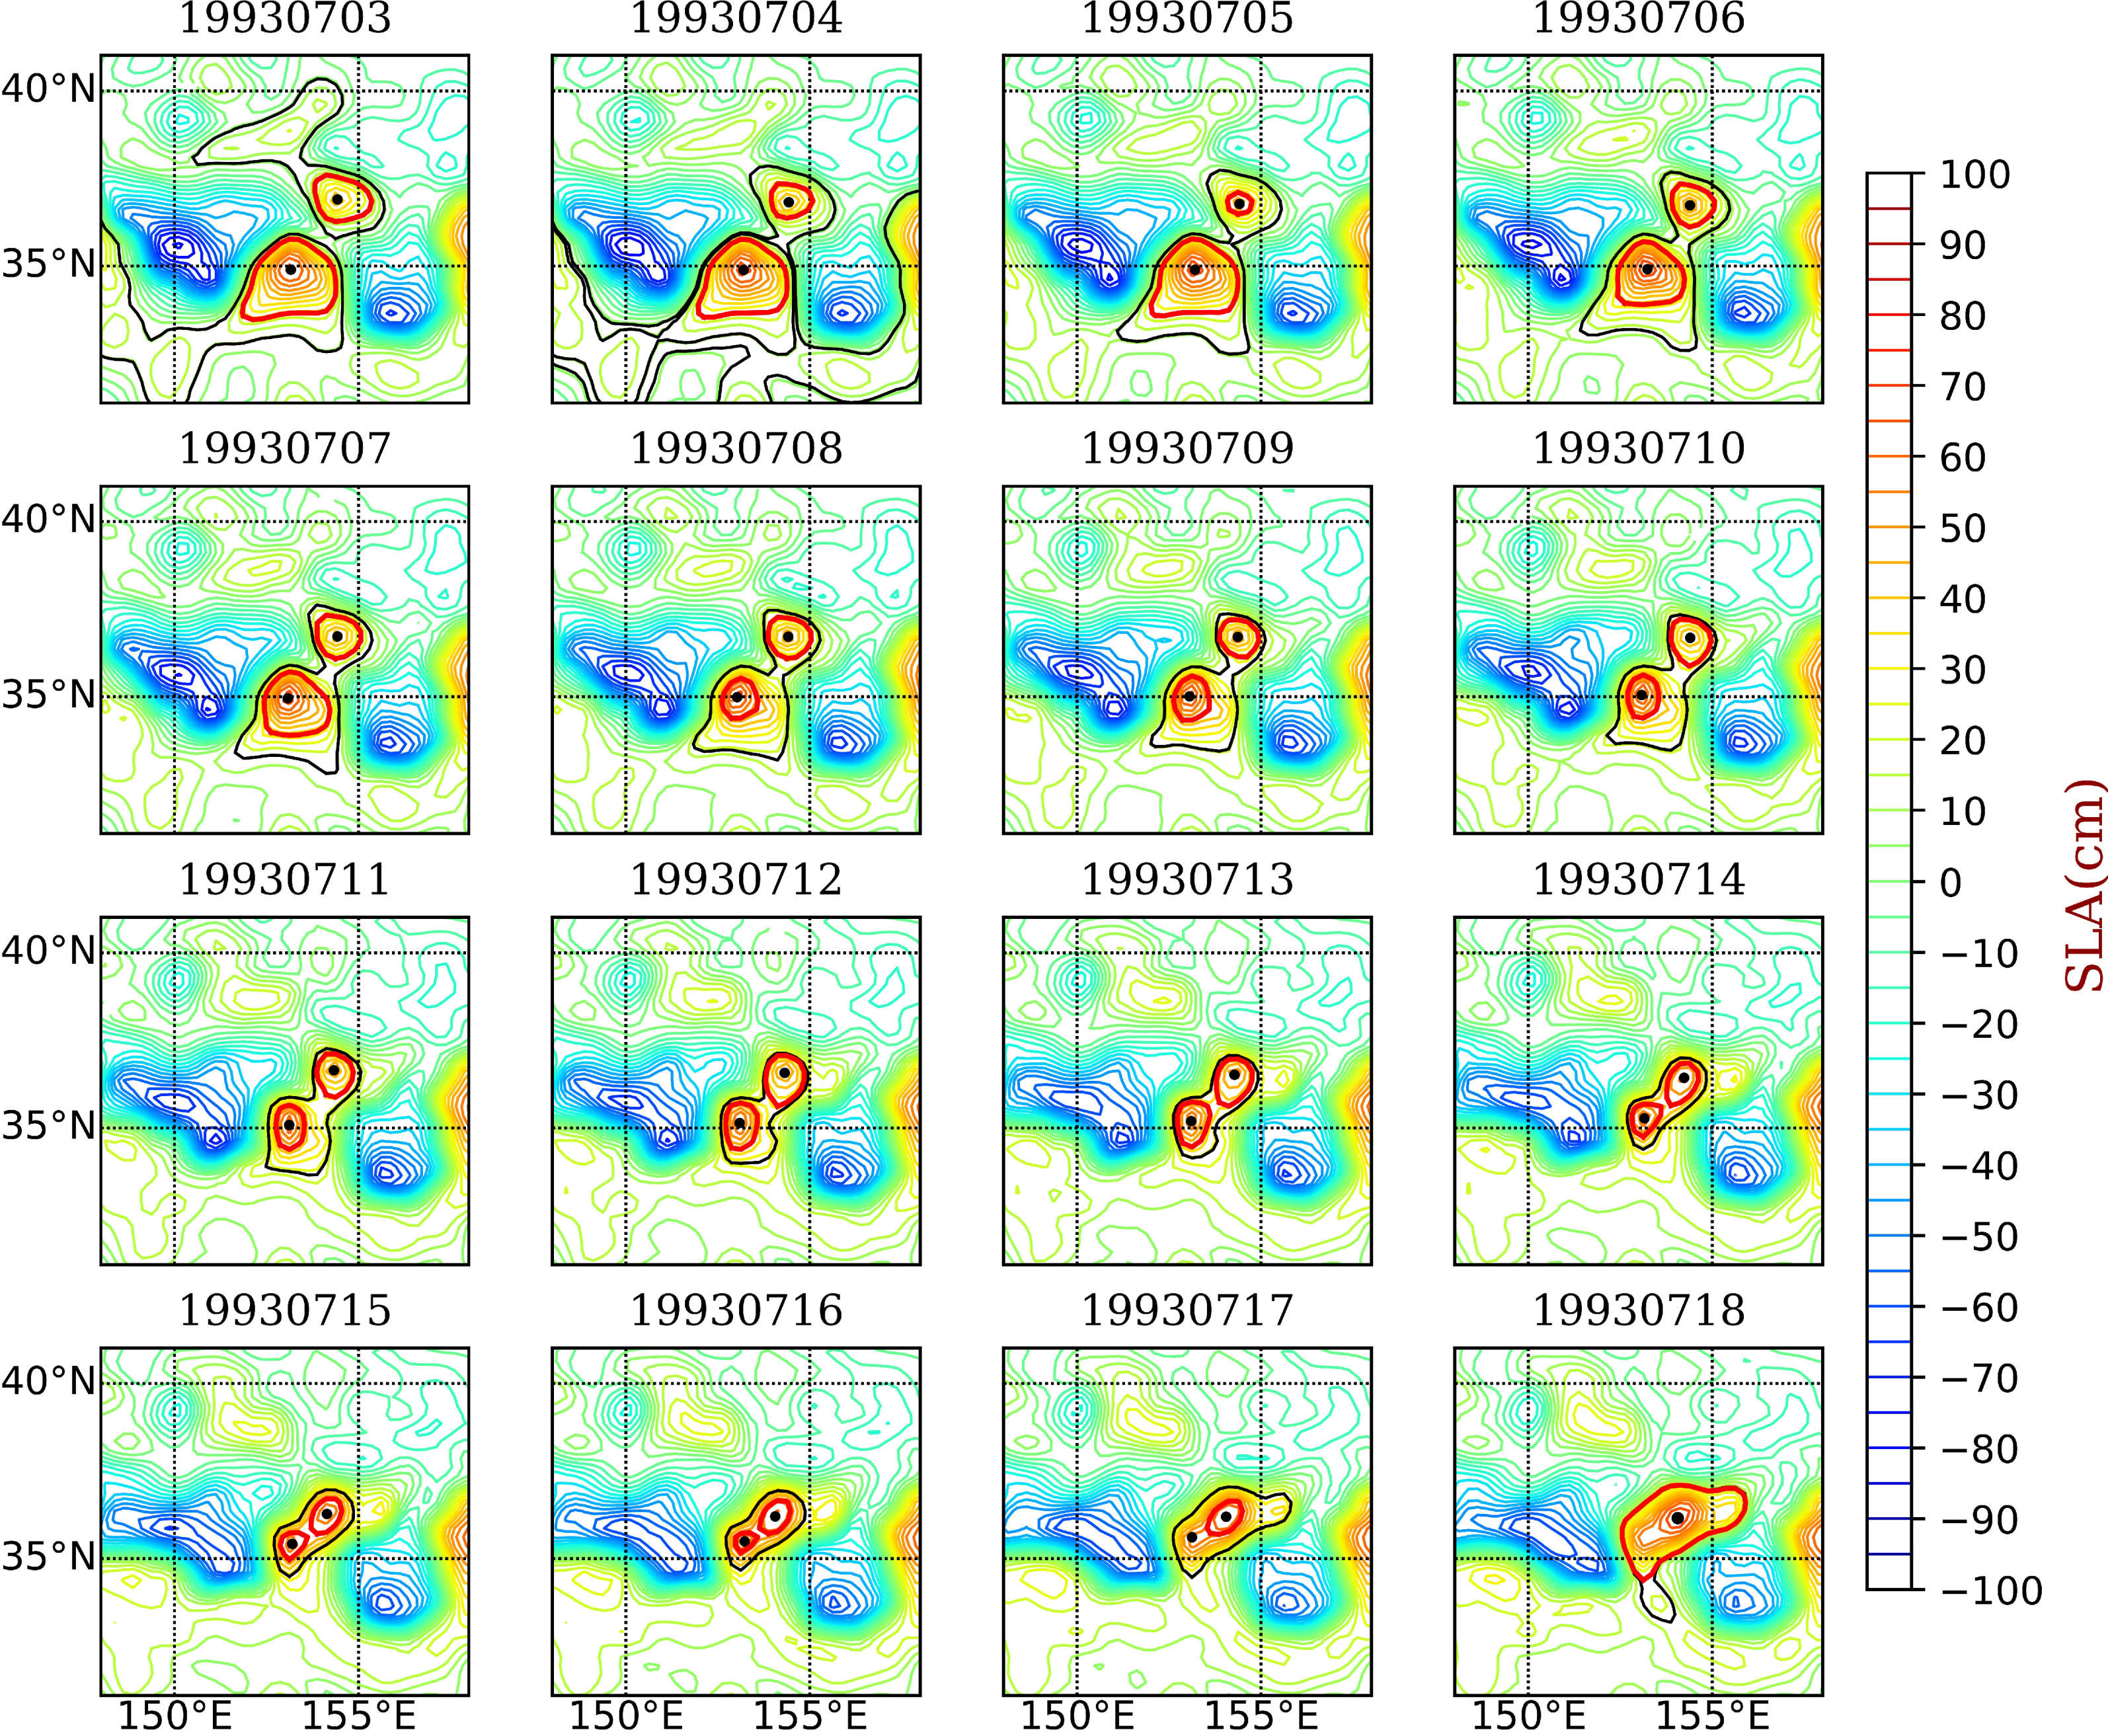
Based on the eddytree data set spanning 27 years (January 1993–December 2019), we tracked 1,023,713 branches. A total of 395,307 Eddy-DAGs were established from these branches, including 103,220 nonlinear Eddy-DAGs and 292,087 linear Eddy-DAGs. In addition, 103,220 splitting events and 202,281 merging events were contained within the nonlinear Eddy-DAGs (Table 1). Figure 10 and Figure 11 demonstrate a splitting merging event and a merging splitting event, respectively, from our data set. Our eddy tracking EddyGraph data set (1993–2019) in the Northwest Pacific Ocean (105°E–165°W, 0°N–60°N) is available at http://data.casearth.cn/sdo/detail/60cc550f819aec69f61fe8f9 (accessed on 22 June 2021).

3.2. Extraction of Typical Events

We chose the events with source branch(es) whose lifetimes all exceeded 14 days and where there were eddies on all branches as typical eddy splitting and merging events during January 1993–December 2019. In total, 6194 anticyclonic eddy splitting events, 5973 cyclonic eddy splitting events, 4764 anticyclonic eddy merging events and 4439 cyclonic eddy merging events were extracted.
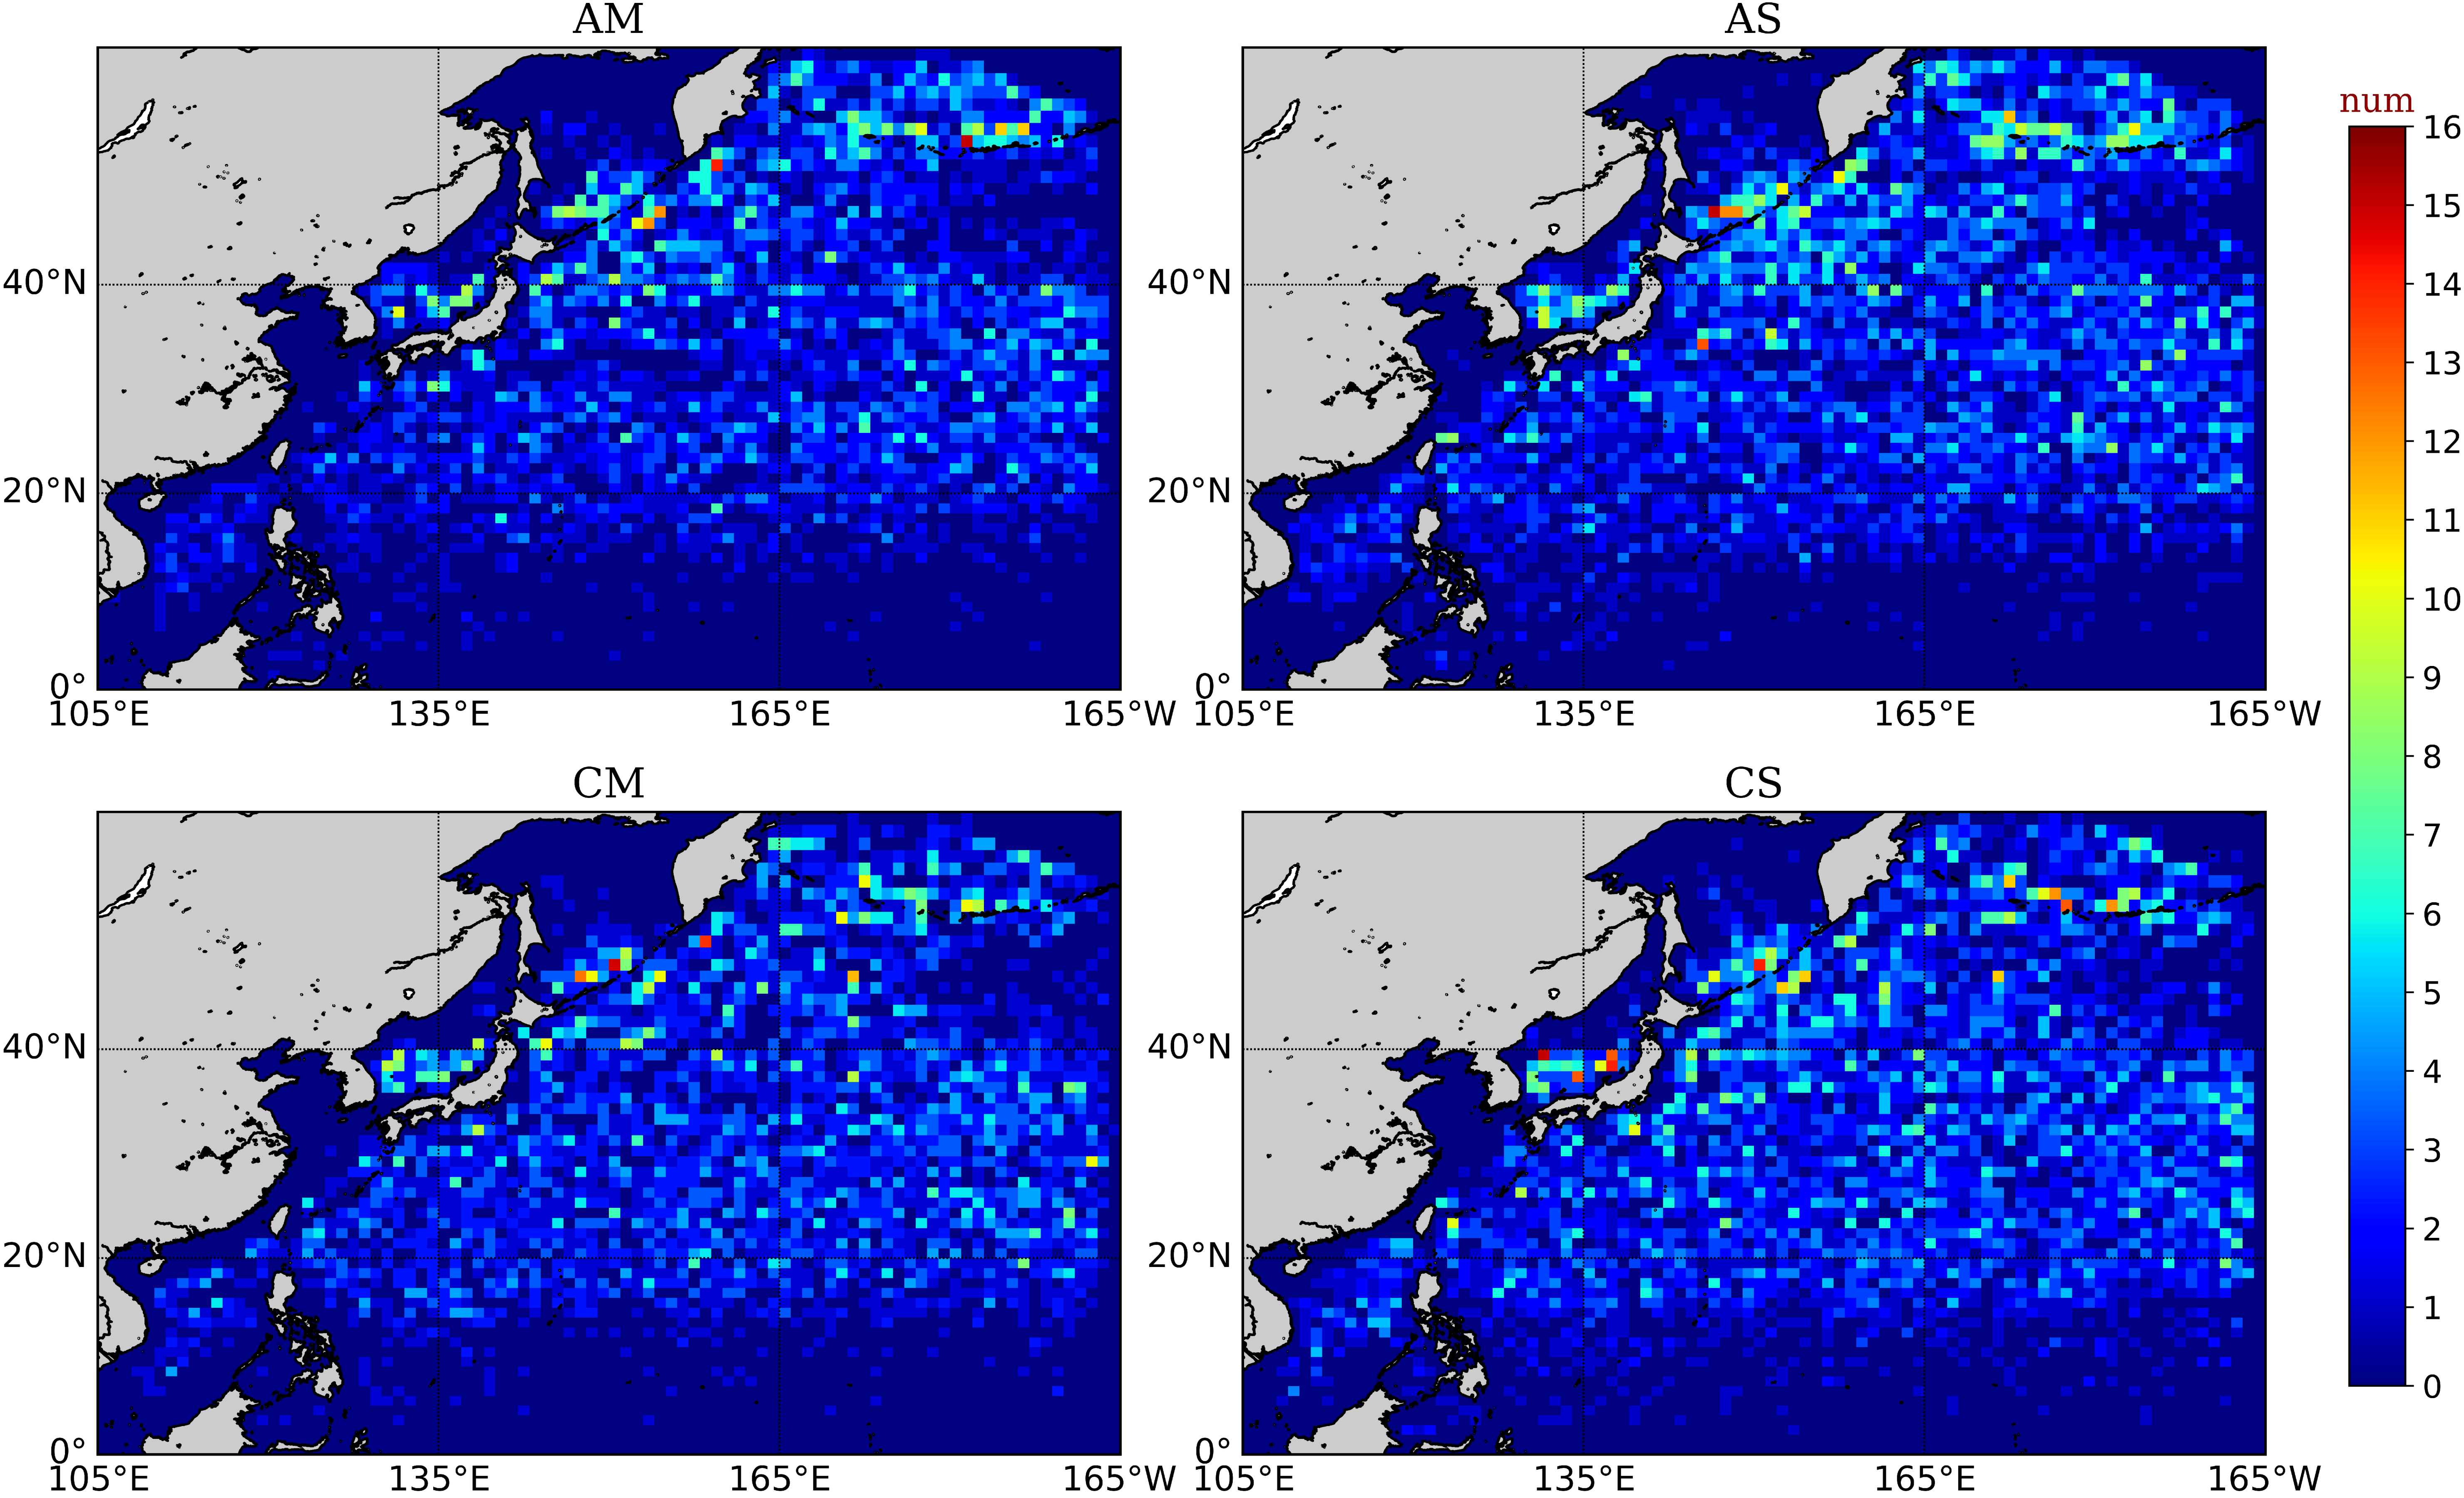
Figure 12 shows the geographical distributions of the numbers of typical merging and splitting events for anticyclonic and cyclonic eddies during January 1993–December 2019 at each 1° × 1°grid point in the Northwest Pacific Ocean (105°E–165°W, 0°N–60°N). Typical eddy merging and splitting events are observed in the mid- and high-latitude regions of the study area, while the occurrence frequencies of typical eddy splitting and merging events are comparatively high in the areas around the Sea of Japan, the Thousand Islands and the Aleutian Islands. The scarcity of typical eddy splitting and merging events in the Kuroshio Extension is noted, which is consistent with the relatively low number of eddies in this region reported by Chelton et al. (2011) [17].

4. Validation

4.1. Verification with Remote Sensing Observations

Mesoscale eddies can effectively transport heat to redistribute temperature, which means that temperature anomalies inside individual eddies tend to move with those eddies [7,8]. For the temperature anomaly structures induced by individual eddies, two patterns have been proposed [1,8,9], including monopole pattern and dipole pattern, which correspond to two mechanisms responsible for the eddy heat flux: the average isopycnal surface displacements caused by eddies [7,12,17,37] and the horizontal advection of the background gradient by eddy rotation [3,4,5]. Consequently, the composite structure of eddy-induced SSTA is a linear combination of monopole structures and dipole structures [8,9].
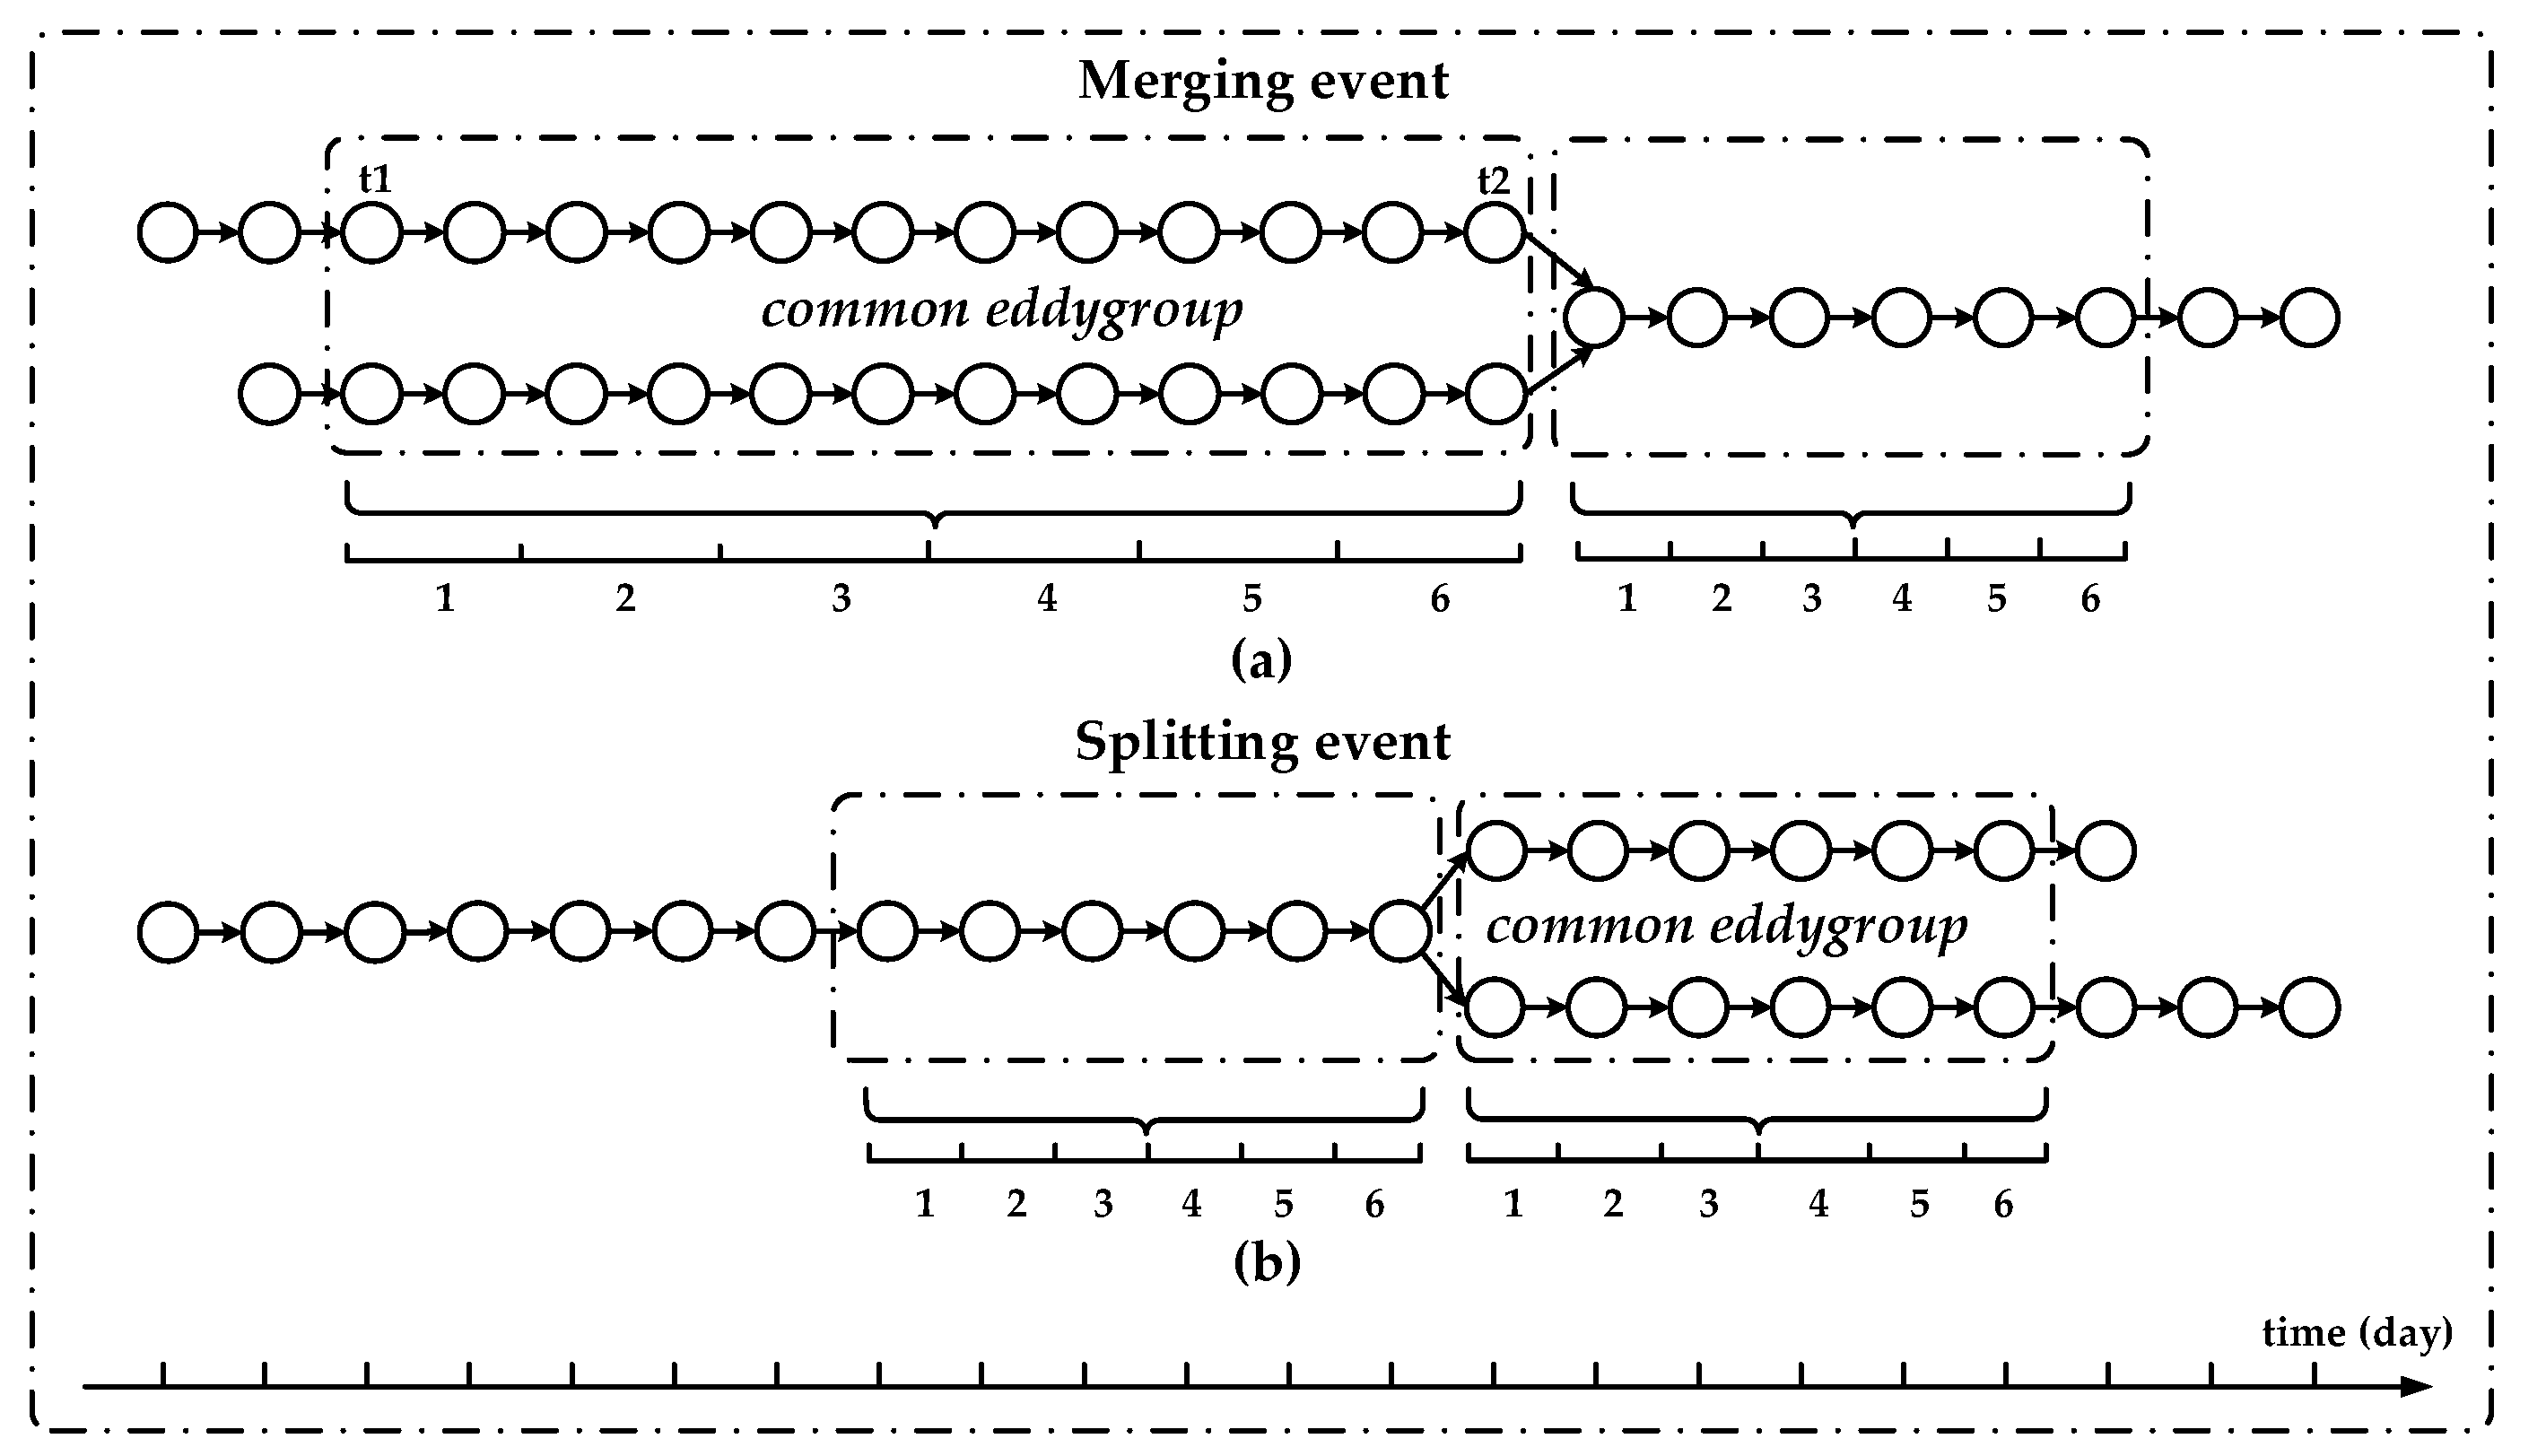
As a fluid structure representing the spatial connection of the sink eddies in splitting events or the source eddies in merging events, a common eddygroup allows us to analyze how splitting and merging events change over a time period around the day of splitting or merging. As shown in Figure 13a, the source branches from day t1 to day t2 during a merging event are within a common eddygroup. We projected the common eddygroups on each merging event source branch from t1 to t2 into six time periods according to the time span. For individual merging events, the number of eddygroups in each time period may be more than one; in this case, the first eddygroup in each time period would be used for normalization. After the source branch projection of all typical merging events (Figure 13a), the SSTA signals within the interiors of the eddygroups in each time period were composited (Figure 14a) to represent the cumulative signal of merging eddies in the common eddygroup of all events during different stages of merging. For the splitting event, the last six days of eddies on the event source branch were projected into six time periods (Figure 13b), and the eddies during each time period were composited in the same way [1,8,9] (Figure 14b). Furthermore, the first six days of eddies (eddygroups) on the sink branch in a merging (splitting) event correspond to six time periods as shown in Figure 13a (Figure 13b). In conclusion, each splitting (merging) event process corresponds to 12 time periods as different stages of the event, and the SSTA signals of the eddygroups or eddies during each stage for all splitting (merging) events are composited to present how the eddies change and develop in the process of splitting (merging).
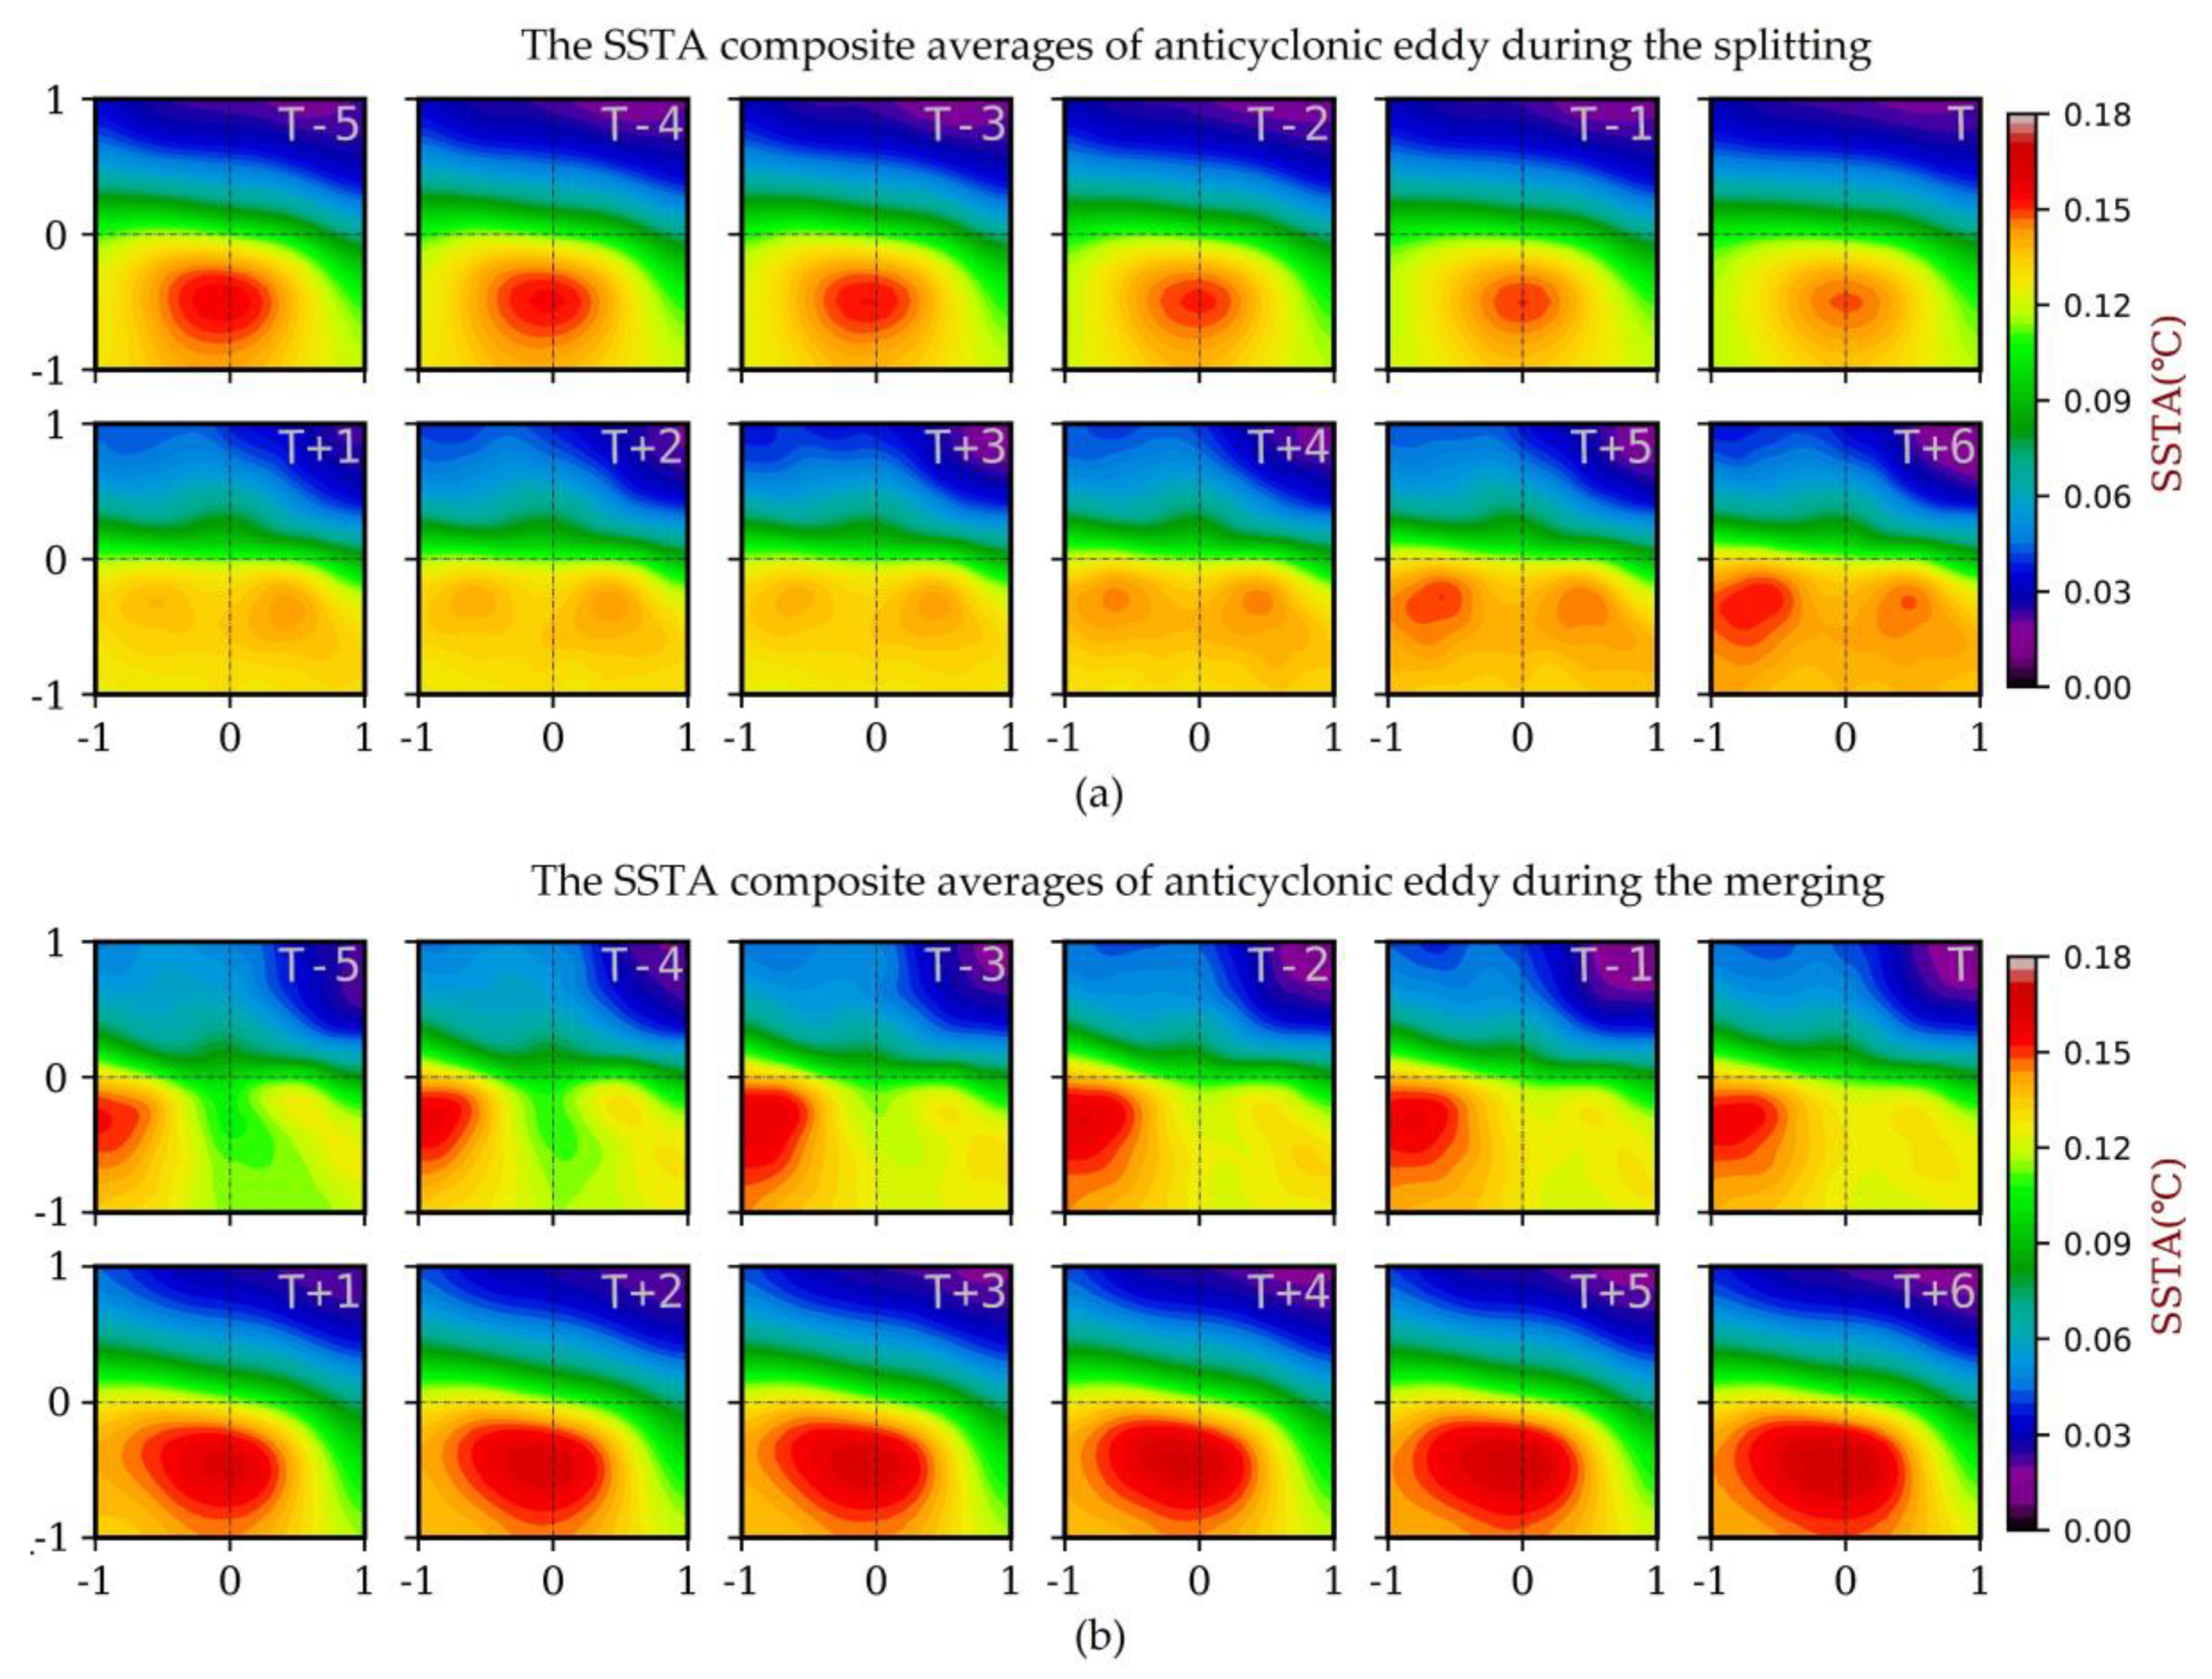
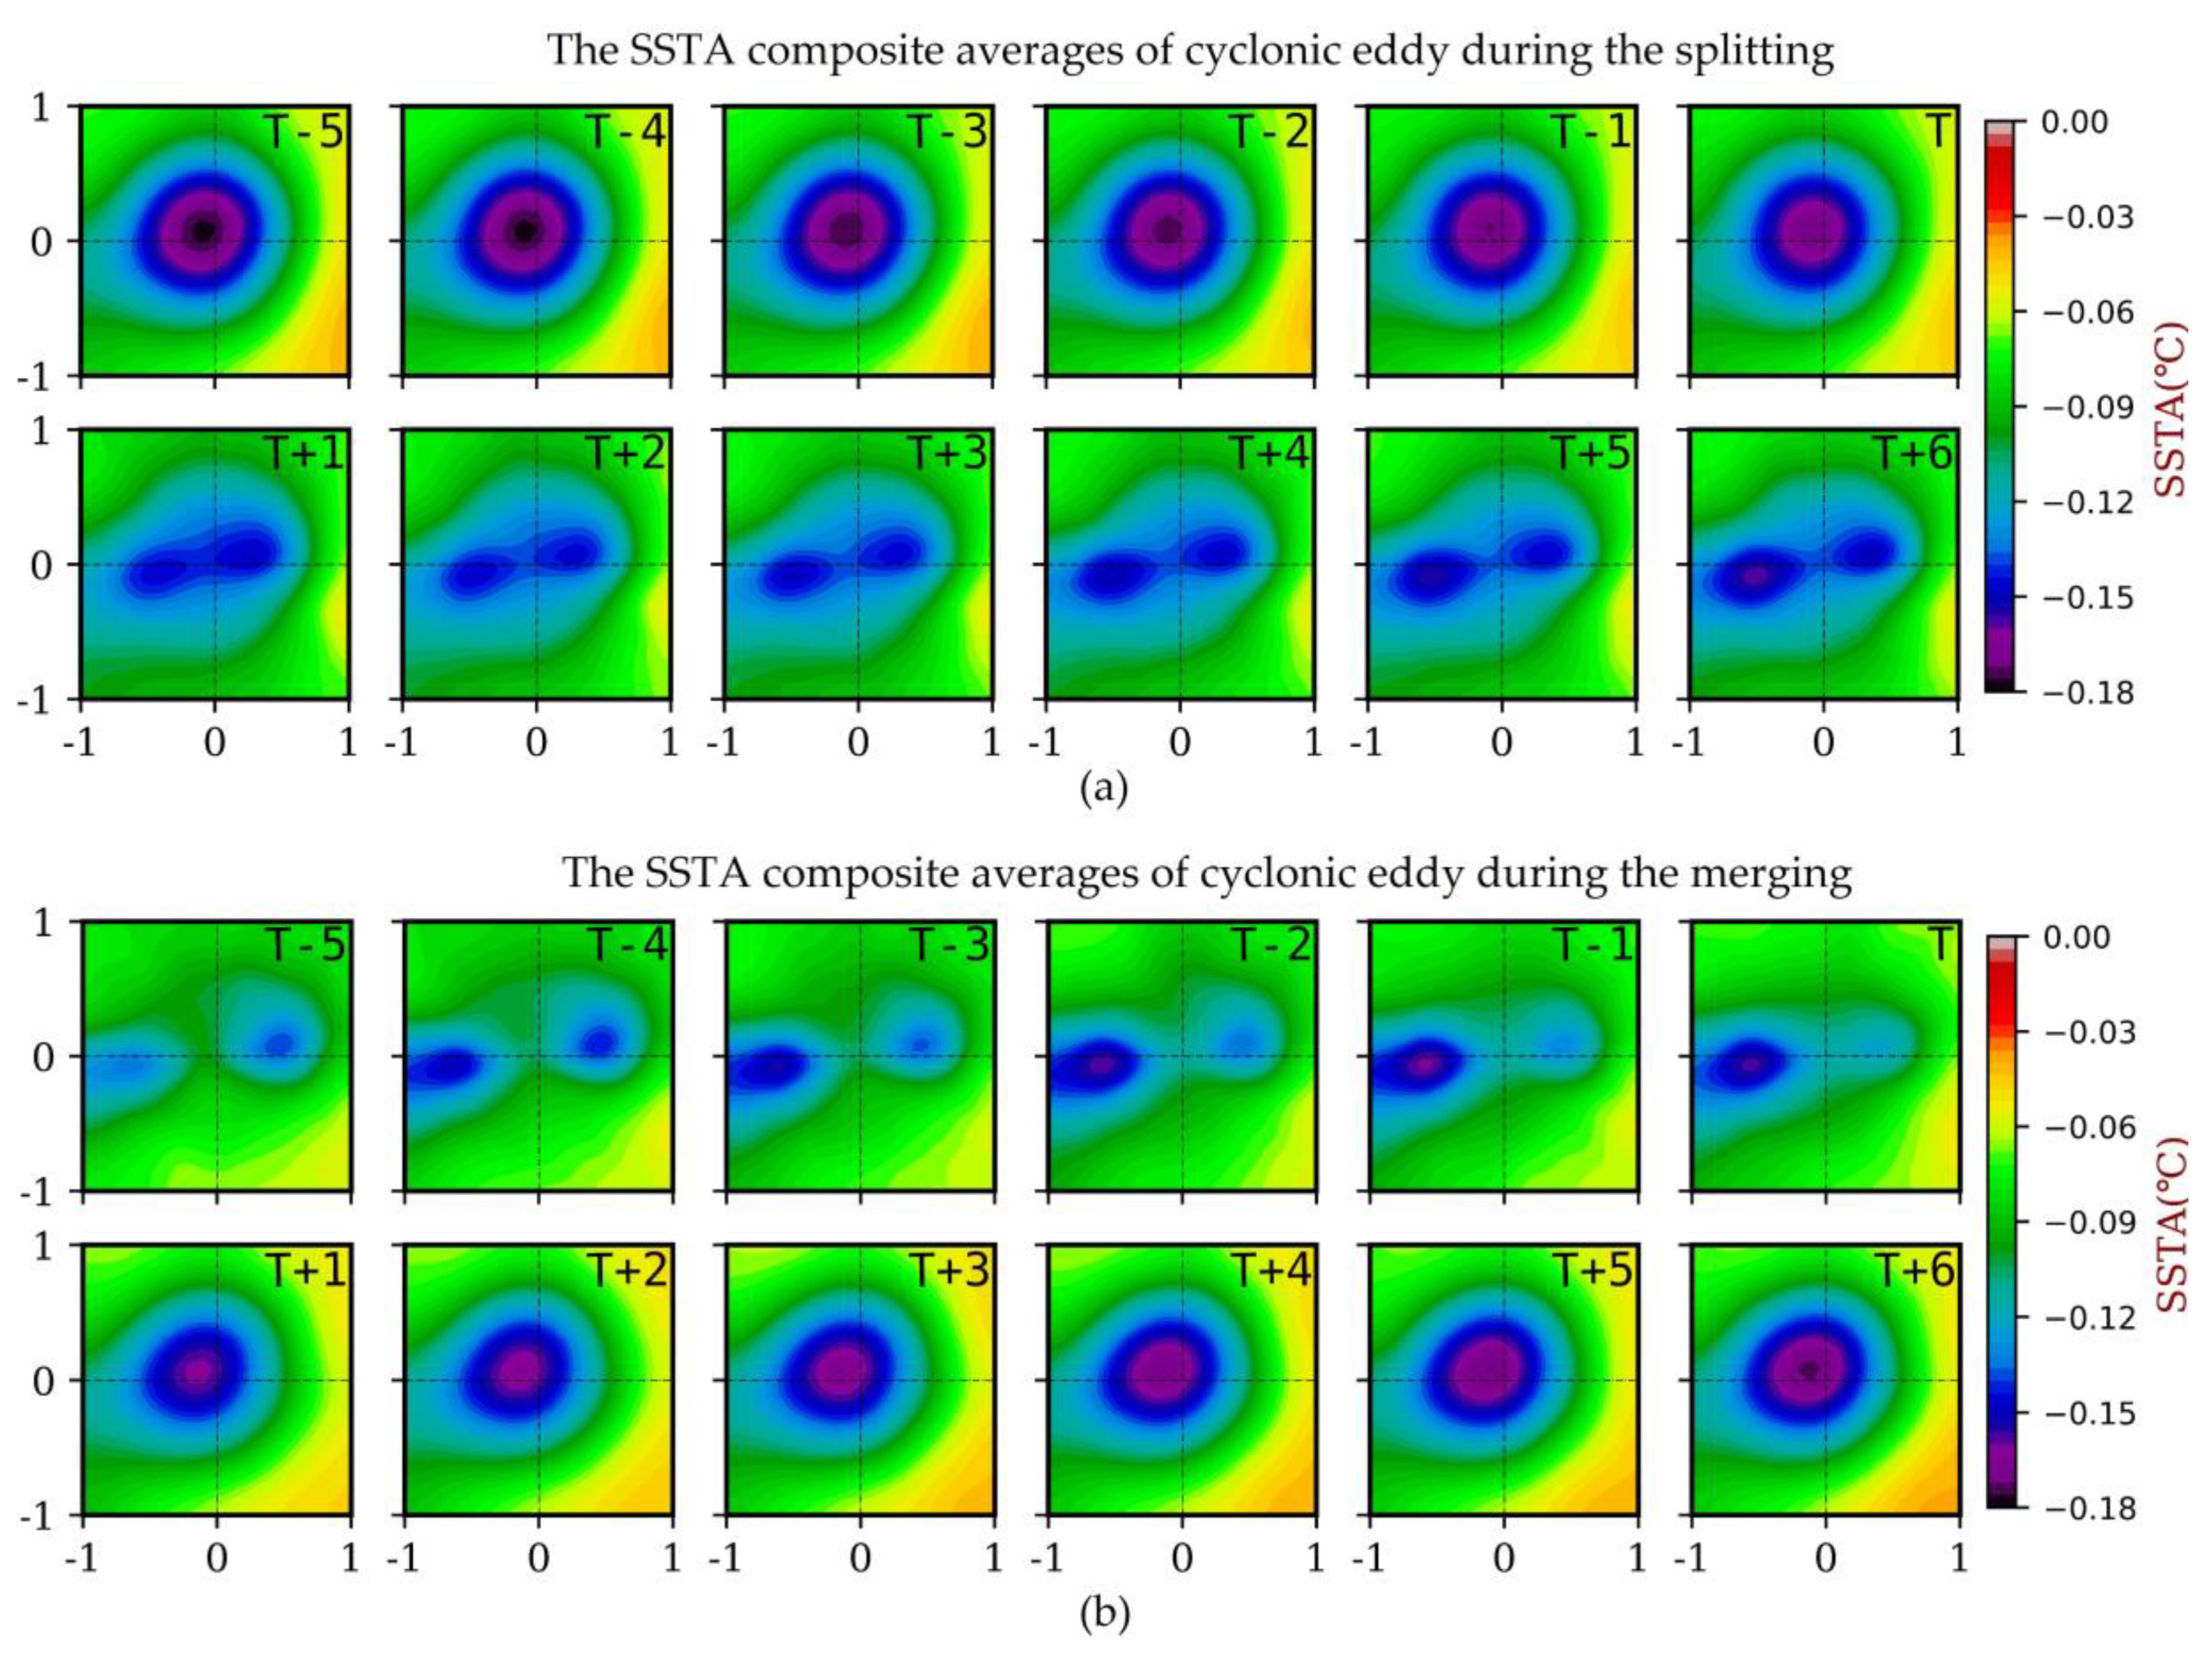
An 18-day running average filter was applied to the SSTA data to attenuate the variability with periods shorter than 2–3 weeks, and a high-pass filter was implemented to remove large-scale SSTA variability unrelated to the influence of mesoscale eddies [1]. The typical events over the 24-year period (January 1996–December 2019) were used for the SSTA composite analysis within the interiors of eddies and eddygroups during splitting (merging) events. Table 2 shows the numbers of events employed for the normalization. The resulting SSTA composite averages for the splitting and merging events of anticyclonic and cyclonic eddies are presented in Figure 15 and Figure 16. The gradual evolution from a splitting eddy into eddies within the same parent eddygroup (Figure 15a and Figure 16a) and the degeneration from merging eddies in a common eddygroup to an eddy (Figure 15b and Figure 16b) for both anticyclonic and cyclonic eddies are consistent with our expectations for eddy splitting and merging events described in Section 2.2.2. The SSTA composite averages of cyclonic eddies during splitting (merging) events present obvious monopole structures (Figure 16a,b), which are likely related to the elevation of the isopycnal surfaces typically associated with cyclonic eddies [7,12,17,37]. In contrast, the SSTA composite averages within the interiors of anticyclonic eddies during splitting (merging) events present a linear combination of monopole and dipole structures (Figure 15a,b), which are likely related to the depression of the isopycnal surfaces typically associated with anticyclonic eddies [7,12,17,37] and the lateral phase alignment between the temperature anomaly fields [3,4,5], respectively. Moreover, the two source eddies in the merging event depicted in Figure 15b and Figure 16b have an unequal intensity, which corresponds to the tendency of merging eddies to manifest as a stronger eddy merging with a weaker eddy [33].

4.2. Verification with In Situ Data

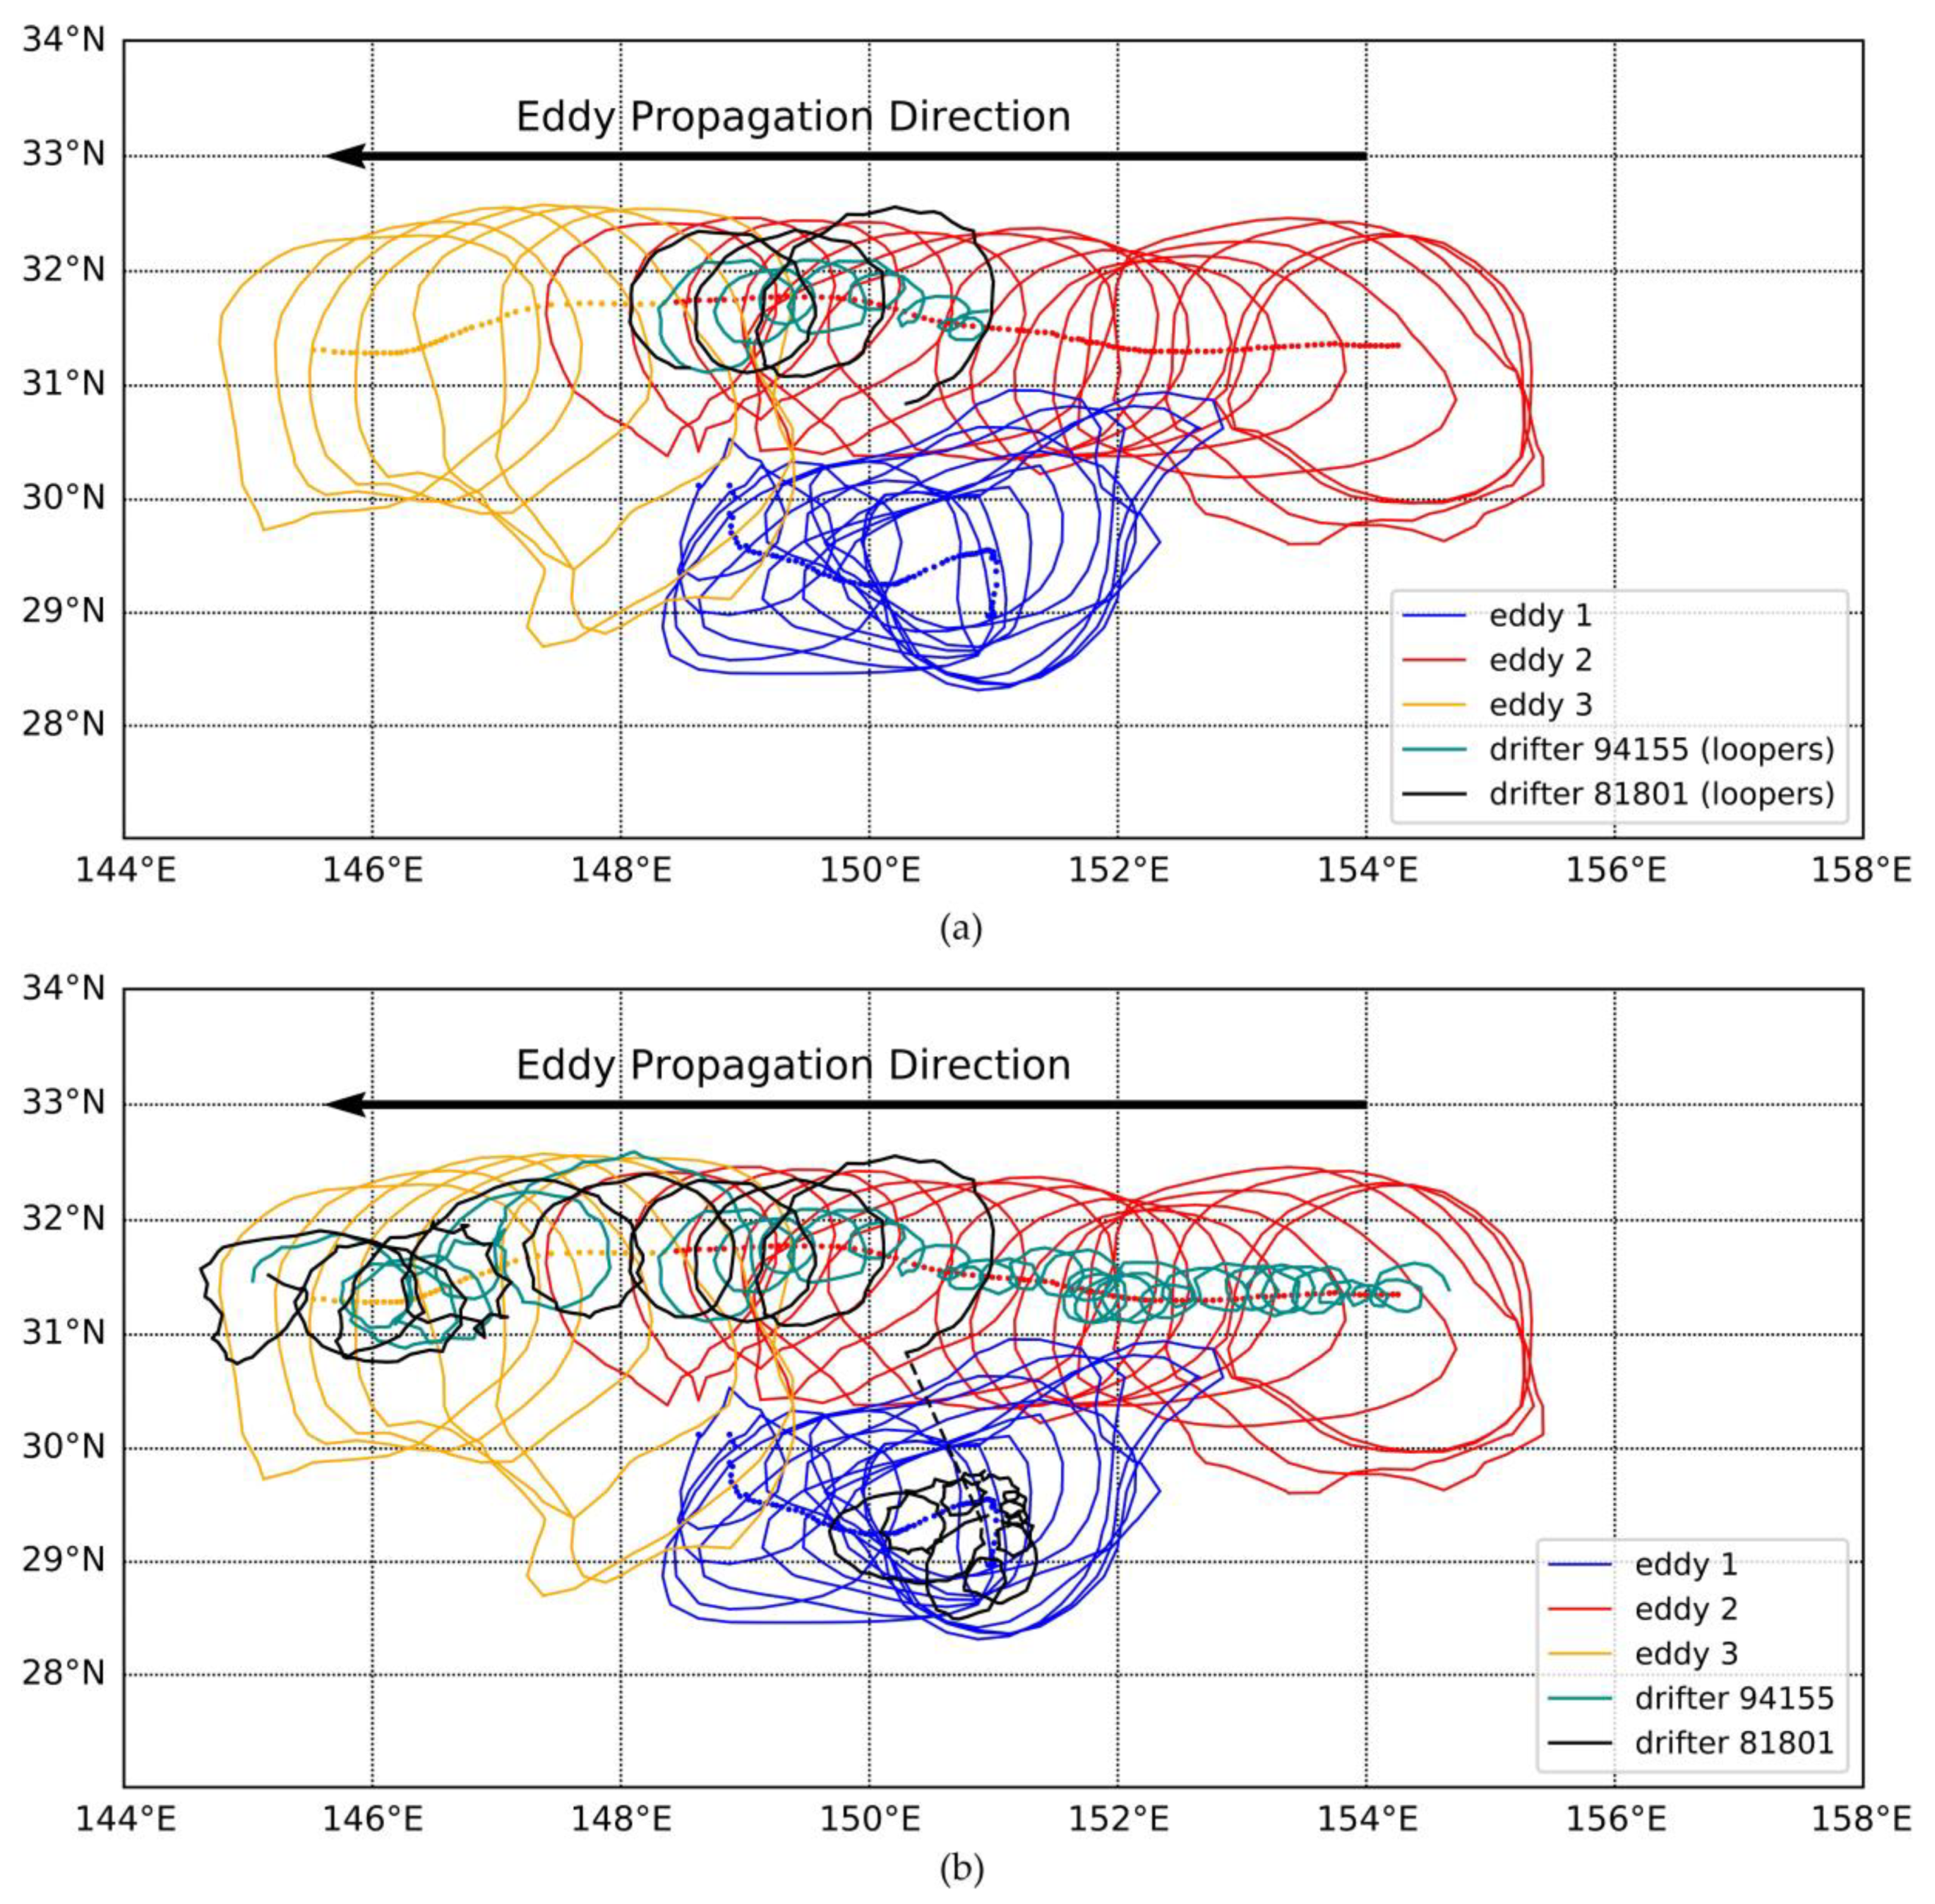
We matched the merging event of a cyclonic eddy with the loopers of drifters in Lagrangian trajectories (Figure 17a). Two or more drifters in Lagrangian trajectories can be considered as loopers in Lagrangian trajectories [34], which is described in Section 2.1. In our trajectories, eddy1 and eddy2 appeared on 20100409 and 20100530, respectively, and eventually merged into eddy3 with a lifetime of 20100908–20100927. Consequently, the sudden disappearance of the two loopers (Figure 17a) is difficult to understand. We searched the data set of drifters in the period of this event, and the trajectories of drifters over 20100530–20100927 are expressed in Figure 17b. As expected, drifter 81,801 lived in eddy2 until 20100728, whereas drifter 94,155 remained in eddy1 during the whole event. It is worth noting that the trajectories of the two drifters resemble the trends of the eddies and rotate along the axis of the eddy core, which validates the authenticity of these three eddies detected by our algorithm. The signal of drifter 81401 was lost during 20100728–20100808 but reappeared within the interior of eddy1 on 20100809, the beginning of the looper trajectories (Figure 17a), which may have been caused by the eddy1 and eddy2 interaction. This merging event demonstrates that loopers are not adequately complete due to the Lagrangian tracking method without considering the splitting and merging of eddies. Furthermore, the algorithm of eddy splitting and merging proposed in this paper could contribute to the tracking of eddies.

5. Discussion and Conclusions

Mesoscale eddies play important roles in the exchange of energy and mass transport. The tracking algorithm for eddy splitting and merging can not only improve our understanding of the time-dependent behavior of ocean eddies but also promotes the study of eddies. At present, automated eddy splitting and merging tracking algorithms are still in a stage of exploration, and few automated algorithms track eddies that split and merge [23,32,33]. Furthermore, no corresponding data set of eddy trajectories that considers splitting and merging behaviors has been published, and no data validation has been presented. This paper proposes an algorithm named EddyGraph for the tracking of eddy splitting and merging events. The data set of eddy trajectories over the 27-year period from January 1993 to December 2019 in the Northwest Pacific is available at http://data.casearth.cn/sdo/detail/60cc550f819aec69f61fe8f9, accessed on 14 February 2021, which would fill gaps in data sets to support studies on eddy splitting and merging in the Northwest Pacific (105°E–165°W, 0°N–60°N). The eddytree data set representing a spatial topological tree structure of closed SLA contours with eddies as the leaf nodes and eddygroups as the intermediate nodes is obtained based on a multilevel eddy identification algorithm. In our tracking algorithm, only eddies contained within a common eddygroup are tracked as sources in merging events or as sinks in splitting events. Moreover, as a fluid structure representing the spatial connection of the sink eddies in splitting events or the source eddies in merging events, a common eddygroup allows us to analyze how splitting and merging events change over a time period around the day of splitting or merging. Twelve continuous time steps of SSTA signals inside eddygroups and eddies in typical splitting and merging events were composited during January 1996–December 2019. The degeneration pattern in which eddies in the same eddygroup merge into an eddy and the evolution pattern in which an eddy splits into eddies in the common parent eddygroup confirm the authenticity of our algorithm. In addition, we matched a merging event of cyclonic eddies with drifters and loopers in eddy Lagrangian trajectories. A comparison between the trajectories from our data set and those of loopers confirms that our tracking algorithm is effective in improving the Lagrangian trajectories of mesoscale eddies.
Much work remains to be accomplished in the future. First, a global data set will be identified with improvements in computational efficiency. Second, in this study, we extracted typical events for validation due to the limited accuracy of our data set caused by the SLA data resolutions; the accuracy of our data set can be optimized with improvements in data resolution promoted by the progress of ocean remote sensing technology [38]. Third, our algorithm for tracking eddy splitting and merging events is based on the nature of eddies in two-dimensional SLA data. However, eddies are ocean phenomena with a three-dimensional structure [7]. Therefore, a tracking algorithm for three-dimensional eddy splitting and merging events will be studied in the future.

Author Contributions

Conceptualization, F.T.; methodology, F.T., Z.L. and Z.Y.; software, Z.L. and Z.Y.; validation, Z.L.; formal analysis, Z.L.; investigation, Z.L.; resources, Z.L.; data curation, Z.L.; writing—original draft preparation, Z.L.; writing—review and editing, F.T. and Z.L.; visualization, Z.L.; supervision, G.C.; project administration, G.C.; funding acquisition, G.C. All authors have read and agreed to the published version of the manuscript.

Funding

This research was funded by the National Natural Science Foundation of China: No. 42030406, Marine Science and Technology Fund of Shandong Province for Pilot National Laboratory for Marine Science and Technology (Qingdao): No. 2018SDKJ0102, the Open Fund of Key Laboratory of Urban Land Resources Monitoring and Simulation, Ministry of Natural Resources: No. KF-2020-05-085 and ESA-NRSCC Scientific Cooperation Project on Earth Observation Science and Applications: Dragon 5: No. 58393.

Acknowledgments

We are very grateful to the open-access data provided by the Copernicus Marine Service, the National Oceanic and Atmospheric Administration-Advanced Very High-Resolution Radiometer and NOAA’s Atlantic Oceanographic and Meteorological Laboratory. We are also very grateful to the data-sharing service system provided by the Chinese Academy of Sciences where our data set can be downloaded. We would like to thank the staff in the editorial office and the authors who contributed to the paper.

Conflicts of Interest

The authors declare no conflict of interest.

References

  1. Chelton, D.B.; Gaube, P.; Schlax, M.G.; Early, J.J.; Samelson, R.M. The Influence of Nonlinear Mesoscale Eddies on Near-Surface Oceanic Chlorophyll. Science 2011, 334, 328. [Google Scholar] [CrossRef] [PubMed]
  2. Volkov, D.L.; Tong, L.; Fu, L.L. Eddy-induced meridional heat transport in the ocean. Geophys. Res. Lett. 2008, 35, 295–296. [Google Scholar] [CrossRef] [Green Version]
  3. Wunsch, C. Where do ocean eddy heat fluxes matter? J. Geophys. Res. Ocean. 1999, 104, 13235–13249. [Google Scholar] [CrossRef]
  4. Roemmich, D.; Gilson, J. Eddy Transport of Heat and Thermocline Waters in the North Pacific: A Key to Interannual/Decadal Climate Variability? J. Phys. Oceanogr. 2001, 13, 675–688. [Google Scholar] [CrossRef]
  5. Hausmann, U.; Czaja, A. The observed signature of mesoscale eddies in sea surface temperature and the associated heat transport. Deep-Sea Res. Part. I Oceanogr. Res. Pap. 2012, 70, 60–72. [Google Scholar] [CrossRef]
  6. Morrow, R.; Traon, P. Recent advances in observing mesoscale ocean dynamics with satellite altimetry. Adv. Space Res. 2012, 50, 1062–1076. [Google Scholar] [CrossRef] [Green Version]
  7. Dong, C.; Mcwilliams, J.C.; Liu, J.; Chen, D. Global heat and salt transports by eddy movement. Nat. Commun. 2014, 5, 3294. [Google Scholar] [CrossRef] [Green Version]
  8. Amores, A.; Melnichenko, O.; Maximenko, N. Coherent mesoscale eddies in the North Atlantic subtropical gyre: 3-D structure and transport with application to the salinity maximum. J. Geophys. Res. Ocean. 2017, 122, 23–41. [Google Scholar] [CrossRef]
  9. Sun, B.; Liu, C.; Wang, F. Eddy induced SST variation and heat transport in the western North Pacific Ocean. J. Oceanol. Limnol. 2020, 38, 1–15. [Google Scholar] [CrossRef]
  10. Zhang, Z.; Wei, W.; Qiu, B. Oceanic mass transport by mesoscale eddies. Science 2014, 345, 322–324. [Google Scholar] [CrossRef]
  11. Sadarjoen, I.A.; Post, F.H. Detection, quantification, and tracking of vortices using streamline geometry. Comput. Graph. 2000, 24, 333–341. [Google Scholar] [CrossRef]
  12. Chelton, D.B.; Schlax, M.G.; Samelson, R.M.; de Szoeke, R.A. Global observations of large oceanic eddies. Geophys. Res. Lett. 2007, 34, 87–101. [Google Scholar] [CrossRef]
  13. Henson, S.A.; Thomas, A.C. A census of oceanic anticyclonic eddies in the Gulf of Alaska. Deep-Sea Res. Part I 2008, 55, 163–176. [Google Scholar] [CrossRef]
  14. Chaigneau, A.; Gizolme, A.; Grados, C. Mesoscale eddies off peru in altimeter records: Identification algorithms and eddy spatio-temporal patterns. Prog. Oceanogr. 2008, 79, 106–119. [Google Scholar] [CrossRef]
  15. Isern-Fontanet, J.; Garcia-Ladona, E.; Font, J. Identification of Marine Eddies from Altimetric Maps. J. Atmos. Ocean. Technol. 2003, 20, 772–778. [Google Scholar] [CrossRef]
  16. Nencioli, F.; Dong, C.M.; Dickey, T.; Washburn, L.; McWilliams, J.C. A Vector Geometry-Based Eddy Detection Algorithm and Its Application to a High-Resolution Numerical Model Product and High-Frequency Radar Surface Velocities in the Southern California Bight. J. Atmos. Ocean. Technol. 2010, 27, 564–579. [Google Scholar] [CrossRef]
  17. Chelton, D.B.; Schlax, M.G.; Samelson, R.M. Global observations of nonlinear mesoscale eddies. Prog. Oceanogr. 2011, 91, 167–216. [Google Scholar] [CrossRef]
  18. Faghmous, J.H.; Frenger, I.; Yao, Y.S.; Warmka, R.; Lindell, A.; Kumar, V. A daily global mesoscale ocean eddy dataset from satellite altimetry. Sci. Data 2015, 2, 150028. [Google Scholar] [CrossRef] [Green Version]
  19. Mason, E.; Pascual, A.; McWilliams, J.C. A New Sea Surface Height–Based Code for Oceanic Mesoscale Eddy Tracking. J. Atmos. Ocean. Technol. 2014, 31, 1181–1188. [Google Scholar] [CrossRef] [Green Version]
  20. Liu, Y.; Chen, G.; Sun, M.; Liu, S.; Tian, F. A Parallel SLA-Based Algorithm for Global Mesoscale Eddy Identification. J. Atmos. Ocean. Technol. 2016, 33, 2743–2754. [Google Scholar] [CrossRef]
  21. Penven, P.; Echevin, V.; Pasapera, J.; Colas, F.; Tam, J. Average circulation, seasonal cycle, and mesoscale dynamics of the Peru Current System: A modeling approach. J. Geophys. Res. Ocean. 2005, 110, C10021. [Google Scholar] [CrossRef]
  22. Halo, I.; Backeberg, B.; Penven, P.; Ansorge, I.; Reason, C.; Ullgren, J.E. Eddy properties in the Mozambique Channel: A comparison between observations and two numerical ocean circulation models. Deep-Sea Res. Part II 2014, 100, 38–53. [Google Scholar] [CrossRef]
  23. Le Vu, B.; Stegner, A.; Arsouze, T. Angular Momentum Eddy Detection and tracking Algorithm (AMEDA) and its application to coastal eddy formation. J. Atmos. Ocean. Technol. 2017, 35, 739–762. [Google Scholar] [CrossRef]
  24. Mkhinini, N.; Coimbra, A.; Stegner, A.; Arsouze, T.; Taupier-Letage, I.; Béranger, K. Long-lived mesoscale eddies in the eastern Mediterranean Sea: Analysis of 20 years of AVISO geostrophic velocities. J. Geophys. Res. Ocean. 2014, 119, 8603–8626. [Google Scholar] [CrossRef]
  25. Pessini, F.; Olita, A.; Cotroneo, Y.; Perilli, A. Mesoscale eddies in the Algerian Basin: Do they differ as a function of their formation site? Ocean. Sci. 2018, 14, 669–688. [Google Scholar] [CrossRef] [Green Version]
  26. Haller, G. An objective definition of a vortex. J. Fluid Mech. 2005, 525, 1–26. [Google Scholar] [CrossRef] [Green Version]
  27. Sun, M.; Tian, F.; Liu, Y.; Chen, G. An Improved Automatic Algorithm for Global Eddy Tracking Using Satellite Altimeter Data. Remote Sens. 2017, 9, 206. [Google Scholar] [CrossRef] [Green Version]
  28. Tian, F.; Wu, D.; Yuan, L.; Chen, G. Impacts of the efficiencies of identification and tracking algorithms on the statistical properties of global mesoscale eddies using merged altimeter data. Int. J. Remote Sens. 2020, 41, 2835–2860. [Google Scholar] [CrossRef]
  29. Isern-Fontanet, J.; Lapeyre, G.; Klein, P.; Chapron, B.; Hecht, M.W. Three-dimensional reconstruction of oceanic mesoscale currents from surface information. J. Geophys. Res. Ocean. 2008, 113, C09005. [Google Scholar] [CrossRef] [Green Version]
  30. Fa, N.F.; Morrow, R. Evolution, movement and decay of warm-core Leeuwin Current eddies. Deep-Sea Res. Part II 2003, 50, 2245–2261. [Google Scholar]
  31. Zhai, X.; Johnson, H.L.; Marshall, D.P. Significant sink of ocean-eddy energy near western boundaries. Nat. Geosci. 2010, 3, 608–612. [Google Scholar] [CrossRef]
  32. Li, Q.Y.; Sun, L.; Lin, S.F. GEM: A Dynamic Tracking Model for Mesoscale Eddies in the Ocean. Ocean. Sci. Discuss. 2016, 12, 1–27. [Google Scholar] [CrossRef] [Green Version]
  33. Cui, W.; Wang, W.; Zhang, J.; Yang, J. Multicore structures and the splitting and merging of eddies in global oceans from satellite altimeter data. Ocean. Sci. 2019, 15, 413–430. [Google Scholar] [CrossRef] [Green Version]
  34. Lumpkin, R. Global characteristics of coherent vortices from surface drifter trajectories. J. Geophys. Res. Ocean. 2016, 121, 1306–1321. [Google Scholar] [CrossRef] [Green Version]
  35. Overman, E.A. Evolution and merger of isolated vortex structures. Phys. Fluids 1982, 25, 1297–1305. [Google Scholar] [CrossRef]
  36. Dritschel, D.G.; Waugh, D.W. Quantification of the inelastic interaction of unequal vortices in two-dimensional vortex dynamics. Phys. Fluids A 1992, 4, 1737–1744. [Google Scholar] [CrossRef] [Green Version]
  37. Cotroneo, Y.; Aulicino, G.; Ruiz, S.; Pascual, A.; Budillon, G.; Fusco, G.; Tintoré, J. Glider and satellite high resolution monitoring of a mesoscale eddy in the algerian basin: Effects on the mixed layer depth and biochemistry. J. Mar. Syst. 2016, 162, 73–88. [Google Scholar] [CrossRef] [Green Version]
  38. Ma, C.; Guo, X.; Zhang, H.; Di, J.; Chen, G. An Investigation of the Influences of SWOT Sampling and Errors on Ocean Eddy Observation. Remote Sens. 2020, 12, 2682. [Google Scholar] [CrossRef]
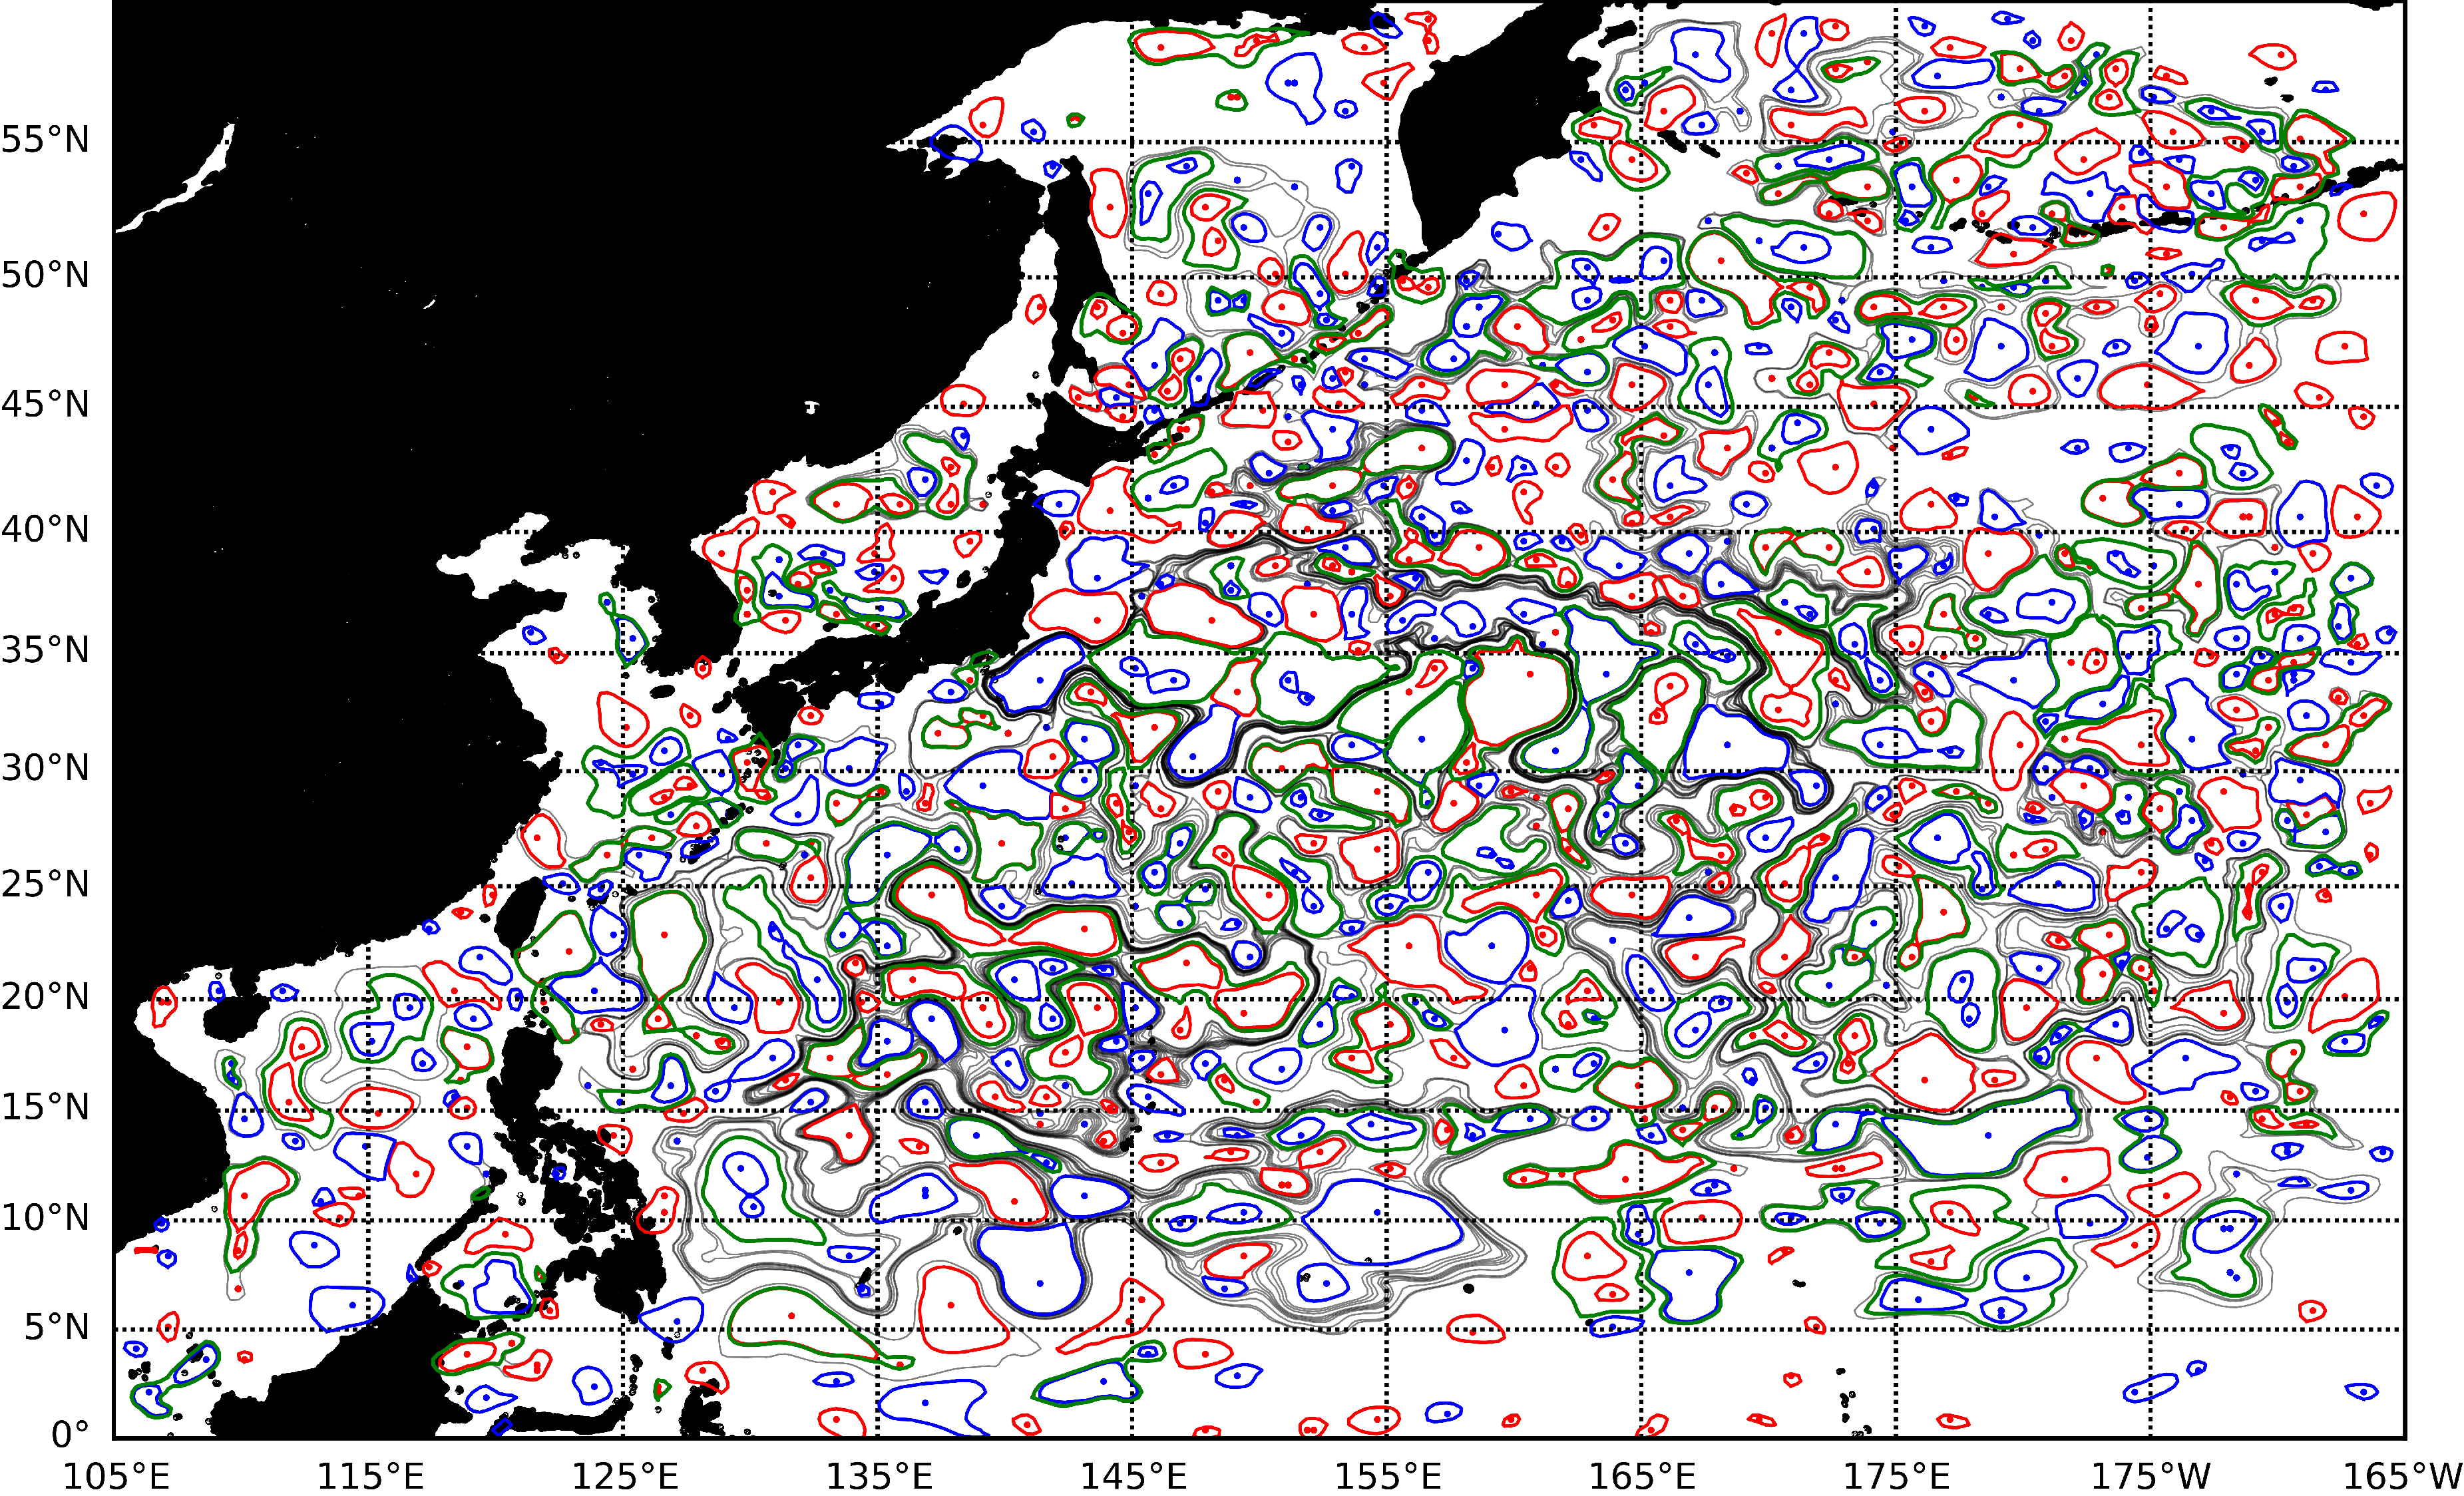
Figure 1. The daily eddytrees detected by our method, including eddies (mononuclear eddies, multicore eddies and eddy seeds) as the leaf nodes, eddygroups (green lines) whose children are all eddies and other eddygroups (black lines). Anticyclonic eddies and cyclonic eddies (except eddy seeds) are represented by red lines and blue lines, respectively, while eddy seeds and the eddy cores of anticyclonic eddies and cyclonic eddies are expressed by red dots and blue dots.
Remotesensing 13 03435 g001
Figure 2. (a) A diagram of an eddytree; (b) the structure of the eddytree corresponding to (a).
Remotesensing 13 03435 g002
Figure 3. A diagram illustrating a merging event of counterclockwise-rotating (black solid line with arrow) anticyclonic eddies in the Northern Hemisphere. (a) Eddy1 in eddygroup1 and eddy2 in eddygroup2 approach each other; (b) eddy1 and eddy2 merge into the common eddygroup3; (c) eddy1 and eddy2 approach each other and eventually merge into eddy3 (a multicore eddy); (d) the local maxima points of eddy3 approach each other, eventually yielding a local maximum point. The eddy cores are represented by black dots.
Remotesensing 13 03435 g003
Figure 4. The four types of segments considered in this paper, where the eddies on day i and day i + 1 are expressed by the gray and red circles, respectively, while the common eddygroups on day i and day i + 1 are represented by the black dashed line and red dashed line, respectively: (a) live segment consisting of the eddies with live relationships in two adjacent time steps; (b) dead segment consisting of an eddy that is dead in the next time step; (c) split segment consisting of the eddies with split relationships in two adjacent time steps; (d) merged segment consisting of the eddies with merged relationships in two adjacent time steps.
Remotesensing 13 03435 g004
Figure 5. A diagram of a nonlinear Eddy-DAG consisting of splitting or merging branches with segments as the basic units.
Remotesensing 13 03435 g005
Figure 6. The workflow of tracking for a daily segment.
Remotesensing 13 03435 g006
Figure 7. A diagram depicting area overlap ratio, where r2 ≥ 2/3 and r3 ≥ 2/3.
Remotesensing 13 03435 g007
Figure 8. A diagram of tracking for a branch, where the state of the eddy branch on the last day (dark gray circle) of its life is split, merged or dead.
Remotesensing 13 03435 g008
Figure 9. A diagram of constructing a nonlinear Eddy-DAG. The branches with a merging relationship are taken as an example, where the merging relationship among eddy branches (branch1, branch2 and branch3) is established by the segment, taking the eddies on the last day of the lives of branch1 and branch2 as the sources and the eddy on the first day of the life of branch3 as the sink.
Remotesensing 13 03435 g009
Figure 10. A splitting event of a cyclonic eddy detected by our algorithm. Mononuclear eddies/multicore eddies and eddygroups are blue lines and black lines, respectively, while the eddy cores of mononuclear eddies/multicore eddies and eddy seeds are black dots.
Remotesensing 13 03435 g010
Figure 11. A merging event of anticyclonic eddies detected by our algorithm. Mononuclear eddies/multicore eddies and eddygroups are represented by red lines and black lines, respectively, while the eddy cores of mononuclear eddies/multicore eddies and eddy seeds are expressed by black dots.
Remotesensing 13 03435 g011
Figure 12. The census statistics of the numbers of typical eddy splitting and merging events in each 1° × 1° region over the 27-year period (January 1993–December 2019) in the Northwest Pacific (105°E–165°W, 0°N–60°N). AM, CM, AS and CS denote the typical merging events and splitting events of anticyclonic eddies and cyclonic eddies.
Remotesensing 13 03435 g012
Figure 13. The temporal normalization of eddy merging and splitting events: in which (a,b) represent the source eddy/eddies and sink eddy/eddies of a merging event and a splitting event, respectively, being projected into different time periods.
Remotesensing 13 03435 g013
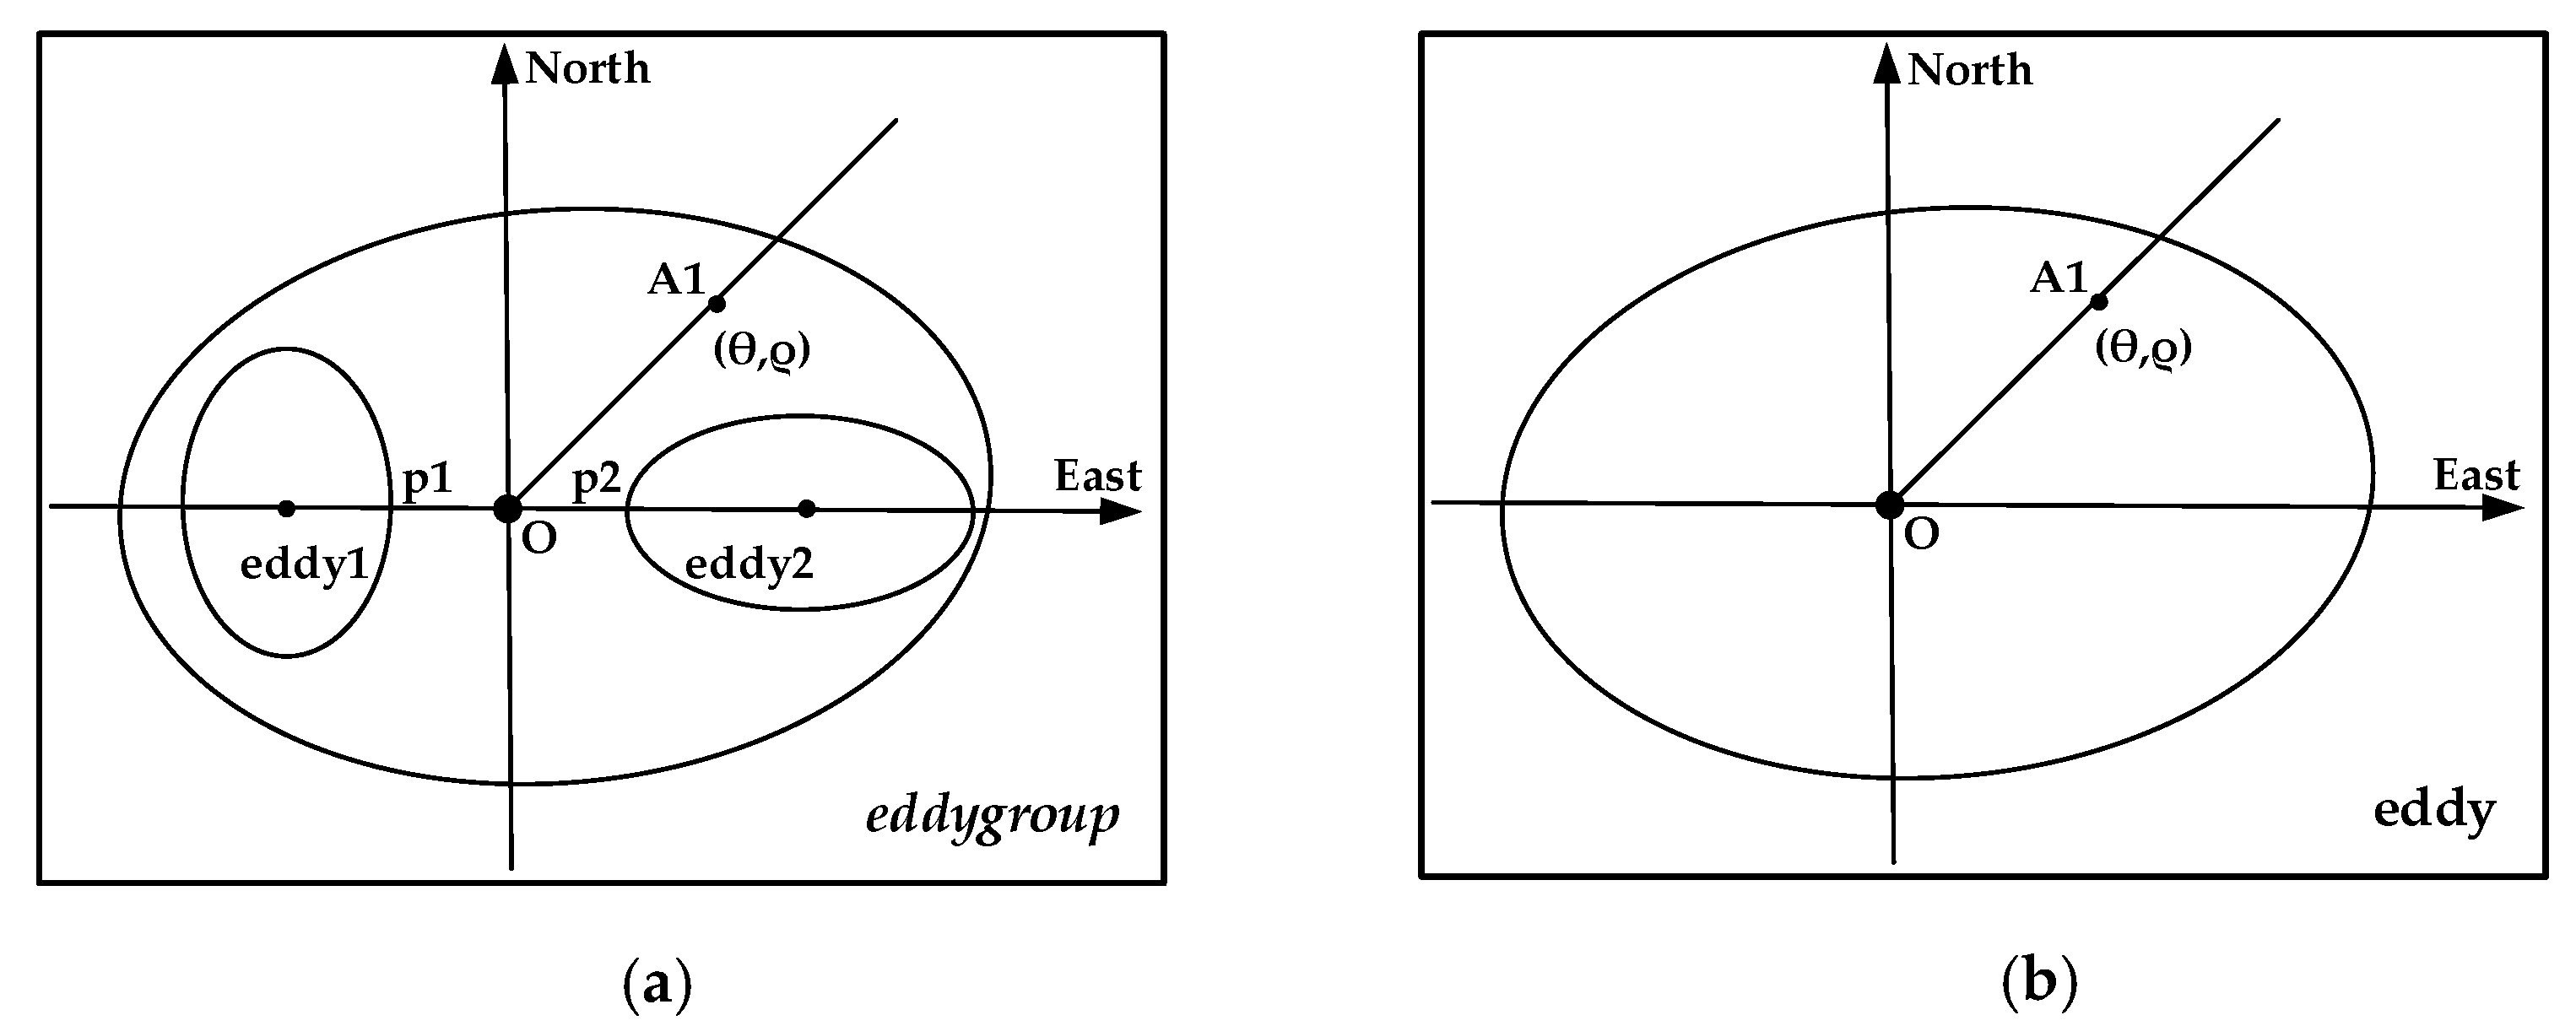
Figure 14. The spatial normalization of an eddygroup and eddy, where (a,b) are simplified representations of the eddygroup and eddy coordinate systems, respectively. In the eddygroup coordinate system (a), the x-axis is determined by the eddy cores of eddy1 and eddy2 and points eastward. The coordinate center O is the midpoint between p1 and p2, which are the intersections of the boundaries of eddy1 and eddy2 with the x-axis. In the eddy coordinate system (b), the coordinate center O is the eddy core and the positive direction of the y-axis points north. Any point A1 in the coordinate system used for normalization will be found in both the eddygroup and the eddy according to (θ,ρ).
Remotesensing 13 03435 g014
Figure 15. The SSTA composite averages of anticyclonic eddy during the splitting and merging over the 24-year period (January 1996–December 2019), where (a,b) represent eddy splitting process and eddy merging process, respectively. The top panel and the bottom panel represent the source branch and sink branch of the event, respectively, for both Figure 15a,b. Moreover, T is the day of splitting or merging.
Remotesensing 13 03435 g015
Figure 16. The SSTA composite averages of cyclonic eddy during the splitting and merging over the 24-year period (January 1996–December 2019), where (a,b) present eddy splitting process and eddy merging process, respectively. The top panel and the bottom panel represent the source branch and sink branch of the event, respectively, for both Figure 16a,b. Moreover, T is the day of splitting or merging.
Remotesensing 13 03435 g016
Figure 17. A comparison of the trajectories of a cyclonic eddy merging event detected by our algorithm with the trajectories of loopers in Lagrangian trajectories (a) and drifters (b). The loopers complete at least two drifter orbits in Lagrangian trajectories. Eddy1 (red solid line) and eddy2 (blue solid line) during 20100530–20100927 approach one another and eventually merge into eddy3 (orange solid line) in the event trajectories detected by our algorithm. The trajectories of drifters in (a) are the loopers in Lagrangian trajectories, while the trajectories of drifters in (b) are complete trajectories of drifters during this merging event detected by our algorithm EddyGraph. The black dashed line corresponds to the time period (20100728–20100808) in which the signal of drifter 81801 was lost. To express the changes in the shapes of eddies more clearly, the boundaries of each eddy in the middle of its life are shown here in seven-day intervals.
Remotesensing 13 03435 g017
Table 1. The numbers of branches and Eddy-DAGs of anticyclonic and cyclonic eddies during January 1993–December 2019 in the Northwest Pacific Ocean (105°E–165°W, 0°N–60°N).
Anticyclonic EddyCyclonic EddyTotal
Branches497,339526,3741,023,713
Eddy-DAG190,594204,713395,307
Nonlinear Eddy-DAG490,34541,86103,220
Linear Eddy-DAG141,560150,527292,087
Splitting event72,22474,198146,422
Merging event98,157104,124202,281
Table 2. The numbers of typical anticyclonic/cyclonic eddy splitting/merging events used for the eddy-induced SSTA composite analysis during January 1996–December 2019.
Anticyclonic Eddy Splitting EventAnticyclonic Eddy Merging EventCyclonic Eddy Splitting EventCyclonic Eddy Merging Event
5500423145843945
Publisher’s Note: MDPI stays neutral with regard to jurisdictional claims in published maps and institutional affiliations.