Review

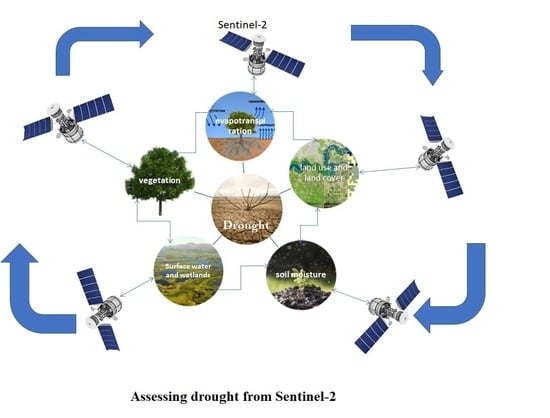
Reviewing the Potential of Sentinel-2 in Assessing the Drought

by
Dani Varghese
*,
Mirjana Radulović
,
Stefanija Stojković
and
Vladimir Crnojević
BioSense Institute, University of Novi Sad, 21000 Novi Sad, Serbia
*
Author to whom correspondence should be addressed.
These authors contributed equally to this work.
Remote Sens. 2021, 13(17), 3355; https://doi.org/10.3390/rs13173355
Submission received: 8 June 2021 / Revised: 10 August 2021 / Accepted: 17 August 2021 / Published: 24 August 2021
(This article belongs to the Special Issue Drought Monitoring Using Satellite Remote Sensing)

Abstract

:
This paper systematically reviews the potential of the Sentinel-2 (A and B) in assessing drought. Research findings, including the IPCC reports, highlighted the increasing trend in drought over the decades and the need for a better understanding and assessment of this phenomenon. Continuous monitoring of the Earth’s surface is an efficient method for predicting and identifying the early warnings of drought, which enables us to prepare and plan the mitigation procedures. Considering the spatial, temporal, and spectral characteristics, the freely available Sentinel-2 data products are a promising option in this area of research, compared to Landsat and MODIS. This paper evaluates the recent developments in this field induced by the launch of Sentinel-2, as well as the comparison with other existing data products. The objective of this paper is to evaluate the potential of Sentinel-2 in assessing drought through vegetation characteristics, soil moisture, evapotranspiration, surface water including wetland, and land use and land cover analysis. Furthermore, this review also addresses and compares various data fusion methods and downscaling methods applied to Sentinel-2 for retrieving the major bio-geophysical variables used in the analysis of drought. Additionally, the limitations of Sentinel-2 in its direct applicability to drought studies are also evaluated.

Graphical Abstract

1. Introduction

Although there is no unique definition of drought [1], the term is generally used to refer to a situation or period related to a deficiency of water for a prolonged time where the amount of rainfall is less than the potential evapotranspiration [2]. Drought occurs in both high and low rainfall regions [1]. Its severity and duration are mainly determined by the amount of recorded precipitation, the level of potential evapotranspiration, and the spatial distribution of soil types and vegetation characteristics [3]. Drought in its nature can be meteorological [4], agricultural [5], hydrological [6], or socio-economic [7,8].
Climate change and global warming have intensified the severity and frequency of drought, especially the meteorological drought, by increasing the land surface temperature and evapotranspiration and negatively influencing the precipitation [9]. Irrespective of its classification droughts are interconnected, and one triggers another. For example, the occurrence of meteorological drought often leads to agricultural and hydrological drought [10]. It is highly essential to develop a framework for the prediction and identification of its early warnings [11,12,13]. The volume of research in this field shows the capability of satellite-derived information in monitoring, quantifying, modeling, and predicting the drought [14,15]. In general, drought-related studies are mainly focused on two aspects. The first aspect is treating it as a natural disaster [16], identifying the major hotspots [17], and evaluating their negative impacts on the natural and human ecosystem [18,19]. The second aspect gives more importance to resilience and mitigation methods to eradicate or minimize its impact [20,21].
Drought is slow to emerge and recede, hence monitoring and quantifying this event is more complex and challenging [22,23,24]. Initially, the severity and the magnitude are measured based on six physical indicators such as the Palmer Drought Severity Index (PDSI), the CPC Soil Moisture Model, the Daily Streamflow Percentiles, the Percent of Normal Precipitation, the Standardized Precipitation Index [25], and the Satellite-based Vegetation Health Index [26]. Droughts can be very destructive and they are considered the costliest of all-natural events [27] and ranked top among all other natural hazards based on the gravity of their impacts on socio-economic conditions, human life, and spatial coverage [28]. Hence, to monitor and quantify the drought, an advanced mechanism is required to measure the intensity, duration [29], and spatial coverage [30].
According to the IPCC’s Fifth Assessment Report, southern Europe would experience severe and longer meteorological droughts, a similar observation as that made by Chen et al. 2019 [31] for the 21st century where the hydrological droughts may become more severe as a result of increasing evapotranspiration. Agricultural drought puts stress on food production which can cause the onset of other negative impacts on economic, environmental, and social aspects. A large number of methods have been developed over the past few decades for studying agricultural drought based on precipitation, soil moisture, temperature, vegetation index, and other indicators [32,33,34].
Advancements in remote sensing techniques have paved the way for new developments in drought research [35,36]. For the last few decades, there was a substantial improvement in spatial, temporal, and spectral resolutions in satellite data [37]. The Sentinel-2 can efficiently monitor and estimate the drought-driven land surface changes [38]. The Satellite-derived Perpendicular Drought Index (PDI) can be widely applied in drought analysis [39,40]. Similarly, Sentinel-2 derived PDI was validated with the precipitation anomaly index to assess the drought conditions in the western part of Texas in the year 2017 [31]. A statistically significant negative correlation was observed between PDI and the precipitation anomaly index.
Data fusion methods have overcome the Sentinel-2 thermal band limitation, especially the absence of thermal band limits and its direct applicability on drought to an extent. It was observed that Sentinel-2 data fusion occurred mainly in estimating the drought indicators using the surface energy balance model. In drought-related research, Sentinel-2 has been mainly fused with Landsat-8 [41,42,43,44] and Sentinel series (1&3) [45,46,47,48]. In a comparative approach with Landsat-8, Sentinel-2 was applied to evaluate the vegetation’s response to varying soil moistures in extreme drought conditions. The Normalized Difference Vegetation Index (NDVI) derived from Sentinel-2 (10 m) and Landsat-8 (30 m) correlated with soil moisture from five different locations at varying depths. Sentinel-2 outperformed Landsat-8 and showed a significant correlation with soil moisture (<30 cm depth). However, a poor correlation was observed over less vegetated areas. The researchers suggest that a minimum of 30–40% of vegetation cover is required for a better correlation [49].
Remotely sensed bio-geophysical variables provide an ample amount of information in assessing the drought. Absorbed Photosynthetically Active Radiation (FAPAR) is one of such variables and a key quantity in carbon cycle estimation [50,51]. Precipitation, evapotranspiration, and land surface temperature are the key components of drought [52]. To an extent, their variation and influence on physical components of the environment can be measured through various indices such as the normalized difference drought index, the normalized multi-band drought index [53], and the normalized difference water index (NDWI) [54]. Sentinel-2 data was used to delineate the impacts of hydrological drought that happened over Germany in 2018 at a national level. A convolutional neural network-based automated processing chain was applied for extracting the water bodies. Despite varying land and atmospheric conditions, the adopted method produced an overall high accuracy (≥0.95) and Kappa Coefficient (≥0.89). The variations in water extent mapped and a time series map is produced from the changes delineated between 2017 and 2018 data [55].
This paper focuses on reviewing the potential of Sentinel-2 in assessing drought through vegetation characteristics, soil moisture, evapotranspiration, surface water including wetland, and land use and land cover changes. Therefore, the present paper is categorized into four sections: introduction; properties of Sentinel-2; progress in remote sensing of drought from a climatological and ecological perspective (remote sensing of vegetation in drought, remote sensing of land use and land cover changes, remote sensing of evapotranspiration, remote sensing of soil moisture, remote sensing of surface water, and wetland analysis); summary and conclusion. To the best of our knowledge, this review paper will be the first of its kind in assessing the potential of Sentinel-2 in drought studies. The following Figure 1. Illustrates the methodological concept used in this review paper.

2. Properties of Sentinel-2

Compared to the available remote sensing data including Landsat and MODIS information, the introduction of Sentinel-2, the twin satellite with a higher spatial and temporal resolution, brought revolutionary changes in the field of remote sensing, especially in the observation of land-surface processes [56]. The sentinel-2 mission includes two identical satellites Sentinel-2A and Sentinel-2B. Sentinel-2A was released in November 2015 and Sentinel-2B in March 2017, respectively. Although the MSI (Multi-Spectral Instrument) on both Sentinel-2A and 2B are designed identically, the measured spectral response function recorded a variation especially in B1, B2, B11, and more than 1% for NDVI [57]. Sentinel-2 has a wide range of applications and is generally used for land monitoring, maritime monitoring, emergency management, and security. The spatial resolution of Sentinel-2 varies from 10 m to 60 m and the radiometric resolution of MSI is 12 bit with a combined revisiting time of 5 days. Detailed band information with the associated signal-to-noise ratio is shown in Table 1.

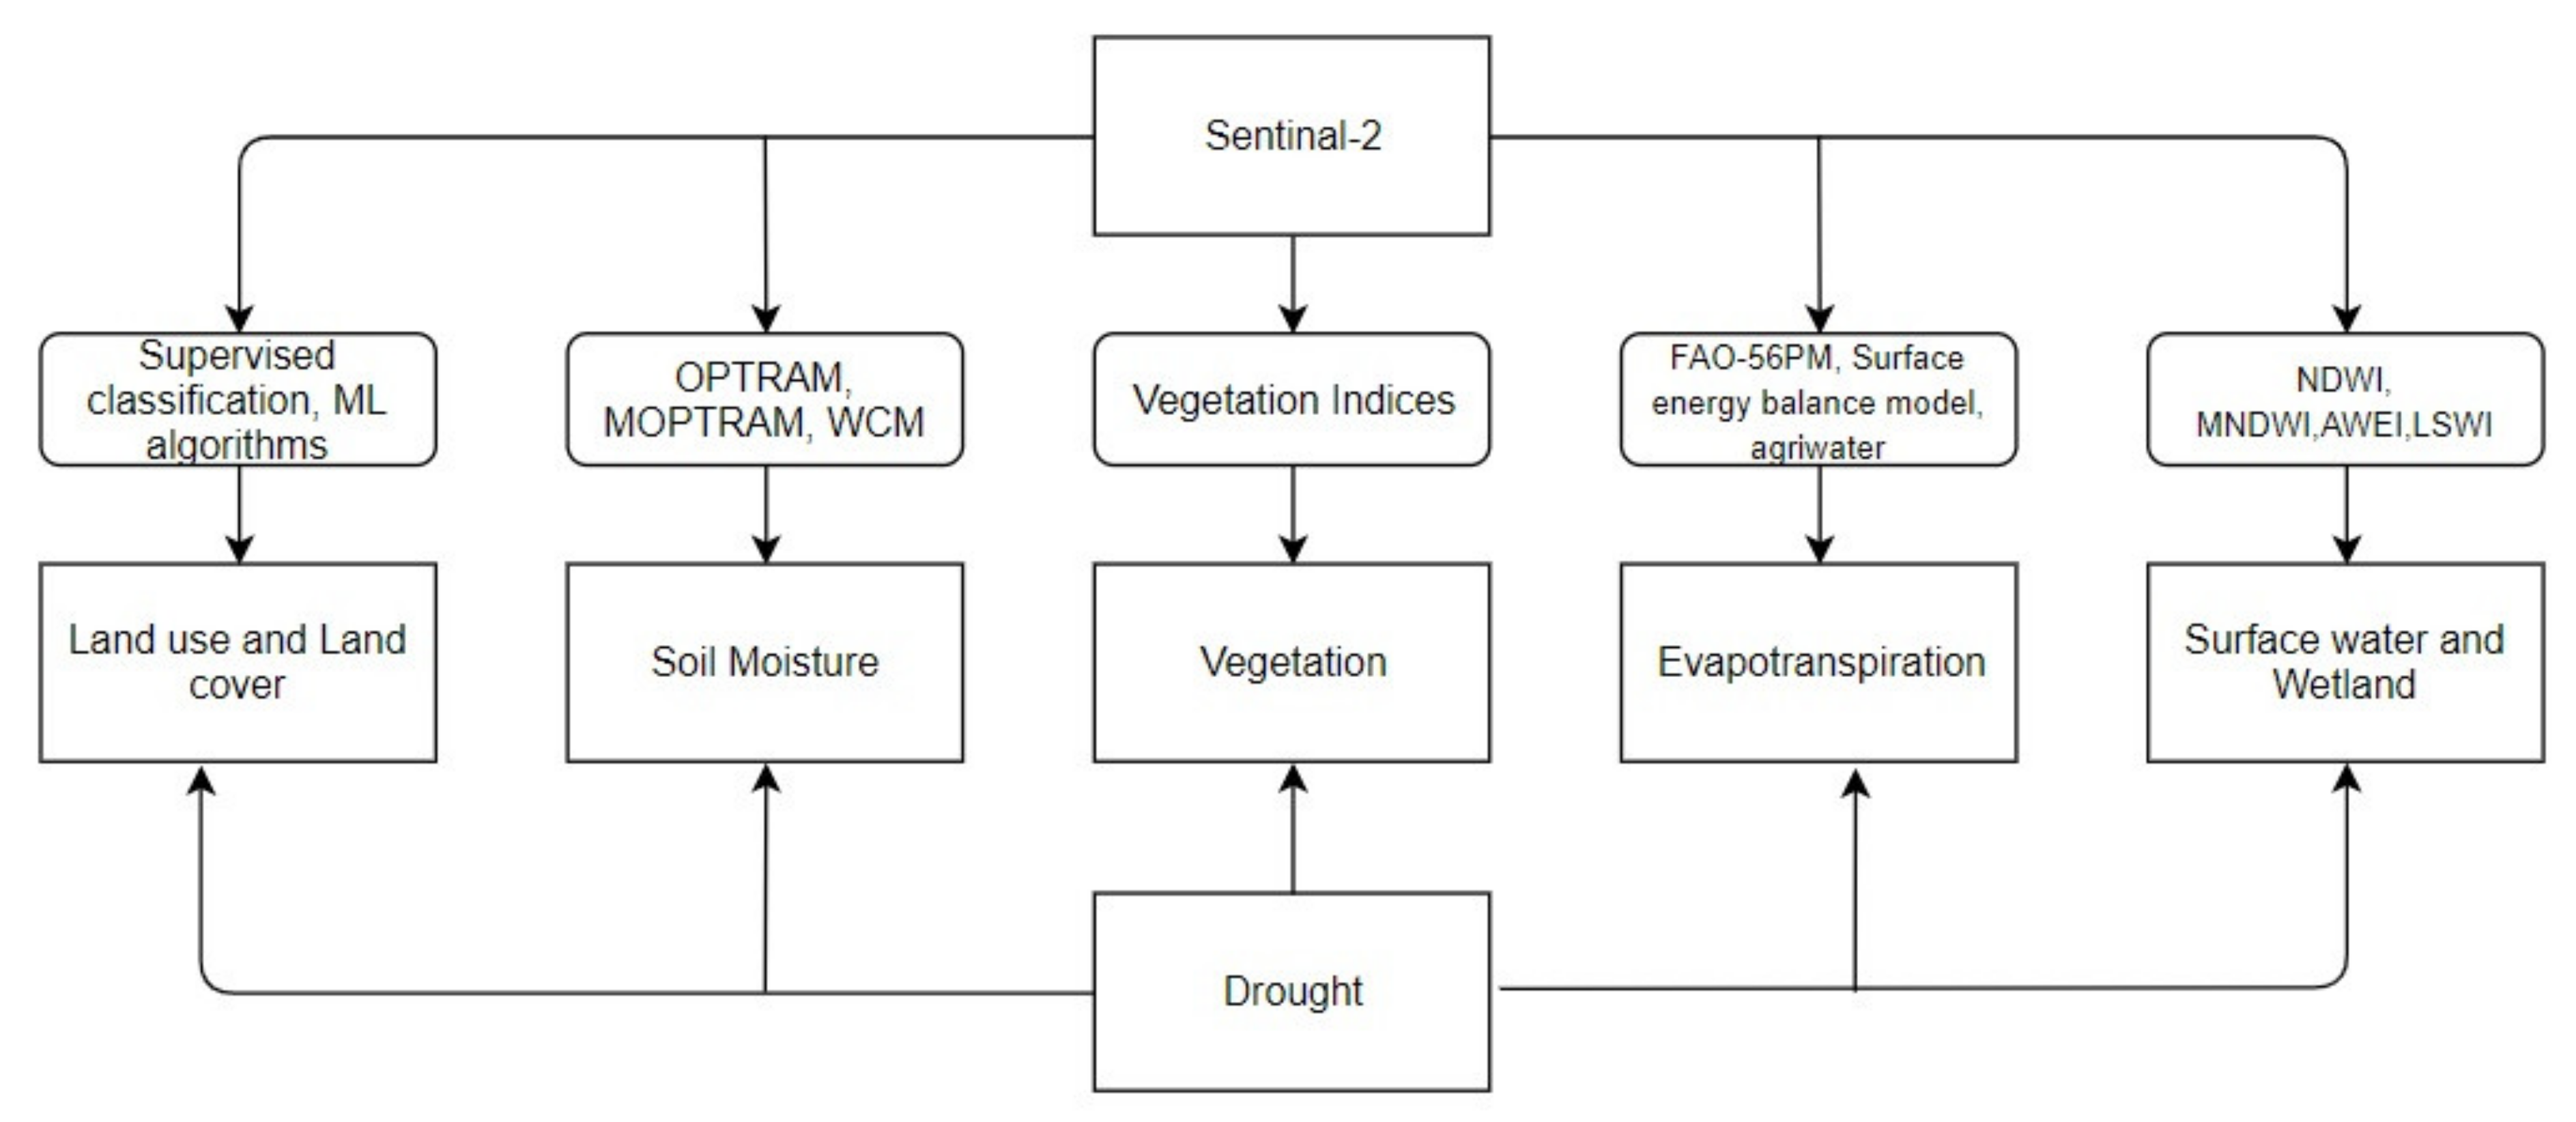
3. Progress in Remote Sensing of Drought from a Climatological and Ecological Perspective

In this section, identification and assessment of drought will be described through analyzing changes in different climatological and ecological variables.

3.1. Remote Sensing of Vegetation in Drought

Vegetation, Earth’s thermometer: the imprints of drought can be read from the vegetation condition [58,59]. As the vegetation is directly connected with drought [60], its health, and changes in distribution pattern are primarily analyzed [61,62]. The vegetation indices are generated from the different band combinations, especially the red and near-infrared, and the NDVI is a fabled index applied extensively in analyzing the response of vegetation to drought.
The Harmonized Landsat-8 and Sentinel-2 (HLS) is a NASA project which aimed to provide daily surface reflectance data generated from the Landsat-8 and Sentinel-2. HLS is widely used for vegetation monitoring, phenology, crop monitoring, and drought-related analysis [63,64]. A combined radar-optical approach was applied to monitor the drought condition in the savanna region. In this approach, Sentinel-2 and Landsat-8 derived phenological information and integrated it with the Sentinel-1 derived soil moisture data. The derived normalized difference vegetation condition and canopy height model was used to measure the vegetation type structure and dynamics concerning the surface soil moisture index [65]. It is essential to monitor the phenological characteristics of vegetation to address the changes in the ecosystem due to climate change. Using a multi-sensor land surface phenology (MS-LSP) algorithm, a thirty-meter continental-scale land surface phenology data was produced from the HLS data [66].
Along with data continuity, the fusion of Sentinel-2 and Landsat-8 provides a greater possibility for monitoring the land surface and cover changes, particularly in drought analysis. The extended super-resolution convolutional neural network (ESRCNN), a deep learning data fusion algorithm used for fusing Sentinel-2 and Landsat-8, can generate 10 m data [67]. In terms of quantitative assessment, data derived from the ESRCNN method outperform the existing area-to-point regression kriging (ATKPK) method. Apart from the normal two data fusion method, Nguyen et al. [68] fused Sentinel-2 along with Landsat-7 and 8 in the Google Earth engine cloud platform and produced a surface reflectance output of 30 m image pre-processing techniques including bidirectional reflectance distribution function correction, topographic correction, and band adjustments. The resultant information efficiently measured the seasonal vegetation characteristics in the drought-prone areas of Vietnam and Lebanon. However, the level of accuracy may be subject to varying topographical conditions.
As the susceptibility ratio of vegetation to drought varies, hence it is essential to classify the vegetation to evaluate the impacts of drought. The random forest method was applied to resampled Sentinel-2 data to estimate the Mediterranean forest types and their major phytocoenosis and seasonal phenological characteristics [69]. Similarly, the potential of the Sentinel-2 derived vegetation indices namely NDVI, Carotenoid Reflectance Index, Anthocyanin Reflectance Index, Red-Green Ratio, Normalized Difference Infrared Index, Short Wave Infrared Ratio, Plant Senescence Reflectance Index, and Soil Adjusted Total Vegetation Index was assessed in extracting the grassland and savanna vegetation states of the North American transect. Hyperion hyperspectral data were used to simulate Sentinel-2, and MODIS data and the Visible Infrared Imaging Radiometer Suite were used for the field validation [70].
Drylands are one of the most climatologically vulnerable areas, which are characterized by varying rainfall conditions with a high level of evapotranspiration. Hence it is essential to monitor and estimate the spatial-temporal vegetation characteristics in the dryland ecosystem. The potentiality of HLS has been assessed in delineating the dryland phenology characteristics. In a novel approach, spectral information was derived from the Sentinel-2 MSI (Multispectral Instrument) and Landsat OLI (Operational Land Imager) using the regression tree model. In several cases, the information derived from the data fusion methods outperformed the single sensor information derived from MODIS and Landsat [71]. Vegetation phenology has a vital role in analyzing the impact of climate change and drought analysis. Since the inception of Sentinel-2, there has been a substantial increase in research towards this direction [72].
For a regional and field level, a high-spatial time series of information is required for continuously monitoring the seasonal variations in drought analysis. The vegetation temperature condition index (VTCI) is a proven index used for estimating drought [73].VTCI derived from Sentinel-2 and MODIS fusion using Enhanced Spatial and Temporal Adaptive Reflectance Fusion Model (ESTARFM) correlated with cumulative precipitation to assess the drought conditions in Guanzhong Plain of China [74]. Sentinel-2 derived NDVI, fraction canopy cover, leaf area index, canopy water content used to disaggregate MODIS land surface temperature [75]. Vegetation response to drought estimated through Spatio-temporal analysis of NDVI, changes in NDVI values before and during drought period used to quantify the intensity of drought. Following Figure 2 represents the variations of Sentinel-2 derived NDVI before and during the drought in Novi Sad and the neighboring region. The image on the left represents March 2017 and the on the right represents July 2017.

3.1.1. Leaf Area Index

The leaf area index (LAI) is a major biophysical variable used to assess the vegetation response to drought [76]. The higher spatial and revisiting characteristics of Sentinel-2 ensure data continuity in analyzing the LAI. Korhonen et al. [77] compared the efficiency of the Sentinel-2A red-edge band with Landsat-8 OLI data in estimating the forest canopy cover, effective canopy cover, and LAI. Lidar and field data were also assessed to derive the forest canopy cover, effective canopy cover, and LAI, and generalized additive models were applied to relate with spectral indices. The research concluded that compared to Landsat-8, Sentinel-2 red-edge band-derived results had marginally better accuracy. However, a negligible difference was registered while computing conventional vegetation indices. Similarly, Sentinel-2 and Landsat-8 were compared for estimating the LAI in the temperate, deciduous broadleaf forests. Field data were collected and linear and multilinear regression models were applied to establish the statistical relation of the derived information. The comparative analysis concluded that except for a marginal difference, the Sentinel-2 (RMSE 0.879) is not superlative to the Landsat-8 OLI (RMSE 0.877) in estimating the LAI of the European broadleaf forest. However, the Sentinel-2 provides better data continuity compared to the Landsat system [78]. Sentinel-2 has been assessed in relation to the estimation of canopy biophysical properties by correlating the PARS model-derived bidirectional reflectance factors along with Sentinel-2 over 962 reference plots. Research highlights a higher correlation in simulated Sentinel-2 bidirectional reflectance factors and the fraction of absorbed photosynthetically active radiation, moreover, band 8 and 4 combinations are highly effective in leaf area estimation [79]. The accuracy of the HLS data was evaluated in crop biomass estimation. LAI derived from MSI and OLI sensors were coupled with a simple soil–water balance model (SAFYE) for estimating the biomass estimation. The derived LAI was calibrated with the measured field LAI. Sentinel-2 derived red-edge band-based LAI exhibits a higher level of accuracy than the near-infrared band-based Landsat data in leaf dry biomass estimation [80]. The potential of Sentinel-2 was assessed in estimating the heatwaves in vinicultural regions of Australia. The nearest neighbor algorithm was applied to downscale the world view to the Sentinel scale and calculated the NDVI. The Pearson’s correlation and Bland–Altman concordance tests were conducted. The red-edge and enhanced vegetation index registered a positive correlation and found reliable vegetation indices to evaluate the heatwave condition on crops [81].

3.1.2. Canopy Water Content

The canopy water content is defined as the volume of water per unit of ground area [82], a major biophysical parameter in drought monitoring [83]. The cropland canopy water content is one of the key factors in estimating agricultural drought. Satellite-based remote sensing techniques can precisely measure the variations in canopy water level at regional and field levels [84]. During the Californian drought, more than 30% of canopy water loss was estimated over 1 million ha forest [85]. Boren et al. [86] proposed a novel radiative transfer inversion model for the cropland canopy water content estimation from the HLS data, minimally constrained inversion and partially constrained inversion techniques were also applied. The derived cropland canopy water content is validated with the field data and the researchers highlighted the potentiality of the HLS data and Sentinel-2 in particular for estimating the cropland canopy water content. Water stress is considered as an early warning of drought which can be identified by closely observing the vegetation characteristics. In the 2019 summer, Marusig et al. [87] studied the drought-induced forest fall-off in the karst plateau. To evaluate the possible drought-induced dehydration and hydraulic failure, Marusig et al. [87] statistically correlated the Sentinel-2 derived (NDVI and NDVI 8A, NDWI), and soil-adjusted vegetation index (SAVI) with filed measured physiological parameters such as absolute water content (AbWC), relative water content (RWC), and minimum water potential (Ψmin). Among other vegetation indices, only NDWI has a significant correlation with physiological parameters and the research concludes the capabilities of NDWI as a proxy for water stress analysis. The water stress condition over the deciduous specious during the summer dry spell was assessed using Sentinel-2 images [88]. The study underlined the importance of high spatial information obtained from the Sentinel-2 such as the moisture stress index, chlorophyll index, and simple ratio vegetation index which improved the quality of the drought assessment studies in fragile ecological regions. Sentinel-2 data was used to analyze the 2017 post-summer Mediterranean forest health conditions in contextual drought and heatwaves. Sentinel-2 derived NDVI is compared with the in situ and meteorological data for the forest damage assessment. The Mannerucci and Raunkiaer methods were applied to assess the vegetation response to climatic events. It was observed that the NDVI declined, compared to the pre-event NDVI values [89]. Lin et al. [90] assess the potential of the Sentinel-2 red-edge band in a gross primary productivity (GPP) estimation. Eight vegetation indices were derived from the Sentinel-2, out of which three indices are non-red edge-based. Sentinel-2 derived GPP compared with MODIS derived light-use efficiency (LUE)-based GPP data, and tower-based incident photosynthetic active radiation, carbon flux data. The research concluded that the GPP produced from the red-edge chlorophyll index coupled with incident photosynthetic active radiation (PARin) outperformed other vegetation indices and had a higher correlation with the tower-based GPP (GPPEC). To quantify the severity of drought impacts on the forest by assessing the variations in photosynthetic activities, in 2017 Puletti et al. [91] compared 118 observational summer sample data with Sentinel-2 derived vegetation indices such as the NDVI, the Red edge Normalized Difference vegetation Index, and the Simple Ration Index. The observational areas are from typical Mediterranean forest environments in Italy, two broadleaf, and one evergreen forest. The research result claims Sentinel-2 derived vegetation index results are statistically best fitted with observational results.

3.1.3. Leaf Chlorophyll Content

The leaf chlorophyll content is inversely proportionate to the intensity of the drought, the variation in leaf chlorophyll content is assessed to analyze the intensity and impact of drought-induced vegetation stress [92]. Satellite information coupled with radiative models, such as the PROSPECT model [93], was mainly used for assessing the chlorophyll content [75]. The spectral properties of Sentinel-2 can efficiently estimate the seasonal variation in leaf chlorophyll content [94,95]. The leaf chlorophyll content was estimated from the temperate forest using the invertible forest reflectance model, a radiative transfer-based model. The derived leaf chlorophyll content was validated and statistically correlated with the field measured leaf chlorophyll content using CCM-300 and wet laboratory analysis. It was observed that the spectral properties of Sentinel-2 outperformed the spatial capabilities of the RapidEye in the leaf chlorophyll content estimation [96]. Similarly, an inversive invertible forest reflectance model based on the forest light interaction model was applied to estimate the needle chlorophyll (Ca+b) of the coniferous forest. Ca+b derived from airborne hyperspectral images and field data were used for validating Sentinel-2, the red-edge-based chlorophyll index outperformed other indices. The object-based Niblack’s thresholding and Sauvola’s binarization techniques were applied to vegetation segmentation in hyperspectral data. The derived Ca+b registered a linear relationship with the inversion model and a nonlinear relationship with the indices [97]. Compared to other onboard bands of Sentinel-2, several studies highlighted the efficiency of the red-edge band in estimating the biophysical parameters, especially in leaf chlorophyll content [98]. Similarly, Gholizadeh et al. [99] modeled the Red-Edge Position (REP) for the forest canopy reflectance and transmittance using the simulated Sentinel-2, HyMap, and resampled radiative transfer modeling. The REP was calculated from Polynomial Fitting (PF), Linear Extrapolation (LE), and 4-Point Linear Interpolation (4PLI) methods and its optimized version of Sentinel-2 and HyMap. The researchers conclude that the REP derived from 4PLI methods outperforms other methods and can efficiently estimate the canopy chlorophyll (Chl × LAI).

3.2. Remote Sensing of Land Use and Land Cover Change in Drought

Drought is one of the major land surface altering agents, its intensity and rate of land surface conversion varies and depends on several factors such as anthropological activities, climatological conditions, and geographical characteristics. Spatio-temporal analysis of land use and land cover will depict the drought-driven land surface changes. With the higher spatial resolution revisiting capabilities, Sentinel-2 can efficiently monitor the changes in land use and land cover [100]. Compared to single sensor information, the land use and land cover estimated from the multi-sensor (Sentinel-1 and 2) using the random forest wrapper approach increased the overall accuracy in the cloud-prone region [101]. Foremost classifiers such as the Random Forest (RF), k-Nearest Neighbor (kNN), and Support Vector Machine (SVM) were compared in classifying land use and land cover from Sentinel-2. It was observed that when the training class is greater than 0.25% of the total study area, the three classifiers recorded a similar and overall higher accuracy (>93.85%). Among other bands, the peculiarities of the Sentinel-2 red-edge band were evaluated in land use and land cover analysis [102]. The random forest, stochastic gradient boosting, and support vector machine methods were applied to HLS data for delineating the land use and land cover changes. The research concluded that the Sentinel-2 red-edge band-derived classification outperformed the results produced from Landsat-8 as well as other bands of Sentinel-2 (5% and 4% respectively) [103]. For a better understanding of drought-driven land cover changes, Eskandari et al. [104] produced 10 m land cover and tree cover data from combining Sentinel-2 with Google Earth information and field data. The reliability of the Google Earth information was assessed with field data and Sentinel-2 treated with a supervised classification algorithm including the minimum distance, Mahalanobis distance, neural network, and support vector machine algorithm. The SVM outperformed other algorithms with an overall accuracy of 81.33% and a kappa index of 0.76. Sentinel-2 data was computed in the Google Earth engine platform for classifying the fallow land from one of the world’s largest dryland regions, the Sahel [105]. Initial reference data produced from the Knowledge Analysis based unsupervised classification techniques used as an input in the random forest classifier for producing the second level enhanced reference data. Finally, the enhanced reference data used in the random classifier was applied to map the 10 m fallow land and cropland of the Sahel region. Spatiotemporal analysis of biocrust and vascular plant cover over the rainfall gradient region of the Negev Desert was assessed using the Sentinel-2. The continuum removal method was applied to the hyperspectral data acquired from the headwall spectrometer to estimate the chlorophyll content information derived from Sentinel-2 [106]. Two indices were proposed, namely the biocrust greenness index and maximum vegetation development index. The proposed indices had satisfactory performance over the northern part of the Negev and poor performance in the south due to a shortage of precipitation and heavy dryness. Pixel R-CNN, a novel method based on recurrent and convolutional neural networks designed to estimate the land cover and crop classification from the Sentinel-2 data. The Pixel R-CNN results show considerable improvement with an overall accuracy of 96.5%, compared with the support vector machine, random forest, Kernel SVM, and gradient boosting machine models [107].

3.3. Remote Sensing of Evapotranspiration in Drought

Evapotranspiration (ET) is defined as the sum of the evaporation and transpiration from the vegetation. Advances in remote sensing technologies enable precise estimation of ET from global to field level under varying topographical conditions. This section focuses only on the ET from the land surface, observational methods, major techniques, and algorithms applied for estimating the ET using Sentinel-2 data and fusion methods. ET is one of the major components in the hydrologic budget and is considered equally with the precipitation in drought studies. In other words, drought can be defined as the imbalance between evaporation and precipitation, the rate of ET decides the intensity and the duration of drought. As the rate of ET has exceeded the precipitation level due to climate change-driven land surface temperature [108], the upcoming decades may record frequent and extreme droughts. Hence, regional and seasonal variations in ET are closely monitored to estimate the trend and amplitude of drought [109,110]. Advancements in satellite remote sensing techniques have provided new dimensions to the spatial and temporal estimation of ET [111,112].
The two prevalent approaches in which Sentinel-2 is used for estimating ET are the indirect and data fusion method. In the indirect method, the required biophysical parameters for computing the FAO-56 Penman-Montecito (FAO-56 PM) are derived from the Sentinel-2 using vegetation indices (VI). In the data fusion method, Sentinel-2 synergy with other satellite data (particularly thermal band) contemplates the latent heat flux using surface energy balance models [113,114]. Thermal disaggregated data fusion methods overcome the thermal band limitation of the Sentinel-2 [115].
The Penman-Monteith (FAO-56 PM) method is considered a standard protocol for calculating ET [116,117]. However, data availability [118] and the quality of input parameters [119] control its applicability to an extent and result in overestimation. The peculiarities of a Sentinel-2 driven VI in ET estimation is its ability to provide accurate vegetation phenology characteristics and a large number of available red-infrared region-based indices, including its red-edge band [120]. Sentinel-2 derived vegetation indices applied in the FAO-56(PM) improved the ET estimation. Sentinel-2 derived LAI and surface albedo coupled with the daily weather information was applied in the Penman-Monteith equation for calculating the field level potential crop evapotranspiration [121] in the Mediterranean region. The estimated result shows a better correlation with the actual crop evapotranspiration derived from the calibrated soil water balance model [122]. Hence, the satellite-derived biophysical variables became major constituents in the FAO-56(PM)-based computation of ET. Biophysical retrieval methods influence the level of accuracy. In a comparative analysis, LAI and the canopy chlorophyll content were retrieved from the Sentinel-2 using major vegetation indices, the CLAIR model, and the artificial neural network (ANN), and their statistical significance was recorded with the in situ data. The crop evapotranspiration generated from the ANN-based LAI and canopy chlorophyll content outperformed other methods with zero saturation [123]. The soil resistivity tomography records the soil wetness and distribution pattern within the irrigation interval. Sentinel-2 derived VI coupled with electrical resistivity tomography derived from surface geophysics information was applied in the dual crop coefficient (Kc) FAO-56 approach for the estimation of crop evapotranspiration from an underwater stress condition [124].
The crop coefficient (Kc), the major component of ET has been widely assessed from the satellite-based vegetation indices [125,126]. While assessing 22 Sentinel-2 derived vegetation indices, it was observed that compared to other regions of the electromagnetic spectrum, the indices calculated from the red-edge regions are more suitable for predicting the Kc [127]. ArcDualKc is an FAO-56Kc based approach implemented in the Geographical Information System (GIS) which facilitates Sentinel-2 in the spatial mapping of ET [128]. Considering the precision and needlessness of ground measurands, the forecasted data began to replace measured meteorological data [129] and was incorporated with Sentinel-2 VI for computing the ET [130]. Irrespective of its quality and predictability, the forecasted data are subjected to model errors. However, to minimize the uncertainty in the prediction of ET more research has to be conducted on treating forecasted meteorological data with VI information.
Data synergy from a similar satellite series may ensure data continuity, apart from that, thermal sharpening of Sentinel-3 using Sentinel-2 optical information [131] for a field-level estimation of ET is a complex procedure. However, several methods are available to serve the purpose, such as PBIM [132], SADFAT [133], TsHARP, and Data Mining Sharpening (DMS) [134,135]. Using Sentinel-2 information, the DSM method sharpened the Sentinel-3 thermal band to 20 m [136]. The proficiencies of sharpened thermal information in the computing field level ET were assessed with Priestley-Taylor’s two-source energy balance model (TSEB-PT), mapping ET with internalized calibration (METRIC), and end-member-based two-source approach (ESVEP). The TSEB-PT outperformed other methods with all-over accuracy and is suitable for varying land cover and climates [137]. The Priestly-Taylor equation is a modified form of the Penman equation, widely applied for estimating ET under water limiting conditions [138].
The Multi-Sensor Data Fusion approach (MSDF-ET) is a well-framed multi-data fusion approach, combined with the Priestly-Taylor equation to generate a robust time series of ET with a short interval from Sentinel-2, MODIS, and Landsat-8 [139]. Landsat-8 derived land surface temperature integrated with the TsHARP algorithm for downscaling the MODIS thermal band. The estimated ET from sharpened thermal information outperformed Landsat-8 output and shows a better correlation with ground-based measurements.
R package ‘agriwater’ was powered by the Simple Algorithm For ET Retrieving (SAFER) algorithm. The SAFER algorithm, earlier known as PM2 (based on Penman-Monteith equation) [140], was applied in a large-scale estimation of ET from diverse land surface wetness conditions. SAFER works on agrometeorological data that neither requires anchor pixels nor the thermal bands nor can integrate with weather data [141]. Hence, integrating Sentinel-2 with agriwater enables a precise estimation of ET which is beneficial in drought studies. Further, the model is designed for a daily scale rather than hourly and is subjected to uncertainties related to the quality, validity, and calibration of data. It was observed that NDVI is more reliable in estimating the irrigation demand rather than the FAO-56 dual crop coefficient estimations [142] and is closely related to the ET fraction [143]. Hence, the ET fraction is calculated from the Landsat-8 and Sentinel-2 applied in the Simplified Surface Energy Balance model for estimating ET. Though this approach could generate 10 m ET data, the level of bias is directly proportional to the level of vegetation.
Considering its wide applicability, the accuracy of the satellite-based ET estimation is directly associated with the accuracy of ground-based measuring methods [144]. Each method was developed to test the same phenomenon under different conditions and hypotheses using a variety of inputs derived from different mechanisms, hence it is difficult to point out the best single method [145]. Satellite-based ET retrieving methods are subjected to regional constraints such as varying climate and associated landscape changes.

3.4. Remote Sensing of Soil Moisture in Drought

As a key variable in regulating the Earth water cycle, surface soil moisture (SSM) has a significant role in detecting, monitoring, and predicting drought [146,147,148,149,150,151]. Soil moisture characteristics are directly associated with the weather conditions and geographical characteristics of an area [152,153]. Since it is crucial for plant growth, it is often used as an important parameter for detecting drought-induced vegetation stress [49,149,154,155,156]. The traditional method of soil moisture retrieval, such as the gravimetric method [157], was applied to a specific location, mostly on the small spatial resolution [158]. The importance of analyzing this parameter on a regional scale for more complex research ushered in a new era in soil moisture estimations using remote sensing techniques.
During the last decade, drought monitoring by using satellite images drastically increased [34,159,160]. The higher spectral and temporal resolution of satellite images is required for more precise and accurate results. Nowadays, with the availability of Sentinel 2 images, these requirements are achieved. As a drought indicator, soil moisture can be obtained from land surface model simulations or satellite estimates.
The most commonly used model is the OPtical TRApezoid Model (OPTRAM) which has been used for estimating soil moisture requiring only the optical remote sensing data. The estimation of the soil moisture is based on shortwave infrared transformed reflectance (STR)-NDVI trapezoidal space [146,161,162,163]. Sadeghi et al. [161] showed that in comparing estimated SSM from OPTRAM Sentinel-2 and TOTRAM Landsat-8, scientifically acceptable and comparable predictive accuracy was found. However, as the OPTRAM model does not require thermal data, it is advanced and applicable to use with optical data such as Sentinel-2 images. To improve derived results from this model, considering different sites of application, this study proposed to use the SWIR band in combination with the NIR band, as the SWIR reflectance is sensitive not just to the leaf water content but to the leafs internal structure [164]. Ambrosone,. et al. [146] applied two different model variations based on linear and nonlinear parameters validated with in situ soil water content measurements. This study showed that the nonlinear model gives a better correlation between in situ and estimated soil water content values and allows the OPTRAM model to be used for effective SSM mapping. Hassanpour et al. [163] implemented a modified OPTRAM model by introducing nonlinear edges to the VI-STR space. The MOPTRAM was used for estimating SSM and root zone soil moisture. With the validation of the OPTRAM and MOPTRAM models with ground truth volumetric soil moisture data of a maize field, this study concludes that the MOPTRAM gave accurate results when compared with those achieved from the OPTRAM model and the accuracy of surface soil moisture estimates in bare soil was better than the root zone soil moisture in relatively full vegetation cover.
For different model-based approaches, retrieving SSM data requires a fusion of the data. The fusion of Sentinel-1 and Sentinel-2 satellite data showed successful applications and accurate results whether in global or field-based SMM estimations [165,166,167,168,169]. There are several different machine learning or empirical-based approaches for this purpose: the Water cloud model [149,168,170,171], change detection method [65,169,172], ANN [149], cost function [173], and support vector regression [174].
A combination of the Water cloud model (WCM) and the integral equation model (IEM) or advanced IEM (AIEM) are often used to estimate SSM with high accuracy in different vegetated areas [170,175]. Comparing with OPTRAM, the Water cloud model requires both SAR and optical data to provide the possibility to derive SSM data. Using time-series Sentinel-1 C-band images with NDVI data derived from the optical Sentinel 2-data satellite, it is achievable to derive information about soil moisture in different areas using WCM [168,171,176].
Comparing with the models which require in situ data for calibration, method change detection can be used for SSM estimation without this requirement. To detect changes in backscattered signal observed on two consecutive dates of Sentinel-1, method change detection is often applied in research studies. It is based on the assumptions that the change in vegetation is small between two days and that the difference in backscattered signals depends on the change in SSM [177]. This method requires data such as NDVI from optical satellites, and Sentinel-2 provides that opportunity with high spatial and temporal resolution. According to Gao et al. [172], the change detection method enables the global application for SSM detection and can be applied to any vegetation area where the images from Sentinel-1 and Sentinel-2 are available [172]. Gao et al. [172] also showed that with this approach, SSM can be retrieved for 100 m (or even better) resolution. Urban et al. [65] analyzed the potential of SSM estimation for drought monitoring in the savanna ecosystem by applying a change detection method to VV-polarized Sentinel-1 C-band. He found good agreement between SurfMI derived from Sentinel-1 in a combination with Sentinel-2 and Landsat-8 data and in situ soil moisture data. They concluded that deriving data about SSM in different land cover classes can be suitable for drought monitoring.

3.5. Remote Sensing of Surface Water and Wetland Analysis in Drought

The impacts of drought on surface water, especially its seasonal changes in quantity and quality, are well documented. Spatio-temporal analysis of surface water is the main objective in most drought studies. Drought is a phenomenon that occurs in an area, due to extreme climate or lack of water. They are among the most harmful and expensive natural disasters in the world [178,179,180,181]. Droughts are becoming more common around the world in varying frequencies and intensities and are affecting developed and underdeveloped countries [181,182]. They have a large impact on agriculture, economy, water resources, environment, and society [183,184,185]. The impacts of drought on wetland and surface water can be monitored effectively by analyzing meteorological, hydrological, and hydrogeological information.
Drought brings new challenges to the wetland ecosystem as its distribution and functions are subjected to the impact of drought. It is estimated that wetland stores 39% of the terrestrial carbon, though it only covers 9% of the total Earth’s surface. Wetlands are a fragile ecosystem, unique and natural landscape features with valuable functions such as protecting the environment, wildlife habitat, water quality, storing floodwater, and maintaining the water levels in the dry season [186]. Inversion of the PROSAIL radiative transfer model was applied to retrieve the LAI of the wetlands ecosystem using Sentinel-2 and RapidEye data. The derived LAI was validated with the field measurement and its statistical relations were assessed. The existing vegetation map was used to mask out regions apart from the region of interest and was used for the inversion process. The research concluded that the Sentinel-2 derived LAI has a higher accuracy rate compared to the RapidEye, irrespective of its fine spatial resolution.
Considering climatic factors such as temperature, rain, and evaporation can directly or indirectly affect wetland ecosystems, it can be concluded that there is a certain connection between the change of the wetland ecosystem and the occurrence of drought. The onset of drought is mainly due to lack of rain, the presence of high temperatures, and evaporation. These phenomena can lead to changes in wetland ecosystems, such as wetland drainage and wetland reduction, as well as water supply, which directly leads to long periods of drought, and thus disturbs the balance of ecosystems [187]. Numerous studies have predicted that droughts will be more frequent and much more severe primarily due to climate change and human activities [181,188,189,190].
Surface waters and wetlands are very important ecosystems on planet Earth because they provide a habitat for many plant and animal species. Wetland habitats are defined as ecotones, i.e., transitional habitats between the dry land and the water body [191]. That is why it is very important to monitor these ecosystems economically and efficiently because in that way we protect wetlands. By monitoring and mapping changes in wetlands, we monitor drought and reduce the risk of drought events. Satellite data offers great potential for wetland monitoring and has been the subject of many studies [192]. The use of multi-temporal images increases the accuracy of classification results [193] and allows the monitoring of changes in wetlands over one or more seasons. In observing water and wet surfaces on satellite images, strong absorption was observed in the near-infrared (NIR) and shortwave infrared (SVIR) spectrum, while in contrast, dry soil and vegetation have weaker absorption in these spectral ranges [192]. Therefore, these spectral bands and the vegetation indices derived from them, represent great potential for measuring certain parameters necessary for wetland detection and as such are good indicators for mapping wetlands and the demarcation of water bodies [194,195,196,197].
Inland water bodies were detected from the downscaled Sentinel-2 SWIR band using Intensity, Hue, Saturation (IHS) transformation, Principal Component Analysis, the Brovey, and the Gram-Schmidt pan sharpening methods. The modified NDWI produced from the IHS and Brovey methods outperformed other approaches and accurately detected the water and non-water areas, respectively [198]. Similarly [199], short-wavelength infrared bands of Sentinel-2 and Landsat were pan-sharpened using PCA, IHS, GS, and NDWII methods. The HIS method outperformed other methods and accurate modification of NDWI was produced from this approach. In recent years, drought monitoring has become very important for people and the environment. Now, thanks to satellite missions with a higher spectral and temporal resolution, such as Sentinel-2, the obtained results are much more accurate. With a temporal resolution of 5 days and a spatial resolution of 10 m, Sentinel-2 enables the efficient detection of surface waters and wetlands [47,200,201,202,203,204,205,206,207].
The most common methods for mapping wetlands and surface waters that use Sentinel-2 mission data, or use Sentinel-1 and Sentinel-2 mission data fusion, are unsupervised classification [47,208,209,210], supervised classification [47,209,211], change detection using vegetation indices [212,213], object-based classification [47,209,214], index-based classification [209], tile-based image thresholding [215], OTSU algorithm [200,203,216], and the rule-based super pixel (RBSP) approach [217]. In addition to these approaches, machine learning algorithms are being used more and more often. The most commonly used ML algorithm is the Random Forest classification [218,219,220], SVM [220,221].
On the Sentinel-2 image, Araya-López et al. 2018 used the one-class classifier Bias support vector machines (BSVM) to identify and map wetlands as an unsupervised classification algorithm. Such a model, which is primarily based on images from the Sentinel-2 mission, provides high performance for wetland mapping, in cases when single-date images and a small amount of field data are used [210]. A multi-time analysis of images was obtained from Sentinel-2 satellites, using the unsupervised K-means classification method and the MNDVI water index with the same image size in each process and year. In this way, a percentage of the class belonging to the flooded area was obtained. Comparing the results, he concluded that there are large oscillations in the water level of the wetlands, which can be attributed to drought or excessive rains. Kaplan et al. [47,209] uses three different approaches to determine the boundaries of wetlands and they are pixel-based, object-based, and index-based classifications. When a pixel-based classification is used as an approach in an unsupervised classification, the pixels are grouped based on the pixel reflection properties, while for supervised classification, selected samples are used for each defined class. The results show that better results are obtained with supervised classification, but are not good enough. Another approach that Kaplan et al. 2017, 2018, 2018a [47,209,214] use is object-based which certainly gives better results, especially when using the fusion of Sentinel-1 and Sentinel-2. The results obtained by a fusion of radar and optical data showed an overall classification accuracy of about 90% for wetland mapping. The third approach based on the classification of the index provides the possibility of separating the amount of vegetation and water, but not the detection of wetland boundaries. Therefore Kaplan et al. 2017 [209] propose a new approach that uses both object-based and index-based classifications, which as a result, gives a kappa value of 0.95 and as such is very suitable for mapping and change detection in wetlands. Bhatnagar et al. [211] explore the applicability of pixels based on supervised classification, using Bagged Tree, Subspace KNN and SVM. The Bagged Tree classifier proved to be the best classifier for wetland detection with an accuracy of about 84%.
One of the simplest approaches in mapping surface waters and wetlands is change detection using vegetation indices. Bhaga et al. [212] and Pena-Regueiro et al. [213] in their works calculate indices such as NDWI, Modified Normalized Difference Water Index Land Surface Water Index (LSWI + 5), and Modified Normalized Difference Index (MNDVI), on which they apply an appropriate threshold based on which they detect areas of interest. Such an approach has proven to be very useful for monitoring surface water and wetlands. Based on the threshold, the most used algorithm is the OTSU algorithm, which is used to determine the optimal value of the threshold for mapping the phenomenon from certain vegetation indices. Du et al. [200] calculated NDWI and MNDVI, and the results show that the use of MNDVI is more useful than the NDWI index. These same indices were also used in a study by Sekertekin et al. [216] and the results showed that NDVI gave better results and represented water bodies better. In addition to the aforementioned indices, Yang et al. [217] introduced the automated water extraction index (AWEI). In this case, NDWI generated poor results, and there were no significant changes in accuracy between the other two indices. Another way of threshold-based detection is the tile-based image thresholding that Ludwig et al. [215] applied in their work. The algorithm is based on a multi-time classification approach and showed an accuracy of over 92% for the proposed location. On that occasion, he calculated the following indices: NDWI, Modified Normalized Difference Water Index (MNDWI), NDVI, Normalized Difference Moisture Index (NDMI), Normalized Multi-band Drought Index (NMDI), Angle Based Drought Index 1 (ABDI1), Angle Based Drought 2 (ABDI2), Normalized Difference NIR-SWIR2 (ND0812), Normalized Difference GREEN-SWIR2 (ND0312), and Normalized Difference SWIR1-SWIR2 (ND1112). Yang et al. 2020 [217] proposed a new approach to rules-based automatic superpixel (RBSP). The RBSP method uses combined spectral indices and superpixel techniques to determine surface water volume. In this study, the AWEI index was adopted and the results showed that this approach has the potential to track surface water changes.
Today, machine learning tools are increasingly used to process multi-temporal images. The most commonly used algorithms are the Random Forest (RF) and Support vector machine (SVM) [218,219,220]. Data fusion of Sentinel-1 and Sentinel-2 and the results show an accuracy of over 80%. White et al. 2018, compare these two algorithms and the results show that RF is better than SVM, but not to a large extent. Chatziantoniou et al. [221] also used the SVM algorithm in their study as a way to detect water surfaces, and the results show an accuracy of about 95%. From these examples, the fusion of Sentinel-1 and Sentinel-2 satellite data has a successful application, especially when ML algorithms are implemented over this data. Sentinel-2 satellite missions have been successfully used to detect and map the impacts of drought on water surfaces and wetlands.
The following Table 2 summarized all mentioned methods and corresponding references in this article for extracting the drought information from the climatological ecological variables using Sentinel-2 satellite.

4. Summary and Conclusions

Drought is the most destructive and expensive natural disaster with a complex nature and pervasive impacts. For many reasons including high spatial, spectral, and temporal resolution, Sentinel-2 has a greater potential in assessing drought, compared to other contemporary mission products (e.g., Landsat-8). However, researchers have to depend on other satellite data for analyzing drought conditions before the commencement of Sentinel-2. That could also be a reason behind there being less research on the direct applicability of Sentinel-2 on drought. Another limitation observed in the Sentinel-2 application was the rate of uncertainties in data fusion and downscaling methods, though it was less in comparison to other sensors. Like other optical sensors in certain conditions, Sentinel-2 accuracy is also subjected to the accuracy of the on-ground measurement instruments. With the unique characteristics of the red-edge band and short revisiting nature, Sentinel-2 can efficiently record the abnormal variation in plant’s phenological and physiological conditions. The red-edge band is the most important band of the Sentinel-2 with high precision in observing the vegetation response to drought, compared to conventional methods such as NDVI.
Higher spatial resolution is a prerequisite in drought studies, Sentinel-2 offers peerless 10 m resolution in land surface monitoring in comparison to other freely available satellite images such as Landsat and MODIS. The data fusion method has overcome the thermal band limitation of the Sentinel-2 in estimating the drought factors such as soil moisture and ET using the surface energy balance model. In several cases, ET estimated from Sentinel-2 fused information such as HLS outperformed Landsat and MODIS outputs. At the same time, Sentinel-2 derived biophysical parameters coupled with climatological data used in ET, soil moisture estimation using FAO-56 PM, OPTRAM, and SAFER-based agriwater methods. It was observed that estimating soil moisture from Sentinel-1 and 2 data fusion maintains a higher level of accuracy compared to the fusing of Sentinel-2 with Landsat and MODIS. Without adequate research in this direction, it is difficult to compare the precision and efficiency of Sentinel-2 derived drought factors using direct and fusion methods because in most cases these methods are developed for either testing a particular hypothesis or an area of interest.
The integration of machine learning and deep learning algorithms increased the overall accuracy of Sentinel-2 derived information on surface water and wetland, vegetation, land use, and land cover classification. Data continuity of the Sentinel-2 is another important aspect in drought studies. The upcoming improved Sentinel-2C and Sentinel-2D to cover the overall 20-year mission will be another advantage. Finally, Sentinel-2 can efficiently monitor and delineate the slow pace of drought, which could improve drought monitoring, forecasting, and developing efficient mitigation procedures.

Author Contributions

Conceptualization, D.V., Writing and Editing D.V., M.R., S.S., Review, V.C. All authors have read and agreed to the published version of the manuscript.

Funding

This study has received funding from the European Union’s Horizon 2020 research and innovation program under SGA-CSA. No. 739570 under FPA No. 664387 (ANTARES).

Acknowledgments

Authors would like to acknowledge Sanja Brdar and Oskar Marko for their constructive suggestions.

Conflicts of Interest

The authors declare no conflict of interest. The founding sponsors had no role in the design of the study: in the collection, analyses, or interpretation of data: in the writing of the manuscript, and in the decision to publish the results.

References

  1. Wilhite, D.A.; Glantz, M.H. Understanding: The drought phenomenon: The role of definitions. Water Int. 1985, 10, 111–120. [Google Scholar] [CrossRef] [Green Version]
  2. Passioura, J.B. Drought and drought tolerance. Plant Growth Regul. 1996, 20, 79–83. [Google Scholar] [CrossRef]
  3. Tsakiris, G.; Vangelis, H. Establishing a drought index incorporating evapotranspiration. Eur. Water 2005, 9, 3–11. [Google Scholar]
  4. Palmer, W.C. Meteorological Drought; U.S. Weather Bureau: Washington, DC, USA, 1965.
  5. Wilhelmi, O.V.; Wilhite, D.A. Assessing vulnerability to agricultural drought: A Nebraska case study. Nat. Hazards 2002, 25, 37–58. [Google Scholar] [CrossRef]
  6. Nalbantis, I.; Tsakiris, G. Assessment of hydrological drought revisited. Water Resour. Manag. 2009, 23, 881–897. [Google Scholar] [CrossRef]
  7. Zhao, M.; Huang, S.; Huang, Q.; Wang, H.; Leng, G.; Xie, Y. Assessing socio-economic drought evolution characteristics and their possible meteorological driving force. Geomat. Nat. Hazards Risk 2019, 10, 1084–1101. [Google Scholar] [CrossRef] [Green Version]
  8. Guerrero-Salazar, P.; Yevjevich, V. Analysis of Drought Characteristics by the Theory of Runs; Hydrology Paper 80; Colorado State University: Fort Collins, CO, USA, 1975. [Google Scholar]
  9. World Meteorological Organization. Drought Monitoring and Early Warning: Concepts, Progress and Future Challenges; World Meteorological Organization: Geneva, Switzerland, 2006; ISBN 978-92-63-11006-0. [Google Scholar]
  10. Wang, W.; Ertsen, M.W.; Svoboda, M.D.; Hafeez, M. Propagation of drought: From meteorological drought to agricultural and hydrological drought. Adv. Meteorol. 2016, 2016, 1–5. [Google Scholar] [CrossRef]
  11. Pulwarty, R.S.; Sivakumar, M.V.K. Information systems in a changing climate: Early warnings and drought risk management. Weather Clim. Extrem. 2014, 3, 14–21. [Google Scholar] [CrossRef] [Green Version]
  12. Zhang, L.; Jiao, W.; Zhang, H.; Huang, C.; Tong, Q. Studying drought phenomena in the Continental United States in 2011 and 2012 using various drought indices. Remote Sens. Environ. 2017, 190, 96–106. [Google Scholar] [CrossRef]
  13. Hayes, M.; Svoboda, M.; Wall, N.; Widhalm, M. The lincoln declaration on drought indices: Universal meteorological drought index recommended. Bull. Am. Meteorol. Soc. 2011, 92, 485–488. [Google Scholar] [CrossRef] [Green Version]
  14. Anderson, L.O.; Malhi, Y.; Aragão, L.E.O.C.; Ladle, R.; Arai, E.; Barbier, N.; Phillips, O. Remote sensing detection of droughts in Amazonian forest canopies. New Phytol. 2010, 187, 733–750. [Google Scholar] [CrossRef]
  15. Zhang, A.; Jia, G. Monitoring meteorological drought in semiarid regions using multi-sensor microwave remote sensing data. Remote Sens. Environ. 2013, 134, 12–23. [Google Scholar] [CrossRef]
  16. Maybank, J.; Bonsai, B.; Jones, K.; Lawford, R.; O’Brien, E.G.; Ripley, E.A.; Wheaton, E. Drought as a natural disaster. Atmosphere-Ocean 1995, 33, 195–222. [Google Scholar] [CrossRef]
  17. Dilley, M.; Chen, R.S.; Deichmann, U.; Lerner-Lam, A.L.; Arnold, M. Natural Disaster Hotspots; World Bank: Washington, DC, USA, 2005. [Google Scholar]
  18. Below, R.; Grover-Kopec, E.; Dilley, M. Documenting drought-related Disasters: A global reassessment. J. Environ. Dev. 2007, 16, 328–344. [Google Scholar] [CrossRef]
  19. Wilhite, D.A.; Svoboda, M.D.; Hayes, M.J. Understanding the complex impacts of drought: A key to enhancing drought mitigation and preparedness. Water Resour. Manag. 2007, 21, 763–774. [Google Scholar] [CrossRef] [Green Version]
  20. Gupta, A.K.; Tyagi, P.; Sehgal, V.K. Drought disaster challenges and mitigation in India: Strategic appraisal. Curr. Sci. 2011, 100, 1795–1860. [Google Scholar]
  21. White, D.H.; Walcott, J.J. The role of seasonal indices in monitoring and assessing agricultural and other droughts: A review. Crop Pasture Sci. 2009, 60, 599–616. [Google Scholar] [CrossRef]
  22. Brito, S.S.B.; Cunha, A.P.M.A.; Cunningham, C.C.; Alvalá, R.C.; Marengo, J.A.; Carvalho, M.A. Frequency, duration and severity of drought in the Semiarid Northeast Brazil region. Int. J. Climatol. 2018, 38, 517–529. [Google Scholar] [CrossRef]
  23. McKee, T.B.; Nolan, J.; Kleist, J. The relationship of drought frequency and duration to time scales. In Proceedings of the 8th Conference on Applied Climatology, Boston, MA, USA, 17–22 January 1993. [Google Scholar]
  24. Svoboda, M.; LeComte, D.; Hayes, M.; Heim, R.; Gleason, K.; Angel, J.; Rippey, B.; Tinker, R.; Palecki, M.; Stooksbury, D.; et al. The drought monitor. Bull. Am. Meteorol. Soc. 2002, 83, 1181–1190. [Google Scholar] [CrossRef] [Green Version]
  25. Keyantash, J.; Dracup, J.A. The quantification of drought: An evaluation of drought indices. Bull. Am. Meteorol. Soc. 2002, 83, 1167–1180. [Google Scholar] [CrossRef]
  26. Vicente-Serrano, S.M. Evaluating the impact of drought using remote sensing in a Mediterranean, Semi-arid Region. Nat. Hazards 2007, 40, 173–208. [Google Scholar] [CrossRef]
  27. Wilhite, D.A. Drought as a natural hazard: Concepts and definitions. In Drought: A Global Assessment; Routledge: London, UK, 2000. [Google Scholar]
  28. Mishra, A.K.; Singh, V.P. A review of drought concepts. J. Hydrol. 2010, 391, 202–216. [Google Scholar] [CrossRef]
  29. McVicar, T.R.; Jupp, D.L.B. The current and potential operational uses of remote sensing to aid decisions on drought exceptional circumstances in Australia: A review. Agric. Syst. 1998, 57, 399–468. [Google Scholar] [CrossRef]
  30. Dai, A. Drought under global warming: A review. Wiley Interdiscip. Rev. Clim. Chang. 2011, 2, 45–65. [Google Scholar] [CrossRef] [Green Version]
  31. Chen, Y.; Sun, L.; Wang, W.; Pei, Z. Application of sentinel 2 data for drought monitoring in Texas, America. In Proceedings of the 2019 8th International Conference on Agro-Geoinformatics (Agro-Geoinformatics), Istanbul, Turkey, 16–19 July 2019. [Google Scholar]
  32. Šebenik, U.; Brilly, M.; Šraj, M. Drought analysis using the standardized precipitation index (SPI). Acta Geogr. Slov. 2017, 57, 31–49. [Google Scholar] [CrossRef] [Green Version]
  33. Knutson, C. Methods and Tools for Drought Analysis and Management. Eos 2008, 89, 206. [Google Scholar] [CrossRef]
  34. Hu, X.; Ren, H.; Tansey, K.; Zheng, Y.; Ghent, D.; Liu, X.; Yan, L. Agricultural drought monitoring using European Space Agency Sentinel 3A land surface temperature and normalized difference vegetation index imageries. Agric. For. Meteorol. 2019, 279, 107707. [Google Scholar] [CrossRef]
  35. Asner, G.P.; Alencar, A. Drought impacts on the Amazon forest: The remote sensing perspective. New Phytol. 2010, 187, 569–578. [Google Scholar] [CrossRef]
  36. Kogan, F.N. Global Drought Watch from Space. Bull. Am. Meteorol. Soc. 1997, 78, 621–636. [Google Scholar] [CrossRef]
  37. Rojas, O.; Vrieling, A.; Rembold, F. Assessing drought probability for agricultural areas in Africa with coarse resolution remote sensing imagery. Remote Sens. Environ. 2011, 115, 343–352. [Google Scholar] [CrossRef]
  38. Volden, E. New Capabilities in Earth Observation for Agriculture; European Space Agency: Budapest, Hungary, 2017. [Google Scholar]
  39. Shahabfar, A.; Ghulam, A.; Eitzinger, J. Drought monitoring in Iran using the perpendicular drought indices. Int. J. Appl. Earth Obs. Geoinf. 2012, 18, 119–127. [Google Scholar] [CrossRef]
  40. Ghulam, A.; Qin, Q.; Kusky, T.; Li, Z.L. A re-examination of perpendicular drought indices. Int. J. Remote Sens. 2008, 29, 6037–6044. [Google Scholar] [CrossRef]
  41. Wang, Q.; Blackburn, G.A.; Onojeghuo, A.O.; Dash, J.; Zhou, L.; Zhang, Y.; Atkinson, P.M. Fusion of Landsat 8 OLI and Sentinel-2 MSI Data. IEEE Trans. Geosci. Remote Sens. 2017, 55, 3885–3899. [Google Scholar] [CrossRef] [Green Version]
  42. Hao, P.-Y.; Tang, H.-J.; Chen, Z.-X.; Yu, L.; Wu, M.-Q. High resolution crop intensity mapping using harmonized Landsat-8 and Sentinel-2 data. J. Integr. Agric. 2019, 18, 2883–2897. [Google Scholar] [CrossRef]
  43. Liu, Y.; Gong, W.; Hu, X.; Gong, J. Forest type identification with random forest using Sentinel-1A, Sentinel-2A, multi-temporal Landsat-8 and DEM data. Remote Sens. 2018, 10, 946. [Google Scholar] [CrossRef] [Green Version]
  44. Roy, D.P.; Huang, H.; Boschetti, L.; Giglio, L.; Yan, L.; Zhang, H.H.; Li, Z. Landsat-8 and Sentinel-2 burned area mapping-A combined sensor multi-temporal change detection approach. Remote Sens. Environ. 2019, 231, 111254. [Google Scholar] [CrossRef]
  45. Wang, Q.; Atkinson, P.M. Spatio-temporal fusion for daily Sentinel-2 images. Remote Sens. Environ. 2018, 204, 31–42. [Google Scholar] [CrossRef] [Green Version]
  46. Wang, Q.; Shi, W.; Li, Z.; Atkinson, P.M. Fusion of Sentinel-2 images. Remote Sens. Environ. 2016, 187, 241–252. [Google Scholar] [CrossRef] [Green Version]
  47. Kaplan, G.; Avdan, U. Sentinel-1 and Sentinel-2 data fusion for wetlands mapping: Balikdami, Turkey. Int Arch. Photogram. Remote Sens. Spat. Inf. Sci. 2018, 42. [Google Scholar] [CrossRef] [Green Version]
  48. Useya, J.; Chen, S. Comparative Performance Evaluation of Pixel-Level and Decision-Level Data Fusion of Landsat 8 OLI, Landsat 7 ETM+ and Sentinel-2 MSI for Crop Ensemble Classification. IEEE J. Sel. Top. Appl. Earth Obs. Remote Sens. 2018, 11, 4441–4451. [Google Scholar] [CrossRef]
  49. West, H.; Quinn, N.; Horswell, M.; White, P. Assessing vegetation response to soil moisture fluctuation under extreme drought using sentinel-2. Water 2018, 10, 838. [Google Scholar] [CrossRef] [Green Version]
  50. Rossi, S.; Weissteiner, C.; Laguardia, G.; Kurnik, B.; Robustelli, M.; Niemeyer, S.; Gobron, N. Potential of MERIS fAPAR for Drought Detection; European Space Agency Communication Production Office: Frascati, Italy, 2008. [Google Scholar]
  51. Putzenlechner, B.; Castro, S.; Kiese, R.; Ludwig, R.; Marzahn, P.; Sharp, I.; Sanchez-Azofeifa, A. Validation of Sentinel-2 fAPAR products using ground observations across three forest ecosystems. Remote Sens. Environ. 2019, 232, 111310. [Google Scholar] [CrossRef]
  52. Karnieli, A.; Agam, N.; Pinker, R.T.; Anderson, M.; Imhoff, M.L.; Gutman, G.G.; Panov, N.; Goldberg, A. Use of NDVI and land surface temperature for drought assessment: Merits and limitations. J. Clim. 2010, 23, 618–633. [Google Scholar] [CrossRef]
  53. Zhang, H.; Chen, H.-L.; Shen, S. The application of normalized multi-band drought index (NMDI) method in cropland drought monitoring. Proc. SPIE 2009, 7472. [Google Scholar] [CrossRef]
  54. Park, S.; Im, J.; Jang, E.; Rhee, J. Drought assessment and monitoring through blending of multi-sensor indices using machine learning approaches for different climate regions. Agric. For. Meteorol. 2016, 216, 157–169. [Google Scholar] [CrossRef]
  55. Wieland, M.; Martinis, S. Large-scale surface water change observed by Sentinel-2 during the 2018 drought in Germany. Int. J. Remote Sens. 2020, 41, 4742–4756. [Google Scholar] [CrossRef]
  56. Vaudour, E.; Gomez, C.; Fouad, Y.; Lagacherie, P. Sentinel-2 image capacities to predict common topsoil properties of temperate and Mediterranean agroecosystems. Remote Sens. Environ. 2019, 223, 21–33. [Google Scholar] [CrossRef]
  57. Chen, F.; Ming, C.; Li, J.; Wang, C.; Claverie, M. A Comparison of Sentinel-2a and Sentinel-2B with Preliminary Results; IEEE: Manhattan, NY, USA, 2018. [Google Scholar]
  58. Breshears, D.D.; Cobb, N.S.; Rich, P.M.; Price, K.P.; Allen, C.D.; Balice, R.G.; Romme, W.H.; Kastens, J.H.; Floyd, M.L.; Belnap, J.; et al. Regional vegetation die-off in response to global-change-type drought. Proc. Natl. Acad. Sci. USA 2005, 102, 15144–15148. [Google Scholar] [CrossRef] [PubMed] [Green Version]
  59. Ji, L.; Peters, A.J. Assessing vegetation response to drought in the northern Great Plains using vegetation and drought indices. Remote Sens. Environ. 2003, 87, 85–98. [Google Scholar] [CrossRef]
  60. Adams, H.D.; Guardiola-Claramonte, M.; Barron-Gafford, G.A.; Villegas, J.C.; Breshears, D.D.; Zou, C.B.; Troch, P.A.; Huxman, T.E. Temperature sensitivity of drought-induced tree mortality portends increased regional die-off under global-change-type drought. Proc. Natl. Acad. Sci. USA 2009, 106, 7063–7066. [Google Scholar] [CrossRef] [Green Version]
  61. Camarero, J.J.; Gazol, A.; Sangüesa-Barreda, G.; Oliva, J.; Vicente-Serrano, S.M. To die or not to die: Early warnings of tree dieback in response to a severe drought. J. Ecol. 2015, 103, 44–57. [Google Scholar] [CrossRef] [Green Version]
  62. Brown, J.F.; Wardlow, B.D.; Tadesse, T.; Hayes, M.J.; Reed, B.C. The Vegetation Drought Response Index (VegDRI): A new integrated approach for monitoring drought stress in vegetation. GIScience Remote Sens. 2008, 45, 16–46. [Google Scholar] [CrossRef]
  63. Masek, J.; Ju, J.; Roger, J.C.; Skakun, S.; Claverie, M.; Dungan, J. Harmonized Landsat/sentinel-2 products for land monitoring. In Proceedings of the IGARSS 2018-2018 IEEE International Geoscience and Remote Sensing Symposium, Valencia, Spain, 22–27 July 2018. [Google Scholar]
  64. Claverie, M.; Ju, J.; Masek, J.G.; Dungan, J.L.; Vermote, E.F.; Roger, J.C.; Skakun, S.V.; Justice, C. The Harmonized Landsat and Sentinel-2 surface reflectance data set. Remote Sens. Environ. 2018, 219, 145–161. [Google Scholar] [CrossRef]
  65. Urban, M.; Berger, C.; Mudau, T.E.; Heckel, K.; Truckenbrodt, J.; Odipo, V.O.; Smit, I.P.J.; Schmullius, C. Surface moisture and vegetation cover analysis for drought monitoring in the southern Kruger National Park using Sentinel-1, Sentinel-2, and Landsat-8. Remote Sens. 2018, 10, 1482. [Google Scholar] [CrossRef] [Green Version]
  66. Bolton, D.K.; Gray, J.M.; Melaas, E.K.; Moon, M.; Eklundh, L.; Friedl, M.A. Continental-scale land surface phenology from harmonized Landsat 8 and Sentinel-2 imagery. Remote Sens. Environ. 2020, 240, 111685. [Google Scholar] [CrossRef]
  67. Shao, Z.; Cai, J.; Fu, P.; Hu, L.; Liu, T. Deep learning-based fusion of Landsat-8 and Sentinel-2 images for a harmonized surface reflectance product. Remote Sens. Environ. 2019, 235, 111425. [Google Scholar] [CrossRef]
  68. Nguyen, M.D.; Baez-Villanueva, O.M.; Bui, D.D.; Nguyen, P.T.; Ribbe, L. Harmonization of landsat and sentinel 2 for crop monitoring in drought prone areas: Case studies of Ninh Thuan (Vietnam) and Bekaa (Lebanon). Remote Sens. 2020, 12, 281. [Google Scholar] [CrossRef] [Green Version]
  69. Puletti, N.; Chianucci, F.; Castaldi, C. Use of Sentinel-2 for forest classification in Mediterranean environments. Ann. Silvic. Res. 2018, 42, 32–38. [Google Scholar] [CrossRef]
  70. Hill, M.J. Vegetation index suites as indicators of vegetation state in grassland and savanna: An analysis with simulated SENTINEL 2 data for a North American transect. Remote Sens. Environ. 2013, 137, 94–111. [Google Scholar] [CrossRef]
  71. Pastick, N.J.; Wylie, B.K.; Wu, Z. Spatiotemporal analysis of Landsat-8 and Sentinel-2 data to support monitoring of dryland ecosystems. Remote Sens. 2018, 10, 791. [Google Scholar] [CrossRef] [Green Version]
  72. Misra, G.; Cawkwell, F.; Wingler, A. Status of phenological research using sentinel-2 data: A review. Remote Sens. 2020, 12, 2760. [Google Scholar] [CrossRef]
  73. Singh, R.P.; Roy, S.; Kogan, F. Vegetation and temperature condition indices from NOAA AVHRR data for drought monitoring over India. Int. J. Remote Sens. 2003, 24, 4393–4402. [Google Scholar] [CrossRef]
  74. Zhou, X.; Wang, P.; Tansey, K.; Zhang, S.; Li, H.; Wang, L. Developing a fused vegetation temperature condition index for drought monitoring at fi eld scales using Sentinel-2 and MODIS imagery. Comput. Electron. Agric. 2020, 168, 105144. [Google Scholar] [CrossRef]
  75. Croft, H.; Chen, J.M.; Zhang, Y.; Simic, A.; Noland, T.L.; Nesbitt, N.; Arabian, J. Evaluating leaf chlorophyll content prediction from multispectral remote sensing data within a physically-based modelling framework. ISPRS J. Photogramm. Remote Sens. 2015, 102, 85–95. [Google Scholar] [CrossRef]
  76. Kim, K.; Wang, M.-C.; Ranjitkar, S.; Liu, S.-H.; Xu, J.-C.; Zomer, R.J. Using leaf area index (LAI) to assess vegetation response to drought in Yunnan province of China. J. Mt. Sci. 2017, 14, 1863–1872. [Google Scholar] [CrossRef]
  77. Korhonen, L.; Hadi; Packalen, P.; Rautiainen, M. Comparison of Sentinel-2 and Landsat 8 in the estimation of boreal forest canopy cover and leaf area index. Remote Sens. Environ. 2017, 195, 259–274. [Google Scholar] [CrossRef]
  78. Meyer, L.H.; Heurich, M.; Beudert, B.; Premier, J.; Pflugmacher, D. Comparison of Landsat-8 and Sentinel-2 data for estimation of leaf area index in temperate forests. Remote Sens. 2019, 11, 1160. [Google Scholar] [CrossRef] [Green Version]
  79. Majasalmi, T.; Rautiainen, M. The potential of Sentinel-2 data for estimating biophysical variables in a boreal forest: A simulation study. Remote Sens. Lett. 2016, 7, 427–436. [Google Scholar] [CrossRef]
  80. Dong, T.; Liu, J.; Qian, B.; He, L.; Liu, J.; Wang, R.; Jing, Q.; Champagne, C.; McNairn, H.; Powers, J.; et al. Estimating crop biomass using leaf area index derived from Landsat 8 and Sentinel-2 data. ISPRS J. Photogramm. Remote Sens. 2020, 168, 236–250. [Google Scholar] [CrossRef]
  81. Cogato, A.; Pagay, V.; Marinello, F.; Meggio, F.; Grace, P.; Migliorati, M.D.A. Assessing the feasibility of using sentinel-2 imagery to quantify the impact of heatwaves on irrigated vineyards. Remote Sens. 2019, 11, 2869. [Google Scholar] [CrossRef] [Green Version]
  82. Cernicharo, J.; Verger, A.; Camacho, F. Empirical and physical estimation of Canopy Water Content: From CHRIS/PROBA Data. Remote Sens. 2013, 5, 5265–5284. [Google Scholar] [CrossRef] [Green Version]
  83. Zhang, F.; Zhou, G. Estimation of canopy water content by means of hyperspectral indices based on drought stress gradient experiments of maize in the north plain China. Remote Sens. 2015, 7, 15203–15223. [Google Scholar] [CrossRef] [Green Version]
  84. Paz-Kagan, T.; Vaughn, N.R.; Martin, R.E.; Brodrick, P.G.; Stephenson, N.L.; Das, A.J.; Nydick, K.R.; Asner, G.P. Landscape-scale variation in canopy water content of giant sequoias during drought. For. Ecol. Manag. 2018, 419–420, 291–304. [Google Scholar] [CrossRef] [Green Version]
  85. Asner, G.P.; Brodrick, P.G.; Anderson, C.B.; Vaughn, N.; Knapp, D.E.; Martin, R.E. Progressive forest canopy water loss during the 2012-2015 California drought. Proc. Natl. Acad. Sci. USA 2016, 113, E249–E255. [Google Scholar] [CrossRef] [Green Version]
  86. Boren, E.J.; Boschetti, L. Landsat-8 and Sentinel-2 Canopy Water Content Estimation in Croplands through Radiative Transfer Model Inversion. Remote Sens. 2020, 12, 2803. [Google Scholar] [CrossRef]
  87. Marusig, D.; Petruzzellis, F.; Tomasella, M.; Napolitano, R.; Altobelli, A.; Nardini, A. Correlation of field-measured and remotely sensed plant water status as a tool to monitor the risk of drought-induced forest decline. Forests 2020, 11, 77. [Google Scholar] [CrossRef] [Green Version]
  88. Dotzler, S.; Hill, J.; Buddenbaum, H.; Stoffels, J. The potential of EnMAP and sentinel-2 data for detecting drought stress phenomena in deciduous forest communities. Remote Sens. 2015, 7, 14227–14258. [Google Scholar] [CrossRef] [Green Version]
  89. Coluzzi, R.; Fascetti, S.; Imbrenda, V.; Italiano, S.S.P.; Ripullone, F.; Lanfredi, M. Exploring the Use of Sentinel-2 Data to Monitor Heterogeneous Effects of Contextual Drought and Heatwaves on Mediterranean Forests. Land 2020, 9, 325. [Google Scholar] [CrossRef]
  90. Lin, S.; Li, J.; Liu, Q.; Li, L.; Zhao, J.; Yu, W. Evaluating the effectiveness of using vegetation indices based on red-edge reflectance from Sentinel-2 to estimate gross primary productivity. Remote Sens. 2019, 11, 1303. [Google Scholar] [CrossRef] [Green Version]
  91. Puletti, N.; Mattioli, W.; Bussotti, F.; Pollastrini, M. Monitoring the effects of extreme drought events on forest health by Sentinel-2 imagery. J. Appl. Remote Sens. 2019, 13, 020501. [Google Scholar] [CrossRef]
  92. Kościelniak, J.; Filek, W.; Biesaga-Kościelniak, J. The effect of drought stress on chlorophyll fluorescence in Lolium-Festuca hybrids. Acta Physiol. Plant. 2006, 28, 149–158. [Google Scholar] [CrossRef]
  93. Zhang, Y.; Chen, J.M.; Thomas, S.C. Retrieving seasonal variation in chlorophyll content of overstory and understory sugar maple leaves from leaf-level hyperspectral data. Can. J. Remote Sens. 2007, 33, 406–415. [Google Scholar] [CrossRef]
  94. Clevers, J.G.P.W.; Kooistra, L.; van den Brande, M.M.M. Using Sentinel-2 data for retrieving LAI and leaf and canopy chlorophyll content of a potato crop. Remote Sens. 2017, 9, 405. [Google Scholar] [CrossRef] [Green Version]
  95. Clevers, J.G.P.W.; Gitelson, A.A. Remote estimation of crop and grass chlorophyll and nitrogen content using red-edge bands on sentinel-2 and-3. Int. J. Appl. Earth Obs. Geoinf. 2013, 23, 344–351. [Google Scholar] [CrossRef]
  96. Darvishzadeh, R.; Skidmore, A.; Abdullah, H.; Cherenet, E.; Ali, A.; Wang, T.; Nieuwenhuis, W.; Heurich, M.; Vrieling, A.; O’Connor, B.; et al. Mapping leaf chlorophyll content from Sentinel-2 and RapidEye data in spruce stands using the invertible forest reflectance model. Int. J. Appl. Earth Obs. Geoinf. 2019, 79, 58–70. [Google Scholar] [CrossRef] [Green Version]
  97. Zarco-Tejada, P.J.; Hornero, A.; Beck, P.S.A.; Kattenborn, T.; Kempeneers, P.; Hernández-Clemente, R. Chlorophyll content estimation in an open-canopy conifer forest with Sentinel-2A and hyperspectral imagery in the context of forest decline. Remote Sens. Environ. 2019, 223, 320–335. [Google Scholar] [CrossRef] [PubMed]
  98. Delegido, J.; Verrelst, J.; Alonso, L.; Moreno, J. Evaluation of sentinel-2 red-edge bands for empirical estimation of green LAI and chlorophyll content. Sensors 2011, 11, 7063–7081. [Google Scholar] [CrossRef] [PubMed] [Green Version]
  99. Gholizadeh, A.; Mišurec, J.; Kopačková, V.; Mielke, C.; Rogass, C. Assessment of red-edge position extraction techniques: A case study for norway spruce forests using hymap and simulated sentinel-2 data. Forests 2016, 7, 226. [Google Scholar] [CrossRef] [Green Version]
  100. Steinhausen, M.J.; Wagner, P.D.; Narasimhan, B.; Waske, B. Combining Sentinel-1 and Sentinel-2 data for improved land use and land cover mapping of monsoon regions. Int. J. Appl. Earth Obs. Geoinf. 2018, 73, 595–604. [Google Scholar] [CrossRef]
  101. Thanh Noi, P.; Kappas, M. Comparison of Random Forest, k-Nearest Neighbor, and Support Vector Machine Classifiers for Land Cover Classification Using Sentinel-2 Imagery. Sensors 2017, 18, 18. [Google Scholar] [CrossRef] [Green Version]
  102. Scheffler, D.; Frantz, D.; Segl, K. Spectral harmonization and red edge prediction of Landsat-8 to Sentinel-2 using land cover optimized multivariate regressors. Remote Sens. Environ. 2020, 241, 111723. [Google Scholar] [CrossRef]
  103. Forkuor, G.; Dimobe, K.; Serme, I.; Tondoh, J.E. Landsat-8 vs. Sentinel-2; examining the added value of sentinel-2′s red-edge bands to land-use and land-cover mapping in Burkina Faso. GIScience Remote Sens. 2018, 55, 331–354. [Google Scholar] [CrossRef]
  104. Eskandari, S.; Jaafari, M.R.; Oliva, P.; Ghorbanzadeh, O.; Blaschke, T. Mapping land cover and tree canopy cover in Zagros forests of Iran: Application of Sentinel-2, google earth, and field data. Remote Sens. 2020, 12, 1912. [Google Scholar] [CrossRef]
  105. Tong, X.; Brandt, M.; Hiernaux, P.; Herrmann, S.; Rasmussen, L.V.; Rasmussen, K.; Tian, F.; Tagesson, T.; Zhang, W.; Fensholt, R. The forgotten land use class: Mapping of fallow fields across the Sahel using Sentinel-2. Remote Sens. Environ. 2020, 239, 111598. [Google Scholar] [CrossRef]
  106. Panigada, C.; Tagliabue, G.; Zaady, E.; Rozenstein, O.; Garzonio, R.; Di Mauro, B.; De Amicis, M.; Colombo, R.; Cogliati, S.; Miglietta, F.; et al. A new approach for biocrust and vegetation monitoring in drylands using multi-temporal Sentinel-2 images. Prog. Phys. Geogr. 2019, 43, 496–520. [Google Scholar] [CrossRef]
  107. Mazzia, V.; Khaliq, A.; Chiaberge, M. Improvement in land cover and crop classification based on temporal features learning from Sentinel-2 data using recurrent-Convolutional Neural Network (R-CNN). Appl. Sci. 2020, 10, 238. [Google Scholar] [CrossRef] [Green Version]
  108. Rind, D.; Goldberg, R.; Hansen, J.; Rosenzweig, C.; Ruedy, R. Potential evapotranspiration and the likelihood of future drought. J. Geophys. Res. 1990, 95, 9983–10004. [Google Scholar] [CrossRef]
  109. Teuling, A.J.; Van Loon, A.F.; Seneviratne, S.I.; Lehner, I.; Aubinet, M.; Heinesch, B.; Bernhofer, C.; Grünwald, T.; Prasse, H.; Spank, U. Evapotranspiration amplifies European summer drought. Geophys. Res. Lett. 2013, 40, 2071–2075. [Google Scholar] [CrossRef]
  110. Um, M.J.; Kim, Y.; Park, D.; Jung, K.; Wang, Z.; Kim, M.M.; Shin, H. Impacts of potential evapotranspiration on drought phenomena in different regions and climate zones. Sci. Total Environ. 2020, 703, 135590. [Google Scholar] [CrossRef]
  111. Zhao, J.; Chen, X.; Zhang, J.; Zhao, H.; Song, Y. Higher temporal evapotranspiration estimation with improved SEBS model from geostationary meteorological satellite data. Sci. Rep. 2019, 9, 14981. [Google Scholar] [CrossRef] [PubMed] [Green Version]
  112. Kustas, W.P.; Norman, J.M. Use of remote sensing for evapotranspiration monitoring over land surfaces. Hydrol. Sci. J. 1996, 41, 495–516. [Google Scholar] [CrossRef]
  113. Liou, Y.A.; Kar, S.K. Evapotranspiration estimation with remote sensing and various surface energy balance algorithms-a review. Energies 2014, 7, 2821–2849. [Google Scholar] [CrossRef] [Green Version]
  114. Kalma, J.D.; McVicar, T.R.; McCabe, M.F. Estimating land surface evaporation: A review of methods using remotely sensed surface temperature data. Surv. Geophys. 2008, 29, 421–469. [Google Scholar] [CrossRef]
  115. Bisquert, M.; Sánchez, J.M.; López-Urrea, R.; Caselles, V. Estimating high resolution evapotranspiration from disaggregated thermal images. Remote Sens. Environ. 2016, 187, 423–433. [Google Scholar] [CrossRef]
  116. Cai, J.; Liu, Y.; Lei, T.; Pereira, L.S. Estimating reference evapotranspiration with the FAO Penman-Monteith equation using daily weather forecast messages. Agric. For. Meteorol. 2007, 145, 22–35. [Google Scholar] [CrossRef]
  117. Hunsaker, D.J.; Pinter, P.J.; Barnes, E.M.; Kimball, B.A. Estimating cotton evapotranspiration crop coefficients with a multispectral vegetation index. Irrig. Sci. 2003, 22, 95–104. [Google Scholar] [CrossRef]
  118. Bogawski, P.; Bednorz, E. Comparison and Validation of Selected Evapotranspiration Models for Conditions in Poland (Central Europe). Water Resour. Manag. 2014, 28, 5021–5038. [Google Scholar] [CrossRef] [Green Version]
  119. Farg, E.; Arafat, S.M.; Abd El-Wahed, M.S.; El-Gindy, A.M. Estimation of Evapotranspiration ETc and Crop Coefficient K c of Wheat, in south Nile Delta of Egypt Using integrated FAO-56 approach and remote sensing data. Egypt. J. Remote Sens. Space Sci. 2012, 15, 83–89. [Google Scholar] [CrossRef] [Green Version]
  120. Murray, R.S.; Nagler, P.L.; Morino, K.; Glenn, E.P. An empirical algorithm for estimating agricultural and riparian evapotranspiration using MODIS enhanced vegetation index and ground measurements of ET. II. application to the lower Colorado river . U.S. Remote Sens. 2009, 1, 1125–1138. [Google Scholar] [CrossRef] [Green Version]
  121. Marta, A.D.; Chirico, G.B.; Bolognesi, S.F.; Mancini, M.; D’Urso, G.; Orlandini, S.; De Michele, C.; Altobelli, F. Integrating sentinel-2 imagery with Aquacrop for dynamic assessment of tomato water requirements in southern Italy. Agronomy 2019, 9, 404. [Google Scholar] [CrossRef] [Green Version]
  122. Vanino, S.; Nino, P.; De Michele, C.; Falanga Bolognesi, S.; D’Urso, G.; Di Bene, C.; Pennelli, B.; Vuolo, F.; Farina, R.; Pulighe, G.; et al. Capability of Sentinel-2 data for estimating maximum evapotranspiration and irrigation requirements for tomato crop in Central Italy. Remote Sens. Environ. 2018, 215, 452–470. [Google Scholar] [CrossRef]
  123. Pasqualotto, N.; D’Urso, G.; Bolognesi, S.F.; Belfiore, O.R.; Van Wittenberghe, S.; Delegido, J.; Pezzola, A.; Winschel, C.; Moreno, J. Retrieval of evapotranspiration from sentinel-2: Comparison of vegetation indices, semi-empirical models and SNAP biophysical processor approach. Agronomy 2019, 9, 663. [Google Scholar] [CrossRef] [Green Version]
  124. Vanella, D.; Ramírez-Cuesta, J.M.; Intrigliolo, D.S.; Consoli, S. Combining electrical resistivity tomography and satellite images for improving evapotranspiration estimates of citrus orchards. Remote Sens. 2019, 11, 373. [Google Scholar] [CrossRef] [Green Version]
  125. Choudhury, B.J.; Ahmed, N.U.; Idso, S.B.; Reginato, R.J.; Daughtry, C.S.T. Relations between evaporation coefficients and vegetation indices studied by model simulations. Remote Sens. Environ. 1994, 50, 1–17. [Google Scholar] [CrossRef]
  126. Pôças, I.; Paço, T.A.; Paredes, P.; Cunha, M.; Pereira, L.S. Estimation of actual crop coefficients using remotely sensed vegetation indices and soil water balance modelled data. Remote Sens. 2015, 7, 2373–2400. [Google Scholar] [CrossRef] [Green Version]
  127. Rozenstein, O.; Haymann, N.; Kaplan, G.; Tanny, J. Estimating cotton water consumption using a time series of Sentinel-2 imagery. Agric. Water Manag. 2018, 207, 44–52. [Google Scholar] [CrossRef]
  128. Ramírez-Cuesta, J.M.; Mirás-Avalos, J.M.; Rubio-Asensio, J.S.; Intrigliolo, D.S. A novel ArcGIS toolbox for estimating crop water demands by integrating the dual crop coefficient approach with multi-satellite imagery. Water 2018, 11, 38. [Google Scholar] [CrossRef] [Green Version]
  129. Mirás-Avalos, J.M.; Rubio-Asensio, J.S.; Ramírez-Cuesta, J.M.; Maestre-Valero, J.F.; Intrigliolo, D.S. Irrigation-advisor-a decision support system for irrigation of vegetable crops. Water 2019, 11, 2245. [Google Scholar] [CrossRef] [Green Version]
  130. Longo-Minnolo, G.; Vanella, D.; Consoli, S.; Intrigliolo, D.S.; Ramírez-Cuesta, J.M. Integrating forecast meteorological data into the ArcDualKc model for estimating spatially distributed evapotranspiration rates of a citrus orchard. Agric. Water Manag. 2020, 231, 105967. [Google Scholar] [CrossRef]
  131. Huryna, H.; Cohen, Y.; Karnieli, A.; Panov, N.; Kustas, W.P.; Agam, N. Evaluation of TsHARP utility for thermal sharpening of Sentinel-3 satellite images using Sentinel-2 visual imagery. Remote Sens. 2019, 11, 2304. [Google Scholar] [CrossRef] [Green Version]
  132. Guo, L.J.; Moore, J.M.M. Pixel block intensity modulation: Adding spatial detail to tm band 6 thermal imagery. Int. J. Remote Sens. 1998, 19, 2477–2491. [Google Scholar] [CrossRef]
  133. Weng, Q.; Fu, P.; Gao, F. Generating daily land surface temperature at Landsat resolution by fusing Landsat and MODIS data. Remote Sens. Environ. 2014, 145, 55–67. [Google Scholar] [CrossRef]
  134. Guzinski, R.; Nieto, H. Evaluating the feasibility of using Sentinel-2 and Sentinel-3 satellites for high-resolution evapotranspiration estimations. Remote Sens. Environ. 2019, 221, 157–172. [Google Scholar] [CrossRef]
  135. Gao, F.; Kustas, W.P.; Anderson, M.C. A data mining approach for sharpening thermal satellite imagery over land. Remote Sens. 2012, 4, 3287–3319. [Google Scholar] [CrossRef] [Green Version]
  136. Bellvert, J.; Jofre-Ĉekalović, C.; Pelechá, A.; Mata, M.; Nieto, H. Feasibility of using the two-source energy balance model (TSEB) with Sentinel-2 and Sentinel-3 images to analyze the spatio-temporal variability of vine water status in a vineyard. Remote Sens. 2020, 12, 2299. [Google Scholar] [CrossRef]
  137. Guzinski, R.; Nieto, H.; Sandholt, I.; Karamitilios, G. Modelling high-resolution actual evapotranspiration through Sentinel-2 and Sentinel-3 data fusion. Remote Sens. 2020, 12, 1433. [Google Scholar] [CrossRef]
  138. Flint, A.L.; Childs, S.W. Use of the Priestley-Taylor evaporation equation for soil water limited conditions in a small forest clearcut. Agric. For. Meteorol. 1991, 56, 247–260. [Google Scholar] [CrossRef]
  139. Mokhtari, A.; Noory, H.; Pourshakouri, F.; Haghighatmehr, P.; Afrasiabian, Y.; Razavi, M.; Fereydooni, F.; Sadeghi Naeni, A. Calculating potential evapotranspiration and single crop coefficient based on energy balance equation using Landsat 8 and Sentinel-2. ISPRS J. Photogramm. Remote Sens. 2019, 154, 231–245. [Google Scholar] [CrossRef]
  140. Antônio, A.H. Determining regional actual evapotranspiration of irrigated crops and natural vegetation in the São Francisco river basin (Brazil) using remote sensing and Penman-Monteith equation. Remote Sens. 2010, 2, 1287–1319. [Google Scholar] [CrossRef] [Green Version]
  141. Silva, C.D.O.F.; Teixeira, A.H.D.C.; Manzione, R.L. Agriwater: An R package for spatial modelling of energy balance and actual evapotranspiration using satellite images and agrometeorological data. Environ. Model. Softw. 2019, 120, 104497. [Google Scholar] [CrossRef]
  142. Hunsaker, D.J.; Fitzgerald, G.J.; French, A.N.; Clarke, T.R.; Ottman, M.J.; Pinter, P.J. Wheat irrigation management using multispectral crop coefficients: I. Crop evapotranspiration prediction. Trans. ASABE 2007, 50, 2017–2033. [Google Scholar] [CrossRef]
  143. Singh, R.K.; Khand, K.; Kagone, S.; Schauer, M.; Senay, G.B.; Wu, Z. A novel approach for next generation water-use mapping using Landsat and Sentinel-2 satellite data. Hydrol. Sci. J. 2020, 65, 2508–2519. [Google Scholar] [CrossRef]
  144. Glenn, E.P.; Neale, C.M.U.; Hunsaker, D.J.; Nagler, P.L. Vegetation index-based crop coefficients to estimate evapotranspiration by remote sensing in agricultural and natural ecosystems. Hydrol. Process. 2011, 25, 4050–4062. [Google Scholar] [CrossRef]
  145. Chen, Y.; Xia, J.; Liang, S.; Feng, J.; Fisher, J.B.; Li, X.; Li, X.; Liu, S.; Ma, Z.; Miyata, A.; et al. Comparison of satellite-based evapotranspiration models over terrestrial ecosystems in China. Remote Sens. Environ. 2014, 140, 279–293. [Google Scholar] [CrossRef]
  146. Ambrosone, M.; Matese, A.; Di Gennaro, S.F.; Gioli, B.; Tudoroiu, M.; Genesio, L.; Miglietta, F.; Baronti, S.; Maienza, A.; Ungaro, F.; et al. Retrieving soil moisture in rainfed and irrigated fields using Sentinel-2 observations and a modified OPTRAM approach. Int. J. Appl. Earth Obs. Geoinf. 2020, 89, 102113. [Google Scholar] [CrossRef]
  147. Liang, W.L.; Hung, F.X.; Chan, M.C.; Lu, T.H. Spatial structure of surface soil water content in a natural forested headwater catchment with a subtropical monsoon climate. J. Hydrol. 2014, 516, 210–221. [Google Scholar] [CrossRef]
  148. Liang, M.; Pause, M.; Prechtel, N.; Schramm, M. Regionalization of coarse scale soil moisture products using fine-scale vegetation indices-prospects and case study. Remote Sens. 2020, 12, 551. [Google Scholar] [CrossRef] [Green Version]
  149. El Hajj, M.; Baghdadi, N.; Zribi, M.; Bazzi, H. Synergic use of Sentinel-1 and Sentinel-2 images for operational soil moisture mapping at high spatial resolution over agricultural areas. Remote Sens. 2017, 9, 1292. [Google Scholar] [CrossRef] [Green Version]
  150. Peters-Lidard, C.D.; Mocko, D.M.; Garcia, M.; Santanello, J.A.; Tischler, M.A.; Moran, M.S.; Wu, Y. Role of precipitation uncertainty in the estimation of hydrologic soil properties using remotely sensed soil moisture in a semiarid environment. Water Resour. Res. 2008, 44, 5. [Google Scholar] [CrossRef] [Green Version]
  151. Zhang, D.; Zhou, G. Estimation of soil moisture from optical and thermal remote sensing: A review. Sensors 2016, 16, 1308. [Google Scholar] [CrossRef] [Green Version]
  152. Lin, H. Earth’s Critical Zone and hydropedology: Concepts, characteristics, and advances. Hydrol. Earth Syst. Sci. 2010, 14, 25–45. [Google Scholar] [CrossRef] [Green Version]
  153. Curcio, J.A.; Petty, C.C. The Near Infrared Absorption Spectrum of Liquid Water. J. Opt. Soc. Am. 1951, 41, 302. [Google Scholar] [CrossRef]
  154. Weare, B. Monitoring and Predicting Agricultural Drought: A Global Study. Vadose Zone J. 2006, 5, 1293. [Google Scholar] [CrossRef]
  155. Ghazaryan, G.; Dubovyk, O.; Graw, V.; Kussul, N.; Schellberg, J. Local-scale agricultural drought monitoring with satellite-based multi-sensor time-series. GIScience Remote Sens. 2020, 57, 704–718. [Google Scholar] [CrossRef]
  156. Han, H.; Bai, J.; Yan, J.; Yang, H.; Ma, G. A combined drought monitoring index based on multi-sensor remote sensing data and machine learning. Geocarto Int. 2019, 36, 1161–1177. [Google Scholar] [CrossRef]
  157. Engman, E.T. Applications of microwave remote sensing of soil moisture for water resources and agriculture. Remote Sens. Environ. 1991, 35, 213–226. [Google Scholar] [CrossRef]
  158. Topp, G.C. State of the art of measuring soil water content. Hydrol. Process. 2003, 17, 2993–2996. [Google Scholar] [CrossRef]
  159. Thavorntam, W.; Tantemsapya, N.; Armstrong, L. A combination of meteorological and satellite-based drought indices in a better drought assessment and forecasting in Northeast Thailand. Nat. Hazards 2015, 77, 1453–1474. [Google Scholar] [CrossRef]
  160. Wu, B.; Ma, Z.; Yan, N. Agricultural drought mitigating indices derived from the changes in drought characteristics. Remote Sens. Environ. 2020, 244, 111813. [Google Scholar] [CrossRef]
  161. Sadeghi, M.; Babaeian, E.; Tuller, M.; Jones, S.B. The optical trapezoid model: A novel approach to remote sensing of soil moisture applied to Sentinel-2 and Landsat-8 observations. Remote Sens. Environ. 2017, 198, 52–68. [Google Scholar] [CrossRef] [Green Version]
  162. Mananze, S.; Pôças, I. Agricultural drought monitoring based on soil moisture derived from the optical trapezoid model in Mozambique. J. Appl. Remote Sens. 2019, 13, 024519. [Google Scholar] [CrossRef]
  163. Hassanpour, R.; Zarehaghi, D.; Neyshabouri, M.R.; Feizizadeh, B.; Rahmati, M. Modification on optical trapezoid model for accurate estimation of soil moisture content in a maize growing field. J. Appl. Remote Sens. 2020, 14, 034519. [Google Scholar] [CrossRef]
  164. Ceccato, P.; Flasse, S.; Tarantola, S.; Jacquemoud, S.; Grégoire, J.M. Detecting vegetation leaf water content using reflectance in the optical domain. Remote Sens. Environ. 2001, 77, 22–33. [Google Scholar] [CrossRef]
  165. Mattia, F.; Balenzano, A.; Satalino, G.; Lovergine, F.; Peng, J.; Wegmuller, U.; Cartus, O.; Davidson, M.W.J.; Kim, S.; Johnson, J.; et al. Sentinel-1 & Sentinel-2 for soil moisture retrieval at field scale. In Proceedings of the IGARSS 2018-2018 IEEE International Geoscience and Remote Sensing Symposium, Valencia, Spain, 22–27 July 2018. [Google Scholar]
  166. Gangat, R.; van Deventer, H.; Naidoo, L.; Adam, E. Estimating soil moisture using Sentinel-1 and Sentinel-2 sensors for dryland and palustrine wetland areas. S. Afr. J. Sci. 2020, 116, 1–9. [Google Scholar] [CrossRef]
  167. Attarzadeh, R.; Amini, J. Towards an object-based multi-scale soil moisture product using coupled Sentinel-1 and Sentinel-2 data. Remote Sens. Lett. 2019, 10, 619–628. [Google Scholar] [CrossRef]
  168. Zhuo, W.; Huang, J.; Li, L.; Zhang, X.; Ma, H.; Gao, X.; Huang, H.; Xu, B.; Xiao, X. Assimilating Soil Moisture Retrieved from Sentinel-1 and Sentinel-2 Data into WOFOST Model to Improve Winter Wheat Yield Estimation. Remote Sens. 2019, 11, 1618. [Google Scholar] [CrossRef] [Green Version]
  169. Pan, H.; Chen, Z.; de Allard, W.; Ren, J. Joint assimilation of leaf area index and soil moisture from sentinel-1 and sentinel-2 data into the WOFOST model for winter wheat yield estimation. Sensors 2019, 19, 3161. [Google Scholar] [CrossRef] [PubMed] [Green Version]
  170. Wang, S.G.; Li, X.; Han, X.J.; Jin, R. Estimation of surface soil moisture and roughness from multi-angular ASAR imagery in theWatershed Allied Telemetry Experimental Research (WATER). Hydrol. Earth Syst. Sci. 2011, 15, 1415–1426. [Google Scholar] [CrossRef] [Green Version]
  171. Bousbih, S.; Zribi, M.; El Hajj, M.; Baghdadi, N.; Lili-Chabaane, Z.; Gao, Q.; Fanise, P. Soil moisture and irrigation mapping in a semi-arid region, based on the synergetic use of Sentinel-1 and Sentinel-2 data. Remote Sens. 2018, 10, 1953. [Google Scholar] [CrossRef] [Green Version]
  172. Gao, Q.; Zribi, M.; Escorihuela, M.J.; Baghdadi, N. Synergetic use of sentinel-1 and sentinel-2 data for soil moisture mapping at 100 m resolution. Sensors 2017, 17, 1966. [Google Scholar] [CrossRef] [Green Version]
  173. Ma, C.; Li, X.; McCabe, M.F. Retrieval of high-resolution soil moisture through combination of Sentinel-1 and Sentinel-2 data. Remote Sens. 2020, 12, 2303. [Google Scholar] [CrossRef]
  174. Attarzadeh, R.; Amini, J.; Notarnicola, C.; Greifeneder, F. Synergetic use of Sentinel-1 and Sentinel-2 data for soil moisture mapping at plot scale. Remote Sens. 2018, 10, 1285. [Google Scholar] [CrossRef] [Green Version]
  175. He, B.; Xing, M.; Bai, X. A synergistic methodology for soil moisture estimation in an alpine prairie using radar and optical satellite data. Remote Sens. 2014, 6, 10966–10985. [Google Scholar] [CrossRef] [Green Version]
  176. Alexakis, D.D.; Mexis, F.D.K.; Vozinaki, A.E.K.; Daliakopoulos, I.N.; Tsanis, I.K. Soil moisture content estimation based on Sentinel-1 and auxiliary earth observation products. A hydrological approach. Sensors 2017, 17, 1455. [Google Scholar] [CrossRef] [PubMed] [Green Version]
  177. Thoma, D.P.; Moran, M.S.; Bryant, R.; Rahman, M.M.; Collins, C.D.H.; Keefer, T.O.; Noriega, R.; Osman, I.; Skrivin, S.M.; Tischler, M.A.; et al. Appropriate scale of soil moisture retrieval from high resolution radar imagery for bare and minimally vegetated soils. Remote Sens. Environ. 2008, 112, 403–414. [Google Scholar] [CrossRef]
  178. Kim, H.; Park, J.; Yoo, J.; Kim, T.W. Assessment of drought hazard, vulnerability, and risk: A case study foradministrative districts in South Korea. J. Hydro-Environ. Res. 2015, 9, 28–35. [Google Scholar] [CrossRef]
  179. Dumitraşcu, M.; Mocanu, I.; Mitrică, B.; Dragotă, C.; Grigorescu, I.; Dumitrică, C. The assessment of socio-economic vulnerability to drought in Southern Romania (Oltenia Plain). Int. J. Disaster Risk Reduct. 2018, 27, 142–154. [Google Scholar] [CrossRef]
  180. Pei, W.; Fu, Q.; Liu, D.; Li, T.; Cheng, K.; Cui, S. A Novel Method for Agricultural Drought Risk Assessment. Water Resour. Manag. 2019, 33, 2033–2047. [Google Scholar] [CrossRef]
  181. Thomas, T.; Jaiswal, R.K.; Galkate, R.; Nayak, P.C.; Ghosh, N.C. Drought indicators-based integrated assessment of drought vulnerability: A case study of Bundelkhand droughts in central India. Nat. Hazards 2016, 81, 1627–1652. [Google Scholar] [CrossRef]
  182. Pandey, R.P.; Pandey, A.; Galkate, R.V.; Byun, H.R.; Mal, B.C. Integrating Hydro-Meteorological and Physiographic Factors for Assessment of Vulnerability to Drought. Water Resour. Manag. 2010, 24, 4199–4217. [Google Scholar] [CrossRef]
  183. Zhang, Q.; Sun, P.; Li, J.; Xiao, M.; Singh, V.P. Assessment of drought vulnerability of the Tarim River basin, Xinjiang, China. Theor. Appl. Climatol. 2015, 121, 337–347. [Google Scholar] [CrossRef]
  184. Rahman, M.R.; Lateh, H. Meteorological drought in Bangladesh: Assessing, analysing and hazard mapping using SPI, GIS and monthly rainfall data. Environ. Earth Sci. 2016, 75, 1026. [Google Scholar] [CrossRef]
  185. Pei, W.; Fu, Q.; Liu, D.; Li, T.-X.; Cheng, K.; Cui, S. Spatiotemporal analysis of the agricultural drought risk in Heilongjiang Province, China. Theor. Appl. Climatol. 2018, 133, 151–164. [Google Scholar] [CrossRef]
  186. Darvishzadeh, R.; Wang, T.; Skidmore, A.; Vrieling, A.; O’Connor, B.; Gara, T.W.; Ens, B.J.; Paganini, M. Analysis of Sentinel-2 and rapidEye for retrieval of leaf area index in a saltmarsh using a radiative transfer model. Remote Sens. 2019, 11, 671. [Google Scholar] [CrossRef] [Green Version]
  187. Cao, C.X.; Zhao, J.; Gong, P.; Ma, G.R.; Bao, D.M.; Tian, K.; Tian, R.; Niu, Z.G.; Zhang, H.; Xu, M.; et al. Wetland changes and droughts in southwestern China. Geomat. Nat. Hazards Risk 2012, 3, 79–95. [Google Scholar] [CrossRef]
  188. Murthy, C.S.; Laxman, B.; Sesha Sai, M.V.R. Geospatial analysis of agricultural drought vulnerability using a composite index based on exposure, sensitivity and adaptive capacity. Int. J. Disaster Risk Reduct. 2015, 12, 163–171. [Google Scholar] [CrossRef]
  189. Mohsenipour, M.; Shahid, S.; Chung, E.-S.; Wang, X.-J. Changing Pattern of Droughts during Cropping Seasons of Bangladesh. Water Resour. Manag. 2018, 32, 1555–1568. [Google Scholar] [CrossRef]
  190. Jiao, W.; Tian, C.; Chang, Q.; Novick, K.A.; Wang, L. A new multi-sensor integrated index for drought monitoring. Agric. For. Meteorol. 2019, 268, 74–85. [Google Scholar] [CrossRef] [Green Version]
  191. Mitsch, W.; Gosselink, J. Wetlands: Human Use and Science. Wetlands 2015, 5, 3–24. [Google Scholar]
  192. Tiner, R.W.; Lang, M.W.; Klemas, V.V. Remote Sensing of Wetlands: Applications and Advances; CRC Press: Boca Raton, FL, USA, 2015; ISBN 9781482237382. [Google Scholar]
  193. Ozesmi, S.L.; Bauer, M.E. Satellite remote sensing of wetlands. Wetl. Ecol. Manag. 2002, 10, 381–402. [Google Scholar] [CrossRef]
  194. Kulawardhana, R.W.; Thenkabail, P.S.; Vithanage, J.; Biradar, C.; Islam, M.A.; Gunasinghe, S.; Alankara, R. Evaluation of the wetland mapping methods using Landsat ETM+ and SRTM data. J. Spat. Hydrol. 2007, 7, 2. [Google Scholar]
  195. Islam, M.A.; Thenkabail, P.S.; Kulawardhana, R.W.; Alankara, R.; Gunasinghe, S.; Edussriya, C.; Gunawardana, A. Semi-automated methods for mapping wetlands using Landsat ETM+ and SRTM data. Int. J. Remote Sens. 2008, 29, 7077–7106. [Google Scholar] [CrossRef]
  196. Bwangoy, J.R.B.; Hansen, M.C.; Roy, D.P.; De Grandi, G.; Justice, C.O. Wetland mapping in the Congo Basin using optical and radar remotely sensed data and derived topographical indices. Remote Sens. Environ. 2010, 114, 73–86. [Google Scholar] [CrossRef]
  197. Davranche, A.; Poulin, B.; Lefebvre, G. Mapping flooding regimes in Camargue wetlands using seasonal multispectral data. Remote Sens. Environ. 2013, 138, 165–171. [Google Scholar] [CrossRef] [Green Version]
  198. Ronchetti, G.; Sona, G. Pan-sharpening methods applied on Sentinel-2 imagery for mapping inland water bodies. Geophys. Res. Abstr. 2018, 20, 7760. [Google Scholar]
  199. Tuan, V.A.; Hang, L.T.T.; Quang, N.H. Monitoring urban surface water bodies change using mndwi estimated from pan-sharpened optical satellite images. In Proceedings of the FIG Working Week, Hanoi, Vietnam, 22–26 April 2019. [Google Scholar]
  200. Du, Y.; Zhang, Y.; Ling, F.; Wang, Q.; Li, W.; Li, X. Water bodies’ mapping from Sentinel-2 imagery with Modified Normalized Difference Water Index at 10-m spatial resolution produced by sharpening the swir band. Remote Sens. 2016, 8, 354. [Google Scholar] [CrossRef] [Green Version]
  201. Gong, P.; Liu, H.; Zhang, M.; Li, C.; Wang, J.; Huang, H.; Clinton, N.; Ji, L.; Li, W.; Bai, Y.; et al. Stable classification with limited sample: Transferring a 30-m resolution sample set collected in 2015 to mapping 10-m resolution global land cover in 2017. Sci. Bull. 2019, 64, 370–373. [Google Scholar] [CrossRef] [Green Version]
  202. Wang, Z.; Liu, J.; Li, J.; Zhang, D.D. Multi-SpectralWater Index (MuWI): A Native 10-m Multi-SpectralWater Index for accuratewater mapping on sentinel-2. Remote Sens. 2018, 10, 1643. [Google Scholar] [CrossRef] [Green Version]
  203. Yang, X.; Chen, L. Evaluation of automated urban surface water extraction from Sentinel-2A imagery using different water indices. J. Appl. Remote Sens. 2017, 11, 026016. [Google Scholar] [CrossRef]
  204. Yesou, H.; Pottier, E.; Mercier, G.; Grizonnet, M.; Haouet, S.; Giros, A.; Faivre, R.; Huber, C.; Michel, J. Synergy of Sentinel-1 and Sentinel-2 imagery for wetland monitoring information extraction from continuous flow of sentinel images applied to water bodies and vegetation mapping and monitoring. In Proceedings of the 2016 IEEE International Geoscience and Remote Sensing Symposium (IGARSS), Beijing, China, 10–15 July 2016. [Google Scholar]
  205. Carlson, B.Z.; Hébert, M.; Van Reeth, C.; Bison, M.; Laigle, I.; Delestrade, A. Monitoring the seasonal hydrology of alpine wetlands in response to snow cover dynamics and summer climate: A novel approach with Sentinel-2. Remote Sens. 2020, 12, 1959. [Google Scholar] [CrossRef]
  206. Yang, X.; Zhao, S.; Qin, X.; Zhao, N.; Liang, L. Mapping of urban surface water bodies from sentinel-2 MSI imagery at 10 m resolution via NDWI-based image sharpening. Remote Sens. 2017, 9, 596. [Google Scholar] [CrossRef] [Green Version]
  207. Yang, X.; Qin, Q.; Grussenmeyer, P.; Koehl, M. Urban surface water body detection with suppressed built-up noise based on water indices from Sentinel-2 MSI imagery. Remote Sens. Environ. 2018, 219, 259–270. [Google Scholar] [CrossRef]
  208. Araya-López, R.A.; Lopatin, J.; Fassnacht, F.E.; Hernández, H.J. Monitoring Andean high altitude wetlands in central Chile with seasonal optical data: A comparison between Worldview-2 and Sentinel-2 imagery. ISPRS J. Photogramm. Remote Sens. 2018, 145, 213–224. [Google Scholar] [CrossRef]
  209. Kaplan, G.; Avdan, U. Mapping and Monitoring Wetlands Using Sentinel-2 Satellite Imagery. ISPRS Ann. Photogramm. Remote Sens. Spat. Inf. Sci. 2017, IV-4/W4, 271–277. [Google Scholar] [CrossRef] [Green Version]
  210. Morales, S.; Ruiz, M.; Soria, J.M. Water level fluctuations in Gallocanta Lake (Spain) using Sentinel-2 remote. Preprints 2020, 1–12. [Google Scholar] [CrossRef]
  211. Bhatnagar, S.; Ghosh, B.; Regan, S.; Naughton, O.; Johnston, P.; Gill, L. Monitoring environmental supporting conditions of a raised bog using remote sensing techniques. Proc. Int. Assoc. Hydrol. Sci. 2018, 380, 9–15. [Google Scholar] [CrossRef]
  212. Bhaga, T.D.; Dube, T.; Shoko, C. Satellite monitoring of surface water variability in the drought prone Western Cape, South Africa. Phys. Chem. Earth 2020, in press. [Google Scholar] [CrossRef]
  213. Pena-Regueiro, J.; Sebastiá-Frasquet, M.T.; Estornell, J.; Aguilar-Maldonado, J.A. Sentinel-2 application to the surface characterization of small water bodies in Wetlands. Water 2020, 12, 1487. [Google Scholar] [CrossRef]
  214. Kaplan, G.; Avdan, U. Sentinel-1 and Sentinel-2 Data Fusion for Mapping and Monitoring Wetlands. Preprints 2018, 2018070244. [Google Scholar] [CrossRef]
  215. Ludwig, C.; Walli, A.; Schleicher, C.; Weichselbaum, J.; Riffler, M. A highly automated algorithm for wetland detection using multi-temporal optical satellite data. Remote Sens. Environ. 2019, 224, 333–351. [Google Scholar] [CrossRef]
  216. Sekertekin, A.; Cicekli, S.Y.; Arslan, N. Index-Based Identification of Surface Water Resources Using Sentinel-2 Satellite Imagery. In Proceedings of the 2018 2nd International Symposium on Multidisciplinary Studies and Innovative Technologies (ISMSIT), Ankara, Turkey, 19–21 October 2018. [Google Scholar]
  217. Yang, X.; Qin, Q.; Yésou, H.; Ledauphin, T.; Koehl, M.; Grussenmeyer, P.; Zhu, Z. Monthly estimation of the surface water extent in France at a 10-m resolution using Sentinel-2 data. Remote Sens. Environ. 2020, 244, 111803. [Google Scholar] [CrossRef]
  218. Slagter, B.; Tsendbazar, N.-E.; Vollrath, A.; Reiche, J. Mapping wetland characteristics using temporally dense Sentinel-1 and Sentinel-2 data: A case study in the St. Lucia wetlands, South Africa. Int. J. Appl. Earth Obs. Geoinf. 2020, 86, 102009. [Google Scholar] [CrossRef]
  219. Mahdianpari, M.; Salehi, B.; Mohammadimanesh, F.; Homayouni, S.; Gill, E. The first wetland inventory map of newfoundland at a spatial resolution of 10 m using sentinel-1 and sentinel-2 data on the Google Earth Engine cloud computing platform. Remote Sens. 2019, 11, 43. [Google Scholar] [CrossRef] [Green Version]
  220. Whyte, A.; Ferentinos, K.P.; Petropoulos, G.P. A new synergistic approach for monitoring wetlands using Sentinels -1 and 2 data with object-based machine learning algorithms. Environ. Model. Softw. 2018, 104, 40–54. [Google Scholar] [CrossRef] [Green Version]
  221. Chatziantoniou, A.; Petropoulos, G.P.; Psomiadis, E. Co-Orbital Sentinel 1 and 2 for LULC mapping with emphasis on wetlands in a mediterranean setting based on machine learning. Remote Sens. 2017, 9, 1259. [Google Scholar] [CrossRef] [Green Version]
Figure 1. Methodological concept.
Remotesensing 13 03355 g001
Figure 2. Sentinel-2 derived NDVI before and during the drought.
Remotesensing 13 03355 g002
Table 1. Sentinel-2 band characteristics.
Band No.Spatial
Resolution (m)
Sentinel-2 ASentinel-2 BSNR @ Lref
Central
Wavelength (nm)
Band WIDTH (nm)Central
Wavelength (nm
Band
Width (nm)
B160442.721442.221129
B210492.466492.166158
B310559.836559.036168
B410664.631664.931148
B520704.115103.816117
B620740.515739.11589
B720782.820779.720105
B810832.8106832.9106174
B8a20864.721864.02272
B960945.120442.221114
B10601373.531943.22150
B11201613.7911610.494100
B12202202.41752185.7185100
Table 2. Summarized methods for extracting drought information from Sentinel-2.
AspectMethodReferences
Remote Sensing of Vegetation in DroughtExtended super-resolution convolutional neural network (ESRCNN)[67]
Enhanced Spatial and Temporal Adaptive Reflectance Fusion Model (ESTARFM)[74]
SAFYE[80]
PROSPECT model[93]
Red-Edge Position (REP)[99]
Remote Sensing of Land Use and Land Cover Change in DroughtThe random forest wrapper approach[101]
Support vector machine[102]
Random forest[102]
k-Nearest Neighbor[102]
Pixel R-CNN[107]
Remote Sensing of Evapotranspiration in DroughtSurface energy balance models[113,114]
FAO-56 Penman-Montecito (FAO-56 PM)[116,117,121]
Soil water balance model[122]
PBIM[132]
SADFAT[133]
Data Mining Sharpening[134,135,136]
Multi-Sensor Data Fusion approach (MSDF-ET)[139]
Simple Algorithm For ET Retrieving (SAFER)[140,141]
Remote Sensing of Soil Moisture in DroughtChange Detection Method[65,169,172,177]
OPtical TRApezoid Model (OPTRAM)[146,161,162,163,164]
ANN[149]
Water Cloud Model (WCM)[149,168,170,171,175,176]
Integral Equation Model (IEM)[170,175]
Cost Function[173]
Support Vector Regression[174]
Remote Sensing of Surface Water and Wetland Analysis in DroughtML algorithm-Random Forest da[28,219,220]
Unsupervised Classification[47,208,209,210]
Supervised Classification[47,209,211]
Object-based Classification[47,209,214]
Gram-Schmidt pan sharpening methods[198]
OTSU algorithm[200,203,216]
Index-based Classification[209]
Change Detection using Vegetation Indices[212,213]
Tile-based Image Thresholding[215]
Rule-based Super Pixel (RBSP) approach[217]
ML algorithm-Support Vector Machine (SVM)[220,221]
Publisher’s Note: MDPI stays neutral with regard to jurisdictional claims in published maps and institutional affiliations.

