Article

Using UAV-Based Hyperspectral Imagery to Detect Winter Wheat Fusarium Head Blight

1
Key Laboratory of Digital Earth Science, Aerospace Information Research Institute, Chinese Academy of Sciences, Beijing 100094, China
2
Key Laboratory for Earth Observation of Hainan Province, Sanya 572029, China
3
University of Chinese Academy of Sciences, Beijing 100049, China
*
Author to whom correspondence should be addressed.
Remote Sens. 2021, 13(15), 3024; https://doi.org/10.3390/rs13153024
Submission received: 7 June 2021 / Revised: 14 July 2021 / Accepted: 29 July 2021 / Published: 1 August 2021

Abstract

:
Fusarium head blight (FHB) is a major winter wheat disease in China. The accurate and timely detection of wheat FHB is vital to scientific field management. By combining three types of spectral features, namely, spectral bands (SBs), vegetation indices (VIs), and wavelet features (WFs), in this study, we explore the potential of using hyperspectral imagery obtained from an unmanned aerial vehicle (UAV), to detect wheat FHB. First, during the wheat filling period, two UAV-based hyperspectral images were acquired. SBs, VIs, and WFs that were sensitive to wheat FHB were extracted and optimized from the two images. Subsequently, a field-scale wheat FHB detection model was formulated, based on the optimal spectral feature combination of SBs, VIs, and WFs (SBs + VIs + WFs), using a support vector machine. Two commonly used data normalization algorithms were utilized before the construction of the model. The single WFs, and the spectral feature combination of optimal SBs and VIs (SBs + VIs), were respectively used to formulate models for comparison and testing. The results showed that the detection model based on the normalized SBs + VIs + WFs, using min–max normalization algorithm, achieved the highest R2 of 0.88 and the lowest RMSE of 2.68% among the three models. Our results suggest that UAV-based hyperspectral imaging technology is promising for the field-scale detection of wheat FHB. Combining traditional SBs and VIs with WFs can improve the detection accuracy of wheat FHB effectively.

1. Introduction

Fusarium head blight (FHB) is a devastating winter wheat disease, caused by the fungal pathogen Fusarium graminearum [1], which results in severe food production loss and food quality degradation [2]. Moreover, it also causes contamination of the grains with mycotoxins that are produced by Fusarium graminearum, which results in a severe threat to the health of humans and animals [3]. In recent years, affected by factors such as climate change and changes in farming systems, the wheat FHB in China exhibits regional expansion, and increased prevalence frequency and disease index. It has thus become one of the most important crop diseases that limit the safety of wheat production and wheat food quality in China [4]. On 15 September 2020, the Ministry of Agriculture and Rural Affairs of the People’s Republic of China has listed wheat FHB as a “class-I crop disease and pest” [5]. Therefore, the timely detection of wheat FHB is very important for improving the management of diseased fields.
In recent years, remote sensing technology has been widely applied in the detection and monitoring of crop diseases [6]. For remote monitoring of wheat FHB, most studies are carried out at spikelet or ear scale, and there is a lack of disease monitoring solutions at field-scale and higher [7,8,9]. Although these studies are of great significance for clarifying the disease spectral response mechanism and identifying remote monitoring mechanisms, they do not meet the current development needs of smart agriculture and precision agriculture. In addition, although some scholars have developed remote monitoring methods for field wheat FHB by relying on specific large machines (such as tractors or tool carriers) [10,11], if comprehensive and continuous field disease monitoring is required, these methods may be complicated and destructive to crops. As a technology that can flexibly, non-destructively, and efficiently obtain farmland environmental information and crop growth information, the rapidly developing unmanned aerial vehicle (UAV) remote sensing solutions play an important role in smart agriculture and precision agriculture [12]. Specifically, UAV remote sensing technology has been widely used in soil salinity assessment [13], vegetation classification [14], crop growth parameter estimation [15], yield prediction [16,17], crop disease monitoring [18,19], and many other applications. In addition, some scholars have tried to apply UAV-based hyperspectral imagery to monitor wheat FHB at field scale [20,21]. These results motivate us to continue to explore the detection methods of wheat FHB with UAV-based hyperspectral imagery.
Different forms of spectral features have been proposed and adopted in order to capture critical information on the crop disease, using hyperspectral remote sensing data, of which the vegetation indices (VIs) are the most representative [6]. Alisaac et al. [22] found that fifteen verified VIs related to physiological parameters were highly correlated with the severity of wheat FHB. Huang et al. [23] successfully detected wheat FHB by integrating VIs, first-order derivative features, and continuum-removed features. Using the spectral differences in the wavelength ranges 665–675 nm and 550–560 nm, Bauriegel et al. [24] proposed a head blight index that was suitable for the recognition of wheat FHB outdoors. Apart from conventional VIs, continuous wavelet analysis (CWA) has been introduced into crop pest and disease monitoring, as a new method that can capture some imperceptible spectral shape changes. Using CWA, Cheng et al. [25] successfully detected attack damage in pine forests, which was caused by mountain pine beetle infestations. Shi et al. [26] proposed a novel wavelet-based rust spectral feature set for determining host–pathogen interaction progression and tracking yellow rust development in wheat. Ma et al. [27] investigated the spectroscopic detection of FHB in wheat ears by applying CWA, and their results suggested that the wavelet features (WFs) derived using CWA show significant potential as a method for detecting FHB. Zhang et al. [28] found that CWA-based WFs outperformed conventional VIs when detecting wheat yellow rust. Furthermore, texture features (TFs) that reflect crop spatial patterns have also been considered for crop disease monitoring [20,21,29]. These studies indicate the effectiveness of VIs, WFs and TFs in crop diseases detection and monitoring applications. In previous studies, the effectiveness of a combination of VIs and TFs for crop disease monitoring has been confirmed. However, VIs and WFs were used separately, and there was no investigation of the performance of VI and WF combinations in disease monitoring.
In the present study, we focus on the performance evaluation of a combination of spectral bands (SBs), VIs and WFs extracted from UAV hyperspectral imagery, for the detection of wheat FHB at field scale. The aims are as follows: (1) determine the optimal SB, VI, and WF combinations for wheat FHB detection from UAV-based hyperspectral imagery; (2) evaluate and compare the performance of the optimal combination of SBs and VIs, single WFs, and combination of optimal SBs, VIs, and WFs in wheat FHB detection; and (3) map wheat FHB damage at the field scale using the optimal detection model.

2. Materials and Methods

2.1. Experimental Site and Data Collection

The UAV observation experiment of wheat FHB was carried out at the Anhui Agricultural University Production Base (31°29′N, 117°13′E). The base is located in Lujiang county, Hefei City, Anhui Province, China (Figure 1). In this area, the average annual temperature is 16.2 °C, rainfall is 1262.9 mm, evaporation is 1648.9 mm, sunshine is 1794.3 h, and the frost-free period is 301 days. Owing to the susceptible main wheat variety (Yangmai 25), the abundant fungus sources and favorable climatic conditions in the study area, FHB occurred naturally in the experiment region.
The field survey experiment was conducted during the wheat filling stage on 3 and 8 May 2019. This is a stable stage of wheat growth and a rapid development stage for wheat FHB. During the field survey, 46 quadrats (each of 1 m2 area) were selected, and each was marked for subsequent investigation of FHB severity and accurate locating in UAV-based hyperspectral imagery using red flags. In each quadrat, disease infestation in 50 randomly selected wheat plants was recorded. Then, according to the national rules for monitoring and forecast of wheat head blight (GB/T 15796-2011), the diseased ear ratio (DER) in each quadrat was calculated. The DER ranges from 0 to 100%, where 0% corresponds to a healthy crop and 100% corresponds to full FHB infection.
Hyperspectral imaging was obtained on the two dates using a DJI S1000 UAV system (SZ DJI Technology Co. Ltd., Guangdong, China). The UAV was equipped with a UHD 185 hyperspectral imaging system (Cubert GmbH, Ulm, Baden-Württemberg, Germany). The hyperspectral sensor can collect reflected radiation in the spectral wavelength region from 450 to 950 nm, with a spectral resolution of 4 nm across 125 bands. The flight was conducted from 11:00 a.m. to 13:00 p.m. (local time), and during the period, the sky was clear, cloudless and windless. The hyperspectral images were collected at a flight altitude of 60 m, with a ground sample distance of about 4 cm. The mosaicked and orthorectified hyperspectral imagery was then used for subsequent analyses.

2.2. Determination of Optimal Spectral Features for Wheat FHB Detection

In this study, our aim is to determine the optimal combination of SBs, VIs, and WFs based on UAV-based hyperspectral imagery, to realize the detection of wheat FHB at field scale. Figure 2 shows the main implementation steps. First, three types of spectral features sensitive to wheat FHB were extracted and optimized. Then, the combination of the optimal SBs, VIs, and WFs was used to construct a wheat FHB detection model through the support vector machine (SVM) method. Meanwhile, for evaluation and comparison, the combination of the optimal SBs and VIs, and the optimal WFs alone, were also used. Finally, the FHB damage under different infection levels on the two dates was mapped using the optimal detection model. Using this approach, the performance of a combination of SBs, VIs, and WFs was evaluated, and the potential of UAV-based hyperspectral imagery for detecting wheat FHB was explored.
SBs and VIs can be used to evaluate host wheat growth status and physiological changes, while WFs can capture some imperceptible spectral shape changes caused by the infection’s progression. For the selection of optimal SBs, the DER sensitivities of all 125 bands were first determined through correlation analysis. The statistically significant (p-value < 0.05) SBs among the top 10% bands (top thirteen bands included here) ranked in descending order based on the coefficient of determination (R2) values were then selected as candidate SBs. To select the optimal VIs, ten commonly used traditional vegetation indices sensitive to crop growth and physiological conditions were first calculated to characterize different aspects of the host wheat. Table 1 lists the definitions, equations, applications, and references of these VIs. The indices that showed significant (p-value < 0.05) correlation with DER were then selected as candidate VIs. For WFs, the raw reflectance spectrum was first transformed into a wavelet function set at different scales using the continuous wavelet transform (CWT) [30]. The Mexican hat wavelet was used as the mother wavelet base of CWT due to its similar characteristics to vegetation absorption [25,31]. During the CWT application, only the wavelet powers of the six most effective dyadic scales of 21, 22, …, 26 were retained to ensure accuracy and reduce complexity [25]. Then, the wavelet regions with a significant (p-value < 0.001) correlation between WFs and DER were considered as sensitive wavelet regions, and the WFs with the highest R2 of each sensitive wavelet region were then selected as candidate WFs. To further reduce redundancy among the three candidate feature types, namely, SBs, VIs, and WFs, a threshold segmentation method based on correlation analysis was used. First, the R2 between each feature type was calculated. Then, a threshold of R2 < 0.8 [32]was adopted to determine the optimal SBs, VIs, and WFs for wheat FHB detection.

2.3. Wheat FHB Detection Model Using Support Vector Machine (SVM)

The classic SVM method was adopted to test the performance of UAV-based hyperspectral imaging in detecting wheat FHB. SVM is a machine learning algorithm that maps the input variables to a high-dimensional feature space according to a pre-selected nonlinear mapping relation, and then performs classification by establishing the optimal hyperplane in feature space [42]. The method has been widely used for the classification of crop diseases and pests using remote sensing [26,43,44,45]. The SVM method converts the inner product operation in the high-dimensional feature space into a kernel function operation in the raw space using a kernel function with special properties. Thus, it can be used to solve difficult problems in high-dimensional space. In this study, the SVM classification kernel used the radial basis function to map the sample data to a higher dimensional space. This can be written as follows [46]:
k ( x , y ) = exp ( x y 2 2 σ 2 )
where σ controls the decision boundary smoothness in the feature space. The grid search method [47] was adopted for parameter optimization.
The success of machine learning algorithms depends on the data quality, but the initial data usually have significant differences due to the unit, dimension, range, etc. Therefore, it is vital to normalize and preprocess the data first to improve the quality of the data and the performance of subsequent machine learning algorithms [48]. In this study, prior to formulating the wheat FHB detection model, all three-type optimal spectral feature types (SBs, VIs, and WFs) were normalized using two commonly used normalization algorithms to accelerate the optimization and improve model accuracy. The two methods included the following: min–max normalization (MMN), and z-score normalization (ZSN). The MMN algorithm was performed via the following equation [49]:
F i = F i F i min F i max F i min
where F i is the normalized feature, Fi is the initial feature, and Fimax and Fimin are the maximum and minimum values of the feature, respectively. Then the ZSN algorithm was performed via the following equation [48]:
F i = F i μ σ
where μ is the mean value of the feature, σ is the standard deviation of the feature.
The SVM input variables were the initial SBs + VIs, WFs, and SBs + VIs + WFs, the normalized SBs + VIs, WFs, and SBs + VIs + WFs using MMN algorithm, and the normalized SBs + VIs, WFs, and SBs + VIs + WFs using ZSN algorithm, respectively. The output variable was the DER of wheat FHB. Two parameters, the R2 and the root mean square error (RMSE), were adopted to assess the effectiveness of the SVM models based on different features. Then, k-fold cross validation was used for training and validation of the models, in which k = 5.

3. Results and Discussion

3.1. Optimal Spectral Features for Wheat FHB

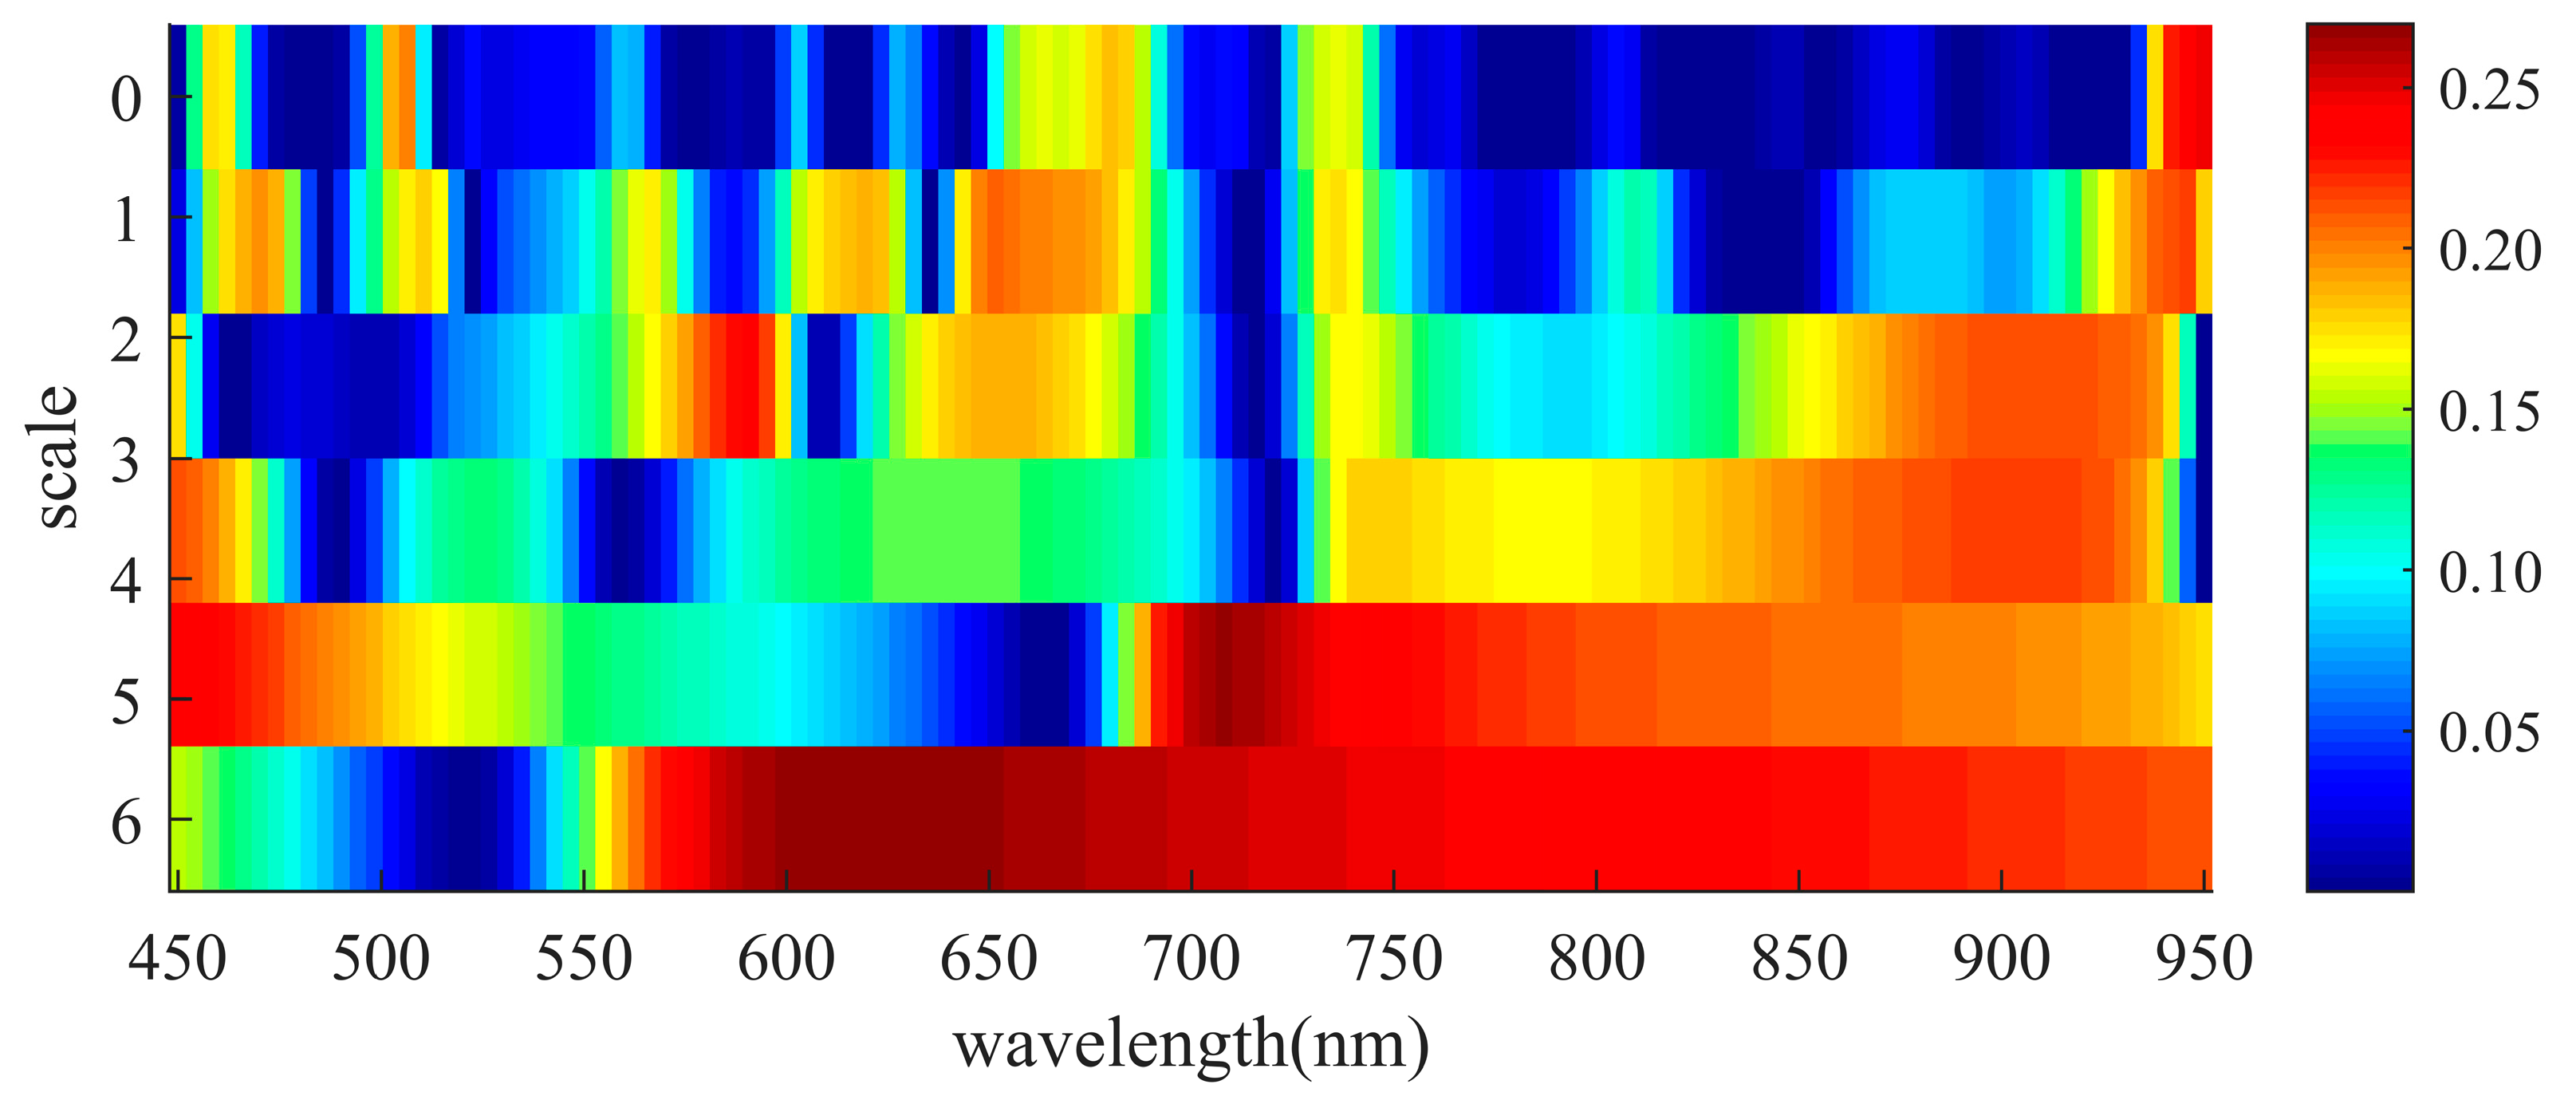
In order to formulate the detection model for wheat FHB, the three-type spectral features (including SBs, VIs, and WFs) were initially filtered. Of the thirteen obtained SBs, with the top 10% R2 values, four SBs were in the visible region, eight SBs in the red-edge region, and one SB in the near-infrared region. A total of seven VIs reached the significance level of 0.05, namely, ARI, MCARI, PRI, PhRI, PSRI, RVSI, and TVI. Figure 3 depicts the correlation scalogram between the wheat spectral reflectance and DER, based on the CWT. The sensitive wavelet regions were distributed in the visible region and near-infrared region. After significance testing (p-value < 0.001), a total of 26 candidate WFs were obtained. It is worth noting that the highest absolute value of R between the three-type spectral features and DER reached only 0.507. Wheat FHB mainly damages wheat ears, and its damage is distributed randomly. Conventional wheat FHB spectroscopy measurements are collected from the side of the wheat ears [10]. Our UAV-based wheat canopy spectrum is perpendicular to the wheat ears, that is, the collected spectral information was obtained mainly from above the wheat ears. Therefore, there is relatively little effective disease information contained in the UAV-based spectral features, which may be the reason for the low correlation between the selected spectral features and DER.
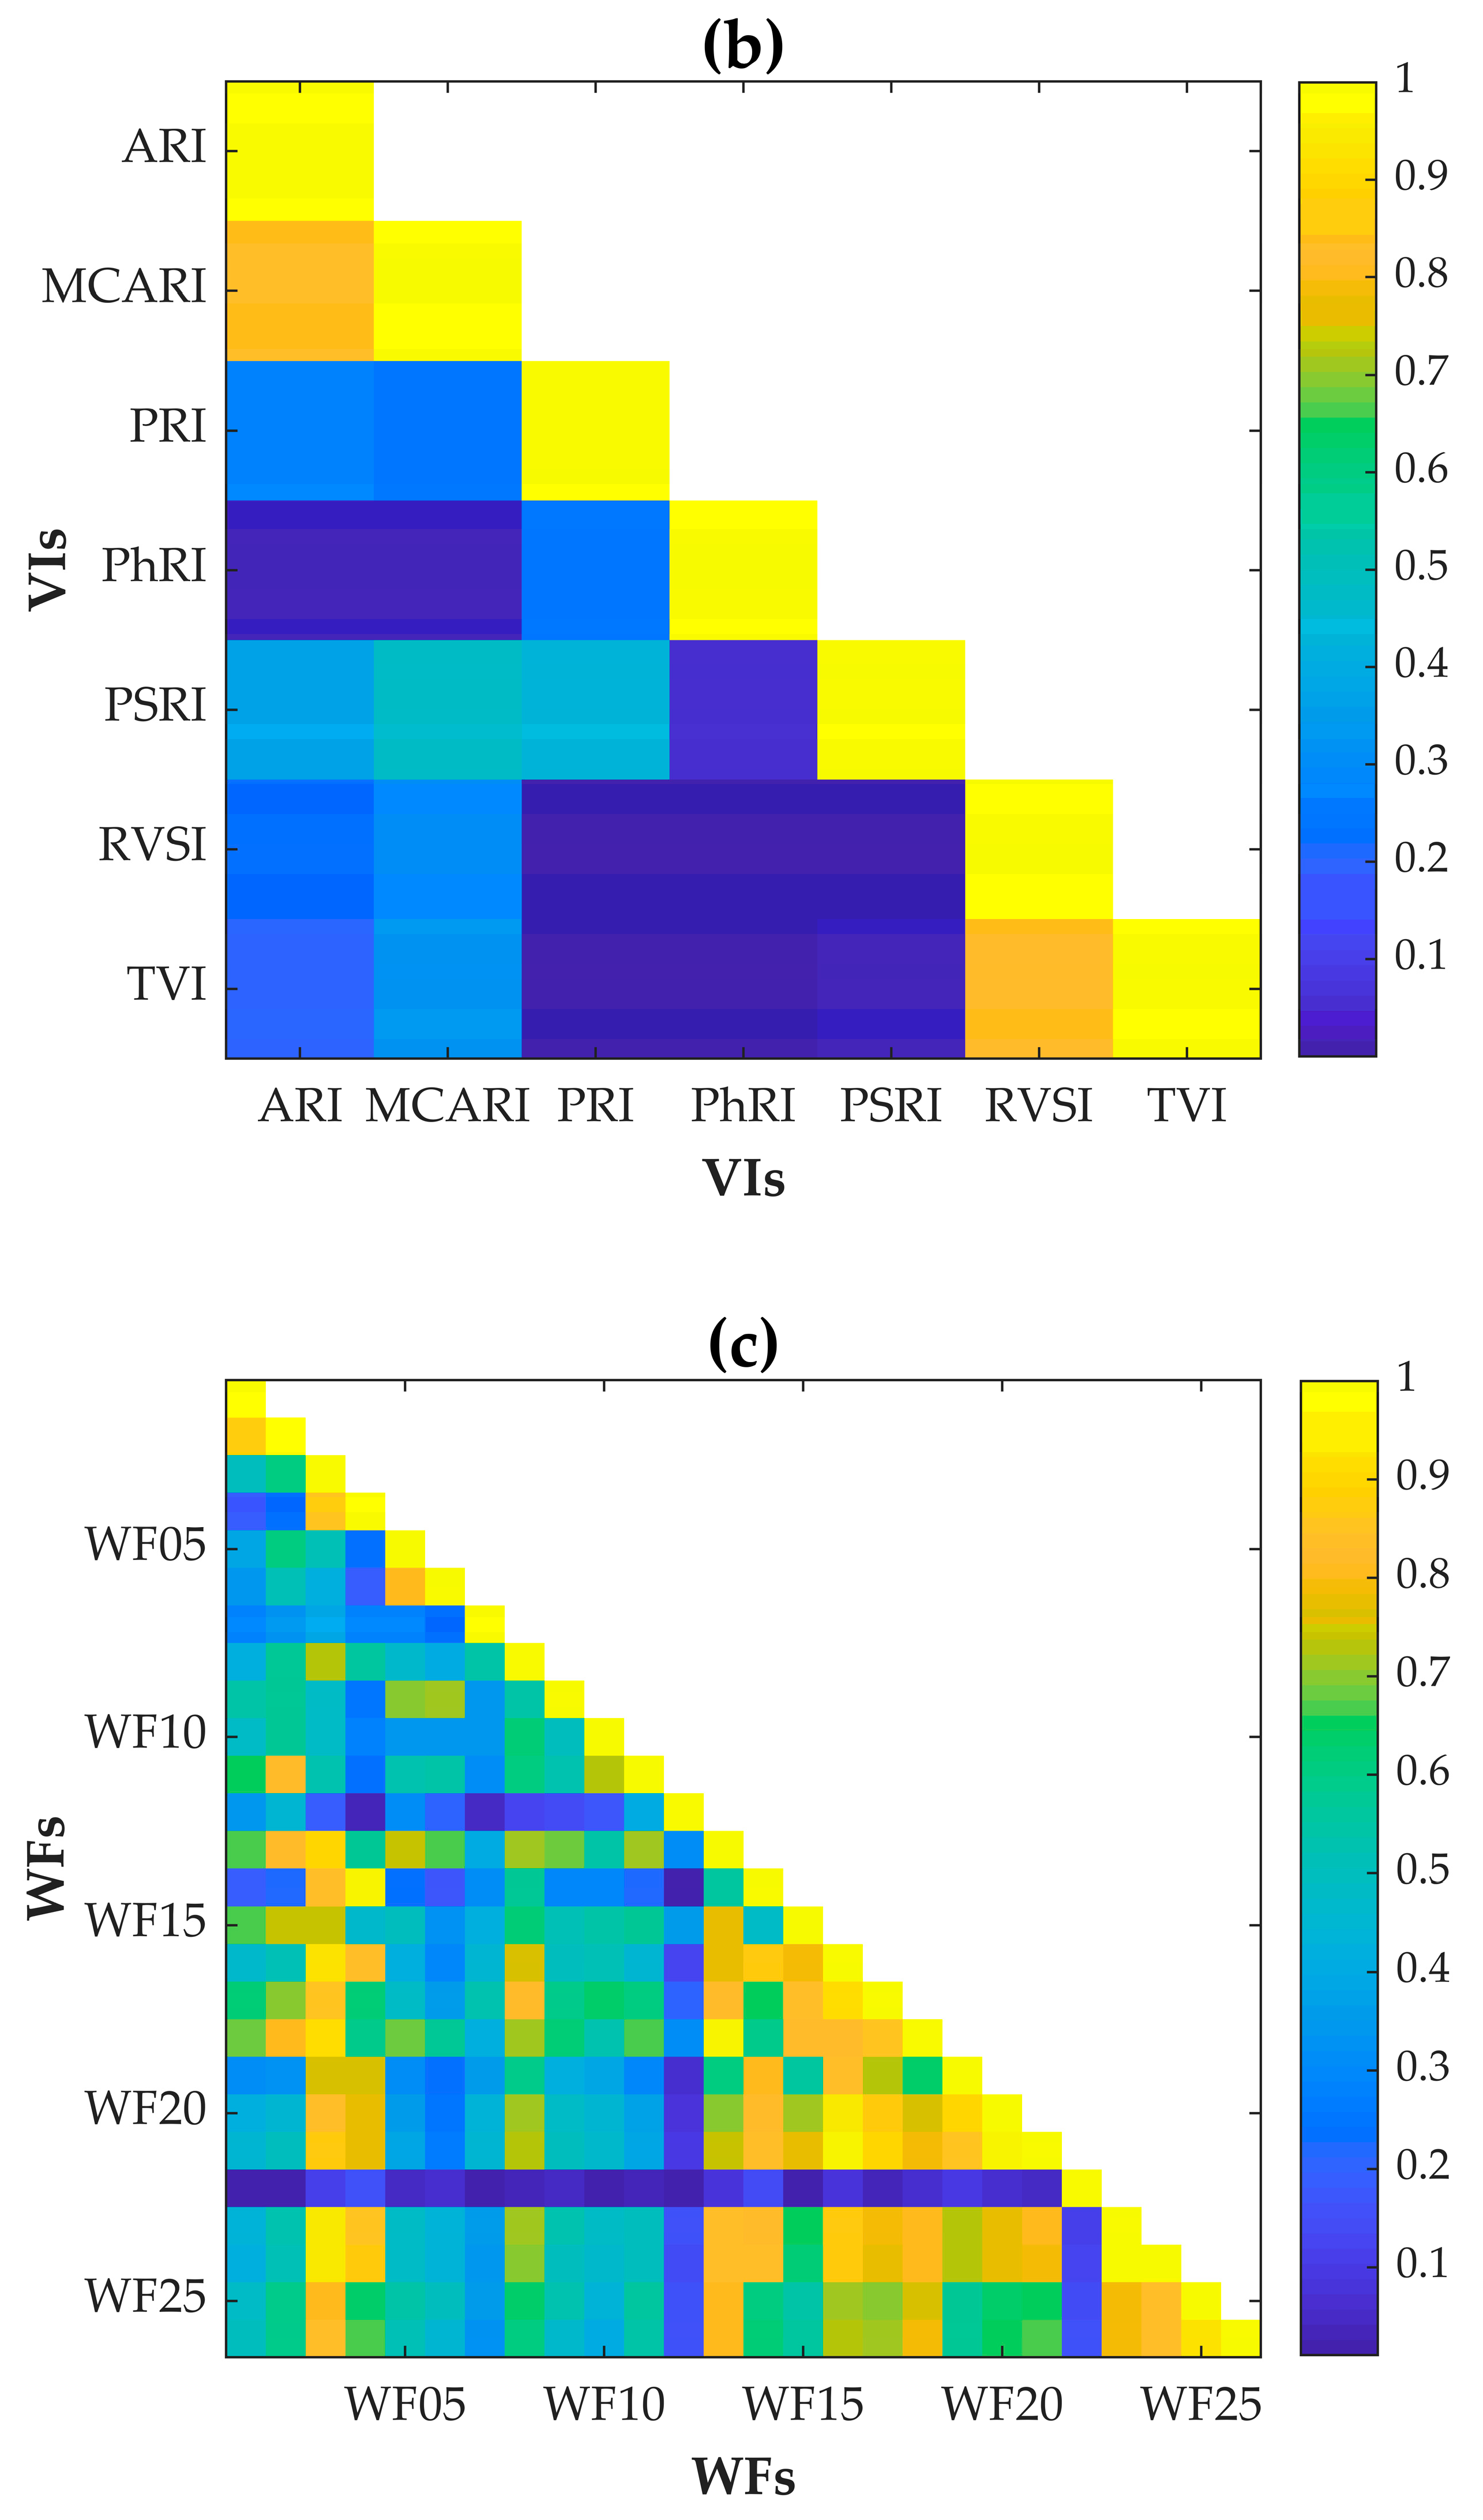
To further reduce the redundancy between the features, the pairwise correlation between the features was calculated and used for threshold segmentation. Figure 4 shows the correlation between the three-type candidate spectral features. Most of the candidate SBs and WFs exhibited high redundancy. For the candidate VIs, only two pairs of indices (ARI and MCARI, RVSI and TVI) had high redundancy. The three SBs, five VIs, and nine WFs were finally selected for wheat FHB detection, using a threshold of R2 < 0.8. The R correlation values between each spectral feature and DER, and their significance levels, are summarized in Table 2. The three optimal SBs, SB01 (478 nm), SB06 (702 nm), and SB13 (946 nm), were in the blue, red-edge, and near-infrared regions. The five optimal VIs were related to chlorophyll (MCARI, RVSI), photosynthetic radiation (PRI), light use efficiency (PhRI), and pigment senescence (PSRI). Of the nine optimal WFs, WF01 (450 nm, scale 23) and WF06 (470 nm, scale 22) were in the blue region, WF07 (502 nm, scale 21) was in the blue-edge region, WF10 (566 nm, scale 22) was in the yellow-edge region, WF12 (618 nm, scale 22), WF13 (618 nm, scale 26) and WF16 (650 nm, scale 23) were in the red region, and WF22 (806 nm, scale 22) was in the near-infrared region. The two SBs and eight WFs in the visible region selected in this study are all in the wavelength ranges of 430–525 nm and 560–710 nm, which is consistent with the findings of Alisaac et al., who found that the spectral reflectance of the visible region at these ranges is highly correlated with FHB [22]. Typically, wheat that is infected with FHB exhibits a powdery discoloration, discoloration, or death of infected spikelets, mostly accompanied by a temporary increase in transpiration and tissue desiccation [50,51]. These phenomena are related to the changes in pigment content (including carotenoid and chlorophyll), water content, and internal structure of the infected wheat ears [24,52]. The above changes will affect the optical characteristics of the wheat canopy, and change its spectral response characteristics. Specifically, in the visible region, the spectral reflectance of wheat infected with FHB is higher than that of healthy wheat [27]. Therefore, the selected SBs and WFs are suitable for detecting infection, and the selected VIs are also effective indices.

3.2. Evaluation of Wheat FHB Detection Models

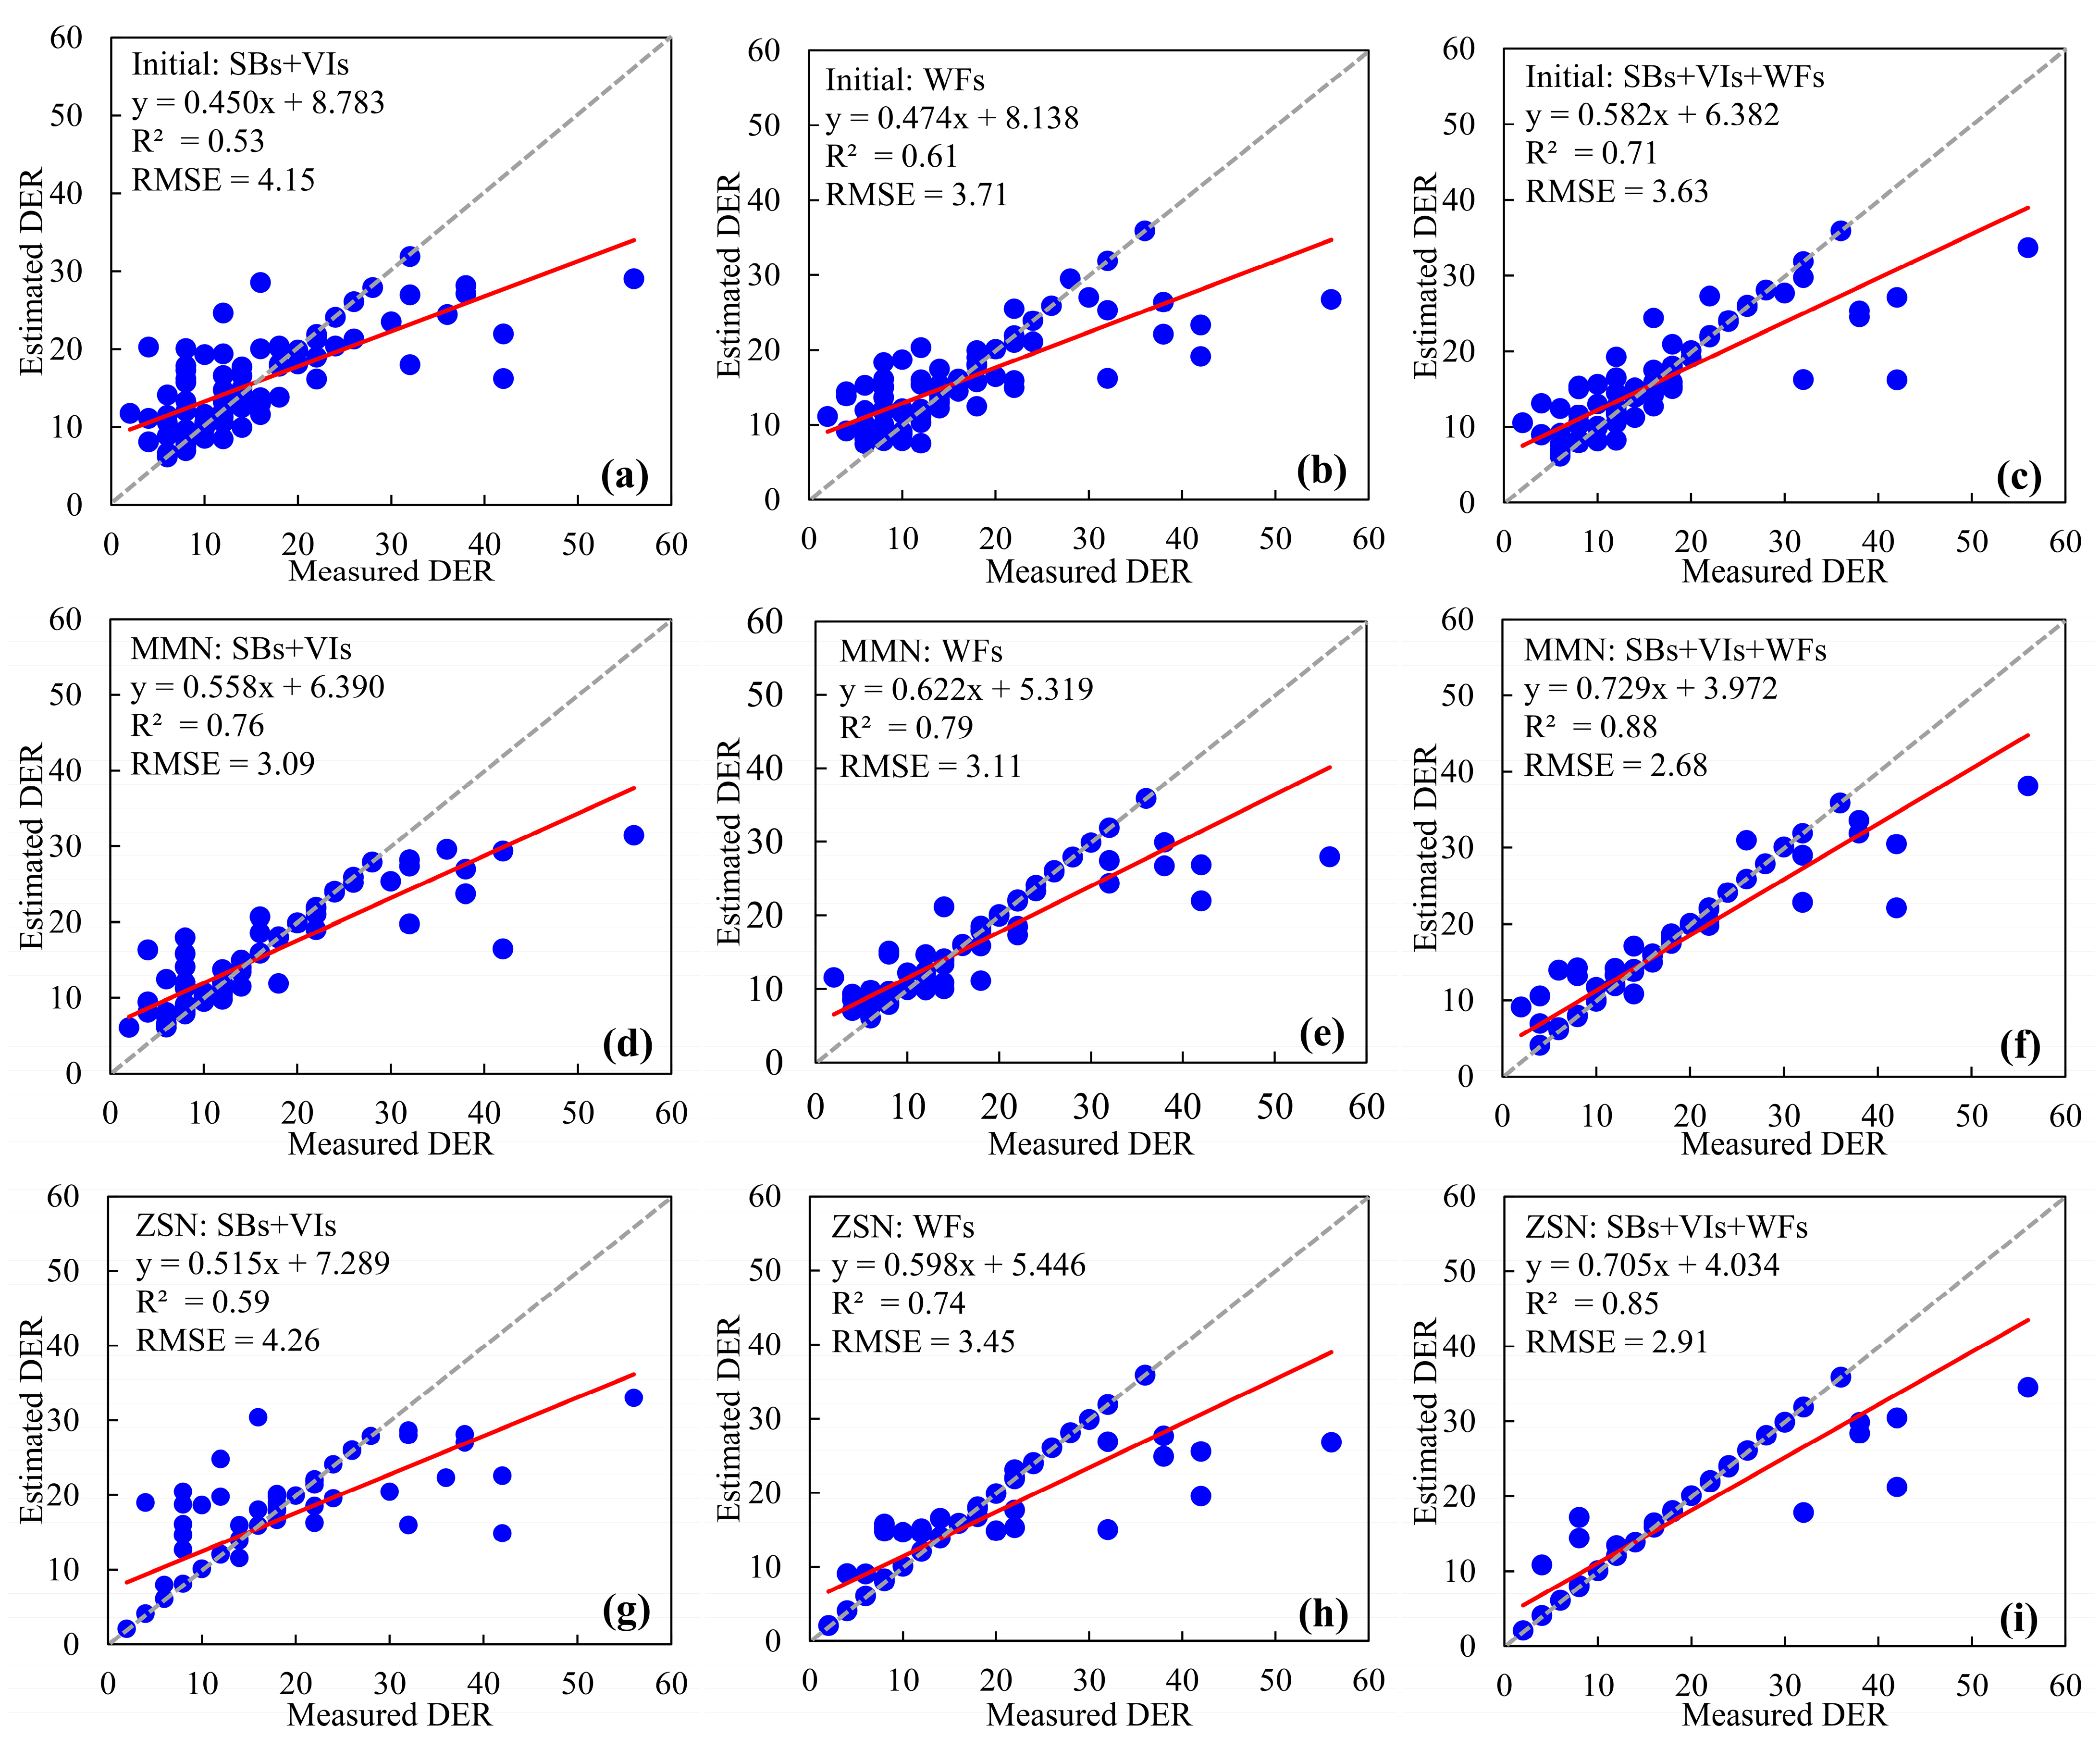
A detection model applying an SVM on the three-fold spectral feature combination (SBs + VIs + WFs) was established, to assess the effectiveness of detecting wheat FHB. For comparison and testing of the initial results, the combination of SBs and conventional VIs (SBs + VIs), and single WFs, were also used as the inputs to the SVM to establish detection models, respectively. In addition, in order to accelerate the optimization and improve the model accuracy, the normalized SBs + VIs + WFs, SBs + VIs, and single WFs using MMN and ZSN algorithms, were also utilized, respectively. Figure 5 shows the evaluation results that were obtained using the five-fold cross-validation. No matter the initial or normalized spectral features, the WFs outperformed the SBs + VIs in the detection of wheat FHB, with the higher R2 values and higher slope values. This result is consistent with the results of Zhang et al., Shi et al., and Zheng et al. in the detection of wheat yellow rust, and Huang et al. in the discrimination of wheat disease and nitrogen–water stresses [26,28,32,53]. CWA can be used to identify signals in the time and frequency domains simultaneously, and the low- and high-frequency signals obtained through the different transform scales can capture the narrow absorption features of the original spectrum and the shape of the continuum [25,54]. Therefore, compared to the selected SBs and VIs, the extracted WFs have the best scales and wavelengths, and can capture spectral details that are sensitive to wheat FHB. For the results of the SVM detection models based on spectral feature combinations under the same data type (including initial, MMN normalized, and ZSN normalized), the SBs + VIs + WFs illustrated excellent linearities and the highest correlations with the measured DER, which had the highest R2 values and the lowest RMSE values (Figure 5c,f,i). The fitted lines of the scatterplot based on SBs + VIs + WFs was also the closest to the 1:1 line. The spectral feature combination of SBs, VIs, and WFs can leverage complementary information, which not only reflects the host wheat growth status and physiological changes caused by FHB infection, but also captures details of the disease. Hence, when SBs + VIs + WFs are used as the input, the accuracy of the FHB detection model is improved effectively.
Compared with the initial spectral feature combinations (including SBs + VIs + WFs, SBs + VIs, and single WFs), the normalized spectral combinations using both MMN and ZSN could improve the accuracy of the SVM detection models effectively. Since SVM calculates data margins, which makes it is equivalent to a distance classifier. However, the excessive distance caused by the differences in the spectral features will result in a huge amount of matrix calculation, and also the need to consider the overflow problem in computation. Therefore, through normalization algorithms, the data can be mapped to a favorable plane, which is convenient for calculation [55]. Besides, the spectral feature combinations that were normalized using the MMN algorithm outperformed the spectral feature combinations that were normalized using the ZSN algorithm, which is consistent with the result of Tang et al. in their research on data normalization for SVM training [56]. Among all nine SVM detection models, SBs + VIs + WFs that were normalized using the MMN algorithm generated the optimal SVM detection model, with the highest R2 value of 0.88, the lowest RMSE value of 2.68, and the fitted line (with a slope of 0.729) closest to the 1:1 line. However, our results were only based on two commonly used normalization algorithms, and more data preprocessing algorithms need to be tested in the future.
Furthermore, all nine SVM detection models tended to underestimate high DER values. We believe that the spectral measurement method and sample distribution were the cause of this phenomenon. On one hand, due to the UAV-based collection of hyperspectral images that are perpendicular to the canopy, and FHB randomly infecting different parts of the wheat ears, the loss of effective spectral disease information in quadrats with high DER values may be higher than that in quadrats with a low DER value. On the other hand, during our field investigation, despite the widespread occurrence of FHB in the field, the overall DER in the survey quadrats was low, and only a few quadrats had high DER values. That is, the obtained dataset is imbalanced for the formulation of the wheat FHB detection models. However, when the dataset is imbalanced, traditional data mining algorithms are prone to overfitting [57]. In future, field disease data with a more uniform distribution of DER values should be collected, to further improve the robustness of the detection model.
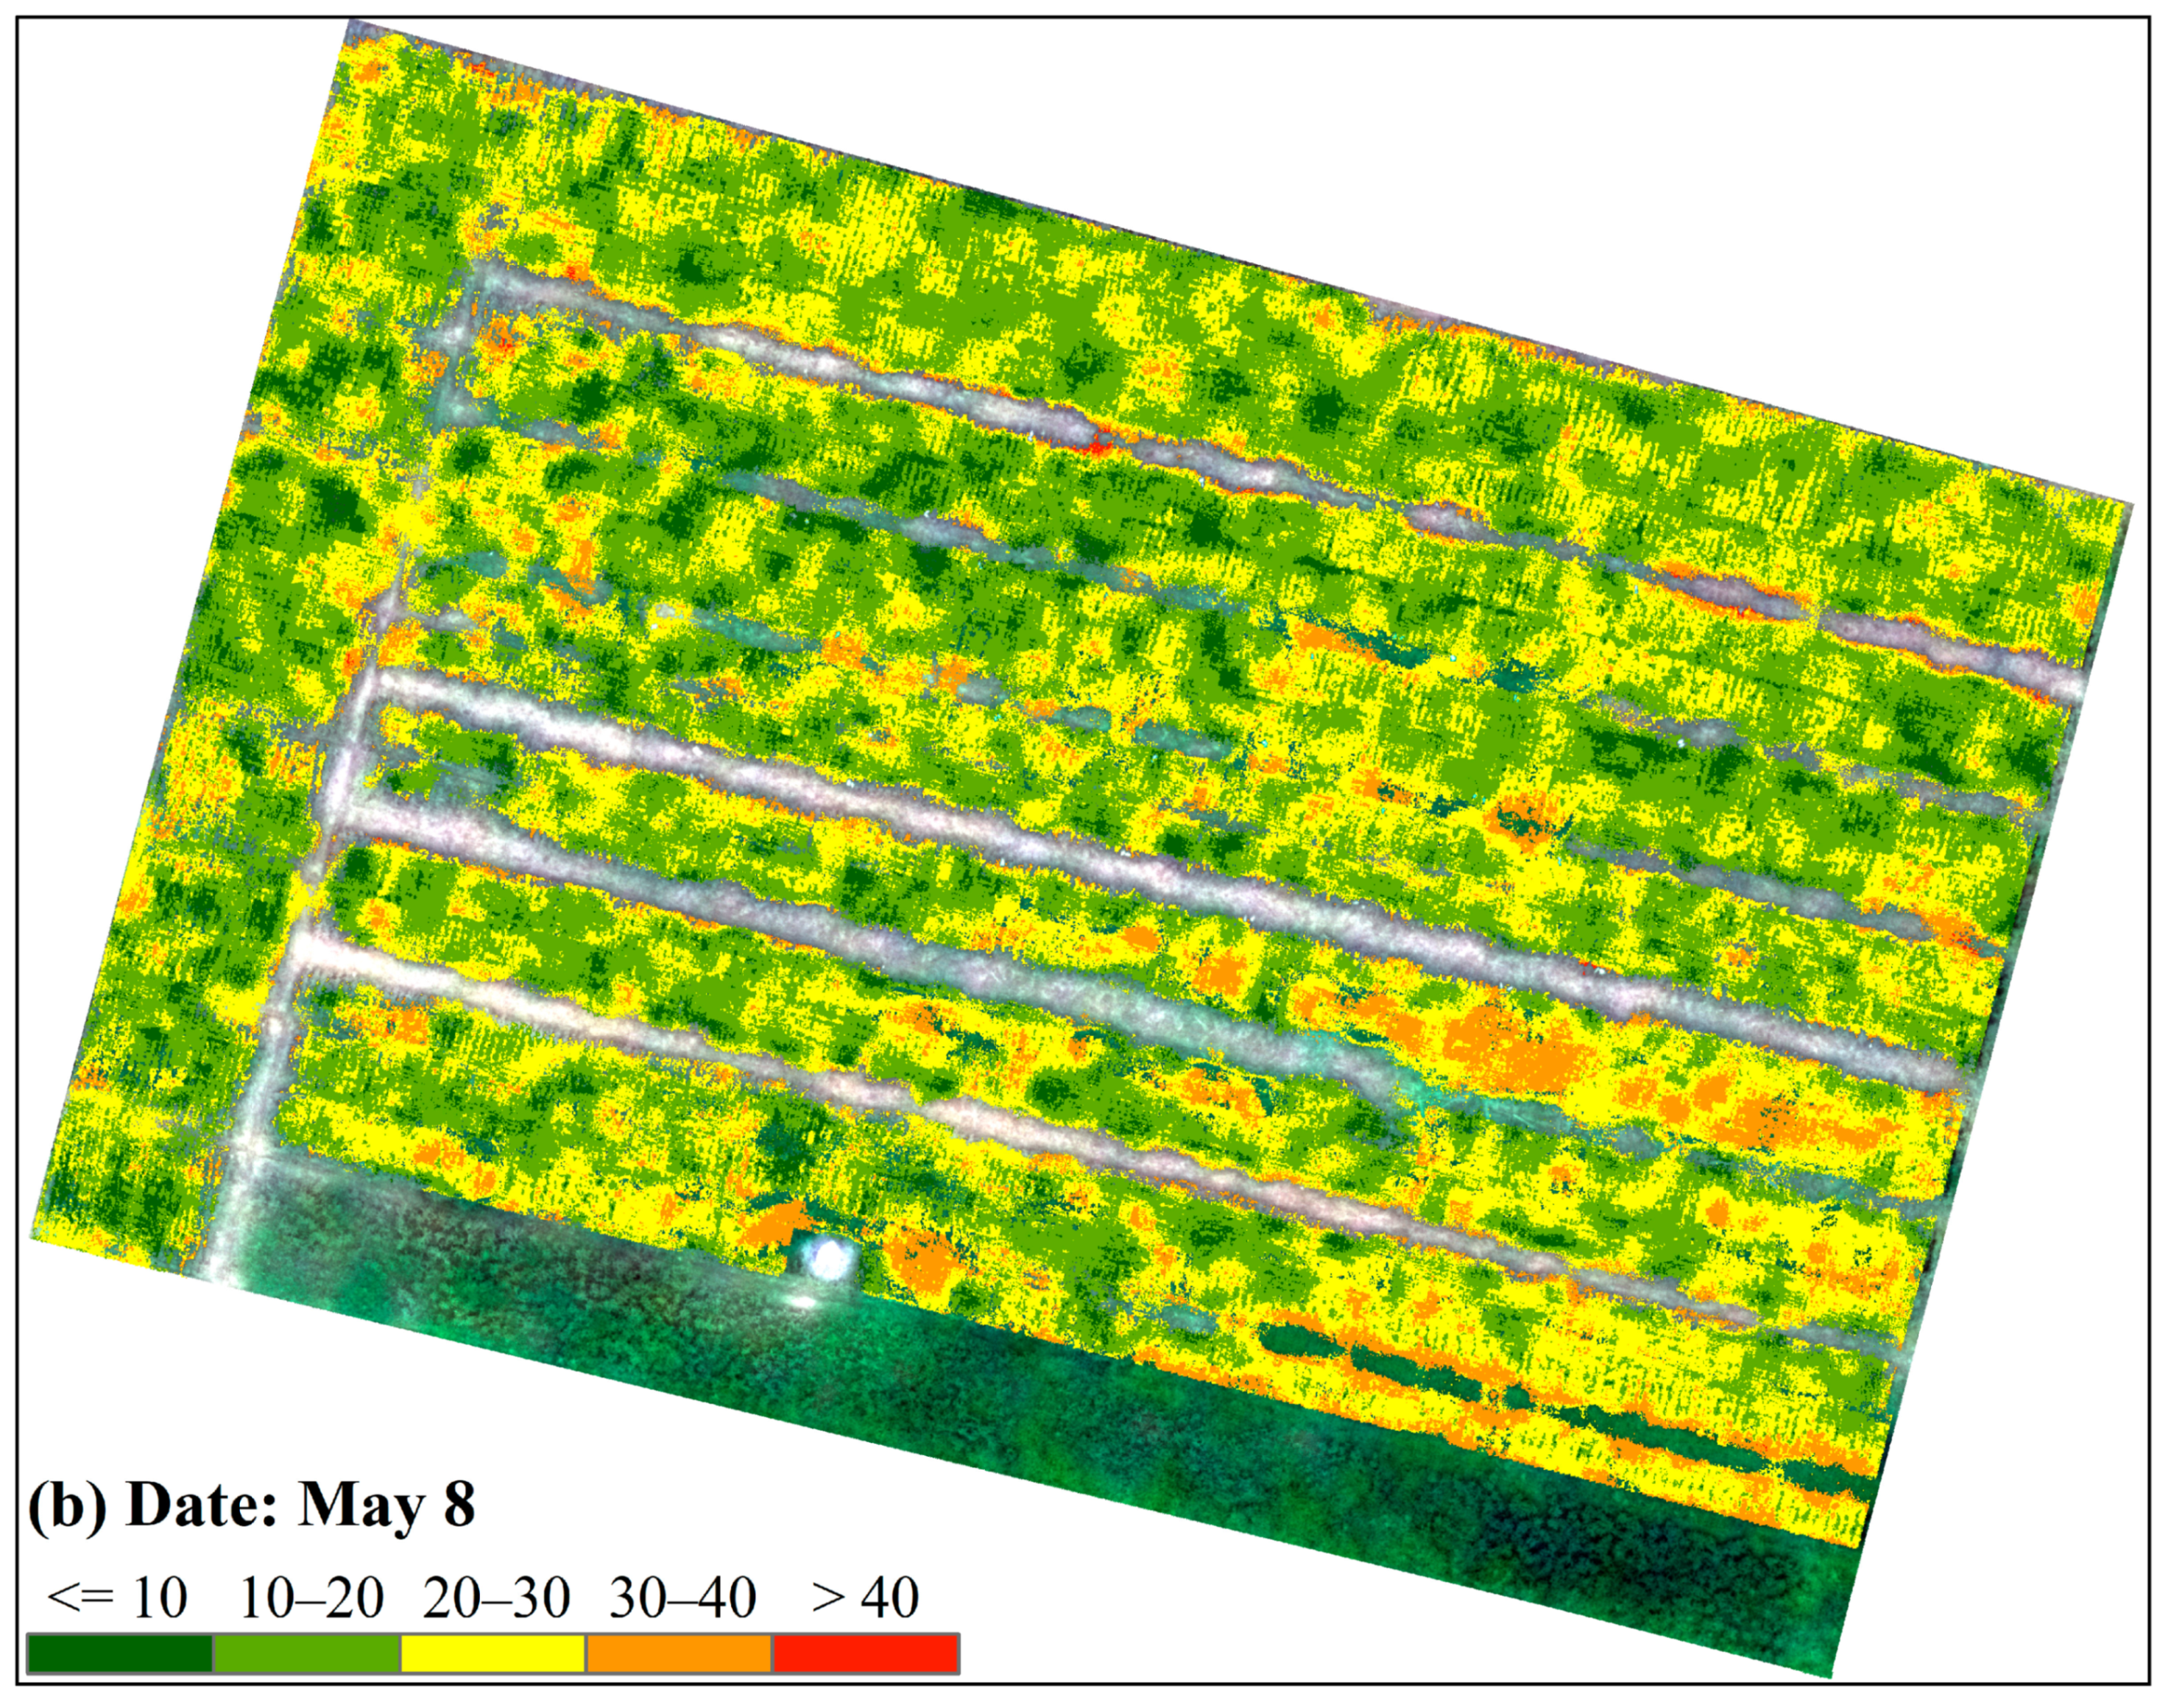
The optimal detection model, based on SBs + VIs + WFs that were normalized using the MMN algorithm, was adopted for mapping wheat FHB damage on 3 May and 8 May 2019. According to GB/T 15796-2011, DER values are classified into the following five ranges that reflect FHB harm degrees: mild (DER ≤ 10), mild-to-moderate (10 < DER ≤ 20), moderate (20 < DER ≤ 30), moderate-to-severe (30 < DER ≤ 40), severe (DER > 40). Figure 6 shows the spatial distribution of FHB-infected wheat on 3 May and 8 May 2019. It can be observed that wheat FHB developed rapidly over a short period of time. In order to quantify the spread, the area proportions corresponding to different FHB infection levels was calculated for the two dates (Table 3). On 3 May, although the wheat FHB infection had spread across the whole field, the overall disease level was moderate or lower. Specifically, the mild-to-moderate infection areas covered the highest proportion (61.4%), followed by mild infection areas (33.7%), and the remaining were mainly moderately infected (4.8%). On 8 May, although the proportion of mild-to-moderate infected areas was still the highest (47.7%), the proportion of moderately infected areas had increased rapidly, from 4.8% to 37.7%. Moderate-to-severe infected areas reached 8.1%, while mildly infected areas only accounted for 6.7%. These results are consistent with the infection characteristics of wheat FHB and our field survey.

3.3. Study Limitations and Future Work

In this study, we propose a wheat FHB detection model using a spectral feature combination of SBs, VIs and WFs extracted from UAV-based hyperspectral imagery, to estimate wheat FHB DER quantitatively. The result is promising, with a significant improvement in detecting wheat FHB DER compared with single WFs, and the combination of SBs and VIs. Still, there are several issues to be considered in future applications. In addition to spectral features, image texture, as a feature that can reflect the external changes of disease-infected target objects, has been widely used in disease monitoring [58,59]. Hence, the effectiveness of the texture features in wheat FHB detection should be investigated. Second, choosing the optimal spectral resolution of UAV-based imagery is essential for the accurate monitoring of diseases [19,29,60]. However, only two UAV images with a spatial resolution of 4 cm were acquired for detecting wheat FHB in this study. We will acquire UAV images at different spatial resolutions and at different flight altitudes, and study the optimal spatial resolution for wheat FHB detection. Third, the UAV-based imagery was obtained by a conventional way, perpendicular to the crop canopy in this study. However, due to the characteristic that FHB mainly infects wheat ears, the above-mentioned conventional method will lead to the loss of effective information about the disease. Currently, UAV-based multi-angle hyperspectral remote sensing imaging technology has been successfully applied to the fine vegetation classification [61]. Therefore, an appropriate UAV-based image acquisition angle can be tried to be determined to replace the conventional method, to capture more infection information of the disease in the future. Finally, wheat varieties, meteorological conditions, fertilization management, etc., affect the infection and development of wheat FHB [62,63,64]. In our study, these factors did not vary significantly. Besides, owing to the prevalence of FHB in our study field, no healthy wheat quadrats were registered. In the future, we will try to increase the number and variety of fields observed, collect multi-year sample data, which include healthy wheat, early diseased wheat, and wheat infected with different severities, and fully consider the above factors, to further improve robustness and extend our method to larger areas.

4. Conclusions

In this study, the quantitative detection of wheat FHB was achieved using a combination of SBs, VIs, and WFs extracted from UAV-based hyperspectral images. First, the three types of spectral features were extracted and optimized from the acquired UAV-based hyperspectral imagery on 3 May and 8 May 2019. A quantitative wheat FHB detection model, based on the optimal combination of SBs, VIs, and WFs, was then formulated using the SVM method. Two commonly used normalization algorithms (MMN and ZSN) were used before the construction of the detection models. The accuracy of the proposed wheat FHB detection model was tested using five-fold cross-validation based on field data, by comparing it with single WFs, and a combination of SBs and VIs (SBs + VIs). Finally, the wheat FHB damages of the field on 3 May and 8 May 2019 were mapped using the proposed detection model. Several conclusions were obtained. The WFs-based wheat FHB detection models outperformed the (SBs + VIs)-based models. No matter the initial or normalized spectral features, the spectral feature combination of SBs, VIs, and WFs can effectively improve the accuracy of the detection model. In all nine spectral feature combinations, SBs + VIs + WFs that were normalized using the MMN algorithm performed best in the detection of wheat FHB, with the highest R2 of 0.88 and the lowest RMSE of 2.68. The disease damage mapping result illustrates that wheat FHB developed very rapidly under suitable conditions. These results suggest that UAV-based hyperspectral imaging technology is promising for the detection of wheat FHB at field scale.
In this study, we were more concerned about the characterization capacity of the determined spectral features (including SBs, VIs, and WFs) for wheat FHB. For this, we focused on the period of the high incidence of the disease, during which the disease was obvious and could be detected. Meanwhile, the ground samples we collected for modeling were pure disease samples with different DERs, which did not confuse other information. Therefore, the spectral feature combination-based wheat FHB detection model that was proposed in this study was relatively reliable. However, more information should be considered in future studies. Apart from the crop growth and detailed disease information, some image spatial information (such as texture features and spatial resolutions) is also important. The feasibility of UAV-based hyperspectral imagery in wheat FHB detection under different acquisition angles should be tested. Meanwhile, wheat varieties, meteorological conditions, fertilization management, etc., which affect the spread of wheat FHB, should not be ignored. The number of infected fields and quadrats surveyed, the experimental year, and the ground sample types, should also be increased.

Author Contributions

Conceptualization, H.M. and W.H.; methodology, H.M. and Y.D.; data acquisition and processing, H.M., L.L. and A.G.; formal analysis, H.M.; writing—original draft preparation, H.M.; writing—review and editing, H.M., W.H. and Y.D.; funding acquisition, W.H. and Y.D. All authors have read and agreed to the published version of the manuscript.

Funding

This work was supported by the National Key R&D Program of China (2017YFE0122400), the National Natural Science Foundation of China (42071423), the Beijing Nova Program of Science and Technology (Z191100001119089), the China Postdoctoral Science Foundation (2020M680685), and the Special Research Assistant Project of CAS.

Institutional Review Board Statement

Not applicable.

Informed Consent Statement

Not applicable.

Data Availability Statement

Data sharing is not applicable to this article.

Conflicts of Interest

The authors declare no conflict of interest.

References

  1. Chen, X.M. Epidemiology and control of stripe rust [Puccinia striiformis f. sp. tritici] on wheat. Can. J. Plant Pathol. 2005, 27, 314–337. [Google Scholar] [CrossRef]
  2. Barbedo, J.G.A.; Tibola, C.S.; Fernandes, J.M.C. Detecting Fusarium head blight in wheat kernels using hyperspectral imaging. Biosyst. Eng. 2015, 131, 65–76. [Google Scholar] [CrossRef]
  3. Miedaner, T.; Schneider, B.; Geiger, H.H. Deoxynivalenol (DON) content and Fusarium head blight resistance in segregating populations of winter rye and winter wheat. Crop. Sci. 2003, 43, 519–526. [Google Scholar] [CrossRef]
  4. Yun, C.; Wang, J.; Yang, R.; Ma, Z.; University, Z. Current situation and management strategies of Fusarium head blight in China. Plant Prot. 2017, 43, 11–17. [Google Scholar]
  5. Ministry of Agriculture and Rural Affairs of the People’s Republic of China. Announcement No.333 of the Ministry of Agriculture and Rural Affairs of the People’s Republic of China. Available online: http://www.moa.gov.cn/govpublic/ZZYGLS/202009/t20200917_6352227.htm (accessed on 24 March 2021).
  6. Zhang, J.; Huang, Y.; Pu, R.; Gonzalez-Moreno, P.; Yuan, L.; Wu, K.; Huang, W. Monitoring plant diseases and pests through remote sensing technology: A review. Comput. Electron. Agric. 2019, 165, 104943. [Google Scholar] [CrossRef]
  7. Zhang, D.-Y.; Chen, G.; Yin, X.; Hu, R.-J.; Gu, C.-Y.; Pan, Z.-G.; Zhou, X.-G.; Chen, Y. Integrating spectral and image data to detect Fusarium head blight of wheat. Comput. Electron. Agric. 2020, 175, 105588. [Google Scholar] [CrossRef]
  8. Gu, C.; Wang, D.; Zhang, H.; Zhang, J.; Zhang, D.; Liang, D. Fusion of deep convolution and shallow features to recognize the severity of wheat Fusarium head blight. Front. Plant Sci. 2020, 11, 599886. [Google Scholar] [CrossRef]
  9. Jin, X.; Jie, L.; Wang, S.; Qi, H.J.; Li, S.W. Classifying wheat hyperspectral pixels of healthy heads and Fusarium head blight disease using a deep neural network in the wild field. Remote Sens. 2018, 10, 395. [Google Scholar] [CrossRef] [Green Version]
  10. Whetton, R.L.; Waine, T.W.; Mouazen, A.M. Hyperspectral measurements of yellow rust and fusarium head blight in cereal crops: Part 2: On-line field measurement. Biosyst. Eng. 2018, 167, 144–158. [Google Scholar] [CrossRef] [Green Version]
  11. Dammer, K.-H.; Möller, B.; Rodemann, B.; Heppner, D. Detection of head blight (Fusarium ssp.) in winter wheat by color and multispectral image analyses. Crop. Prot. 2011, 30, 420–428. [Google Scholar] [CrossRef]
  12. Boursianis, A.D.; Papadopoulou, M.S.; Diamantoulakis, P.; Liopa-Tsakalidi, A.; Barouchas, P.; Salahas, G.; Karagiannidis, G.; Wan, S.; Goudos, S.K. Internet of things (IoT) and agricultural unmanned aerial vehicles (UAVs) in smart farming: A comprehensive review. Internet Things 2020, 100187. in press. [Google Scholar] [CrossRef]
  13. Ivushkin, K.; Bartholomeus, H.; Bregt, A.K.; Pulatov, A.; Franceschini, M.H.D.; Kramer, H.; van Loo, E.N.; Jaramillo Roman, V.; Finkers, R. UAV based soil salinity assessment of cropland. Geoderma 2019, 338, 502–512. [Google Scholar] [CrossRef]
  14. Ishida, T.; Kurihara, J.; Viray, F.A.; Namuco, S.B.; Paringit, E.C.; Perez, G.J.; Takahashi, Y.; Marciano, J.J. A novel approach for vegetation classification using UAV-based hyperspectral imaging. Comput. Electron. Agric. 2018, 144, 80–85. [Google Scholar] [CrossRef]
  15. Tao, H.; Feng, H.; Xu, L.; Miao, M.; Long, H.; Yue, J.; Li, Z.; Yang, G.; Yang, X.; Fan, L. Estimation of crop growth parameters using UAV-based hyperspectral remote sensing data. Sensors 2020, 20, 1296. [Google Scholar] [CrossRef] [PubMed] [Green Version]
  16. Zhou, X.; Zheng, H.B.; Xu, X.Q.; He, J.Y.; Ge, X.K.; Yao, X.; Cheng, T.; Zhu, Y.; Cao, W.X.; Tian, Y.C. Predicting grain yield in rice using multi-temporal vegetation indices from UAV-based multispectral and digital imagery. ISPRS J. Photogramm. Remote Sens. 2017, 130, 246–255. [Google Scholar] [CrossRef]
  17. Maimaitijiang, M.; Sagan, V.; Sidike, P.; Hartling, S.; Esposito, F.; Fritschi, F.B. Soybean yield prediction from UAV using multimodal data fusion and deep learning. Remote Sens. Environ. 2020, 237, 111599. [Google Scholar] [CrossRef]
  18. Su, J.; Liu, C.; Coombes, M.; Hu, X.; Wang, C.; Xu, X.; Li, Q.; Guo, L.; Chen, W.-H. Wheat yellow rust monitoring by learning from multispectral UAV aerial imagery. Comput. Electron. Agric. 2018, 155, 157–166. [Google Scholar] [CrossRef]
  19. Ye, H.; Huang, W.; Huang, S.; Cui, B.; Dong, Y.; Guo, A.; Ren, Y.; Jin, Y. Recognition of banana fusarium wilt based on UAV remote sensing. Remote Sens. 2020, 12, 938. [Google Scholar] [CrossRef] [Green Version]
  20. Liu, L.; Dong, Y.; Huang, W.; Du, X.; Ma, H. Monitoring wheat fusarium head blight using unmanned aerial vehicle hyperspectral imagery. Remote Sens. 2020, 12, 3811. [Google Scholar] [CrossRef]
  21. Xiao, Y.; Dong, Y.; Huang, W.; Liu, L.; Ma, H. Wheat fusarium head blight detection using UAV-based spectral and texture features in optimal window size. Remote Sens. 2021, 13, 2437. [Google Scholar] [CrossRef]
  22. Alisaac, E.; Behmann, J.; Kuska, M.T.; Dehne, H.W.; Mahlein, A.K. Hyperspectral quantification of wheat resistance to Fusarium head blight: Comparison of two Fusarium species. Eur. J. Plant Pathol. 2018, 152, 869–884. [Google Scholar] [CrossRef]
  23. Huang, L.; Wu, Z.; Huang, W.; Ma, H.; Zhao, J. Identification of fusarium head blight in winter wheat ears based on fisher’s linear discriminant analysis and a support vector machine. Appl. Sci. 2019, 9, 3894. [Google Scholar] [CrossRef] [Green Version]
  24. Bauriegel, E.; Giebel, A.; Geyer, M.; Schmidt, U.; Herppich, W. Early detection of Fusarium infection in wheat using hyper-spectral imaging. Comput. Electron. Agric. 2011, 75, 304–312. [Google Scholar] [CrossRef]
  25. Cheng, T.; Rivard, B.; Sánchez-Azofeifa, G.; Feng, J.; Calvo-Polanco, M. Continuous wavelet analysis for the detection of green attack damage due to mountain pine beetle infestation. Remote Sens. Environ. 2010, 114, 899–910. [Google Scholar] [CrossRef]
  26. Shi, Y.; Huang, W.; González-Moreno, P.; Luke, B.; Dong, Y.; Zheng, Q.; Ma, H.; Liu, L. Wavelet-based rust spectral feature set (WRSFs): A novel spectral feature set based on continuous wavelet transformation for tracking progressive host–pathogen interaction of yellow rust on wheat. Remote Sens. 2018, 10, 525. [Google Scholar] [CrossRef] [Green Version]
  27. Ma, H.; Huang, W.; Jing, Y.; Pignatti, S.; Laneve, G.; Dong, Y.; Ye, H.; Liu, L.; Guo, A.; Jiang, J. Identification of fusarium head blight in winter wheat ears using continuous wavelet analysis. Sensors 2020, 20, 20. [Google Scholar] [CrossRef] [Green Version]
  28. Zhang, J.; Pu, R.; Loraamm, R.W.; Yang, G.; Wang, J. Comparison between wavelet spectral features and conventional spectral features in detecting yellow rust for winter wheat. Comput. Electron. Agric. 2014, 100, 79–87. [Google Scholar] [CrossRef]
  29. Guo, A.; Huang, W.; Dong, Y.; Ye, H.; Ma, H.; Liu, B.; Wu, W.; Ren, Y.; Ruan, C.; Geng, Y. Wheat yellow rust detection using UAV-based hyperspectral technology. Remote Sens. 2021, 13, 123. [Google Scholar] [CrossRef]
  30. Cheng, T.; Rivard, B.; Sanchez-Azofeifa, A. Spectroscopic determination of leaf water content using continuous wavelet analysis. Remote Sens. Environ. 2011, 115, 659–670. [Google Scholar] [CrossRef]
  31. Torrence, C.; Compo, G.P. A practical guide to wavelet analysis. Bull. Am. Meteorol. Soc. 1998, 79, 61–78. [Google Scholar] [CrossRef] [Green Version]
  32. Zheng, Q.; Huang, W.; Ye, H.; Dong, Y.; Shi, Y.; Chen, S. Using continous wavelet analysis for monitoring wheat yellow rust in different infestation stages based on unmanned aerial vehicle hyperspectral images. Appl. Opt. 2020, 59, 8003–8013. [Google Scholar] [CrossRef]
  33. Gitelson, A.A.; Merzlyak, M.N.; Chivkunova, O.B. Optical properties and nondestructive estimation of anthocyanin content in plant leaves. Photochem. Photobiol. 2001, 74, 38–45. [Google Scholar] [CrossRef]
  34. Daughtry, C.S.; Walthall, C.; Kim, M.; De Colstoun, E.B.; McMurtrey, J., III. Estimating corn leaf chlorophyll concentration from leaf and canopy reflectance. Remote Sens. Environ. 2000, 74, 229–239. [Google Scholar] [CrossRef]
  35. Chen, J.M. Evaluation of vegetation indices and a modified simple ratio for boreal applications. Can. J. Remote Sens. 1996, 22, 229–242. [Google Scholar] [CrossRef]
  36. Tucker, C.J. Red and photographic infrared linear combinations for monitoring vegetation. Remote Sens. Environ. 1979, 8, 127–150. [Google Scholar] [CrossRef] [Green Version]
  37. Robert, P.C.; Rust, R.H.; Larson, W.E.; Bausch, W.C.; Duke, H.R.; Iremonger, C. Assessment of Plant Nitrogen in Irrigated Corn. In Proceedings of the 3rd International Conference on Precision Agriculture, Madison, WI, USA, 23–26 June 1996. [Google Scholar] [CrossRef]
  38. Gamon, J.A.; Peñuelas, J.; Field, C.B. A narrow-waveband spectral index that tracks diurnal changes in photosynthetic efficiency. Remote Sens. Environ. 1992, 41, 35–44. [Google Scholar] [CrossRef]
  39. Merzlyak, M.N.; Gitelson, A.A.; Chivkunova, O.B.; Rakitin, V.Y. Non-destructive optical detection of pigment changes during leaf senescence and fruit ripening. Physiol. Plant. 1999, 106, 135–141. [Google Scholar] [CrossRef] [Green Version]
  40. Merton, R.; Huntington, J. Early simulation results of the ARIES-1 satellite sensor for multi-temporal vegetation research derived from AVIRIS. In Proceedings of the 8th Annual JPL Airborne Earth Science Workshop, Pasadena, CA, USA, 9–11 February 1999; pp. 9–11. [Google Scholar]
  41. Broge, N.H.; Leblanc, E. Comparing prediction power and stability of broadband and hyperspectral vegetation indices for estimation of green leaf area index and canopy chlorophyll density. Remote Sens. Environ. 2001, 76, 156–172. [Google Scholar] [CrossRef]
  42. Scholkopf, B. Support vector machines. IEEE Intell. Syst. 1998, 13, 18–28. [Google Scholar]
  43. Ma, H.; Jing, Y.; Huang, W.; Shi, Y.; Dong, Y.; Zhang, J.; Liu, L. Integrating early growth information to monitor winter wheat powdery mildew using multi-temporal landsat-8 imagery. Sensors 2018, 18, 3290. [Google Scholar] [CrossRef] [Green Version]
  44. Ma, H.; Huang, W.; Jing, Y.; Yang, C.; Han, L.; Dong, Y.; Ye, H.; Shi, Y.; Zheng, Q.; Liu, L.; et al. Integrating growth and environmental parameters to discriminate powdery mildew and aphid of winter wheat using bi-temporal Landsat-8 imagery. Remote Sens. 2019, 11, 846. [Google Scholar] [CrossRef] [Green Version]
  45. Huang, L.; Jiang, J.; Huang, W.; Ye, H.; Zhao, J.; Ma, H.; Ruan, C. Wheat yellow rust monitoring based on Sentinel-2 Image and BPNN model. Trans. Chin. Soc. Agric. Eng. 2019, 35, 178–185. [Google Scholar]
  46. Amari, S.; Wu, S. Improving support vector machine classifiers by modifying kernel functions. Neural Netw. 1999, 12, 783–789. [Google Scholar] [CrossRef]
  47. Rumpf, T.; Mahlein, A.K.; Steiner, U.; Oerke, E.C.; Dehne, H.W.; Plümer, L. Early detection and classification of plant diseases with Support Vector Machines based on hyperspectral reflectance. Comput. Electron. Agric. 2010, 74, 91–99. [Google Scholar] [CrossRef]
  48. Singh, D.; Singh, B. Investigating the impact of data normalization on classification performance. Appl. Soft Comput. 2020, 97, 105524. [Google Scholar] [CrossRef]
  49. Hoang, N.-D.; Pham, A.-D. Hybrid artificial intelligence approach based on metaheuristic and machine learning for slope stability assessment: A multinational data analysis. Expert Syst. Appl. 2016, 46, 60–68. [Google Scholar] [CrossRef]
  50. Kadariya, M. Progress from Five Fears of Selecting for Resistance to Fusarium Head Blight Severity in Spring Wheat; South Dakota State University: Brookings, SD, USA, 2006. [Google Scholar]
  51. Kang, Z.; Buchenauer, H. A cytological and ultrastructural study on the infection process of Fusarium culmorum on wheat spikes. Mycol. Res. 2000, 104, 1083–1093. [Google Scholar] [CrossRef]
  52. Al Masri, A.; Hau, B.; Dehne, H.-W.; Mahlein, A.-K.; Oerke, E.-C. Impact of primary infection site of Fusarium species on head blight development in wheat ears evaluated by IR-thermography. Eur. J. Plant Pathol. 2017, 147, 855–868. [Google Scholar] [CrossRef]
  53. Huang, W.; Lu, J.; Ye, H.; Kong, W.; Mortimer, A.H.; Shi, Y. Quantitative identification of crop disease and nitrogen-water stress in winter wheat using continuous wavelet analysis. Int. J. Agric. Biol. Eng. 2018, 11, 145–152. [Google Scholar] [CrossRef] [Green Version]
  54. Blackburn, G.A.; Ferwerda, J.G. Retrieval of chlorophyll concentration from leaf reflectance spectra using wavelet analysis. Remote Sens. Environ. 2008, 112, 1614–1632. [Google Scholar] [CrossRef]
  55. Li, W.; Liu, Z. A method of SVM with normalization in intrusion detection. Procedia Environ. Sci. 2011, 11, 256–262. [Google Scholar] [CrossRef] [Green Version]
  56. Tang, R.; Duan, H.; Sun, H. Research on data normalization for SVM training. J. Shandong Norm. Univ. Nat. Sci. 2016, 31, 60–65. [Google Scholar]
  57. Huang, Y.M.; Hung, C.M.; Jiau, H.C. Evaluation of neural networks and data mining methods on a credit assessment task for class imbalance problem. Nonlinear Anal. Real World Appl. 2006, 7, 720–747. [Google Scholar] [CrossRef]
  58. Pydipati, R.; Burks, T.F.; Lee, W.S. Identification of citrus disease using color texture features and discriminant analysis. Comput. Electron. Agric. 2006, 52, 49–59. [Google Scholar] [CrossRef]
  59. Hu, G.; Yin, C.; Wan, M.; Zhang, Y.; Fang, Y. Recognition of diseased Pinus trees in UAV images using deep learning and AdaBoost classifier. Biosyst. Eng. 2020, 194, 138–151. [Google Scholar] [CrossRef]
  60. Dash, J.P.; Watt, M.S.; Pearse, G.D.; Heaphy, M.; Dungey, H.S. Assessing very high resolution UAV imagery for monitoring forest health during a simulated disease outbreak. ISPRS J. Photogramm. Remote Sens. 2017, 131, 1–14. [Google Scholar] [CrossRef]
  61. Yan, Y.; Deng, L.; Liu, X.; Zhu, L. Application of UAV-based multi-angle hyperspectral remote sensing in fine vegetation classification. Remote Sens. 2019, 11, 2753. [Google Scholar] [CrossRef] [Green Version]
  62. Shah, D.; De Wolf, E.; Paul, P.; Madden, L. Functional data analysis of weather variables linked to Fusarium head blight epidemics in the United States. Phytopathology 2019, 109, 96–110. [Google Scholar] [CrossRef] [Green Version]
  63. Lemmens, M.; Haim, K.; Lew, H.; Ruckenbauer, P. The effect of nitrogen fertilization on fusarium head blight development and deoxynivalenol contamination in wheat. J. Phytopathol. 2004, 152, 1–8. [Google Scholar] [CrossRef]
  64. Mesterházy, Á.; Tóth, B.; Varga, M.; Bartók, T.; Szabó-Hevér, Á.; Farády, L.; Lehoczki-Krsjak, S. Role of fungicides, application of nozzle types, and the resistance level of wheat varieties in the control of fusarium head blight and deoxynivalenol. Toxins 2011, 3, 1453–1483. [Google Scholar] [CrossRef] [PubMed] [Green Version]
Figure 1. Experimental area location and field survey sampling positions.
Remotesensing 13 03024 g001
Figure 2. Methodological framework of wheat FHB detection model.
Remotesensing 13 03024 g002
Figure 3. Disease-sensitive wavelet regions extracted from UAV hyperspectral imagery.
Remotesensing 13 03024 g003
Figure 4. R2 among different features of each spectral feature type: (a) SBs, (b) VIs, and (c) WFs.
Remotesensing 13 03024 g004aRemotesensing 13 03024 g004b
Figure 5. Scatter plots of measured DER versus estimated DER of SVM detection models based on (ac) initial spectral feature combinations of SBs, VIs, and WFs; (df) spectral feature combinations of SBs, VIs, and WFs normalized using MMN algorithm; and (gi) spectral feature combinations of SBs, VIs, and WFs normalized using ZSN algorithm.
Remotesensing 13 03024 g005
Figure 6. Damage maps of wheat FHB on (a) 3 May and (b) 8 May 2019, obtained using the normalized (SBs + VIs + WFs)-based SVM detection model.
Remotesensing 13 03024 g006aRemotesensing 13 03024 g006b
Table 1. VIs used for detecting wheat FHB in this study.
DefinitionEquationApplicationReference
Anthocyanin reflectance index, ARI(R550)−1 − (R700)−1Evaluate anthocyanin[33]
Modified chlorophyll absorption reflectance index, MCAVI((R701R671) − 0.2(R701R549))/(R701/R671)Sensitive to leaf area index and chlorophyll[34]
Modified simple ratio index, MSR(R800/R670 − 1)/sqrt(R800/R670 + 1)Sensitive to chlorophyll content change and can avoid influence of environmental factors such as cloud and soil[35]
Normalized difference vegetation index, NDVI(R830R670)/(R830 + R670)Related to canopy greenness and vegetation coverage[36]
Nitrogen reflectance index, NRI(R570R670)/(R570 + R670)Evaluate nitrogen status[37]
Photochemical reflectance index, PRI(R570R531)/(R570 + R531)Sensitive to photosynthetic radiation[38]
Physiological reflectance index, PhRI(R550R531)/(R550 + R531)Sensitive to light use efficiency[38]
Plant senescence reflectance index, PSRI(R680R500)/R750Sensitive to leaf senescence[39]
Red-edge vegetation stress index, RVSI((R712 + R752)/2) − R732Sensitive to vegetation stress[40]
Triangular vegetation index, TVI0.5(120(R750R550) − 200(R670R550))Related to plant status[41]
Table 2. Optimal spectral features for detecting wheat FHB.
Spectral Feature TypeRp-Value
Spectral bands (SBs)SB01: Band 8, 478 nm0.484***
SB06: Band 64, 702 nm0.488***
SB13: Band 125, 946 nm0.479***
Vegetation indices (VIs)MCARI0.452***
PRI0.313***
PhRI0.257**
PSRI0.291**
RVSI−0.403***
Wavelet features (WFs)WF01: 23, 450 nm−0.411***
WF06: 22, 470 nm0.430***
WF07: 21, 502 nm−0.412***
WF10: 22, 566 nm0.412***
WF11: 23, 590 nm0.475***
WF12: 22, 618 nm0.423***
WF13: 26, 618 nm0.507***
WF16: 23, 650 nm−0.419***
WF22: 22, 806 nm0.361***
Note: ** and *** mean that the correlation significance reaches 0.01 and 0.001 significant levels, respectively.
Table 3. Area proportions with different FHB infection levels on 3 May and 8 May 2019.
DateArea Proportion under Different FHB Infection Levels/%
MildMild-to-ModerateModerateModerate-to-SevereSevereSum
3 May 201933.761.44.80.10100
8 May 20196.747.437.78.10.1100
Publisher’s Note: MDPI stays neutral with regard to jurisdictional claims in published maps and institutional affiliations.