Article

A Comprehensive Evaluation of Key Tropospheric Parameters from ERA5 and MERRA-2 Reanalysis Products Using Radiosonde Data and GNSS Measurements

1
College of Geomatics and Geoinformation, Guilin University of Technology, Guilin 541004, China
2
Guangxi Key Laboratory of Spatial Information and Geomatics, Guilin 541004, China
3
School of Geodesy and Geomatics, Wuhan University, Wuhan 430079, China
*
Author to whom correspondence should be addressed.
Remote Sens. 2021, 13(15), 3008; https://doi.org/10.3390/rs13153008
Submission received: 18 June 2021 / Revised: 23 July 2021 / Accepted: 29 July 2021 / Published: 30 July 2021
(This article belongs to the Special Issue Climate Modelling and Monitoring Using GNSS)

Abstract

:
Tropospheric delay is a major error source in the Global Navigation Satellite System (GNSS), and the weighted mean temperature (Tm) is a key parameter in precipitable water vapor (PWV) retrieval. Although reanalysis products like the National Centers for Environmental Prediction (NCEP) and the European Center for Medium-Range Weather Forecasts (ECMWF) Re-Analysis-Interim (ERA-Interim) data have been used to calculate and model the tropospheric delay, Tm, and PWV, the limitations of the temporal and spatial resolutions of the reanalysis data have affected their performance. The release of the fifth-generation accurate global atmospheric reanalysis (ERA5) and the second Modern-Era Retrospective analysis for Research and Applications (MERRA-2) provide the opportunity to overcome these limitations. The performances of the zenith tropospheric delay (ZTD), zenith wet delay (ZWD), Tm, and zenith hydrostatic delay (ZHD) of ERA5 and MERRA-2 data from 2016 to 2017 were evaluated in this work using GNSS ZTD and radiosonde data over the globe. Taking GNSS ZTD as a reference, the ZTD calculated from MERRA-2 and ERA5 pressure-level data were evaluated in temporal and spatial scales, with an annual mean bias and root mean square (RMS) of 2.3 and 10.9 mm for ERA5 and 4.5 and 13.1 mm for MERRA-2, respectively. Compared to radiosonde data, the ZHD, ZWD, and Tm derived from ERA5 and MERRA-2 data were also evaluated on temporal and spatial scales, with annual mean bias values of 1.1, 1.7 mm, and 0.14 K for ERA5 and 0.5, 4.8 mm, and –0.08 K for MERRA-2, respectively. Meanwhile, the annual mean RMS was 4.5, 10.5 mm, and 1.03 K for ERA5 and 4.4, 13.6 mm, and 1.17 K for MERRA-2, respectively. Tropospheric parameters derived from MERRA-2 and ERA5, with improved temporal and spatial resolutions, can provide a reference for GNSS positioning and PWV retrieval.

1. Introduction

Tropospheric delay and weighted mean temperature (Tm) are key tropospheric parameters for high-accuracy positioning/navigation and precipitable water vapor (PWV) retrieval in space geodetic techniques [1,2,3,4,5,6]. Hence, this should be considered carefully. The Saastamoinen model can calculate with high accuracy the zenith hydrostatic delay (ZHD) based on the condition of obtaining accurate meteorological parameters. However, not all Global Navigation Satellite System (GNSS) stations are equipped with meteorological sensors. Meanwhile, the distribution of GNSS stations is uneven; most of them are distributed on land and few are distributed in the ocean. The high-accuracy prior zenith wet delay (ZWD) can effectively reduce the convergence time and improve the positioning precision in precise point positioning (PPP) [7,8,9]. Meanwhile, tropospheric parameter information with high precision and high spatial and temporal resolution is an important data source for establishing a model of tropospheric delay and weighted mean temperature. Therefore, it is very important to obtain high-precision tropospheric parameters.
Reanalysis data are an effective means to calculate tropospheric delay and weighted mean temperature [10,11]. Meanwhile, many global or regional Tm and tropospheric delays models, such as the Global Pressure and Temperature 2 wet (GPT2w) [12], GPT3 [13], TropGrid2 [14], Improved Tropospheric Grid (ITG) [15], Improved GPT2w (IGPT2w) [16], and GGTm models [17], have been established based on reanalysis products. This indicates that tropospheric parameters derived from reanalysis products, including ZWD, Tm, and zenith tropospheric delay (ZTD), play an important role in the modeling of tropospheric parameters and GNSS meteorology. Thus, evaluating the performance of the key tropospheric parameters derived from reanalysis data is a necessary and meaningful research task.
GNSS ZTD and radiosonde data have often been used to validate the accuracies of ZWD, ZTD, ZHD, and Tm values calculated from reanalysis products and tropospheric models. Zhang et al. [18] assessed the performances of the fifth-generation European Centre for Medium-Range Weather Forecasts (ECMWF) Re-Analysis (ERA5) meteorological parameters by comparing data obtained from meteorological and radiosonde stations in China, which showed that the accuracies of Tm and PWV derived from ERA5 are high in China. Pedro et al. [19] established an hourly global pressure and temperature (HGPT) model based on ERA5 data and tested it using radiosonde data, concluding that the high-precision HGPT model can be helpful for GNSS meteorology and climate studies, and other topics. Li et al. [20] established a new model to calculate pressure, temperature, and water vapor pressure in China using ERA5 data and validated it using ERA5 data and radiosonde data, finding that the model had a higher precision when calculating these parameters compared to the GPT2w model. Sun et al. [21] built a high spatial and temporal resolution model to calculate tropospheric delay and Tm using ERA5 data. It was found that the model was able to provide higher accuracy tropospheric delay and Tm information compared to GNSS ZTD and radiosonde data. Vedel et al. [22] evaluated the accuracies of zenith delays from meteorological data tested by radiosonde and GPS delays. The results indicated that the zenith delays from meteorological data have high precision, and numerical integration had a better effect for calculating zenith delays than the Saastamoinen model. Zhou et al. [23] assessed the accuracy of ERA5 ZTD calculated by ray-traced with respect to GNSS ZTD, which showed that ERA5 ZTD had a high accuracy with a root mean square (RMS) of 1.01 cm. In summary, the feasibility of using radiosonde and GNSS data to test the performances of ZTD, ZWD, ZHD, and Tm calculated from reanalysis data has been demonstrated.
ERA5 was released by ECMWF, with higher temporal and spatial resolutions compared to ERA-Interim [24,25]. In addition, the second Modern-Era Retrospective analysis for Research and Applications (MERRA-2) has been shown to have very high spatial and temporal resolutions [26,27]. Therefore, it is necessary to verify the feasibility and accuracy of the key tropospheric parameters from ERA5 and MERRA-2 reanalysis products. Although some studies have assessed the accuracy of ERA5 ZTD [23,28], the accuracies of ZWD, ZHD, and Tm from ERA5 have not been verified worldwide. At the same time, the temporal and spatial variation features of ZTD, ZWD, ZHD, and Tm’s biases as well as RMS over the globe have yet to be further analyzed. In addition, as for the comparisons, the accuracies and spatiotemporal variation characteristics of ZTD, ZHD, ZWD, and Tm from MERRA-2 and ERA5 have not been made. Therefore, the current study aimed to use GNSS ZTD products and radiosonde data to (1) verify the accuracies of ERA5 and MERRA-2 tropospheric parameters over the globe and (2) to analyze the spatiotemporal variation characteristics of the tropospheric parameters from ERA5 and MERRA-2, and compare them with each other.
The data and methodology for ZTD, ZWD, ZHD, and Tm calculated from MERRA-2 and ERA5 data are presented first. Then, we comprehensively evaluate the performances of the ZTD, ZWD, ZHD, and Tm derived from MERRA-2 and ERA5 reanalysis data. Finally, we summarize the conclusions of this work.

2. Data and Methodology

2.1. Data Description

The main data used in this study were the ERA5 reanalysis data from ECMWF; MERRA-2 reanalysis data from the National Aeronautics and Space Administration (NASA); GNSS observations collected from the International GNSS Service (IGS); radiosonde data from the websites of the University of Wyoming, both from 2016 to 2017. The performances of key tropospheric parameters derived from MERRA-2 and ERA5 reanalysis data were analyzed by comparing the GNSS observations and radiosonde data on a global scale.

2.1.1. Reanalysis Products
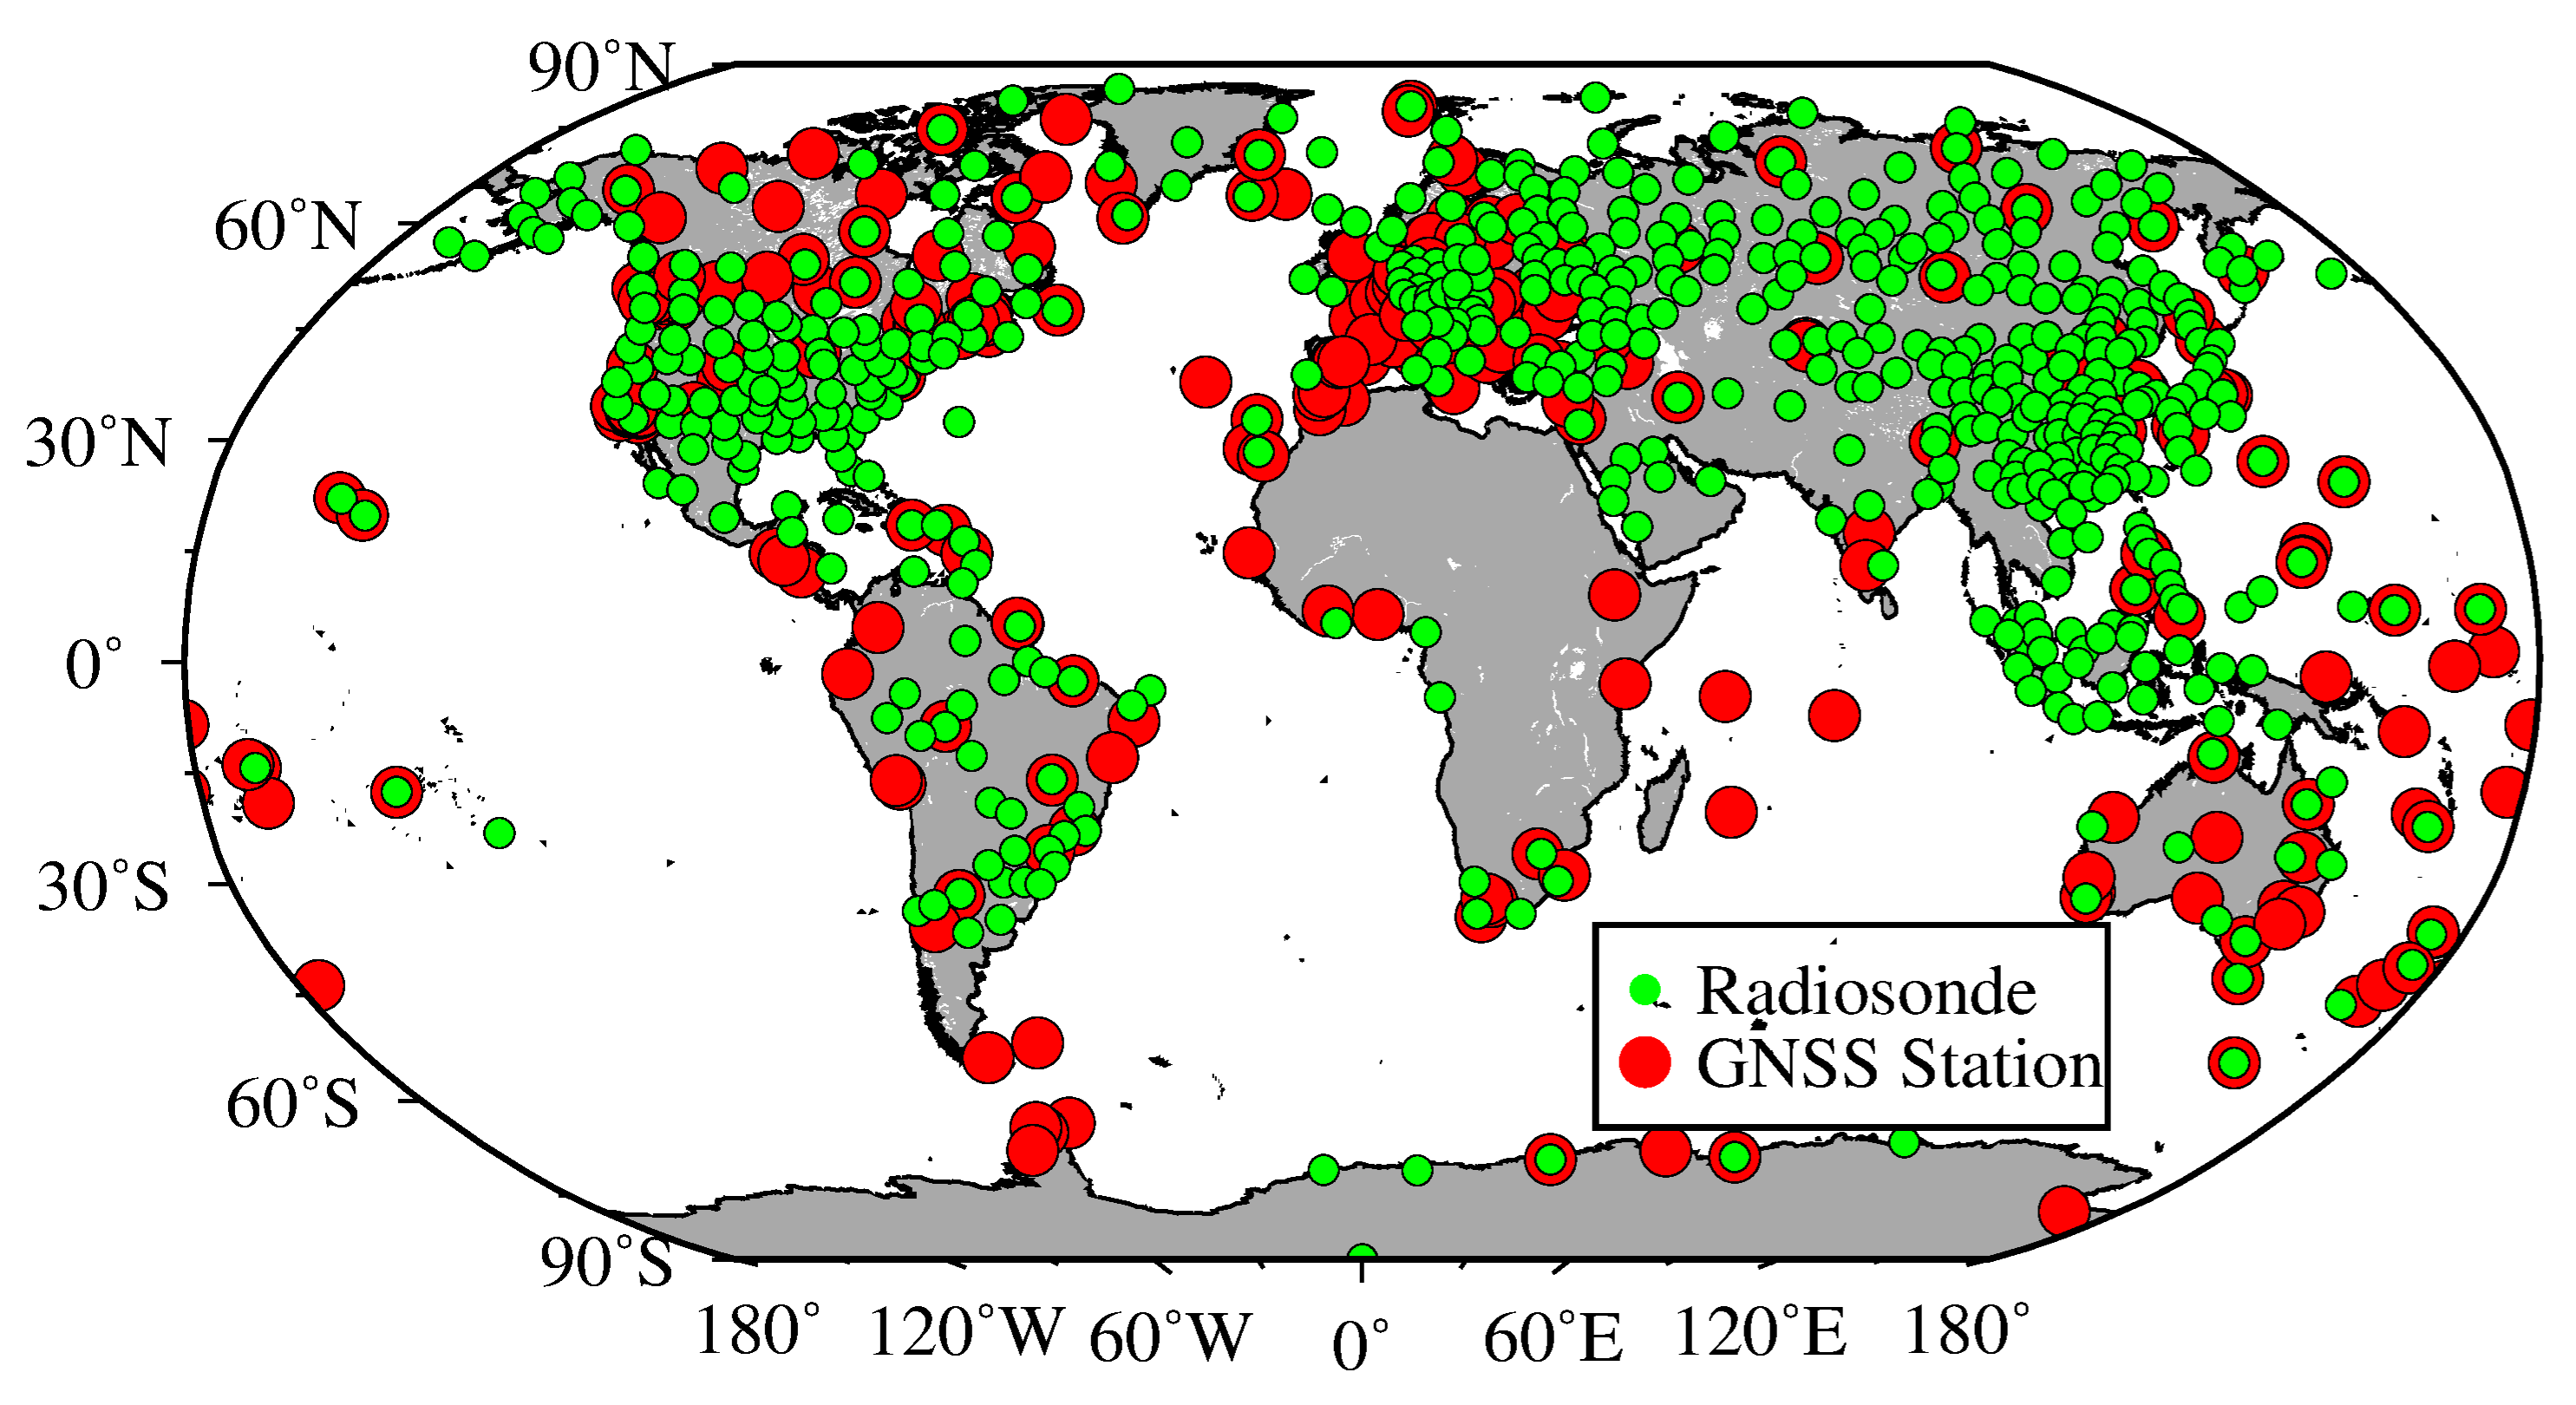
MERRA-2 and ERA5 are the latest reanalysis products from NASA and ECMWF, respectively. The surface-level and pressure-level data of MERRA-2 (https://goldsmr4.gesdisc.eosdis.nasa.gov/data/MERRA2, accessed on 1 June 2021) and ERA5 (https://www.ecmwf.int/en/forecasts/datasets/reanalysis-datasets/era5, accessed on 1 June 2021) were used in the current study. The MERRA-2 hourly surface-level data have a horizontal resolution of 0.625 ° × 0.5 ° including temperature, geopotential height, surface pressure, and specific humidity. The ERA5 hourly surface-level data have a horizontal resolution of 0.25 ° × 0.25 ° , containing temperature, geopotential, surface pressure, and surface specific humidity. The geopotential data are divided by gravity acceleration to obtain geopotential heights. The MERRA-2 6 hourly pressure-level data have a horizontal resolution of 0.625 ° × 0.5 ° and a vertical resolution of 42 levels from 1000 to 0.1 hPa and comprise temperature, geopotential height, and specific humidity. Compared to the MERRA-2 pressure-level data, the ERA5 pressure-level data have a temporal resolution of 1 h, the horizontal resolution of 0.25 ° × 0.25 ° , and vertical resolution of 37 levels from 1000 to 1 hPa involving temperature, geopotential, and specific humidity.

2.1.2. GNSS Data

IGS can offer ZTD products with a temporal resolution of 5 min and accuracy of 4 mm [29] (https://cddis.nasa.gov/archive/gnss/products/troposphere/zpd/, accessed on 1 June 2021). We obtained 6 hourly and hourly ZTD products from IGS to evaluate the ZTD from reanalysis products. The GNSS ZTD were collected at 290 GNSS stations in the IGS as shown in Figure 1.

2.1.3. Radiosonde Data

Radiosonde data can be used as a reference to evaluate the accuracies of ZWD and Tm derived from reanalysis data [30,31,32]. In addition, radiosonde data can also provide measured meteorological parameters such as water vapor pressure, atmospheric pressure, and temperature. We can use these meteorological parameters to calculate ZHD and ZTD using the Saastamoinen model, and which are used as the reference to validate the performances of ZHD and ZTD from reanalysis products. The radiosonde data from the websites of the University of Wyoming can be accessed freely (http://weather.uwyo.edu/upperair/sounding.html, accessed on 1 June 2021). Figure 1 shows the distribution of 545 radiosonde stations over the globe.

2.2. Methods

2.2.1. Deriving ZTD, ZHD, ZWD, and Tm from ERA5 and MERRA-2 Surface- and Pressure-Level Data

The Saastamoinen model method was used to calculate the ZHD, ZTD, and ZWD from ERA5 and MERRA-2 surface-level data, and the integration method was used to calculate ZTD, ZWD, ZHD, and Tm from ERA5 and MERRA-2 pressure-level data. After deriving the ZTD by the integration method from pressure-level data, the Saastamoinen model was used to calculate the ZTD above the pressure level and the meteorological data of the top level was used as input values in the model.
The ZTD, ZWD, Tm, and ZHD values from ERA5 and MERRA-2 pressure-level data and the formulas are as follows [33]:
Z T D = 10 6 S   N   d s = 10 6 i   N i Δ s i
Z W D = 10 6 S   N w d s = 10 6 i   N w i Δ s i
Z H D = Z T D Z W D
T m = s   e / T d s s   e / T 2 d s = i e i / T i Δ s i i e i / T i 2 Δ s i
where N w the wet refraction, N the total refraction, e denotes the water vapor pressure, and T denotes the atmospheric temperature. Then, the N w , N , and e were calculated using the following formulas [34,35]:
e q P / 0.622
N = k 1 P e T + k 2 e T + k 3 e T 2
N w = k 2 e T + k 3 e T 2
where P denotes the atmospheric pressure, q represents the specific humidity, k 3 = 377600   K 2 / hPa , k 2 = 64.79   K / hPa , k 2 = 22.97   K / hPa , and k 1 = 77.604   K / hPa [21,34].
The Saastamoinen model was used to calculate the ZTD, ZWD, and ZHD based on the ERA5 and MERRA-2 surface-level data, and the formulas are as follows [36]:
Z T D = 0.002277 P 0 + 0.05 + 1255 T 0 e 1 0.00266 cos 2 φ 0.00000028 H
Z H D = 2.2768 P 0 1 0.00266 cos 2 φ 0.00000028 H
where H denotes the height (m) of the station, T 0 denotes the surface temperature (K), φ represents the latitude (radian), and P 0 denotes the surface pressure (hPa).

2.2.2. Calculating ZTD, ZHD, ZWD, and Tm Using ERA5 and MERRA-2 Data at Radiosonde and GNSS Stations

We can calculate the ZTD, ZWD, ZHD, and Tm values of grid points by the above method. However, the radiosonde or GNSS stations and the ERA5 and MERRA-2 grid points are usually not collocated and have different elevations. The altitude difference between radiosonde or GNSS and the grid point can lead to large errors in evaluating the performances of ZTD, ZWD, ZHD, and Tm derived from reanalysis data [37]. It is necessary to eliminate or reduce the influence of this altitude difference. Therefore, the ZTD, ZWD, ZHD, and Tm values of grid points in this study were at the height of radiosonde and GNSS stations. It can be ensured that the height of stations was consistent with the height of the grid points, which significantly eliminates or reduces the influence of altitude differences in evaluating the accuracies of these tropospheric parameters.
Meteorological parameters at the same height need to be obtained before calculating the ZTD, ZWD, ZHD, and Tm values of grid points at the height of radiosonde and GNSS stations. Notably, the different reference planes of the grid height, radiosonde height, and GNSS height should be unified before interpolating meteorological parameters [38]. A detailed introduction to calculating the temperature, pressure, and specific humidity of grid points at a station’s height using pressure-level data can be found in Huang’s paper [39].
The method for calculating the meteorological parameters at the height of radiosonde and GNSS stations using reanalysis surface-level data is different from that of using reanalysis pressure-level data. The surface-level data from ERA5 and MERRA-2 data do not directly provide water vapor pressure values. Therefore, the grid points of water vapor pressure values need to be calculated, firstly, by using Formula (5). The formulas for calculating the pressure, temperature, and water vapor pressure values of the grid points at a station’s height is as follows [20,28]:
T = T 0 0.0065 H H 0
P = P 0 1 0.0000226 H H 0 5.225
e = e 0 P / P 0 λ + 1
where λ denotes the water vapor pressure decrease factor, which can be obtained by using the GPT2w model; T 0 represents the temperature at the grid point height H 0 ; e 0 denotes the water vapor pressure at the same height; P 0 is the pressure at the grid height; H denotes the height of the radiosonde or GNSS site.
The ZTD, ZHD, ZWD, and Tm values of the grid points at the height of the radiosonde and GNSS stations can be calculated by the above method, whereas the corresponding values of these parameters at the radiosonde and GNSS stations were obtained by the inverse distance weighting (IDW) [40].
To access the performance of the ZTD, ZWD, ZHD, and Tm derived from MERRA-2 and ERA5 reanalysis data, we compared the tropospheric parameters calculated by reanalysis data with those derived from the radiosonde data and GNSS observation. Then, the bias and RMS were selected to measure their performance, which could be computed via the following equations:
b i a s = 1 N i = 1 N V m i V R i
R M S = 1 N i = 1 N V m i V R i 2
where V m i and V R i are the values from the reanalysis data and reference data, respectively, and N is the number of samples.

3. Results

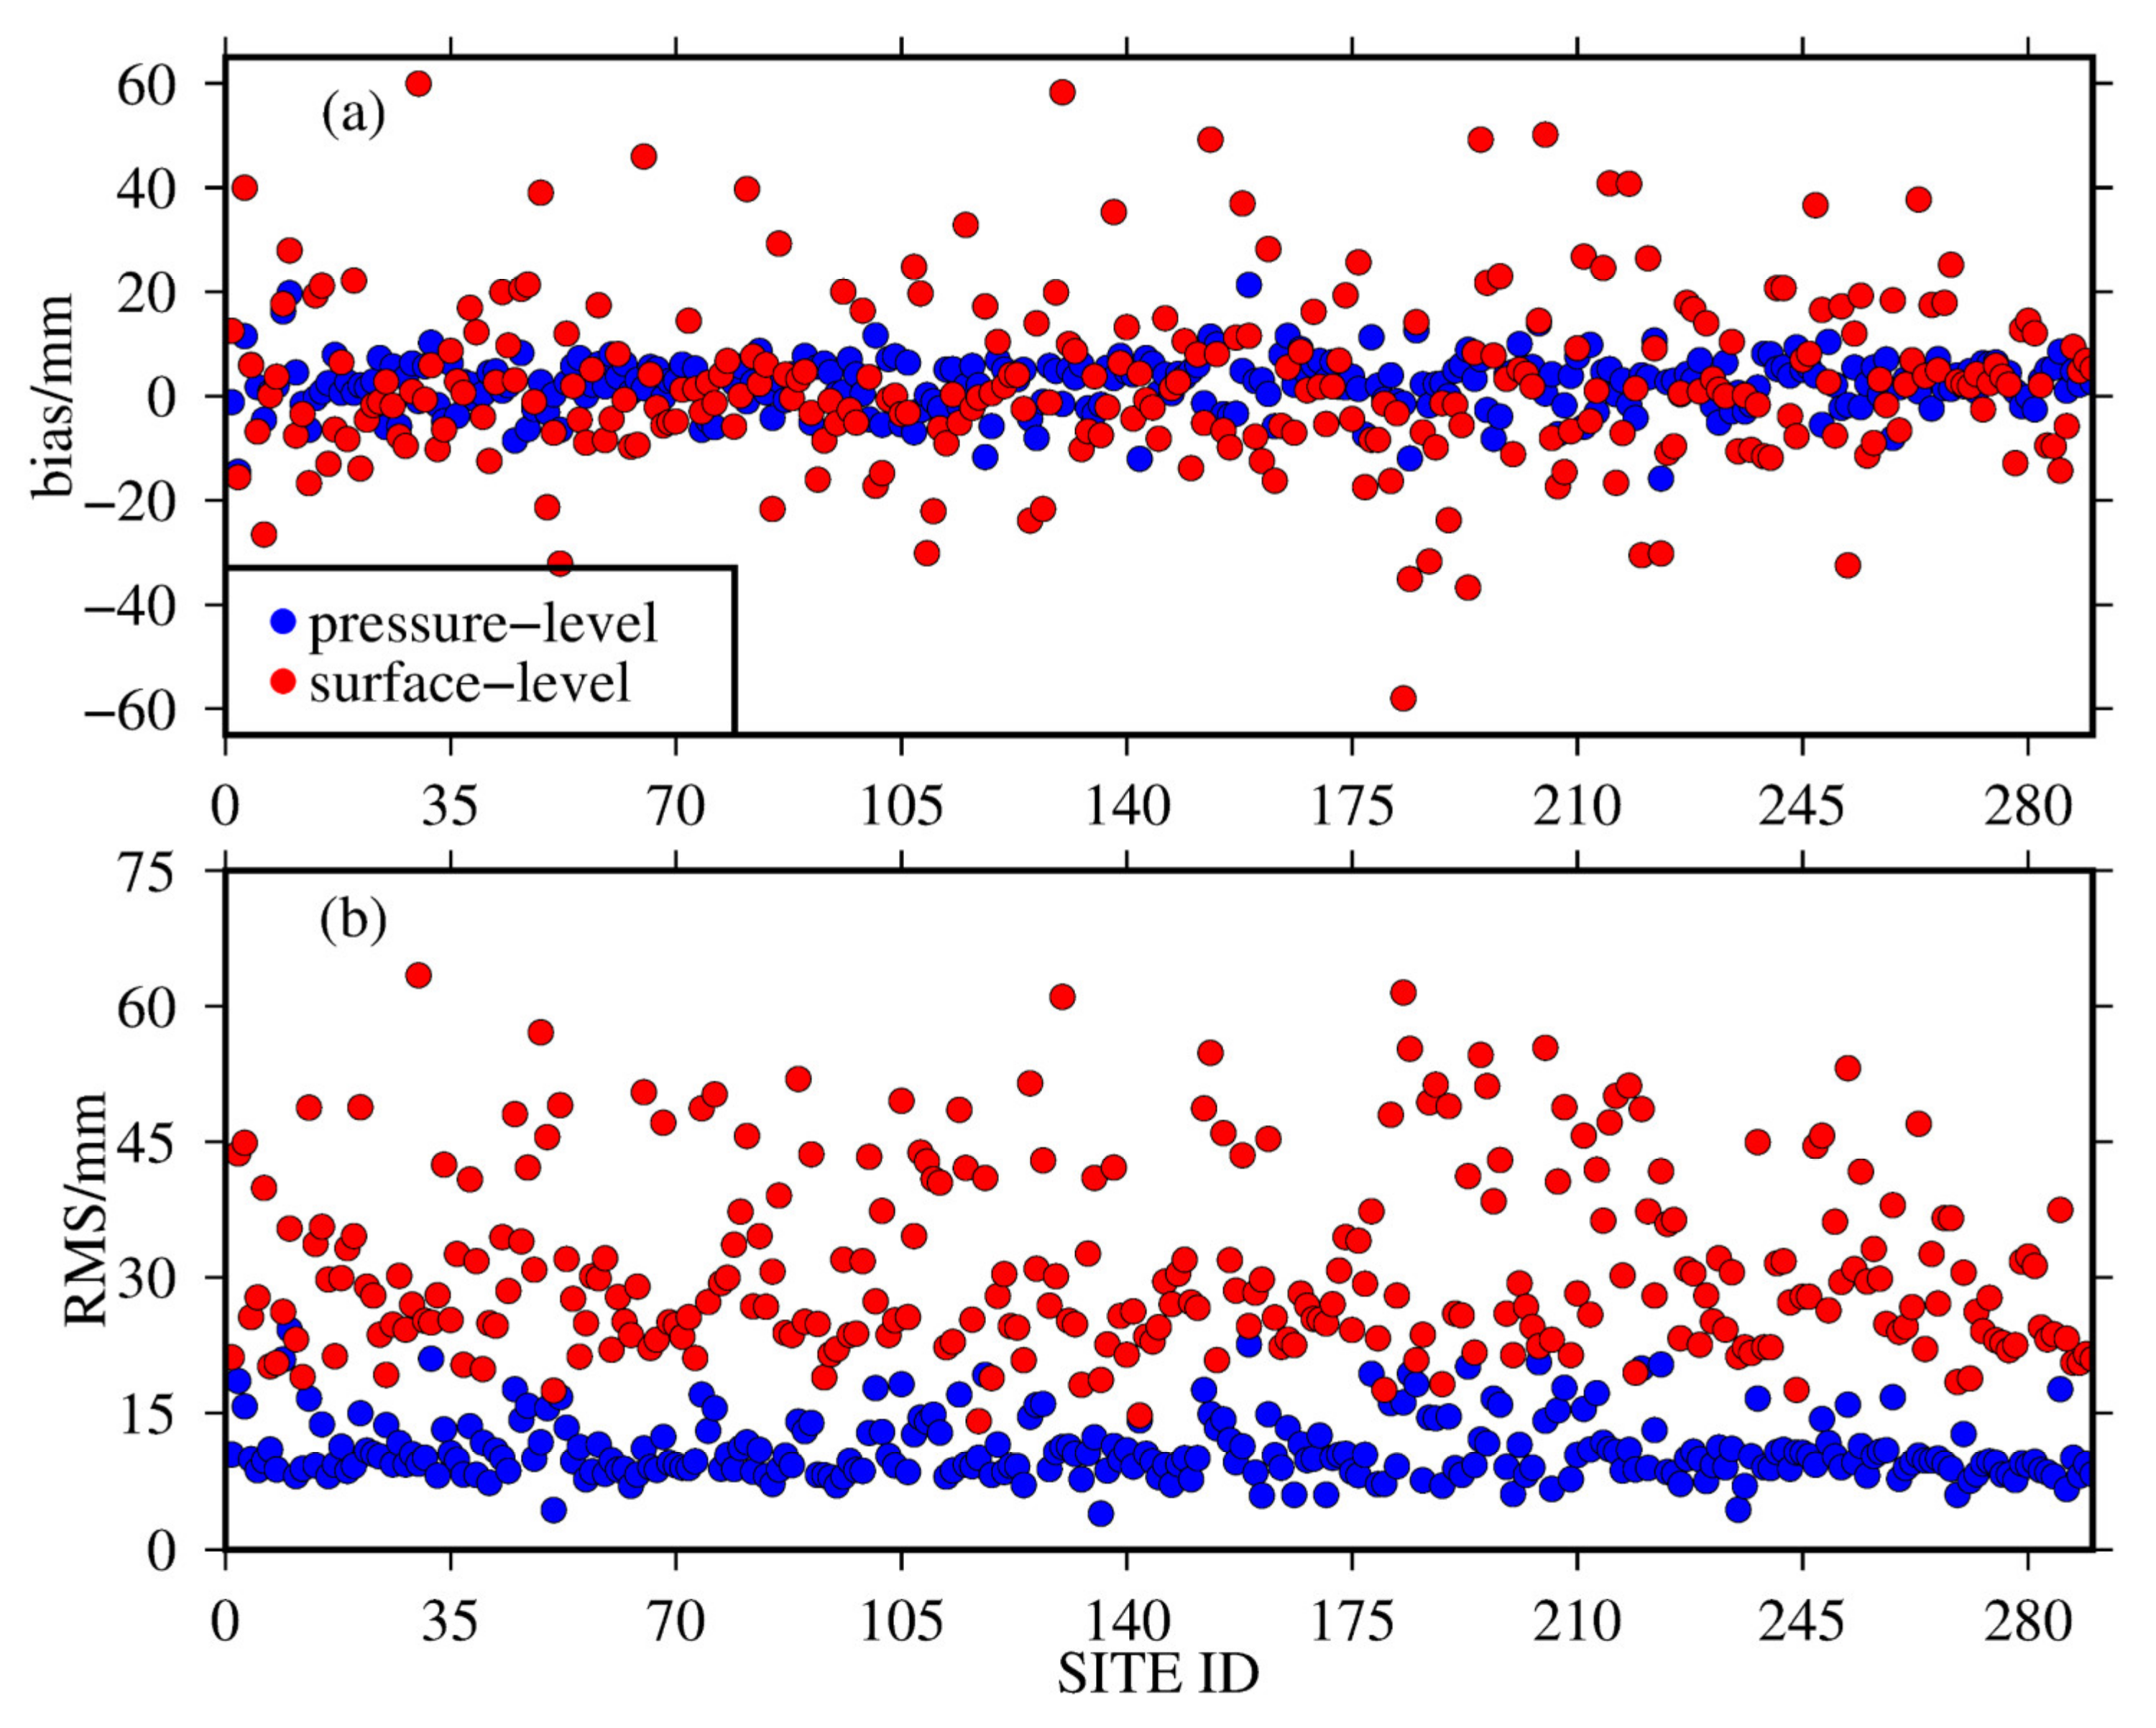
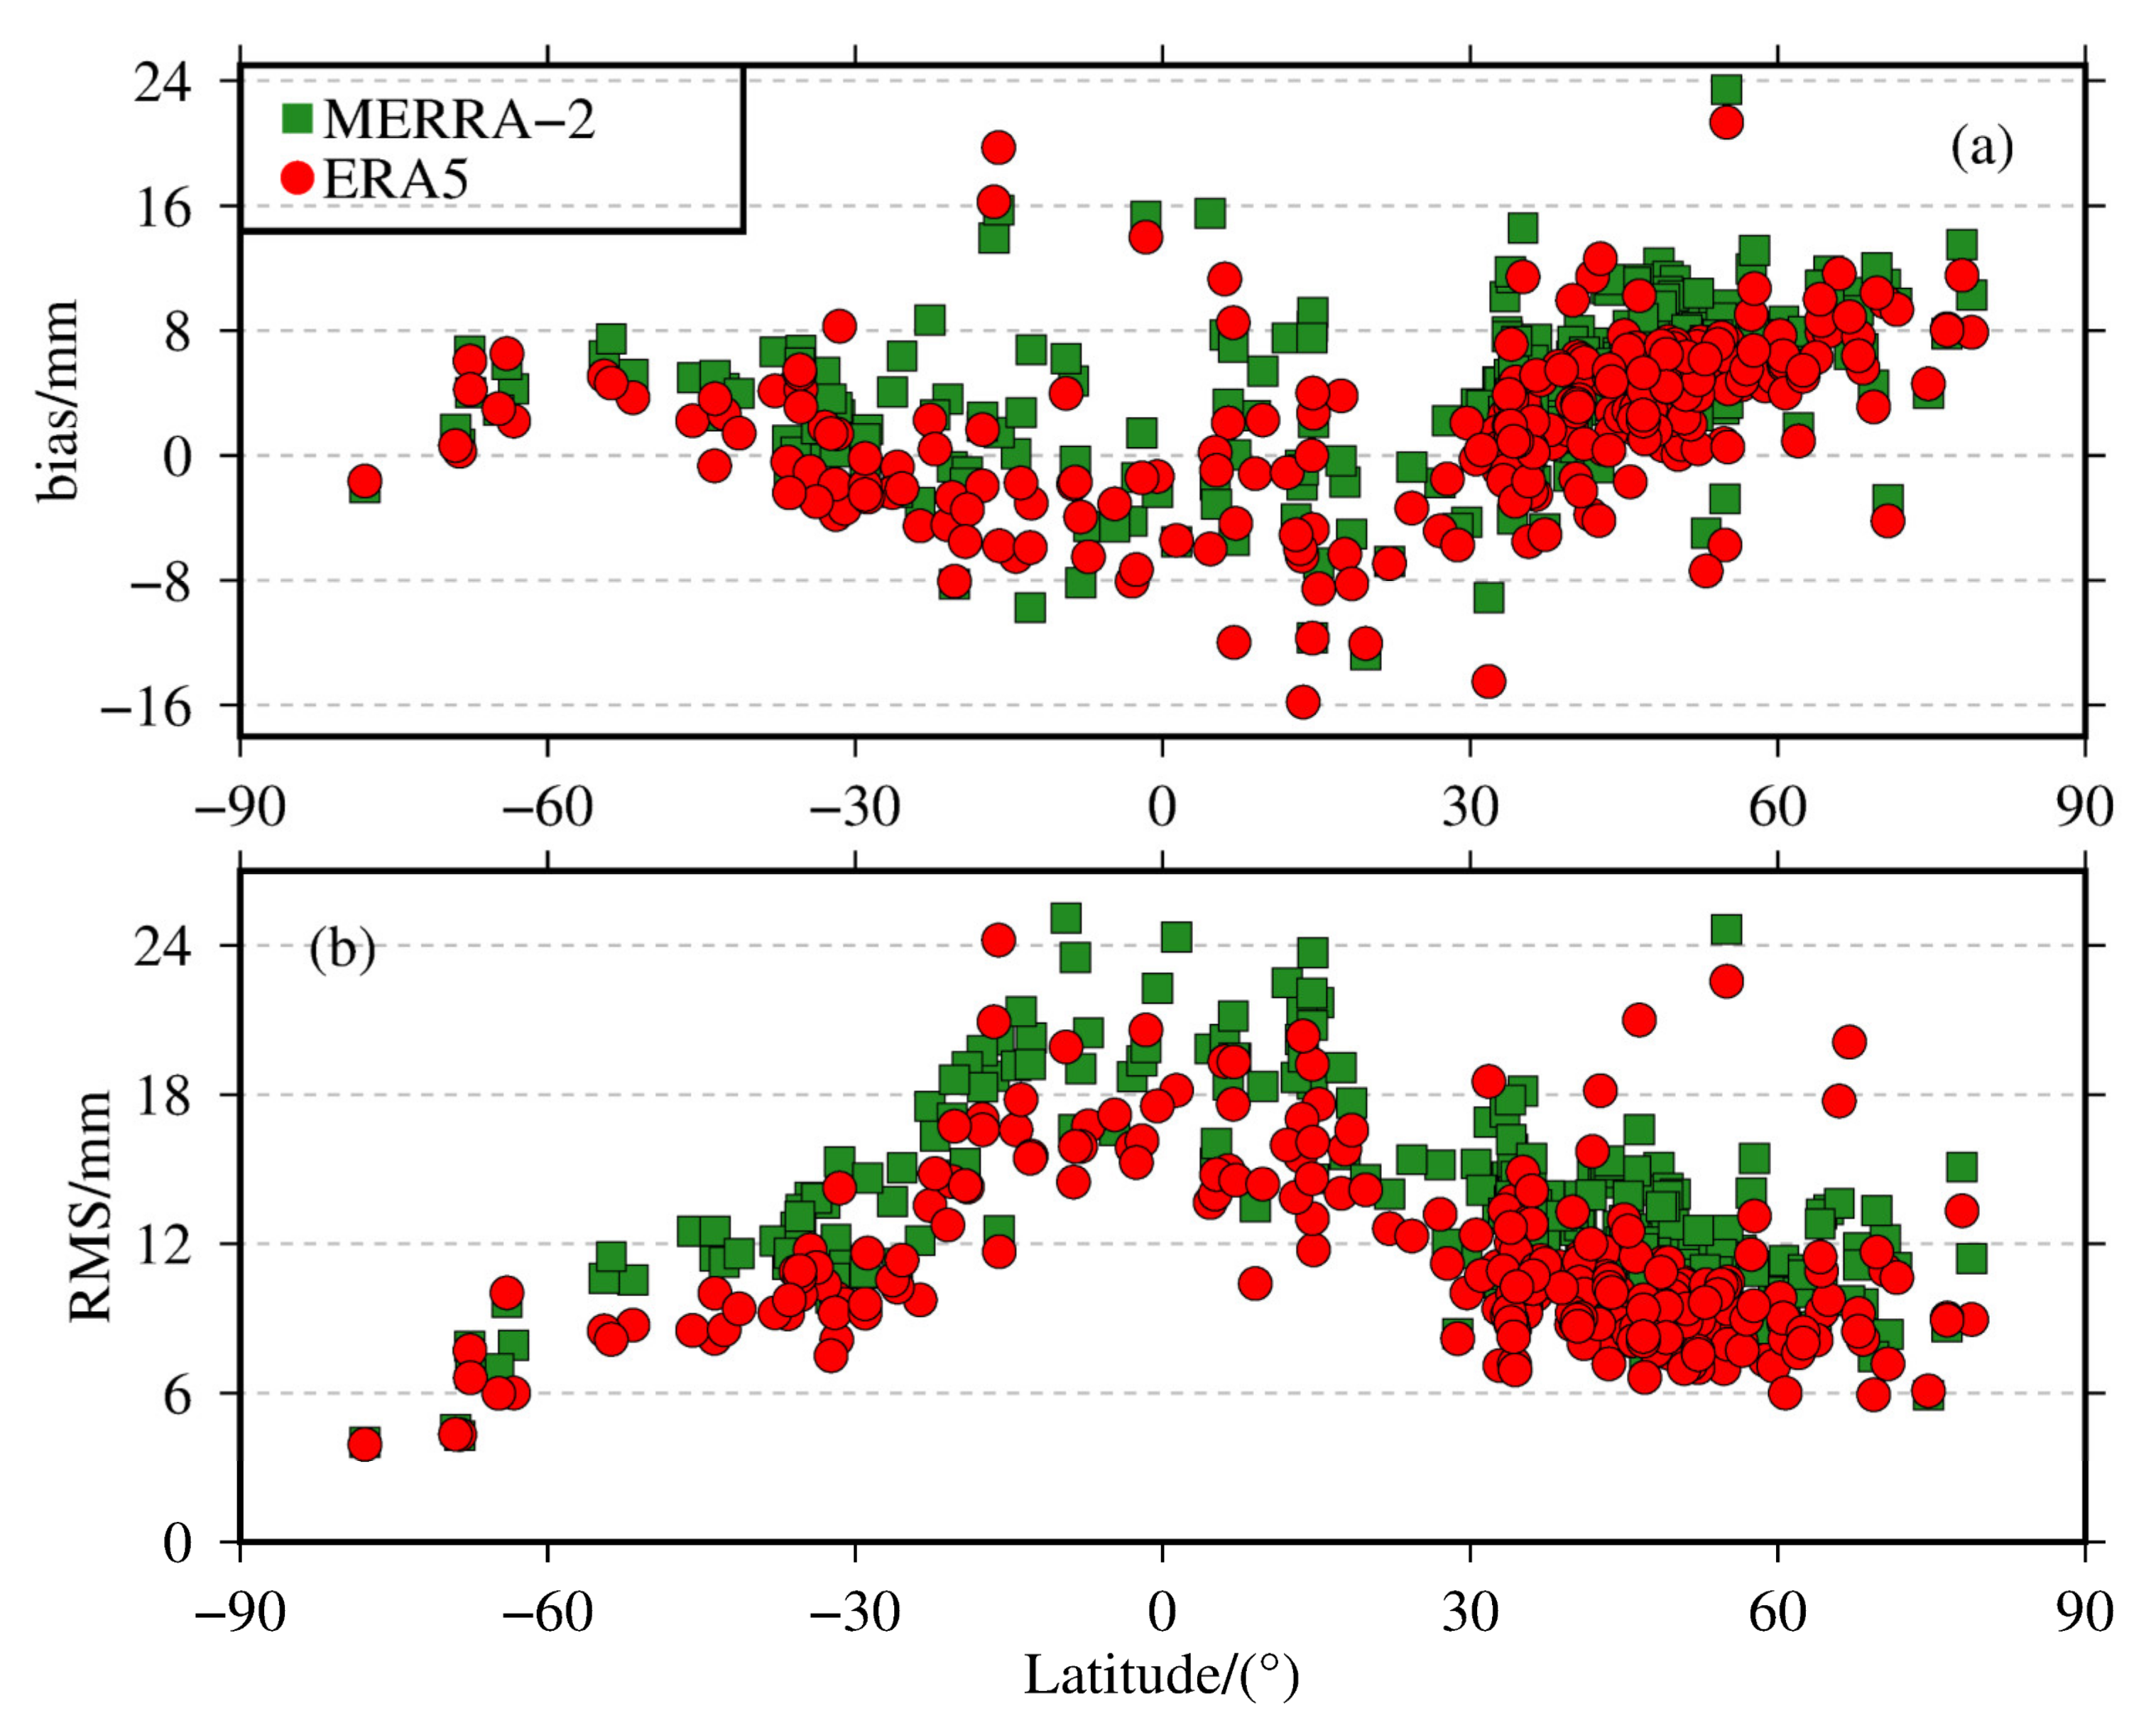
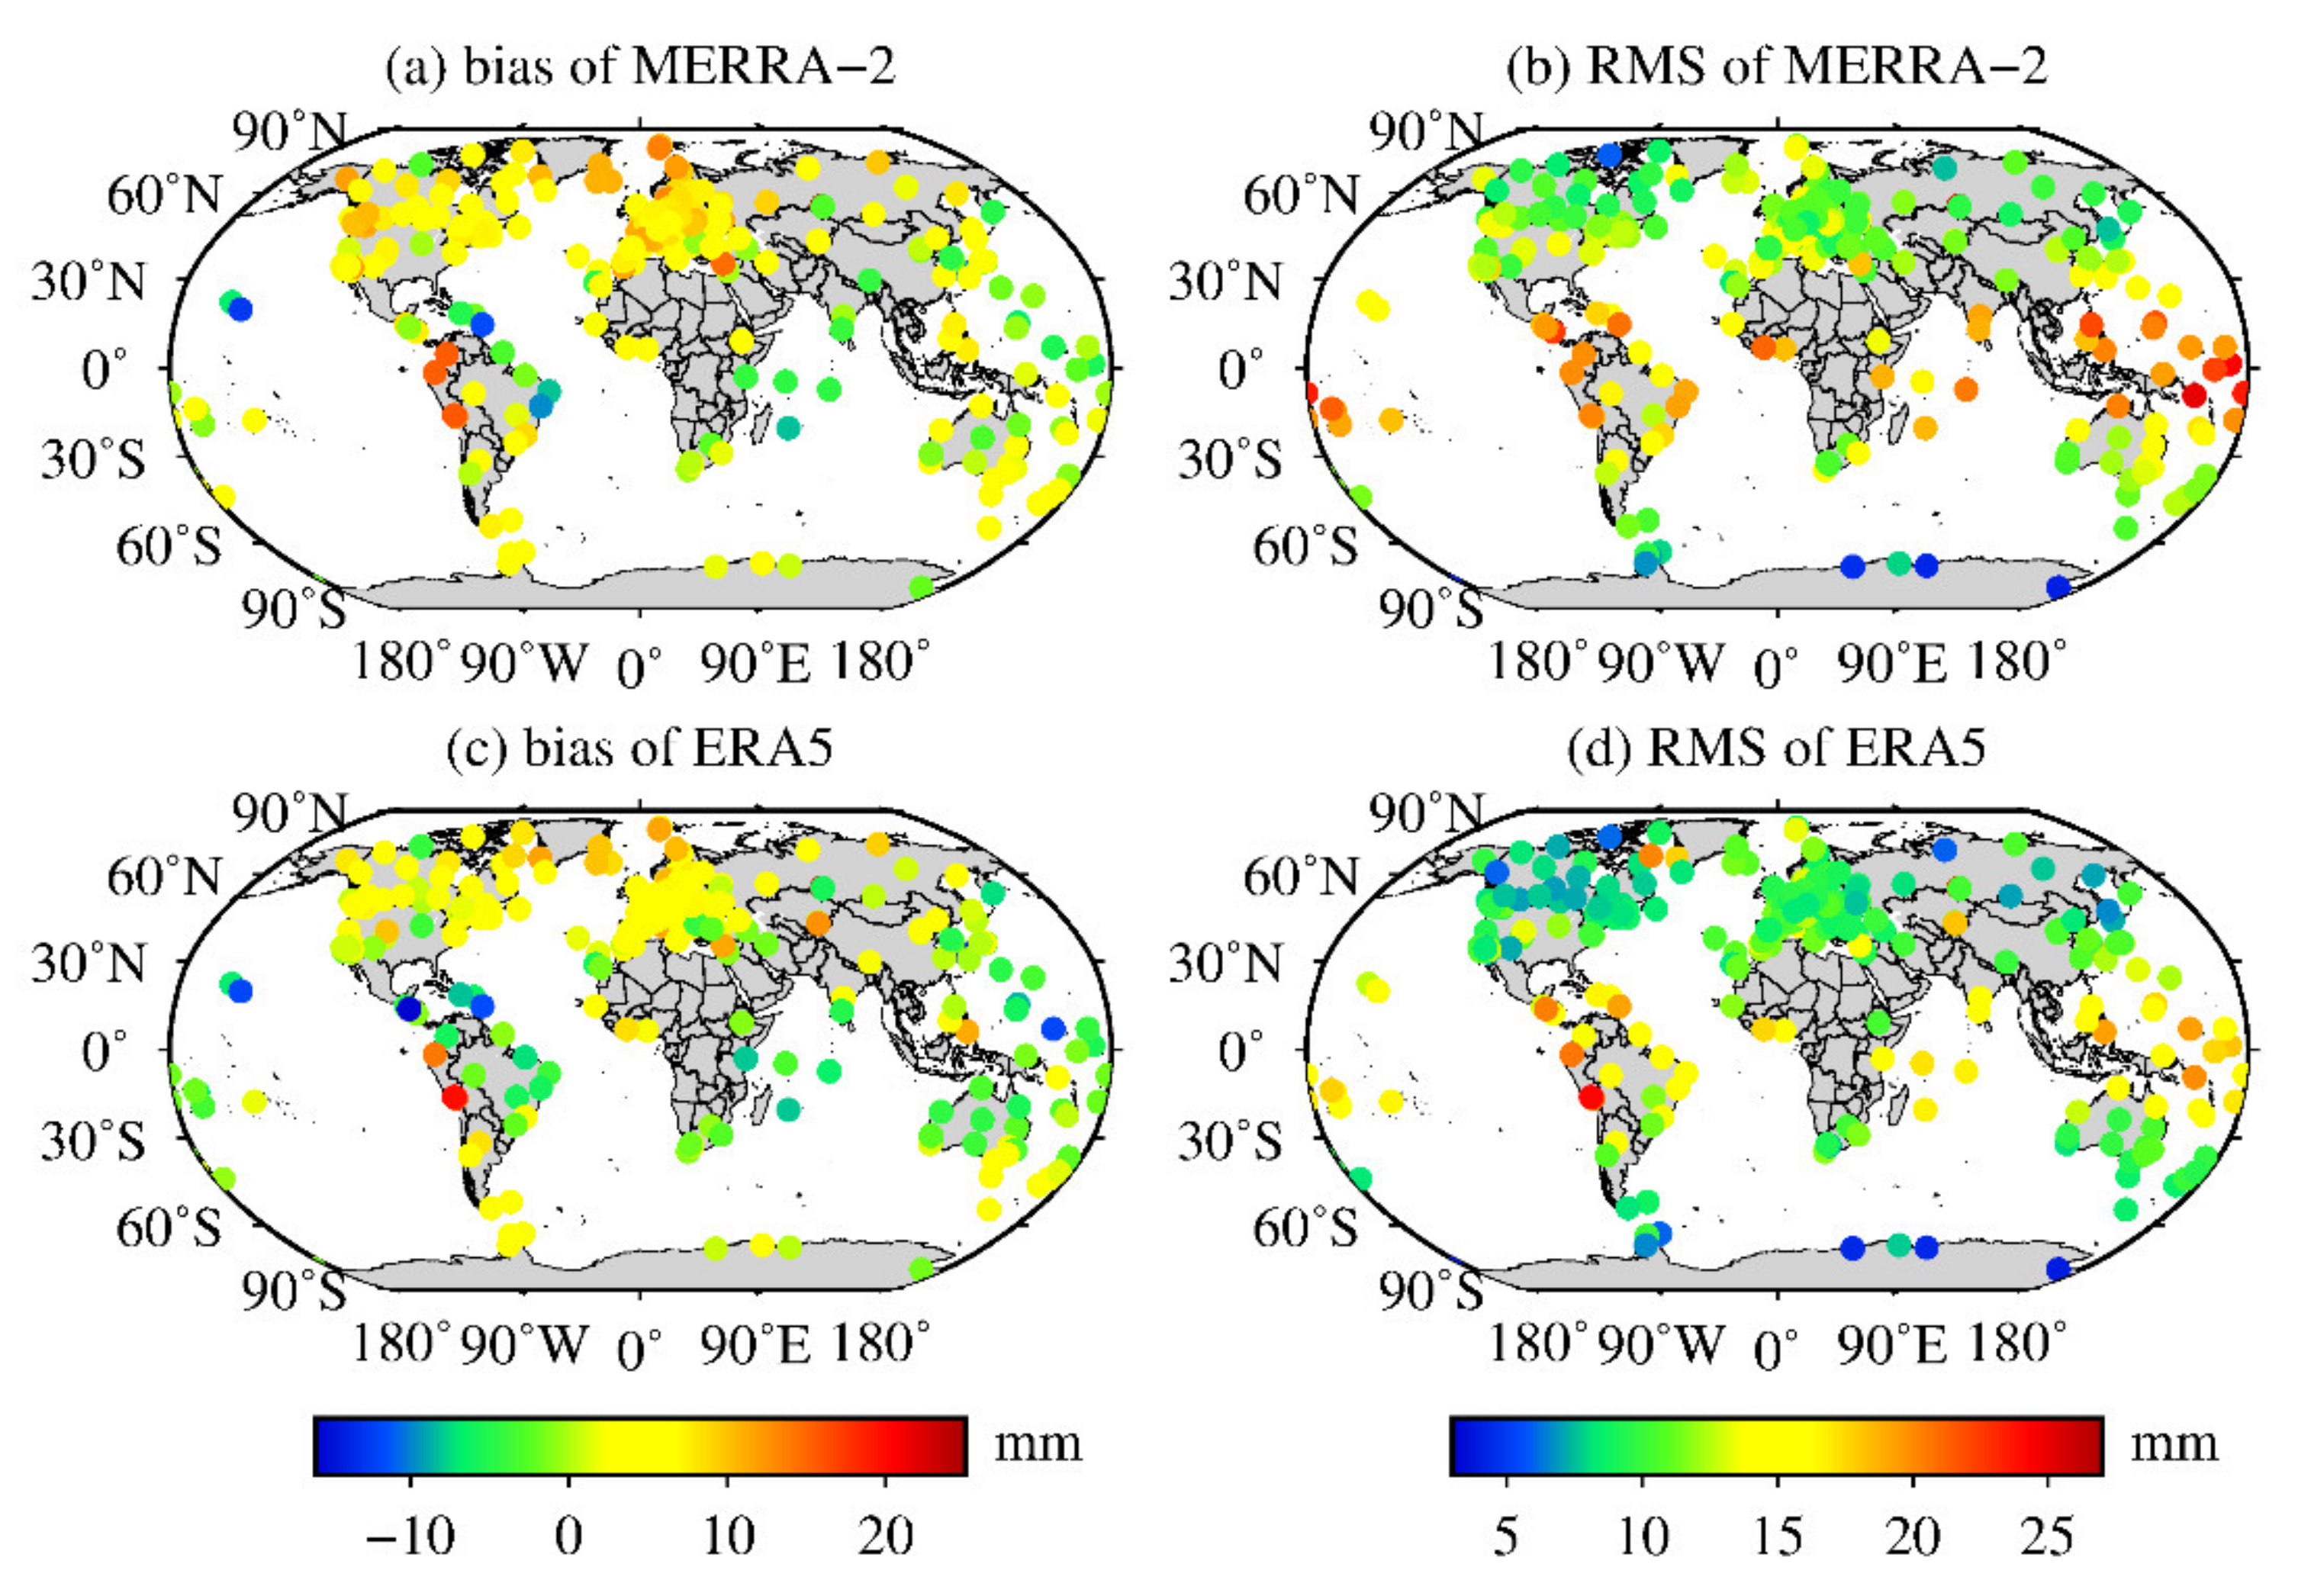
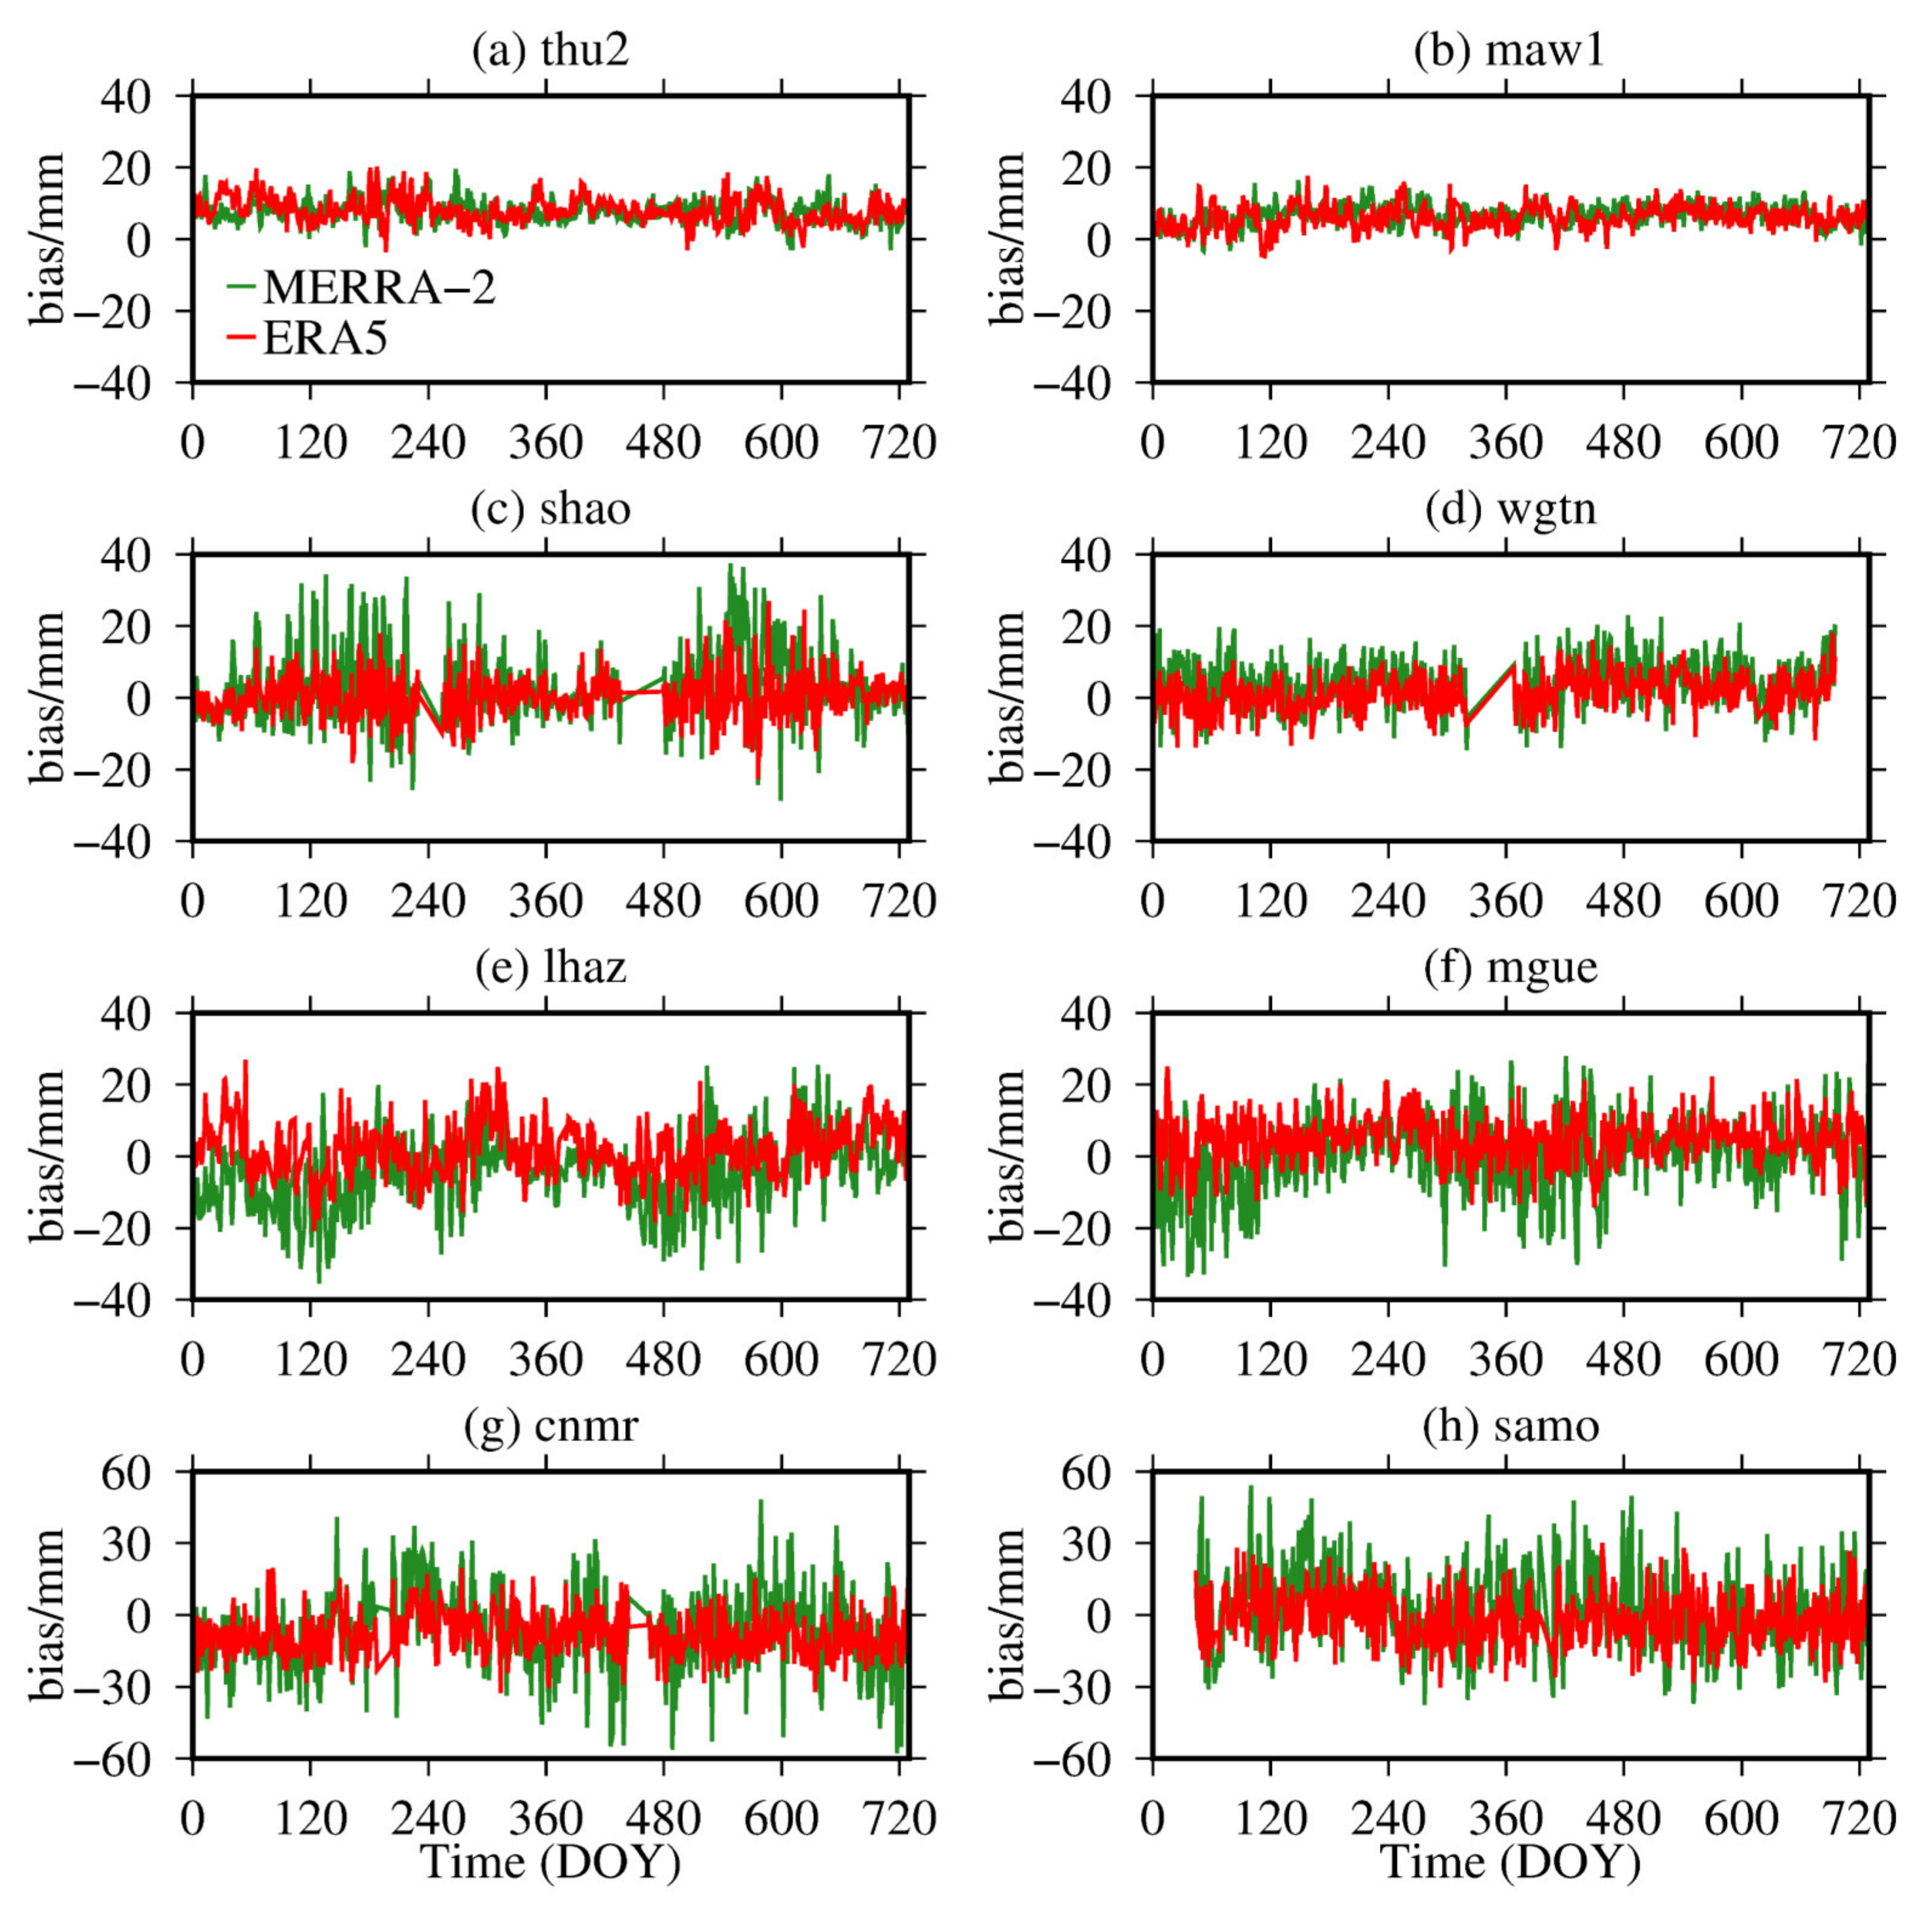
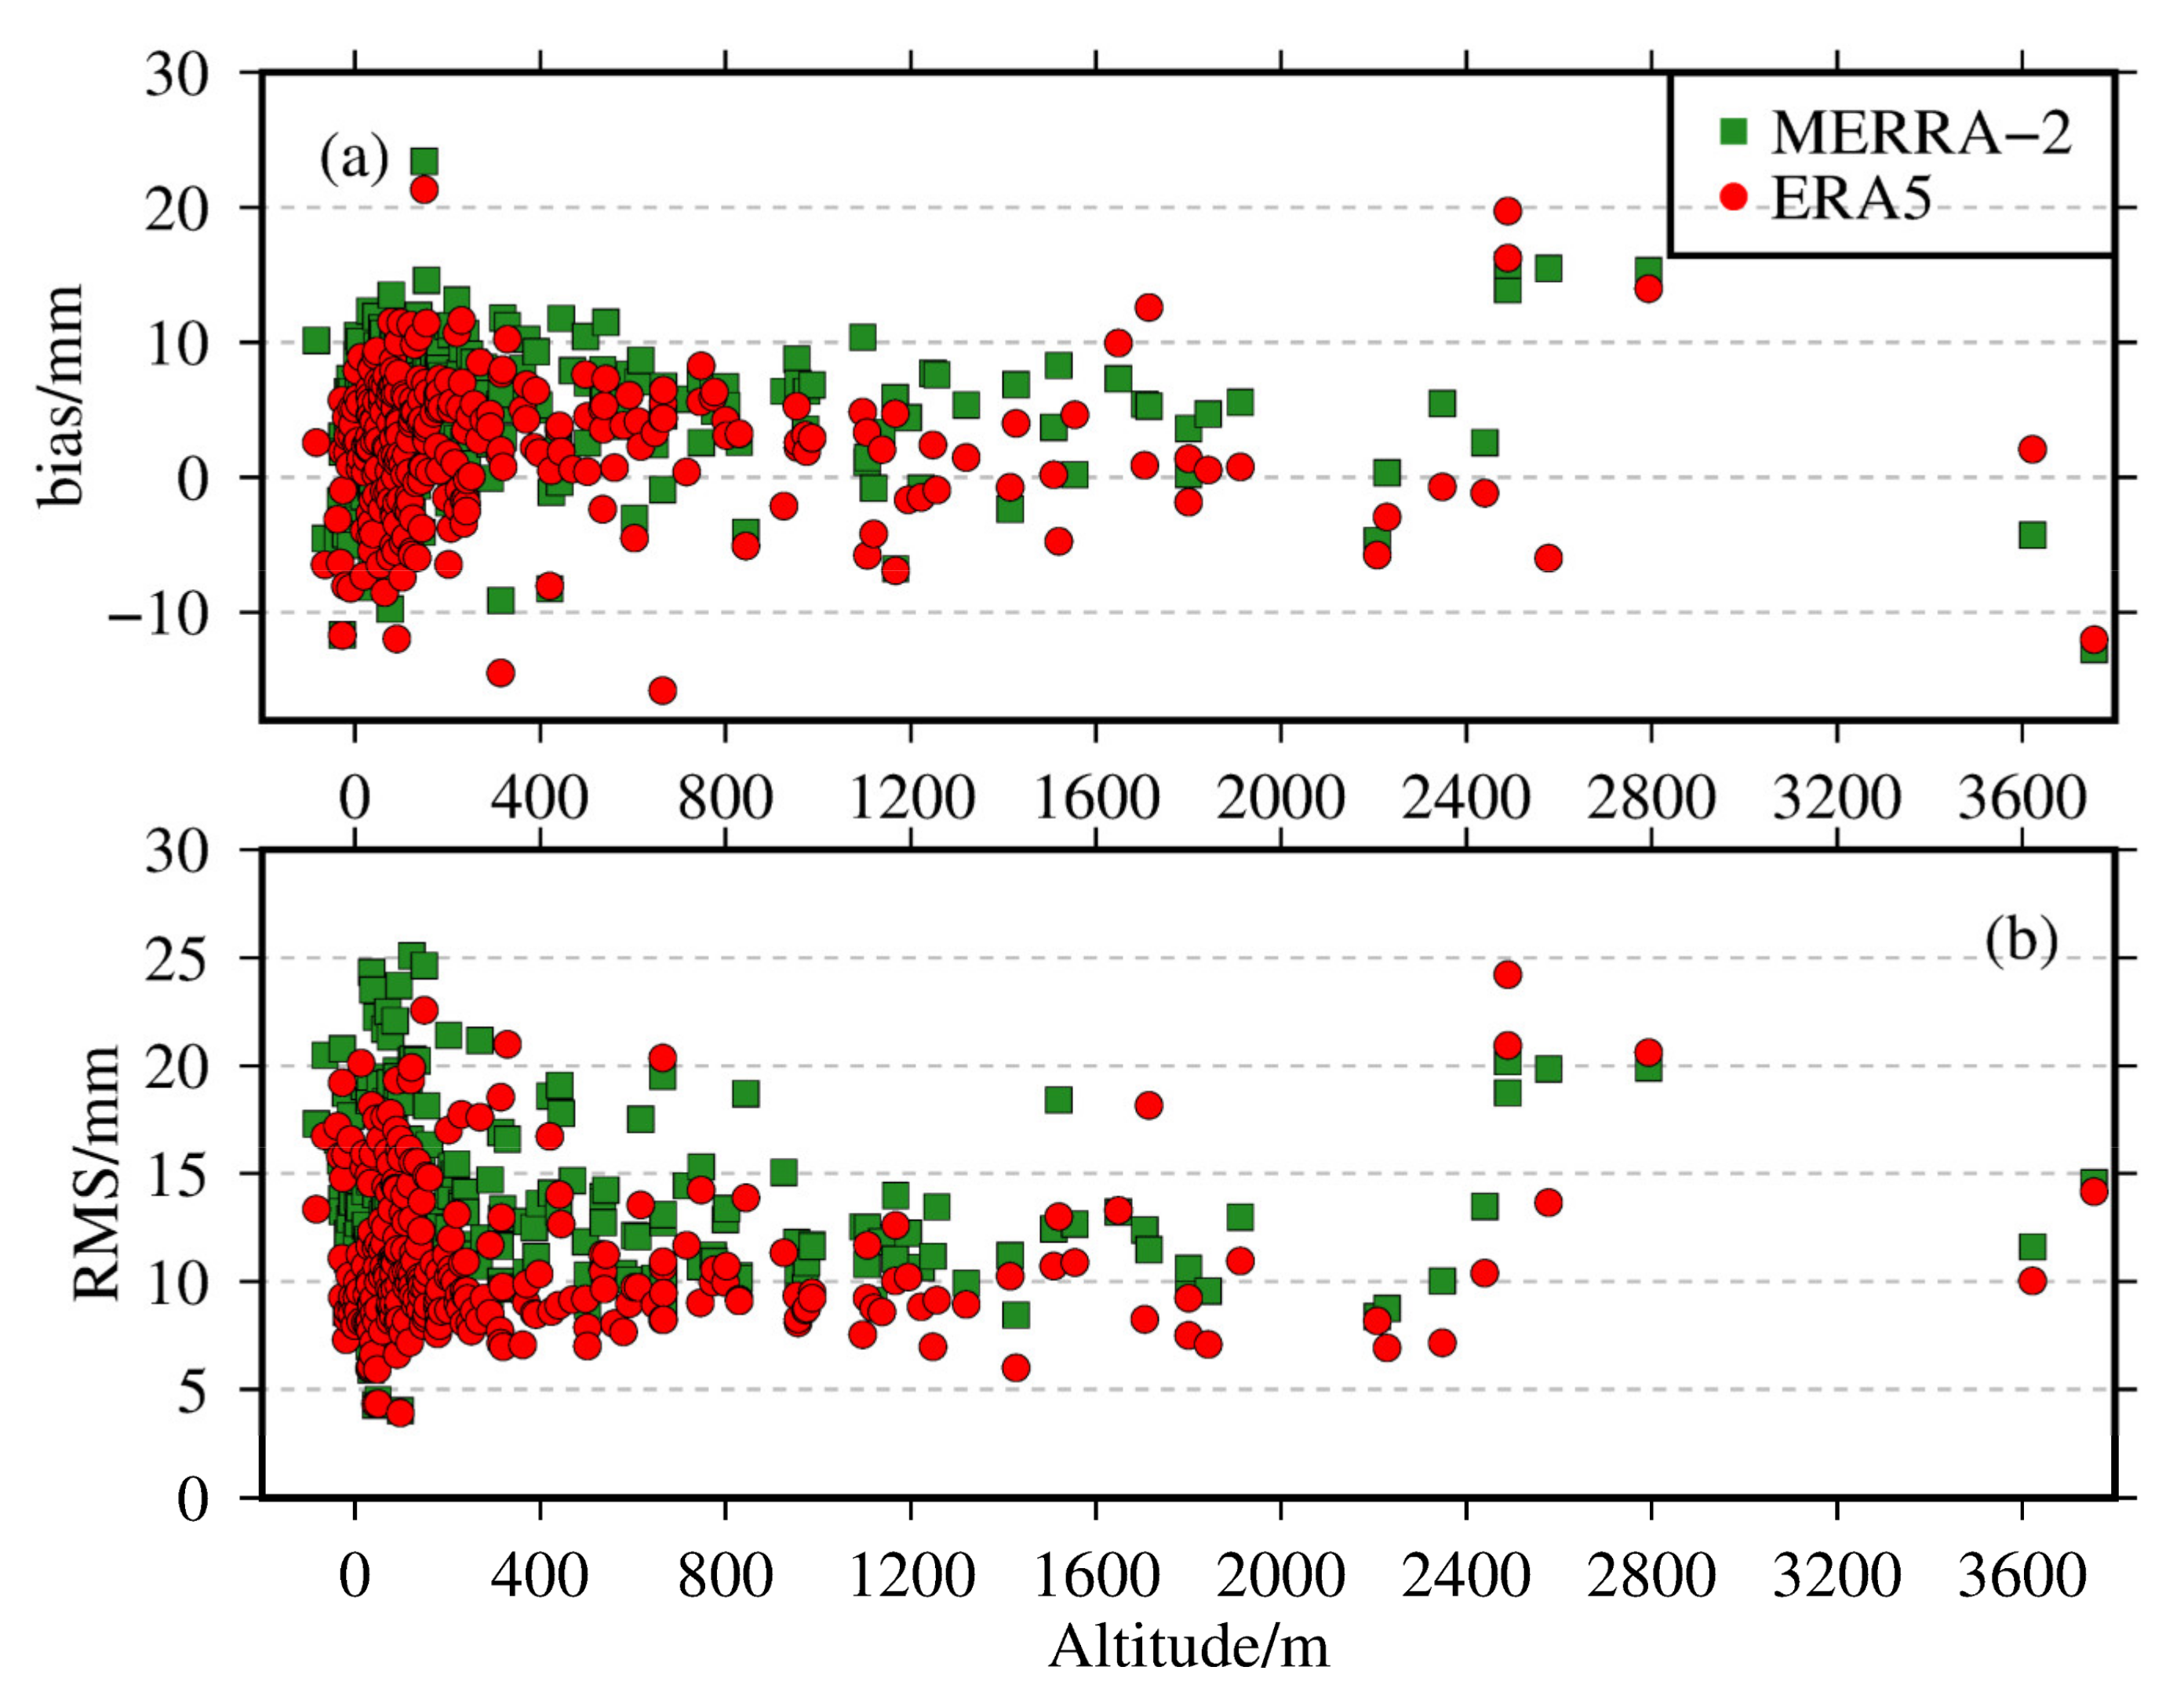
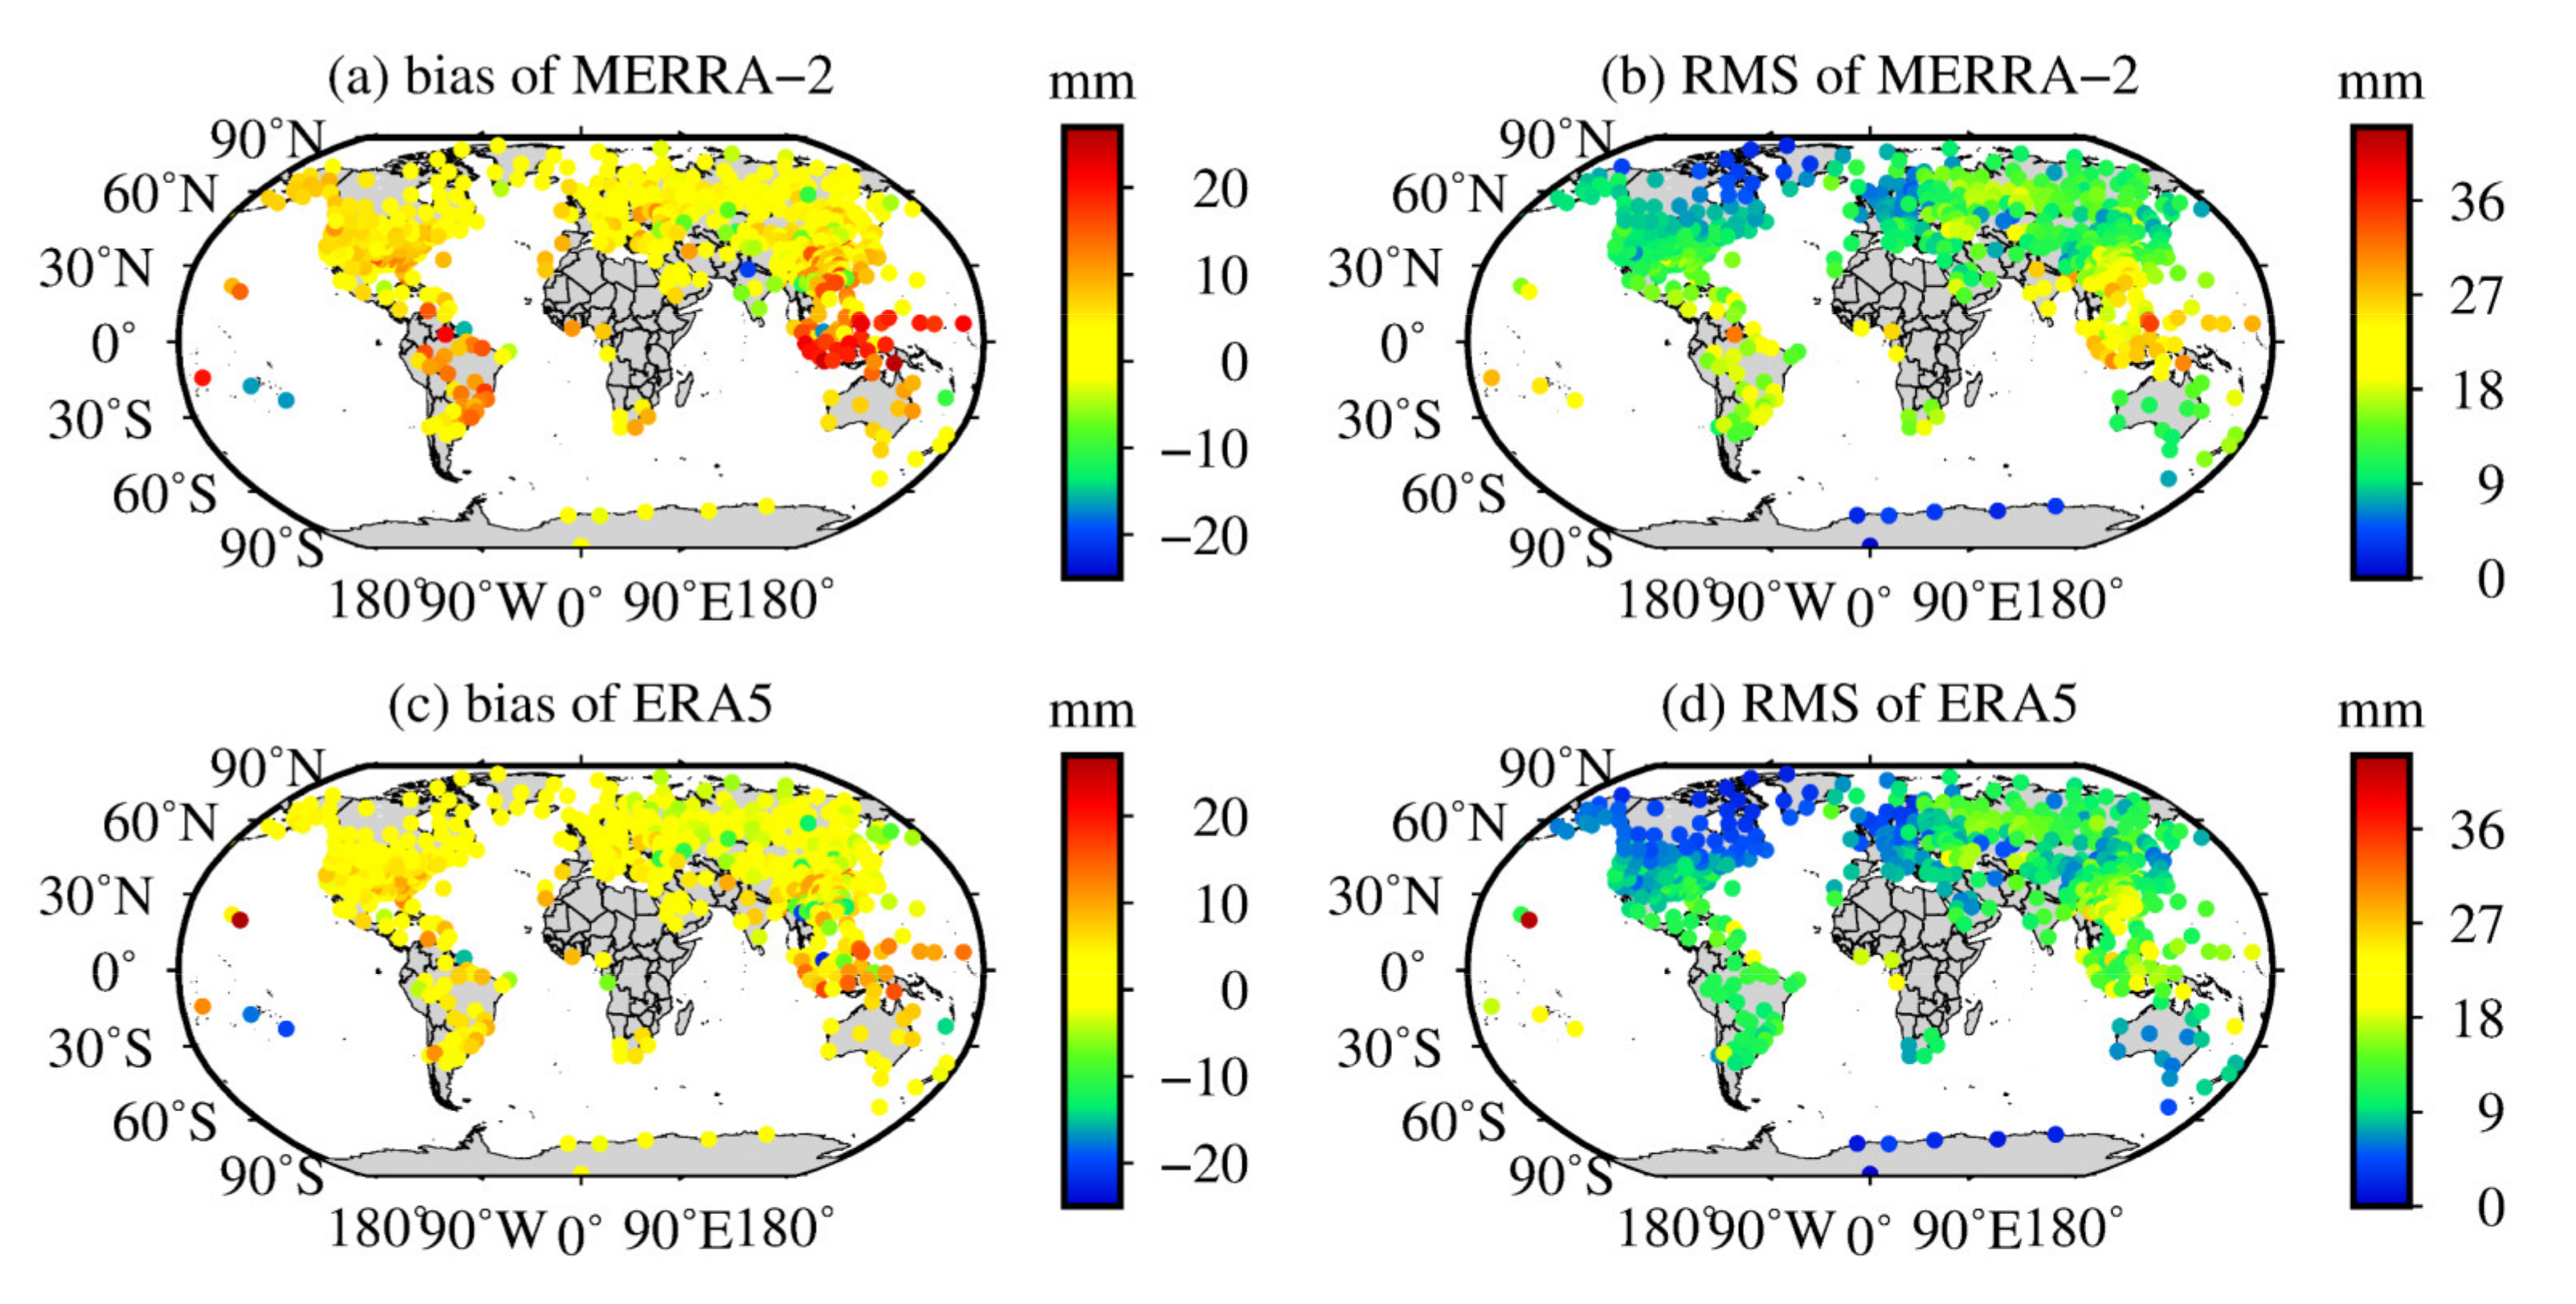
3.1. Comparisons between ERA5/MERRA-2 ZTD and GNSS ZTD

The hourly ZTDs from 290 GNSS stations from 2016 to 2017 as a reference were employed to evaluate the accuracy of ERA5 and MERRA-2 surface- and pressure-level ZTD. For each GNSS station, we computed the annual mean bias and RMS values of ZTD. The results are shown in Figure 2 and Figure 3 and Table 1.
The RMS values for MERRA-2 ZTD from pressure-level data compared to GNSS ZTD were less than 16 mm for 82% of the 290 GNSS stations. We also found that the RMS values between ERA5 pressure-level ZTD and GNSS ZTD were less than 16 mm for 90% of the 290 GNSS stations. Meanwhile, the annual mean bias and RMS were 4.5 and 13.1 mm for MERRA-2 pressure-level ZTD and –4.8 and 27.9 mm for MERRA-2 surface-level ZTD, respectively. The annual mean bias and RMS of ERA5 ZTD from pressure-level data with respect to GNSS ZTD were 2.3 and 10.9 mm, respectively, and those of ERA5 ZTD from surface-level data were 3.8 and 31.6 mm, respectively. These illustrate that the ZTD calculated from pressure-level data had superior consistencies with GNSS ZTD than surface-level ZTD. The reason for this phenomenon was that the error of the Saastamoinen model method was 10–30 mm greater than that of the integration method [37]. Furthermore, the performance of ZTD derived from ERA5 pressure-level data was slightly improved over MERRA-2 pressure-level data, with an RMS of 10.9 and 13.1 mm for ERA5 and MERRA-2, respectively. This small RMS difference between ERA5 and MERRA-2 may be caused by differences in data assimilation and physical models [41]. Thus, the following comparison and analysis were based on ERA5 and MERRA-2 pressure-level ZTD.
To analyze the seasonal variation features of ZTD derived from ERA5 and MERRA-2 data, the monthly average bias and RMS values of ERA5 ZTD and MERRA-2 ZTD compared with GNSS ZTD at all GNSS stations from 2016 to 2017 were calculated. There are 222 GNSS sites in the Northern Hemisphere and 68 GNSS sites in the Southern Hemisphere. The bias and RMS means of all stations in four seasons, namely, spring (i.e., March, April, and May), summer (i.e., June, July, and August), autumn (i.e., September, October, and November), and winter (December, January, and February) were also summarized, and the results are shown in Table 2. In the Northern Hemisphere, the biases of MERRA-2 ZTD were positive in different seasons and show apparent seasonal trends that have a larger bias in the summer and a smaller bias in the winter. Meanwhile, the seasonal variation in RMS of ZTD in the Northern Hemisphere was obvious. The RMS of MERRA-2 ZTD in the summer and winter were 16.4 and 9.6 mm, respectively, and those of ERA5 ZTD in summer and winter were 13.1 and 8.5 mm, respectively. These features are related to the complicated and changeable climate during summer when the content of atmospheric water vapor is abundant and changes violently, which leads to larger errors of MERRA-2 and ERA5 ZTD in the summer [21,23]. Seasonal variations in RMS of ZTD in the Southern Hemisphere are opposite to that in the Northern Hemisphere owing to the contrary seasons and climatic conditions [42]. In the Southern Hemisphere, the RMS of MERRA-2 ZTD in summer and winter were 12.2 and 16.1 mm, respectively, and those of ERA5 ZTD in the summer and winter were 10.8 and 13.1 mm, respectively. Although seasonal variations clearly affected the performance of ZTD derived from reanalysis data, the ERA5 ZTD and MERRA-2 ZTD still had high precision, with a smaller bias and RMS in all seasons.
To analyze the daily variations of MERRA-2 and ERA5 ZTD, the times series of MERRA-2 and ERA5 ZTD bias and RMS in eight GNSS stations are shown in Figure 4 and Figure 5. The details of eight GNSS stations are shown in Table 3. Overall, the ZTD derived from MERRA-2 and ERA5 data in the thu2 and maw1 stations in high latitudes showed better precision than that in the shao, lhaz, cnmr, wgtn, mgue, and samo stations in middle and low latitudes. This is attributed to the stable variation of meteorological parameters in high latitudes, which reduces the uncertainty of ZTD calculated from MERRA-2 and ERA5 data. It is evident that the RMS of ZTD in the shao and mgue stations show a distinct seasonal trend. The main reason is that the shao station in the Northern Hemisphere is located in a temperate monsoon climate and close to the ocean, and the abundant and changeable water vapor in summer will lead to a large error in the calculation of ZTD. While the mgue station in the Southern Hemisphere is located in the temperate grassland climate, the water vapor content is lower in summer and increases in winter, which causes fewer errors in the summer and large errors in the winter. The altitude of the lhaz station is above 3000 m and the climate is dry, which leads to small errors in ZTD calculation.
Figure 6 shows the variations in the latitude of the annual mean bias and RMS values of MERRA-2 ZTD and ERA5 ZTD compared with GNSS ZTD for all stations from 2016 to 2017. The variations in the biases of ZTD with latitude were not evident. While the RMS values of ZTD had clear trends with latitude, decreasing from the equator to both poles. Further, the distribution of the annual average bias and RMS values of ZTD over the globe from 2016 to 2017 are shown in Figure 7. We can find that both MERRA-2 and ERA5 ZTD RMS values were larger at low and middle latitudes and smaller at high latitudes, mainly influenced by the complex climate and drastic changes in water vapor at low latitudes [43]. The RMSs of ERA5 ZTD were generally smaller than MERRA-2 at low latitudes, especially in South Asia and Southeast Asia. Meanwhile, the accuracy of ERA5 ZTD was slightly improved over MERRA-2 at middle and high latitudes, especially in North America, Europe, Australia, and the eastern part of Asia. This indicates that ERA5 ZTD agrees well with GNSS ZTD more than MERRA-2 ZTD in these regions.
Figure 8 shows the variation in altitude with the annual average bias and RMS values for all stations from 2016 to 2017. The bias and RMS of ZTD with altitude are not obvious. Meanwhile, we can find that the RMSs of ZTD were mostly within 25 mm, which illustrates that taking the station height as the integral starting height can effectively reduce the error of ZTD interpolation in the altitude direction.

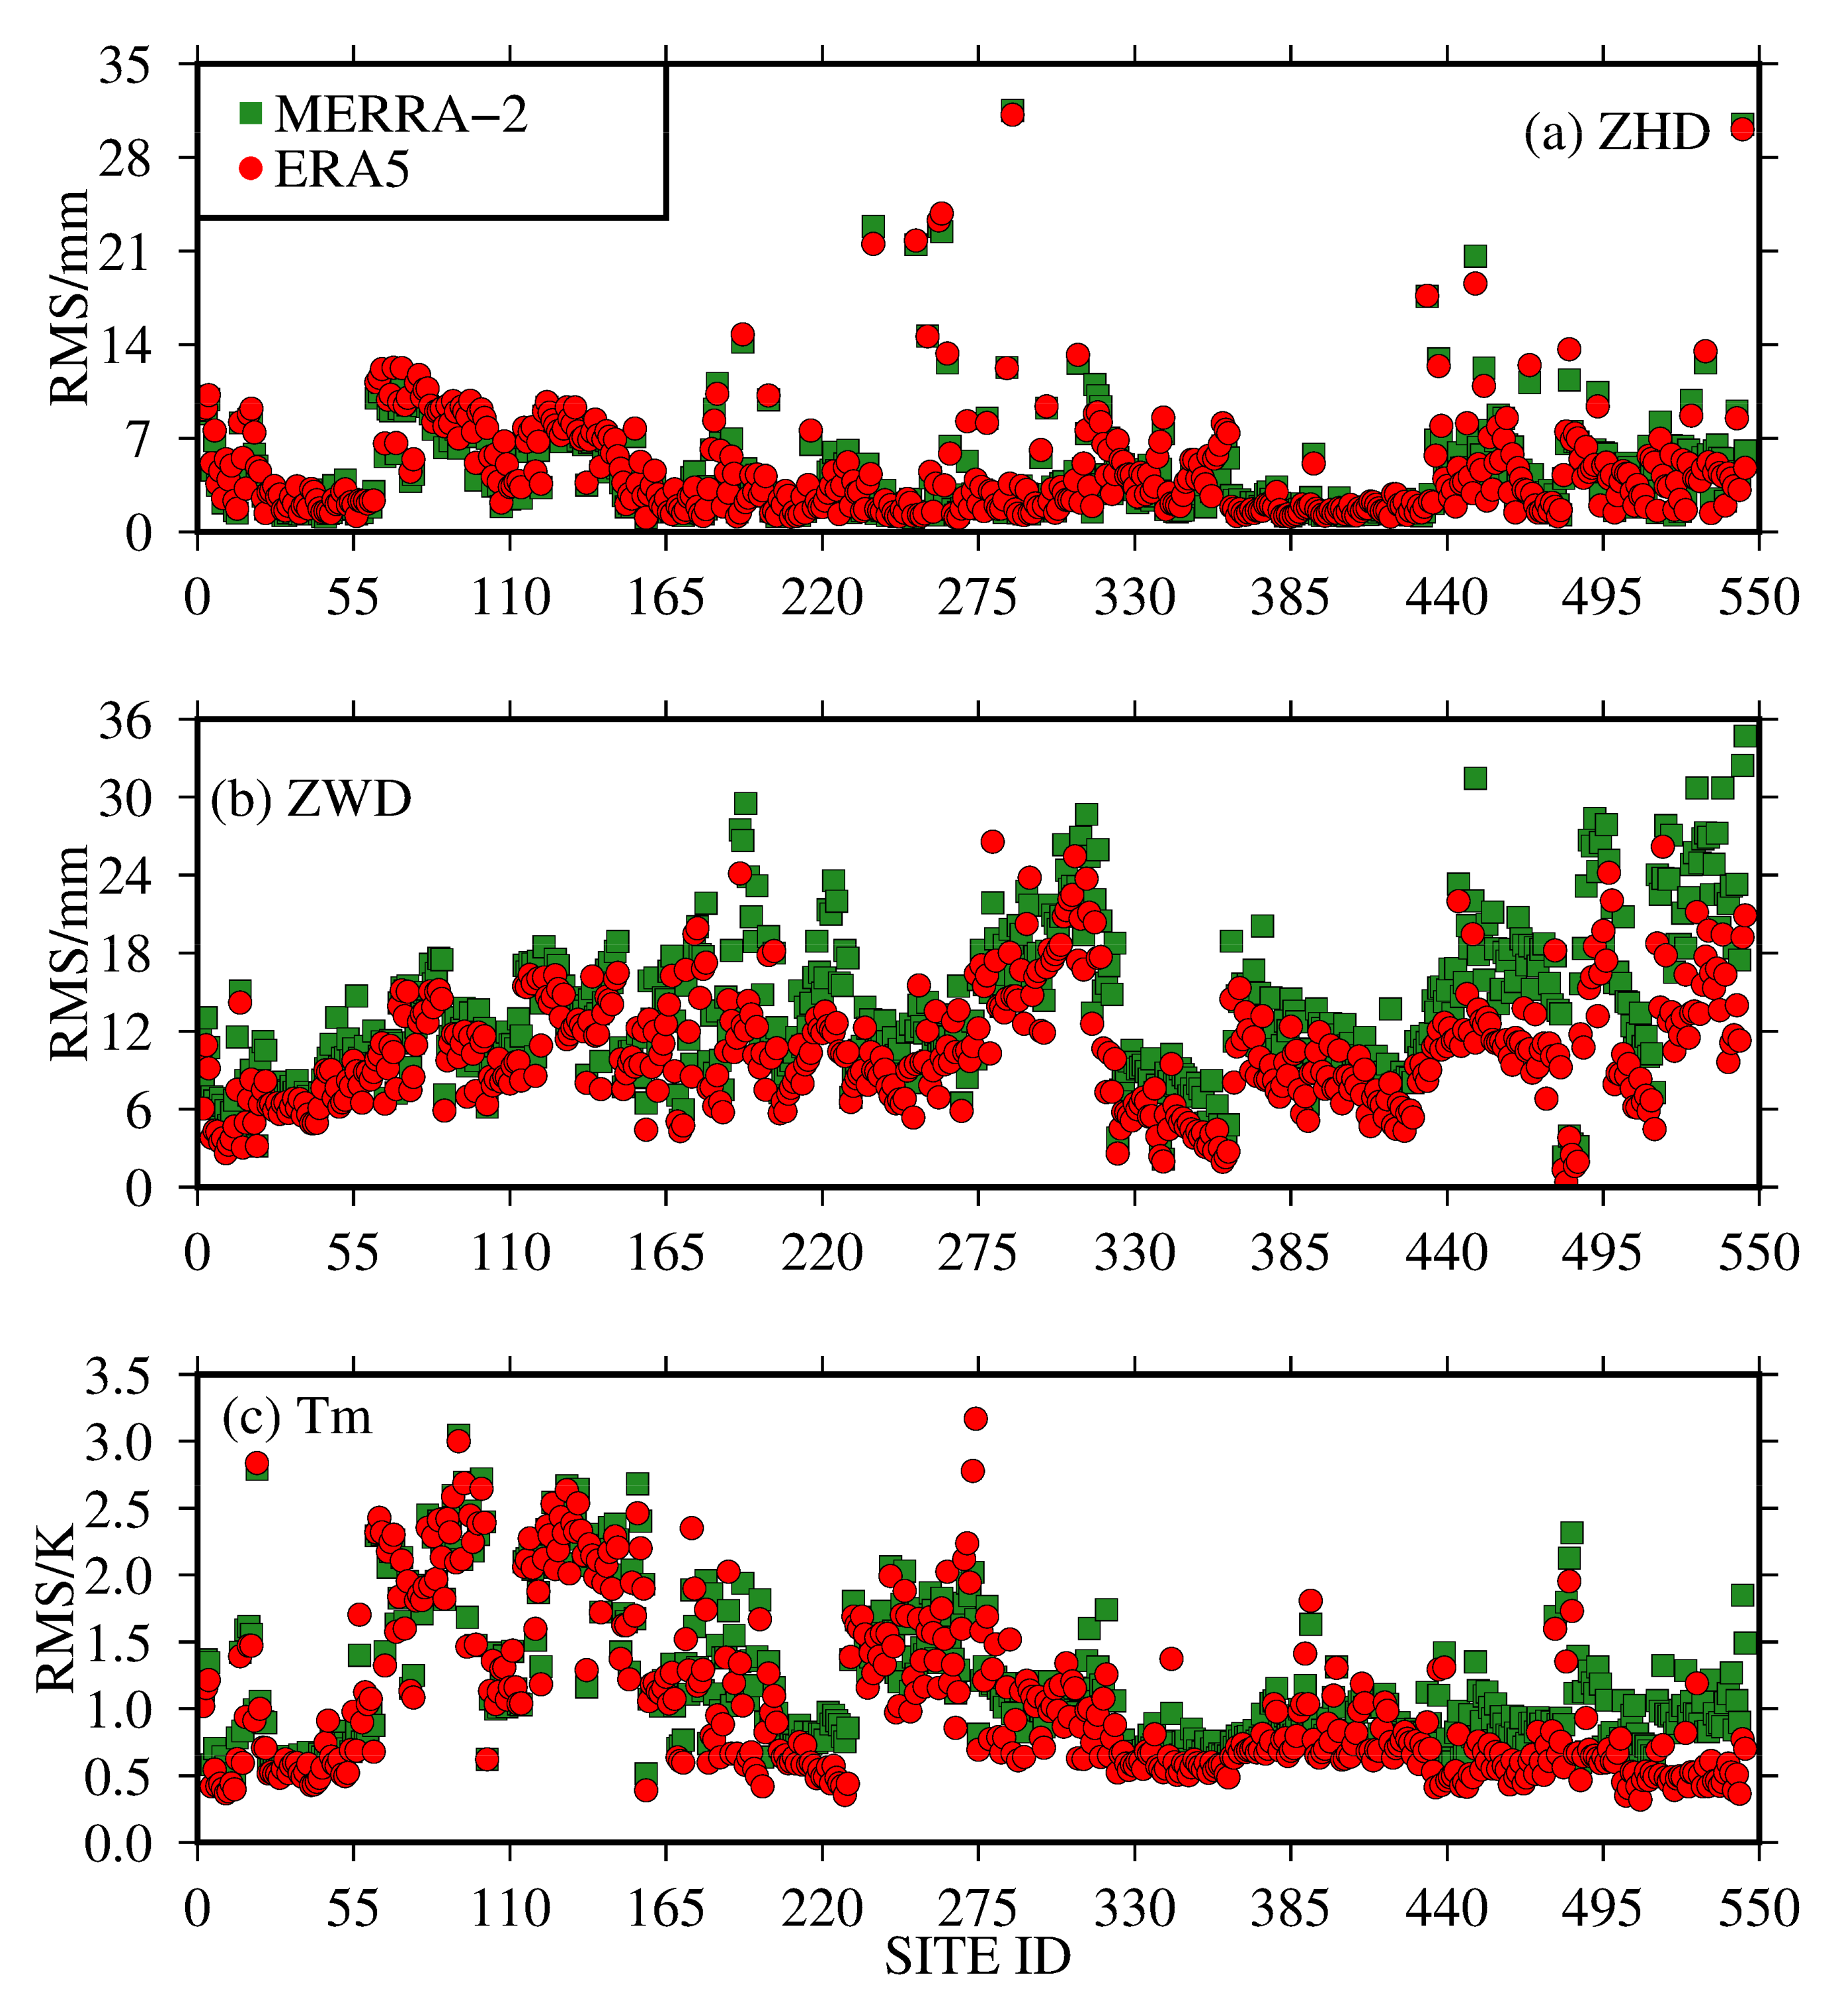
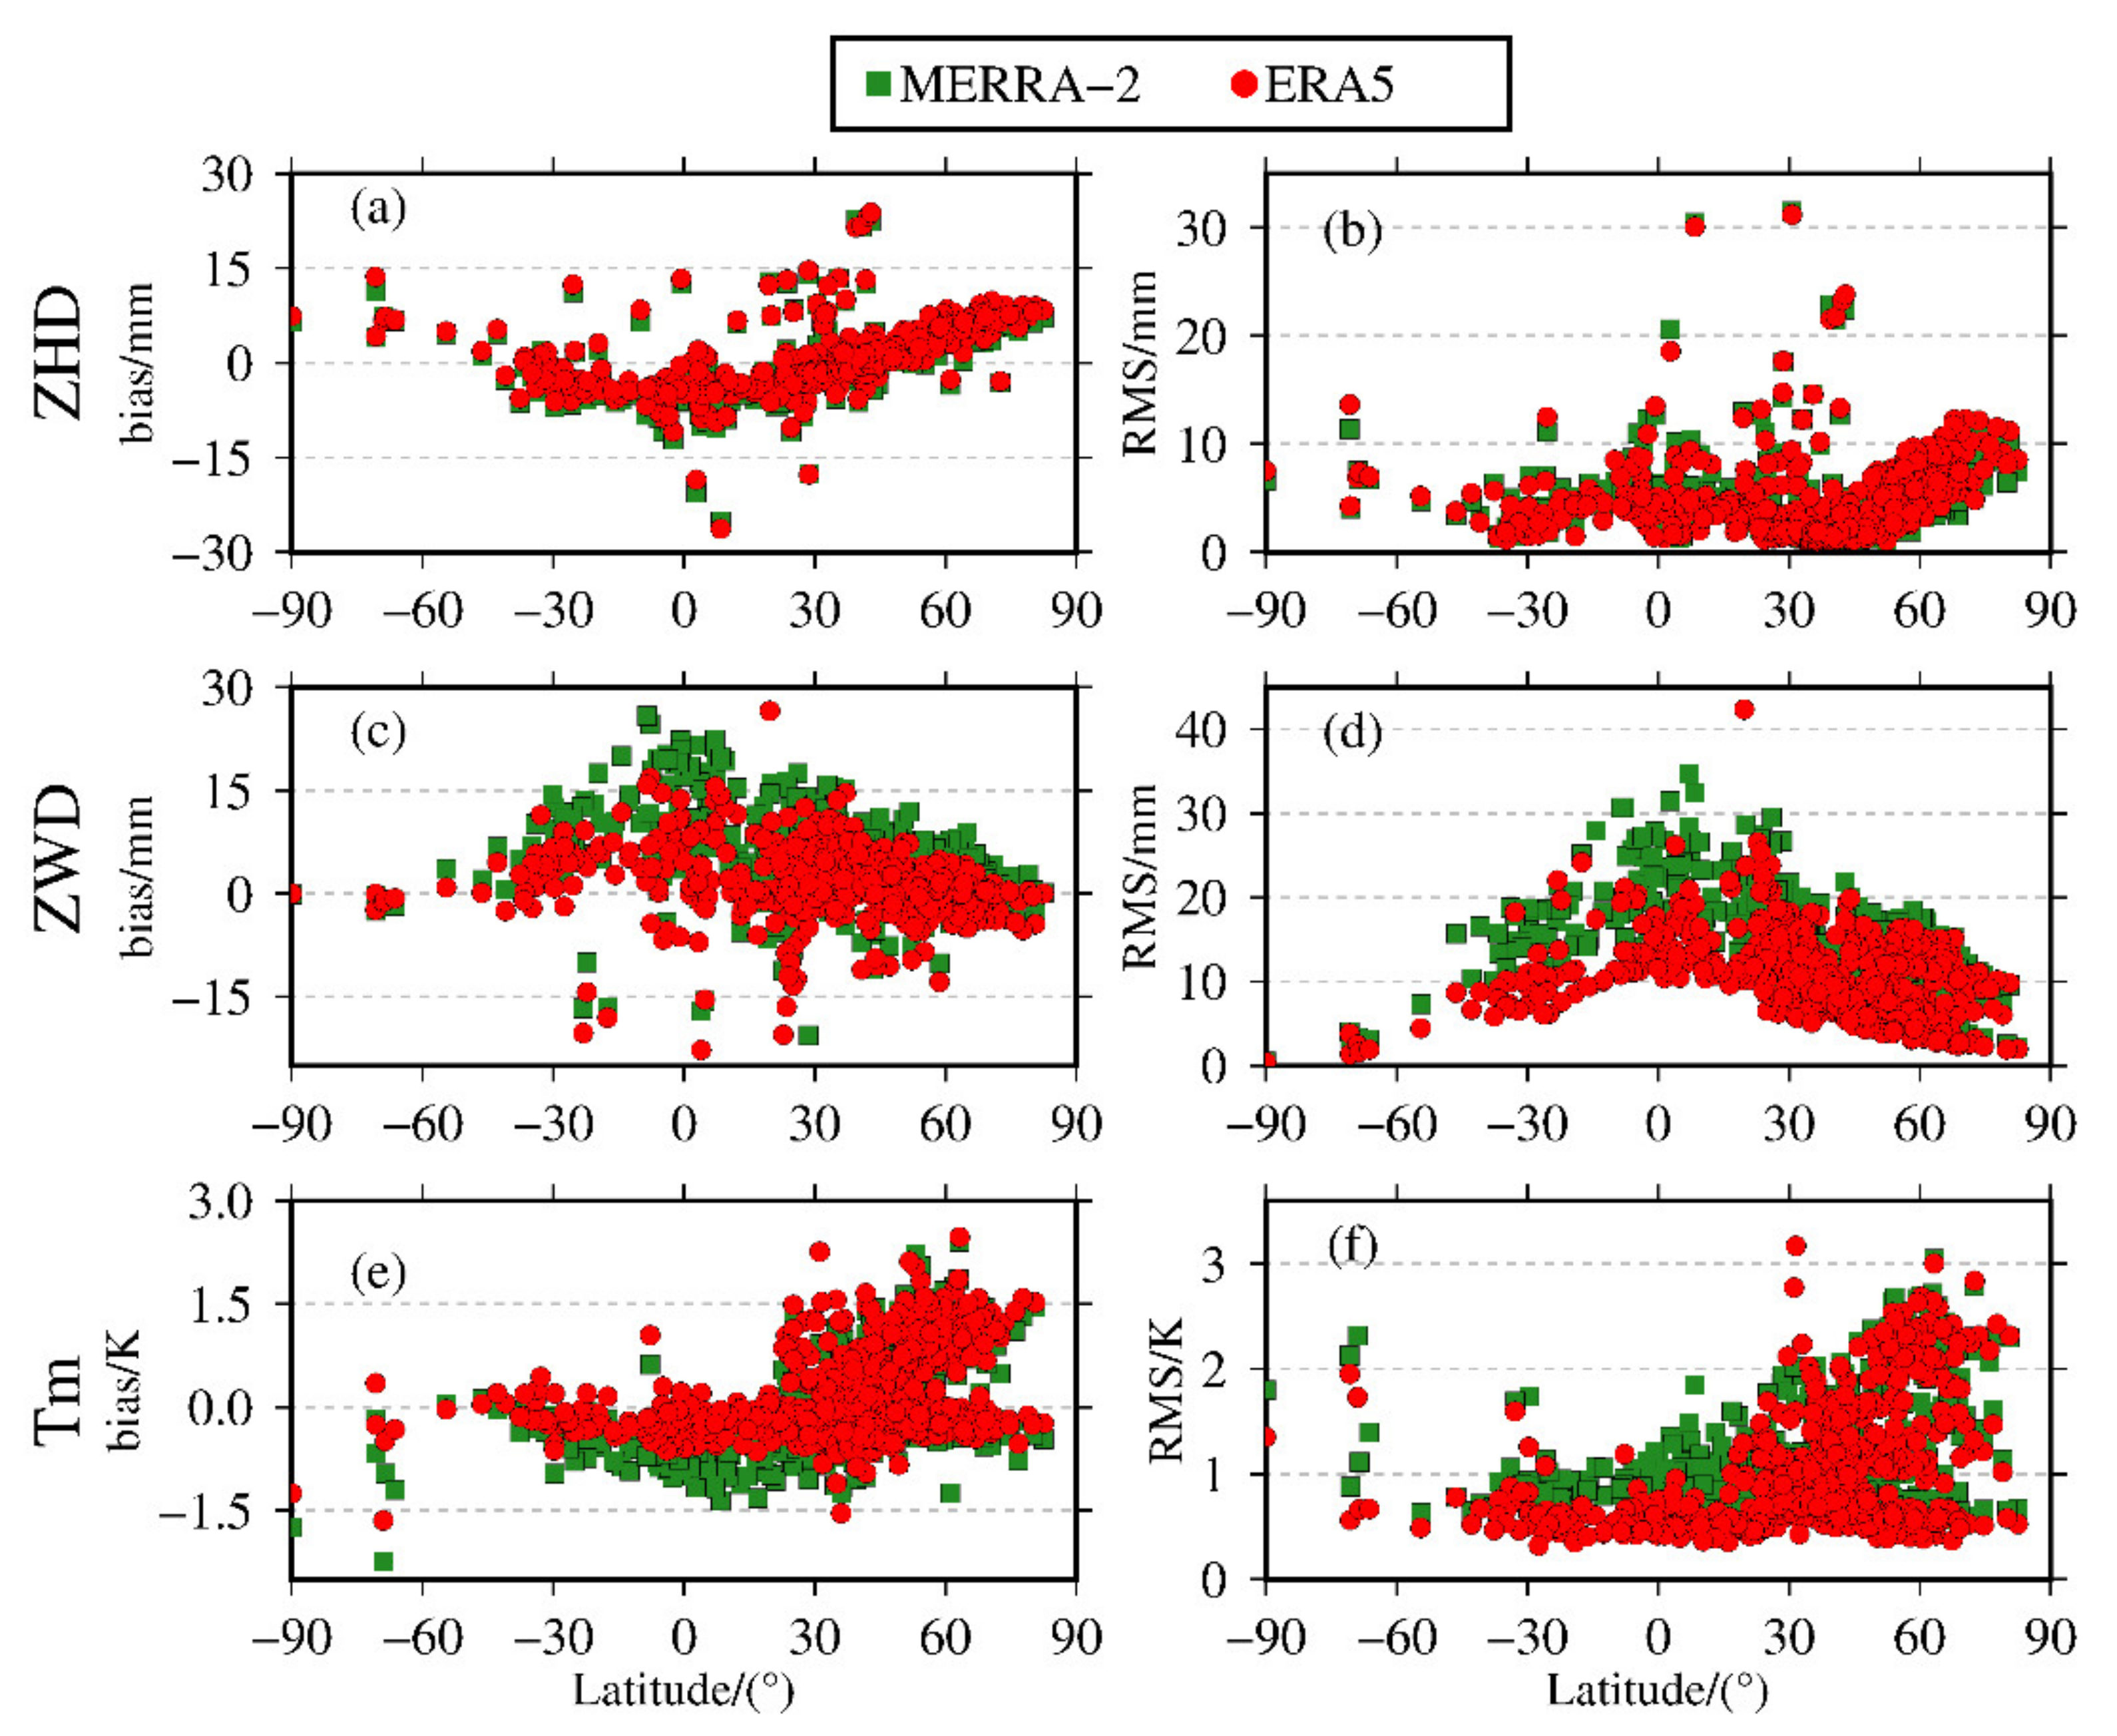
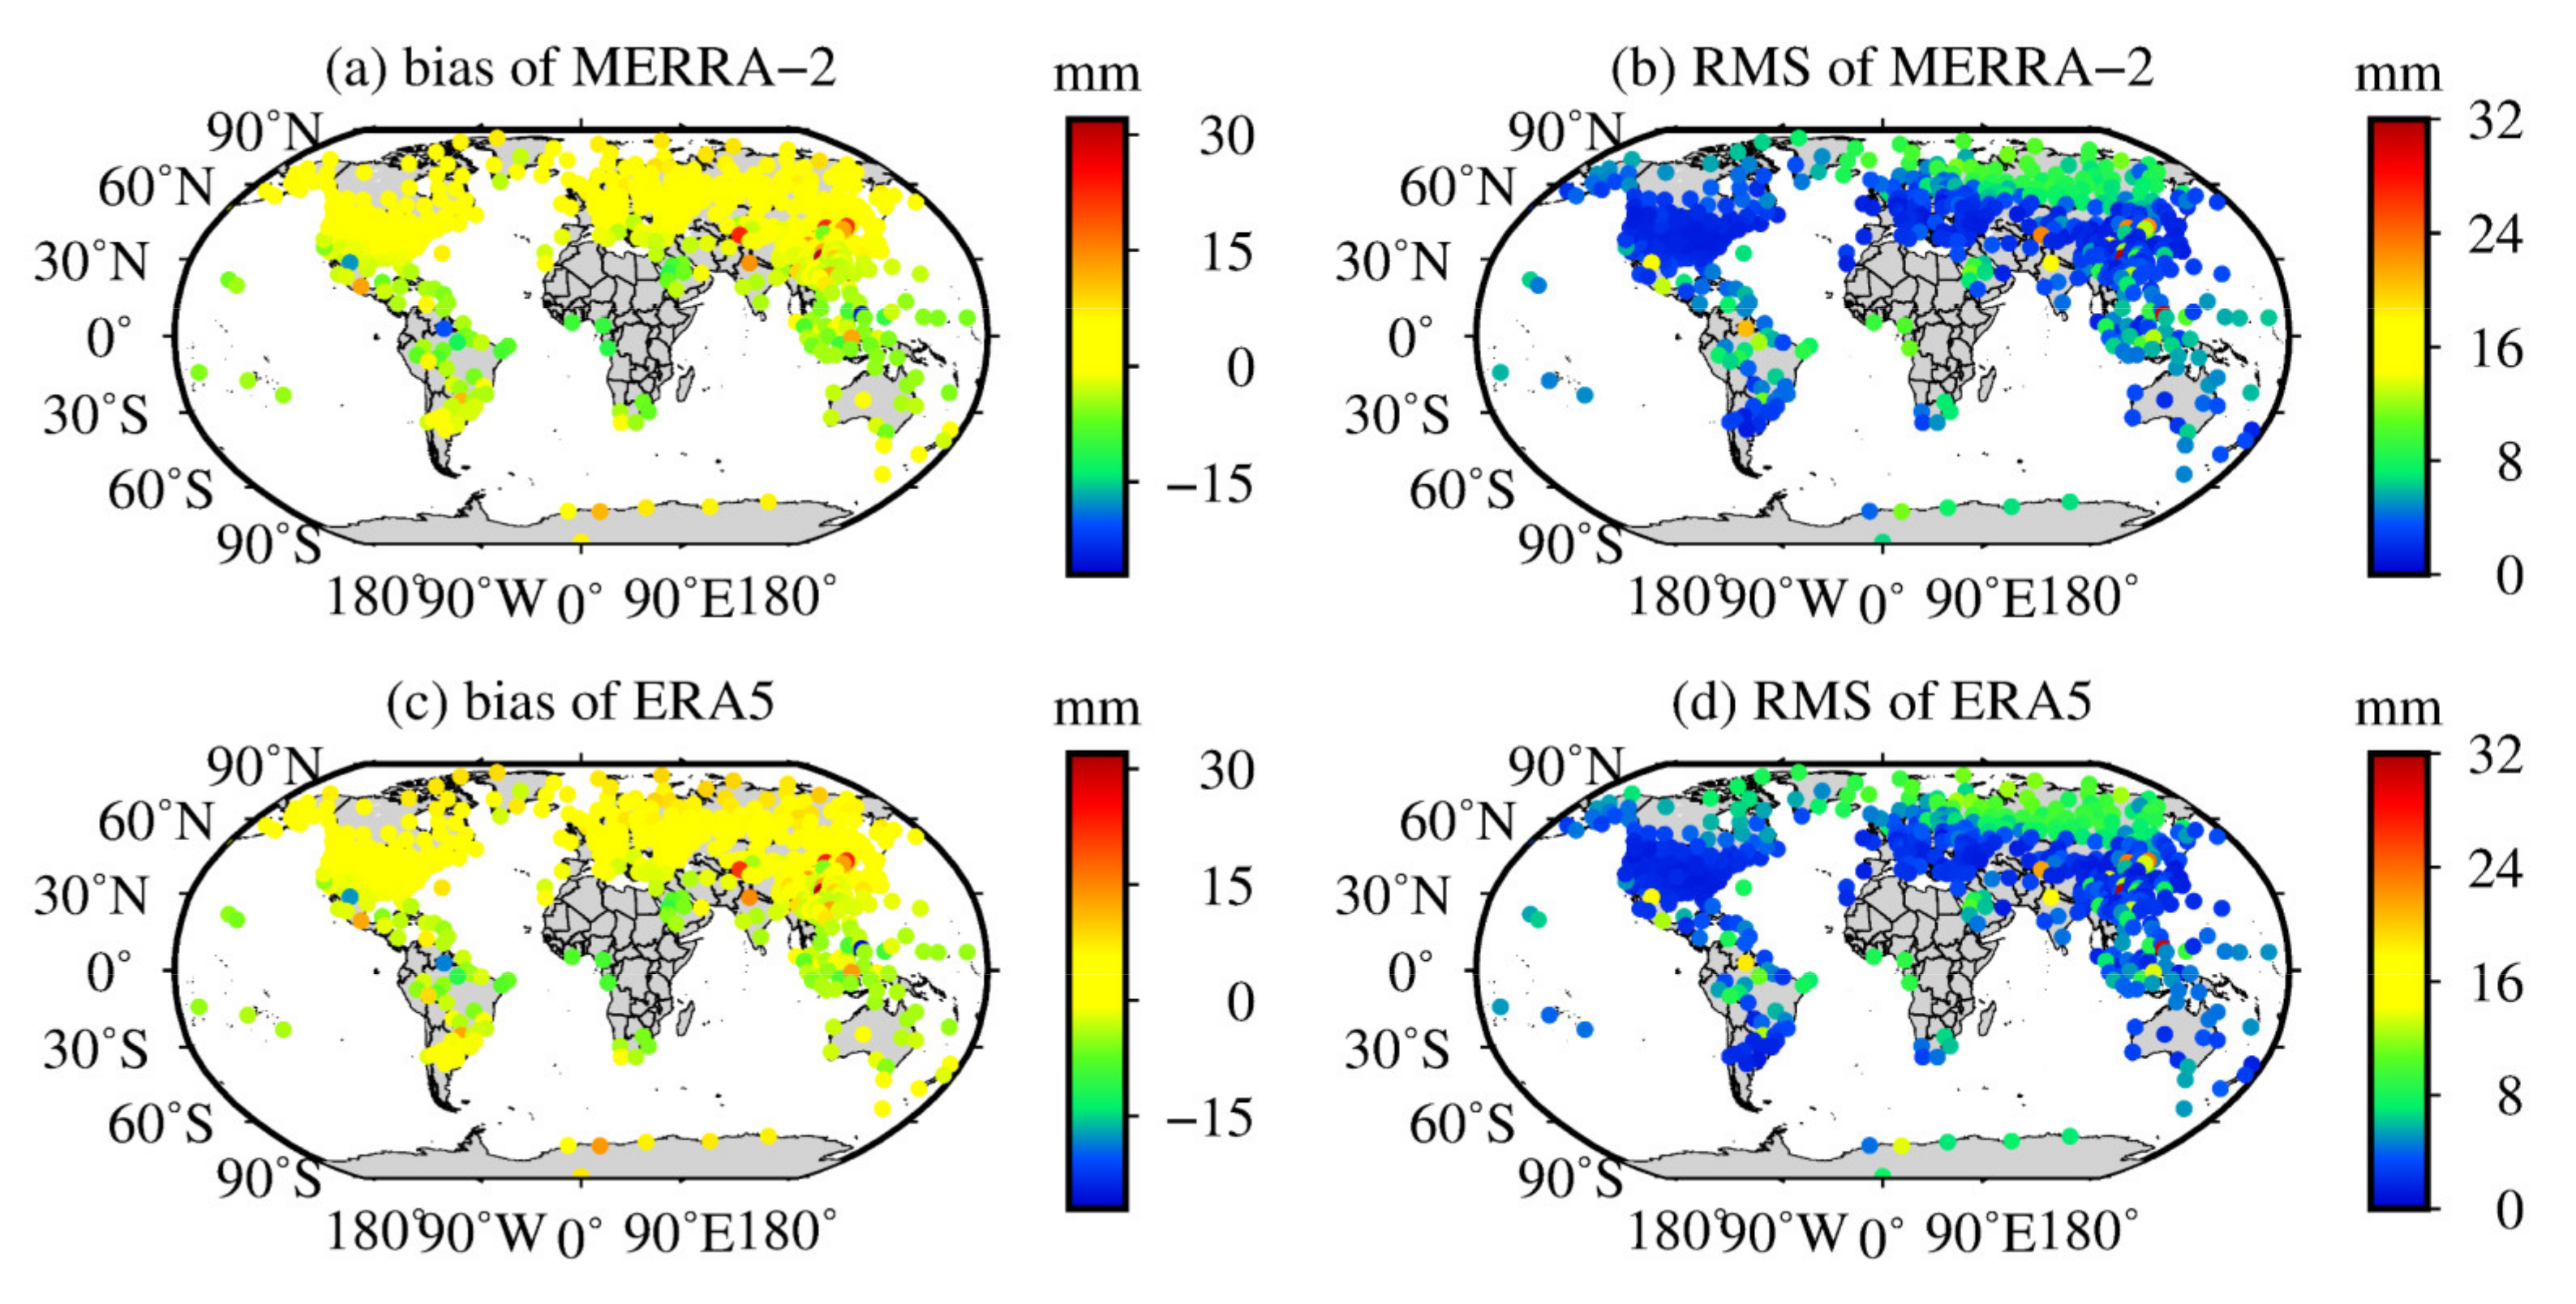
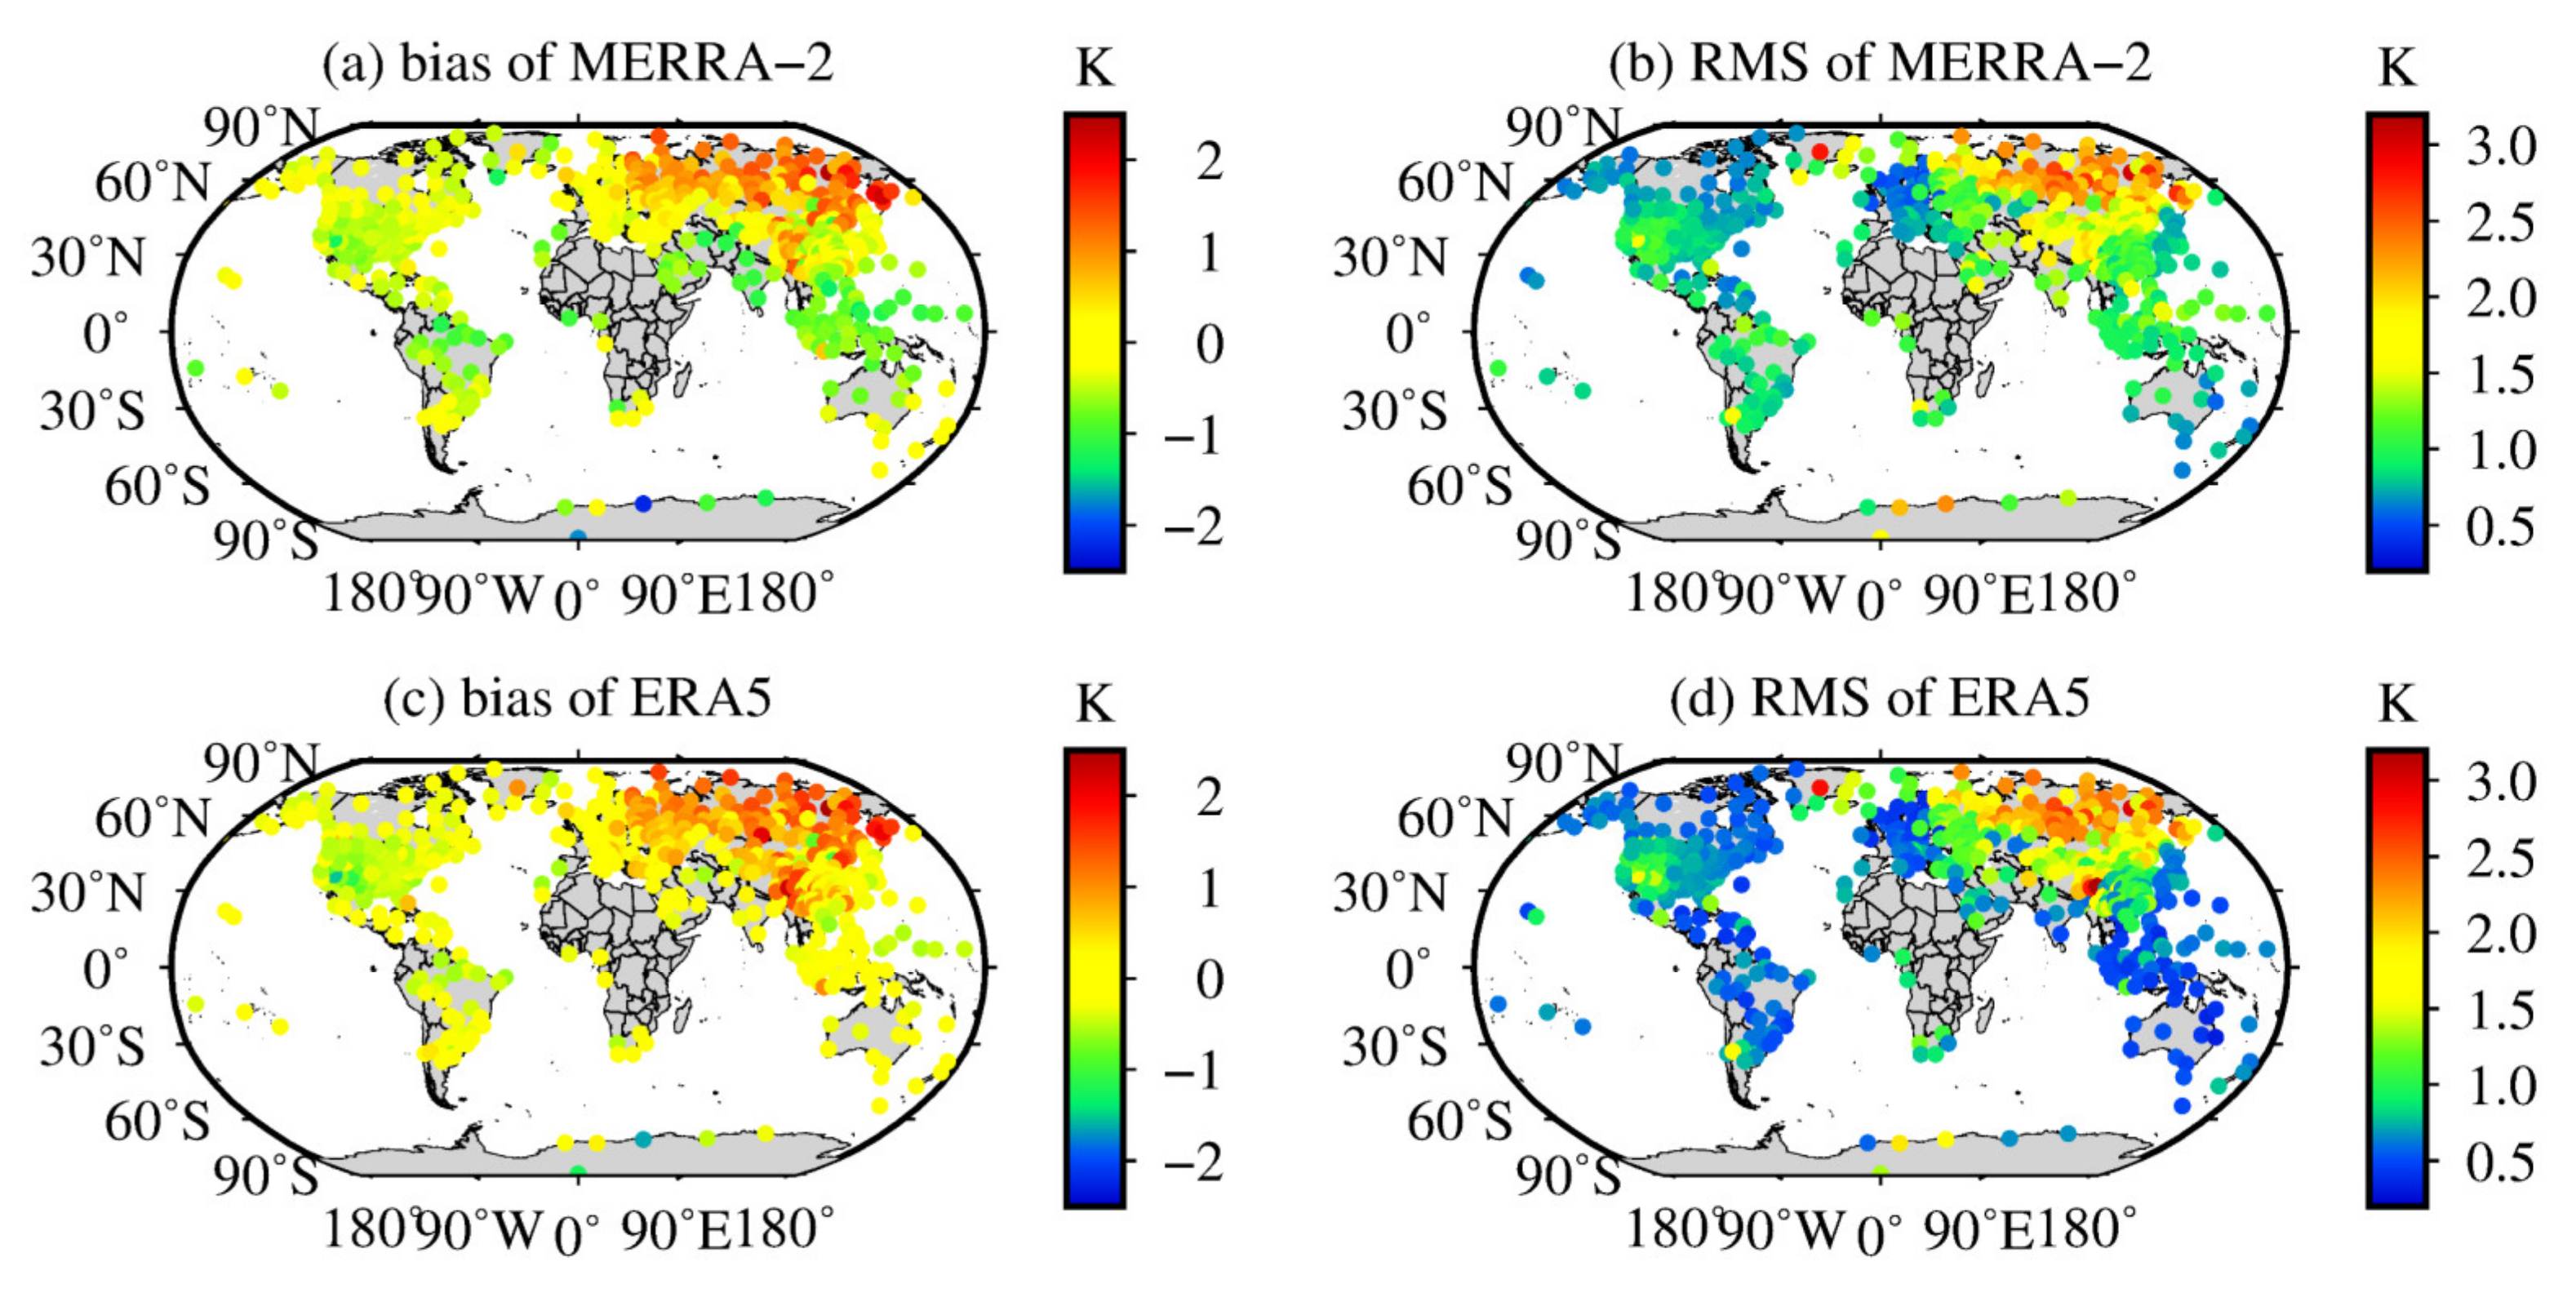
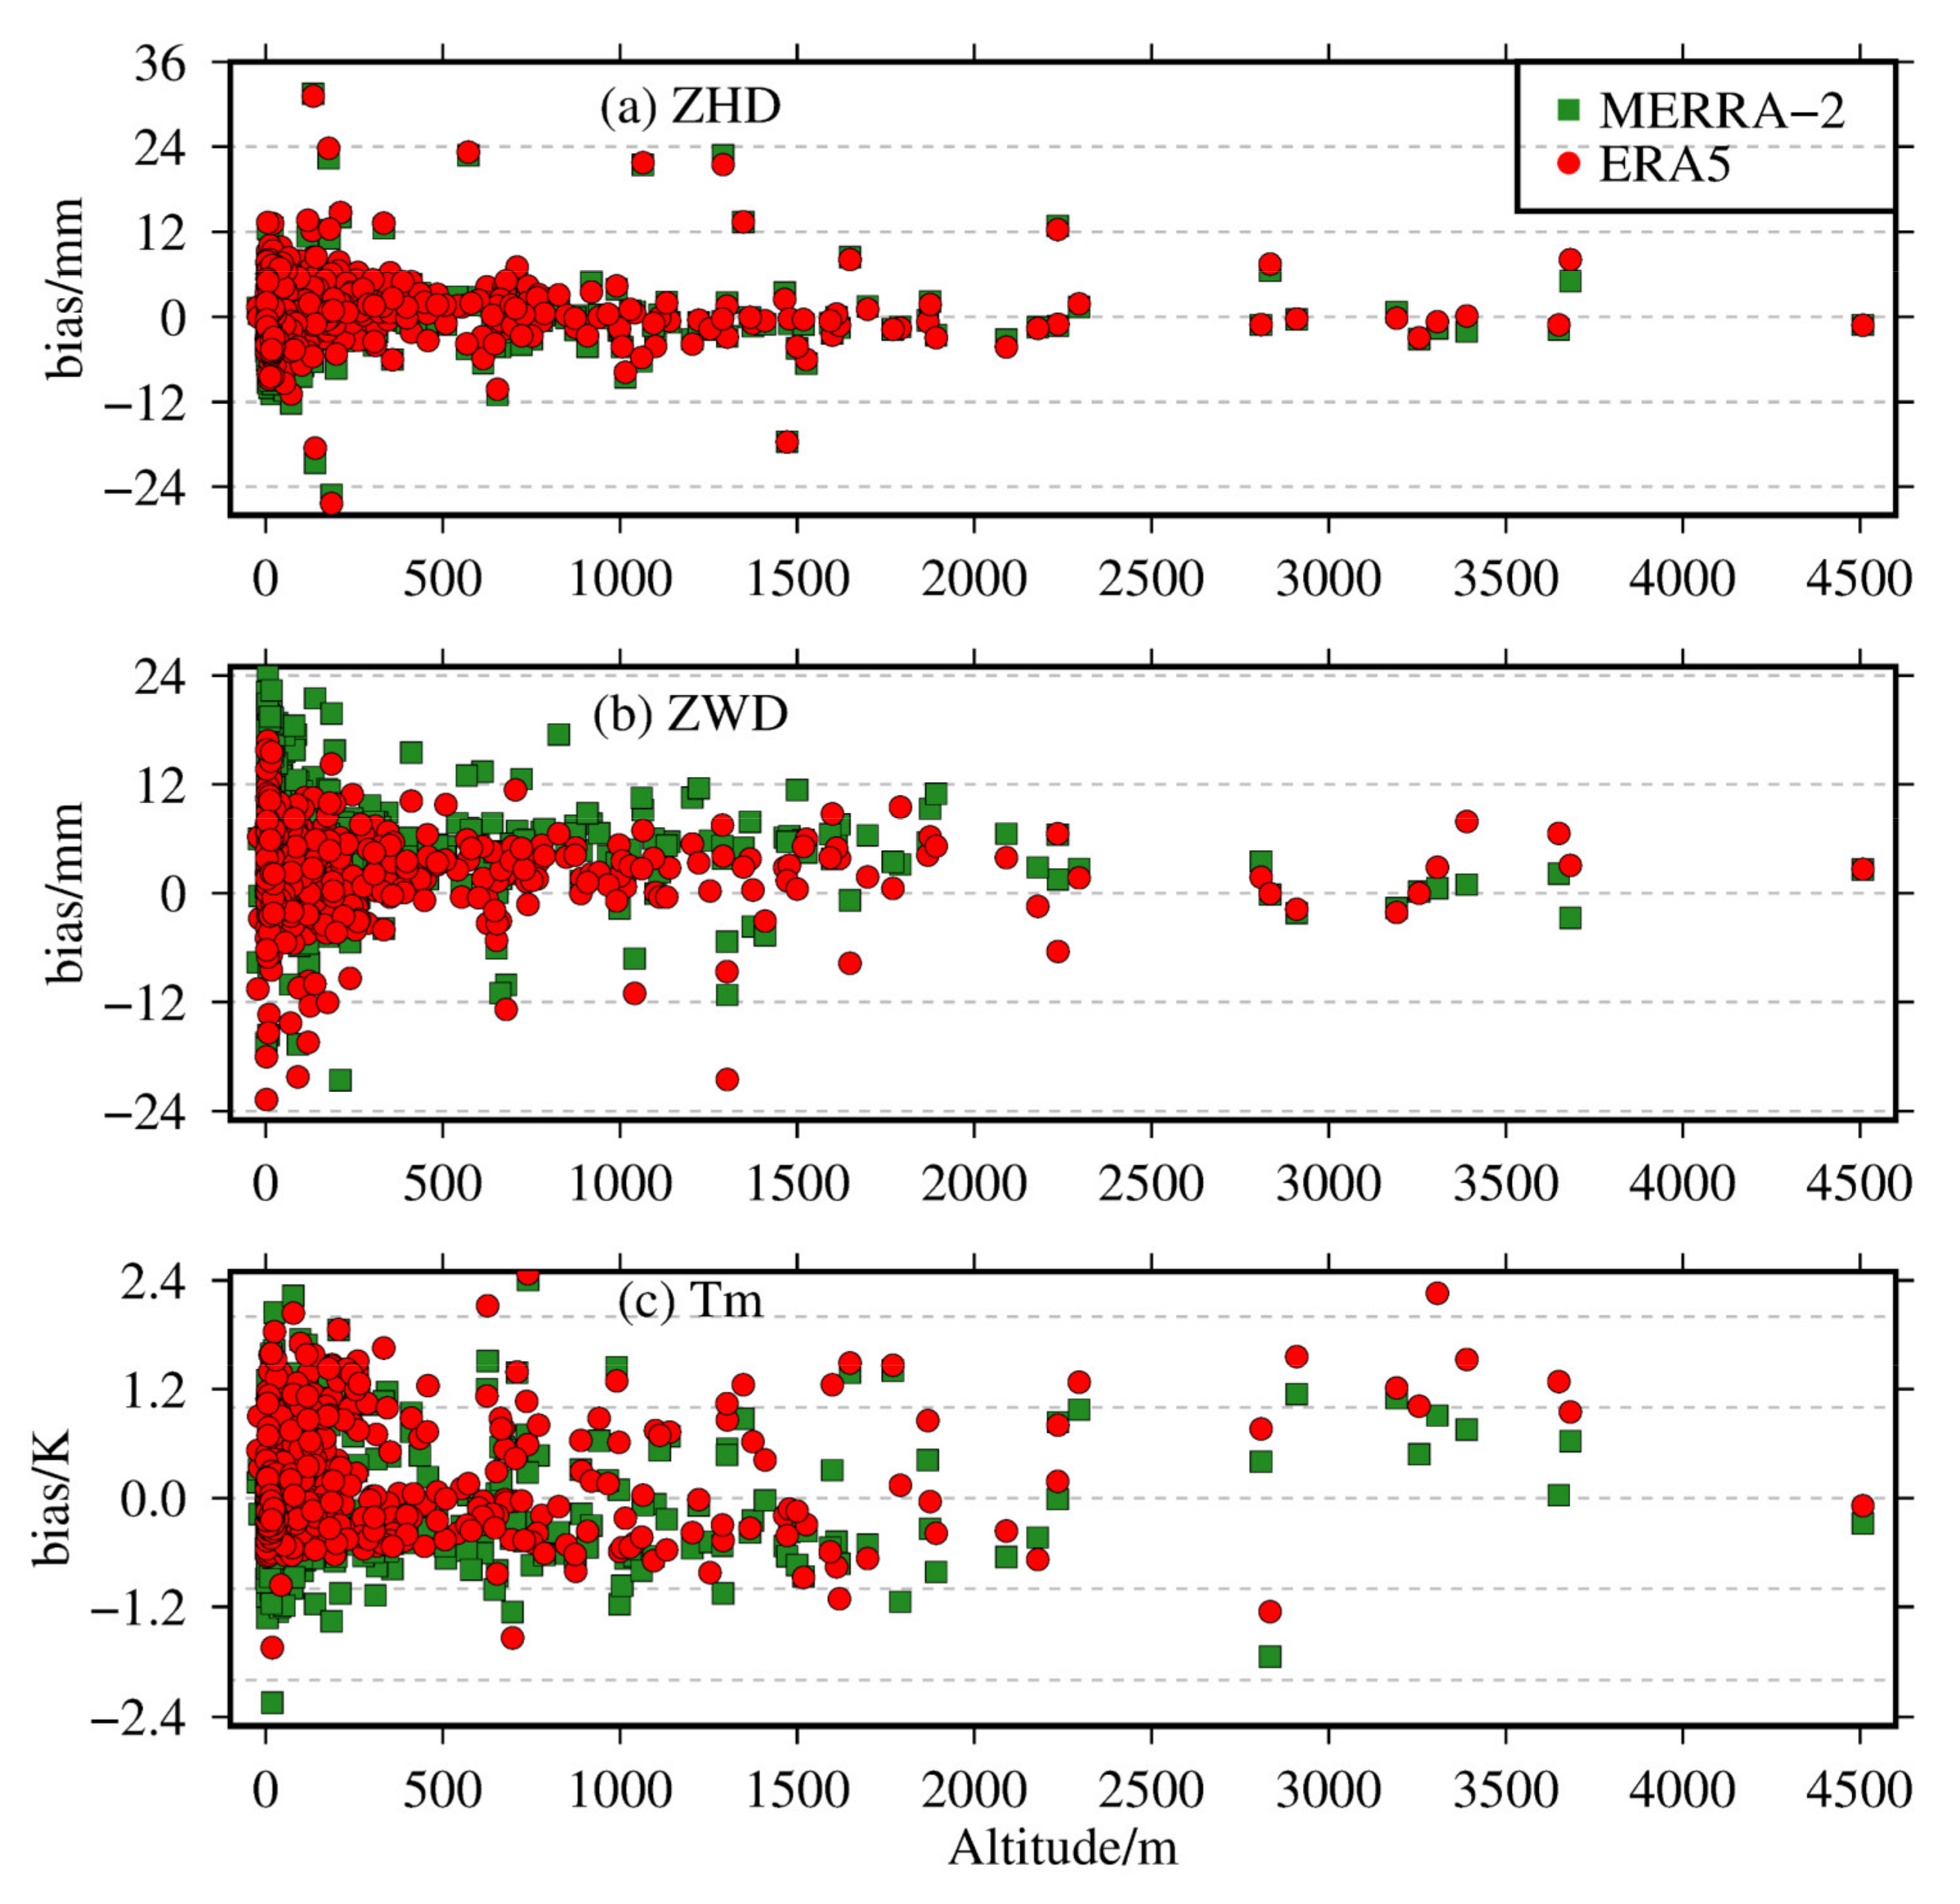
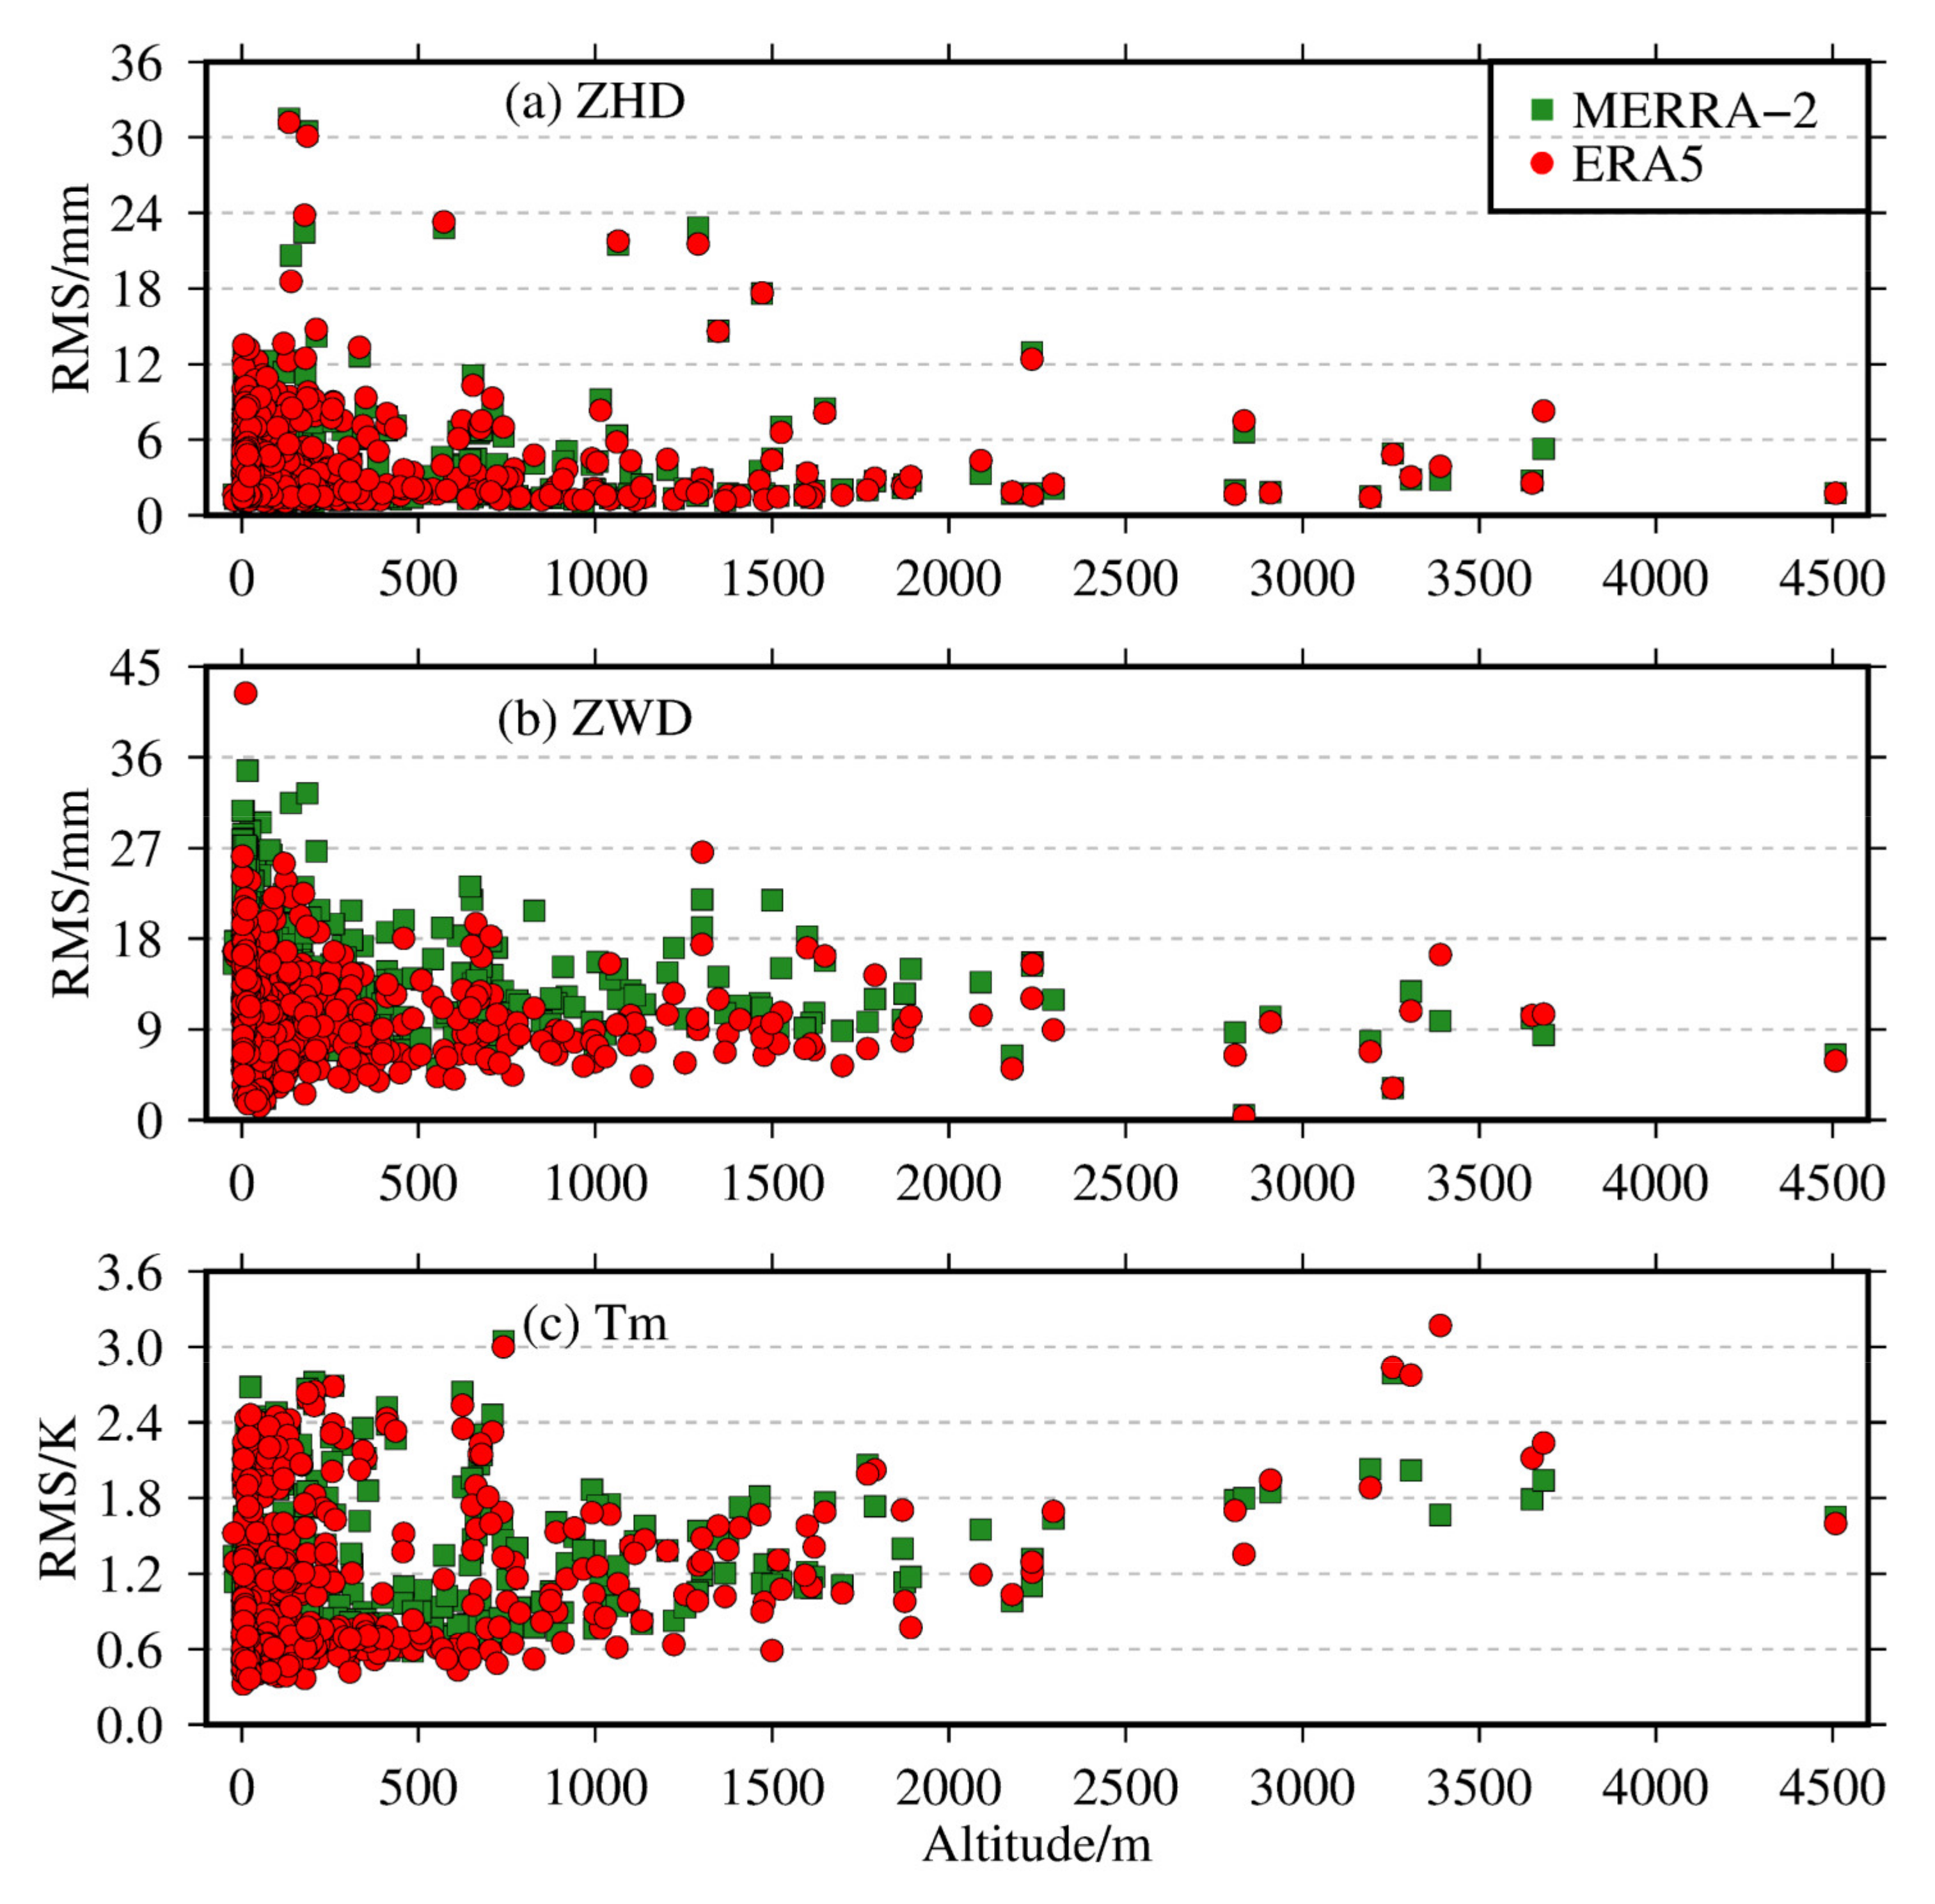
3.2. Evaluations of the ZHD, ZWD, and Tm Derived from MERRA-2 and ERA5 by Radiosonde Data

Through Section 3.1, we know that the accuracy of ZTD calculations from pressure-level data using the integration method is higher than that derived from surface-level data using the Saastamoinen model method. Thus, the following comparison and analysis were also mainly based on ERA5 and MERRA-2 pressure-level ZHD, ZWD, and Tm. ZHD, ZWD, and Tm calculated from radiosonde data from 545 stations from 2016 to 2017 were used to evaluate the accuracies of corresponding tropospheric parameters derived from ERA5 and MERRA-2 pressure-level data. The annual mean bias and RMS of ZHD, ZWD, and Tm values at each station were calculated. The results are shown in Table 4 and Figure 9.
The RMSs of ZHD derived from MERRA-2 data were almost the same as those of the ERA5 data, with an annual mean RMS of 4.4 mm for MERRA-2 and 4.5 mm for ERA5. Meanwhile, the RMSs of ZHD from MERRA-2 and ERA5 data compared to radiosonde ZHD were less than 10 mm for 94% of the 545 radiosonde stations. The accuracy of Tm calculated from MERRA-2 data was almost similar to that from the ERA5 data, with an annual mean RMS of 1.17 K for MERRA-2 and 1.03 K for ERA5. In addition, the RMSs of Tm derived from MERRA-2 and ERA5 data, with respect to radiosonde Tm, were less than 2.2 K for 93% of the 545 stations. Furthermore, the performance of ZWD derived from ERA5 data slightly improved over that of the MERRA-2 data, with an RMS of 10.5 mm for ERA5 and 13.6 mm for MERRA-2. The reasons for this are described in Section 3.1. In a word, the tropospheric parameters derived from MERRA-2 and ERA5 data had high precision.
To analyze the seasonal variation features of ZHD, ZWD, and Tm derived from ERA5 and MERRA-2 data, the monthly average bias and RMS values of ZHD, ZWD, and Tm at all radiosonde stations in four seasons are also summarized in Table 5. There are 470 radiosonde stations in the Northern Hemisphere and 75 radiosonde stations in the Southern Hemisphere. Seasonal variations did not evidently impact the accuracy of ZHD calculated from reanalysis data, with smaller differences in bias and RMS for different seasons over the globe, while a seasonal trend in bias and RMS for ZWD was evident in the Northern Hemisphere. The maximum and minimum RMS appeared in the summer and winter months, with an RMS of 19.1 and 8.0 mm for MERRA-2 and 14.8 and 6.6 mm for ERA5, respectively. This is caused by the abundant and changeable water vapor in summer [44]. Meanwhile, seasonal variations in the ZWD RMS in the Southern Hemisphere were opposite to that in the Northern Hemisphere, with an RMS of 14.6 and 18.8 mm in the summer and winter for MERRA-2 and 9.7 and 12.3 mm in summer and winter for ERA5, respectively. Furthermore, the biases of ERA5 Tm in winter were higher than those in summer in the Northern Hemisphere. The major reason for this is that the variation in Tm during winter is stronger than that in summer [21,45]. At the same time, the ERA5 Tm has a larger bias in summer and a smaller bias in winter in the Southern Hemisphere. However, the seasonal variation in RMS of Tm in the Southern Hemisphere and Northern Hemisphere was not obvious.
Figure 10 shows the variations in annual mean bias and RMS of ZHD, ZWD, and Tm with latitude. The variations of biases of ZHD, ZWD, and Tm with latitude were not distinct. However, the trend in RMSs of ZWD with latitude was clear, decreasing from the equator to the poles. Figure 11, Figure 12 and Figure 13 display the distribution of the annual mean bias and RMS values of ZHD, ZWD, and Tm over the globe. Across the board, the RMSs of ZHD were mostly within 1 cm, and those of Tm were mostly within 2 K over the globe. Moreover, the RMSs of ZHD and Tm represent slightly higher values in the north of Asia. This may be due to the seasonal variations of ZHD and Tm at high latitudes that are stronger than at low latitudes [21]. There was less difference between the accuracy of ZHD calculated from MERRA-2 and that of ERA5 over the globe. While the RMSs of ERA5 Tm were generally smaller than MERRA-2 at low latitudes, especially in South Asia, Southeast Asia, and the north of South America. In the meantime, the performance of ERA5 ZWD improved over MERRA-2 in these regions. In addition, the RMSs of ZWD were relatively large at low latitudes. This was due to the influence of the tropical climate, such as tropical rain forest and tropical monsoon, in the low latitude area, where the water vapor content is rich and changes violently. At the same time, the changes in the tropospheric meteorological parameters were more active as a result of the high temperature, which leads to an increase in the uncertainty in the calculation of tropospheric parameters from reanalysis data, and the accuracy of ZWD is reduced [46,47].
The variations in the biases and RMS values of ZHD, ZWD, and Tm with the altitude of the radiosonde station are shown in Figure 14 and Figure 15. The trends in the bias and RMS of ZHD, ZWD, and Tm with altitude were not clear. We can find that the radiosonde stations below 500 m showed relatively large bias and RMS values, mainly influenced by active meteorological parameters in low elevation areas, resulting in large errors of interpolation meteorological parameters. All the same, the RMSs of ZHD, ZWD, and Tm were mostly within 15, 27 mm, and 2.7 K. This further shows that taking the station height as the integral starting height can effectively reduce the error of tropospheric parameters interpolation in the elevation direction.

4. Conclusions

The ZTD, ZWD, ZHD, and Tm derived from MERRA-2 and ERA5 data were validated using radiosonde data and GNSS ZTD. The spatial and temporal distribution characteristics of bias and RMS values were also analyzed.
Taking hourly GNSS ZTD as reference values, the annual mean RMS of MERRA-2 ZTD from pressure-level data and surface-level data were 13.1 and 27.9 mm, respectively, and that of ERA5 ZTD from pressure-level data and surface-level data were 10.9 and 31.6 mm, respectively. This indicates that the performance of ZTD derived from pressure-level data was much better than surface-level data. Meanwhile, the accuracy of ERA5 pressure-level ZTD was slighter higher than MERRA-2 pressure-level ZTD, which may be caused by differences in data assimilation and physical models. Additionally, the temporal and spatial variation characteristics of the bias and RMS of ZTD derived from pressure-level data were analyzed over the globe. The seasonal variations in ZTD from ERA5 and MERRA-2 were clear over the globe, with larger errors in the summer and smaller errors in the winter in the Northern Hemisphere, while there were smaller errors in the summer and larger errors in the winter in the Southern Hemisphere. Furthermore, it was found that the trend in RMS of ZTD with latitude was obvious, decreasing from the equator to both poles. However, the trend in the bias and RMS of ZTD with altitude was not evident.
Compared with ZHD, ZWD, and Tm calculated from radiosonde data, the annual average RMS of ZHD, ZWD, and Tm derived from MERRA-2 data were 4.4, 13.6 mm, and 1.17 K, respectively, and those of ERA5 were 4.5, 10.5 mm, and 1.03 K, respectively. The bias and RMS of ZWD had evident seasonal variation which was similar to that of ZTD. Meanwhile, the trend for RMS of ZWD with latitude was also similar to that of ZTD. However, the RMS values for ZHD and Tm were relatively larger at high latitudes in the Northern Hemisphere. This may be due to the seasonal variations of ZHD and Tm at high latitudes that were stronger than at low latitudes. In addition, the variations in ZHD, ZWD, and Tm with altitude were not clear.
In summary, the performance of tropospheric parameters derived from ERA5 was slighter higher than MERRA-2 with improved temporal and spatial resolution, which can be used for global tropospheric modeling, GNSS meteorology research, and other regions.

Author Contributions

Conceptualization, L.G., L.H. (Liangke Huang), H.H. and L.L.; Methodology, L.G., L.H. (Liangke Huang), S.X. and B.F.; Founding acquisition, L.L.; Validation, L.H. (Liangke Huang), L.G., L.H. (Ling Huang), and J.L.; Writing—original draft, L.G.; Writing—review and editing, L.G., L.H. (Liangke Huang), J.L. L.L., L.H. (Ling Huang), B.F., S.X., C.R. and H.H. All authors have read and agreed to the published version of the manuscript.

Funding

This research was founded by Guangxi Natural Science Foundation of China (grant numbers: 2018GXNSFAA281182, 2017GXNSFDA198016, 2020GXNSFBA297145 and 2017GXNSFBA198139); the National Natural Foundation of China (grant numbers: 41864002, 41704027, and 41664002); Innovation Project of GuangXi Graduate Education (grant number: YCSW2021209); the “Ba Gut Scholars” program of the provincial government of Guangxi and the Open Fund of Hunan Natural Resources Investigation and Monitoring Engineering Technology Research Center (grant number: 2020-9).

Data Availability Statement

The MERRA-2 data was obtained from NASA (https://goldsmr4.gesdisc.eosdis.nasa.gov/data/MERRA2, accessed on 1 June 2021) and the ERA5 data was obtained from ECMWF (https://www.ecmwf.int/en/forecasts/datasets/reanalysis-datasets/era5, accessed on 1 June 2021). The GNSS data was obtained from IGS (https://cddis.nasa.gov/archive/gnss/products/troposphere/zpd/, accessed on 1 June 2021) and the radiosonde data was obtained from the websites of the University of Wyoming (http://weather.uwyo.edu/upperair/sounding.html, accessed on 1 June 2021).

Acknowledgments

The authors would like to extend their sincere gratitude to NASA, IGS, ECMWF, and the University of Wyoming for providing the relevant data.

Conflicts of Interest

The authors declare no conflict of interest.

References

  1. Hofmeister, A.; Bohm, J. Application of ray-traced tropospheric slant delays to geodetic VLBI analysis. J. Geod. 2017, 91, 945–964. [Google Scholar] [CrossRef] [Green Version]
  2. Mendes, V.B.; Prates, G.; Pavlis, E.C.; Pavlis, D.E.; Langley, R.B. Improved mapping functions for atmospheric refraction correction in SLR. Geophys. Res. Lett. 2002, 29, 51–53. [Google Scholar] [CrossRef] [Green Version]
  3. Kinoshita, Y.; Shimada, M.; Furuya, M. InSAR observation and numerical modeling of the water vapor signal during a heavy rain: A case study of the 2008 Seino event, central Japan. Geophys. Res. Lett. 2013, 40, 4740–4744. [Google Scholar] [CrossRef]
  4. Hobiger, T.; Ichikawa, R.; Koyama, Y.; Kondo, T. Fast and accurate ray-tracing algorithms for real-time space geodetic applications using numerical weather models. J. Geophys. Res. Atmos. 2008, 113. [Google Scholar] [CrossRef]
  5. Askne, J.; Nordius, H. Estimation of tropospheric delay for microwaves from surface weather data. Radio Sci. 1987, 22, 379–386. [Google Scholar] [CrossRef]
  6. Ning, T.; Wang, J.; Elgered, G.; Dick, G.; Wickert, J.; Bradke, M.; Sommer, M.; Querel, R.; Smale, D. The uncertainty of the atmospheric integrated water vapour estimated from GNSS observations. Atmos. Meas. Tech. 2016, 9, 79–92. [Google Scholar] [CrossRef] [Green Version]
  7. Lu, C.; Zus, F.; Heinkelmann, R.; Dick, G.; Ge, M.; Wickert, J.; Schuh, H. Tropospheric delay parameters from numerical weather models for muulti-GNSS precise positioning. Atmos. Meas. Tech. 2016, 9, 5965–5973. [Google Scholar] [CrossRef] [Green Version]
  8. Lu, C.; Li, X.; Zus, F.; Keinkelmann, R.; Dick, G.; Ge, M.; Wickert, J.; Schuh, H.; Wickert, J.; Schuh, H. Improving BeiDou real-time precise point positioning with numerical weather models. J. Geod. 2017, 91, 1019–1029. [Google Scholar] [CrossRef]
  9. Yao, Y.; Peng, W.; Xu, C.; Cheng, S. Enhancing real-time precise point positioning with zenith troposphere delay products and the determination of corresponding tropospheric stochastic models. Geophys. J. Int. 2017, 208, 1217–1230. [Google Scholar] [CrossRef]
  10. Pany, T.; Pesec, P.; Stangl, G. Elimination of tropospheric path delays in GPS observations with the ECMWF numerical weather model. Phys. Chem. Earth Part A Solid Earth Geod. 2001, 26, 487–492. [Google Scholar] [CrossRef]
  11. Bromwich, D.H.; Wang, S.H. Evaluation of the NCEP-NCAR and ECMWF15-and 40-yr reanalyzes using radiosonde data from two independent Arctic field experiments. Mon. Weather rev. 2005, 133, 3562–3578. [Google Scholar] [CrossRef]
  12. Bohm, J.; Moller, G.; Schindelegger, M.; Pain, G.; Weber, R. Development of an improved empirical model for slant delays in the troposphere (GPT2w). GPS Solut. 2015, 19, 433–441. [Google Scholar] [CrossRef] [Green Version]
  13. Landskron, D.; Bohm, J. VMF3/GPT3: Refined discrete and empirical troposphere mapping functions. J. Geod. 2018, 92, 349–360. [Google Scholar] [CrossRef]
  14. Schuler, T. The TropGrid2 standard tropospheric correction model. GPS Solut. 2014, 18, 123–131. [Google Scholar] [CrossRef]
  15. Yao, Y.; Xu, C.; Shi, J.; Cao, N.; Zhang, B.; Yang, J. ITG: A new global GNSS tropospheric correction model. Sci. Rep. 2015, 5, 10273. [Google Scholar] [CrossRef] [Green Version]
  16. Huang, L.K.; Liu, L.L.; Chen, H.; Jiang, W.P. An improved atmospheric weighted mean temperature model and its impact on GNSS precipitable water vapor estimates for China. GPS Solut. 2019, 23, 1–16. [Google Scholar] [CrossRef]
  17. Huang, L.K.; Jiang, W.P.; Liu, L.L.; Chen, H.; Ye, S.R. A new global grid model for the determination of atmospheric weighted mean temperature in GPS precipitable water vapor. J. Geod. 2019, 93, 159–176. [Google Scholar] [CrossRef]
  18. Zhang, W.; Zhang, H.; Liang, H.; Lou, Y.; Cai, Y.; Cao, Y.; Zhou, Y.; Liu, w. On the suitability of ERA5 in hourly GPS precipitable water vapor retrieval over China. J. Geod. 2019, 93, 1897–1909. [Google Scholar] [CrossRef]
  19. Mateus, P.; Catalão, J.; Mendes, V.B.; Nico, G. An ERA5-Based Hourly Global Pressure and Temperature (HGPT) Model. Remote Sens. 2020, 12, 1098. [Google Scholar] [CrossRef] [Green Version]
  20. Li, J.Y.; Zhang, B.; Yao, Y.B.; Liu, L.L.; Sun, Z.Y.; Yan, X. A refined regional model for estimating pressure, temperature, and water vapor pressure for geodetic applications in China. Remote Sens. 2020, 12, 1713. [Google Scholar] [CrossRef]
  21. Sun, Z.; Zhang, B.; Yao, Y. An ERA5-based model for estimating tropospheric delay and weighted mean temperature over China with improved spatiotemporal resolutions. Earth Space Sci. 2019, 6, 1926–1941. [Google Scholar] [CrossRef]
  22. Vedel, H.; Mogensen, K.S.; Huang, X.Y. Calculation of zenith delays from meteorological data comparison of NWP model, radiosonde and GPS delays. Phys. Chem. Earth Part A Solid Earth Geod. 2001, 26, 497–502. [Google Scholar] [CrossRef]
  23. Zhou, Y.; Lou, Y.; Zhang, W.; Kuang, C.; Liu, W.; Bai, J. Improved performance of ERA5 in global tropospheric delay retrieval. J. Geod. 2020, 94, 103. [Google Scholar] [CrossRef]
  24. Hersbach, H.; de Rosnay, P.; Bell, B.; Schepers, D.; Simmons, A.; Soci, C.; Abdalla, S.; Alonso-Balmaseda, M.; Balsamo, G.; Bechtold, P.; et al. Operational global reanalysis: Progress, future directions and Synergies with NWP. ERA Rep. Ser. 2018, 27. [Google Scholar] [CrossRef]
  25. Albergel, C.; Dutra, E.; Munier, S.; Calvet, J.C.; Munoz-Sabater, J.; de Rosnay, P.; Balsamo, G. ERA5 and ERA-Interim driven ISBA land surface model simulations: Which one performs better? Hydrol. Earth Syst. Sci. 2018, 22, 3515–3532. [Google Scholar] [CrossRef] [Green Version]
  26. Molod, A.; Takacs, L.; Suarez, M.; Bacmeister, J. Development of the GEOS-5 atmospheric general circulation model: Evolution from MERRA to MERRA2. Geosci. Model Dev. 2015, 8, 1339–1356. [Google Scholar] [CrossRef] [Green Version]
  27. Gelaro, R.; Mccarty, W.; Suárez, M.; Todling, R.; Zhao, B. The modern-era retrospective analysis for research and applications, Version 2 (MERRA-2). J. Clim. 2017, 30, 5419–5454. [Google Scholar] [CrossRef]
  28. Jiang, C.; Xu, T.; Wang, S.; Nie, S.; Sun, Z. Evaluation of zenith tropospheric delay derived from ERA5 data over China using GNSS observations. Remote Sens. 2020, 12, 663. [Google Scholar] [CrossRef] [Green Version]
  29. Byun, S.H.; Bar-Sever, Y.E. A new type of troposphere zenith path delay product of the international GNSS service. J. Geod. 2009, 83, 367–373. [Google Scholar] [CrossRef] [Green Version]
  30. Yao, Y.; Xu, C.; Zhang, B.; Cao, N. GTm-III: A new global empirical model for mapping zenith wet delays onto precipitable water vapour. Geophys. J. Int. 2014, 197, 202–212. [Google Scholar] [CrossRef] [Green Version]
  31. Zhang, H.; Yuan, Y.; Li, W.; Zhang, B. A real-time precipitable water vapor monitoring system using the national GNSS network of China: Method and preliminary results. IEEE J. Sel. Top. Appl. Earth Obs. Remote Sens. 2019, 12, 1587–1598. [Google Scholar] [CrossRef]
  32. Wang, J.; Zhang, L. Climate applications of a global, 2-hourly atmospheric precipitable water dataset derived from IGS tropospheric products. J. Geod. 2009, 83, 209–217. [Google Scholar] [CrossRef] [Green Version]
  33. Bevis, M.; Businger, S.; Herring, T.; Rocken, C.; Anthes, R.; Ware, R. GPS meteorology’ remote sensing of atmospheric water vapor using the global positioning system. J. Geophys. Res. 1992, 97, 15787–15801. [Google Scholar] [CrossRef]
  34. Thayer, G. An improved equation for the radio refractive index of air. Radio Sci. 1974, 9, 803–807. [Google Scholar] [CrossRef]
  35. Davis, J.L.; Herring, T.A.; Shapiro, I.I.; Rogers, A.E.E.; Elgered, G. Geodesy by radio interferometry: Effects of atmospheric modeling errors on estimates of baseline length. Radio Sci. 1985, 20, 1593–1607. [Google Scholar] [CrossRef]
  36. Saastamioinen, J. Contributions to the theory atmospheric refraction, Part II refraction corrections in satellite Geodesy. Bull. Geo. 1972, 105, 279–298. [Google Scholar] [CrossRef]
  37. Chen, Q.; Song, S.; Heise, S.; Liou, Y.; Zhu, W.; Zhao, J. Assessment of ZTD derived from ECMWF/NCEP data with GPS ZTD over China. GPS Solut. 2011, 15, 415–425. [Google Scholar] [CrossRef]
  38. Pavlis, N.K.; Holmes, S.A.; Kenyon, S.C.; Factor, J.K. The development and evaluation of the Earth Gravitational Model 2008 (EGM2008). J. Geophys. Res. 2012, 117. [Google Scholar] [CrossRef] [Green Version]
  39. Huang, L.K.; Guo, L.J.; Liu, L.L.; Chen, H.; Chen, J.; Xie, S.F. Evaluation of the ZWD/ZTD values derived from MERRA-2 global reanalysis products using GNSS observations and radiosonde data. Sensors 2020, 20, 6440. [Google Scholar] [CrossRef] [PubMed]
  40. Janssen, V.; Ge, L.; Rizos, C. Tropospheric corrections to SAR interferometry from GPS observations. GPS Solut. 2004, 8, 140–151. [Google Scholar] [CrossRef] [Green Version]
  41. Huang, L.; Mo, Z.; Liu, L.; Zeng, Z.; Chen, J.; Xiong, S.; He, H. Evaluation of hourly PWV products derived from ERA5 and MERRA-2 over the Tibetan Plateau using ground based GNSS observations by two enhanced models. Earth Space Sci. 2021, 8, e2020EA001516. [Google Scholar] [CrossRef]
  42. Yao, Y.; Xu, X.; Xu, C.; Peng, W.; Wan, Y. GGOS tropospheric delay forecast product performance evaluation and its application in real-time PPP. J. Atmos. Sol. Terr. Phys. 2018, 175, 1–17. [Google Scholar] [CrossRef]
  43. Nikolaidou, T.; Balidakis, K.; Nievinski, F.G.; Santos, M.C.; Schuh, H. Impact of different NWM-derived mapping functions on VLBI and GPS analysis. Earth Planets Space 2018, 70, 1–16. [Google Scholar] [CrossRef] [Green Version]
  44. Yao, Y.; Sun, Z.; Xu, C. Establishment and Evaluation of a New Meteorological Observation-Based Grid Model for Estimating Zenith Wet Delay in Ground-Based Global Navigation Satellite System (GNSS). Remote Sens. 2018, 10, 1718. [Google Scholar] [CrossRef] [Green Version]
  45. Zhang, H.; Yuan, Y.; Li, W.; Ou, J.; Li, Y.; Zhang, B. GPS PPP-derived precipitable water vapor retrieval based on Tm/Ps from multiple sources of meteorological data sets in china. J. Geophys. Res. 2017, 122, 4165–4183. [Google Scholar] [CrossRef]
  46. Zhai, P.; Eskridge, R.E. Atmospheric water vapor over China. J. Clim. 1997, 10, 2643–2652. [Google Scholar] [CrossRef]
  47. Tang, C.; Li, X.; Li, J.; Dai, C.; Deng, L.; Wei, H. Distribution and trends of the cold-point troposphere over China from 1979 to 2014 based on radiosonde dataset. Atmos. Res. 2017, 193, 1–9. [Google Scholar] [CrossRef]
Figure 1. Distribution of global radiosonde and GNSS stations.
Remotesensing 13 03008 g001
Figure 2. (a) Bias and (b) RMS of MERRA-2 ZTD from pressure- and surface-level data compared to GNSS ZTD at 290 stations from 2016 to 2017.
Remotesensing 13 03008 g002
Figure 3. (a) Bias and (b) RMS of ERA5 ZTD from pressure- and surface-level data compared to GNSS ZTD at 290 stations from 2016 to 2017.
Remotesensing 13 03008 g003
Figure 4. (ah) Time series of MERRA-2 and ERA5 pressure-level ZTD bias in 8 GNSS stations.
Remotesensing 13 03008 g004
Figure 5. (ah) Time series of MERRA-2 and ERA5 pressure-level ZTD RMS in 8 GNSS stations.
Remotesensing 13 03008 g005
Figure 6. Variations with latitude of the annual average (a) bias and (b) RMS of ERA5 and MERRA-2 pressure-level ZTD with respect to GNSS ZTD over the globe from 2016 to 2017.
Remotesensing 13 03008 g006
Figure 7. Distributions of the annual mean (a,c) bias and (b,d) RMS values of the ZTD derived from ERA5 and MERRA-2 pressure-level data compared to the GNSS ZTD from 2016 to 2017.
Remotesensing 13 03008 g007
Figure 8. Variations in altitude of the annual average (a) bias and (b) RMS of ERA5 and MERRA-2 pressure-level ZTD with respect to GNSS ZTD over the globe from 2016 to 2017.
Remotesensing 13 03008 g008
Figure 9. (ac) RMS of ZHD, ZWD, and Tm from ERA5 and MERRA-2 pressure-level data from 545 stations validated by radiosonde data from 2016 to 2017.
Remotesensing 13 03008 g009
Figure 10. Variations with latitudes of the annual average (a,c,e) bias and (b,d,f) RMS values of ZHD, ZWD, and Tm.
Remotesensing 13 03008 g010
Figure 11. Distributions of the (a,c) bias and (b,d) RMS of the ZHD values calculated from ERA5 and MERRA-2 pressure-level data with respect to the radiosonde ZHD from 2016 to 2017.
Remotesensing 13 03008 g011
Figure 12. Distributions of the (a,c) bias and (b,d) RMS of the ZWD values calculated from ERA5 and MERRA-2 pressure-level data with respect to the radiosonde ZWD from 2016 to 2017.
Remotesensing 13 03008 g012
Figure 13. Distributions of the (a,c) bias and (b,d) RMS of Tm values calculated from ERA5 and MERRA-2 pressure-level data with respect to the radiosonde Tm from 2016 to 2017.
Remotesensing 13 03008 g013
Figure 14. Variations with altitudes of the annual mean (ac) bias values of ZHD, ZWD, and Tm over the globe from 2016 to 2017.
Remotesensing 13 03008 g014
Figure 15. Variations with altitudes of the annual mean (ac) RMS values of ZHD, ZWD, and Tm over the globe from 2016 to 2017.
Remotesensing 13 03008 g015
Table 1. Statistics on the bias and RMS for ERA5 and MERRA-2 ZTD from surface- and pressure-level data compared to GNSS ZTD from 2016 to 2017.
MERRA-2ERA5
Pressure-ZTDSurface-ZTDPressure-ZTDSurface-ZTD
bias
(mm)
RMS
(mm)
bias
(mm)
RMS
(mm)
bias
(mm)
RMS
(mm)
bias
(mm)
RMS
(mm)
Mean4.513.1−4.827.92.310.93.831.6
Minimum−12.84.0−72.810.5−15.83.9−59.814.6
Maximum23.425.145.875.021.324.259.865.1
Table 2. Average ZTD bias and RMS for MERRA-2 and ERA5 pressure-level data in different seasons.
Northern HemisphereSouthern Hemisphere
MERRA-2ERA5MERRA-2ERA5
bias
(mm)
(cm)
RMS
(mm)
bias
(mm)
RMS
(mm)
bias
(mm)
RMS
(mm)
bias
(mm)
RMS
(mm)
Spring5.112.32.29.72.514.40.312.1
Summer8.016.43.213.12.712.20.910.8
Autumn4.912.43.110.41.513.3011.3
Winter2.89.62.88.52.016.1013.1
Table 3. Details of 8 GNSS stations.
GNSS StationLatitude/°Longitude/°Altitude/mSpecial Features
thu276.54N68.82W36.1-
shao31.1N121.2E22.1along the coastline
lhaz29.66N91.1E3622high altitude
cnmr15.23N145.74E64.4equatorial region
samo13.85S171.7W76.9equatorial region
mgue35.78S69.4W1554.2high altitude and near the coastline
wgtn41.32S174.81E26.1along the coastline
maw167.6S62.87E59.2-
Table 4. Statistical results of ZHD, ZWD, and Tm derived from MERRA-2 and ERA5 pressure-level data tested by radiosonde data.
MERRA-2ERA5
biasRMSbiasRMS
ZHD
(mm)
Mean0.54.41.14.5
Minimum−25.11.1−26.31.1
Maximum31.531.531.231.2
ZWD
(mm)
Mean4.813.61.710.5
Minimum−20.60.5−22.70.4
Maximum25.834.726.642.3
Tm
(K)
Mean−0.081.170.141.03
Minimum−2.250.50−1.650.32
Maximum2.403.042.473.17
Table 5. Average bias and RMS of ZHD, ZWD, and Tm for MERRA-2 and ERA5 pressure-level data in different seasons.
Northern HemisphereSouthern Hemisphere
MERRA-2ERA5MERRA-2ERA5
biasRMSbiasRMSbiasRMSbiasRMS
ZHD
(mm)
Spring1.14.51.64.6−2.15.1−1.24.6
Summer0.74.11.34.3−2.15.3−1.14.7
Autumn1.04.51.74.7−2.45.2−1.44.7
Winter1.24.11.94.3−2.35.0−1.54.6
ZWD
(mm)
Spring4.512.61.79.98.317.12.911.2
Summer8.819.12.914.87.414.62.79.7
Autumn3.312.51.110.38.816.64.411.1
Winter0.78.00.36.69.218.84.012.3
Tm
(K)
Spring0.071.310.21.19−0.580.95−0.210.62
Summer−0.221.180.091.05−0.621.01−0.30.7
Autumn−0.031.170.211.06−0.560.99−0.190.67
Winter0.171.180.281.09−0.520.95−0.090.64
Publisher’s Note: MDPI stays neutral with regard to jurisdictional claims in published maps and institutional affiliations.

