Article

A Climatological Assessment of Intense Desert Dust Episodes over the Broader Mediterranean Basin Based on Satellite Data

by
Maria Gavrouzou
1,
Nikolaos Hatzianastassiou
1,*,
Antonis Gkikas
2,
Christos J. Lolis
1 and
Nikolaos Mihalopoulos
3,4
1
Laboratory of Meteorology, Department of Physics, University of Ioannina, 45110 Ioannina, Greece
2
Institute for Astronomy, Astrophysics, Space Applications and Remote Sensing (IAASARS), National Observatory of Athens, 15236 Athens, Greece
3
Institute for Environmental Research and Sustainable Development (IERSD), NOA, 15236 Athens, Greece
4
Environmental Chemical Processes Laboratory, Department of Chemistry, University of Crete, 70013 Heraklion, Greece
*
Author to whom correspondence should be addressed.
Remote Sens. 2021, 13(15), 2895; https://doi.org/10.3390/rs13152895
Submission received: 9 June 2021 / Revised: 8 July 2021 / Accepted: 16 July 2021 / Published: 23 July 2021

Abstract

:
A satellite algorithm able to identify Dust Aerosols (DA) is applied for a climatological investigation of Dust Aerosol Episodes (DAEs) over the greater Mediterranean Basin (MB), one of the most climatologically sensitive regions of the globe. The algorithm first distinguishes DA among other aerosol types (such as Sea Salt and Biomass Burning) by applying threshold values on key aerosol optical properties describing their loading, size and absorptivity, namely Aerosol Optical Depth (AOD), Aerosol Index (AI) and Ångström Exponent (α). The algorithm operates on a daily and 1° × 1° geographical cell basis over the 15-year period 2005–2019. Daily gridded spectral AOD data are taken from Moderate Resolution Imaging Spectroradiometer (MODIS) Aqua Collection 6.1, and are used to calculate the α data, which are then introduced into the algorithm, while AI data are obtained by the Ozone Monitoring Instrument (OMI) -Aura- Near-UV aerosol product OMAERUV dataset. The algorithm determines the occurrence of Dust Aerosol Episode Days (DAEDs), whenever high loads of DA (higher than their climatological mean value plus two/four standard deviations for strong/extreme DAEDs) exist over extended areas (more than 30 pixels or 300,000 km2). The identified DAEDs are finally grouped into Dust Aerosol Episode Cases (DAECs), consisting of at least one DAED. According to the algorithm results, 166 (116 strong and 50 extreme) DAEDs occurred over the MB during the study period. DAEDs are observed mostly in spring (47%) and summer (38%), with strong DAEDs occurring primarily in spring and summer and extreme ones in spring. Decreasing, but not statistically significant, trends of the frequency, spatial extent and intensity of DAECs are revealed. Moreover, a total number of 98 DAECs was found, primarily in spring (46 DAECs) and secondarily in summer (36 DAECs). The seasonal distribution of the frequency of DAECs varies geographically, being highest in early spring over the eastern Mediterranean, in late spring over the central Mediterranean and in summer over the western MB.

1. Introduction

Desert Dust (DD) particles are mainly natural coarse mode aerosols emitted from the global deserts, especially the biggest ones, namely Sahara, Middle East and the Asian deserts. Due to their considerable absorbing ability of solar, but also terrestrial, radiation, they cause local heating, thus modifying the atmospheric temperature profile and affecting the radiative and energy budgets [1,2,3]. Dust aerosols (DA) also have various environmental implications. For example, mineral DA, emitted through wind erosion, affect the radiative budget of the planet, cloud formation and precipitation patterns, biogeochemical cycles, the chemistry of the atmosphere, air pollution and human health. Besides, mineral DA containing iron can impact the marine biological productivity and ecosystem structure by supplying micronutrients to regions of the ocean where iron scarcity limits primary productivity [4]. Many of these DA implications critically depend on dust iron solubility. Although fresh emitted dust is commonly insoluble, through chemical reactions depending on dust particle and atmospheric chemical composition, it becomes more hygroscopic and is able to act as Cloud Condensation Nuclei (CCN) [5]. It has also been found that DA can act as CCN through water adsorption. According to [6], the consideration of this procedure causes an increase in CCN equal to 40%. On the other hand, hydrophobic DAs are efficient Ice Nuclei (IN) [7]. Mineral dust is the most important natural source of atmospheric IN, which may significantly mediate the properties of ice cloud through heterogeneous nucleation and lead to crucial impacts on the hydrological and energy cycle [8].
Dust radiation and cloud interactions are expected to be stronger in cases of higher dust loads, namely dust aerosol episodes (DAEs). For this reason, dust episodic conditions are ideal for investigating dust effects on weather and climate. Although DAs are inserted in the atmosphere over the greatest world deserts, they travel over long distances from their sources, driven by atmospheric circulation [9,10]. The broader Mediterranean Basin (MB) is frequently affected by dust export originating from North Africa and the Middle East and local sources [11,12,13,14]. The frequency and the intensity of this phenomenon depend on the dust sources’ activation [15], the atmospheric circulation patterns [16,17,18,19,20] and the dust deposition mechanisms (either wet, i.e., through precipitation, or dry deposition [21]). The broader Mediterranean Basin is appropriate for investigating DAEs, because of their high frequency, and because MB is one of the most vulnerable regions in the world to the impacts of ongoing climate change associated with global warming [22]. Indeed, the Mediterranean climate is known for its particular regional characteristics: large seasonal contrast for temperature and rainfall, strong wind systems, intense precipitation and cold season frontal depression activity (Mediterranean cyclones) [23]. Because of its relatively small size, its geographical location and its semi-landlocked nature, this basin is very sensitive and responds quickly to atmospheric forcings and/or anthropogenic influences [23]. In addition, MB is a region of special interest related to aerosols, since it is characterized by their emission from various anthropogenic and natural sources, namely fossil fuel combustion, biomass burning, soil (deserts) erosion or marine production, resulting in the coexistence of different aerosol types such as sulfate, sea salt and dust [11,24,25].
Although DAEs over the MB have been investigated during the last decades, most of the studies are focused on specific dust events [26,27,28,29] or they are spatially [19,30,31,32] or temporally [19] limited or they refer to only surface particulate matter [33,34]. Mediterranean DAEs have been investigated on a broad spatial scale, namely over the entire Mediterranean Basin, and over decadal time periods, taking advantage of reliable satellite data used as input in developed satellite algorithms [11,13,35,36]. These studies focused on the determination of DAEs on a pixel-level basis and the creation of relevant climatologies dealing with the spatial and temporal (seasonal and interannual) variability of DAEs. Moreover, the synoptic circulation characteristics favoring the export of dust to the Mediterranean Basin from its neighboring deserts of the Sahara and the Middle East have been studied, under specific conditions of intense DAEs, namely days with extended spatial coverage of dust, the so-called Dust Aerosol Episode Days (DAEDs), and persisting occurrence of DAEs (consecutive days), the so-called Dust Aerosol Episode Cases (DAECs) [20]. In that study, however, the emphasis was given to the prevailing synoptic conditions during DAECs, and not to DAEDs and DAECs themselves. This is the focus of the present study, which aims to analyze and examine in detail the spatial and temporal variability of DAEDs and DAECs over MB, ensuring long-term and complete geographical coverage, also including the neighboring desert dust source areas, which were missed in the previous studies.
In the present study, the spatiotemporal regime of DAEDs over the broader MB is investigated for the 15-year period 2005–2019. This is achieved with an algorithm which, by using contemporary Moderate Resolution Imaging Spectroradiometer (MODIS) and Ozone Monitoring Instrument (OMI) satellite data of key aerosol optical properties, identifies DAEs on a daily basis and on a 1° × 1° pixel level, and subsequently determines the occurrence of strong and extreme DAEDs based on the criterion of large spatial extent (geographical coverage) of DAEs. DAECs, consisting of consecutive DAEDs, are also determined by the satellite algorithm. A detailed investigation of the geographical characteristics as well as of the seasonal and interannual variability of DAEDs and DAECs is made for the first time, using contemporary satellite data with a complete spatial and extended temporal coverage. Thus, additional information is obtained compared to previous studies [11,13,36] that used a similar algorithm and previous versions of satellite data focusing on the geographical and interannual variability of DAEs. Moreover, as described in detail in Section 2, the present study uses improved versions of satellite data, which provide more extended spatial coverage, including the dust source desert areas of North Africa and the Middle East. Furthermore, the 15-year study period enables a robust climatological investigation of intense dust episodes, and the derivation of safe conclusions on their interannual variability. The utilized satellite data, methodology and algorithm are described in Section 2. The results of the algorithm are presented and discussed in Section 3, emphasizing the geographical, seasonal and interannual variability of both DAEDs and DAECs, and finally conclusions are drawn in the last section.

2. Data and Methodology

2.1. MODIS Aqua

MODIS is one of the most widely used instruments for aerosol and cloud remote sensing [37,38] It is a spectroradiometer measuring reflected solar and emitted thermal radiation in 36 spectral channels between 0.415 (VIS) and 14.235 μm (IR) with spatial resolution of 250, 500 and 1000 m and view of the entire Earth’s surface every 1 to 2 days. The measurements of MODIS, which is on board NASA’s Terra (launched on 18 December 1999) and Aqua (launched on 4 May 2002) satellites, are used by different retrieval algorithms in order to derive information for several aerosol and cloud micro- and macro-physical properties over global land and ocean areas, while an additional algorithm (Deep Blue, DB) is used to also cover the highly reflecting desert areas. The MODIS aerosol products have been extensively used [3,11,13,18,39,40,41,42] and evaluated [43,44,45] against ground-based measurements from AERONET network stations. Since the release of the first MODIS dataset, more than fifteen years ago, several new improved collections followed. In the present study, the level 3 aerosol product from the latest MODIS Collection (C6.1) is used. In this new product, some improvements were made, which mainly refer to surface reflectance and heavy smoke detection [46,47], leading to better agreement with AERONET measurements as well as to increased spatial coverage compared to the previous and already improved C6.0 Collection. The values of correlation coefficient (R) between the daily level-2 MODIS C6.1 and AERONET, being dependent on the surface type and the used product, vary between 0.65 and 0.97 for Dark Target (DT) and between 0.60 and 0.97 for DB products [48]. Retrievals with low R values are avoided in this study by using the appropriate product for each area. More specifically, DB is used over arid, semi-arid and urban regions, while DT is used over oceanic regions. The MODIS Aqua satellite ((1:30 p.m. UTC) equatorial crossing time) product is preferred to its twin Terra ((10:30 a.m. UTC) equatorial crossing time) product in this study, in order to ensure a temporal overlap with the Aura satellite (1:45 p.m. equatorial crossing time) whose products are also used by the satellite algorithm.

2.2. OMI Aura

OMI is a high-resolution spectrometer onboard the sun-synchronous EOS-Aura satellite, launched on July 15, 2004 (1:45 p.m. equator crossing time, ascending mode). OMI is the successor instrument of NASA’s Total Ozone Mapping Spectrometer (TOMS) and measures the upwelling radiation at the top of the atmosphere in ultraviolet (UV, 270–380 nm) and visible (VIS, 350–500 nm) regions. The advantage of OMI is the near-UV technique used for aerosol characterization, which works well under all surfaces (except for ice- and snow-covered ones). For this reason, it has been extensively used for aerosol detection and characterization, as well as for aerosol radiative effect estimations [49]. Three different algorithms are used for deriving OMI products: the near UV Aerosol Algorithm (OMAERUV, [50]), which takes measurements in 354 and 388 nm and provides information on the UV Aerosol Index, as well as the aerosol extinction and absorption optical depth in 388 nm, the Multiwavelength Aerosol Algorithm (OMAERO, [51,52,53]), which is used to derive aerosol characteristics from reflectance measurements in 20 channels in the range between 331 and 500 nm and the Surface UV Algorithm (OMUVB, [54,55,56]), which provides information about the erythemally weighted daily dose, as well as spectral irradiancies [57]. Here, daily level-3 UV Aerosol Index (AI) data from the OMAERUV algorithm, covering the period 2005–2019, are derived and used for the identification of dust aerosols.

2.3. The Algorithm

In the present study, a satellite algorithm using aerosol optical properties is developed and applied for the identification of DAEs. The algorithm, which operates on a daily basis, as shown in the flowchart of Figure 1, is a modified version of the algorithm used in previous works [20,36], which utilized MODIS Collection 5.1 products. There are substantial differences in the satellite algorithm as well as in the utilized data. First, only two aerosol optical properties (α and AI), instead of four (Fine Fraction (FF), Effective Radius (reff), α and AI) optical properties used in [20,36], are retained here. Effective Radius is omitted because it is not available in the latest C6.1 MODIS Aerosol Product. On the other hand, FF is not used, because it is calculated from MODIS Aerosol Optical Depth (AOD) and a specific MODIS product (“Aerosol_Optical_Depth_Small_Ocean”), which refers to the Optical Depth of fine mode aerosols and is available only over oceans. Moreover, a stricter (lower) α threshold value was used in the present algorithm (0.4 instead of 0.7 used in [20]). This was decided after several algorithm sensitivity tests on a global scale, which indicated a more appropriate identification of dust aerosols by the algorithm using the stricter threshold [49]. In addition, the 0.4 threshold AI value is indicative of the presence of Saharan dust, according to previous studies based on ground measurements [28,58]. Another difference between the present and previous algorithm used in [18] is that here MODIS Aqua data are used instead of Terra data. As also reported in Section 2.1, the Aqua satellite data were preferred here over the Terra ones in order to ensure a close temporal overlap with the OMI Aura satellite products. Furthermore, another significant difference between the present study and the studies [13,20] is that here the latest released and improved collections of both MODIS and OMI products (Section 2.1 and Section 2.2) are used for the identification of DAEs and DAEDs on a climatological basis (15-year period 2005–2019) over the broader Mediterranean Basin. In particular, it should be noted that the latest MODIS C6.1 product, thanks to the new DB algorithm, provides information over strongly reflecting areas, such as the North Africa and Middle East deserts, which are the main dust export sources, and are covered in the present study, opposite to the previous studies that utilized MODIS C5.1 data [20,36]. Finally, one more advantage of the present study is the extended (relative to the previous studies) 15-year study period (2005–2019).
The algorithm operates on a daily and 1° × 1° pixel level basis. First, using spectral MODIS AOD data, the algorithm computes α values (at the wavelength pairs of 470–660 nm over land and 470–2130 nm over ocean, using the smallest and longest available wavelengths), which is a critical parameter to ensure the existence and predominance of the coarse DA in the atmosphere. Subsequently, the algorithm identifies the presence of DA on a specific day and over a specific area (pixel) whenever α ≤ 0.4 and AI ≥ 1, i.e., absorbing coarse dust aerosols predominate. In the next step, the algorithm estimates the occurrence of Dust Aerosol Episodes (DAEs) by applying specific thresholds to AOD values, in order to ensure the existence of high dust loadings. Specifically, the algorithm identifies the occurrence of strong and extreme DAEs whenever AODmean + 2STDV ≤ AOD ≤ AODmean + 4STDV and AOD ≥ AODmean + 4STDV, respectively, where AODmean is the mean AOD value, for each 1° × 1° pixel of the study area, averaged over the entire study period (2005–2019) and STDV is the associated standard deviation. As the present study deals with spatially extended dust episodes, an additional requirement is set. Thus, a specific day is characterized as DAED if at least 30 dust episodic pixels (with strong or extreme DAEs) are detected over the broader Mediterranean Basin. In other words, during DAEDs, extended areas of the MB with surfaces equal to at least 10,000 km2 are undergoing strong or extreme dust episodes. For these days (DAEDs) the algorithm outputs the distributions of AODs, which are essentially dust optical depths (DODs), over the study area (greater MB, Figure 2).
It is known that, depending on the prevailing synoptic conditions [20], such dust episodes may last for more than a day. Thus, in a final step, the identified DAEDs by the algorithm are grouped into DAECs, which are series of n (n ≥ 1) sequent days with extended dust episodes DAEDs over the Mediterranean. The geographical and temporal (seasonal and interannual) variability of strong and extreme DAECs over MB is also examined in detail in the present study, on a climatological basis, as it has never been examined before.
The frequency of occurrence, the spatial extent and the intensity of intense Mediterranean dust episodes vary with time. Therefore, the present analysis emphasizes the interannual variation of these characteristics of DAEDs. Moreover, the study area is divided into three sub-regions (East–Central––West Mediterranean, Figure 2) in order to study regional characteristics of DAEDs. It is noted that each DAED is considered to occur over one of the above sub-regions if more than 60% of the associated episodic pixels lie in the specific sub-region. When the episode is spread over more than one sub-region, then this DAED is excluded from this sub-regional analysis. The geographical limits of the three sub-regions are displayed in Figure 2 (red lines).

3. Results and Discussion

3.1. Climatology of DAED

Table 1 displays an overview of the total number (absolute frequency) of DAEDs over the 15-year period 2005–2019. In total, 166 DAEDs (strong and extreme) took place over the MB, yielding an average annual frequency of 11.1 DAEDs/year. Most of them occurred in spring (48.2%) and summer (37.3%), while fewer occurred in winter (9.1%) and autumn (only nine DAEDs, or 5.4%). In total, 116 out of the 166 DAEDs, i.e., 69.9% of them, were strong, and 50 (30.1%) were extreme. The frequency of strong DAEDs follows the same seasonality with that of all DAEDs, with relative percent frequencies equal to 4.3, 44.8, 46.5 and 5.4% for winter, spring, summer and autumn, respectively. On the other hand, extreme Mediterranean DAEDs have a different seasonality, being more frequent in spring (56%, 28 DAEDs) and less frequent in winter (20%, 10 DAEDs). The absolute and relative percent frequencies of the determined DAEDs in the present study are smaller than the corresponding numbers reported in [20] (255 DAEDs or 18.2 DAEDs/year). This is attributed to the differences mentioned in Section 2.3, and mainly to the stricter α threshold applied in the present study. Indeed, according to the results obtained from an algorithm’s sensitivity test for the indicative year 2007, the increase of α threshold from 0.4 to 0.7 resulted in an increase of the total number of DAEDs from 5 to 17. More specifically, strong DAEDs increased from 3 to 14, and extreme ones from 2 to 3. The seasonality of DAEDs unveiled by the current analysis is connected with dust production (e.g., Sharav cyclones) [59], transport [16,60] and removal mechanisms (e.g., wet deposition/precipitation [61]). The seasonal characteristics of DAEDs are further discussed, in conjunction with their spatial characteristics, later in this section.
The overall absolute frequency of occurrence and intensity (by means of DOD) of strong and extreme DAEDs that took place over the broader MB during the period 2005–2019 is given in Figure 3a–d, respectively, for both strong (Figure 3a,c) and extreme (Figure 3b,d) DAEDs. White areas indicate locations over which no DAEDs occurred from 2005 to 2019. The results are given on a pixel level, enabling a detailed assessment of the examined DAEDs’ characteristics. It should be noted that the results shown in Figure 3 provide information about the occurrence of dust episodes over an area (pixel) during DAEDs, i.e., during the occurrence of spatially extended Mediterranean dust episodes, covering areas of at least 300,000 km2. Of course, local dust episodes (DAEs) may also occur in other days, in cases of less widespread Mediterranean dust episodes, but these are not taken into account in our results.
Strong DAEDs occurred over the Mediterranean Basin with an absolute frequency (at pixel level) ranging from 1 DAED or 0.07 DAEDs/year (deep blue colors) over the northern and eastern parts of MB up to 34 DAEDs or 2.27 DAEDs/year (deep red colors) over Northwestern Africa (Figure 3a). In general, according to the algorithm results, strong DAEDs are more frequent over the western and central parts of the basin, including the Northern African desert areas, while they are quite rare over the northern (Southern Europe) and eastern parts of MB, with the exception of the Middle East, which hosts desert areas, where they occurred from 5 up to 10 times (or from 0.33 up to 0.67 times/year). These results cannot be directly compared to the ones obtained with a previous version of the satellite algorithm [13,36], because in these studies the overall frequency of DAEs (and not DAEDs) has been computed. This explains the higher frequencies (up to 3.5 episodes/year) reported in the previous studies. Both similarities and dissimilarities exist between the present and previous study results in terms of geographical patterns. Thus, a northward decreasing gradient of frequencies is found either in this or the previous studies. On the contrary, the eastward decreasing gradient of frequencies observed in this study does not exist in [36] (their Figure 6i-b). Moreover, the complete coverage of North Africa in the present study does not exist in [36]. Extreme DAEDs are less frequent than strong ones over MB, with a total number of occurrences varying from 1 to 11 DAEDs (or 0.07 to 0.73 episodes/year, reddish colors in Figure 3b). The maximum frequencies of extreme DAEDs are observed over the central MB, while there is again (as also observed for strong DAEDs) a northward decreasing gradient of the DAEDs frequencies. Moreover, in this case, i.e., for extreme DAEDs, the geographical patterns are different from those presented in [36], where no distinct longitudinal gradient was found (their Figure 6ii-b).
The mean intensity, by means of averaged DOD values for the strong and extreme DAEDs, is presented in Figure 3c,d, respectively. During strong DAEDs, the DOD values vary from ≈0.33 up to ≈1.77 (Figure 3c), being in general agreement with the corresponding values appearing in Figure 7i-b of [36]. The lowest DODs are observed over the northern parts of the basin (Southern Europe), as expected, since the Mediterranean dust sources are located in the southernmost parts of MB, namely North Africa and the Middle East. Nevertheless, it is worth noticing that the maximum DOD values are not observed over Northern Africa, as may be expected, but over the maritime areas off the African coasts of Tunisia, Libya and Egypt. This can be attributed to the pathways of Sharav cyclones, which are mainly responsible for African dust transport over the MB. These cyclones are formed in the lee of the Atlas Mountains and move eastwards, generally along the northern coasts of North Africa [59]. Another explanation for the occurrence of the maximum DOD values over the maritime areas off the African coasts of Tunisia, Libya and Egypt can be the utilized AOD threshold values in the algorithm for the determination of strong and extreme dust episodes. These thresholds, which are plotted in Figure S1c,d, respectively, as explained in Section 2.3, are derived from the 2005–2019 mean AODs and the associated standard deviations, which are shown in Figure S1a,b, respectively. As shown in Figure S1a,b, the AOD thresholds are maximum over the coastal marine areas of the southeastern Mediterranean Sea, where the maximum DODs during DAEDs are also observed (Figure 3c). Moreover, as also shown in Figure S1c,d, this is, in turn, not attributed to high mean AODs, but to high STDVs over these maritime areas (reddish colors, Figure S1b). These high STDVs can be attributed to the fact that AOD values over the specific maritime areas are in general low in the absence of dust episodes, while they sharply increase under dust export conditions. On the contrary, the STDVs are quite lower south of the North African coastal areas (bluish colors, Figure S1b), where the mean AODs are quite higher (Figure S1a), because the high episodic AOD values of exported dust do not significantly surpass the already high AOD values over these desert areas. The mean DOD values of extreme DAEDs (Figure 3d) vary from 0.5 up to ≈5. Maximum DAEDs are found primarily over the eastern Mediterranean Sea, reaching as far north as southern Greece, but also over the Black Sea. However, it should be noted that the maximum DOD values over the Black Sea are associated with a unique DAED (during the 15-year study period). It is interesting to note, again, the remarkable contrast between the low continental and high maritime DODs (as was the case for strong DAEDs). Nevertheless, in this case, the maximum DODs (reddish areas) further extend to the north, far from the African coasts, which is not observed for strong DAEDs. Moreover, this northward extension of maximum AODs is not attributed to very high STDVs, as was the case for the coastal maritime areas (Figure S1d). It is noted that this northward extension of maximum DODs is not found in the results presented in [36], while, on the contrary, maximum values are also found in that study over the Black Sea (Figure 7ii-b of [36]).
The geographical distribution of the total number of strong (left panels) and extreme (right panels) DAEDs that took place over the broader MB from 2005 to 2019 in each season is given in Figure 4. For an easy comparison of the seasonal frequencies, identical colorbar scales are used in the graphs. It is clearly shown that spring and summer are the seasons with the highest frequencies of strong DAEDs (up to 20), opposite to autumn and winter, when only up to 2–3 strong DAEDs occurred. The results for extreme DAEDs reveal a different seasonality, with maximum frequencies only in spring (up to 8 DAEDs), lower frequencies in winter and summer (up to 2–3 DAEDs) and even fewer DAEDs in autumn (less than 2). The geographical patterns of strong DAEDs do not show remarkable difference among seasons, exhibiting the highest frequencies over the western part of North Africa and the easternmost part of MB (Middle East) in spring and summer, against very small frequencies (bluish colors) over the central and easternmost parts of the basin in winter and autumn. On the contrary, different spatial patterns are found for extreme DAEDs. The highest frequencies of extreme DAEDs are observed over the eastern and central MB in winter and especially in spring, while in summer and autumn the—clearly smaller—maximum frequencies shift to the western MB (mostly over western North Africa). This longitudinal shift of DAEDs with the course of seasons is attributed to the prevailing atmospheric conditions. This is shown in Figures S2 and S3, where, as an example, the atmospheric circulation, i.e., the geopotential height and the wind vectors and the associated dust export during two DAECs that took place over MB in spring and summer are shown.
The geographical distribution of the intensity, in terms of DOD, of strong (left) and extreme (right) DAEDs that took place over the broader MB from 2005 to 2019 in each season (Figure S5) reveals that the climatological geographical patterns are driven by specific seasons’ characteristics. Thus, the location of 15-year annual maximum DODs (Figure 3c,d), either for strong or extreme DAEDs, is the same as the location of winter and spring maxima (up to 1.65), namely over the southernmost areas of the central Mediterranean Sea, off the African coasts of Tunisia, Libya and Egypt for strong DAEDs, and over the eastern Mediterranean Sea for extreme DAEDs. Similarly, the minimum annual DODs (bluish areas) are mainly determined by the minimum DODs of spring and summer both for strong and extreme DAEDs. As for the seasonality of the intensity of strong and extreme DAEDs, it is shown that higher DODs are observed in winter and spring, up to 1.62 and 1.77 for strong and up to 5.00 and 4.96 for extreme DAEDs, respectively, than in summer and autumn (up to 1.30 and 1.33 for strong and up to 3.63 and 4.83 for extreme DAEDs, respectively).
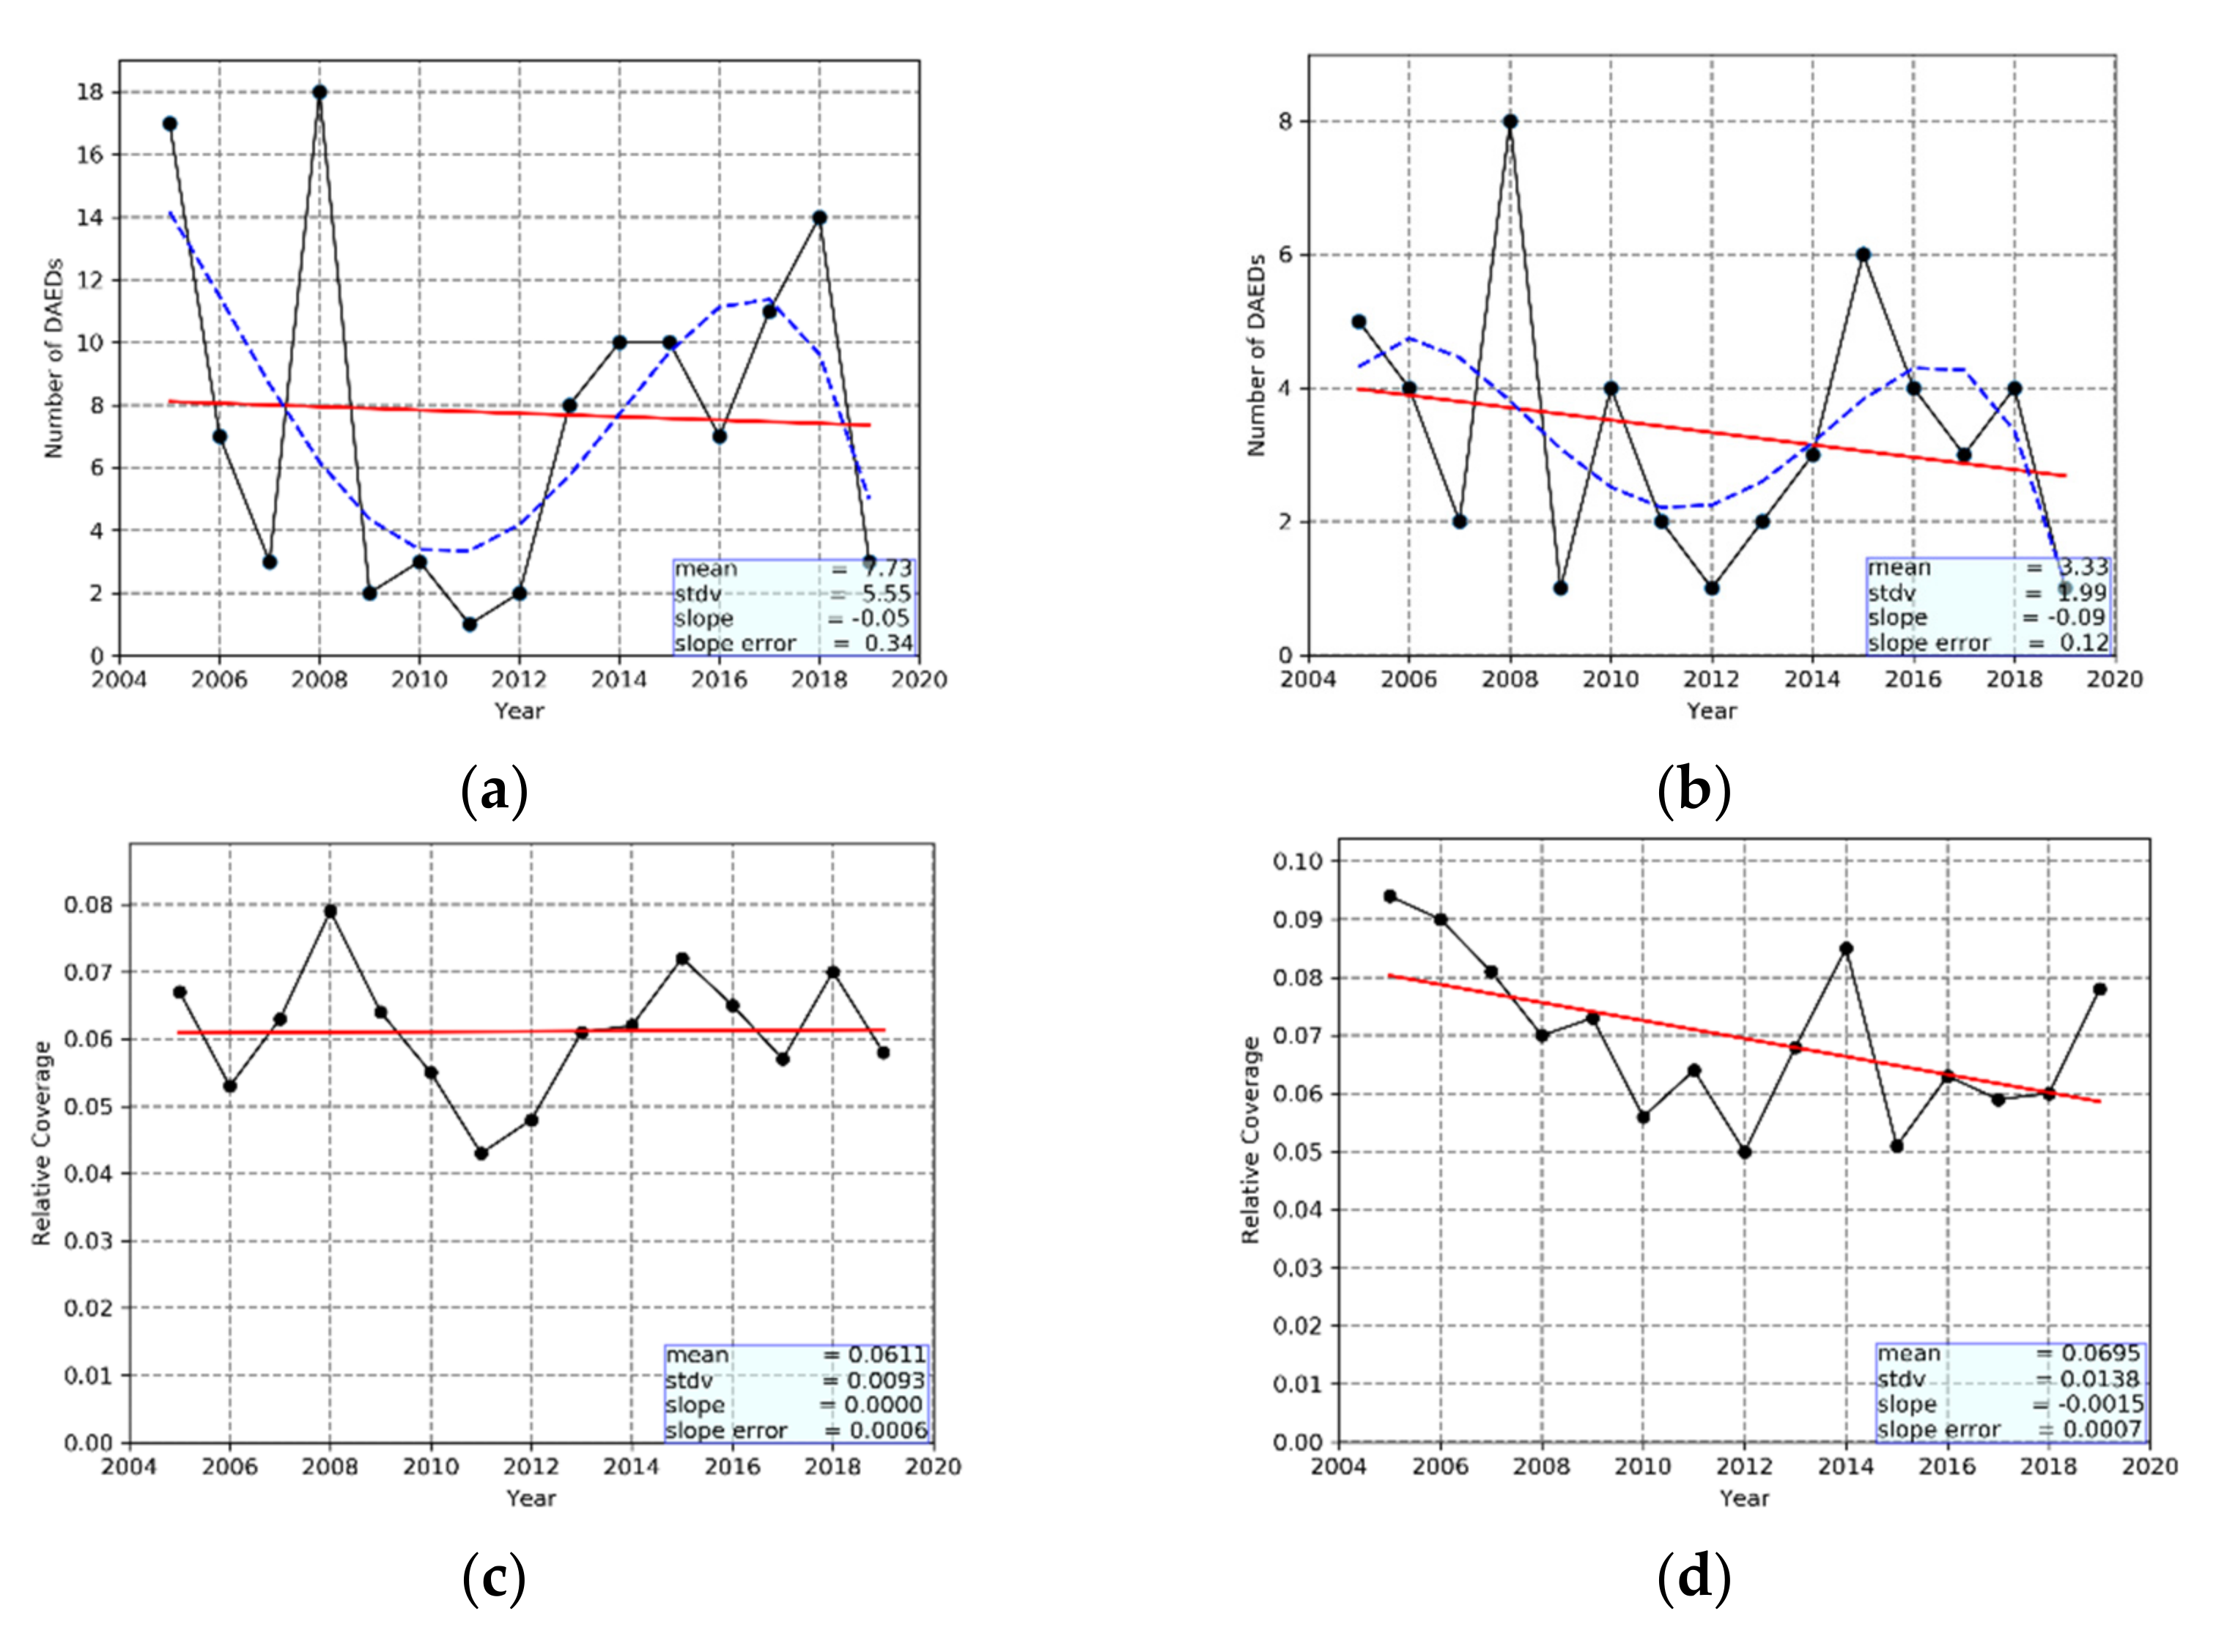
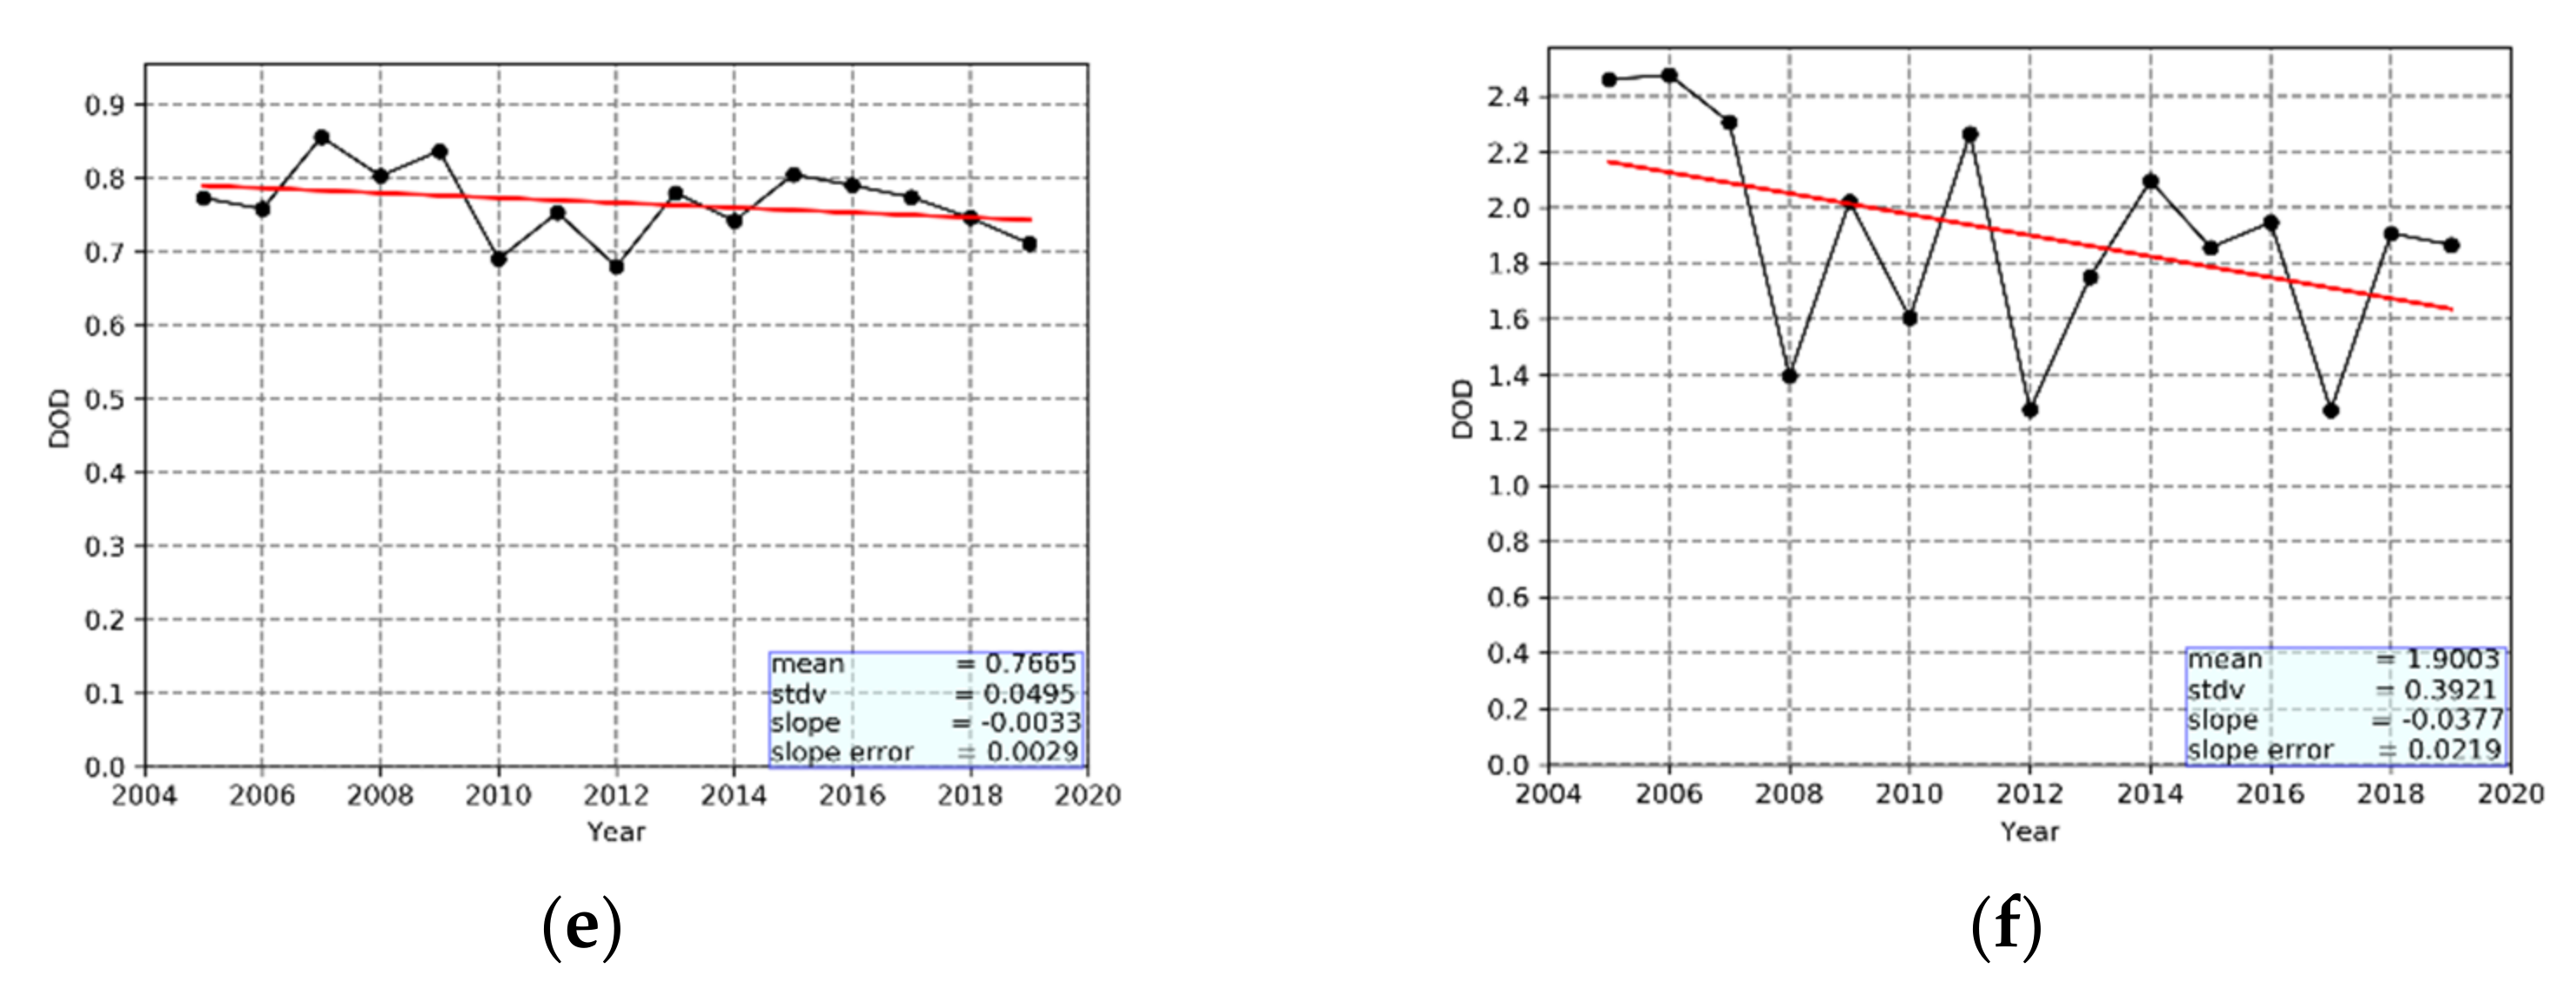
The interannual variations and trends (red lines) of various characteristics of strong and extreme Mediterranean DAEDs that took place during the 15-year period 2005–2019 are presented in Figure 5. Specifically, the number of DAEDs, the percent spatial coverage of the study area by dust episodic pixels and the average DOD of episodic pixels are reported per year both for strong (left panels) and extreme (right panels) DAEDs. Such interannual variabilities can be important in a two-way relation to the ongoing climate change, i.e., in terms of possible effects of climate change on dust episodes, and also possible implications of changing dust episodes for climate. Both strong and extreme DAEDs exhibit a large year by year variability, ranging from 1 to 18 (strong) and 1 to 8 (extreme) DAEDs, accompanied by slight, but not statistically significant, decreasing trends, a little stronger for extreme DAEDs (Figure 5a,b). As revealed in Figure S4, where the corresponding interannual variation of strong and extreme DAEDs is given per season, this overall decrease arises from a decrease in winter and spring. The applied 4th order polynomial fit (found to ideally represent the interannual variability) to the time series (blue dashed lines) reveals a lower frequency variability, which is characterized by decreasing tendencies in the 2000s followed by increasing tendencies in the 2010s. In general, there is some covariability of strong and extreme DAEDs, with common years having high (2005, 2008) and low (2007, 2009, 2011, 2012, 2019) frequencies of strong and extreme DAEDs. These maxima/minima can be connected with corresponding minima/maxima in precipitation over the study area, according to the data derived from the Global Precipitation Climatology Project [62].
The interannual variability of the spatial extent of DAEDs, which is also important from a climatological perspective, is shown in terms of the percent coverage of the study area by episodic dusty pixels per year, in Figure 5c,d. It is found that the spatial extent of strong DAEDs considerably covaries with their frequency. For example, common peaks exist for the years 2005, 2008 and 2018, whereas minima in both parameters are found in 2011 and 2019 (Figure 5a,c). This is not strange since the spatial extent of DAEDs is partly determined by their number. However, this is not valid for extreme DAEDs, as there are years with high numbers of extreme DAEDs, like 2008 and 2015 (Figure 5b), which are not marked by a large spatial extent (Figure 5d). This proves that the overall annual spatial extent of DAEDs is also dependent on other than frequency parameters, for example, the spatial coverage of individual occurring DAEDs. In general, about 4–8% of the study area was covered by strong DAEDs during the period 2005–2019, while the corresponding percentage for extreme DAEDs was slightly larger, 5.0–9.5%. Moreover, the algorithm results show that the spatial coverage of strong DAEDs has not changed for MB during the studied period, while the coverage of extreme DAEDs has decreased (statistically significant trend based on the computed slope error).
Another examined property of Mediterranean DAEDs is their intensity. This is assessed in terms of the computed average DOD values for the episodic pixels for every year, and results are given separately for strong and extreme DAEDs in Figure 5e,f, respectively. According to the algorithm, Mediterranean areas that underwent strong DAEDs during the period 2005–2019 have been characterized by DODs ranging from 0.68 to 0.86, yielding a mean 15-year value of 0.77. The intensity of extreme DAEDs is significantly stronger, with DOD values varying between 1.27 and 2.46, with a mean long-term DOD equal to 1.9. Comparing the year-by-year variability of the DAEDs’ intensity (Figure 5e,f) with the corresponding variability of their frequency and spatial extent (Figure 5a,b,c,d, respectively), it is clear that there is no covariability between the above parameters. This is not strange, since the intensity of DAEDs is not driven by the same factors that determine their frequency and spatial coverage. Thus, dust loadings, and hence DOD, depend on the strength of dust uplift over the source areas (desert areas), which in turn depends on parameters like wind or soil erodibility. On the other hand, the spatial extent depends on the prevailing synoptic conditions or deposition mechanisms like precipitation or sedimentation, which depend on their own on particle size. According to the algorithm results, the intensity of strong DAEDs over the MB has slightly decreased (by 0.045 or 6%) from 2005 to 2019, while the intensity of extreme DAEDs has drastically decreased, by 0.57 (or 30%). This decrease is statistically significant based on the computed slope error value, but not based on the applied Mann–Kendall test (at 95% confidence level).

3.2. DAECs Climatology

In this section, the spatiotemporal variability of DAECs, which consist of a sequence of n (n ≥ 1) DAEDs (Section 2.3), is discussed. It is to be noticed that the total number of DAECs over MB is equal to 98, and hence the reported absolute numbers are practically equivalent to percent numbers. Their seasonality, in terms of absolute frequency of occurrence, with respect to their duration (number of days), is shown in Figure 6. The results are given for the entire MB (Figure 6a), as well as for its sub-domains, i.e., the western, the central and the eastern ΜΒ (Figure 6b–d). Most of the Mediterranean DAECs take place primarily in spring (14–17 DAECs, maximum in May) and secondarily in summer (10–14 DAECs). On the contrary, the occurrence of DAECs in the other seasons is very scarce, with a few (1–7) DAECs in September, October, January and February and no DAECs at all in November and December. The Mediterranean DAECs last for 1–7 days. Most of them, i.e., 64 DAECs (or 65.3% of the total number), last for one day, while the corresponding numbers for DAECs lasting for 2, 3, 4, 5, 6 and 7 days are equal to 24 (24.4%), 5 (5.1%), 2 (2%), 1 (1%), 1 (1%) and 1 (1%), respectively. Most of the persisting DAECs, i.e., those lasting for more than 2 days, are observed in spring (47%), while the longest-lasting DAECs (6–7 days) occur in summer and spring (by 1, or 50%). In comparison with the corresponding results of [20], which also computed Mediterranean DAECs for the period 2000–2013 with a previous version of the satellite algorithm (see Section 2.3), there are similarities, but also some differences. For example, the annual cycle of DAECs is the same, with primary spring and secondary summer maximum frequencies in both analyses, accounting for 46.9% (spring) and 36.7% (summer) of total DAECs in the present analysis, against 51.4% and 30.4% in [20]. On the other hand, the overall frequencies of DAECs are smaller in the present study. Thus, the 15-year mean monthly frequencies per year in the present analysis are as high as 1.1 DAECs/year, compared to 2.2 DAECs/year reported in [20]. In addition, differences are also found in the duration of DAECs with respect to their seasonality. Thus, in the present analysis, the longest (5–7 days), but very few (2%) DAECs are observed in summer, while in [20] they were found to occur in spring. The encountered differences between the two analyses should be attributed to the different time periods of study (2005–2019 against 2000–2013), the different versions of the satellite algorithms and data used, but also to possible changes of the prevailing synoptic conditions that favor the development of DAECs, an issue that deserves to be investigated in a future focused study.
It is interesting to note that the seasonality of DAECs clearly differs between the three sub-domains of MB, namely the eastern, the central and the western MB (Figure 6b–d). The highest frequencies occur in late winter and early spring (February–March) over the eastern MB, in middle–late spring (April–May) over the central MB and in summer over the western MB. Differences are also found in the frequencies of DAECs between the three sub-basins. Thus, DAECs are more frequent over the western and central MB, where the maximum monthly frequencies are as high as 10 and 9 DAECs/month, respectively, and the corresponding annual frequencies are up to 37 and 35 DAECs, than over the eastern MB (up to 5 DAECs/month and 17 DAECs in total). These geographical (longitudinal) differences in the overall annual and seasonal frequencies of Mediterranean DAECs, which are put in evidence for the first time in the present study, should be associated with the frequency of occurrence and the seasonality of the various synoptic patterns inducing dust transport over the western, central and eastern MB [20]. Moreover, another encountered difference between the three sub-basins refers to the duration of DAECs, which ranges from 1 to 2 days for the eastern and central MB, while increasing to up to 5 days for the western MB.
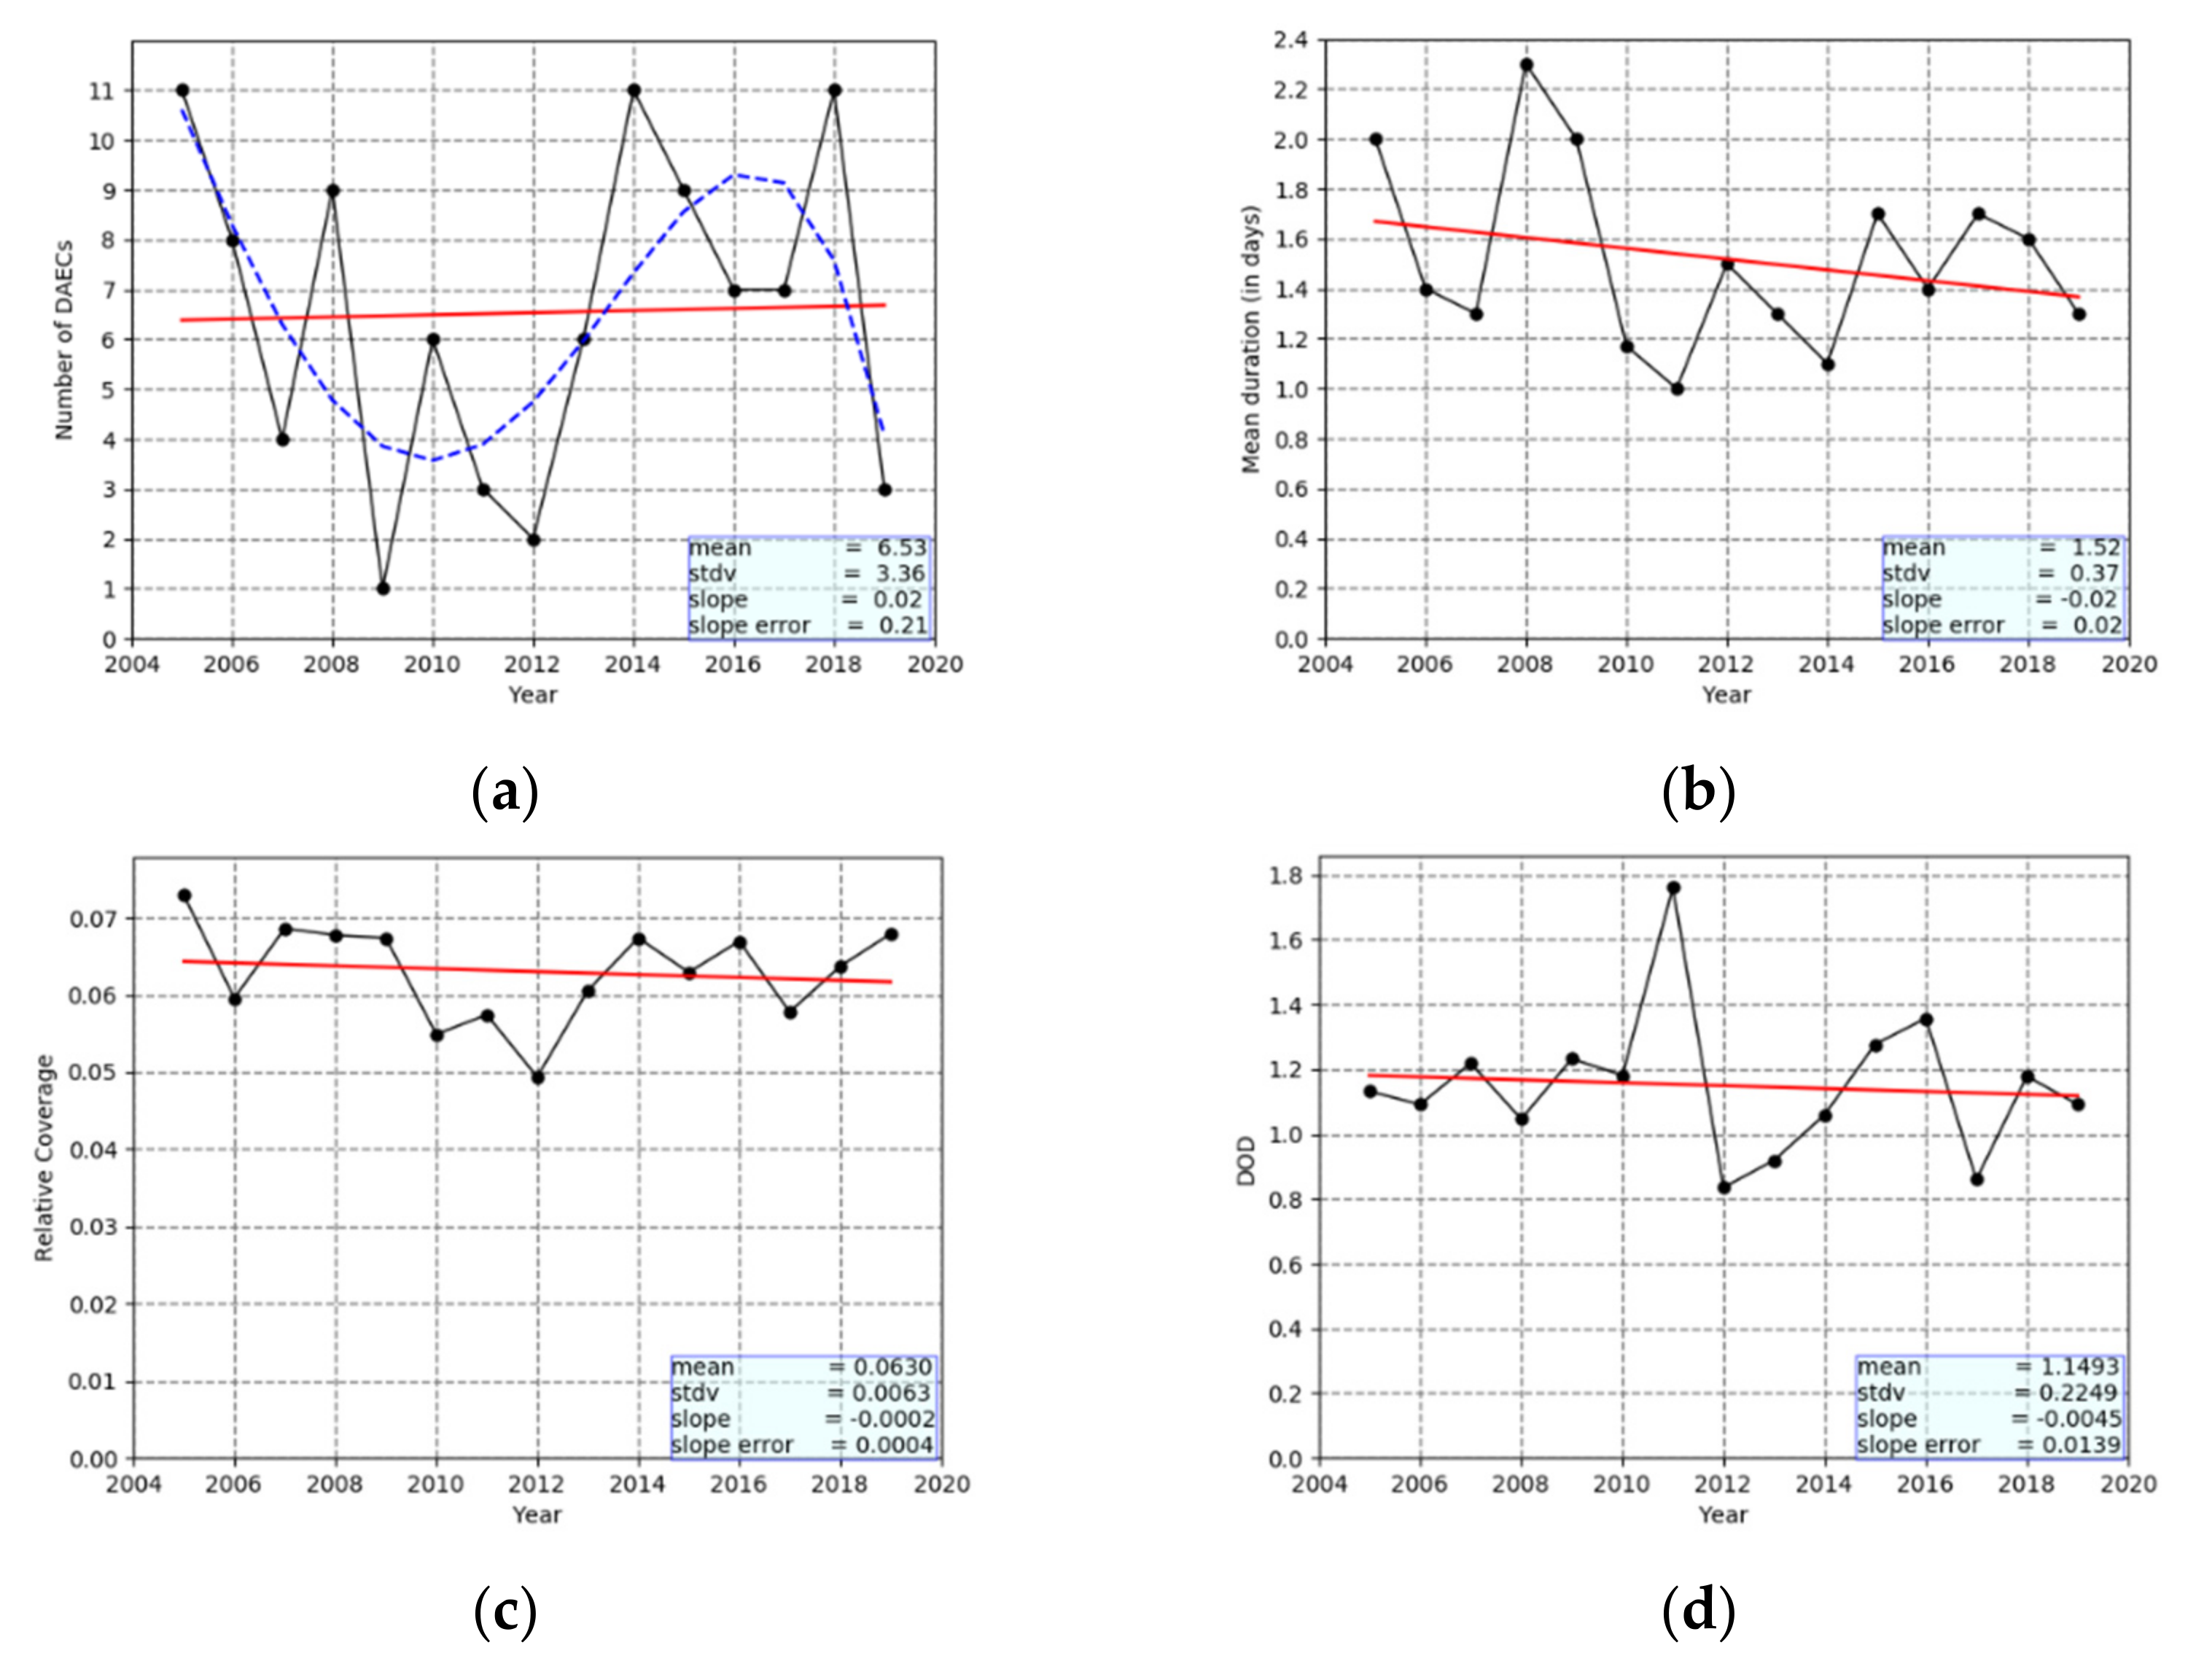
The interannual variability of the properties of Mediterranean DAECs is shown in Figure 7. The annual number of DAECs (Figure 7a) is marked by a strong year to year variability, ranging from 1 to 11 DAECs per year. The lowest frequency of occurrence is observed in 2009, when only a single DAEC took place, and the highest one is observed in years 2005, 2014 and 2018, with 11 DAECs. Taking into account that DAECs are composed of (both strong and extreme) DAEDs, it may not be surprising that the interannual variability of DAECs is quite similar to that of DAEDs (sum of strong and extreme, Figure 5a,b). This shows that the causes of the year to year variation of the frequency of occurrence of DAECs are the same as those responsible for the interannual variability of DAEDs. The computed mean annual duration of DAECs (averaged over the year’s DAECs), as shown in Figure 7b, varies between 1 and about 2.3 days/year. In comparison with Figure 7a, it is clear that, in general, the mean annual duration of DAECs does not covary with their frequency, since years with high/low frequencies are not characterized by long/short duration. Moreover, the 2005–2019 changes of the frequency and duration of Mediterranean DAECs are not in line, since their frequency slightly increased (not a statistically significant change, neither based on the slope error value, nor on the applied Mann–Kendall test), while the duration decreased. This is not strange, as frequency and duration are two independent parameters of DAECs, driven by different factors, e.g., intensity of emission and removal of sources of dust for the frequency versus synoptic circulation patterns for the duration. The geographical coverage of DAECs (given in terms of the percent coverage of the MB study region, Figure 7c) has annual values varying between about 5 and 7%, exhibiting a slight, not statistically significant (neither based on the slope error, since it is equal or larger than the slope value, nor on the applied Mann–Kendall test), decrease during the studied period. Although the interannual variability of geographical coverage of DAECs is not similar with that of their frequency, there are single years characterized by high values of both parameters. For example, the year 2008 is marked by the maximum duration, while the frequency and the spatial extent of the DAECs of this year are also high. The algorithm results for 2008 are in line with strong activity of African dust sources in this year reported in literature [15]. Finally, the annual intensity of DAECs was also calculated and it is displayed in Figure 7d. In general, it does not vary a lot year by year, having values between 0.83 and 1.76 or between 0.83 and 1.36 if the year 2011, which has the maximum DOD value of 1.76, is excepted. The year to year variability of DOD is not in line with the corresponding variability of the other three parameters (frequency, duration and spatial extent). For example, the year 2008, which is characterized by high frequency, long duration and extended spatial coverage of DAECs (Figure 7a–c), is marked by relatively low DOD (Figure 7d). This could be explained by the fact that as a dust episode develops and expands over the MB, leaving its source areas in N. Africa, a part of its load is deposited through dry and wet deposition, thus leading to lower DOD values. Moreover, it could be attributed to the fact that the main driving factors for the magnitude of DOD can be different from those that are responsible for the other parameters.

4. Summary and Conclusions

In the present study, spatiotemporally extended Dust Aerosol Episodes (DAEs) over the broader Mediterranean Basin (MB) have been studied with a satellite algorithm, which uses as input aerosol optical properties, namely Ångström Exponent (AE), Aerosol Index (AI) and Aerosol Optical Depth (AOD), representative of particle size, absorptivity and loading, respectively. The study covers a 15-year period (2005–2019), using the latest available products of MODIS (Collection 6.1) and OMI (OMAERUV). The algorithm first computes strong and extreme DAEs on a daily and 1° × 1° latitude–longitude pixel level basis. Subsequently, Dust Aerosol Episode Days (DAEDs) with more than 30 DAEs, (coverage of at least 300,000 km2), and Dust Aerosol Episode Cases (DAECs) consisting of a sequence (n ≥ 1) of DAEDs, are determined by the algorithm. The analysis focused on a detailed investigation of the geographical and temporal, seasonal and interannual variability of DAEDs, and more specifically on their frequency of occurrence and their intensity, in terms of Dust Optical Depth (DOD). This is achieved at the widest spatial coverage, since the entire MB and the nearby desert areas are covered in parallel with a long (15-year) time span. Moreover, for the first time, a comprehensive study of Mediterranean DAECs is made on a climatological basis, dealing with their seasonal and geographical patterns. The outcomes of the analysis are summarized as follows:
  • According to the algorithm results, 166 DAEDs took place over the broader Mediterranean Basin from 2005 to 2019. Most of them (116 DAEDs) were strong, occurring mainly in spring (47%) and summer (38%). The extreme DAEDs were less frequent (50 DAEDs), usually taking place in spring (56%) and winter (16%).
  • During Mediterranean DAEDs, the annual geographical distribution indicates the frequent presence of strong episodes over the western and central MB, especially over continental NW African desert areas (up to 34 DAEDs), and the less frequent occurrence of extreme DAEDs over the central MB (up to 11 DAEDs). Similarly, during either strong or extreme DAEDs, on an annual basis, the dust loadings are strongest off the coasts of Libya and Egypt, more for extreme (DOD values up to 4.9) than for strong (up to 1.7) DAEDs.
  • The geographical distribution of the frequency of DAEDs is characterized by a distinct seasonality, which differs between strong and extreme DAEDs. For strong DAEDs, higher frequencies (up to 20 DAEDs) are observed, always over NW Africa, in spring and summer. On the other hand, for extreme DAEDs, the highest frequencies are found mainly in spring, mostly over the central MB (up to 9 DAEDs) and less over its eastern part (up to 5 DAEDs), and much less in winter (over the southeastern MB) and summer (over the southwestern MB), up to 4 DAEDs.
  • There is a considerable interannual variability of the characteristics of DAEDs, which is largest for their frequency that varies between 1 and 18 strong DAEDs/year, and between 1 and 8 extreme DAEDs/year. The spatial coverage varies more for extreme DAEDs (ranging from 5.0 to 9.4% of the MB surface area) than for strong DAEDs (4.3–8.0, 7.9%). Moreover, the intensity varies from year to year, more for extreme DAEDs (DOD values between 1.27 and 2.50) than for strong DAECs (0.70–0.86). According to the algorithm results, the frequency, the spatial extent and the intensity of DAEDs have decreased from 2005 to 2019, with the exception of the spatial extent of strong DAEDs. However, according to the slope error values, among these trends, only those for the spatial extent and the intensity of extreme DAEDs are statistically significant, while none of them is statistically significant at the 95% level according to the applied Mann–Kendall test.
  • Overall, 98 DAECs were identified over the Mediterranean Basin during the 15-year period 2005–2019, with a duration ranging from 1 day (65.3%), reaching up to 7 days (1%). The Mediterranean DAECs are marked by a distinct seasonality, most of them (47%) being observed in spring and then some (37%) in summer. Yet, the seasonality varies with longitude, namely between the western, central and eastern MB. In the eastern MB, there is a clear maximum occurrence in late winter–early spring, shifting to late spring in the central MB, and to late summer in the western MB. There is also a longitudinal difference in the frequency of DAECs, with more DAECs occurring in the western and the central MB (38 and 35 DAECs, respectively) and less in the eastern MB (17 DAECs). DAECs are characterized by a significant year to year variability, ranging from 1 to 11 DAECs/year, opposite to weaker interannual variability for their duration, spatial extent and intensity, as well as small and not statistically significant changes.
This first ever 15-year climatology of Mediterranean DAEDs and DAECs is very important in many aspects, and especially for assessments of two-way links to the Mediterranean weather and climate. The identified Mediterranean areas with high frequencies or intensities of DAEDs are those which are prone to undergo any type of effect, from dust episodes to cloud properties or other atmospheric conditions, and this issue is going to be examined in a future study. The radiative effect of DAEDs is planned to be studied using a 3D radiative transfer model (RTM), and we will also investigate possible effects on the temperature profile of the Mediterranean atmosphere. In addition, a preliminary analysis puts forth evidence of impacts of DAEDs on cloud properties, namely the formation of mixed and ice phase clouds over the areas of their occurrence, and it is planned to be further extended and completed.

Supplementary Materials

The following are available online at https://www.mdpi.com/article/10.3390/rs13152895/s1. Figure S1: (a) AOD threshold values (AODmean+2STDV) for strong dust episodes, (b) AOD threshold values (AOD ≥ AODmean+4STDV) for extreme dust episodes, (c) climatological (2005-2019) mean AOD values (AODmean) and (d) the associated standard deviations (STDVs), Figure S2: The atmospheric circulation, i.e., geopotential height (GPH, in m) at 700 hPa (left column panels, i) along with the wind vectors (black arrows) and the geographical distribution of MODIS AOD (right column panels, ii) during the day before (D-0, first row, a), and the first (D-1, second row, b), second (D-2, third row, c), third (D-3, fourth row, d) and fourth (D-4, fifth row, e) days of the DAEC that took place during 17–20 April 2015 over the Mediterranean Basin, Figure S3: The atmospheric circulation, i.e., geopotential height (GPH, in m) at 700 hPa (left column panels, i) and the geographical distribution of MODIS AOD (right column panels, ii) during the day before (D-0, first row, a) along with the wind vector (black arrow) and the first (D-1, second row, b), second (D-2, third row, c) and third (D-3, fourth row, d) days of the DAEC that took place during 16–18 June 2016 over the Mediterranean Basin, Figure S4: Interannual variation of the total number (frequency of occurrence) of (a) strong and (b) extreme dust aerosol episode days (DAEDs) per year over the broader Mediterranean basin during the period 2005–2019. Figure S5: Spatial distribution of the seasonal mean DOD of strong (left column) and extreme (right column) DAEDs that took place over the broader Mediterranean basin during the 15-year period 2005–2019.

Author Contributions

Conceptualization, N.H. and A.G.; methodology, N.H. and A.G.; software, N.H., A.G. and M.G.; formal analysis, M.G.; investigation, N.H. and M.G.; resources, N.H., M.G. and A.G.; data curation, N.H. and M.G.; writing—original draft preparation, M.G.; writing—review and editing, N.H., A.G., C.J.L., N.M. and M.G.; visualization, M.G.; supervision, N.H.; project administration, N.H.; funding acquisition, N.H. and N.M. All authors have read and agreed to the published version of the manuscript.

Funding

This research was funded by the PANhellenic infrastructure for Atmospheric Composition and climatE change (PANACEA) research project (MIS 5021516), implemented under the Action Reinforcement of the Research and Innovation Infrastructure, and the Operational Program Competitiveness, Entrepreneurship, and Innovation (NSRF 2014–2020), co-financed by Greece and the European Union (European Regional Development Fund).

Institutional Review Board Statement

Not applicable.

Informed Consent Statement

Not applicable.

Data Availability Statement

Publicly available datasets were analyzed in this study. This data can be found here: [https://ladsweb.modaps.eosdis.nasa.gov/search/] (accessed on 1 June 2021).

Acknowledgments

We acknowledge support by the project “PANhellenic infrastructure for Atmospheric Composition and climatE change” (MIS 5021516) which is implemented under the Action “Reinforcement of the Research and Innovation Infrastructure”, funded by the Operational Program “Competitiveness, Entrepreneurship and Innovation” (NSRF 2014-2020) and co-financed by Greece and the European Union (European Regional Development Fund). A. G. acknowledges support by the Hellenic Foundation for Research and Innovation (H.F.R.I.) under the “2nd Call for H.F.R.I. Research Projects to support Post-Doctoral Researchers” (Project Acronym: ATLANTAS, Project Number: 544).

Conflicts of Interest

The authors declare no conflict of interest.

References

  1. Kaufman, Y.J.; Tanré, D.; Boucher, O. A satellite view of aerosols in the climate system. Nature 2002, 419, 215–223. [Google Scholar] [CrossRef] [PubMed]
  2. Sicard, M.; Bertolín, S.; Muñoz, C.; Rodríguez, A.; Rocadenbosch, F.; Comerón, A. Separation of aerosol fine-and coarse-mode radiative properties: Effect on the mineral dust longwave, direct radiative forcing. J. Geophys. Res. Atmos. 2014, 41, 6978–6985. [Google Scholar] [CrossRef] [Green Version]
  3. Gkikas, A.; Giannaros, T.; Kotroni, V.; Lagouvardos, K. Assessing the radiative impacts of an extreme desert dust outbreak and the potential improvements on short-term weather forecasts: The case of February 2015. Atmos. Res. 2019, 226, 152–170. [Google Scholar] [CrossRef]
  4. Winckler, G.; Mahowald, N. DICE: Dust impact on climate and environment. Dust 2015, 24, 61. [Google Scholar] [CrossRef] [Green Version]
  5. Karydis, V.A.; Tsimpidi, A.P.; Bacer, S.; Pozzer, A.; Nenes, A.; Lelieveld, J. Global impact of mineral dust on cloud droplet number concentration. Atmos. Chem. Phys. 2017, 17, 5601–5621. [Google Scholar] [CrossRef] [Green Version]
  6. Karydis, V.; Kumar, P.; Barahona, D.; Sokolik, I.; Nenes, A. On the effect of dust particles on global cloud condensation nuclei and cloud droplet number. J. Geophys. Res. Atmos. 2011, 116, D23. [Google Scholar] [CrossRef] [Green Version]
  7. Levin, Z.; Teller, A.; Ganor, E.; Yin, Y. On the interactions of mineral dust, sea-salt particles, and clouds: A measurement and modeling study from the Mediterranean Israeli Dust Experiment campaign. J. Geophys. Res. Atmos. 2005, 110. [Google Scholar] [CrossRef] [Green Version]
  8. Li, R.; Dong, X.; Guo, J.; Fu, Y.; Zhao, C.; Wang, Y.; Min, Q. The implications of dust ice nuclei effect on cloud top temperature in a complex mesoscale convective system. Sci. Rep. 2017, 7, 13826. [Google Scholar] [CrossRef] [Green Version]
  9. Prospero, J.M.; Lamb, P.J. African droughts and dust transport to the Caribbean: Climate change implications. Science 2003, 302, 1024–1027. [Google Scholar] [CrossRef]
  10. Basart, S.; Pérez, C.; Nickovic, S.; Cuevas, E.; Baldasano, J. Development and evaluation of the BSC-DREAM8b dust regional model over Northern Africa, the Mediterranean and the Middle East. Tellus B: Chem. Phys. Meteorol. 2012, 64, 18539. [Google Scholar] [CrossRef] [Green Version]
  11. Gkikas, A.; Hatzianastassiou, N.; Mihalopoulos, N. Aerosol events in the broader Mediterranean basin based on 7-year (2000–2007) MODIS C005 data. Atmos. Chem. Phys. 2009, 27, 3509–3522. [Google Scholar] [CrossRef]
  12. Ginoux, P.; Prospero, J.M.; Gill, T.E.; Hsu, N.C.; Zhao, M. Global-scale attribution of anthropogenic and natural dust sources and their emission rates based on MODIS Deep Blue aerosol products. Rev. Geophys. 2012, 50, RG3005. [Google Scholar] [CrossRef]
  13. Gkikas, A.; Hatzianastassiou, N.; Mihalopoulos, N.; Katsoulis, V.; Kazadzis, S.; Pey, J.; Querol, X.; Torres, O. The regime of intense desert dust episodes in the Mediterranean based on contemporary satellite observations and ground measurements. Atmos. Chem. Phys. 2013, 13, 12135–12154. [Google Scholar] [CrossRef] [Green Version]
  14. Ludwig, P.; Gavrilov, M.B.; Marković, S.B.; Ujvari, G.; Lehmkuhl, F. Simulated regional dust cycle in the Carpathian Basin and the Adriatic Sea region during the Last Glacial Maximum. Quat. Int. 2021, 581–582, 114–127. [Google Scholar] [CrossRef]
  15. Wagner, R.; Schepanski, K.; Heinold, B.; Tegen, I. Interannual variability in the Saharan dust source activation—Toward understanding the differences between 2007 and 2008. J. Geophys. Res. Atmos. 2016, 121, 4538–4562. [Google Scholar] [CrossRef] [Green Version]
  16. Moulin, C.; Lambert, C.E.; Dayan, U.; Masson, V.; Ramonet, M.; Bousquet, P.; Legrand, M.; Balkanski, Y.J.; Guelle, W.; Marticorena, B.; et al. Satellite climatology of African dust transport in the Mediterranean atmosphere. J. Geophys. Res. Atmos. 1998, 103, 13137–13144. [Google Scholar] [CrossRef]
  17. Rodrıguez, S.; Querol, X.; Alastuey, A.; Kallos, G.; Kakaliagou, O. Saharan dust contributions to PM10 and TSP levels in Southern and Eastern Spain. Atmos. Environ. 2001, 35, 2433–2447. [Google Scholar] [CrossRef]
  18. Meloni, D.; Di Sarra, A.; Monteleone, F.; Pace, G.; Piacentino, S.; Sferlazzo, D. Seasonal transport patterns of intense Saharan dust events at the Mediterranean island of Lampedusa. Atmos. Res. 2008, 88, 134–148. [Google Scholar] [CrossRef]
  19. Gavrilov, M.B.; Marković, S.B.; Schaetzl, R.J.; Tošić, I.A.; Zeeden, C.; Obreht, I.; Sipos, G.; Ruman, A.; Putniković, S.; Emunds, K.; et al. Prevailing surface winds in Northern Serbia in the recent and past time periods; modern- and past dust deposition. Aeolian Res. 2018, 31, 117–129. [Google Scholar] [CrossRef] [Green Version]
  20. Gkikas, A.; Houssos, E.; Lolis, C.; Bartzokas, A.; Mihalopoulos, N.; Hatzianastassiou, N. Atmospheric circulation evolution related to desert-dust episodes over the Mediterranean. Q. J. R. Meteorol. Soc. 2015, 141, 1634–1645. [Google Scholar] [CrossRef]
  21. Osada, K.; Ura, S.; Kagawa, M.; Mikami, M.; Tanaka, T.Y.; Matoba, S.; Aoki, K.; Shinoda, M.; Kurosaki, Y.; Hayashi, M.; et al. Wet and dry deposition of mineral dust particles in Japan: Factors related to temporal variation and spatial distribution. Atmos. Chem. Phys. 2014, 14, 1107–1121. [Google Scholar] [CrossRef] [Green Version]
  22. IPCC. Climate Change 2013: The Physical Science Basis. Contribution of Working Group I to the Fifth Assessment Report of the Intergovernmental Panel on Climate Change; Stocker, T.F., Qin, D., Plattner, G.-K., Tignor, M., Allen, S.K., Boschung, J., Nauels, A., Xia, Y., Bex, V., Midgley, P.M., Eds.; Cambridge University Press: Cambridge, UK, 2013; 1535p. [Google Scholar]
  23. Lionello, P. The Climate of the Mediterranean Region: From the Past to the Future; Elsevier: Amsterdam, The Netherlands, 2012. [Google Scholar]
  24. Georgoulias, A.K.; Alexandri, G.; Kourtidis, K.A.; Lelieveld, J.; Zanis, P.; Pöschl, U.; Levy, R.; Amiridis, V.; Marinou, E.; Tsikerdekis, A. Spatiotemporal variability and contribution of different aerosol types to the aerosol optical depth over the Eastern Mediterranean. Atmos. Chem. Phys. 2016, 16, 13853–13884. [Google Scholar] [CrossRef] [PubMed] [Green Version]
  25. Ozdemir, E.; Tuygun, G.T.; Elbir, T. Application of aerosol classification methods based on AERONET version 3 product over eastern Mediterranean and Black Sea. Atmos. Pollut. Res. 2020, 11, 2226–2243. [Google Scholar] [CrossRef]
  26. Di Sarra, A.; Di Biagio, C.; Meloni, D.; Monteleone, F.; Pace, G.; Pugnaghi, S.; Sferlazzo, D. Shortwave and longwave radiative effects of the intense Saharan dust event of 25–26 March 2010 at Lampedusa (Mediterranean Sea). J. Geophys. Res. Atmos. 2011, 116, D23. [Google Scholar] [CrossRef] [Green Version]
  27. Schepanski, K.; Mallet, M.; Heinold, B.; Ulrich, M. North African dust transport toward the western Mediterranean basin: Atmospheric controls on dust source activation and transport pathways during June–July 2013. Atmos. Chem. Phys. 2016, 16, 14147–14168. [Google Scholar] [CrossRef] [Green Version]
  28. Solomos, S.; Kalivitis, N.; Mihalopoulos, N.; Amiridis, V.; Kouvarakis, G.; Gkikas, A.; Binietoglou, I.; Tsekeri, A.; Kazadzis, S.; Kottas, M.; et al. From tropospheric folding to Khamsin and Foehn winds: How atmospheric dynamics advanced a record-breaking dust episode in Crete. Atmosphere 2018, 9, 240. [Google Scholar] [CrossRef] [Green Version]
  29. Kaskaoutis, D.G.; Dumka, U.C.; Rashki, A.; Psiloglou, B.E.; Gavriil, A.; Mofidi, A.; Petrinoli, K.; Karagiannis, D.; Kambezidis, H.D. Analysis of intense dust storms over the eastern Mediterranean in March 2018: Impact on radiative forcing and Athens air quality. Atmos. Env. 2019, 209, 23–39. [Google Scholar] [CrossRef]
  30. Toledano, C.; Cachorro, V.; De Frutos, A.; Sorribas, M.; Prats, N.; De la Morena, B. Inventory of African desert dust events over the southwestern Iberian Peninsula in 2000–2005 with an AERONET Cimel Sun photometer. J. Geophys. Res. Atmos. 2007, 112, D21. [Google Scholar] [CrossRef]
  31. Ganor, E.; Osetinsky, I.; Stupp, A.; Alpert, P. Increasing trend of African dust, over 49 years, in the eastern Mediterranean. J. Geophys. Res. Atmos. 2010, 115, D7. [Google Scholar] [CrossRef] [Green Version]
  32. Achilleos, S.; Mouzourides, P.; Kalivitis, N.; Katra, I.; Kloog, I.; Kouis, P.; Middleton, N.; Mihalopoulos, N.; Neophytou, M.; Panayiotou, A.; et al. Spatio-temporal variability of desert dust storms in Eastern Mediterranean (Crete, Cyprus, Israel) between 2006 and 2017 using a uniform methodology. Sci. Total Environ. 2020, 714, 136693. [Google Scholar] [CrossRef]
  33. Pey, J.; Querol, X.; Alastuey, A.; Forastiere, F.; Stafoggia, M. African dust outbreaks over the Mediterranean Basin during 2001–2011: PM 10 concentrations, phenomenology and trends, and its relation with synoptic and mesoscale meteorology. Atmos. Chem. Phys. 2013, 13, 1395–1410. [Google Scholar] [CrossRef] [Green Version]
  34. Flores, R.M.; Kaya, N.; Eşer, Ö.; Saltan, Ş. The effect of mineral dust transport on PM10 concentrations and physical properties in Istanbul during 2007–2014. Atmos. Res. 2017, 197, 342–355. [Google Scholar] [CrossRef]
  35. Gkikas, A.; Houssos, E.; Hatzianastassiou, N.; Papadimas, C.; Bartzokas, A. Synoptic conditions favouring the occurrence of aerosol episodes over the broader Mediterranean basin. Q. J. R. Meteorol. Soc. 2012, 138, 932–949. [Google Scholar] [CrossRef]
  36. Gkikas, A.; Basart, S.; Hatzianastassiou, N.; Marinou, E.; Amiridis, V.; Kazadzis, S.; Pey, J.; Querol, X.; Jorba, O.; Gassó, S.; et al. Mediterranean intense desert dust outbreaks and their vertical structure based on remote sensing data. Atmos. Chem. Phys. 2016, 16, 8609–8642. [Google Scholar] [CrossRef] [Green Version]
  37. Barnes, W.L.; Xiong, X.; Guenther, B.W.; Salomonson, V. Development, characterization, and performance of the EOS MODIS sensors. In Proceedings of the SPIE 5151, Earth Observing Systems VIII, San Diego, CA, USA, 10 November 2003. [Google Scholar] [CrossRef]
  38. Salomonson, V.V.; Barnes, W.; Masuoka, E.J. Introduction to MODIS and an Overview of Associated Activities. Earth Sci. Satell. Remote Sens. 2006, 12–32. [Google Scholar] [CrossRef]
  39. Baddock, M.C.; Bullard, J.E.; Bryant, R.G. Dust source identification using MODIS: A comparison of techniques applied to the Lake Eyre Basin, Australia. Remote Sens. Environ. 2009, 113, 1511–1528. [Google Scholar] [CrossRef] [Green Version]
  40. Rezaei, M.; Farajzadeh, M.; Mielonen, T.; Ghavidel, Y. Analysis of spatio-temporal dust aerosol frequency over Iran based on satellite dat. Atmos. Pollut. Res. 2019, 10, 508–519. [Google Scholar] [CrossRef]
  41. Ali, M.A.; Nichol, J.E.; Bilal, M.; Qiu, Z.; Mazhar, U.; Wahiduzzaman, M.; Almazroui, M.; Islam, M.N. Classification of aerosols over Saudi Arabia from 2004–2016. Atmos. Environ. 2020, 24, 1352–2310. [Google Scholar] [CrossRef]
  42. Voss, K.K.; Evan, A.T. A new satellite-based global climatology of dust aerosol optical depth. J. Appl. Meteorol. Climatol. 2020, 59, 83–102. [Google Scholar] [CrossRef]
  43. Remer, L.A.; Kaufman, Y.J.; Tanré, D.; Mattoo, S.; Chu, D.A.; Martins, J.V.; Li, R.-R.; Ichoku, C.; Levy, R.C.; Kleidman, R.G.; et al. The MODIS Aerosol Algorithm, Products, and Validation. J. Atmos. Sci. 2005, 62, 947–973. [Google Scholar] [CrossRef] [Green Version]
  44. Papadimas, C.; Hatzianastassiou, N.; Mihalopoulos, N.; Kanakidou, M.; Katsoulis, B.D.; Vardavas, I. Assessment of the MODIS Collections C005 and C004 aerosol optical depth products over the Mediterranean basin. Atmos. Chem. Phys. 2009, 9, 2987–2999. [Google Scholar] [CrossRef] [Green Version]
  45. Schutgens, N.; Sayer, A.M.; Heckel, A.; Hsu, C.; Jethva, H.; de Leeuw, G.; Leonard, P.J.T.; Levy, R.C.; Lipponen, A.; Lyapustin, A.; et al. An AeroCom–AeroSat study: Intercomparison of satellite AOD datasets for aerosol model evaluation. Atmos. Chem. Phys. 2020, 20, 12431–12457. [Google Scholar] [CrossRef]
  46. Hsu, N.C. Changes to Modis Deep Blue Aerosol Products between Collection 6 and Collection 6.1. 2017. Available online: https://atmosphere-imager.gsfc.nasa.gov/sites/default/files/ModAtmo/modis_deep_blue_c61_changes2.pdf (accessed on 27 May 2021).
  47. Mattoo, S. Aerosol Dark Target (10 km & 3 km) Collection 6.1 Changes. Available online: https://atmosphere-imager.gsfc.nasa.gov/sites/default/files/ModAtmo/C061_Aerosol_Dark_Target_v2.pdf (accessed on 27 May 2021).
  48. Wang, Y.; Yuan, Q.; Li, T.; Shen, H.; Zheng, L.; Zhang, L. Evaluation and comparison of MODIS Collection 6.1 aerosol optical depth against AERONET over regions in China with multifarious underlying surfaces. Atmos. Environ. 2019, 200, 280–301. [Google Scholar] [CrossRef] [Green Version]
  49. Gavrouzou, M.; Hatzianastassiou, N.; Gkikas, A.; Korras-Carraca, M.-B.; Mihalopoulos, N. A global climatology of dust aerosols based on satellite data: Spatial, seasonal and inter-annual patterns over the period 2005–2019. Remote Sens. 2021, 13, 359. [Google Scholar] [CrossRef]
  50. Torres, O.; Ahn, C.; Chen, Z. Improvements to the OMI near-UV aerosol algorithm using A-train CALIOP and AIRS observations. Atmos. Meas. Tech. 2013, 6, 3257–3270. [Google Scholar] [CrossRef] [Green Version]
  51. Stein Zweers, D.C.; Veefkind, P. OMI/Aura Multi-Wavelength Aerosol Optical Depth and Single Scattering Albedo 1-orbit L2 Swath 13 × 24 km V003; Goddard Earth Sciences Data and Information Services Center (GES DISC): Greenbelt, MD, USA, 2012. [CrossRef]
  52. Stein Zweers, D.C.; Veefkind, P. OMI/Aura Multiwavelength Aerosol Optical Depth and Single Scattering Albedo L3 1 day Best Pixel in 0.25 Degree × 0.25 Degree V3; NASA Goddard Space Flight Center, Goddard Earth Sciences Data and Information Services Center (GES DISC): Greenbelt, MD, USA, 2012. [CrossRef]
  53. Stein Zweers, D.C.; Veefkind, P. OMI/Aura Aerosol Product Multi-Wavelength Algorithm Zoomed 1-Orbit L2 Swath 13 × 12 km V003; Goddard Earth Sciences Data and Information Services Center (GES DISC): Greenbelt, MD, USA, 2012. [CrossRef]
  54. Hovila, J.; Arola, A.; Tamminen, J. OMI/Aura Surface UV Irradiance 1-Orbit L2 Swath 13 × 24 km V003; Goddard Earth Sciences Data and Information Services Center (GES DISC): Greenbelt, MD, USA, 2007. [CrossRef]
  55. Hovila, J.; Arola, A.; Tamminen, J. OMI/Aura Surface UVB Irradiance and Erythemal Dose Daily L3 Global Gridded 1.0 Degree × 1.0 Degree V3; Goddard Earth Sciences Data and Information Services Center (GES DISC): Greenbelt, MD, USA, 2013. [CrossRef]
  56. Hovila, J.; Arola, A.; Tamminen, J. OMI/Aura Surface UVB Irradiance and Erythemal Dose Daily L2 Global Gridded 0.25 Degree × 0.25 Degree V3; Goddard Earth Sciences Data and Information Services Center (GES DISC): Greenbelt, MD, USA, 2014. [CrossRef]
  57. Torres, O.; Tanskanen, A.; Veihelmann, B.; Ahn, C.; Braak, R.; Bhartia, P.K.; Veefkind, P.; Levelt, P. Aerosols and surface UV products from Ozone Monitoring Instrument observations: An overview. J. Geophys. Res. 2007, 112, D24S47. [Google Scholar] [CrossRef] [Green Version]
  58. Pace, G.; di Sarra, A.; Meloni, D.; Piacentino, S.; and Chamard, P. Aerosol optical properties at Lampedusa (Central Mediterranean). 1. Influence of transport and identification of different aerosol types. Atmos. Chem. Phys. 2006, 6, 697–713. [Google Scholar] [CrossRef] [Green Version]
  59. Alpert, P.; Ziv, B. The Sharav cyclone: Observations and some theoretical considerations. J. Geophys. Res. Atmos. 1989, 94, 18495–18514. [Google Scholar] [CrossRef] [Green Version]
  60. Barkan, J.; Alpert, P.; Kutiel, H.; Kishcha, P. Synoptics of dust transportation days from Africa toward Italy and central Europe. J. Geophys. Res. Atmos 2005, 110. [Google Scholar] [CrossRef] [Green Version]
  61. Hatzianastassiou, N.; Papadimas, C.D.; Lolis, C.J.; Bartzokas, A.; Levizzani, V.; Pnevmatikos, J.D.; Katsoulis, B.D. Spatial and temporal variability of precipitation over the Mediterranean Basin based on 32-year satellite Global Precipitation Climatology Project data, part I: Evaluation and climatological patterns. Int. J. Climatol. 2016, 36, 4741–4754. [Google Scholar] [CrossRef]
  62. Adler, R.F.; Sapiano, M.R.P.; Huffman, G.J.; Wang, J.-J.; Gu, G.; Bolvin, D.; Chiu, L.; Schneider, U.; Becker, A.; Nelkin, E.; et al. The Global Precipitation Climatology Project (GPCP) Monthly Analysis (New Version 2.3) and a Review of 2017 Global Precipitation. Atmosphere 2018, 9, 138. [Google Scholar] [CrossRef] [PubMed] [Green Version]
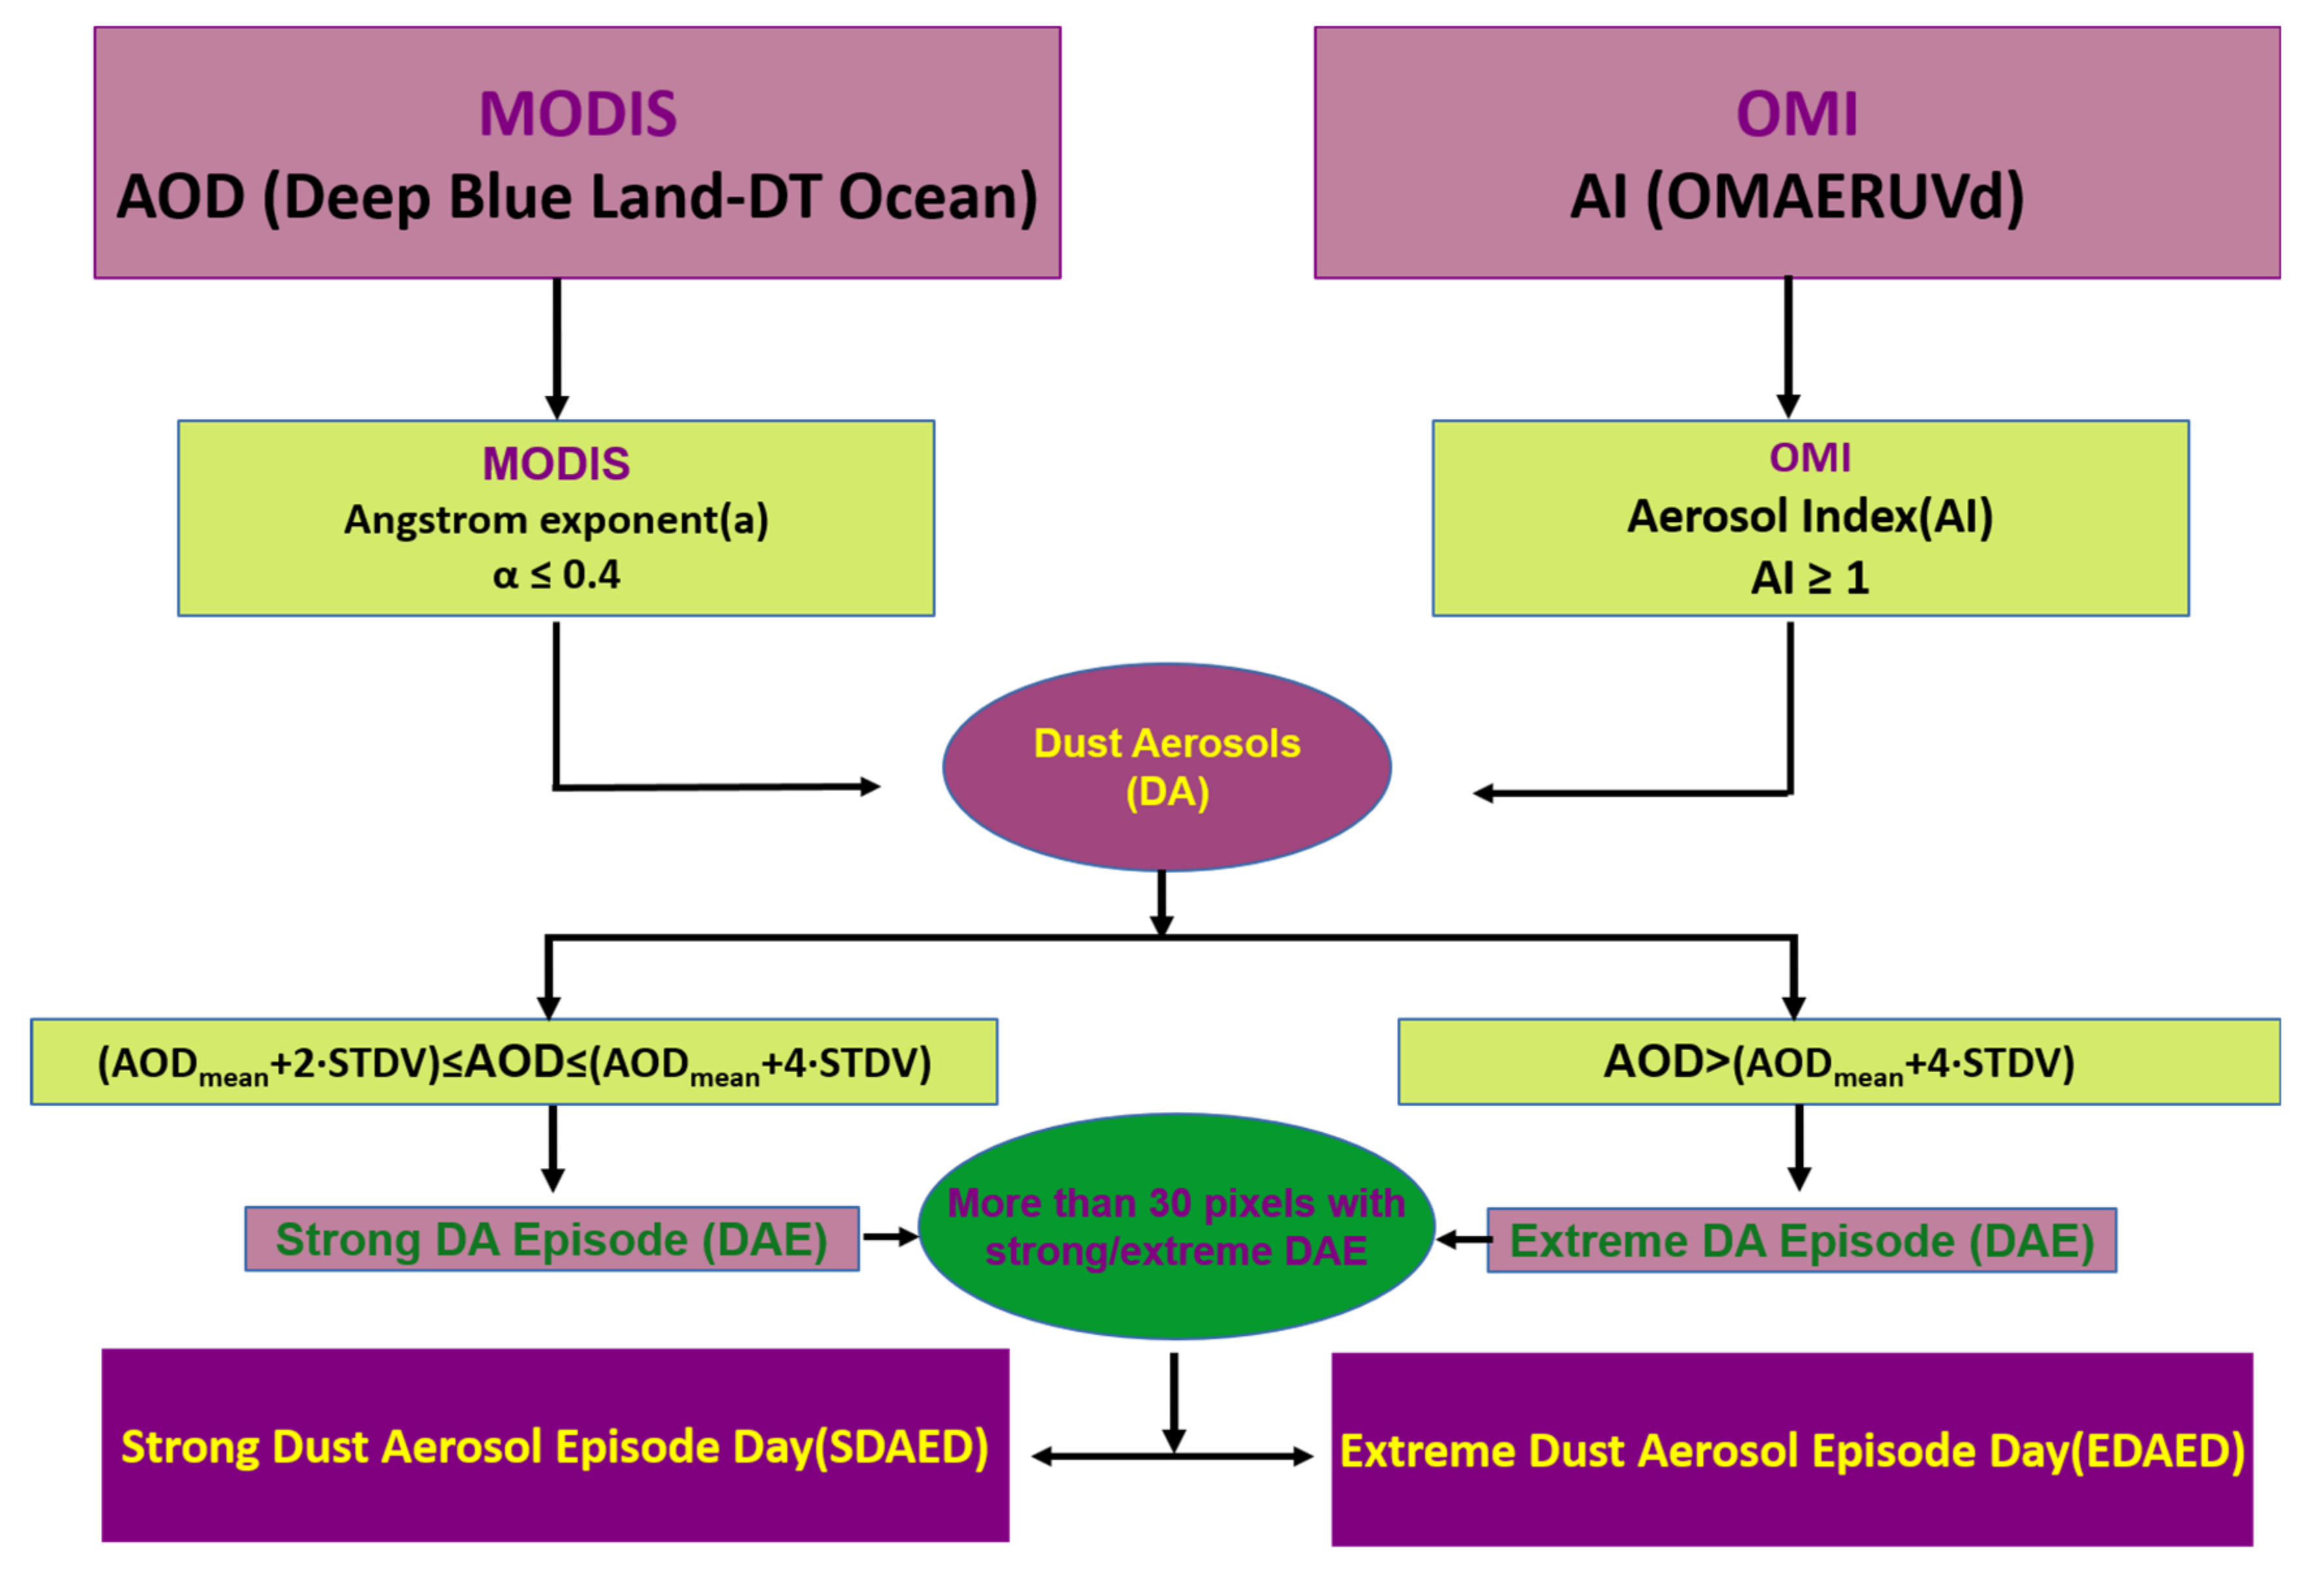
Figure 1. The satellite-based algorithm and the applied methodology for the identification of Dust Aerosol Episodes (DAEs) and Dust Aerosol Episode Days (DAEDs).
Remotesensing 13 02895 g001
Figure 2. The study area of the greater Mediterranean Basin and its sub-areas (western, central and eastern sub-basins).
Remotesensing 13 02895 g002
Figure 3. Spatial distribution of the total number of strong (a) and extreme (b) DAEDs over the Mediterranean Basin during the 15-year period 2005–2019 and the corresponding climatological annual mean DOD of strong (c) and extreme (d) DAEDs.
Remotesensing 13 02895 g003
Figure 4. Spatial distribution of the seasonal absolute frequency of occurrence (total number) of strong (left panels) and extreme (right panels) DAEDs over the broader Mediterranean Basin during the 15-year period 2005–2019.
Remotesensing 13 02895 g004aRemotesensing 13 02895 g004b
Figure 5. Interannual variation of: the total number (absolute frequency) of dust aerosol episode days (DAEDs) over the broader Mediterranean Basin during the period 2005–2019 (a,b, first row), the percent coverage of the study area by dust episodic pixels per year (c,d, second row) and the relevant mean dust optical depth, DOD (e,f, third row). Results are given for strong (left panels, a,c,e) and extreme (right panels, b,d,f) DAEDs. First-order (linear regression, red lines) as well as fourth-order (blue dashed curves) polynomial fitting is applied to each time series. Moreover, at the bottom right corner of each panel plot, the computed 15-year mean values and standard deviations, as well as the computed slope values and associated errors of the applied linear regressions are shown.
Remotesensing 13 02895 g005aRemotesensing 13 02895 g005b
Figure 6. Intra-annual variation of the total number of DAECs occurring over (a) the broader Mediterranean Basin, and its (b) eastern, (c) central and (d) western sub-domains (see Figure 1), during the period 2005–2019. The duration (numbers of days) of DAECs is also given in graded shaded colors.
Remotesensing 13 02895 g006
Figure 7. Interannual variation of (a) the total number per year, (b) the mean annual duration, (c) the mean annual percent coverage of the study region and (d) the mean annual DOD of DAECs that took place over the broader Mediterranean Basin during the period 2005–2019.
Remotesensing 13 02895 g007
Table 1. An overview of the total number of DAEDs that took place over the Mediterranean Basin during the period 2005–2019. The seasonal absolute frequencies are also given along with the corresponding relative percent frequencies (in parentheses). The maximum seasonal frequencies are indicated in bold. Results are also given separately for strong and extreme DAEDs.
Absolute and Relative Percent
Frequencies of DAEDs
Winter SpringSummerAutumnAnnual
All DAEDs15 (9.1%)80 (48.2%)62 (37.3%)9 (5.4%)166
Strong DAEDs5 (4.3%)52 (44.8%)54 (46.5%)5 (5.4%)116
Extreme DAEDs10 (20%)28 (56%)8 (16%)4 (8%)50
Publisher’s Note: MDPI stays neutral with regard to jurisdictional claims in published maps and institutional affiliations.