Article

Optical and Microphysical Properties of Aged Biomass Burning Aerosols and Mixtures, Based on 9-Year Multiwavelength Raman Lidar Observations in Athens, Greece

by
Maria Mylonaki
1,*,
Alexandros Papayannis
1,
Dimitra Anagnou
1,
Igor Veselovskii
2,
Christina-Anna Papanikolaou
1,
Panagiotis Kokkalis
3,
Ourania Soupiona
1,
Romanos Foskinis
1,
Marilena Gidarakou
1 and
Eleni Kralli
1
1
Laser Remote Sensing Unit, Department of Physics, National and Technical University of Athens, 15780 Zografou, Greece
2
Prokhorov General Physics Institute of the Russian Academy of Sciences, 119991 Moscow, Russia
3
Physics Department, Kuwait University, P.O. Box 5969, Safat 13060, Kuwait
*
Author to whom correspondence should be addressed.
Remote Sens. 2021, 13(19), 3877; https://doi.org/10.3390/rs13193877
Submission received: 30 July 2021 / Revised: 6 September 2021 / Accepted: 23 September 2021 / Published: 28 September 2021

Abstract

:
Mean optical and microphysical aerosol properties of long-range transported biomass burning (BB) particles and mixtures are presented from a 9-year (2011–2019) data set of multiwavelength Raman lidar data, obtained by the EOLE lidar over the city of Athens (37.58° N, 23.47° E), Greece. We studied 34 aerosol layers characterized as: (1) smoke; (2) smoke + continental polluted, and (3) smoke + mixed dust. We found, mainly, small-sized aerosols with mean backscatter-related (355 nm/532 nm, 532 nm/1064 nm) values and Ångström exponent (AE) values in the range 1.4–1.7. The lidar ratio (LR) value at 355 nm was found to be 57 ± 10 sr, 51 ± 5 sr, and 38 ± 9 sr for the aerosol categories (1), (2), and (3), respectively; while at 532 nm, we observed LR values of 73 ± 11 sr, 59 ± 10 sr, and 62 ± 12 for the same categories. Regarding the retrieved microphysical properties, the effective radius (reff) ranged from 0.24 ± 0.11 to 0.24 ± 0.14 μm for all aerosol categories, while the volume density (vd) ranged from 8.6 ± 3.2 to 20.7 ± 14.1 μm−3cm−3 with the higher values linked to aerosol categories (1) and (2); the real part of the refractive index (mR) ranged between 1.49 and 1.53, while for the imaginary part (mI), we found values within 0.0108 i and 0.0126 i. Finally, the single scattering albedo (SSA) of the propped particles varied from 0.915 to 0.936 at all three wavelengths (355–532–1064 nm). The novelty of this study is the provision of typical values of BB aerosol properties from the UV to the near IR, which can be used in forecasting the aerosol climatic effects in the European region.

1. Introduction

Fire has been a part of human life ever since the origin of our species and, as a result, air pollution from the smoke of biomass fires has been humanity’s companion for some 2 million years. Its impact on the environment is evident through soot and black carbon deposits in glaciers [1,2] and on human health through soot deposit in the lungs of mummies [3]. Yet, systematic studies on the BB aerosols and their effect on the environment began only in the late 1970s, when the first publication on the role of BB aerosol contributors to increased air pollution levels appeared [4]. Moreover, large-scale forest fires produce BB particles which can be long-range transported from the source region to a hemispheric level (e.g., from Canada to Central–Southern Europe as shown in [5,6,7]). Recently, the study in [8] showed that smoke is the most predominant aerosol type in Europe regarding long-range air mass transport.
BB aerosols are estimated to constitute to ~62% of the global particulate organic carbon (OC) and 27 % of black carbon (BC) emissions annually [9]; thus, they remain an important contributor to global particulate matter (PM) concentrations in the atmosphere affecting air pollution, radiative forcing, climate change, and the Earth’s biochemistry [10]. BC and OC aerosols have a 2–4 week mean lifetime in the free troposphere far from precipitating regions. It is estimated that they affect the radiation budget up to and above the layer in which they are embedded [11]. Additionally, when on ice, BC and OC can reduce its reflectance, enhancing glacial melting [11]. BB aerosols can affect cloud formation, acting as cloud condensation nuclei (CCN) or ice nuclei (IN), and change their optical properties [12,13].
Their impact on radiative forcing may be either a positive or negative impact on radiative forcing, depending on their OC and BC content, on their size, and on their spatial distribution in the atmosphere [14,15,16,17]. These properties are related to their source region, the combustion type and phase [17]. Specifically, fresh smoke aerosols have different optical properties than aged smoke and pure smoke ones and behave differently than mixed ones [18,19,20].
Thus, to better understand the BB aerosol effects on the Earth’s climate, their optical and microphysical properties are urgently needed to be measured with a very high spatio-temporal resolution. An ideal tool for such studies is the light detection and ranging (lidar) technique from which vertical profiles of the aerosol backscatter coefficient (baer), the extinction coefficient (aaer), the lidar ratio (LR), and the Ångström exponent (AE) can be extracted. From these products, the aerosol microphysical properties, such as the effective radius (reff), the volume density (vd), the real part (mR), and the imaginary part (mI) of the refractive index and the single scattering albedo (SSA) can also be derived.
There have been many studies concerning the vertical profiles of the optical and microphysical properties of BB aerosols over all continents using the lidar technique. Some of these studies were conducted with airborne flights of high spectral resolution lidar (HSRL) [21,22,23] and the UK’s Facility for Airborne Atmospheric Measurements (FAAM) aircraft [24], or with the space-borne lidar cloud–aerosol lidar with orthogonal polarization (CALIOP) system [7]. However, the majority of these studies concerned ground-based lidar measurements at different lidar sites: Japan [25]; Washington, DC [26]; South Africa [27]; the Amazon Basin [28]; over Europe (Athens [29], Thessaloniki [30,31], Granada [32], and Warsaw [5], as well as over Germany [19,33,34]).
More specifically, the work in [6], which studied different BB aerosols transported from Canada and observed over various European sites, revealed the wide range of BB optical properties depending on the type of burning area. Additionally, the work in [35] and [18] studied the modification of the physico-chemical properties of the BB aerosols along their transportation paths.
Recently, [36] published a study concerning a large number of BB lidar measurements from different lidar sites within the European Aerosol Lidar Network (EARLINET; https://www.earlinet.org/index.php?id=105, last access: 22 March 2021). Pure BB aerosols are not commonly found in the atmosphere, as they are usually mixed with other aerosol types (e.g., continental polluted, dust, marine; [27,37,38]). In fact, [20] highlighted the importance of well-knowing the source of the aerosols to better calculate their microphysical properties, since depending on particles’ shapes and sizes, different processes are followed in order to calculate their microphysical properties, with the lowest possible uncertainty
In this paper, we present for the first time a comprehensive study based on a 9-year data set (2011–2019) of multi-wavelength Raman lidar nighttime measurements obtained over Athens, Greece, from which we retrieved the vertical profiles of the optical and the microphysical properties of aged BB (pure and mixed) aerosols in different free tropospheric layers. The results derived from this study provide typical values of the BB aerosol properties over Europe, which may be useful in global climatic models, in reducing the currently large uncertainty in climate forcing due to this kind of aerosols. The total industrial era climate forcing of BC is estimated to be +1.1 Wm−2 with ~90% uncertainty bounds of 0.11–2.1 Wm−2. Of the total estimate of 1.1 Wm−2, up to 0.18 Wm−2 (with a large uncertainty range) is derived from effects of the cloud thermodynamic phase alone. Towards the elimination of this uncertainty range, the enhancement of the existing literature with relative studies is important. On top of that, here, we worked also on the classification of small and spherical particles (such as the biomass burning ones) into various sub-categories in different mixtures. We propose a new method for distinguishing between pure smoke and layers mixed with continental polluted aerosols. These aerosol layers are frequently observed over Europe due to the presence of anthropogenic pollution and are difficult to be discriminated due to the fact of their aerosol optical properties’ overlapping values. Finally, we provide a narrower range of mean values for the three aerosol categories.
The vertical profiles of the aerosol optical properties were retrieved using the single calculus chain (SCC) tool [39,40] in a homogeneous and quality-assured manner providing the values of LR at 355 and 532 nm, the AE extinction-related 355/532 coefficients as well as the AE backscatter-related 355/532 and 532/1064 coefficients. The aerosol characterization was based on a recently published study [38]. Finally, the aerosol microphysical properties reff, mR and mI, the vd, and the SSA at 355 nm, 532 nm, and 1064 nm of the BB layers were calculated according to [41]. Further details about the abovementioned methods are provided in the next sections.

2. Materials and Methods

The lidar data used in this study were obtained over the city of Athens at the suburban site of the National and Technical University of Athens (NTUA; 37.96° N, 23.78° E, elevation 220 m asl.) using the multi-wavelength elastic-Raman lidar system aerosol and ozone lidar system (EOLE; [42]) of the Laser Remote Sensing Unit (LRSU; http://lrsu.physics.ntua.gr/; last access: 26 March 2021) during the time period 2011–2019. During this period, the EOLE performed systematic measurements twice per week, every Monday and Thursday, except on rainy days, according to the European Aerosol Lidar Network (EARLINET) protocol [43]. From this large lidar data set, only the cloud-free nighttime data containing BB aerosol layers (and their mixtures) were selected and used here for aerosol classification and further data processing. For the former, the source classification analysis (SCAN) algorithm was used that requires the following input parameters: (a) the fire hot-spots (identified by MODIS), (b) the air mass back-trajectories (HYSPLIT), and (c) the aerosol layers (obtained by lidar) in order to classify the probed particles according to various criteria. After classifying our data set, we utilized the SCC code for the lidar data processing. Further information about the methodology pursued during this study is discussed in the following subsections.

2.1. Aerosol Classification—SCAN

The geometrical boundaries of the 34 aerosol layers studied in this work were extracted from the range-corrected lidar signals at 1064 nm, using the method described in [37]. This method identifies the vertical changes in the backscattered lidar signal at a given wavelength (for this study at 1064 nm) and extracts the aerosol vertical layering of the atmosphere. Using the geometrical characteristics of the aerosol layers retrieved from the abovementioned method, we then used the hybrid single particle Lagrangian integrated trajectory model (HYSPLIT; [44]) to locate the possible aerosol source regions, taking into account the height of the aerosol layers and their observation time over the measuring site (Athens). HYSPLIT is widely used in atmospheric studies, since it is able to provide spatial information (latitude, longitude, height) of any air mass of interest for a selected number of past hours. For this study, 8-day air mass backward trajectories were calculated using this model.
As collocated satellite measurements of the burnt areas, we used the moderate resolution imaging spectroradiometer (MODIS; [45]) Burnt Area product from the FIRMS Web Fire Mapper (https://firms.modaps.eosdis.nasa.gov/map/; last accessed: 26 March 2021) for the time period of the 8-day air mass backward trajectories starting from the day of each observation.
The SCAN algorithm was then used to classify the aerosol layers, as described in [38]. SCAN is an important contributor in classifying aerosol layers and especially those of smoke origin, because it applies strict rules concerning classification including the one that concerns the variable “confidence” of the fire product of MODIS, and only the fire dots with confidence levels higher than 80% are used. Additionally, the BSC-DREAM8b dust model ([46]; https://ess.bsc.es/bsc-dust-daily-forecast; last access: 26 March 2021) was implemented to effectively determine the dust aerosol load over the Athens lidar site.
Based on the abovementioned “tools” to characterize an aerosol layer, three different aerosol categories were, finally, obtained: (1) smoke (s), (2) smoke and continental polluted (s+cp), and (3) smoke and mixed dust (s+md). For instance, the smoke category [47] consists of aerosols containing mostly carbonaceous compounds (OC, EC), PAHs, and NH4+; the continental polluted particles [48] mostly contain a mixture of trace elements (Cd, Cr, Cu, Mn, Pb, V, Zn, Te, Co, Ni, Se, Sr, As, and Sb) and water-soluble ions (Cl, NO3, SO2, Na+, K+, Ca2+, Mg2+); the mixed dust category [49] contains a mixture of minerals (Si, Al, Ca, Mg, Fe, K). However, no additional information is available about “pure” aerosol categories, such as continental polluted and mixed dust, as these categories were not examined in this study.

2.2. Aerosol Optical Properties Retrieval—SCC

The lidar data processing was performed by the automated SCC tool [39,40] that enables near real-time lidar data processing. The lidar signals were averaged over a 60 s time period considering stable atmospheric conditions, as much as possible. The atmospheric stability was validated through the observation of the spatio-temporal evolution of the range-corrected lidar signals.
Regarding the value of the LRs (LR = aaer/baer) used for calculating the elastic baer at 1064 nm vertical profiles by the SCC, a constant LR was assumed [50,51]. In fact, the LR value can vary greatly depending on the shape and size of the backscattering particles and, therefore, on the aerosol mixing processes [52]. In this study, the smoke and mixed dust category were expected to have optical properties intermediate to those presented by the dust and smoke and/or urban pollution aerosols and/or marine with LR values in the range of 30–71 sr [53]. For this reason, in this study, an LR mean value of 50 ± 15 sr was assumed for calculating the elastic baer value of this category. The LR of the smoke aerosols can also vary greatly between 26 and 93 sr [23,33] depending on the aging of the aerosols; thus, for fresh smoke, the LR ranged between 33 and 46 sr, although aged smoke presented greater values (55–73 sr) [54]. In this study, for long-range transport of smoke aerosols, a constant LR value equal to 60 ± 15 sr was assumed. Finally, for the smoke and continental polluted category an LR value of 60 ± 15 sr was assumed according to [23,54], which reported LR ranges between 33 and 72 sr for urban aerosols. In this study, only nighttime lidar measurements were used; thus, the calculation of aaer and baer at 355 nm and 532 nm was performed independently by the Raman technique [55].
As the lidar data in this work were processed by the SCC, the propagation of the errors arising from the calculation of baer and aaer can be found in [39,40], where a total uncertainty of ~5–15% and ~10–25%, respectively, was estimated. Therefore, the corresponding uncertainty of the retrieved LR values was of the order of 11–30%, while the uncertainty for AE backscatter- and extinction-related ranged between 0.02 and 0.04 and 0.03 and 0.08, respectively, as estimated by propagation error calculations.

2.3. Aerosol Microphysical Properties Retrieval

The particle microphysical properties, reff, mR and mI, vd and the SSA can be estimated when the aerosol vertical profiles of three backscattering and two extinction coefficients (the so-called 3β + 2α data set) are available by a Mie–Raman lidar system based on a three-wavelength (355–532–1064 nm) emitting Nd:YAG laser. Thus far, different techniques have been considered to invert these measurements into particle microphysics ([41,56] and references therein), but the main issue in all these approaches is the small number of inputs that can be provided through measurements, compared to the numerous parameters needed for describing the aerosol microphysical properties. This implies that the inverse problem is underdetermined and that numerous solutions may reproduce the input measurements with similar accuracy.
This family of solutions can be localized by applying constraints to the “search space”, e.g., limiting the range of particle radii and refractive indices considered [41,57]. Such an approach has proved to be efficient for the aerosols with a predominant fraction of fine particles, so it is widely used for the analysis of smoke lidar observations [26]. An additional assumption usually made is that the refractive index is spectrally independent. Actually, smoke particles can demonstrate an increase in absorption in UV and at the shorter wavelengths in the visible due to the presence of the “brown carbon” fraction. However, the spectral properties of this fraction are not well known and remain highly variable, so at the moment, we do not take into consideration these effects.
To invert the lidar observations into the aerosols’ microphysical properties, the regularization algorithm was used [41]. As the BB particles are rather small, the effects related to the particle non-sphericity were not considered and the inversion was made taking into consideration the assumption of a spherical particle shape. The boundary of the inversion window was set to minimum and maximum particle radii of 0.05 and 10 μm, respectively. The mR was allowed to vary in the range 1.35–1.65, while the mI varied in the range 0–0.02 i. Based on numerous simulations and comparisons of inversion with AERONET observations, we estimated the uncertainty of particle vd and reff to be below 25%. For the mR, this uncertainty was ±0.05, while for the mI the uncertainty was approximately 50%.

3. Results

According to the lidar data selection and the classification procedure described in the previous section, we revealed 34 aerosol layers in the time period 2011–2019, which were sorted into three different aerosol categories: smoke (s), smoke and continental polluted (s+cp), and smoke and mixed dust (s+md) (Figure 1, blue, red, and yellow colors, respectively). All aerosol layers correspond to nighttime lidar measurements, thus from all these layers the full set of aerosol optical properties is provided (baer, aaer, LR, AE).

3.1. General Observations

In particular, these 34 aerosol layers were spread between the years 2011 and 2019, with the majority of the aerosol layers observed in 2014 (eight layers) and the minority in 2013, when no aerosol layers were found according to our methodology. Additionally, aerosol layers from all the three aerosol categories were found during the years 2011, 2012, and 2014, while at least two aerosol categories were found in the years 2015, 2016, 2017, and 2019. The aerosol layers observed during 2018 were only from one aerosol category (Figure 1a). Subsequently, out of the 34 aerosol layers in this study, 18% were characterized as s, 29% as s+cp, and 53% as s+md (Figure 1b). More information about the aerosol layers can be found in Table A1 presented in Appendix A.

3.2. Aerosol Optical and Microphysical Properties

After retrieving the vertical profiles of the aerosol optical properties, we calculated the mean values of baer, aaer, LR, AE, and the ratio of the LRs (LR532/LR355), within the geometrical boundaries of each aerosol layer, as well as the mean values of these properties for each aerosol category. These values are presented in Figure 2 along with their standard deviations.
As observed in Figure 2a, the baer of the s+cp category (square symbol) had higher mean values in all three wavelengths compared to the corresponding mean values of the other two aerosol categories, while accordingly, the s category (circle symbol) had the lower mean values. The same behavior was reported for the aaer in Figure 2b for the different aerosol categories. Concerning the LR values reported in Figure 2c, they are higher at 532 nm (green color) than at 355 nm (blue color) for all aerosol categories, while for the s+md category (diamond symbol), a great difference of 24 sr was observed between the two wavelengths (38 ± 9 sr at 355 nm and 62 ± 14 sr at 532 nm). Additionally, the higher values were reported for the s category (circle symbol): 57 ± 10 sr at 355 nm and 73 ± 11 sr at 532 nm. The AE backscatter-related mean values reported in Figure 2d were all higher than one for the aerosol categories s and s+cp (Figure 2d, circle and square, respectively). The AE extinction-related values of the s+md category (Figure 2d, blue diamond) showed a lower mean value and a larger standard deviation (0.5 ± 0.3). Finally, the ratio LR532/LR355 (Figure 2e) was observed to be >1 for all of the aerosol categories. The mean values of the retrieved optical properties are summarized in Table 1.
The classification algorithm used in this study, which is described in [38], was also able to retrieve the resident time (i.e., number of hours) of a HYSPLIT backward trajectory above a burned area. This information versus the variable LR532/LR355 for each aerosol layer of s and s+cp categories is presented in Figure 3. Concerning the s aerosol category, the LR532/LR355 variable increased as the number of hours over the burned areas increased, resulting in a high correlation between these two variables (correlation coefficient R2 = 0.82). On the other hand, the corresponding correlation coefficient for the s+cp category was extremely low (equal to 0.01) thus showing no correlation at all between the two variables for this aerosol category.
The mean values of the aerosol microphysical properties (i.e., reff, mR and mI, vd, and SSA) at three different wavelengths, calculated according to [41], can be found in Figure 4. No significant differences within the error bars were observed between the mean values of each one of them, for the three different sub-aerosol categories of this study, except the vd mean value of the s+cp aerosol category (Figure 4d, square symbol), which found to be slightly higher compared to the rest of the categories. Finally, the mean values of SSA at 532 nm were slightly larger than the mean values of SSA at 355 nm and 1064 nm, although when considering the corresponding standard deviations, this difference was negligible. The mean values of the aerosol microphysical properties along with their standard deviations are also summarized in Table 1.
According to Table 1, the mean LR values of 57 ± 10 sr and 73 ± 11 were observed for the s category at 355 nm and 532 nm, respectively. The corresponding LR values of the s+cp category were 51 ± 5 sr and 59 ± 10 sr, respectively, while for the s+md category they were equal to 39 ± 5 sr and 62 ± 12 sr, respectively. The AE backscatter-related mean values were all higher than 1.4. On the other hand, the AE extinction-related coefficient, especially for the s+md category, had a significantly low mean value (0.49 ± 0.88). The ratio of the LRs (LR532/LR355) was found >1 for all cases.
The mean values of the aerosol microphysical properties had no noticeable differences between the various aerosol categories, except the vd property (20.7 ± 14.1 μm−3cm−3) for the s+cp category, which was found to be ~100% greater than the corresponding mean values for the s and s+md categories (8.6 ± 3.2 μm−3cm−3 and 9.7 ± 6.1 μm−3cm−3, respectively). On the other hand, the mean value of reff was found to be 0.24 ± 0.14 μm for all aerosol categories, the mean value of mR ranged between 1.49 ± 0.06 and 1.53 ± 0.07, and the mI value ranged between 0.0108 ± 0.0048 i and 0.0126 ± 0.0043 i. Finally, the mean value of SSA (at all three wavelengths 355, 532, and 1064 nm) ranged between 0.915 ± 0.045 and 0.936 ± 0.024.

4. Discussion

As observed in Figure 2b, the aaer of the s+cp category (square symbol) had higher mean values in all three wavelengths compared to the corresponding mean values of the other two aerosol categories, while, accordingly, the s category (circle symbol) had the lower mean values. This behavior indicates amplified scattering mechanisms for the s+cp aerosols and less for the s aerosols.
The AE backscatter-related mean values, reported in Figure 2d, were all higher than one for the aerosol categories s and s+cp (Figure 2d, circle and square, respectively) indicating the presence of smaller particles. The AE extinction-related coefficient of the s+md category (Figure 2d, blue diamond) showed a lower mean value and a large standard deviation (0.5 ± 0.3) indicating the presence of larger aerosols as well in this category [35].
The mean value of LR at 532 nm for all aerosol categories was higher than the corresponding value at 355 nm in accordance with [19,34,35]. Additionally, the ratio of the LRs at the two wavelengths (LR532/LR355) was found >1 for all particles inside the observed layers which, according to [18], indicate the presence of aged smoke particles, thus supporting also our classification methodology, which also marked as aged all aerosol layers in this study.
Finally, all the calculated mean values of aerosol optical properties were found to be consistent with those reported in the literature for the s [24,28,31,34,38,39] and s+md [33,41] particle categories.
Concerning the microphysical properties, no significant differences were observed between their mean values with respect to the aerosol classification performed. Nevertheless, without taking into account the high retrieval uncertainty, some differences in the mR and mI of the refractive index could be identified. The highest mI for the s category clearly denoted the high absorptivity of the pure aerosol type, while for the mixture of various other types with dust, the scattering effect became more prominent. Notice, also, that during the inversion process, the effects related to the particle non-sphericity were not considered and the inversion was made with the assumption of a spherical particle shape, since the main component studied here was biomass burning particles which are rather small.
Concerning the reff, Figure 4 does not reflect clearly the variability of this property per case, because the information is lost when averaging within each category. Nevertheless, for completeness, we provide Figure A1 in Appendix A, where we demonstrate the case-by-case variability of the reff, showing that for our data set, this property took values from 0.11 to 0.52 μm.
High discrepancy per aerosol cluster was identified for the vd mean values, taking a maximum under the s+cp aerosol category (Figure 4d, square symbol), something that can be attributed to the low atmospheric heights (Table A1 of the Appendix A) of the observed layers of that specific type [26].
Finally, all aerosol microphysical properties retrieved in this study were compared to those reported in the literature and found to be in good accordance with them [5,17,18,19,22,25,27,28,30,34,35,59,60]. However, comparing our results to those in the literature can be misleading because the latter might reflect factors different from what is found over Athens.
It is important to note that the microphysical properties of the s+cp aerosol category and the corresponding values of SSA at UV and IR are the first to be introduced into the literature within this study, since so far no report of such a combined aerosol mixture can be found. Here, it seems that this mixture has to be taken into account when trying to discriminate between small and spherical particles.

5. Conclusions

Summarizing this work:
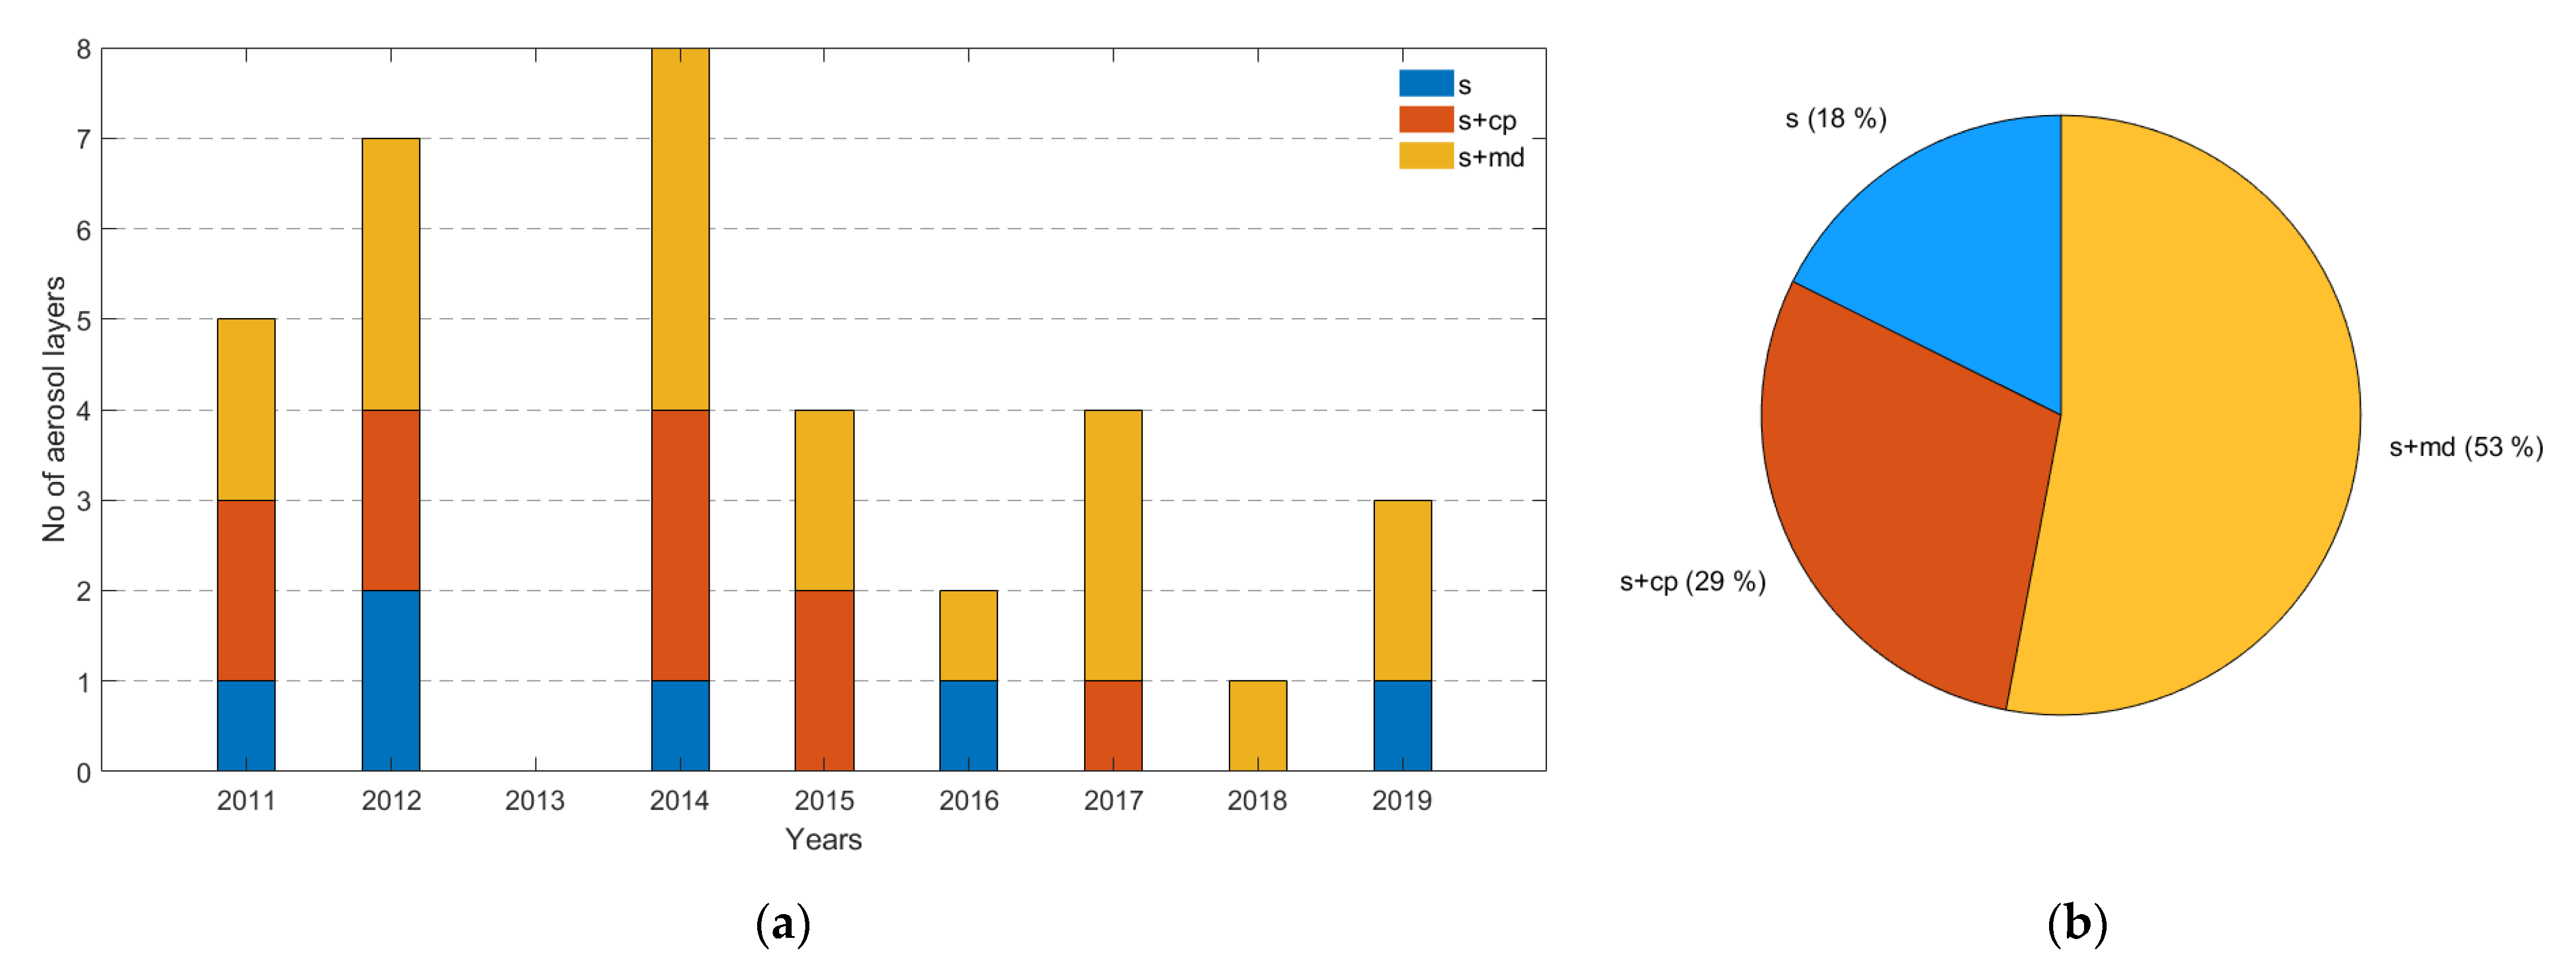
  • We studied 34 aerosol layers derived from multiwavelength (3β + 2α) lidar data measured over a 9-year period (i.e., 2011–2019) over the city of Athens at the suburban site of the National and Technical University of Athens;
  • We obtained the following three aerosol categories: smoke, smoke + continental polluted, and smoke + mixed dust. The smoke category consisted mostly of aerosols containing carbonaceous compounds; the continental polluted particles mostly contained a mixture of trace elements and water-soluble ions, and the mixed dust category contained a mixture of minerals;
  • We retrieved the optical and microphysical properties of BB aerosols and their mixtures.
We found:
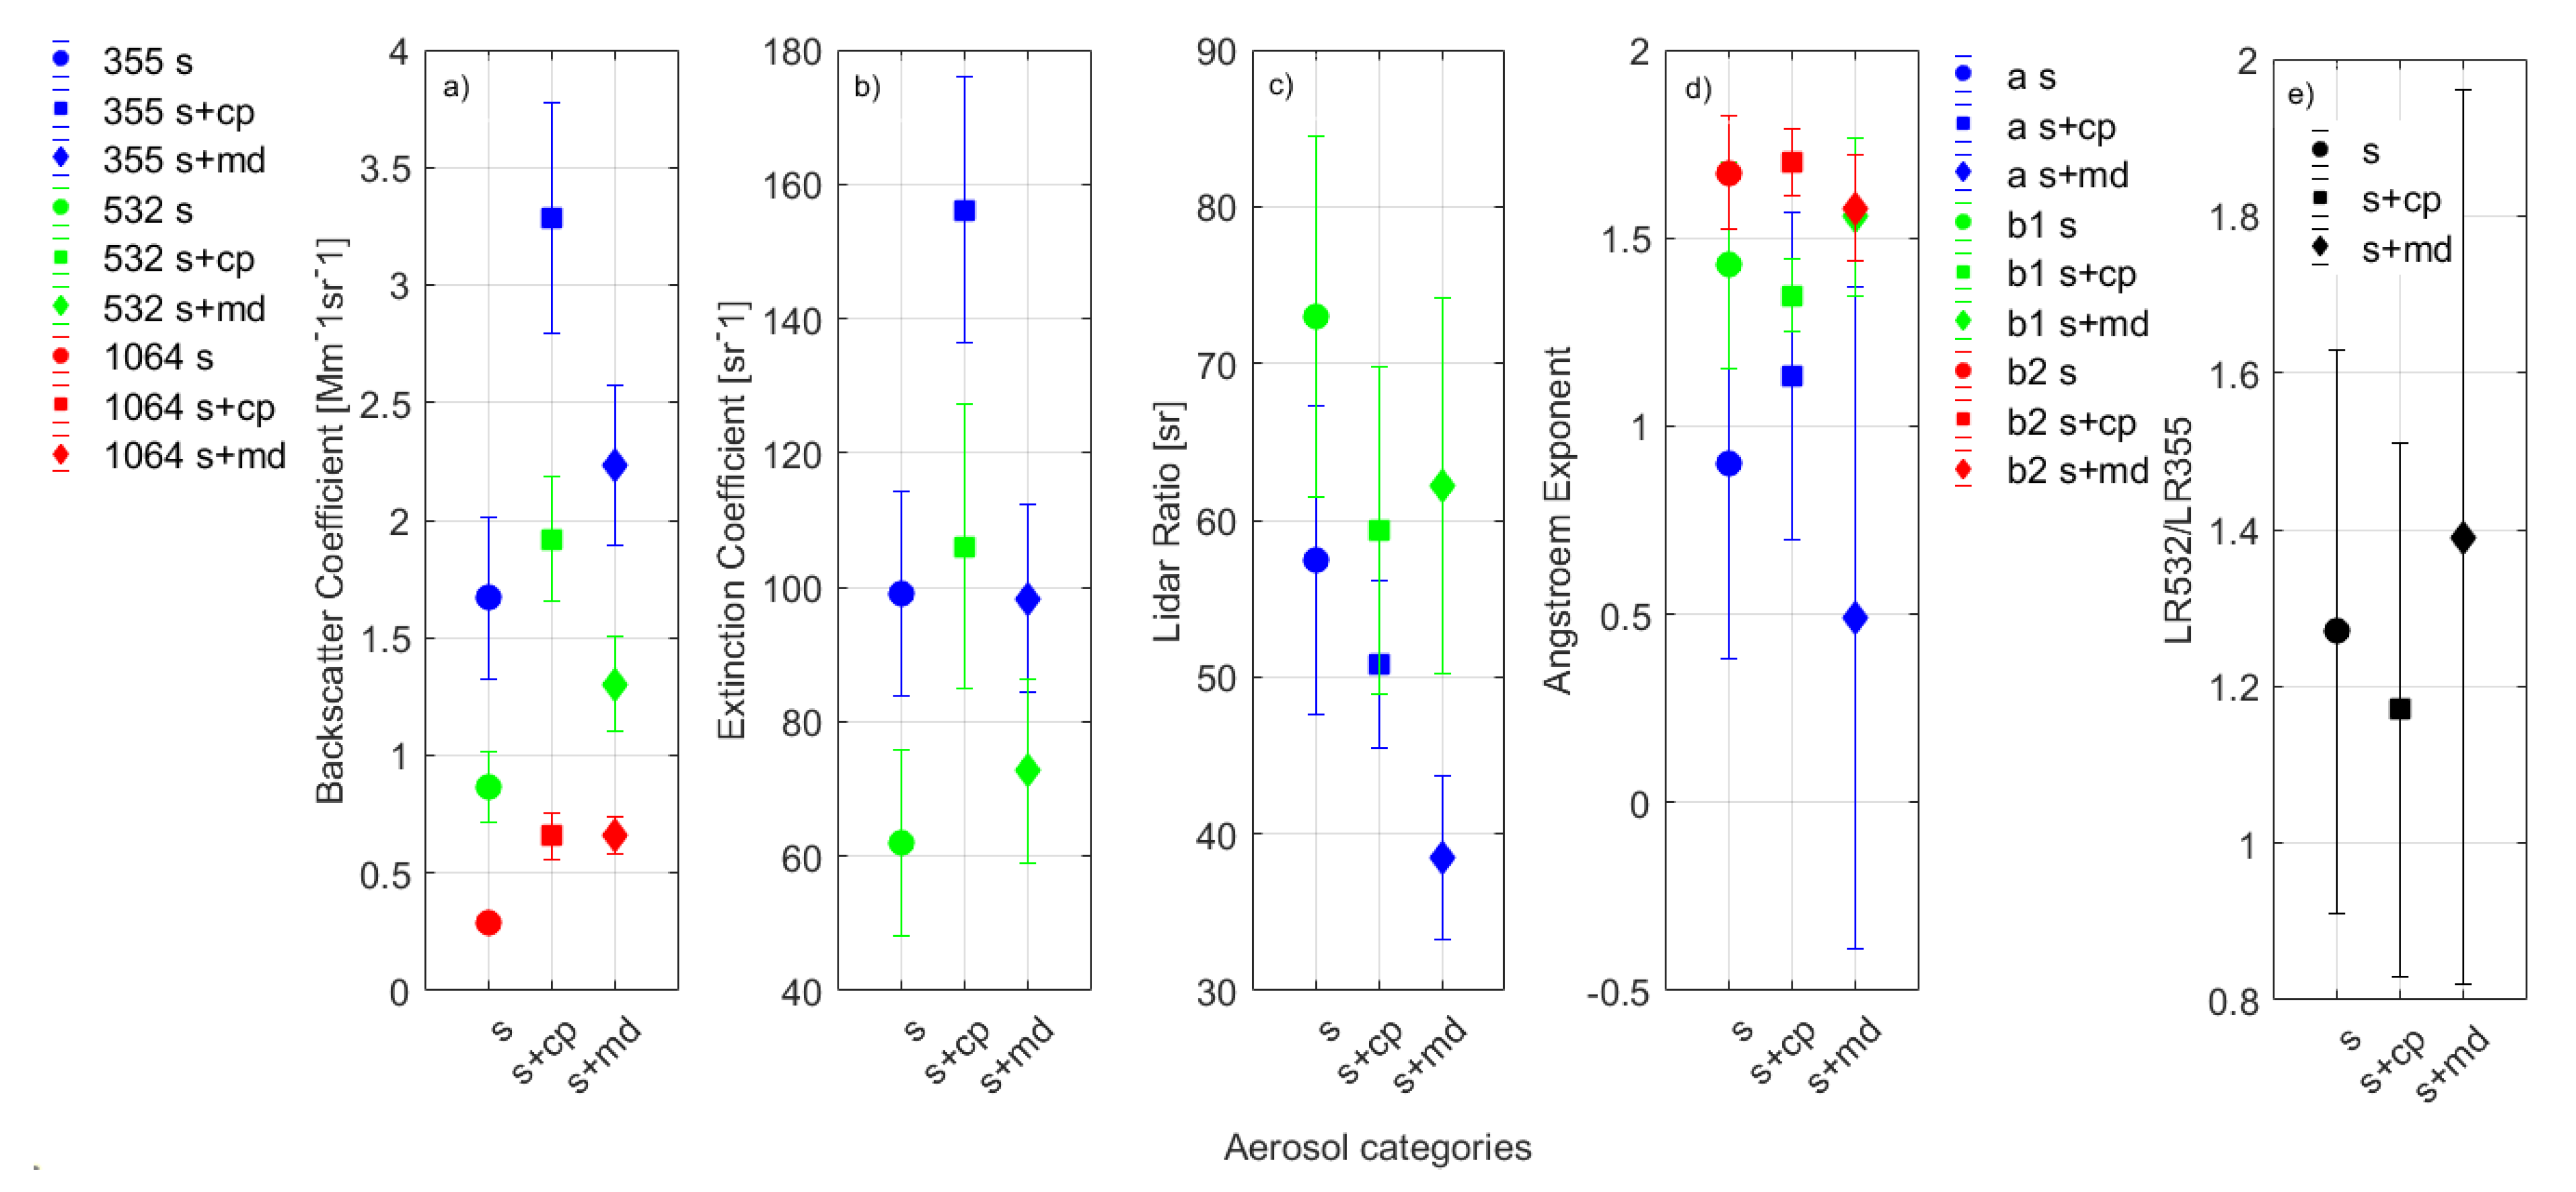
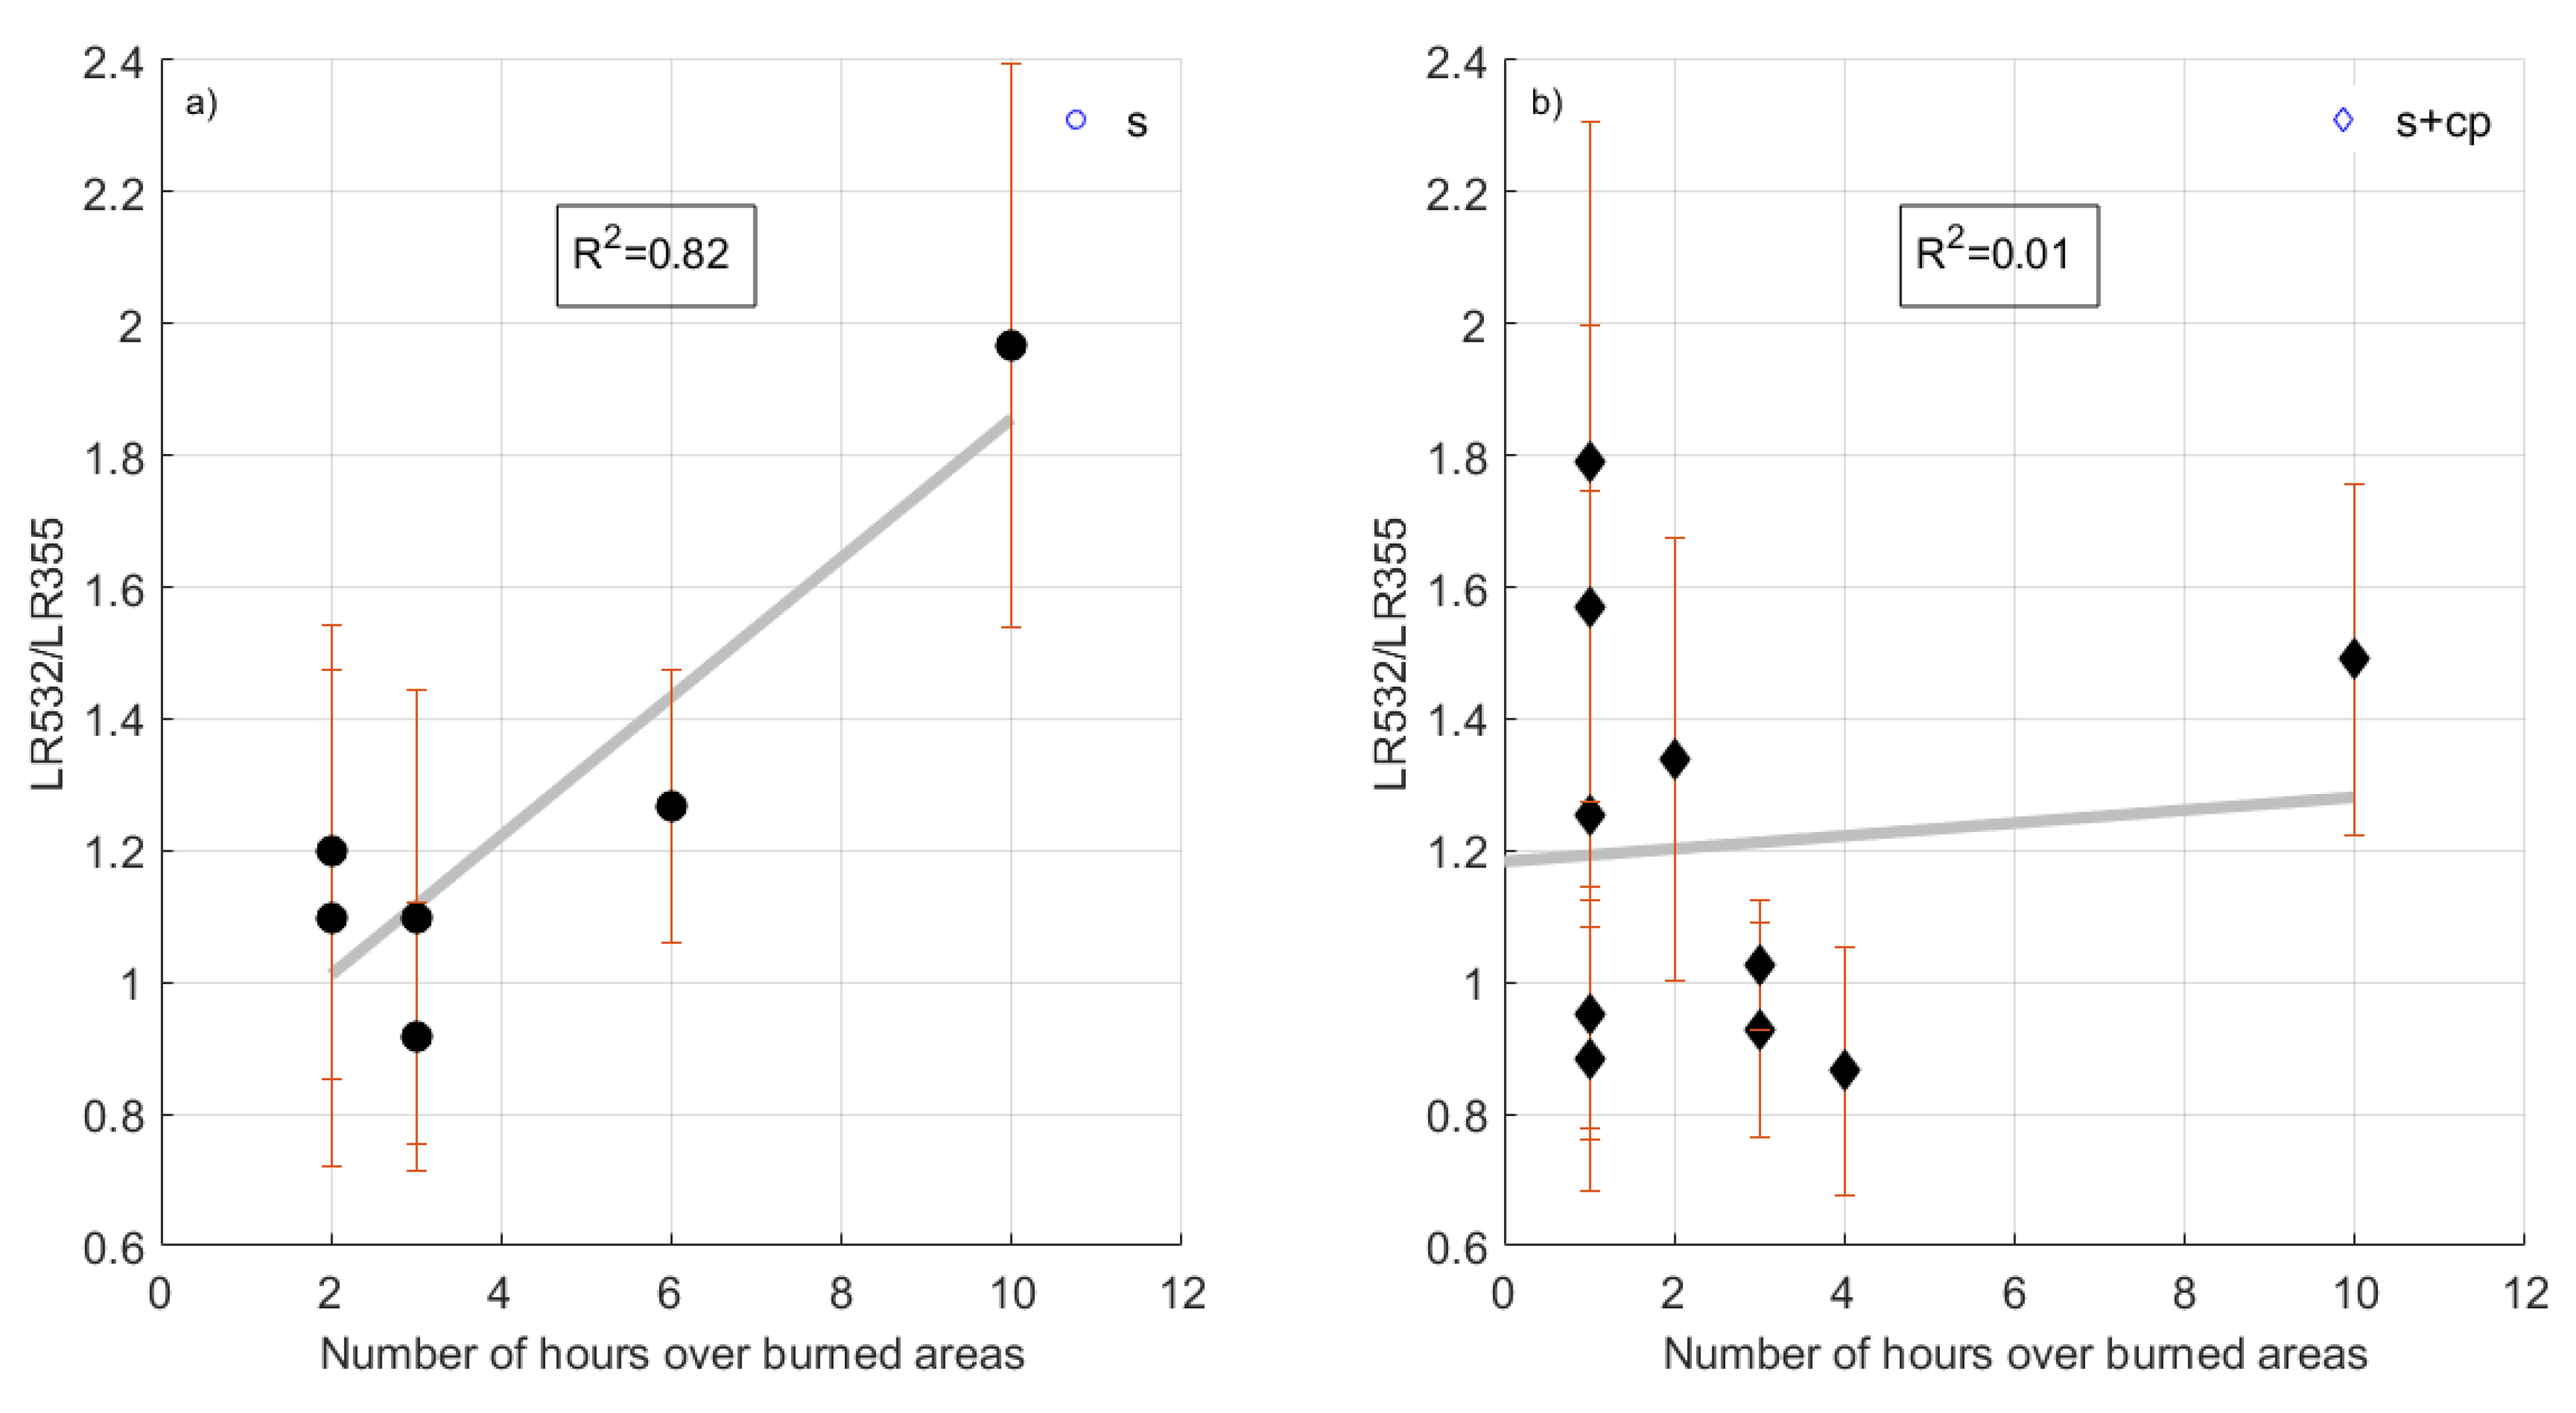
  • A positive correlation between the LR532/355 variable and the time that the air mass had spent over the burned area for the s aerosol category, which seems not to be the case for the s+cp category;
  • Higher LR mean values at 532 nm than 355 nm;
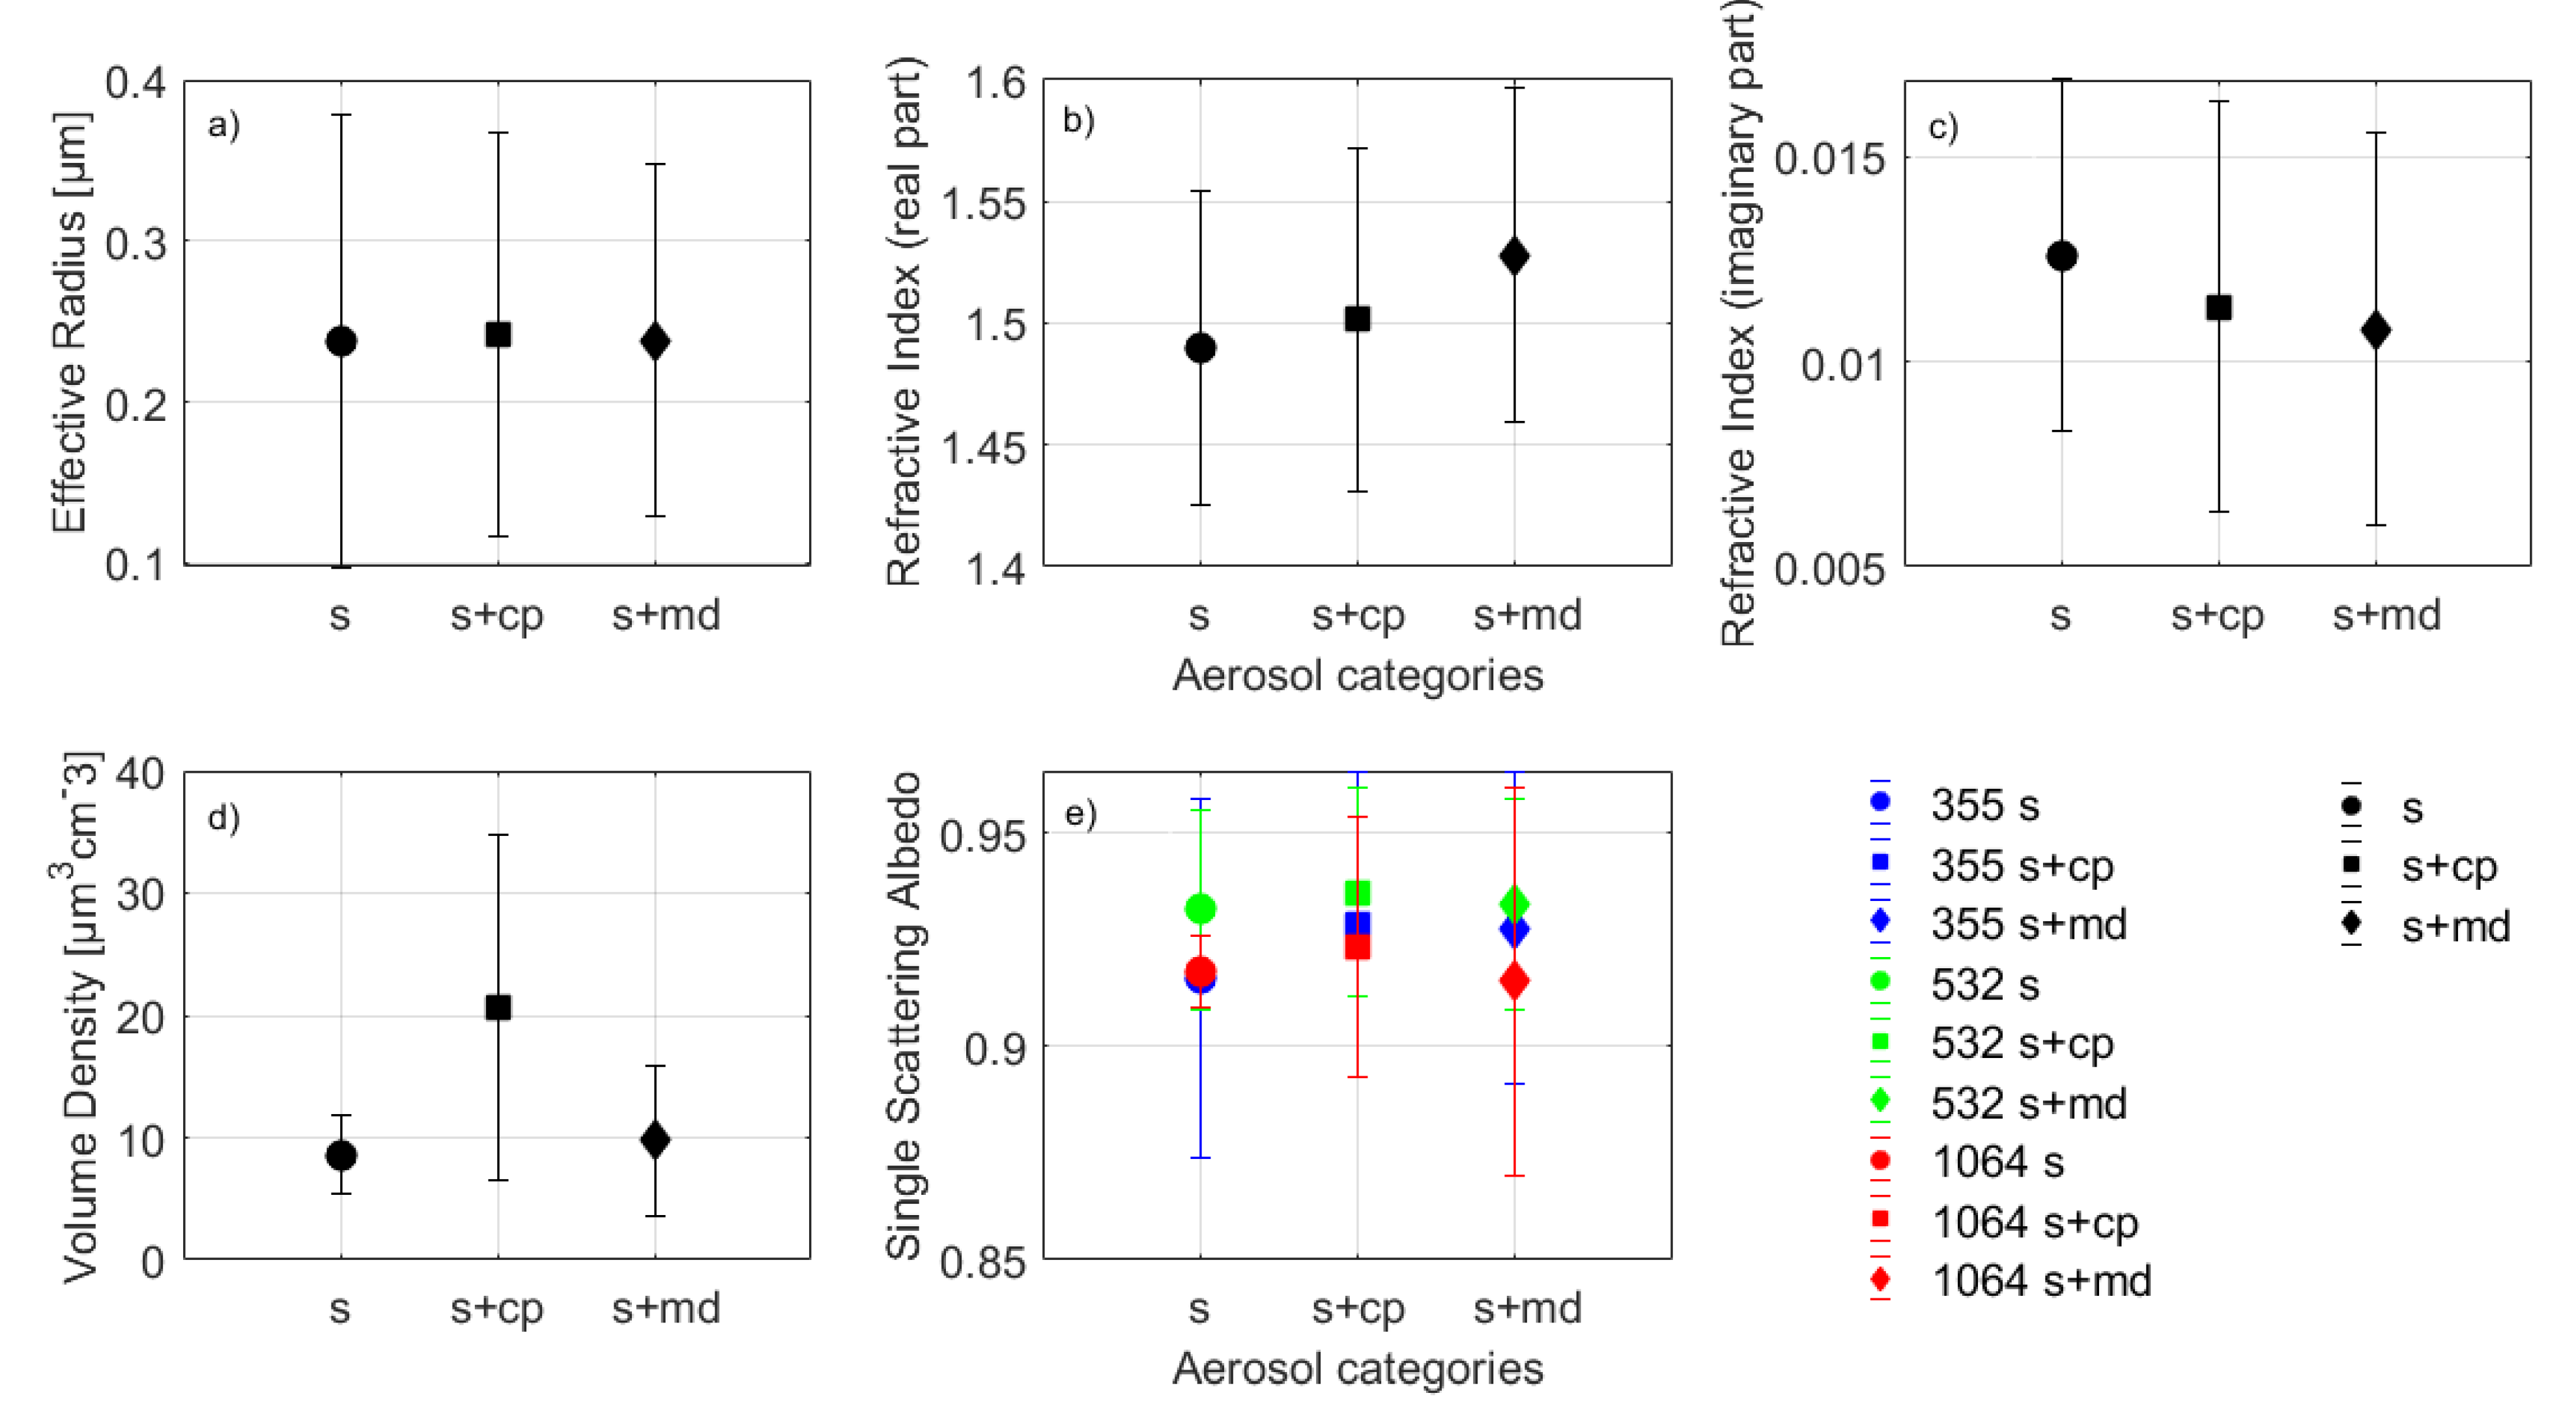
  • High discrepancy per aerosol cluster for the vd mean values, taking a maximum under the s+cp aerosol category;
  • The microphysical properties of the s+cp aerosol category and the corresponding values of SSA at UV and IR are the first to be introduced into the literature with this study.
In the future:
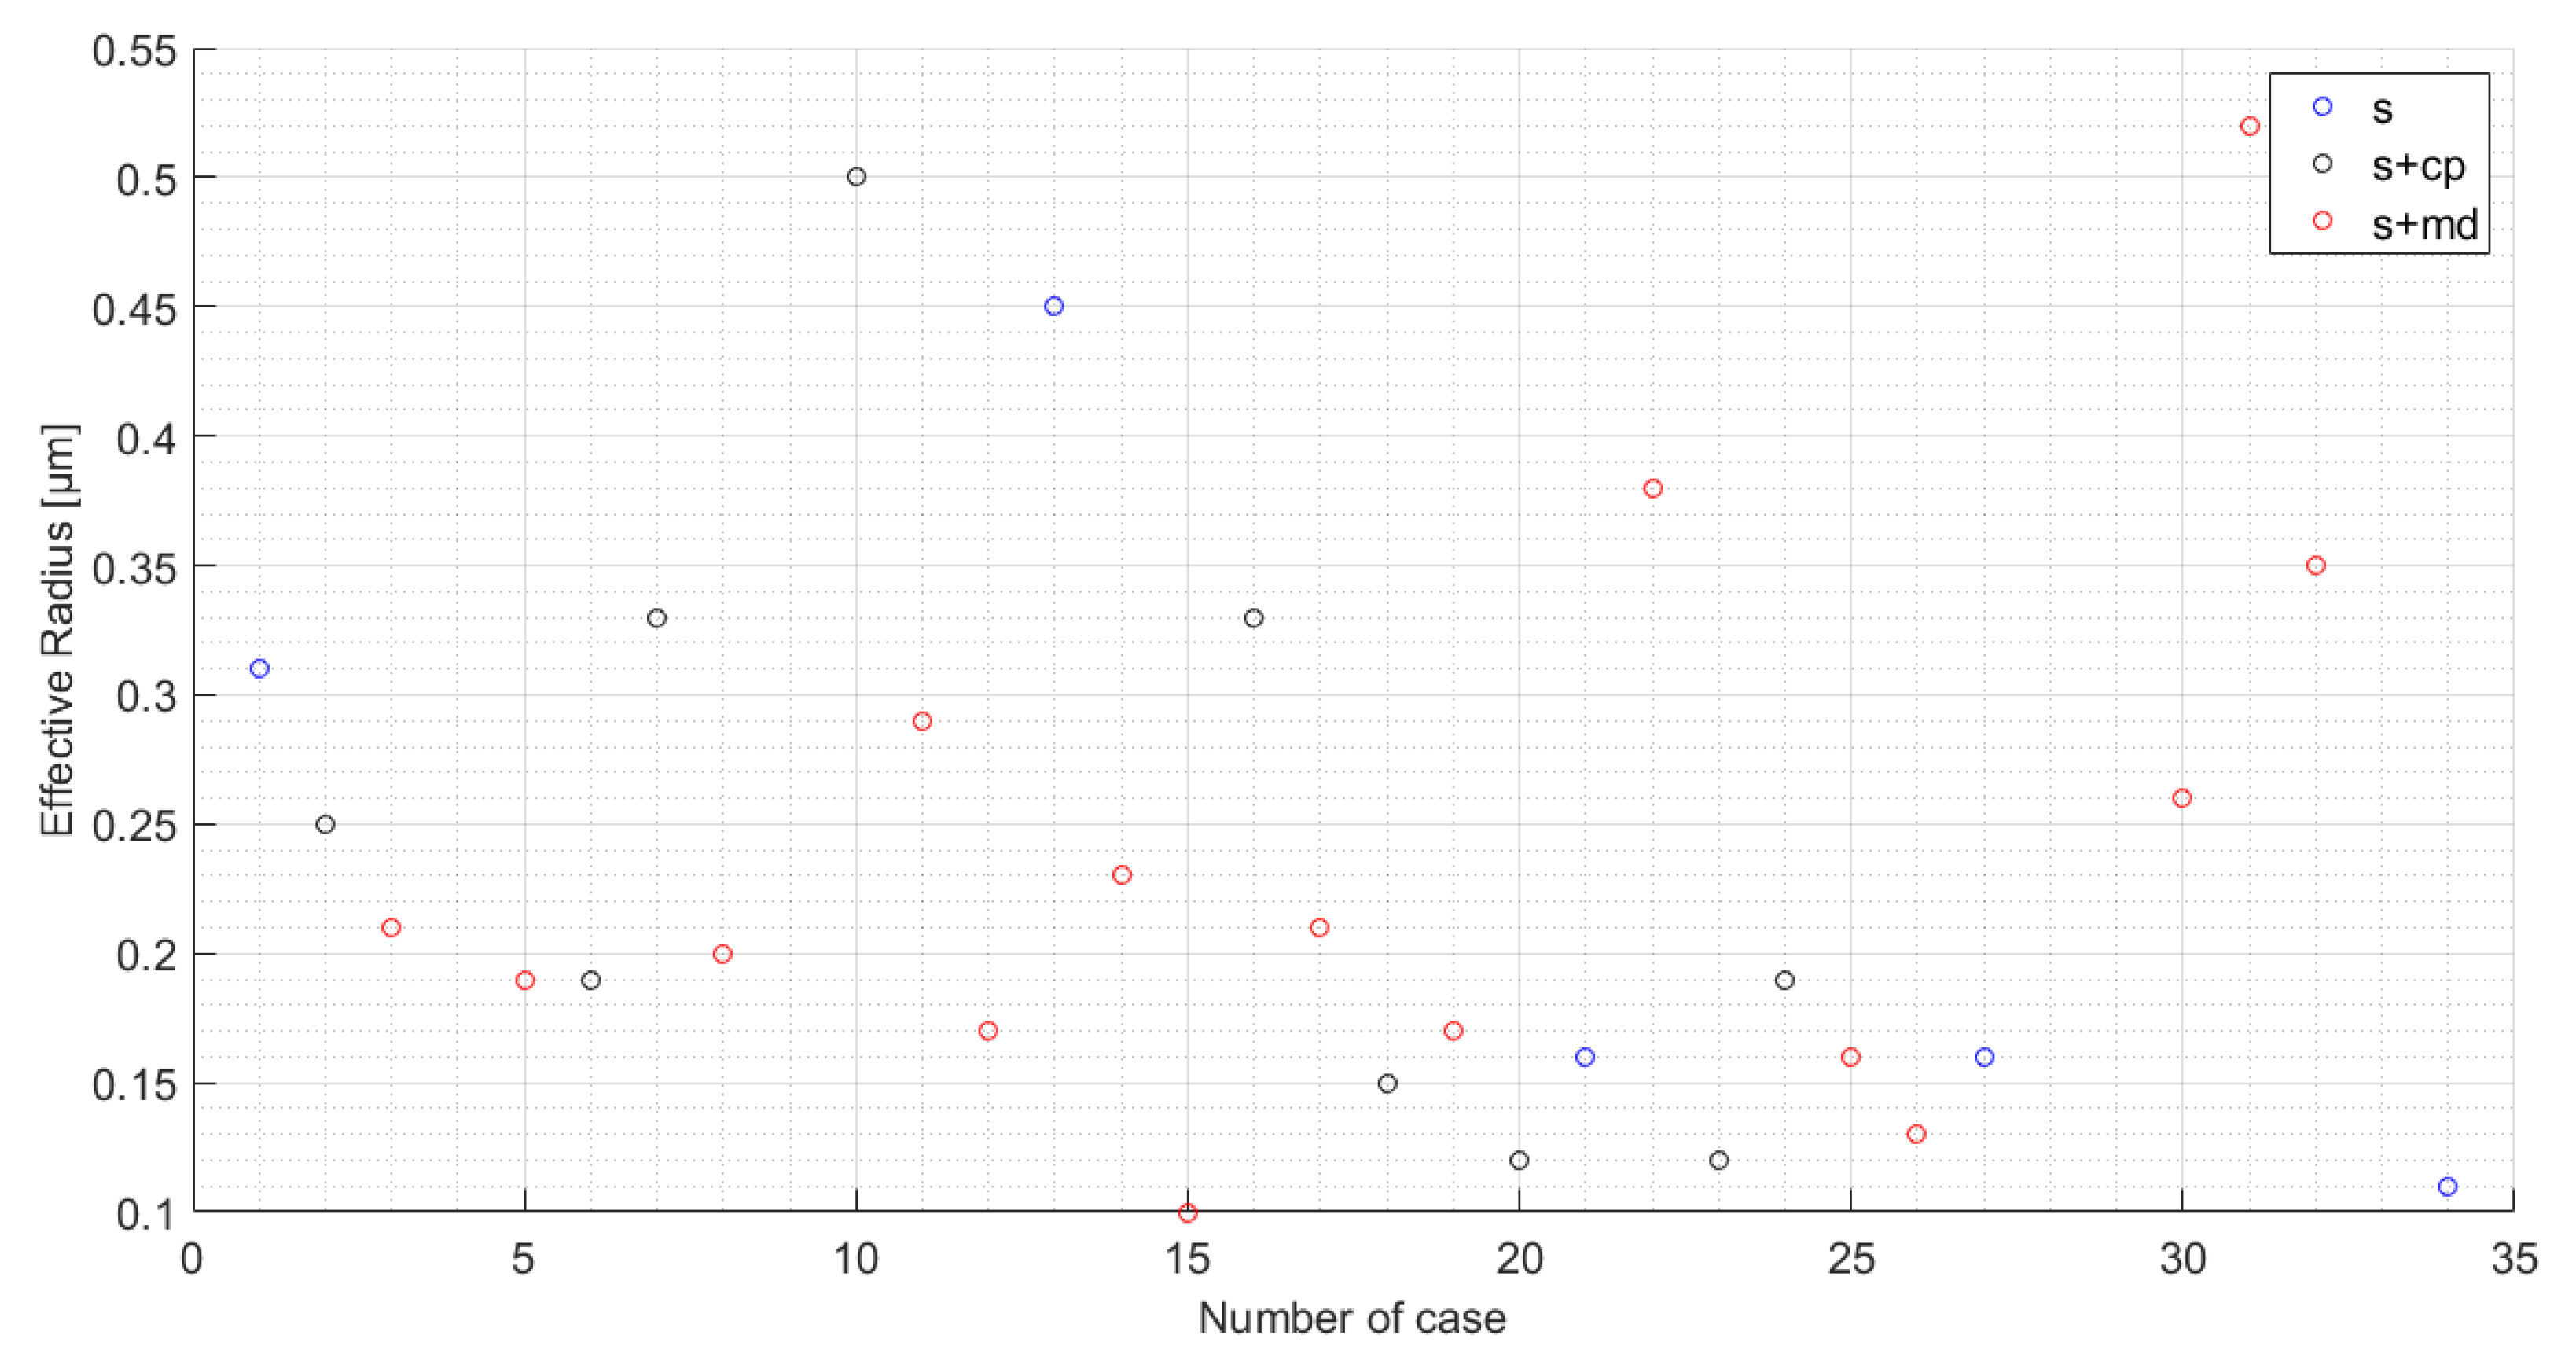
  • It is important to have as large data set as possible in order to have statistically valid results;
  • The non-sphericity of the aerosols in a mixture must be taken into consideration during the retrieval of microphysical aerosol properties;
  • The uncertainties of the SCAN algorithm should be examined.

Author Contributions

Conceptualization, M.M. and A.P.; Data curation, M.M. and I.V.; Formal analysis, M.M. and I.V.; Investigation, M.M.; Methodology, M.M.; Project administration, M.M. and A.P.; Software, M.M. and I.V.; Supervision, M.M. and A.P.; Validation, M.M.; Visualization, M.M. and A.P.; Writing—original draft, M.M. and D.A.; Writing—review and editing, M.M., A.P., D.A., I.V., C.-A.P., P.K., O.S., R.F., M.G. and E.K. All authors have read and agreed to the published version of the manuscript.

Funding

This research received no external funding.

Data Availability Statement

The aerosol lidar profiles used in this study are available upon registration from the EARLINET web page at https://data.earlinet.org/earlinet/login.zul, accessed on 25 September 2021.

Acknowledgments

The research work was supported by the Hellenic Foundation for Research and Innovation (HFRI) under the HFRI PhD Fellowship grant (Fellowship Number: 669). We also acknowledge the support of this work by the project “PANhellenic Infrastructure for Atmospheric Composition and Climate Change” (MIS 5021516) that is implemented under the Action “Reinforcement of the Research and Innovation Infrastructure” funded by the Operational Programme “Competitiveness, Entrepreneurship and Innovation” (NSRF 2014–2020) and co-financed by Greece and the European Union (European Regional Development Fund). Moreover, the authors acknowledge support through ACTRIS under grand agreement no. 262 254 of the European Commission Seventh Framework Programme (FP7/2007–2013) and ACTRIS-2 under grant agreement no. 654109 from the Horizon 2020 Research and Innovation Program of the European Commission. The authors gratefully acknowledge the NOAA Air Resources Laboratory (ARL) for the provision of the HYSPLIT transport and dispersion model and the READY website (http://www.ready.noaa.gov; last access: 25 September 2021) used in this publication. We acknowledge the use of data products or imagery from the Land, Atmosphere Near real-time Capability for EOS (LANCE) system operated by NASA’s Earth Science Data and Information System (ESDIS) with funding provided by NASA Headquarters. Development of lidar retrieval algorithm was supported by the Russian Science Foundation under project 21-17-00114.
Remotesensing 13 03877 i001

Conflicts of Interest

The authors declare no conflict of interest.

Appendix A

Table A1. Date, bottom, top, and aerosol category of each aerosol layer of this study.
NoDateBottomTopAerosol Category
12011051630623542s
92012032624023182s
132012102522822522s
212014090134223902s
272016091530023242s
342019090925223062s
22011063015021922s+cp
62011091514422042s+cp
72012031516222042s+cp
102012040614422102s+cp
162014052310822042s+cp
182014062213822102s+cp
202014072413221622s+cp
232015071324022882s+cp
242015072713822222s+cp
282017071013821922s+cp
32011072815621802s+md
122012091921623482s+md
302017082823422942s+md
112012061214421982s+md
312017091116224682s+md
332019082613823962s+md
52011090917422042s+md
82012032214421802s+md
172014061712623242s+md
292017072414422942s+md
352019102916822282s+md
142014051716821862s+md
152014052012022102s+md
192014071713821742s+md
222015021914421562s+md
252015072716222222s+md
262016070415621982s+md
322018091322222762s+md
Figure A1. Effective radius (μm) for the s (blue), s+cp (black), and s+md (red) aerosol layers, numbered as shown in Table A1 in Appendix A.
Remotesensing 13 03877 g0a1

References

  1. Xu, B.; Cao, J.; Hansen, J.; Yao, T.; Joswia, D.R.; Wang, N.; Wu, G.; Wang, M.; Zhao, H.; Yang, W.; et al. Black soot and the survival of Tibetan glaciers. Proc. Natl. Acad. Sci. USA 2009, 106, 22114–22118. [Google Scholar] [CrossRef] [Green Version]
  2. Gautam, S. COVID-19: Air pollution remains low as people stay at home. Air Qual. Atmos. Health 2020, 13, 853–857. [Google Scholar] [CrossRef] [PubMed]
  3. Montgomerie, R.D. The Structural and Elemental Composition of Inhaled Particles in Ancient Egyptian Mummified Lungs; The University of Manchester: Manchester, UK, 2012; p. 269. [Google Scholar]
  4. Seinfeld, J. Air Polution: Physical and Chemical Fundamentals; McGraw-Hill: New York, NY, USA, 1975; ISBN-10 0070560420; ISBN-13 978-0070560420. [Google Scholar]
  5. Janicka, L.; Stachlewska, I.S.; Veselovskii, I.; Baars, H. Temporal variations in optical and microphysical properties of mineral dust and biomass burning aerosol derived from daytime Raman lidar observations over Warsaw, Poland. Atmos. Environ. 2017, 169, 162–174. [Google Scholar] [CrossRef]
  6. Baars, H.; Ansmann, A.; Ohneiser, K.; Haarig, M.; Engelmann, R.; Althausen, D.; Hanssen, I.; Gausa, M.; Pietruczuk, A.; Szkop, A.; et al. The unprecedented 2017–2018 stratospheric smoke event: Decay phase and aerosol properties observed with the EARLINET. Atmos. Chem. Phys. 2019, 19, 15183–15198. [Google Scholar] [CrossRef] [Green Version]
  7. Papanikolaou, C.A.; Giannakaki, E.; Papayannis, A.; Mylonaki, M.; Soupiona, O. Canadian biomass burning aerosol properties modification during a long-ranged event on August 2018. Sensors 2020, 20, 5442. [Google Scholar] [CrossRef]
  8. Nicolae, V.; Talianu, C.; Andrei, S.; Antonescu, B.; Ene, D.; Nicolae, D.; Dandocsi, A.; Toader, V.-E.; Ștefan, S.; Savu, T.; et al. Multiyear Typology of Long-Range Transported Aerosols over Europe. Atmosphere 2019, 10, 482. [Google Scholar] [CrossRef] [Green Version]
  9. Wiedinmyer, C.; Akagi, S.K.; Yokelson, R.J.; Emmons, L.K.; Al-Saadi, J.A.; Orlando, J.J.; Soja, A.J. The Fire INventory from NCAR (FINN): A high resolution global model to estimate the emissions from open burning. Geosci. Model. Dev. 2011, 4, 625–641. [Google Scholar] [CrossRef] [Green Version]
  10. Pan, X.; Ichoku, C.; Chin, M.; Bian, H.; Darmenov, A.; Colarco, P.; Ellison, L.; Kucsera, T.; Da Silva, A.; Wang, J.; et al. Six global biomass burning emission datasets: Intercomparison and application in one global aerosol model. Atmos. Chem. Phys. 2020, 20, 969–994. [Google Scholar] [CrossRef] [Green Version]
  11. Mahowald, N.; Ward, D.S.; Kloster, S.; Flanner, M.G.; Heald, C.L.; Heavens, N.G.; Hess, P.G.; Lamarque, J.F.; Chuang, P.Y. Aerosol impacts on climate and biogeochemistry. Annu. Rev. Environ. Resour. 2011, 36, 45–74. [Google Scholar] [CrossRef] [Green Version]
  12. Sassen, K.; Khvorostyanov, V.I. Cloud effects from boreal forest fire smoke: Evidence for ice nucleation from polarization lidar data and cloud model simulations. Environ. Res. Lett. 2008, 3, 25006. [Google Scholar] [CrossRef]
  13. Rosenfeld, D.; Sherwood, S.; Wood, R.; Donner, L. Climate effects of aerosol-cloud interactions. Science 2014, 343, 379–380. [Google Scholar] [CrossRef] [PubMed]
  14. Martins, E.P.; Bissell, A.N.; Morgan, K.K. Population differences in a lizard communicative display: Evidence for rapid change in structure and function. Anim. Behav. 1998, 56, 1113–1119. [Google Scholar] [CrossRef] [PubMed] [Green Version]
  15. Jacobson, M.Z. Strong radiative heating due to mixing state of black carbon in atmospheric aerosol. Nature 2001, 409, 695–697. [Google Scholar] [CrossRef] [PubMed]
  16. Reid, J.S.; Eck, T.F.; Christopher, S.A.; Koppman, R.; Dubovik, O.; Eleuterio, D.P.; Holben, B.N.; Reid, E.A.; Zhang, J. A review of biomass burning emissions part III: Intensive optical properties of biomass burning particles. Atmos. Chem. Phys. 2005, 5, 827–849. [Google Scholar] [CrossRef] [Green Version]
  17. Ortiz-Amezcua, P.; Luis Guerrero-Rascado, J.; Granados-Munõz, M.J.; Benavent-Oltra, J.A.; Böckmann, C.; Samaras, S.; Stachlewska, I.S.; Janicka, L.; Baars, H.; Bohlmann, S.; et al. Microphysical characterization of long-range transported biomass burning particles from North America at three EARLINET stations. Atmos. Chem. Phys. 2017, 17, 5931–5946. [Google Scholar] [CrossRef] [Green Version]
  18. Nicolae, D.; Nemuc, A.; Müller, D.; Talianu, C.; Vasilescu, J.; Belegante, L.; Kolgotin, A. Characterization of fresh and aged biomass burning events using multiwavelength Raman lidar and mass spectrometry. J. Geophys. Res. Atmos. 2013, 118, 2956–2965. [Google Scholar] [CrossRef]
  19. Haarig, M.; Ansmann, A.; Baars, H.; Jimenez, C.; Veselovskii, I.; Engelmann, R.; Althausen, D. Extreme levels of Canadian wildfire smoke in the stratosphere over central Europe—Part 2: Lidar study of depolarization and lidar ratios at 355, 532, and 1064 nm and of microphysical properties. Atmos. Chem. Phys. 2018, 18, 11847–11861. [Google Scholar] [CrossRef] [Green Version]
  20. Hu, Q.; Goloub, P.; Veselovskii, I.; Bravo-Aranda, J.A.; Elisabeta Popovici, I.; Podvin, T.; Haeffelin, M.; Lopatin, A.; Dubovik, O.; Pietras, C.; et al. Long-range-transported Canadian smoke plumes in the lower stratosphere over northern France. Atmos. Chem. Phys. 2019, 19, 1173–1193. [Google Scholar] [CrossRef] [Green Version]
  21. Weinzierl, B.; Sauer, D.; Esselborn, M.; Petzold, A.; Veira, A.; Rose, M.; Mund, S.; Wirth, M.; Ansmann, A.; Tesche, M.; et al. Microphysical and optical properties of dust and tropical biomass burning aerosol layers in the Cape Verde region-an overview of the airborne in situ and lidar measurements during SAMUM-2. Tellus Ser. B Chem. Phys. Meteorol. 2011, 63, 589–618. [Google Scholar] [CrossRef] [Green Version]
  22. Burton, S.P.; Ferrare, R.A.; Hostetler, C.A.; Hair, J.W.; Rogers, R.R.; Obland, M.D.; Butler, C.F.; Cook, A.L.; Harper, D.B.; Froyd, K.D. Aerosol classification using airborne High Spectral Resolution Lidar measurements-methodology and examples. Atmos. Meas. Tech. 2012, 5, 73–98. [Google Scholar] [CrossRef] [Green Version]
  23. Groß, S.; Esselborn, M.; Weinzierl, B.; Wirth, M.; Fix, A.; Petzold, A. Aerosol classification by airborne high spectral resolution lidar observations. Atmos. Chem. Phys. 2013, 13, 2487–2505. [Google Scholar] [CrossRef] [Green Version]
  24. Marenco, F.; Johnson, B.; Turnbull, K.; Newman, S.; Haywood, J.; Webster, H.; Ricketts, H. Airborne lidar observations of the 2010 Eyjafjallajkull volcanic ash plume. J. Geophys. Res. Atmos. 2011, 116, 1–15. [Google Scholar] [CrossRef]
  25. Murayama, T.; Müller, D.; Wada, K.; Shimizu, A.; Sekiguchi, M.; Tsukamoto, T. Characterization of Asian dust and Siberian smoke with multi-wavelength Raman lidar over Tokyo, Japan in spring 2003. Geophys. Res. Lett. 2004, 31, 1–5. [Google Scholar] [CrossRef] [Green Version]
  26. Veselovskii, I.; Whiteman, D.N.; Korenskiy, M.; Suvorina, A.; Kolgotin, A.; Lyapustin, A.; Wang, Y.; Chin, M.; Bian, H.; Kucsera, T.L.; et al. Characterization of forest fire smoke event near Washington, DC in summer 2013 with multi-wavelength lidar. Atmos. Chem. Phys. 2015, 15, 1647–1660. [Google Scholar] [CrossRef] [Green Version]
  27. Giannakaki, E.; Van Zyl, P.G.; Müller, D.; Balis, D.; Komppula, M. Optical and microphysical characterization of aerosol layers over South Africa by means of multi-wavelength depolarization and Raman lidar measurements. Atmos. Chem. Phys. 2016, 16, 8109–8123. [Google Scholar] [CrossRef] [Green Version]
  28. Baars, H.; Ansmann, A.; Althausen, D.; Engelmann, R.; Heese, B.; Mller, D.; Artaxo, P.; Paixao, M.; Pauliquevis, T.; Souza, R. Aerosol profiling with lidar in the Amazon Basin during the wet and dry season. J. Geophys. Res. Atmos. 2012, 117, 1–16. [Google Scholar] [CrossRef]
  29. Amiridis, V.; Zerefos, C.; Kazadzis, S.; Gerasopoulos, E.; Eleftheratos, K.; Vrekoussis, M.; Stohl, A.; Mamouri, R.E.; Kokkalis, P.; Papayannis, A.; et al. Impact of the 2009 Attica wild fires on the air quality in urban Athens. Atmos. Environ. 2012, 46, 536–544. [Google Scholar] [CrossRef]
  30. Balis, D.S.; Amiridis, V.; Zerefos, C.; Gerasopoulos, E.; Andreae, M.; Zanis, P.; Kazantzidis, A.; Kazadzis, S.; Papayannis, A. Raman lidar and sunphotometric measurements of aerosol optical properties over Thessaloniki, Greece during a biomass burning episode. Atmos. Environ. 2003, 37, 4529–4538. [Google Scholar] [CrossRef]
  31. Amiridis, V.; Balis, D.S.; Giannakaki, E.; Stohl, A.; Kazadzis, S.; Koukouli, M.E.; Zanis, P. Optical characteristics of biomass burning aerosols over Southeastern Europe determined from UV-Raman lidar measurements. Atmos. Chem. Phys. 2009, 9, 2431–2440. [Google Scholar] [CrossRef] [Green Version]
  32. Alados-Arboledas, L.; Müller, D.; Guerrero-Rascado, J.L.; Navas-Guzmán, F.; Pérez-Ramírez, D.; Olmo, F.J. Optical and microphysical properties of fresh biomass burning aerosol retrieved by Raman lidar, and star-and sun-photometry. Geophys. Res. Lett. 2011, 38, 1–5. [Google Scholar] [CrossRef]
  33. Müller, D.; Mattis, I.; Wandinger, U.; Ansmann, A.; Althausen, D.; Stohl, A. Raman lidar observations of aged Siberian and Canadian forest fire smoke in the free troposphere over Germany in 2003: Microphysical particle characterization. J. Geophys. Res. D Atmos. 2005, 110, 75–90. [Google Scholar] [CrossRef]
  34. Müller, D.; Ansmann, A.; Mattis, I.; Tesche, M.; Wandinger, U.; Althausen, D.; Pisani, G. Aerosol-type-dependent lidar ratios observed with Raman lidar. J. Geophys. Res. Atmos. 2007, 112, 1–11. [Google Scholar] [CrossRef]
  35. Ansmann, A.; Baars, H.; Tesche, M.; Müller, D.; Althausen, D.; Engelmann, R.; Pauliquevis, T.; Artaxo, P. Dust and smoke transport from Africa to South America: Lidar profiling over Cape Verde and the Amazon rainforest. Geophys. Res. Lett. 2009, 36, 2–6. [Google Scholar] [CrossRef]
  36. Adam, M.; Nicolae, D.; Belegante, L.; Stachlewska, I.; Janicka, L.; Szczepanik, D.; Mylonaki, M.; Papanikolaou, C.A.; Siomos, N.; Voudouri, K.A.; et al. Biomass burning events measured by lidars in EARLINET. Part II. Results and discussions. Atmos. Chem. Phys. Discuss. 2020. preprint. [Google Scholar] [CrossRef]
  37. Mylonaki, M.; Papayannis, A.; Papanikolaou, C.A.; Foskinis, R.; Soupiona, O.; Maroufidis, G.; Anagnou, D.; Kralli, E. Tropospheric vertical profiling of the aerosol backscatter coefficient and the particle linear depolarization ratio for different aerosol mixtures during the PANACEA campaign in July 2019 at Volos, Greece. Atmos. Environ. 2021, 247, 118184. [Google Scholar] [CrossRef]
  38. Mylonaki, M.; Giannakaki, E.; Papayannis, A.; Papanikolaou, C.A.; Komppula, M.; Nicolae, D.; Papagiannopoulos, N.; Amodeo, A.; Baars, H.; Soupiona, O. Aerosol type classification analysis using EARLINET multiwavelength and depolarization lidar observations. Atmos. Chem. Phys. 2021, 21, 2211–2227. [Google Scholar] [CrossRef]
  39. D’Amico, G.; Amodeo, A.; Mattis, I.; Freudenthaler, V.; Pappalardo, G. EARLINET Single Calculus Chain-technical andndash; Part 1: Pre-processing of raw lidar data. Atmos. Meas. Tech. 2016, 9, 491–507. [Google Scholar] [CrossRef] [Green Version]
  40. Mattis, I.; D’Amico, G.; Baars, H.; Amodeo, A.; Madonna, F.; Iarlori, M. EARLINET Single Calculus Chain—Technical—Part 2: Calculation of optical products. Atmos. Meas. Tech. 2016, 9, 3009–3029. [Google Scholar] [CrossRef] [Green Version]
  41. Veselovskii, I.; Kolgotin, A.; Griaznov, V.; Müller, D.; Wandinger, U.; Whiteman, D.N. Inversion with regularization for the retrieval of tropospheric aerosol parameters from multiwavelength lidar sounding. Appl. Opt. 2002, 41, 3685. [Google Scholar] [CrossRef] [Green Version]
  42. Kokkalis, P.; Soupiona, O.; Papanikolaou, C.A.; Foskinis, R.; Mylonaki, M.; Solomos, S.; Vratolis, S.; Vasilatou, V.; Kralli, E.; Anagnou, D.; et al. Radiative effect and mixing processes of a long-lasting dust event over athens, greece, during the COVID-19 period. Atmosphere 2021, 12, 318. [Google Scholar] [CrossRef]
  43. Pappalardo, G.; Amodeo, A.; Apituley, A.; Comeron, A.; Freudenthaler, V.; Linné, H.; Ansmann, A.; Bösenberg, J.; D’Amico, G.; Mattis, I.; et al. EARLINET: Towards an advanced sustainable European aerosol lidar network. Atmos. Meas. Tech. 2014, 7, 2389–2409. [Google Scholar] [CrossRef] [Green Version]
  44. Draxler, R.R.; Hess, G.D. An overview of the HYSPLIT_4 modelling system for trajectories, dispersion and deposition. Aust. Meteorol. Mag. 1998, 47, 295–308. [Google Scholar]
  45. Giglio, L.; Descloitres, J.; Justice, C.O.; Kaufman, Y.J. An enhanced contextual fire detection algorithm for MODIS. Remote Sens. Environ. 2003, 87, 273–282. [Google Scholar] [CrossRef]
  46. Basart, S.; PéRez, C.; Nickovic, S.; Cuevas, E.; Baldasano, J.M. Development and evaluation of the BSC-DREAM8b dust regional model over northern Africa, the mediterranean and the middle east. Tellus Ser. B Chem. Phys. Meteorol. 2012, 64, 18539. [Google Scholar] [CrossRef] [Green Version]
  47. Bougiatioti, A.; Bezantakos, S.; Stavroulas, I.; Kalivitis, N.; Kokkalis, P.; Biskos, G.; Mihalopoulos, N.; Papayannis, A.; Nenes, A. Biomass-burning impact on CCN number, hygroscopicity and cloud formation during summertime in the eastern Mediterranean. Atmos. Chem. Phys. 2016, 16, 7389–7409. [Google Scholar] [CrossRef] [Green Version]
  48. Terzi, E.; Argyropoulos, G.; Bougatioti, A.; Mihalopoulos, N.; Nikolaou, K.; Samara, C. Chemical composition and mass closure of ambient PM10 at urban sites. Atmos. Environ. 2010, 44, 2231–2239. [Google Scholar] [CrossRef]
  49. Remoundaki, E.; Papayannis, A.; Kassomenos, P.; Mantas, E.; Kokkalis, P.; Tsezos, M. Influence of saharan dust transport events on PM2.5 concentrations and composition over Athens. Water Air Soil Pollut. 2013, 224, 1373. [Google Scholar] [CrossRef]
  50. Klett, J.D. Stable analytical inversion solution for processing lidar returns. Appl. Opt. 1981, 20, 211. [Google Scholar] [CrossRef] [Green Version]
  51. Klett, J.D. Lidar inversion with variable backscatter/extinction ratios. Appl. Opt. 1985, 24, 1638. [Google Scholar] [CrossRef]
  52. Papayannis, A.; Amiridis, V.; Mona, L.; Tsaknakis, G.; Balis, D.; Bösenberg, J.; Chaikovski, A.; De Tomasi, F.; Grigorov, I.; Mattis, I.; et al. Systematic lidar observations of Saharan dust over Europe in the frame of EARLINET (2000–2002). J. Geophys. Res. Atmos. 2008, 113, 1–17. [Google Scholar] [CrossRef] [Green Version]
  53. Groß, S.; Tesche, M.; Freudenthaler, V.; Toledano, C.; Wiegner, M.; Ansmann, A.; Althausen, D.; Seefeldner, M. Characterization of Saharan dust, marine aerosols and mixtures of biomass-burning aerosols and dust by means of multi-wavelength depolarization and Raman lidar measurements during SAMUM 2. Tellus Ser. B Chem. Phys. Meteorol. 2011, 63, 706–724. [Google Scholar] [CrossRef]
  54. Burton, S.P.; Ferrare, R.A.; Vaughan, M.A.; Omar, A.H.; Rogers, R.R.; Hostetler, C.A.; Hair, J.W. Aerosol classification from airborne HSRL and comparisons with the CALIPSO vertical feature mask. Atmos. Meas. Tech. 2013, 6, 1397–1412. [Google Scholar] [CrossRef] [Green Version]
  55. Ansmann, A.; Riebesell, M.; Weitkamp, C. Measurement of atmospheric aerosol extinction profiles with a Raman lidar. Opt. Lett. 1990, 15, 746. [Google Scholar] [CrossRef] [PubMed]
  56. Chemyakin, E.; Müller, D.; Burton, S.; Kolgotin, A.; Hostetler, C.; Ferrare, R. Arrange and average algorithm for the retrieval of aerosol parameters from multiwavelength high-spectral-resolution lidar/Raman lidar data. Appl. Opt. 2014, 53, 7252. [Google Scholar] [CrossRef] [PubMed]
  57. Müller, D.; Wandinger, U.; Ansmann, A. Microphysical particle parameters from extinction and backscatter lidar data by inversion with regularization: Theory. Appl. Opt. 1999, 38, 2346. [Google Scholar] [CrossRef]
  58. Samaras, S.; Nicolae, D.; Böckmann, C.; Vasilescu, J.; Binietoglou, I.; Labzovskii, L.; Toanca, F.; Papayannis, A. Using Raman-lidar-based regularized microphysical retrievals and Aerosol Mass Spectrometer measurements for the characterization of biomass burning aerosols. J. Comput. Phys. 2015, 299, 156–174. [Google Scholar] [CrossRef]
  59. Soupiona, O.; Papayannis, A.; Kokkalis, P.; Foskinis, R.; Sánchez Hernández, G.; Ortiz-Amezcua, P.; Mylonaki, M.; Papanikolaou, C.A.; Papagiannopoulos, N.; Samaras, S.; et al. EARLINET observations of Saharan dust intrusions over the northern Mediterranean region (2014–2017): Properties and impact on radiative forcing. Atmos. Chem. Phys. 2020, 20, 15147–15166. [Google Scholar] [CrossRef]
  60. Wandinger, U.; Müller, D.; Böckmann, C.; Althausen, D.; Matthias, V.; Bösenberg, J.; Weiß, V.; Fiebig, M.; Wendisch, M.; Stohl, A.; et al. Optical and microphysical characterization of biomass-burning and industrial-pollution aerosols from multiwavelength lidar and aircraft measurements. J. Geophys. Res. Atmos. 2002, 107, 8125. [Google Scholar] [CrossRef]
Figure 1. (a) Number of aerosol layers observed through the years 2011–2019 and sorted into one of the three different aerosol categories; (b) frequency distribution of the aerosol categories out of the 34 total aerosol layers. The 3 aerosol categories: smoke—“s” (blue), smoke and continental polluted “s+cp”—(red), and smoke and mixed dust—“s+md” (yellow).
Remotesensing 13 03877 g001
Figure 2. Mean values of aerosol: (a) backscatter coefficient (Mm−1sr−1); (b) extinction coefficient (sr−1); (c) lidar ratio (sr); (d) Ångström exponent, and (e) ratio of the LRs, LR532/LR355, for each aerosol category. The different aerosol categories are denoted with different symbols (s—circle, s+cp—square, and s+md—diamond). The blue, green, and red colors in (ac) stand for the wavelengths 355, 532, and 1064 nm, respectively, while in (d) for extinction 355/532 (a), backscatter 355/532 (b1) and backscatter 532/1064 (b2)-related Ångström exponents, respectively.
Remotesensing 13 03877 g002
Figure 3. Correlation between the variables LR532/LR355 and number of hours over burned areas for (a) the s aerosol layers; (b) the s+cp aerosol layers.
Remotesensing 13 03877 g003
Figure 4. Mean aerosol microphysical properties: (a) effective Radius (μm); (b) real part of refractive index; (c) imaginary part of refractive index; (d) volume density (μm3cm−3), and (e) single scattering albedo in 355 nm (blue), 532 nm (green), and 1064 nm (red) for the s (circle), s+cp (square), and s+md (diamond) aerosol categories.
Remotesensing 13 03877 g004
Table 1. Mean values along with their standard deviation of s, s+cp, and s+md aerosol categories for aerosol optical and microphysical properties presented in this study.
Aerosol Category
ss+cps+md
Optical properties
LR 355 nm (sr)this study57 ± 1051 ± 5 *39 ± 5
literature21–67 35–92
LR 532 nm (sr)this study73 ± 1159 ± 10 *62 ± 12
literature26–80 32–75
AE ext 355/532this study0.90 ± 0.521.13 ± 0.44 *0.49 ± 0.88
literature0.64–2.3 0.50–1.70
AE bsc 355/532this study1.43 ± 0.271.35 ± 0.09 *1.56 ± 0.21
literature~1.90 0.44–1.50
AE bsc 532/1064this study1.67 ± 0.151.70 ± 0.09 *1.58 ± 0.14
literature~1.90 0.44–1.50
LR532/LR355this study1.27 ± 0.361.17 ± 0.34 *1.39 ± 0.57
literature0.9–1.4 0.7–1.0
References [18,22,25,28,32,33,58] [27,35,59]
Microphysical properties
reff (μm)this study0.24 ± 0.140.24 ± 0.13 *0.24 ± 0.11
literature0.13–0.44 0.17–0.45
mRthis study1.49 ± 0.061.50 ± 0.07 *1.53 ± 0.07
literature1.37–1.6 1.37–1.50
mIthis study0.013 ± 0.004 i0.011 ± 0.005 i *0.011 ± 0.005 i
literature0.001–0.053 i 0.004–0.007 i
vd (μm−3cm−3)this study8.6 ± 3.220.7 ± 14.1 *9.7 ± 6.1
literature8–50 7.4–24.0
SSA 355 nmthis study0.916 ± 0.0420.929 ± 0.036 *0.928 ± 0.037
literature0.760–0.890 0.948–0.964
SSA 532 nmthis study0.932 ± 0.0230.936 ± 0.024 *0.933 ± 0.025
literature0.790–0.997 0.937–0.958
SSA 1064 nmthis study0.918 ± 0.0080.923 ± 0.031 *0.915 ± 0.045 *
literature0.740–0.980
References [5,17,18,19,25,26,27,30,35,58,60] [5,35,59]
* Introduced in the literature within this study.
Publisher’s Note: MDPI stays neutral with regard to jurisdictional claims in published maps and institutional affiliations.

