Article

Multi-Scene Building Height Estimation Method Based on Shadow in High Resolution Imagery

1
Faculty of Geosciences and Environmental Engineering, South West Jiaotong University, Chengdu 611756, China
2
College of Earth Science, Chengdu University of Technology, Chengdu 610059, China
*
Author to whom correspondence should be addressed.
Remote Sens. 2021, 13(15), 2862; https://doi.org/10.3390/rs13152862
Submission received: 2 June 2021 / Revised: 13 July 2021 / Accepted: 20 July 2021 / Published: 21 July 2021

Abstract

:
Accurately building height estimation from remote sensing imagery is an important and challenging task. However, the existing shadow-based building height estimation methods have large errors due to the complex environment in remote sensing imagery. In this paper, we propose a multi-scene building height estimation method based on shadow in high resolution imagery. First, the shadow of building is classified and described by analyzing the features of building shadow in remote sensing imagery. Second, a variety of shadow-based building height estimation models is established in different scenes. In addition, a method of shadow regularization extraction is proposed, which can solve the problem of mutual adhesion shadows in dense building areas effectively. Finally, we propose a method for shadow length calculation combines with the fish net and the pauta criterion, which means that the large error caused by the complex shape of building shadow can be avoided. Multi-scene areas are selected for experimental analysis to prove the validity of our method. The experiment results show that the accuracy rate is as high as 96% within 2 m of absolute error of our method. In addition, we compared our proposed approach with the existing methods, and the results show that the absolute error of our method are reduced by 1.24 m–3.76 m, which can achieve high-precision estimation of building height.

Graphical Abstract

1. Introduction

Building height information is an important part of urban basic geographic information, which plays an important role in many urban applications, such as urban planning, building floor area ratio calculation, smart city construction [1,2,3,4,5]. Automatic building height estimation from high-resolution images has always been one of the fundamental tasks in the field of remote sensing research.
The existing building height estimation methods based on remote sensing images are mainly divided into two categories. The first is based on light detection and ranging (lidar) [6,7,8], interferometric synthetic aperture radar (InSAR) [9,10,11], and stereo pair [12,13,14]. The second is based on the shadows of buildings from remote sensing imagery [15,16,17,18,19]. In the first method, multi-source data is used for building height estimation. For example, Soregel et al. proposed an interferometric synthetic aperture radar building height estimation method based on a segmentation algorithm [20]. Dubois et al. carried out the detection and extraction of building overlap based on the InSAR phase diagram to achieve the purpose of estimating geometric parameters such as building height [9]. Sportouche et al. used the DTM and system parameters of SAR sensors to provide a building height estimation method based on likelihood criterion optimization [21]. Wegner et al. used a pair of InSAR images and an aerial orthophoto to estimate the height of buildings [22]. Brunner et al. proposed a method for the height estimation of generic man-made structures from single detected SAR data, and the efficiency of their method was proven on a set of 40 flat roof and gable roof buildings in the absence of crosstalk effects [23]. Vu et al. proposed a multi-scale solution based on morphology, which obtains elevation information from airborne lidar data, and describes the elevation data in the morphological scale space to realize the expression of building height [24]. Ding et al. proposed a method to obtain building height from a single ground image based on the inherent parameters of the camera [25]. Chen et al. used stereo pairs to extract building height by using the Digital Elevation Model (DEM) to identify building height in the city’s three-dimensional model [26]. The above methods have improved the efficiency of obtaining height information, and the accuracy of the estimation results is also improved. However, the data used are not easy to obtain, since they are affected by geographical location, weather, and other factors, which shows obvious limitations in application.
Compared with the limitation that the above data is difficult to obtain, the optical remote sensing image has obvious advantages. It can be used to extract building height by constructing a model of the geometric relationship between the building and shadow in the image [27,28,29,30,31]. Since 1989, in aerial photogrammetry, researchers have long used shadow information to estimate building height [32]. Wang et al. used ZY3 images to establish a geometric relationship model between shadow length and building height, and combined the shadow length to calculate the building height. On this basis, a three-dimensional modeling of urban buildings was carried out [15]. Liasis used the spectrum and spatial analysis information of satellite image to implement a new active contour model, thereby optimizing the shadow segmentation process of buildings, improving the accuracy of shadow extraction, and estimating building height through shadow length [19]. Izadi et al. proposed a building height calculation method by detecting building boundaries and shadow boundaries, and achieved building height in QuickBird images [33]. Wang et al. used the geometric relationship between shadows and buildings to calculate the height of buildings in Kunming, China in QuickBird images [34]. Qi et al. built a method to calculate the height of buildings, which can calculate building height by Google Earth [35]. Shettigara et al. used the shadow information on the SPOT panchromatic image to construct a model to obtain building height [36]. Turker et al. used building shadow to calculate the height of collapsed buildings in an earthquake [37]. Wang et al. proposed a multi-constrained method to extract shadow information from images, and calculate the height information of buildings based on the relationship between shadow and building [38]. Shao et al. proposed a method combining the spatial index of image objects to improve the accuracy of shadow extraction, and took IKONOS images as an example to estimate the building height using shadow length [39].
Although these works are all notable, the application of the scene is limited to building height estimation in remote sensing images. Firstly, the building height estimation model in different scenarios is not perfect, because of the influence of the sun azimuth and altitude angle, the satellite azimuth and altitude, and the terrain. Secondly, the shadow of densely-built areas in some images adheres to each other, which cannot accurately reflect the height of buildings. Finally, the traditional method of using the shadow length to calculate building height cannot effectively deal with the problem of complex shape of the building shadow. To overcome these limitations, this paper proposes a multi-scene building height estimation method based on shadow in high-resolution satellite imagery. The main contributions of our work are summarized below.
(1) The multi-scene building height estimation model is established by analyzing building shadow in remote sensing images, which can explain the geometric relationship between buildings and shadows in different scenarios.
(2) A method-regularized extraction of building shadows is proposed, which can solve the problem of mutual adhesion between shadows in dense areas of buildings.
(3) We propose a method of shadow length calculation based on the combination of fish net and pauta criterion for the problem of complex shadow shapes of buildings, which can provide more reliable basic data for building height estimation.
The remainder of this paper is organized as follows. The methods are presented in Section 2, including classification and description of building shadows and multi-scene building height estimation. The experiment results and analysis of this article are presented in Section 3, including building height estimation results of ordinary scene, dense scene, and complex terrain scene. Finally, the conclusion and future work are presented in Section 4.

2. Methods

In this paper, we propose a multi-scene building height estimation method based on shadow in high resolution imagery, as shown in Figure 1. Firstly, the scene description is performed by analyzing the characteristics of the shadow shape, distribution density, and regional terrain differences of the buildings in the remote sensing image. Secondly, the building scenes are divided into three types: ordinary scene, dense scene, and complex terrain scene. On this basis, the building height calculation method is designed based on the scene classification results. Finally, building height estimation is achieved through regularized building shadow, shadow length calculation, shadow length correction, and the geometric relationship between shadow and building, as shown in highlighted part in Figure 1.

2.1. Classification and Description of Building Shadow

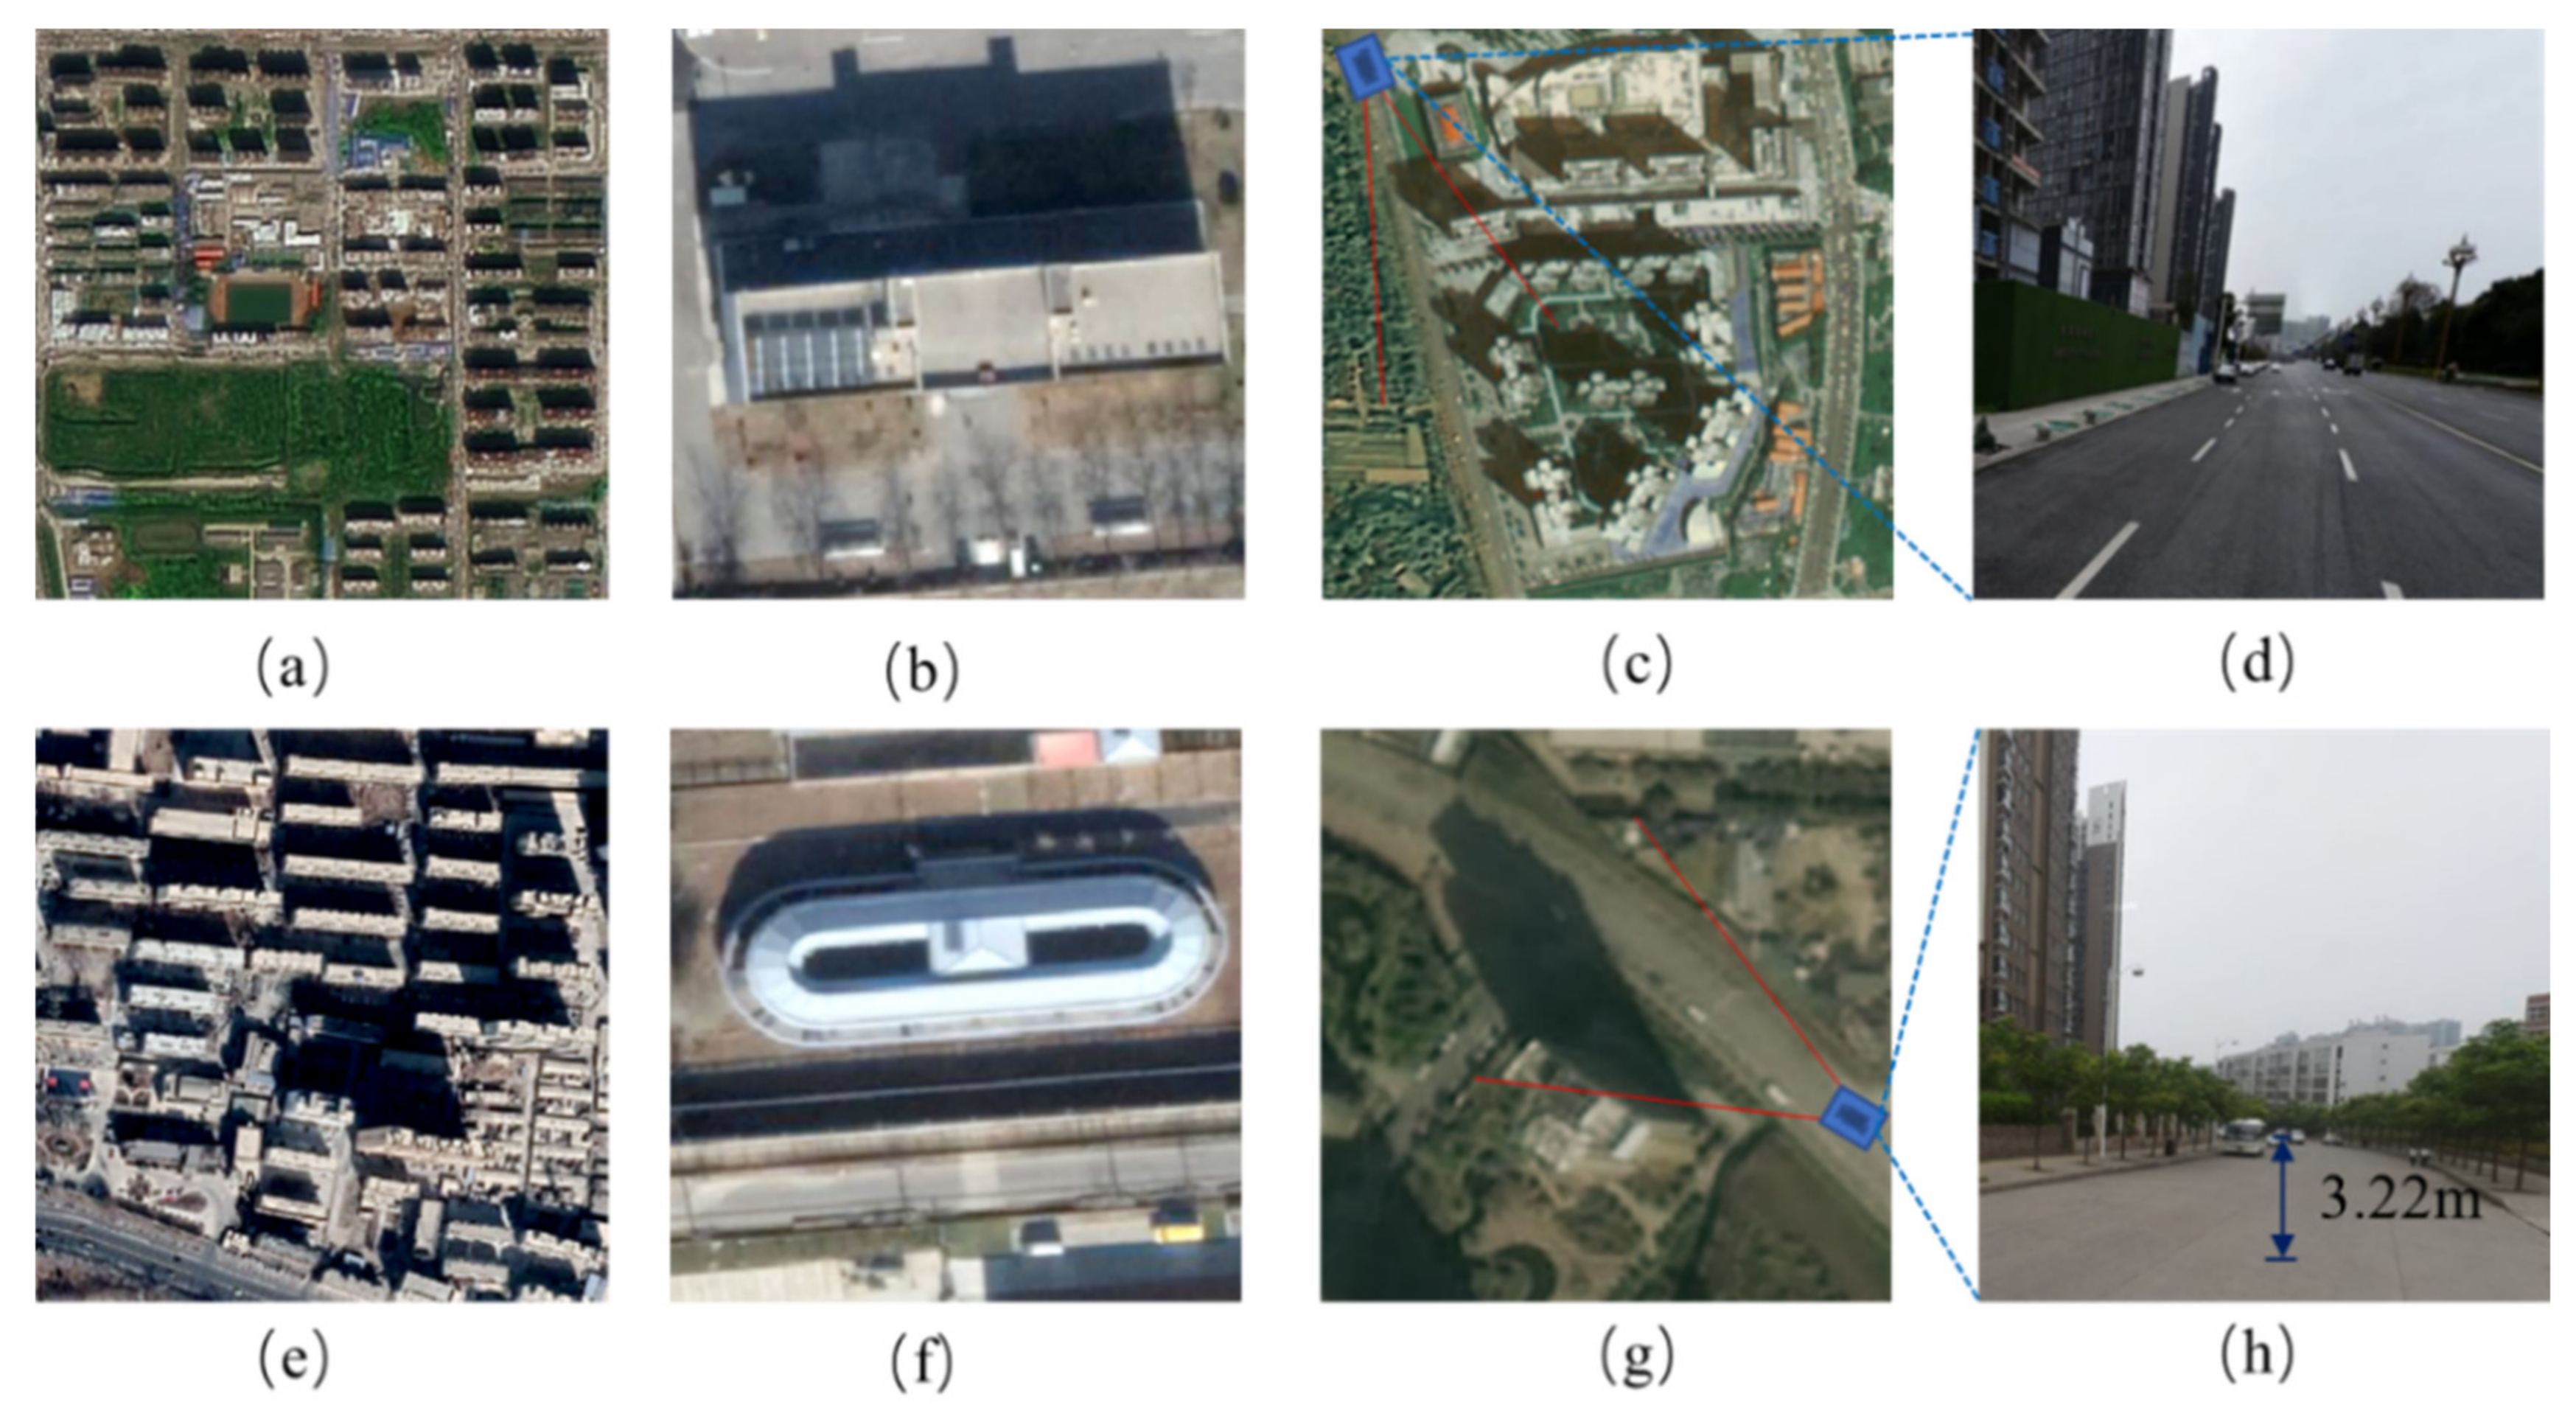
The existing methods for building height calculation based on shadow are generally carried out under three assumptions [40,41,42]. First, the density of the building is small, and there is no overlap between the shadows of building, as shown in Figure 2a. Second, the structure of building is regular, as shown in Figure 2b. Third, the buildings is located in the plain area and not affected by the terrain, as shown in Figure 2c,d. However, these three assumptions produce an ideal situation, which greatly limits the application of the shadow-based building height estimation. Therefore, we have classified and described the shadow of the building in the remote sensing imagery, which can overturn these three hypotheses. The building shadow is divided into three categories.
(1) Density of building shadow. There will be overlap between the shadow as the density of the building increases, and it is impossible to segment the shadows of buildings with different heights, which cannot be used to invert the height of buildings directly, as shown in Figure 2e.
(2) Complex structure of building shadow. There are many complex designs of urban buildings, such as arcs, circles, complex combinations, etc. Shadow extraction will be affected and result in lower accuracy of height calculation results if the shape of the building is complex, as shown in Figure 2f.
(3) Terrain difference of building shadow. Although plain areas are the main population gathering places, there are still some cities in areas with large terrain undulations. The difference of terrain will lead to a great error when calculating the building height based on shadow. as shown in Figure 2g. Figure 2h, which is a photograph of the terrain with a difference in the real scene, and the height difference is 3.22 m on the road at a distance of 120 m.

2.2. Multi-Scene Building Height Estimation

In this section, we introduce the building height estimation method in multi-scene in detail. First, the model for building height estimation using shadow in different azimuths of the sun and sensors is constructed. Second, the method of shadow regularization extraction for buildings in dense areas is introduced. Third, shadow length calculation method combined with fish net and pauta criterion is introduced. Finally, a shadow length correction method under complex terrain is proposed.

2.2.1. Building Height Estimation Model Based on Shadow

We divide the model that uses shadows to invert the height of building into three types based on the relationship of the azimuth angle between the sun and the sensor. Including the same azimuth angle between the sun and the sensor, the azimuth angle difference between the sun and the sensor is greater than 180°, and the azimuth angle difference between the sun and the sensor is between 0° and 180°.
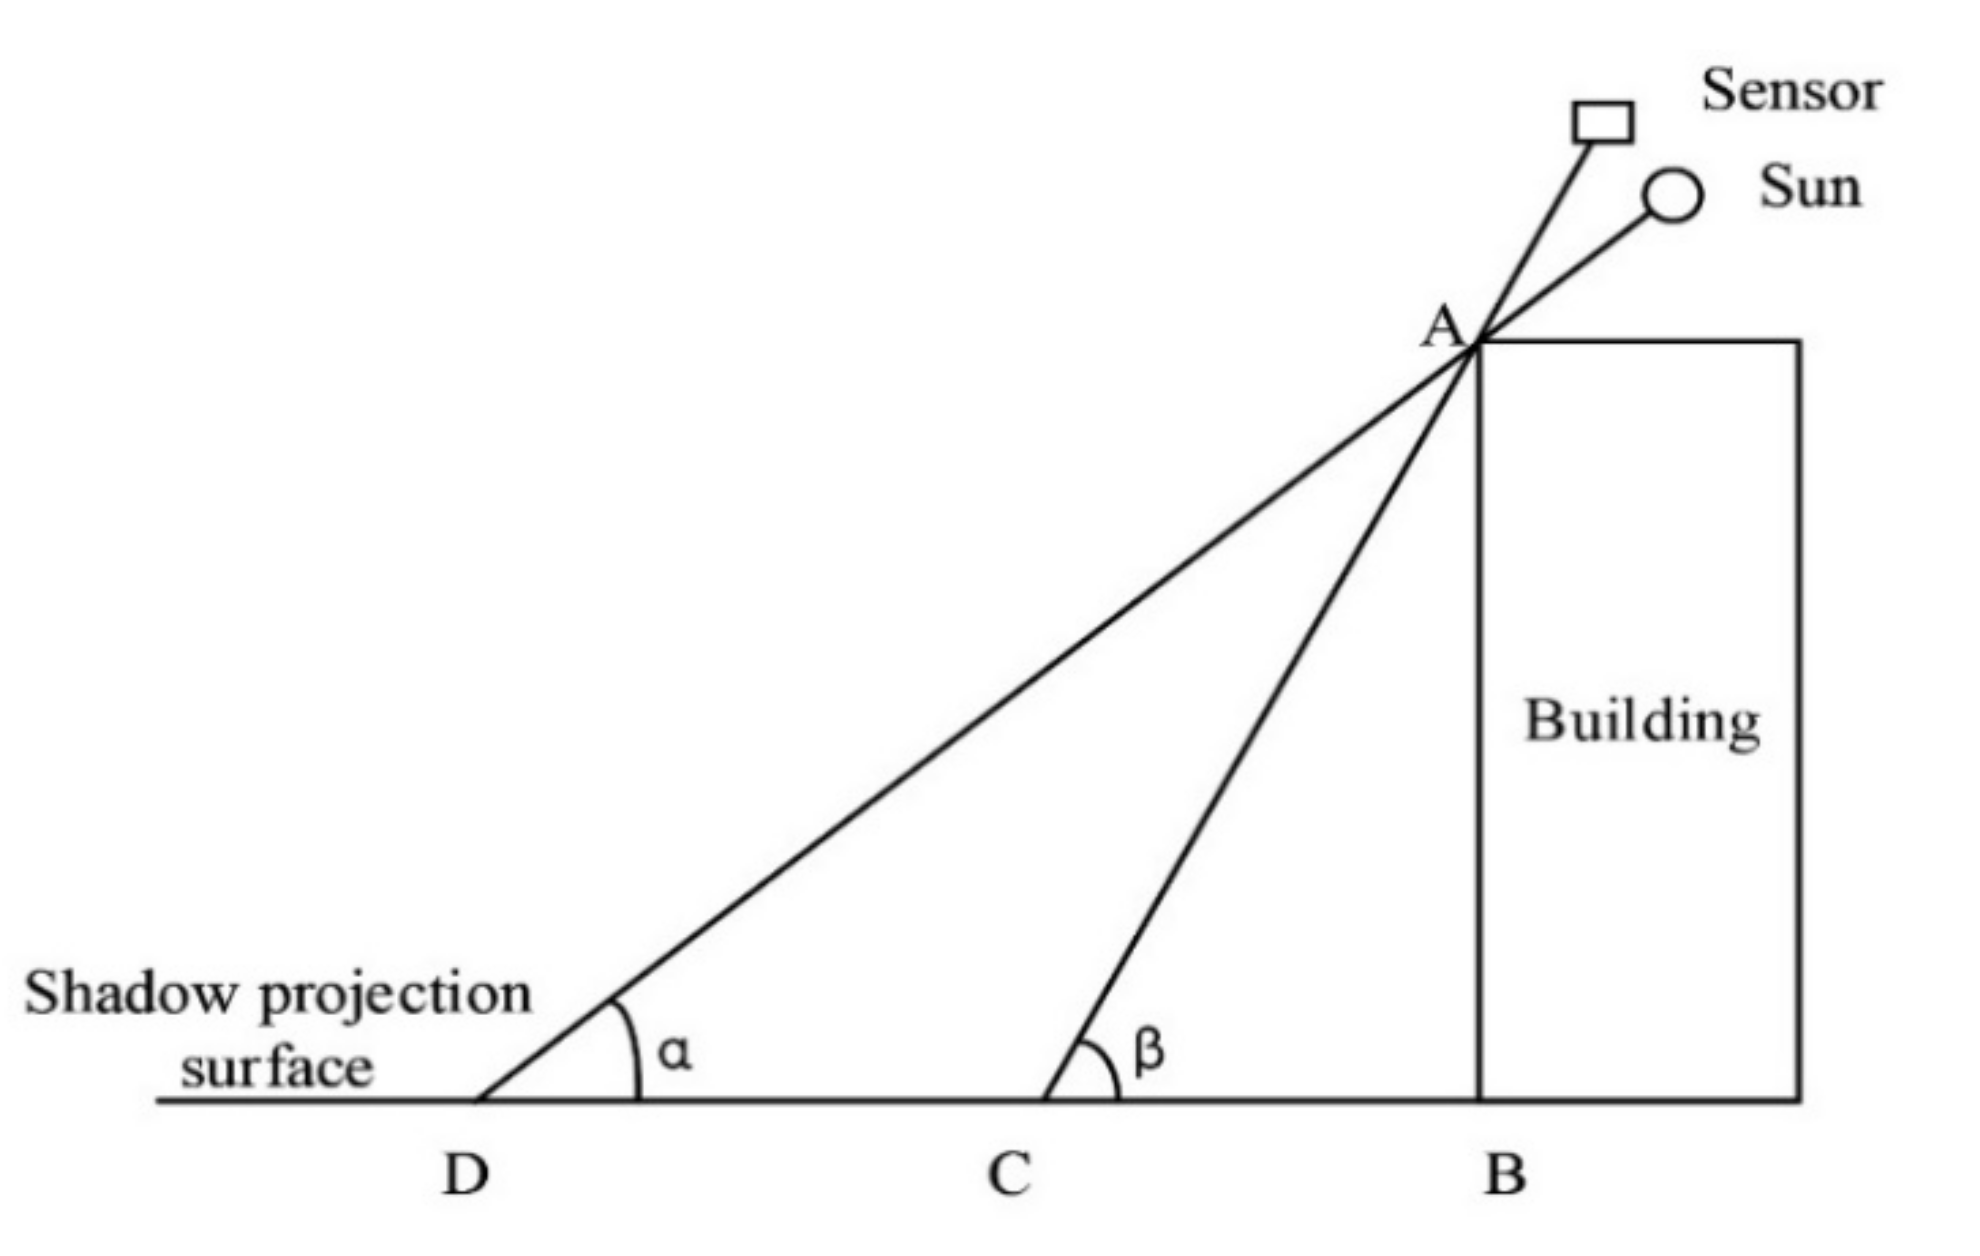
(1) The same azimuth angle between the sun and the sensor. There is no need to consider the influence of the azimuth angle on the shadow detection when the azimuth angle of the sensor is the same as sun azimuth. The sensor and the sun are on the same side of the building; the geometric relationship is shown in Figure 3.
Where α is the sun elevation, β is the sensor elevation, AB is the height of building, BC is the shaded part of the building, BD is the total length of the building shadow, CD is the length of the shadow that can be observed on the remote sensing imagery.
The length of the shadow measured in the image can be calculated in Equation (1).
C D = B D B C = A B t a n α A B t a n β
The height of the building is shown in Equation (2).
A B = C D × t a n α × t a n β t a n β t a n α
It can be seen that the height of the building is only related to the length of the shadow on the remote sensing image and the fixed parameters of the sensor and the sun during shooting. Therefore, the height of the building is proportional to the length of the shadow in the same image. The proportionality coefficient is k , as shown in Equation (3).
A B = C D × k
k = t a n α × t a n β t a n β t a n α
(2) The azimuth angle between the sun and the sensor is greater than 180°. The sensor can capture all shadow areas of the building in this situation, and the value of BC is 0, as shown in Figure 4. The building height is calculated in Equation (5).
A B = B D × t a n α
In the same way as Equation (2), the height of the building is proportional to the length of the shadow in the same image, and the proportionality coefficient is k1, as shown in Equation (6).
A B = B D × k 1
k 1 = t a n α
(3) The azimuth angle between the sun and the sensor is within 0°–180°. The influence of the azimuth angle of the sensor on the shadow detection should be considered in this situation, which is also the most common situation in the image. The geometric relationship between the sensor, the sun, and the building are shown in Figure 5.
Where γ is sun azimuth, δ is sensor azimuth, ε is the angle formed by the direction of the building and its shadow projection in the clockwise direction, and it can be assumed that ε is the same in the same image. B D is the actual length of the building shadow, D E is the observed building shadow length on the remote sensing imagery.
The length of the shadow is D E = B D B E , the building height is AB, and the building height could be computed in Equation (8).
A B = D E × s i n ε c o t α s i n ε c o t β s i n ε + γ δ
In the same way as Equation (2), the height of the building is proportional to the length of the shadow in the same image, and the proportionality coefficient is k2, as shown in Equation (9).
A B = D E × k 2
k 2 = s i n ε c o t α s i n ε c o t β s i n ε + γ δ
When using the above models to calculate the height of the building, a lot of additional auxiliary information is needed, such as sun azimuth and sensor azimuth. It is difficult to obtain these parameters. We have conducted an in-depth study of this difficulty. These parameters are invariable in the same scene image, which provides more convenience to our calculations. As long as we know the height of any building in the image and the length of the shadow, we can calculate the ratio between the building and shadow. After that, we can inversely calculate the height of other buildings based on the ratio and shadow length, as shown in Equations (3), (6) and (9).

2.2.2. Regularized Extraction of Building Shadow in Dense Areas

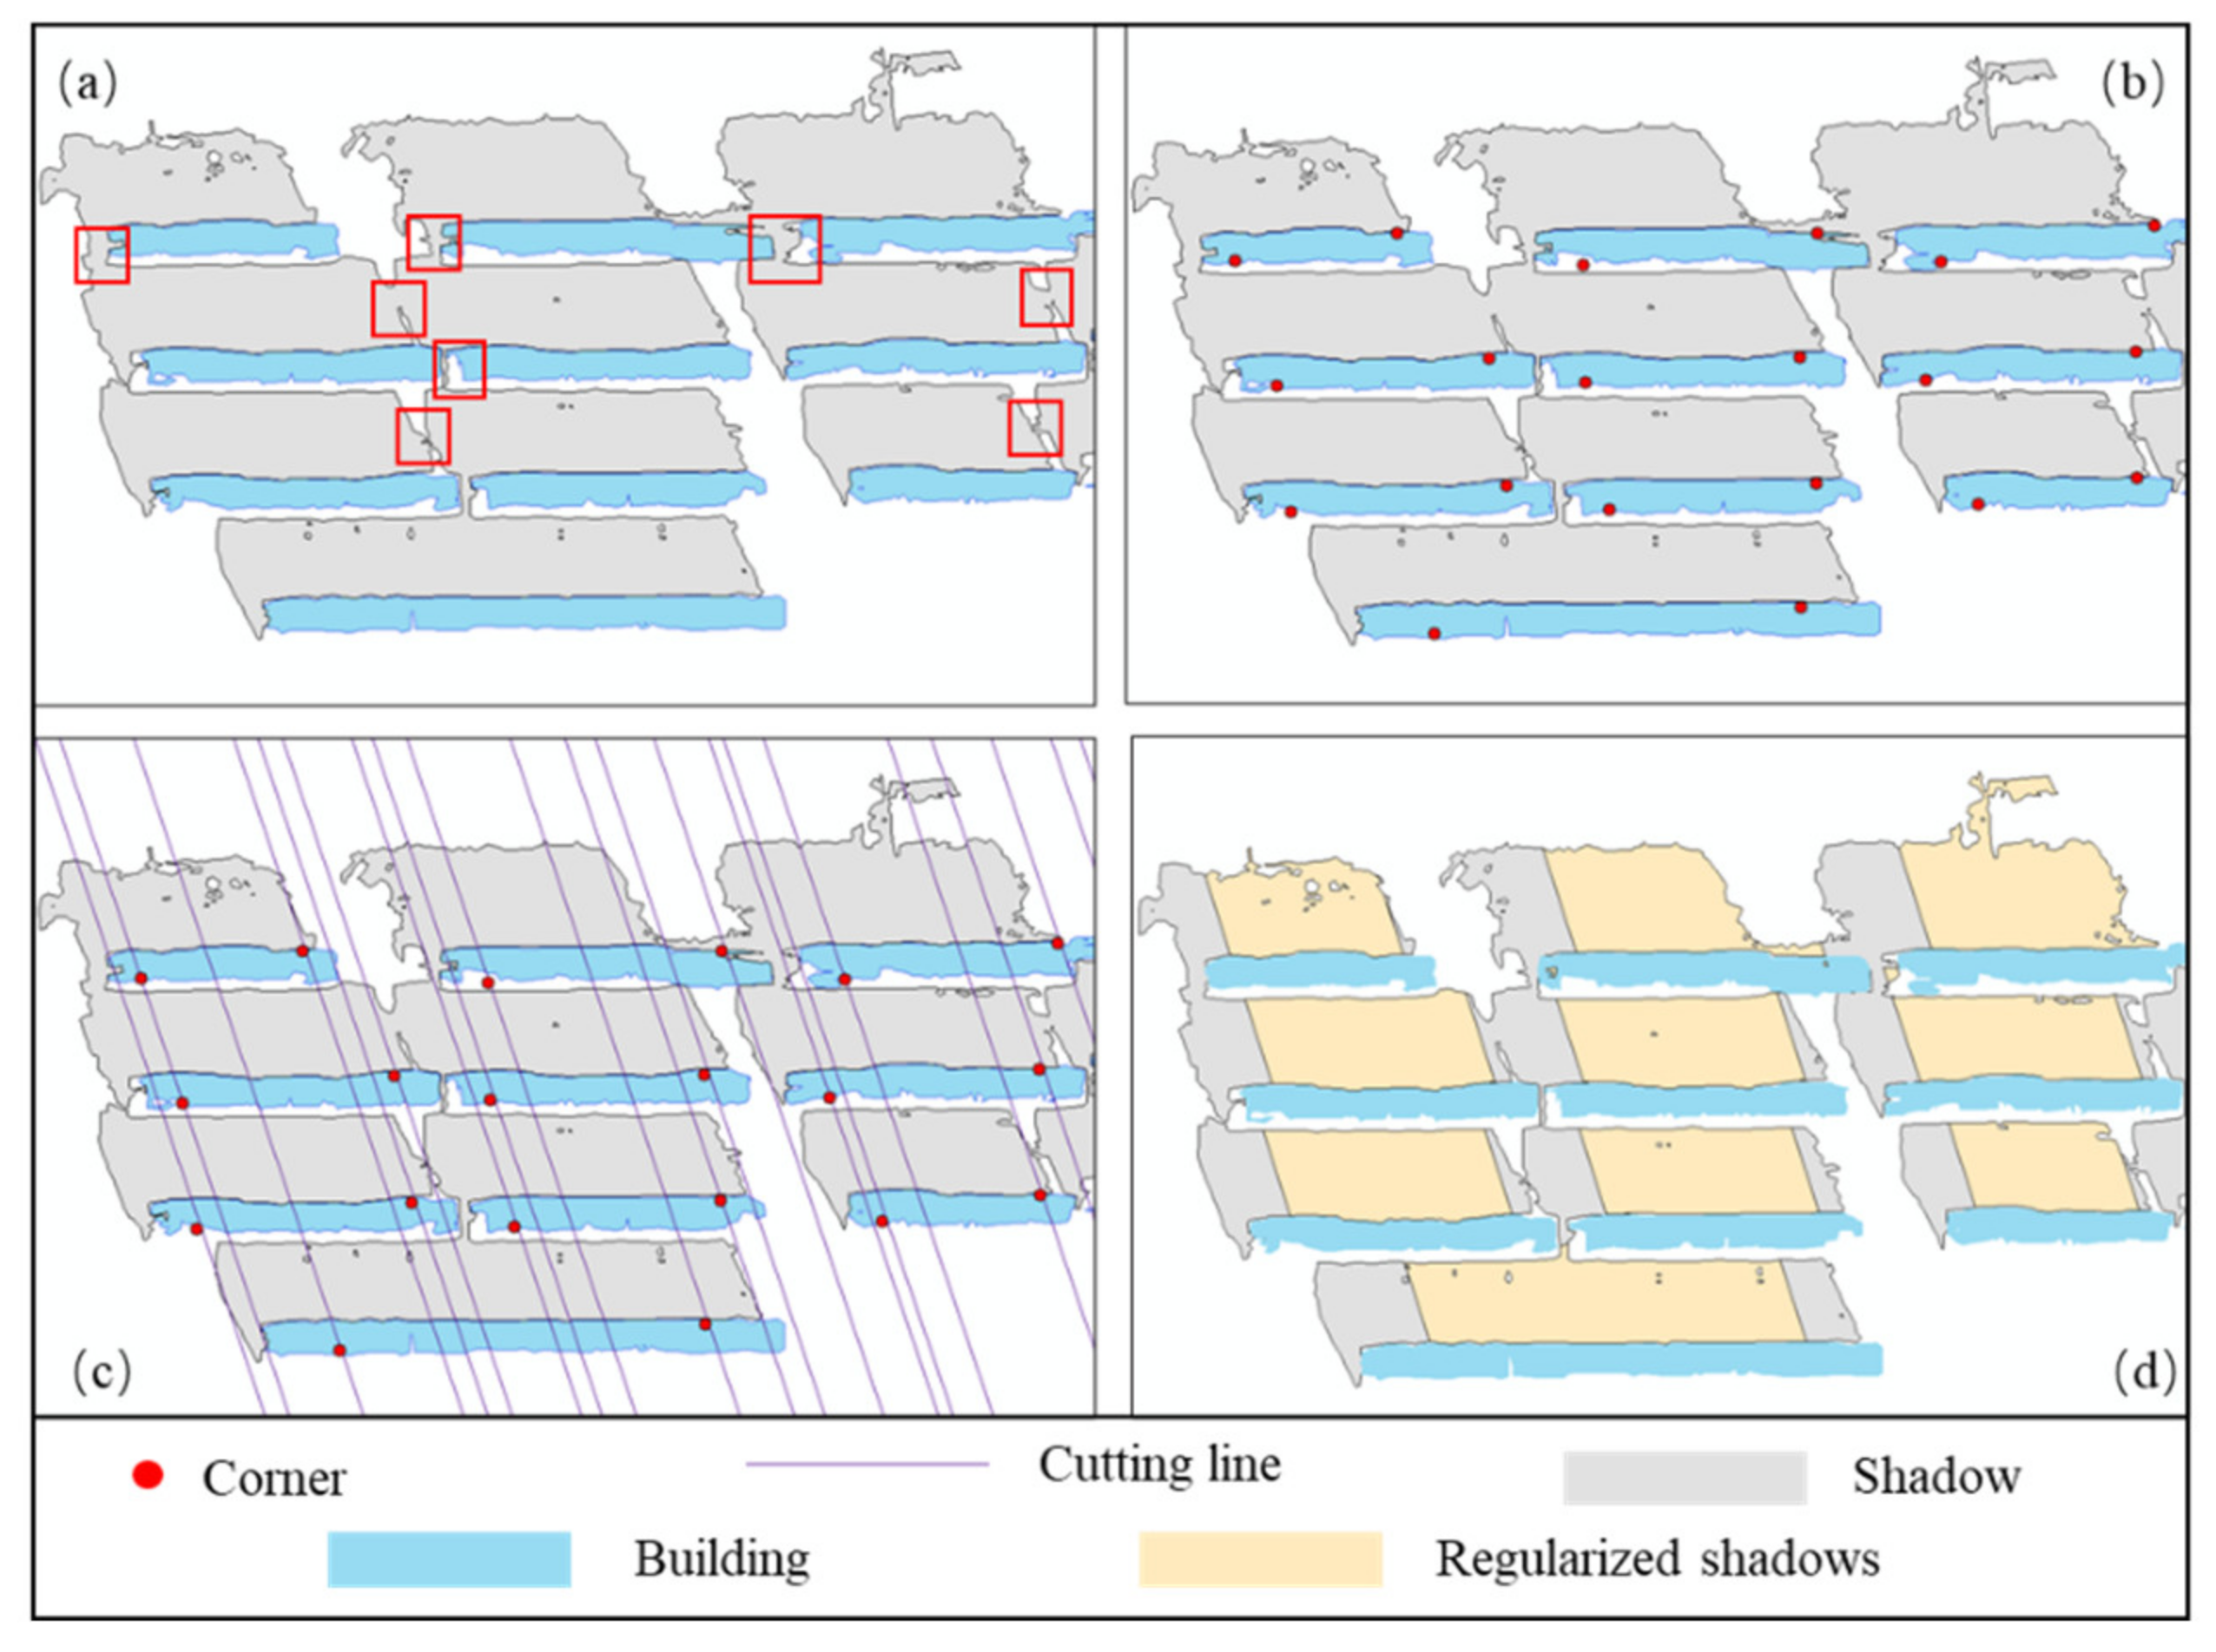
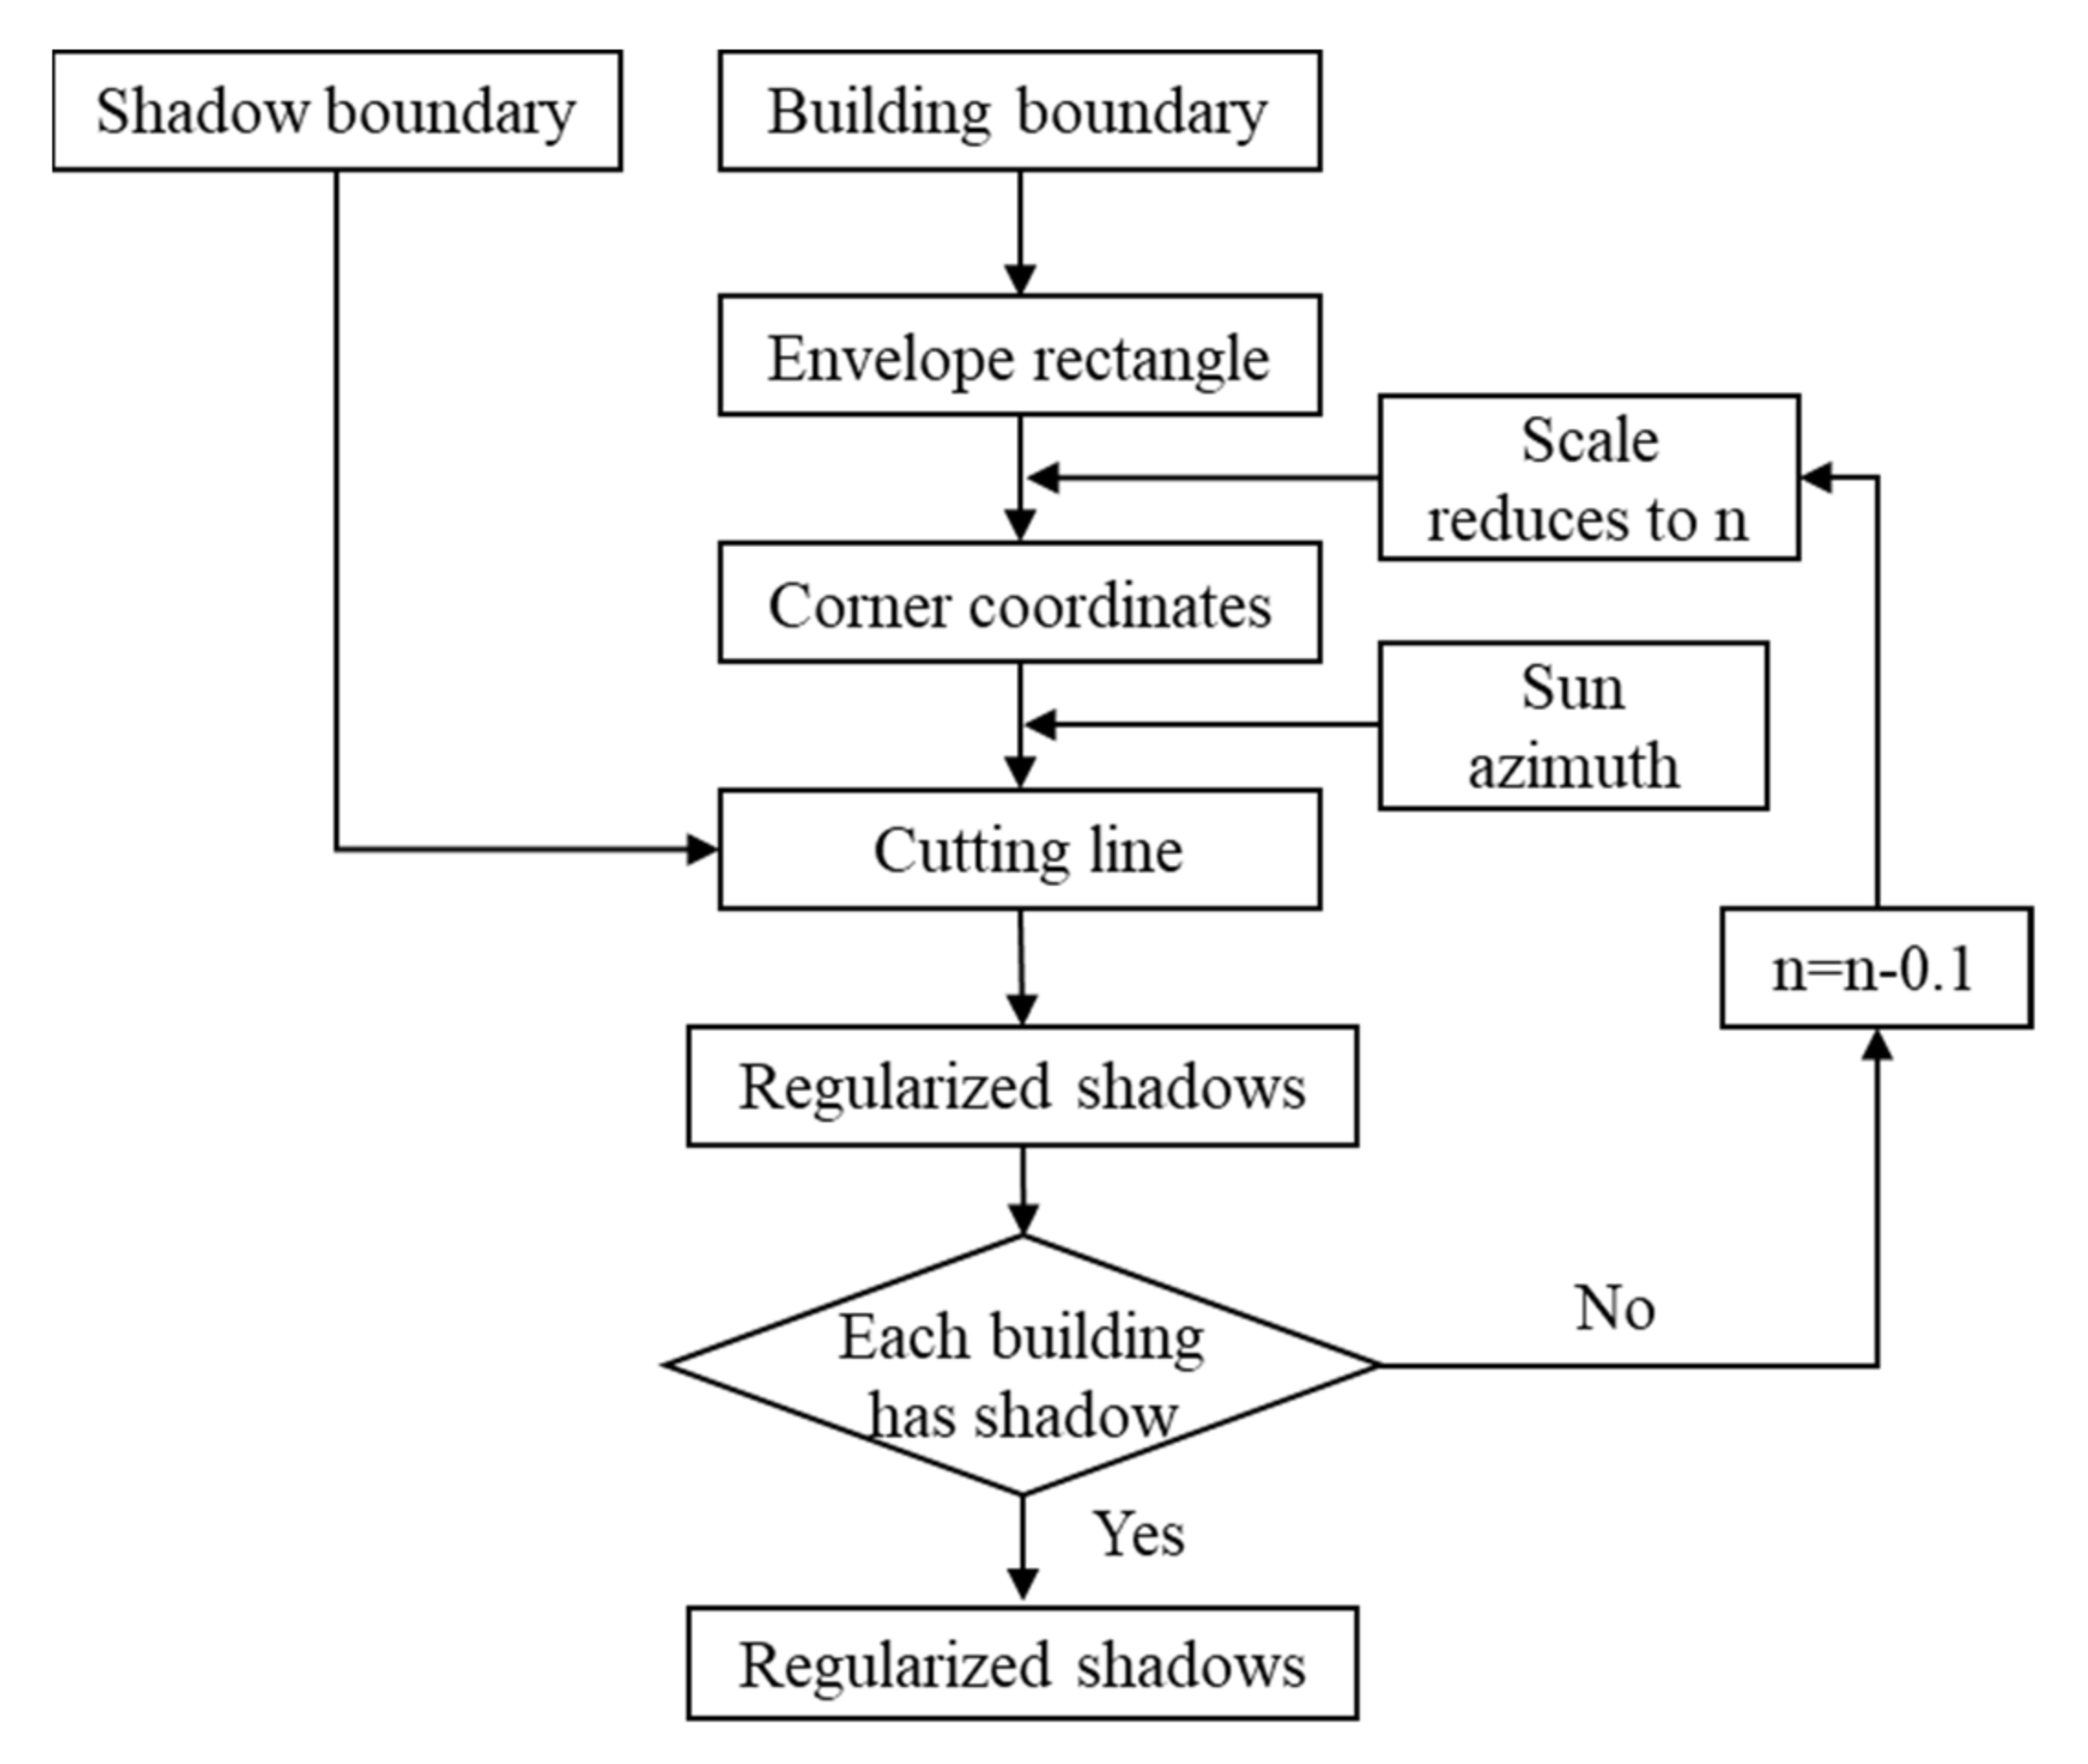
The building shadows in dense areas will overlap with each other, due to the comprehensive influence of multiple factors such as the building, sun elevation, sun azimuth, sensor elevation, and sensor azimuth, as shown in red box in Figure 6a. The buildings cannot correspond to their corresponding shadows one-to-one, the length of the shadow of the building cannot be extracted. To overcome this situation, we propose a method of regularized extraction of building shadows in dense areas based on building boundary constraints; the flow chart of our method is shown in Figure 7. It should be noted that the shadow boundary and building boundary extraction methods used of this article are based on our previous research [43,44].
First, an envelope rectangle is made for the building vector boundary, and scaled according to the proportion. The initial value of the scaling ratio n is 0.7, and the value range of n is 0 to 1. Second, the corner coordinates are obtained from the enveloping rectangle; the result is shown in Figure 6b. The cutting line is generated according to the sun azimuth and corner coordinates; the result is shown in Figure 6c. Then, the regularized shadow is cropped by the cutting line and overlapped shadow. Finally, the building and the regularized shadow are matched according to the azimuth direction of the sun [45]. At the same time, the scaling ratio of the building envelope rectangle is reduced by 0.1 until all the buildings are matched with the shadow, which can be used to calculate the building height; the result is shown in Figure 6d.

2.2.3. Shadow Length Calculation Combine Fish Net and Pauta Criterion

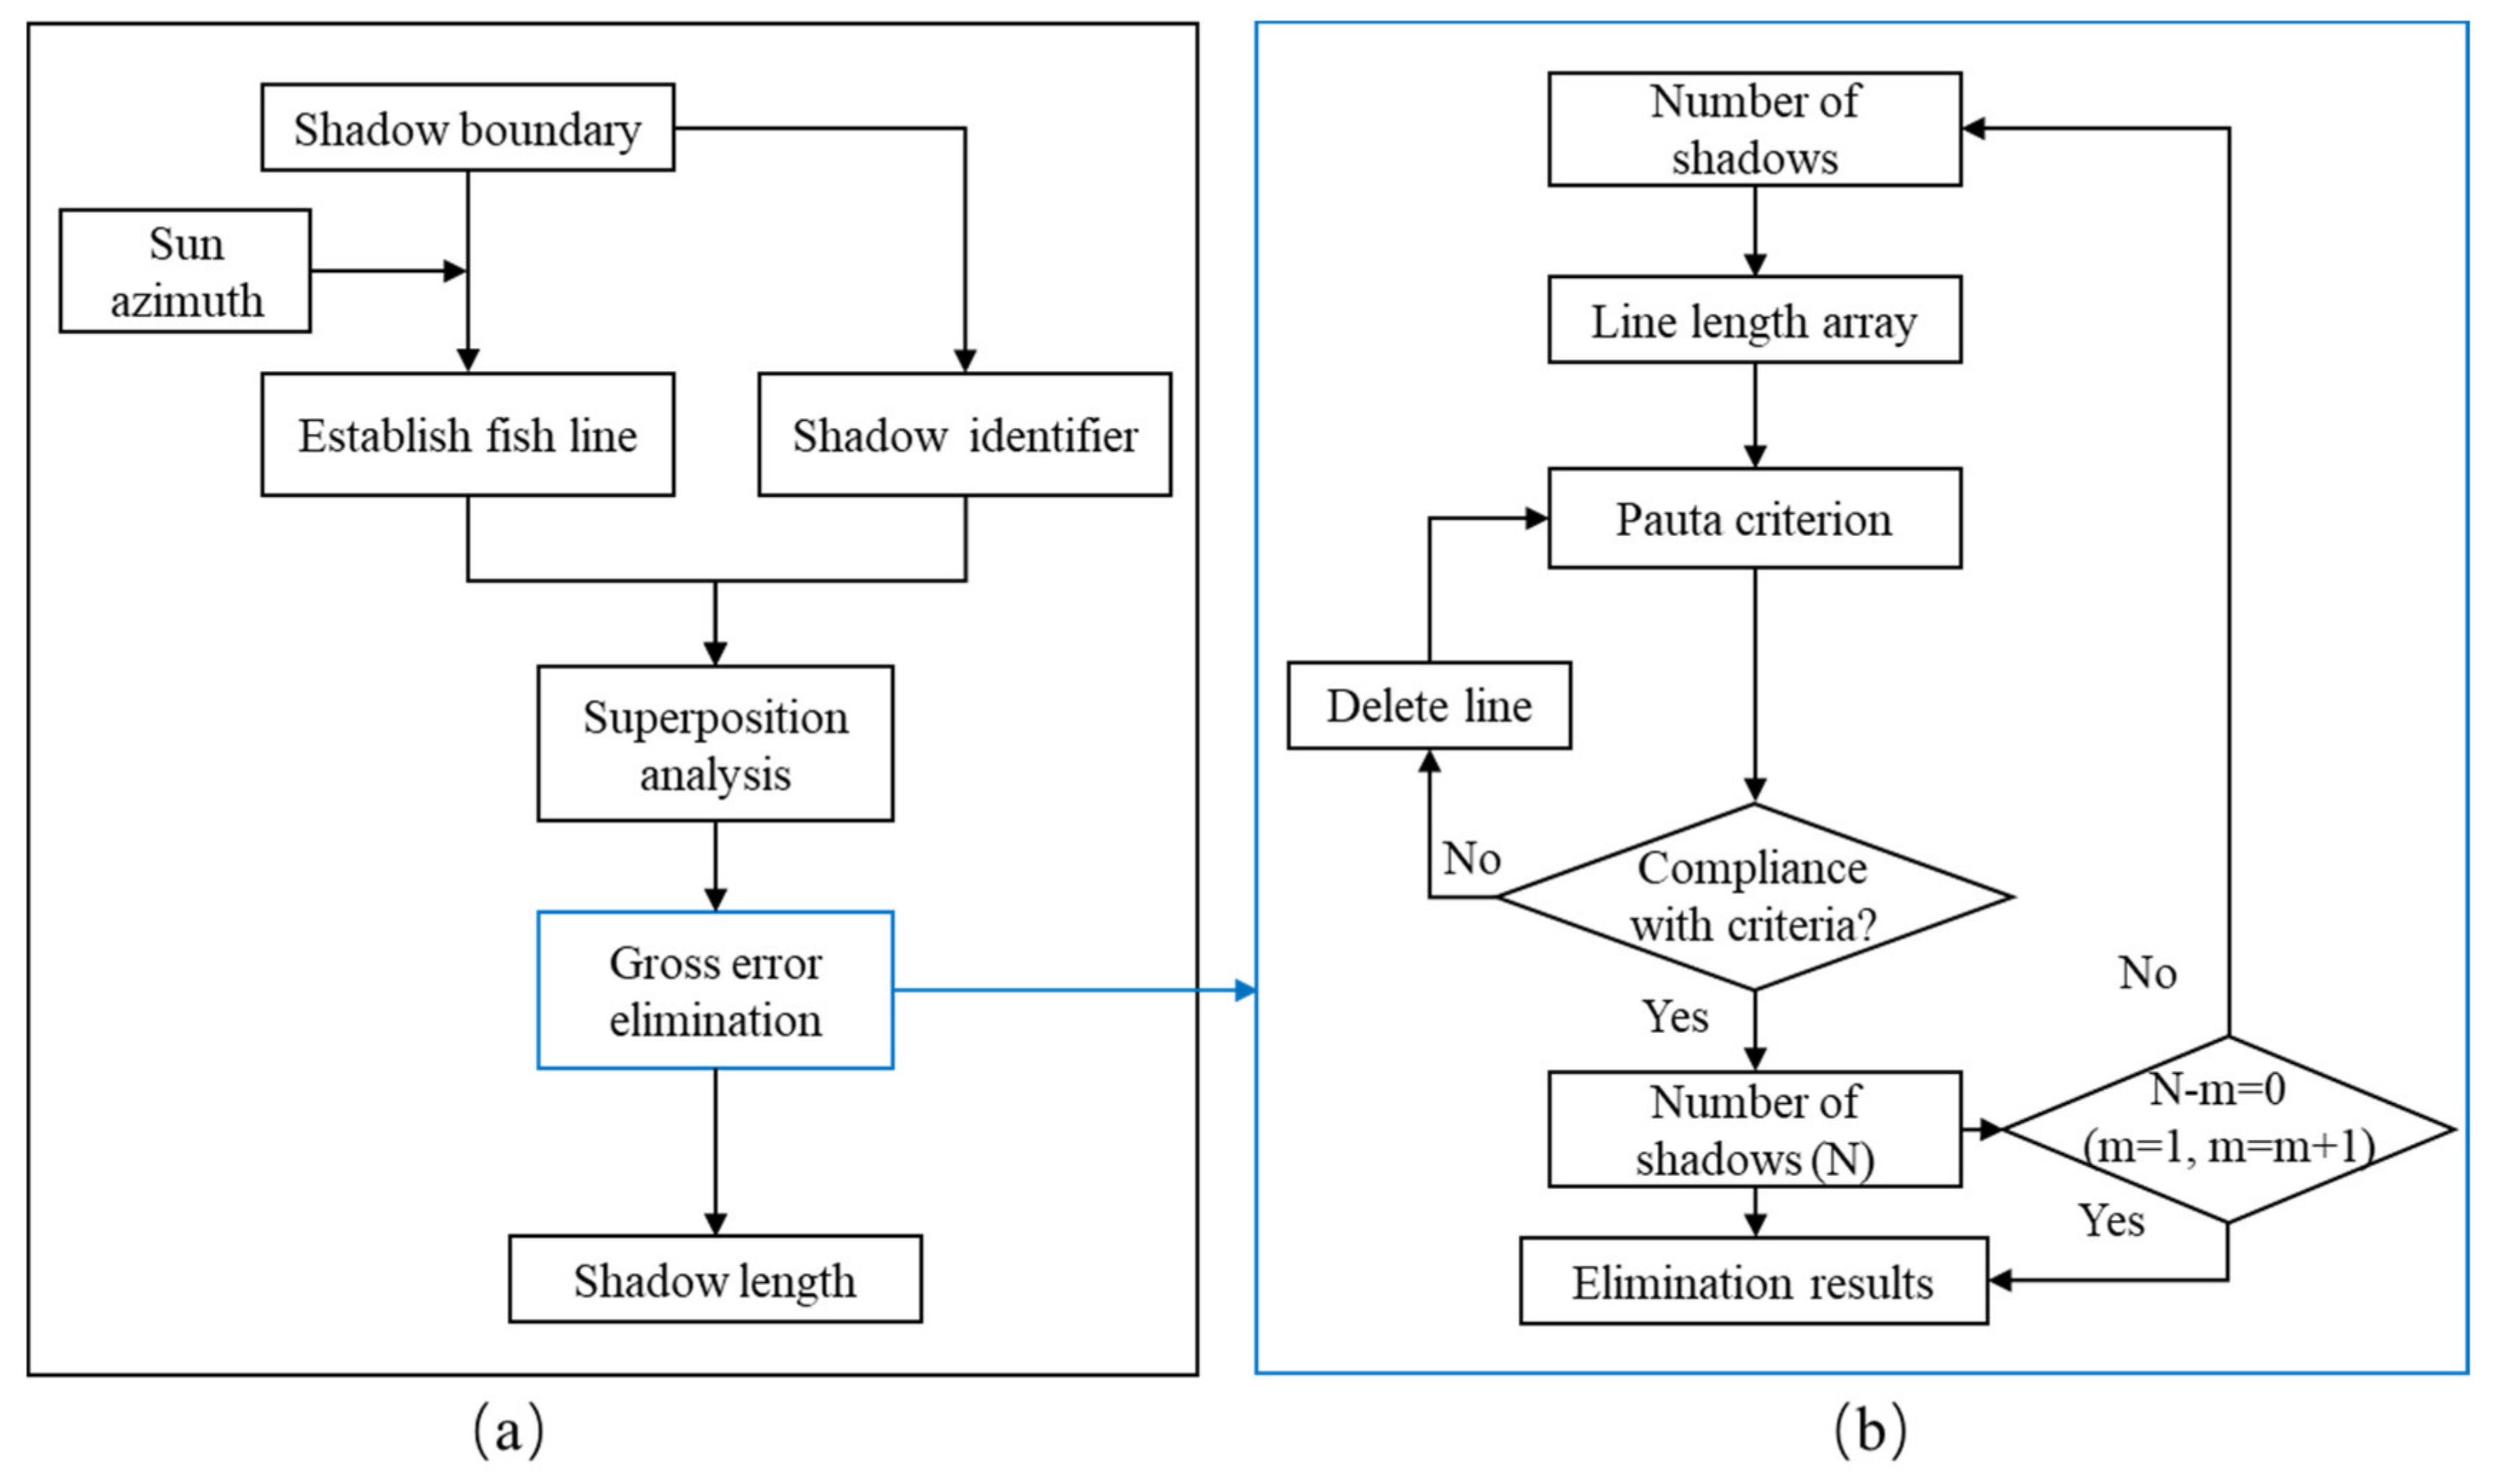
The shadow length calculation is a prerequisite for building height estimation. The existing methods for shadow length calculation include pixel method, area and perimeter, corner closest distance, and fish net [19]. However, it will be difficult to select appropriate feature points or feature lines of the pixel method, the area and perimeter, and the corner closest distance. The fish net has a wide range of applications for the shadow length calculation, which can generate a series of parallel lines in the shadow area to calculate shadow length [19]. However, the traditional fish net method has a large error for the spots and holes in the shadow. In addition, the mean value or median value of fish net length will produce greater errors for the shadow produced by complex-shaped buildings. In order to avoid the above problems, we propose that a method of shadow length calculation combines fish net and pauta criterion, as shown in Figure 8. The method includes two parts: fish net line generation and gross error elimination.
(1) Fish net line generation, as shown in Figure 8a. First, the shadow produced by the buildings is numbered, as shown in Figure 9a. Second, the fish net lines are constructed according to the sun azimuth, which is a cluster of parallel lines with certain intervals, as shown in Figure 9b. Finally, the fish net line and the shadow are superimposed to obtain the shadow line, as shown in Figure 9c.
(2) Gross error elimination, as shown in Figure 8b. The shadow length will produce a large error, if we calculate the average of shadow line directly. Therefore, we propose a method of eliminating gross errors based on the pauta criterion [46]. The pauta criterion assumes that a set of fishing net line length contains random errors only, calculates the standard deviation, and determines an interval with a certain probability. After that, it considers that any error that exceeds this interval is gross error, and deletes it. This method is often used to eliminate errors in measurement data. The pauta criterion can improve the calculation accuracy of the shadow length than average value or median value. The overall algorithm is explained as follows.
(1) Calculate the standard deviation σ and the arithmetic mean X for all the line lengths in each shadow plane.
(2) The triple standard deviation is used as the detection interval, and the given confidence probability is 99.73%.
(3) Find the residual error of the length of each cutting line in the shadow plane, as shown in Equation (11).
Vi=|XiX|
(4) Determine gross error, if Vi ≤ 3 σ , then the detection value is normal and should be retained; If Vi > 3 σ , the detected value is determined as an abnormal value and should be discarded; σ is the standard deviation. Repeat the above steps until all gross errors are eliminated, the final result is shown in Figure 9d.
To prove the advantages of the pauta criterion, we selected 18 buildings to calculate the building height using the shadow length based on average value, median value and pauta criterion for comparative experiments, and all errors are taken as absolute values. The result is shown in Table 1. Among them, the building number 7 is used as the reference data for height calculation, and its error is regarded as 0. The average value method has an absolute error between 0.76 m and 19.04 m, and average error is 6.57 m. The median value method has an absolute error between 0.21 m and 13.34 m, and average error is 3.07 m. After the error is eliminated by the pauta criterion, the absolute error range for calculating the height of the building is between 0.12 m and 1.81 m, and average error is 3.07 m. Compared with the average value and median value method, the average error is reduced by 2.38–5.88 m. It can be seen that the accuracy of building height calculated is higher after the gross error is eliminated by the pauta criterion. In particular, the shadow of the building number 10 is occluded and only a part of the shadow is detected. The average and median errors reached 12.13 m and 13.34 m, respectively. This error is extremely large, and the error is only 1.68 m by our method.

2.2.4. Shadow Length Correction under Complex Terrain

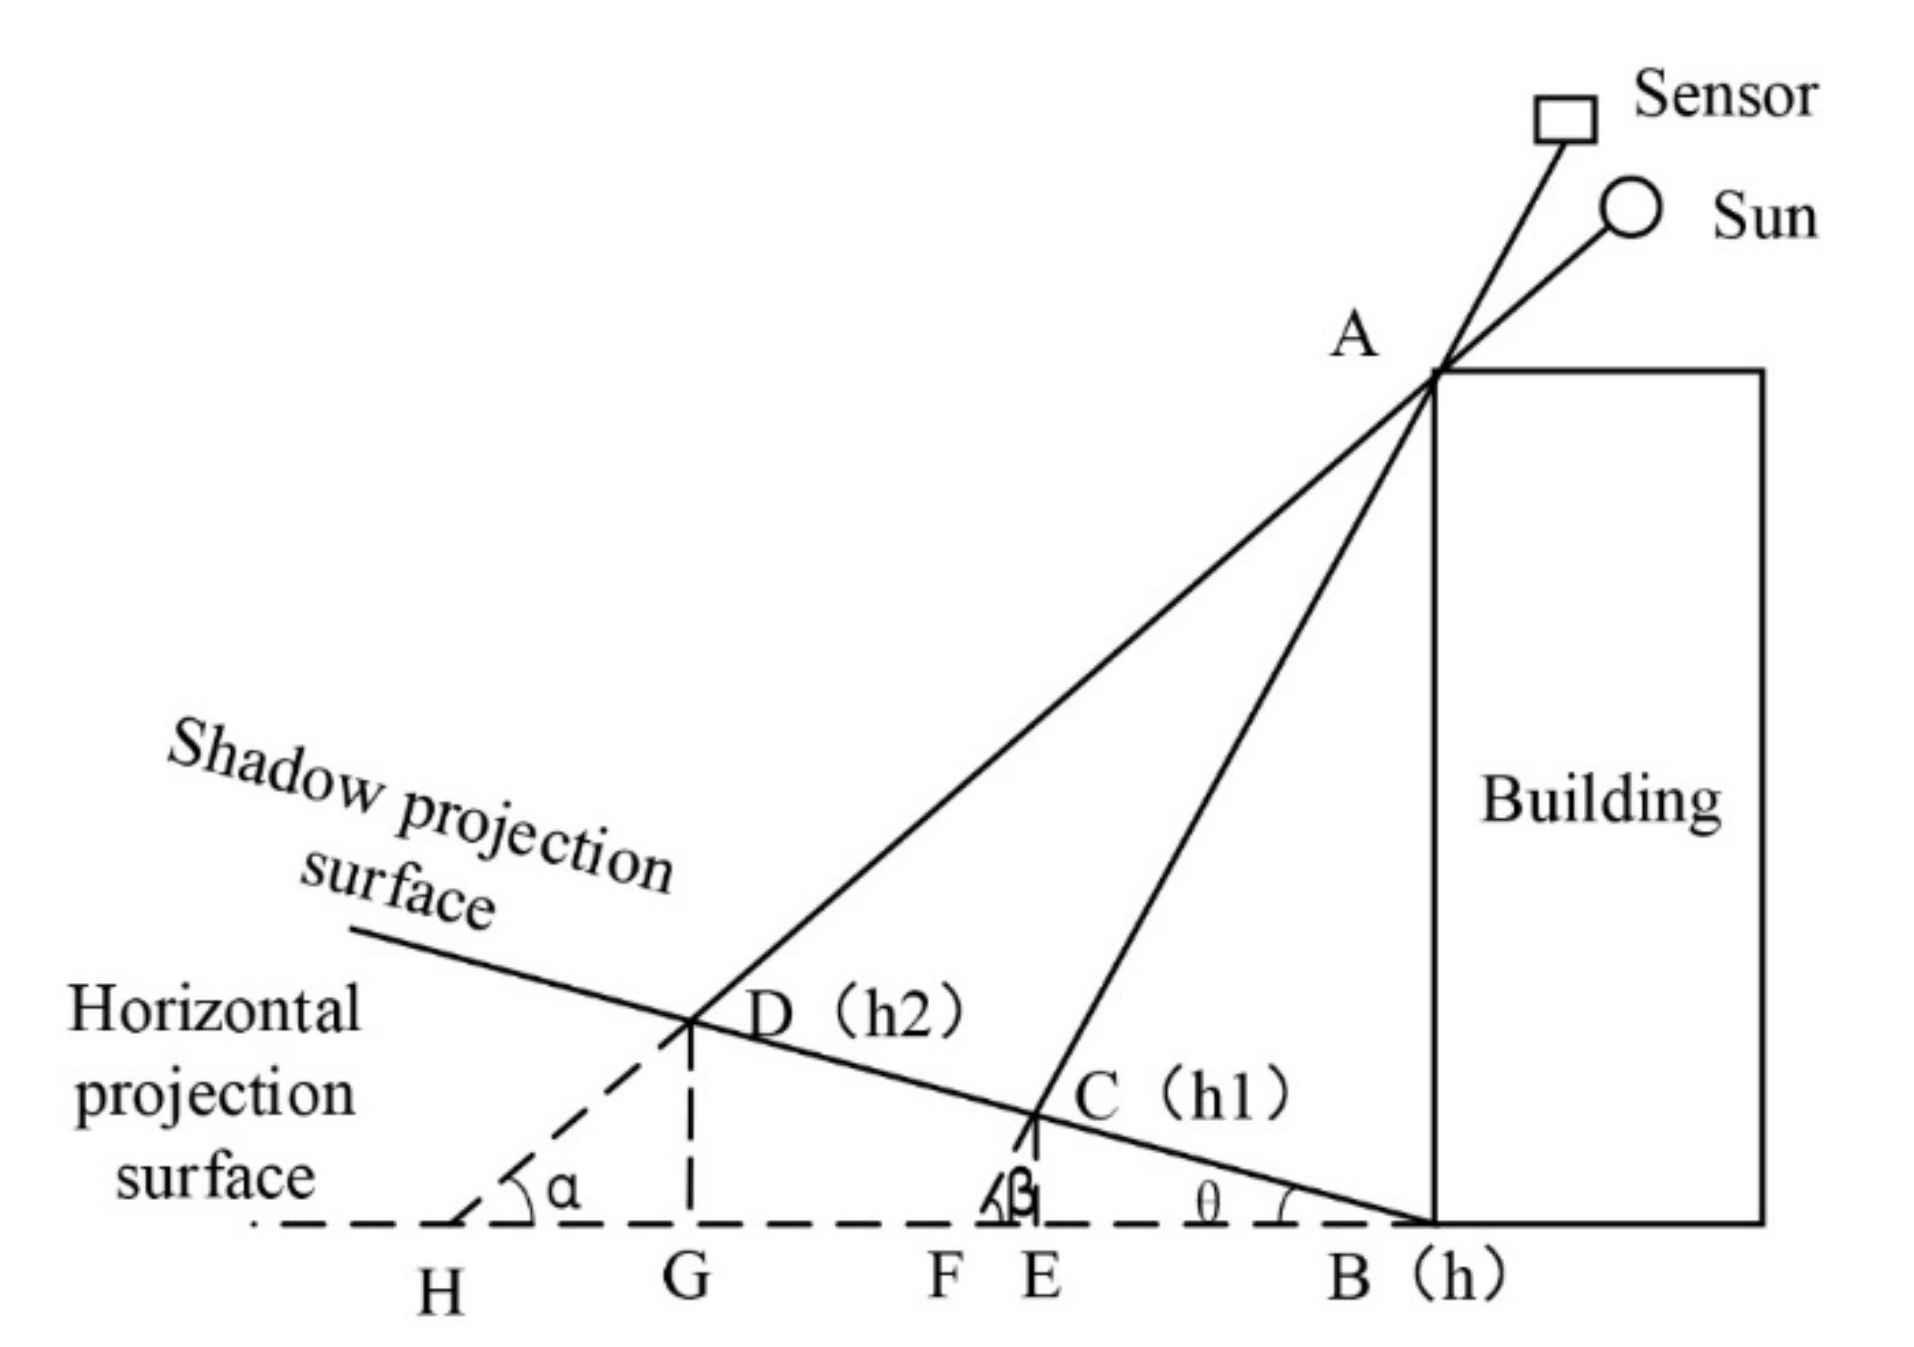
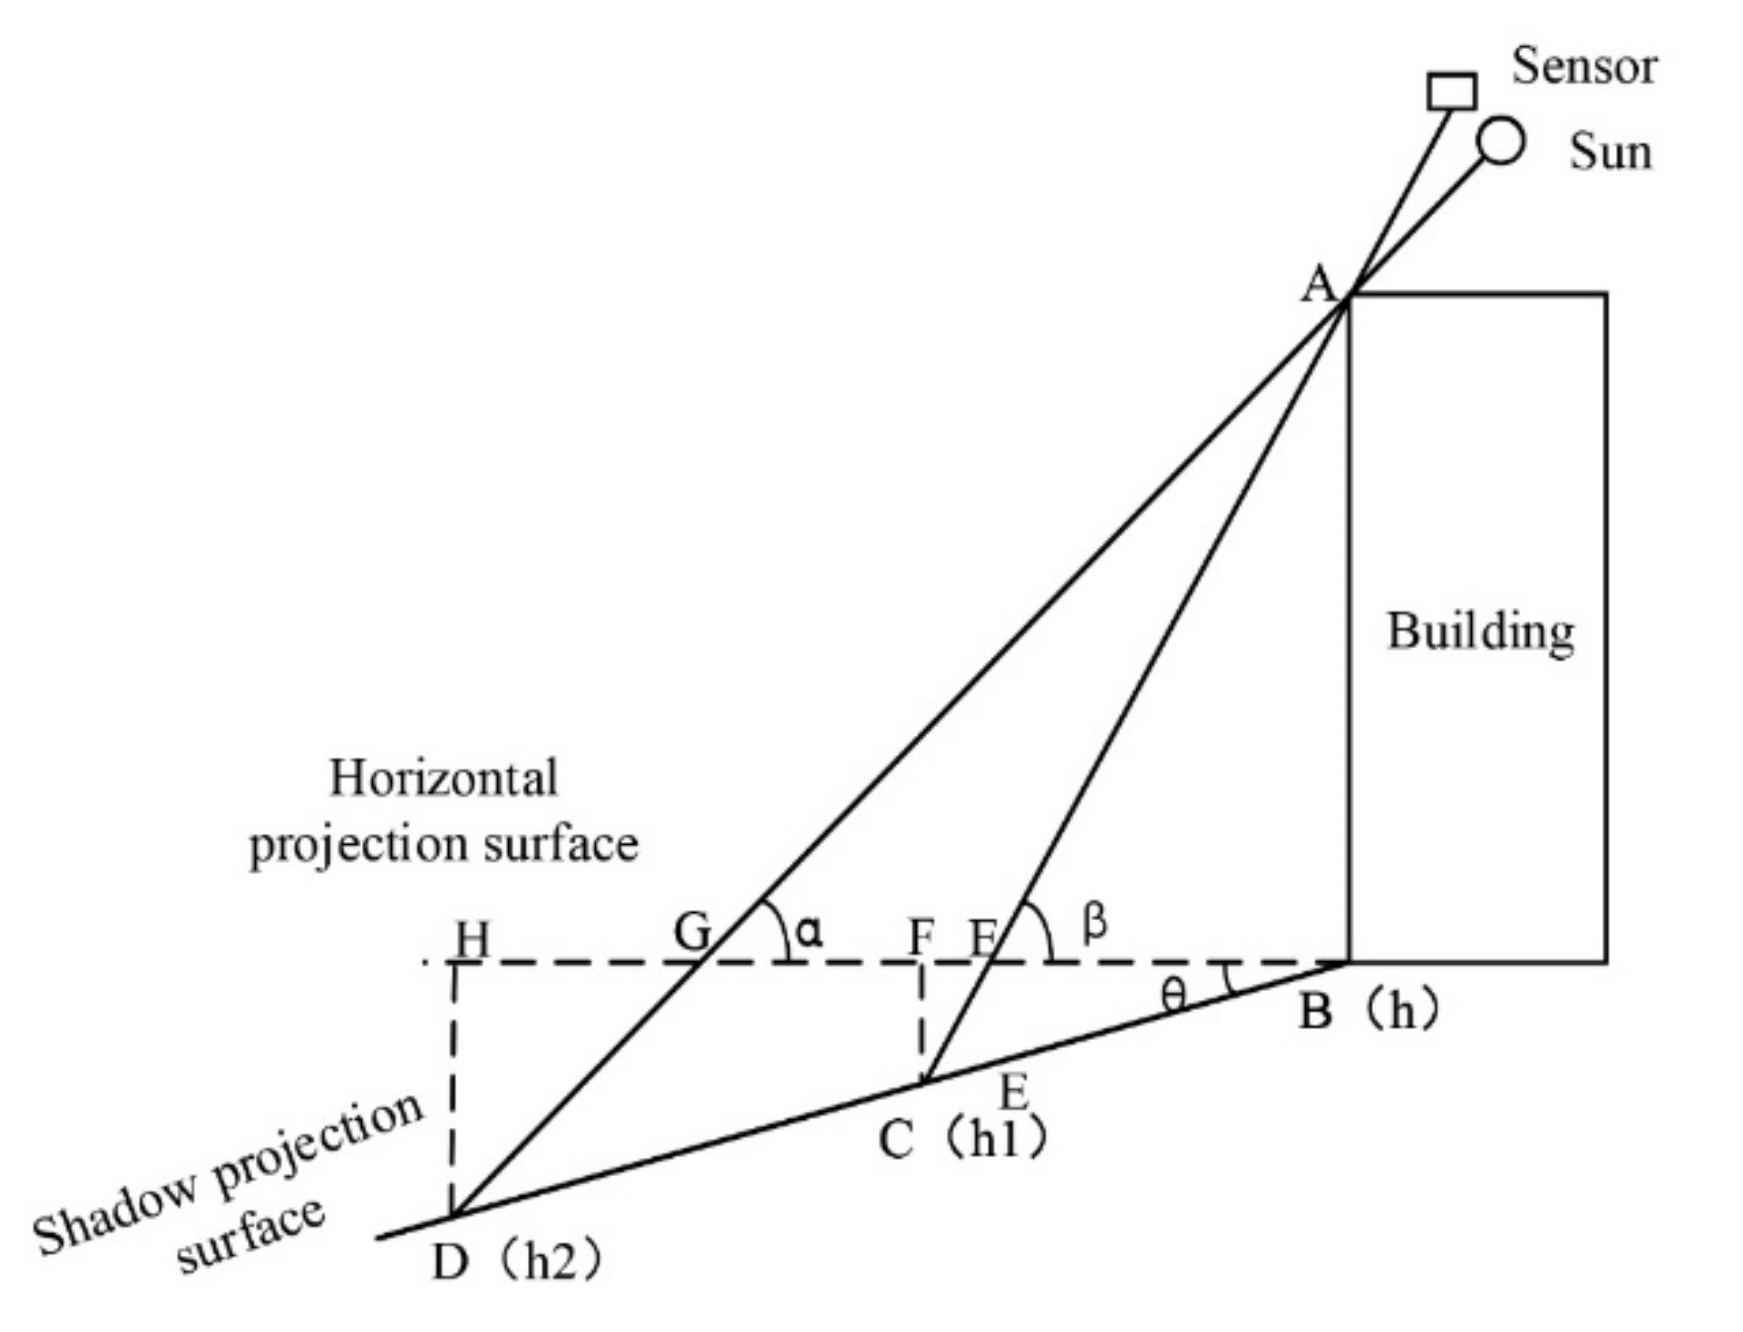
There is no guarantee that the building is located in a plain area in the actual situation, and the measured shadow length of the building is the slope distance because the actual bottom surface is non-horizontal. There will be large errors if the building height is extracted on the premise of assumptions. Therefore, the shadow length needs to be corrected under complex terrain. In this paper, a DEM-based correction model for the length of shadow under complex terrain is established. Firstly, the DEM is transformed into contour line. Secondly, the two ends of the shadow line are used as buffers to obtain the contour line elevation in the buffer area. Finally, the elevation is assigned to the end of the fishing net line for correction of the shadow length. The complex terrain shadow length correction is divided into two situations to establish the model, bearing in mind the fact that the elevation of the shadow projection surface is higher than the elevation of the bottom of the building and the elevation of the shadow projection surface is less than the elevation of the bottom surface of the building.
(1) The elevation of the shadow projection surface is higher than the horizontal projection surface, as shown in Figure 10. The shadow length obtained on the image is less than the actual shadow length of the building when the elevation of the shadow projection surface is higher than the elevation of the bottom of the building. The shadow length result is corrected by Equation (12).
H F = E G h 1 h t a n β + h 2 h t a n α
where EG is the measured shadow length in the image, and HF is the actual shadow length, α is sun elevation, β is sensor elevation, and h, h1, and h2 are the bottom surface of the building, the height of the shadow ends.
(2) The elevation of the shadow projection surface is less than the elevation of the horizontal projection surface, as shown in Figure 11. The shadow length obtained on the image is higher than the actual shadow length of the building when the elevation of the shadow projection surface is less than the elevation of the bottom of the building. The shadow length result is corrected by Equation (13).
G E = F H + h h 1 t a n β h h 2 t a n α
where FH is the total measured shadow length of the image, GE is the actual shadow length, α is sun elevation, β is sensor elevation, and h, h1, and h2 are the bottom surface of the building, the height of the shadow ends.

3. Experimental Results and Analysis

In order to verify the feasibility of our proposed approach, we judged the effectiveness of the building height estimation method in different scenarios. Relative error and absolute error are used as evaluation metrics in order to prove the effectiveness of our method. We selected five experimental areas for different scenarios. In addition, since the shadow projections of the buildings are all irregular shapes, we used the shadow length calculation method in Section 2.2.3 for all scenes in order to further improve the accuracy. In addition, it should be noted that all actual building heights are obtained by field measurement.

3.1. Building Height Estimation of Ordinary Scene

The first experimental area is a remote sensing image with a spatial resolution of 0.14 m in Sichuan, China, including 18 buildings. The azimuth difference between the sun and the sensor is greater than 180°. The height of building 7 is 20.84 m by field measurement, and the shadow length of the building obtained by the pauta criterion is 15.21 m. According to Equation (6), the value of constant k1 is 1.3701. The second experimental area is a remote sensing image with a spatial resolution of 0.61 m in Sichuan, China, including 43 buildings. The height of building 7 is 25.26 m by field measurement, and the shadow length obtained by the pauta criterion is 17.38 m, and the actual value of k2 is 1.4534. The visual display results of the shadow length calculation process in the two experimental areas are shown in Figure 12. Firstly, the shadow of the building is extracted based on the object-oriented method [43]; the result is shown in Figure 12a. Secondly, the fish net line is established according to the sun azimuth and superimpose it with the shadow boundary for analysis; the result is shown in Figure 12b. Finally, the shadow line length is extracted combined with fish net and pauta criterion, as shown in Figure 12b.
We obtain the building height in the actual scene through field measurement, and compare it with the calculated height. An error curve is drawn for the height calculation results of 59 buildings in experimental area 1 and experimental area 2, as shown in Figure 13. Among them, 43 buildings have an absolute error of 0~1 m, accounting for about 73%, 15 buildings have an error of 1 m~2 m, accounting for about 25%, and 1 building has an error of greater than 2 m, accounting for about 2%. The analysis found that the large absolute error of more than 2 m is caused by the large shadow extraction error of the building. In general, the 98% absolute error of the building height extracted by this method is between 0 m and 2 m, which can meet the requirements of urban planning and has a certain practical value.

3.2. Building Height Estimation in Dense Scene

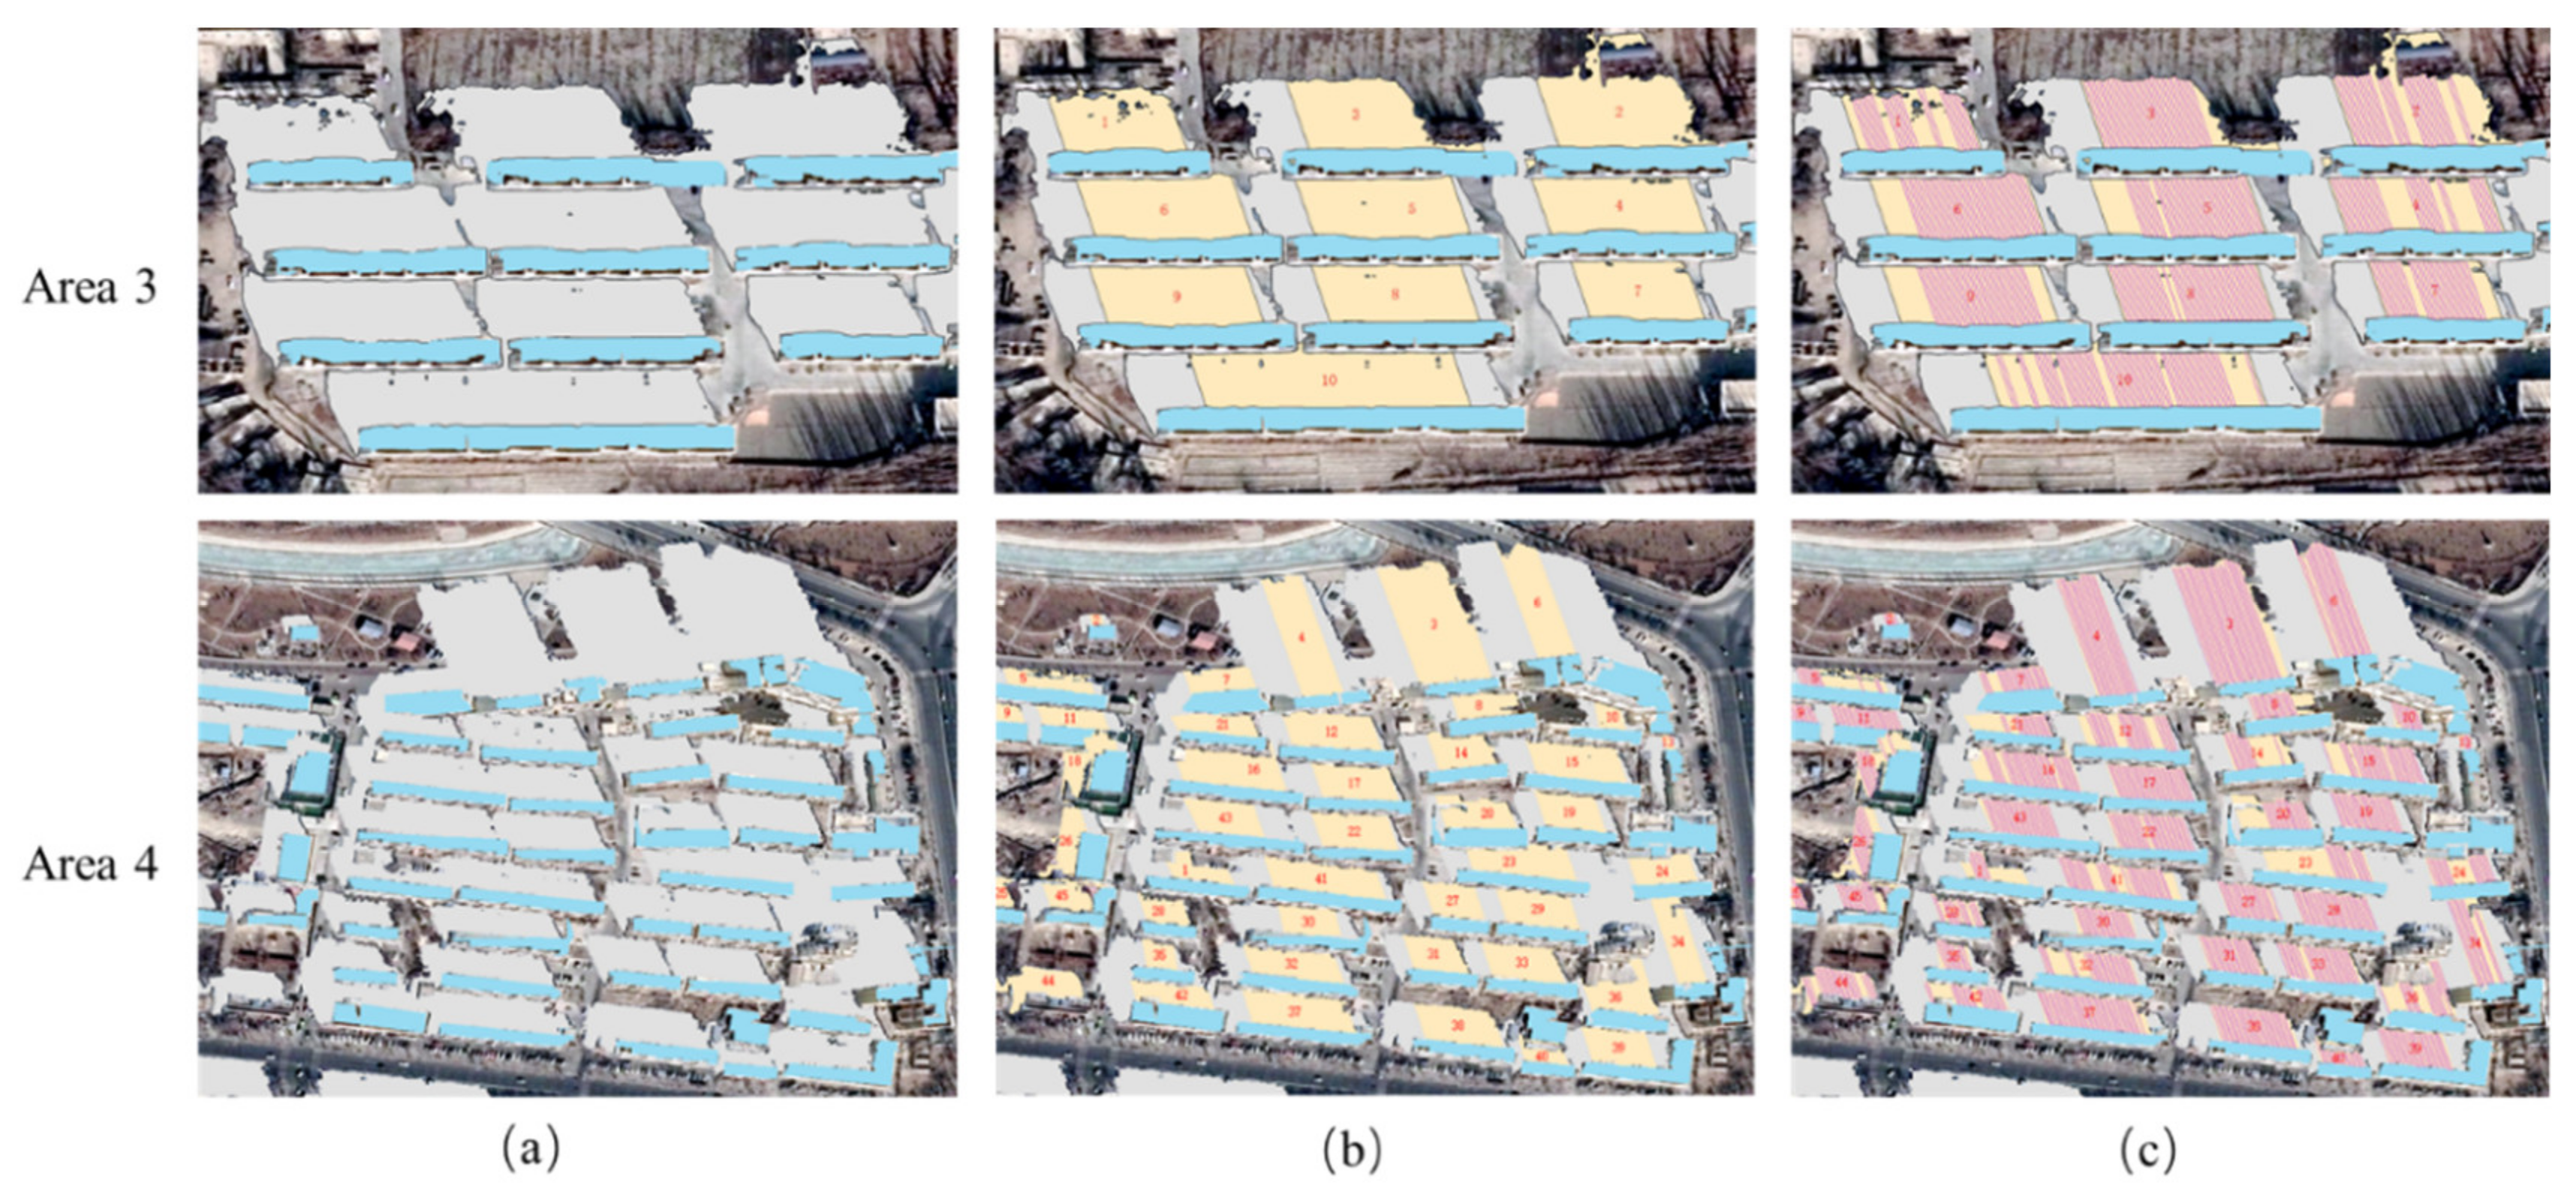
The third and fourth experimental areas are a remote sensing image with a spatial resolution of 1 m in Xinjiang, China. We select the images to verify the effectiveness of our method for dense scene areas. As shown in Figure 14a, the gray part is the extracted shadows, and the light blue is the building. There is obvious overlap in the building shadows, and it is impossible to calculate the height of buildings through the shadow. According to the building shadow regularization extraction method in Section 2.2.2, the available area of shadow can be obtained, as shown in the yellow area in Figure 14b. Finally, the shadow length is calculated by the fish net line and the pauta criterion, as shown in Figure 14c.
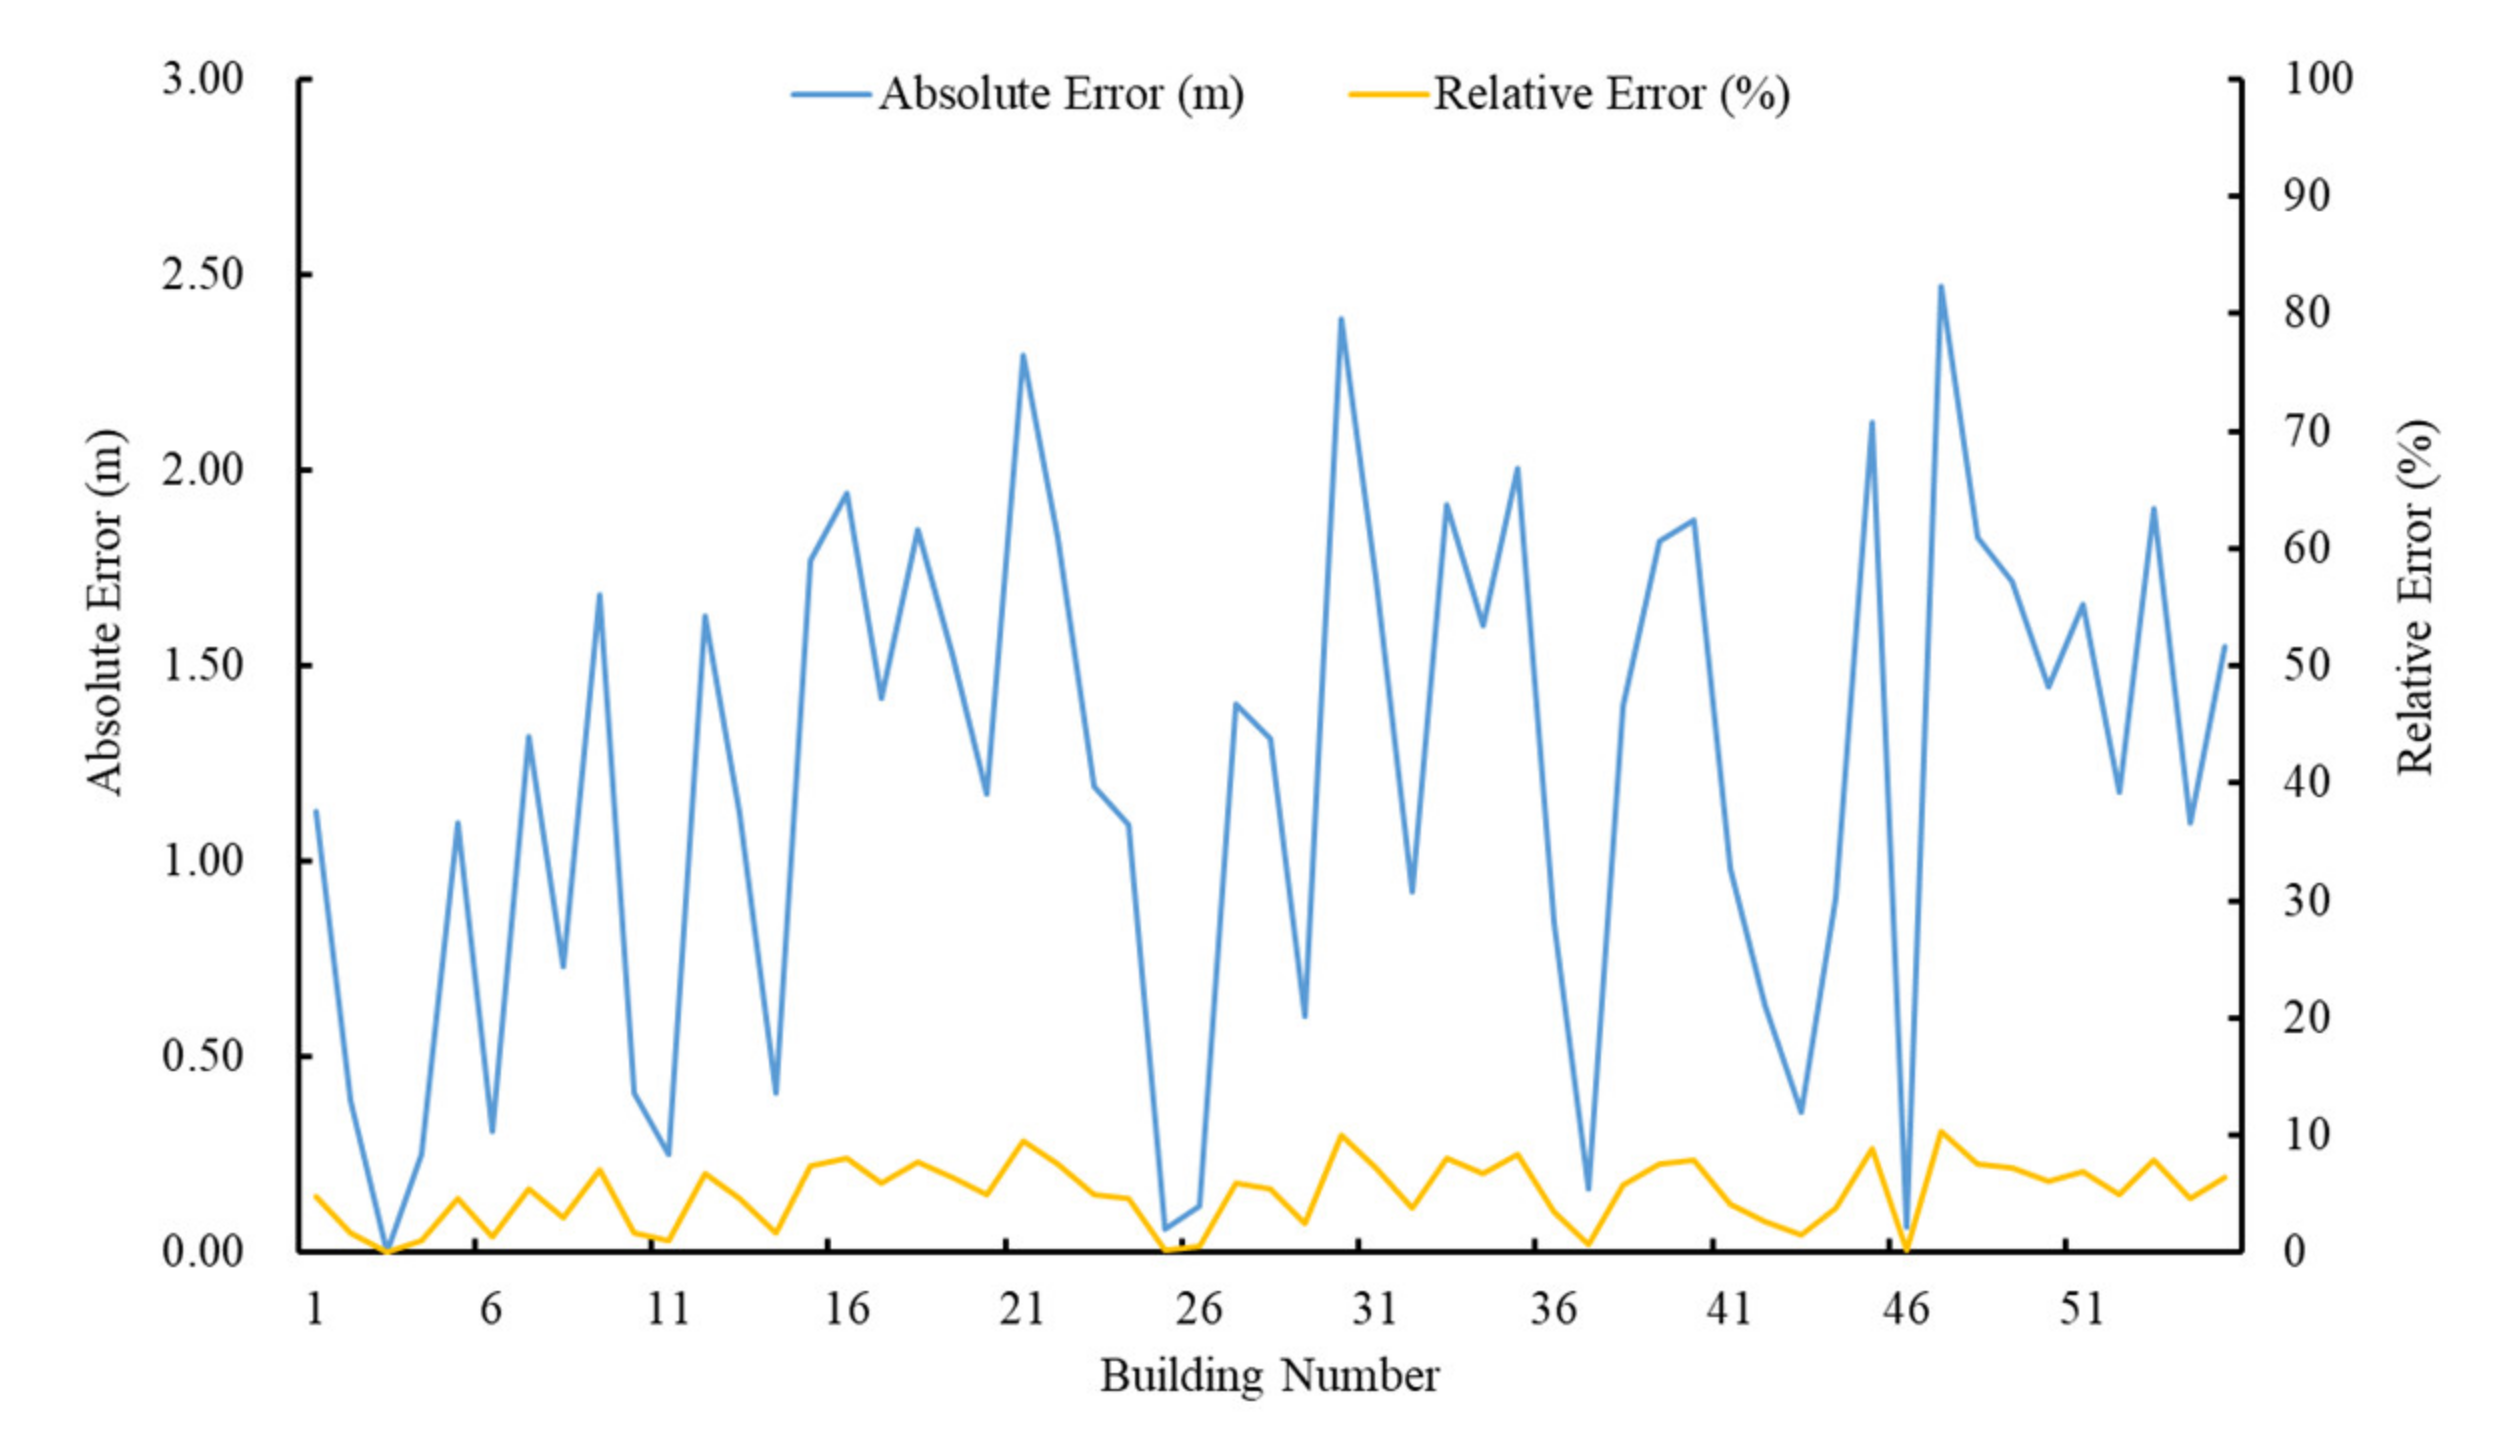
Quantitative statistics are performed on the height estimation results of 55 buildings in the third experimental area, where the proportional coefficient k1 is 0.5624, and the result is shown in Figure 15. It can be seen from the result that the height of buildings can be effectively extracted through the shadow regularization extraction method. The absolute error is within 3 m, and the relative error is kept within 10%, which can generally meet the needs of urban planning. This further proves the effectiveness of the shadow regularization extraction method in this paper for dense building areas.

3.3. Building Height Estimation for Complex Terrain Scene

The fifth experimental area is a remote sensing image with a spatial resolution of 0.14 m in Chongqing, China, as shown in Figure 16a. The terrain of the area is undulating, and the experiment can verify the correctness of the building height estimation model under complex terrain. Firstly, the DEM is transformed into contour lines, which are used to obtain the elevation value of complex terrain, as shown in Figure 16b. Secondly, the shadow of building boundary is extracted, in which the shape of building shadow is complex, as shown in the red box in Figure 16c. Finally, the shadow lines that can be used for building height estimation are obtained by the method of combination of the fish net and the pauta criterion, as shown in Figure 16d.
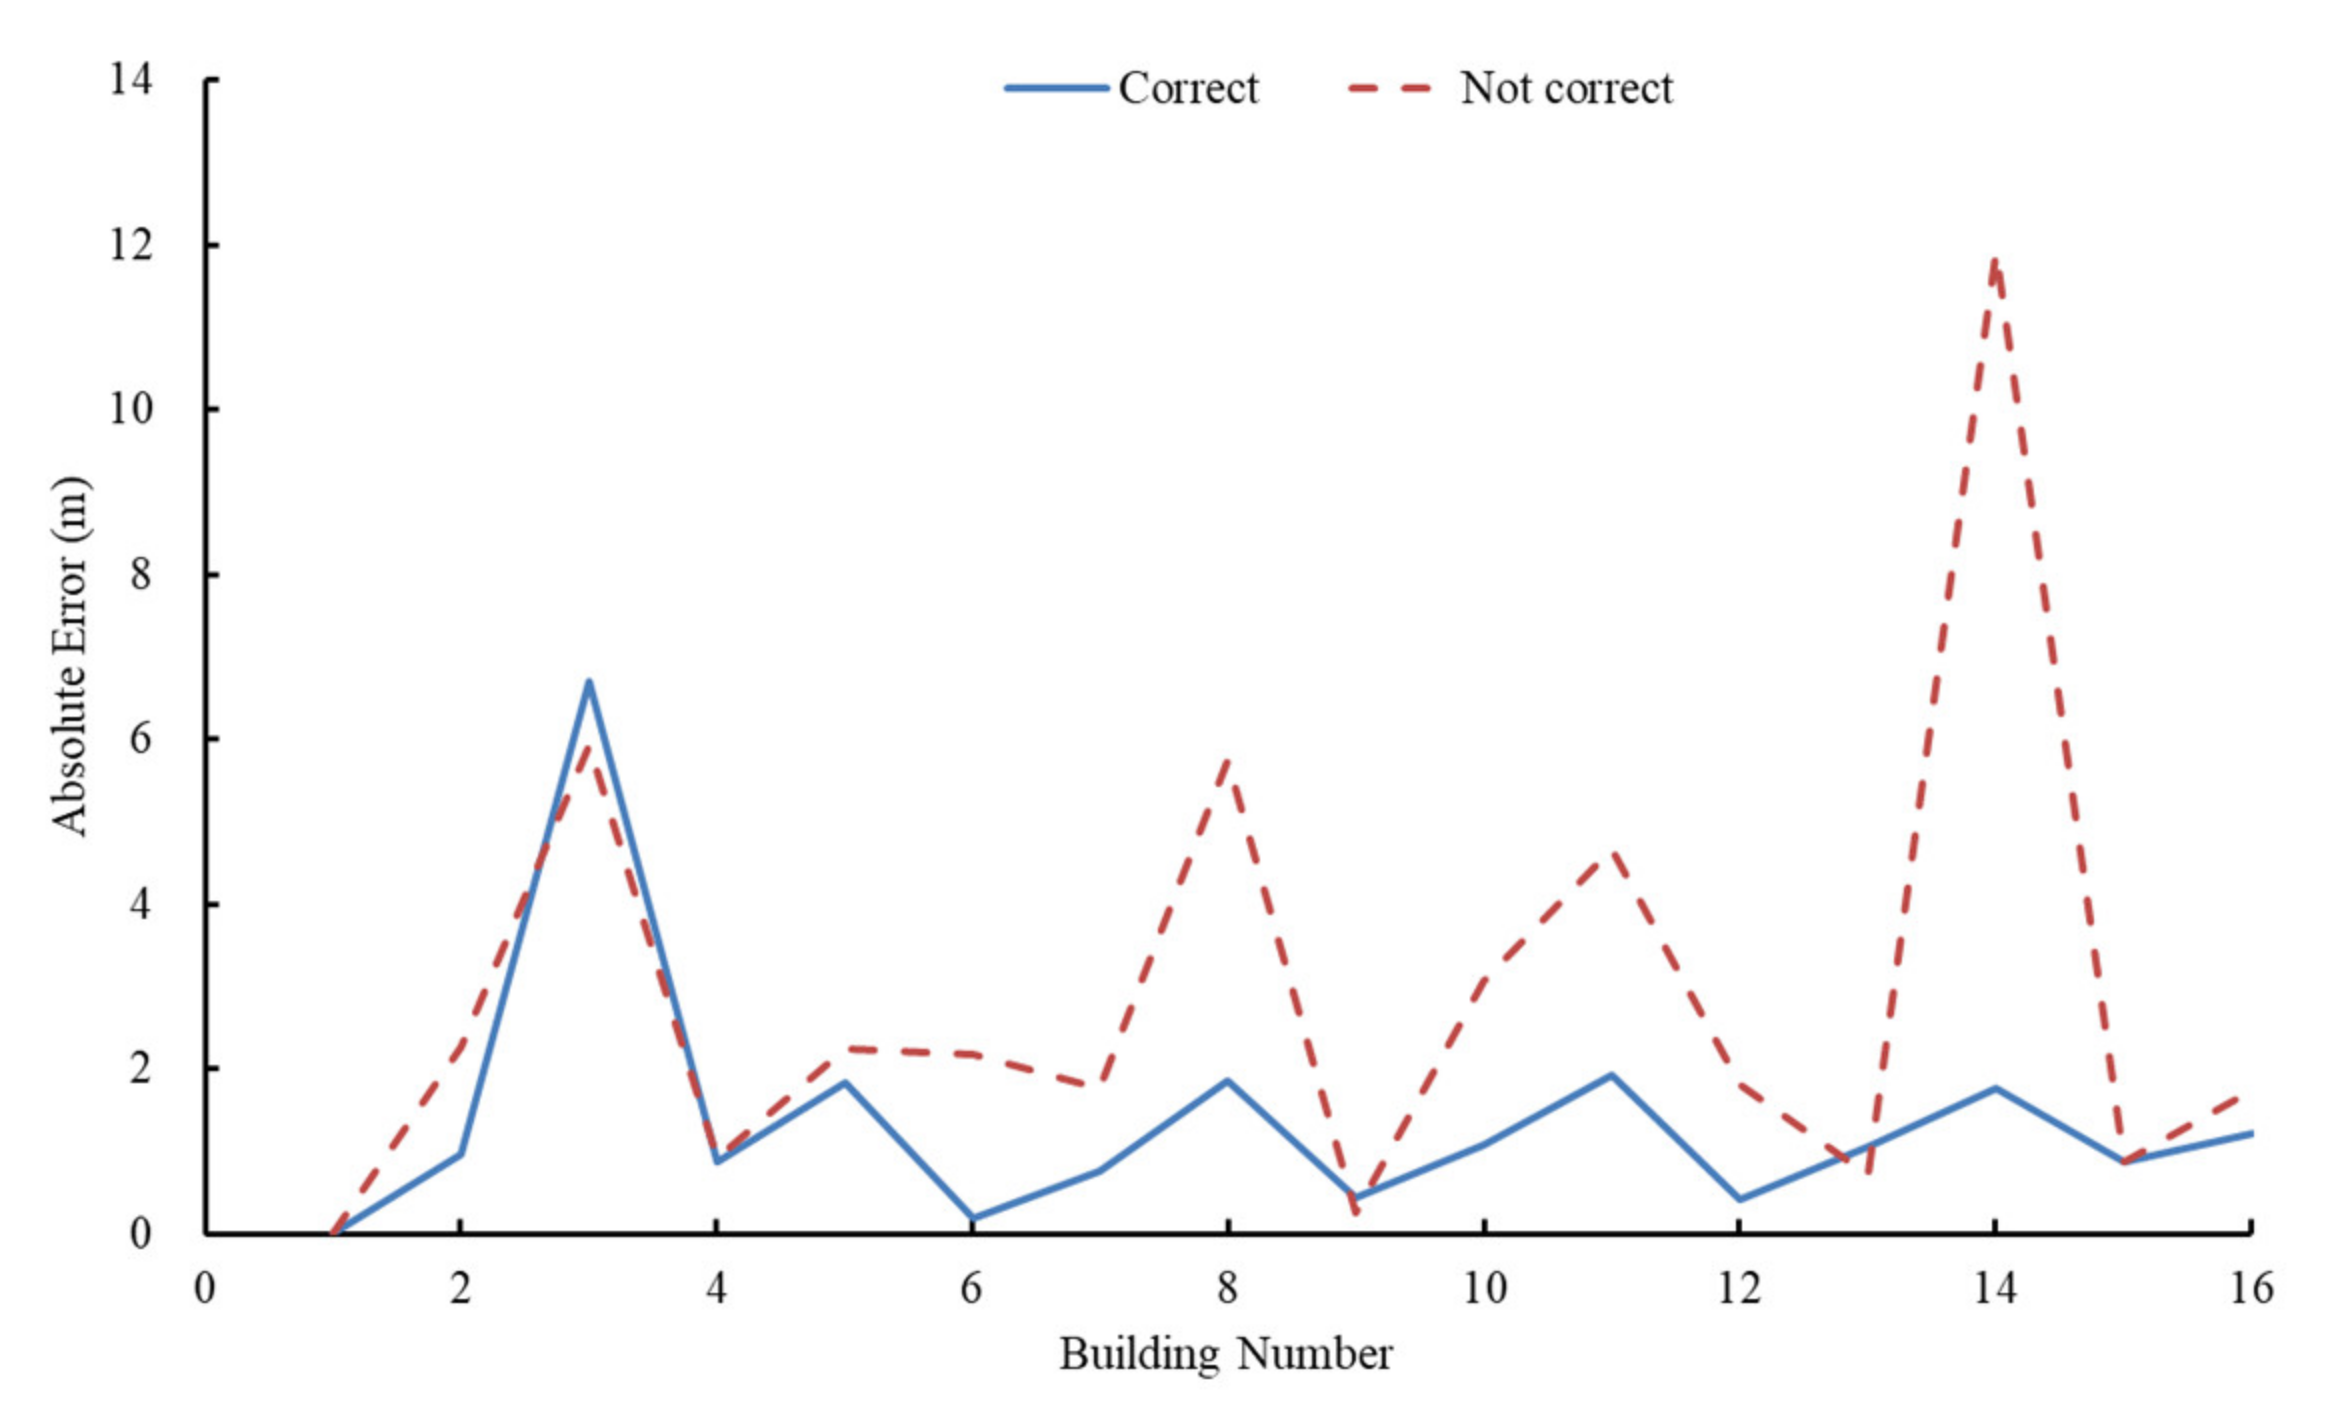
The shadow correction results and uncorrected results of 16 buildings in the fifth experimental area are statistically analyzed. The uncorrected proportional coefficient is 1.311, and the corrected proportional coefficient is 1.097. Finally, the building height error curve is drawn according to the calculation results, as shown in Figure 17. It can be seen from the result that most of the absolute height errors of 16 buildings in the experimental area are less than 2 m after shadow correction, and the fluctuation range of the absolute error is small. Among them, only one building is more than 2 m, which is due to the low accuracy of contour lines and imperfect shadow extraction. However, the absolute error of building heights without shadow correction fluctuate greatly, and the maximum error reaches 11.91 m, which cannot meet the accuracy requirements of building height estimation.

3.4. Comparison with Different Methods

In order to prove the advantages of our method, we choose two methods to compare with our method in five experimental areas; the result is shown in Table 2. It can be seen that our method has better performance. The method proposed by Liasis et al. [19] reached an average of 4.89 m and 17.28% in absolute error and relative error, respectively. The reason for this large error is that the shadow boundary in the shadow experiment area is more complicated, and there are some holes in the shadow. The gross error cannot be avoided by only using the median method. The method proposed by Chen et al. [47] reached an average of 2.37 m and 9.54% in absolute error and relative error, respectively. The method in this paper has higher accuracy, in which the average absolute error reaches 1.13 m, and the average relative error reaches 3.49%. In addition, we use aggregate variance to verify the stability of our method. Compared with the comparison method, the aggregate variance value of our method is increased by 1.83–4.6, which can prove that our method not only has better accuracy but also has better stability.
Furthermore, to further prove the robustness of our method, we use the Worldview-3 image provided by Chen [47] for building height calculation experiments, and compare the results with our method; the result is shown in Table 3. Compared with the method proposed by Chen, our method increases the average value of absolute error and the average value of relative error by 1.02 m and 1.18%, respectively. In addition, in terms of the stability of the method, it shows a stronger advantage, with an increase of 9.54. Experiments in different experimental areas show that our method has better robustness for building height estimation.

3.5. Speed Analysis of the Proposed Algorithm

In addition to accuracy, estimation speed is also one of the important conditions for the feasibility of the method. We tested our method in three different device configurations, including Device1 (an Intel Core i7-8750H CPU with 16 GB of RAM), Device2 (an Intel(R) Core (TM) i7-4810MQ CPU with 8 GB of RAM), and Device3 (an Intel(R) Core (TM) i7-5500U CPU with 8 GB of RAM); the result is shown in Table 4. The average time used in different experimental equipment are 5.1 min, 7.0 min, 9.2 min respectively. In practical applications, the average value is kept within 10 min even in device 3 with lower performance, which proves that the method in this paper has higher efficiency and can realize building height estimation.

4. Conclusions and Future Works

Although there is much research on building height estimation by shadow, there is little research on the calculation methods of building height in different scenes. In this paper, we implement a variety of scenarios of the building height estimation method, and verify the effectiveness of the method framework in several experimental areas. Firstly, we completed the classification and semantic description of building shadows in different scenes, which provides a basis for using shadows to extract building height. Secondly, we solved the problem of building shadows’ mutual adhesion in dense areas, which is very common in remote sensing images. Then, the shadow length is calculated by combining the fish net line and the pauta criterion in order to obtain more accurate shadow lines, which provides a more reliable data basis for building height estimation. Finally, the comparison with existing methods under the same data also proves that our method has accuracy advantages. In this work, using our method can effectively avoid the limitation of ideal conditions in traditional building height estimation methods, and further expand the application scenarios of building height estimation using shadow.
However, the estimation accuracy still needs to be further improved, and the scene scalability also needs to be further expanded. In future works, we consider using artificial intelligence methods for in-depth research on this basis, so that the building height estimation results can achieve higher accuracy and be applied to more complex scenes.

Author Contributions

Conceptualization, Y.X., D.F. and J.Z.; data curation, Y.X., D.F. and Y.L.; formal analysis, Y.X.; funding acquisition, J.Z.; investigation, J.Z.; methodology, Y.X., D.F. and J.Z.; project administration, D.F.; software, S.X. and Y.L.; supervision, D.F.; validation, S.X. and Y.L.; visualization, S.X.; writing—original draft, Y.X. and S.X.; writing—review and editing, Y.X., D.F. and J.Z. All authors have read and agreed to the published version of the manuscript.

Funding

This paper was supported by the National Natural Science Foundation of China (Grant Nos. U2034202 and 41871289), the Sichuan Youth Science and Technology Innovation Team (Grant No. 2020JDTD0003), and the road affairs center of Chongqing (Grant No. R113520H01095).

Acknowledgments

The authors would like to thank Xiaoliang Shi and Chong Chen from Xi’an University of Science and Technology for providing the comparative dataset. All authors would sincerely thank the reviewers and editors for their beneficial, careful, and detailed comments and suggestions for improving the paper.

Conflicts of Interest

The authors declare no conflict of interest.

References

  1. Liu, J.; Li, P.; Wang, X. A new segmentation method for very high resolution imagery using spectral and morphological information. ISPRS J. Photogramm. Remote Sens. 2015, 101, 145–162. [Google Scholar] [CrossRef]
  2. Zhang, X.; Chen, Z.; Yue, Y.; Qi, X.; Zhang, C.H. Fusion of remote sensing and internet data to calculate urban floor area ratio. Sustainability 2019, 11, 3382. [Google Scholar] [CrossRef] [Green Version]
  3. Cheng, G.; Han, J. A survey on object detection in optical remote sensing images. ISPRS J. Photogramm. Remote Sens. 2016, 117, 11–28. [Google Scholar] [CrossRef] [Green Version]
  4. Liu, C.-J.; Krylov, V.; Kane, P.; Kavanagh, G.; Dahyot, R. IM2ELEVATION: Building height estimation from single-view aerial imagery. Remote Sens. 2020, 12, 2719. [Google Scholar] [CrossRef]
  5. Frantz, D.; Schug, F.; Okujeni, A.; Navacchi, C.; Wagner, W.; van der Linden, S.; Hostert, P. National-scale mapping of building height using Sentinel-1 and Sentinel-2 time series. Remote. Sens. Environ. 2021, 252, 112128. [Google Scholar] [CrossRef]
  6. Aringer, K.; Roschlaub, R. Bavarian 3d building model and update concept based on lidar, image matching and cadastre information. In Innovations in 3D Geo-Information Sciences; Isikdag, U., Ed.; Springer International Publishing: Cham, Switzerland, 2014; pp. 143–157. [Google Scholar]
  7. Gamba, P.; Houshmand, B. Digital surface models and building extraction: A comparison of IFSAR and LIDAR data. IEEE Trans. Geosci. Remote Sens. 2000, 38, 1959–1968. [Google Scholar] [CrossRef]
  8. Lu, Z.; Im, J.; Rhee, J.; Hodgson, M. Building type classification using spatial and landscape attributes derived from LiDAR remote sensing data. Landsc. Urban Plan. 2014, 130, 134–148. [Google Scholar] [CrossRef]
  9. Dubois, C.; Thiele, A.; Hinz, S. Building detection and building parameter retrieval in InSAR phase images. ISPRS J. Photogramm. Remote Sens. 2016, 114, 228–241. [Google Scholar] [CrossRef]
  10. Thiele, A.; Cadario, E.; Schulz, K.; Thoennessen, U.; Soergel, U. Building recognition from multi-aspect high-resolution insar data in urban areas. IEEE Trans. Geosci. Remote Sens. 2009, 45, 3583–3593. [Google Scholar] [CrossRef]
  11. Sauer, S.; Ferro-Famil, L.; Reigber, A.; Pottier, E. Multi-aspect POLInSAR 3D urban scene reconstruction at L-band. In Proceedings of the European Conference on Synthetic Aperture Radar, Friedrichshafen, Germany, 2–5 June 2008; Volume 3. [Google Scholar]
  12. Stal, C.; Tack, F.; De Maeyer, P.; De Wulf, A.; Goossens, R. Airborne photogrammetry and lidar for DSM extraction and 3D change detection over an urban area—A comparative study. Int. J. Remote Sens. 2013, 34, 1087–1110. [Google Scholar] [CrossRef] [Green Version]
  13. Takaku, J.; Tadono, T.; Tsutsui, K.; Ichikawa, M. Validation of "AW3D" global DSM generated from ALOS prism. ISPRS Ann. Photogramm. Remote Sens. Spat. Inf. Sci. 2016, III-4, 25–31. [Google Scholar] [CrossRef] [Green Version]
  14. Unger, J.; Reich, M.; Heipke, C. UAV-based photogrammetry: Monitoring of a building zone. ISPRS Int. Arch. Photogramm. Remote Sens. Spat. Inf. Sci. 2014, XL-5, 601–606. [Google Scholar] [CrossRef] [Green Version]
  15. Wang, X.; Yu, X.; Ling, F. Building heights estimation using ZY3 data-A case study of Shanghai, China. In Proceedings of the IEEE International Geoscience and Remote Sensing Symposium, Quebec City, QC, Canada, 13–18 July 2014; pp. 1749–1752. [Google Scholar] [CrossRef]
  16. Liu, Z.J.; Wang, J.; Liu, W.P. Building extraction from high resolution imagery based on multi-scale object oriented classification and probabilistic hough transform. In Proceedings of the IEEE International Geoscience and Remote Sensing Symposium, Seoul, Korea, 25–29 July 2005; pp. 2250–2253. [Google Scholar] [CrossRef]
  17. Hartl, P.; Cheng, F. Delimiting the building heights in a city from the shadow on a panchromatic SPOT-image: Part 2: Test of a complete city. Int. J. Remote Sens. 1995, 16, 2829–2842. [Google Scholar] [CrossRef]
  18. Cheng, F.; Thiel, K.-H. Delimiting the building heights in a city from the shadow in a panchromatic SPOT-image—Part 1. Test of forty-two buildings. Int. J. Remote Sens. 1995, 16, 409–415. [Google Scholar] [CrossRef]
  19. Liasis, G.; Stavrou, S. Satellite images analysis for shadow detection and building height estimation. ISPRS J. Photogramm. Remote Sens. 2016, 119, 437–450. [Google Scholar] [CrossRef]
  20. Soergel, U.; Thoennessen, U.; Gross, H.; Stilla, U. Segmentation of interferometric SAR data for building detection. Int. Arch. Photogramm. Remote Sens. 2000, 33, 328–335. [Google Scholar] [CrossRef] [Green Version]
  21. Sportouche, H.; Tupin, F.; Denise, L. Building detection by fusion of optical and SAR features in metric resolution data. In Proceedings of the IEEE International Geoscience and Remote Sensing Symposium, Yokohama, Japan, 28 July 28–2 August 2019; pp. 769–772. [Google Scholar] [CrossRef]
  22. Wegner, J.D.; Ziehn, J.R.; Soergel, U. Combining high-resolution optical and InSAR features for height estimation of buildings with flat roofs. IEEE Trans. Geosci. Remote Sens. 2013, 52, 5840–5854. [Google Scholar] [CrossRef]
  23. Brunner, D.; Lemoine, G.; Bruzzone, L.; Greidanus, H. Building height retrieval from vhr sar imagery based on an iterative simulation and matching technique. IEEE Trans. Geosci. Remote Sens. 2009, 48, 1487–1504. [Google Scholar] [CrossRef]
  24. Vu, T.T.; Yamazaki, F.; Matsuoka, M. Multi-scale solution for building extraction from LiDAR and image data. Int. J. Appl. Earth Obs. Geoinformation 2009, 11, 281–289. [Google Scholar] [CrossRef]
  25. Ding, W.; Zhu, F.; Hao, Y. Interactive 3D city modeling using Google Earth and ground images. In Proceedings of the Fourth International Conference on Image and Graphics, Chengdu, China, 22–24 August 2007; pp. 849–854. [Google Scholar] [CrossRef] [Green Version]
  26. Chen, A.J.; XU, G.Y.; Shi, Y.C. Automated 3D building modeling based on urban aerial stereopair. Acta Geod. Et Cartogr. Sin. 2002, 1, 54–59. [Google Scholar] [CrossRef]
  27. Massalabi, D.-C.H.A.; Massalabi, A.; He, D.-C.; Bénié, G.; Beaudry, E. Detecting information under and from shadow in panchromatic IKONOS images of the city of Sherbrooke. In Proceedings of the IEEE International Geoscience and Remote Sensing Symposium, Anchorage, AK, USA, 20–24 September 2004; Volume 3, pp. 2000–2003. [Google Scholar] [CrossRef]
  28. Kim, T.; Javzandulam, T.; Lee, T.-Y. Semiautomatic reconstruction of building height and footprints from single satellite images. In Proceedings of the 2007 IEEE International Geoscience and Remote Sensing Symposium, Barcelona, Spain, 23–28 July 2007; pp. 4737–4740. [Google Scholar] [CrossRef]
  29. Qi, F.; Wang, Y. A new calculation method for shape coefficient of residential building using Google Earth. Energy Build. 2014, 76, 72–80. [Google Scholar] [CrossRef]
  30. Lee, T.; Kim, T. Automatic building height extraction by volumetric shadow analysis of monoscopic imagery. Int. J. Remote Sens. 2013, 34, 5834–5850. [Google Scholar] [CrossRef]
  31. Comber, A.J.; Umezaki, M.; Zhou, R.; Ding, Y.; Li, Y.; Fu, H.; Jiang, H.; Tewkesbury, A. Using shadows in high-resolution imagery to determine building height. Remote Sens. Lett. 2012, 3, 551–556. [Google Scholar] [CrossRef] [Green Version]
  32. Irvin, R.B.; McKeown, D.M. Methods for exploiting the relationship between buildings and their shadows in aerial imagery. IEEE Trans. Syst. Man Cybern. 1989, 19, 1564–1575. [Google Scholar] [CrossRef] [Green Version]
  33. Izadi, M.; Saeedi, P. Three-dimensional polygonal building model estimation from single satellite images. IEEE Trans. Geosci. Remote Sens. 2012, 50, 2254–2272. [Google Scholar] [CrossRef]
  34. Wang, J.L.; Wang, X.H. Information extraction of building height and density based on quick bird image in Kunming, China. In Proceedings of the 2009 Joint Urban Remote Sensing Event, Shanghai, China, 20–22 May 2009; pp. 1–8. [Google Scholar] [CrossRef]
  35. Qi, F.; Zhai, J.Z.; Dang, G. Building height estimation using Google Earth. Energy Build. 2016, 118, 123–132. [Google Scholar] [CrossRef]
  36. Shettigara, V.K.; Sumerling, G.M. Height determination of extended objects using shadows in SPOT images. Photogramm. Eng. Remote Sens. 1998, 64, 35–43. [Google Scholar] [CrossRef]
  37. Türker, M.; Sümer, E. Building-based damage detection due to earthquake using the watershed segmentation of the post-event aerial images. Int. J. Remote Sens. 2008, 29, 3073–3089. [Google Scholar] [CrossRef]
  38. Wang, Y.; Liu, H. Semiautomatic extraction of building information and variation detection from high resolution remote sensing images. In Proceedings of the Remotely Sensed Data and Information, Wuhan, China, 28 October 2006; pp. 1–11. [Google Scholar] [CrossRef]
  39. Shao, Y.; Taff, G.N.; Walsh, S.J. Shadow detection and building-height estimation using IKONOS data. Int. J. Remote Sens. 2011, 32, 6929–6944. [Google Scholar] [CrossRef]
  40. Biljecki, F.; LeDoux, H.; Stoter, J. Generating 3D city models without elevation data. Comput. Environ. Urban Syst. 2017, 64, 1–18. [Google Scholar] [CrossRef] [Green Version]
  41. Zhang, H. Research on Buildings Shadow Detection Method and Height Inversion with Hight Resolution Sensed Image. Master’s Thesis, Southwest Jiaotong University, Chengdu, China, May 2017. [Google Scholar]
  42. Hu, L.; Zheng, J.; Gao, F. A building extraction method using shadow in high resolution multispectral images. In Proceedings of the IEEE International Geoscience and Remote Sensing Symposium, Vancouver, BC, Canada, 24–29 July 2011; pp. 1862–1865. [Google Scholar] [CrossRef]
  43. Xie, Y.; Feng, D.; Li, Q.; Wang, Y.; Hu, M. Building shadow detection with integrated characteristic components for high resolution remote sensing images. Bull. Surv. Mapp. 2018, 10, 16–65. [Google Scholar] [CrossRef]
  44. Xie, Y.; Zhu, J.; Cao, Y.; Feng, D.; Hu, M.; Li, W.; Zhang, Y.; Fu, L. Refined extraction of building outlines from high-resolution remote sensing imagery based on a multifeature convolutional neural network and morphological filtering. IEEE J. Sel. Top. Appl. Earth Obs. Remote Sens. 2020, 13, 1842–1855. [Google Scholar] [CrossRef]
  45. Guo, Z.; Du, S. Mining parameter information for building extraction and change detection with very high-resolution imagery and GIS data. GIScience Remote Sens. 2017, 54, 38–63. [Google Scholar] [CrossRef]
  46. Guo, Y.; Sun, Y.; Li, L.; Tang, X. Reliability assessment for multi-source data of mechanical parts of civil aircraft based on the model. J. Mech. Sci. Technol. 2019, 33, 3205–3211. [Google Scholar] [CrossRef]
  47. Chen, C. Building Heigh Information Extraction from Shadow Derived from High Resolution Satellife Image Based on Scene Classification. Master’s Thesis, Xi’an University of Science and Technology, Xian, China, July 2020. [Google Scholar] [CrossRef]
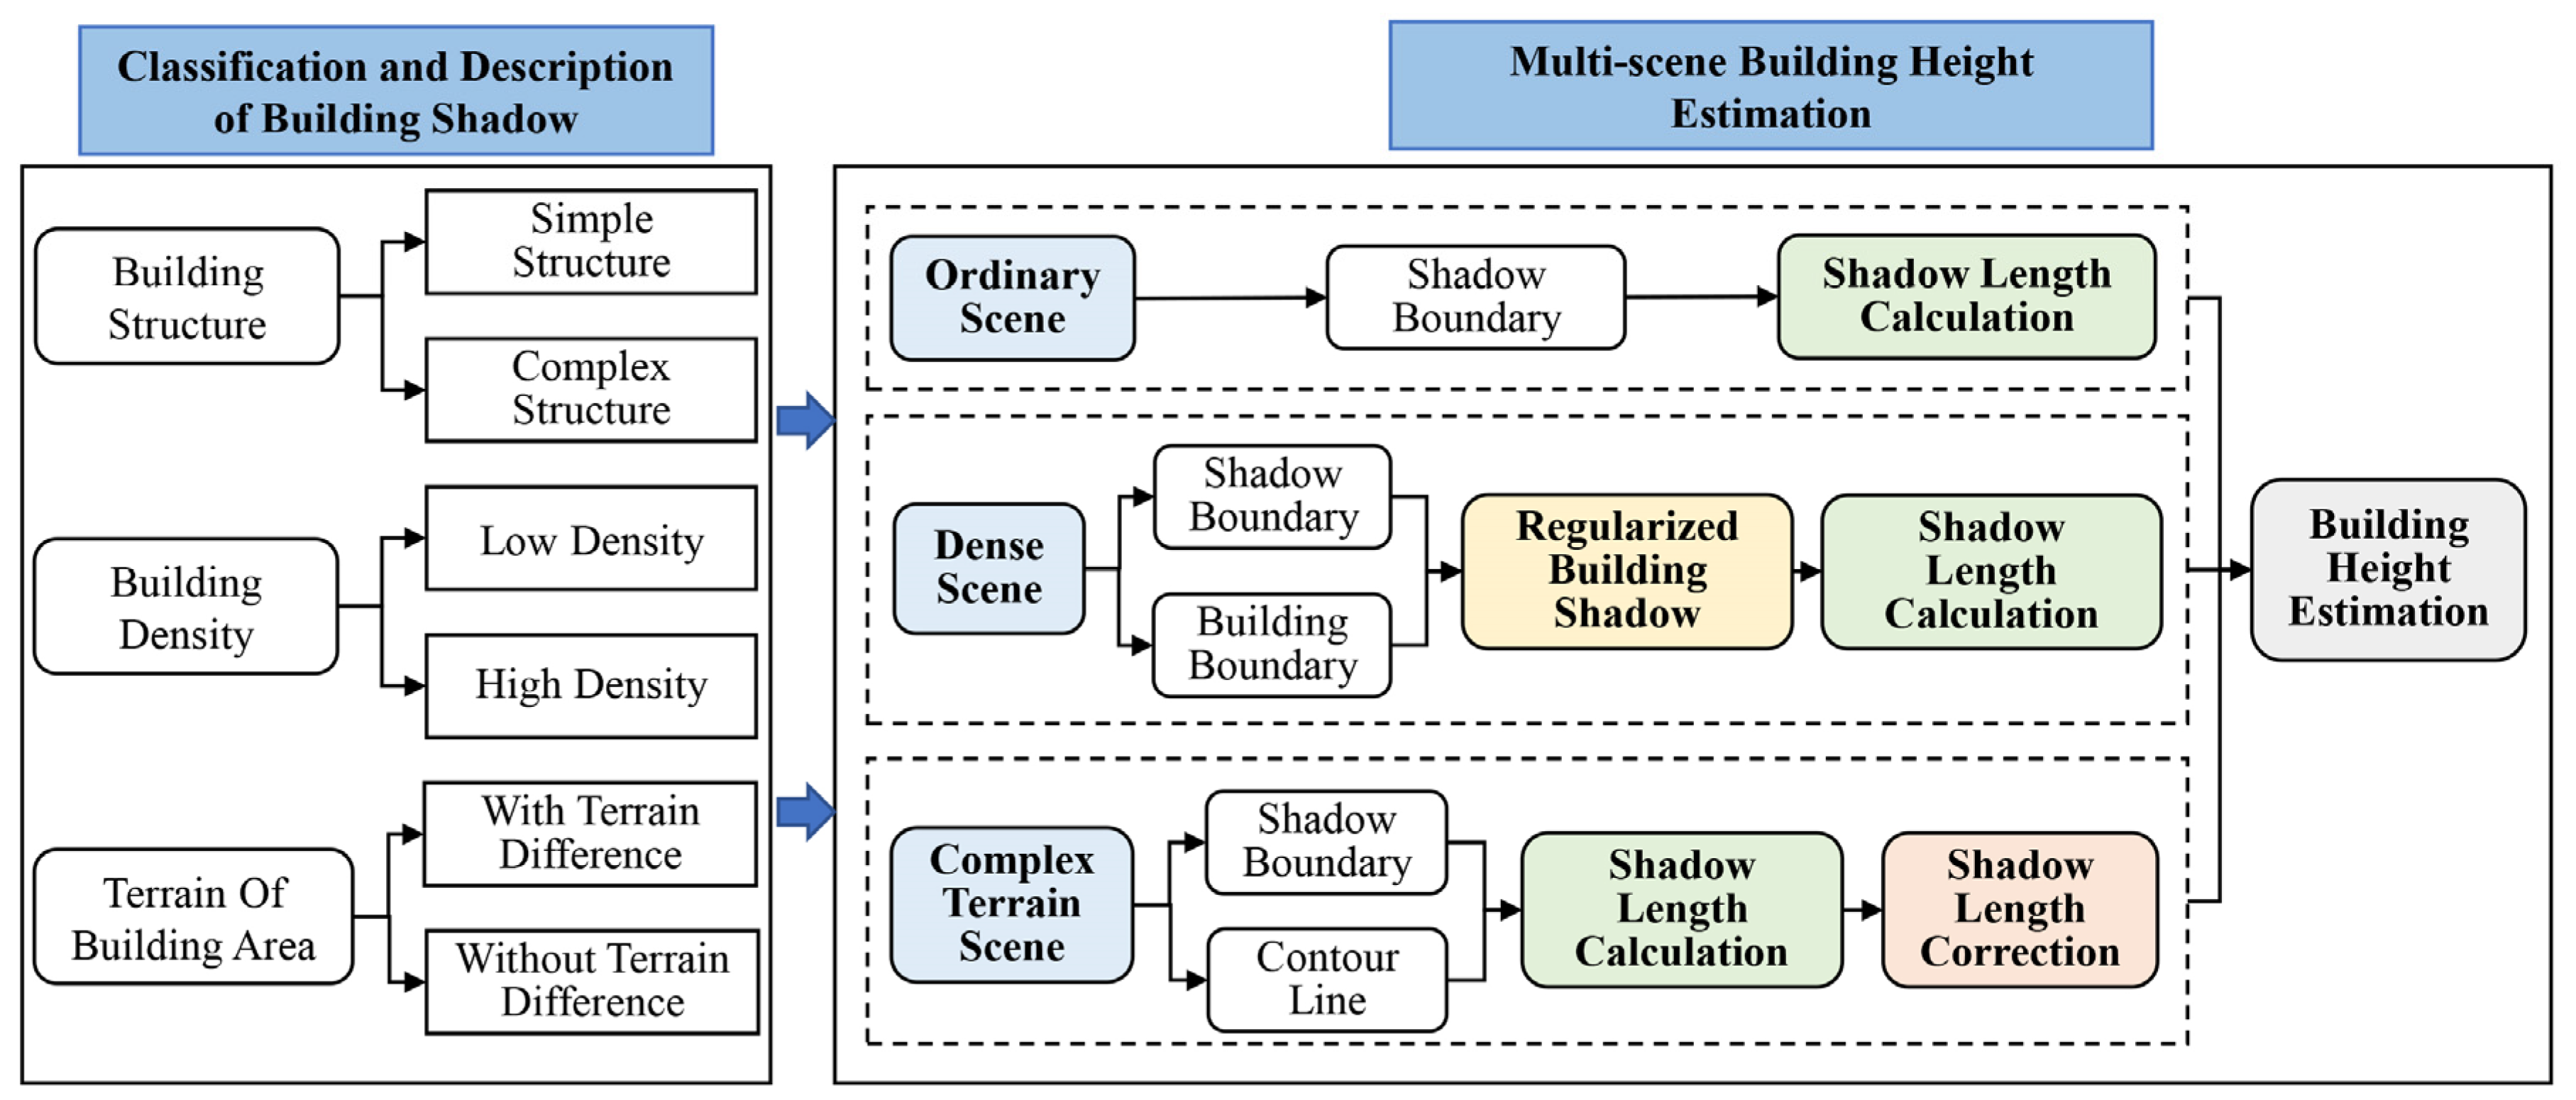
Figure 1. The framework of the proposed method for building height estimation.
Remotesensing 13 02862 g001
Figure 2. Classification of building shadow scene. (a) Sparse of building shadow; (b) Regular structure of building shadow; (c,d) Building shadows without terrain differences; (e) Density of building shadow; (f) Complex structure of building shadow; (g,h) Terrain difference of building shadow.
Remotesensing 13 02862 g002
Figure 3. The sun azimuth is the same as the sensor azimuth.
Remotesensing 13 02862 g003
Figure 4. The azimuth angle between the sun and the sensor is greater than 180°.
Remotesensing 13 02862 g004
Figure 5. The azimuth angle between the sun and the sensor is within 0°–180°.
Remotesensing 13 02862 g005
Figure 6. The process of shadow regularization extraction. (a) Building and shadow in dense areas; (b) Corner coordinates of envelope rectangle; (c) Cutting lines; (d) Regularized shadow.
Remotesensing 13 02862 g006
Figure 7. Flow chart of building shadow regularized extraction in dense areas.
Remotesensing 13 02862 g007
Figure 8. Flow chart of shadow length calculation method. (a) Flow chart of Fish net line generation; (b) Flow chart of gross error elimination.
Remotesensing 13 02862 g008
Figure 9. The process of shadow length calculation. (a) Shadow boundary; (b) Fish net lines; (c) Shadow lines; (d) Final result of shadow lines.
Remotesensing 13 02862 g009
Figure 10. The elevation of the shadow projection surface is higher than the horizontal projection surface.
Remotesensing 13 02862 g010
Figure 11. The elevation of the shadow projection surface is less than the elevation of the horizontal projection surface.
Remotesensing 13 02862 g011
Figure 12. Visual display of building height estimation process in ordinary scenes. (a) Shadow boundary; (b) Shadow lines; (c) Final result of shadow lines.
Remotesensing 13 02862 g012
Figure 13. Accuracy analysis of building height estimation in ordinary scenes.
Remotesensing 13 02862 g013
Figure 14. Visual display of building height estimation process in dense scenes. (a) Shadow boundary; (b) Shadow lines; (c) Final result of shadow lines.
Remotesensing 13 02862 g014
Figure 15. Accuracy analysis of building height estimation in dense scenes.
Remotesensing 13 02862 g015
Figure 16. Visual display of building height estimation in complex terrain. (a) Original image; (b) Contour lines; (c) Shadow boundary; (d) Final result of shadow lines.
Remotesensing 13 02862 g016
Figure 17. Accuracy analysis of building height estimation in complex terrain.
Remotesensing 13 02862 g017
Table 1. Comparison of building height estimation accuracy between the average value median value and pauta criterion.
Building NumberAverage (m)Median (m)Pauta Criterion (m)Building NumberAverage
(m)
Median (m)Pauta Criterion (m)
11.26 2.84 0.57 1012.13 13.34 1.68
20.87 1.12 0.43 113.63 2.00 0.15
39.19 1.33 0.59 1215.81 4.32 1.19
46.90 2.42 0.12 1317.92 5.81 0.47
54.07 1.09 0.35 1419.40 5.11 1.45
63.86 3.22 1.81 157.35 4.24 0.53
70.00 0.00 0.00 164.89 0.74 0.79
84.05 0.84 0.24 170.76 0.21 0.16
93.85 3.21 0.99 182.35 3.38 0.98
Table 2. Accuracy comparison between the methods on our data.
MethodsMean Absolute Error (m)Mean Relative Error (%)Aggregate Variance
Liasis et al. [19]4.89 17.28 5.14
Chen [47]2.379.54 2.37
Our method1.13 3.49 0.54
Table 3. Accuracy comparison between the methods on data of Chen [47].
MethodsMean Absolute Error (m)Mean Relative Error (%)Aggregate Variance
Chen [47]2.384.15 10.78
Our method1.36 2.97 1.24
Table 4. Analysis of the time taken by our method with three different device configurations.
AreaDevice1 (min)Device2 (min)Device3 (min)
Area12.13.65.1
Area23.3 4.96.8
Area37.28.610.9
Area49.312.715.2
Area53.65.47.6
Average time5.17.09.2
Publisher’s Note: MDPI stays neutral with regard to jurisdictional claims in published maps and institutional affiliations.