Terrestrial Videogrammetry for Deriving Key Forest Inventory Data: A Case Study in Plantation
Abstract
:1. Introduction
2. Materials and Methods
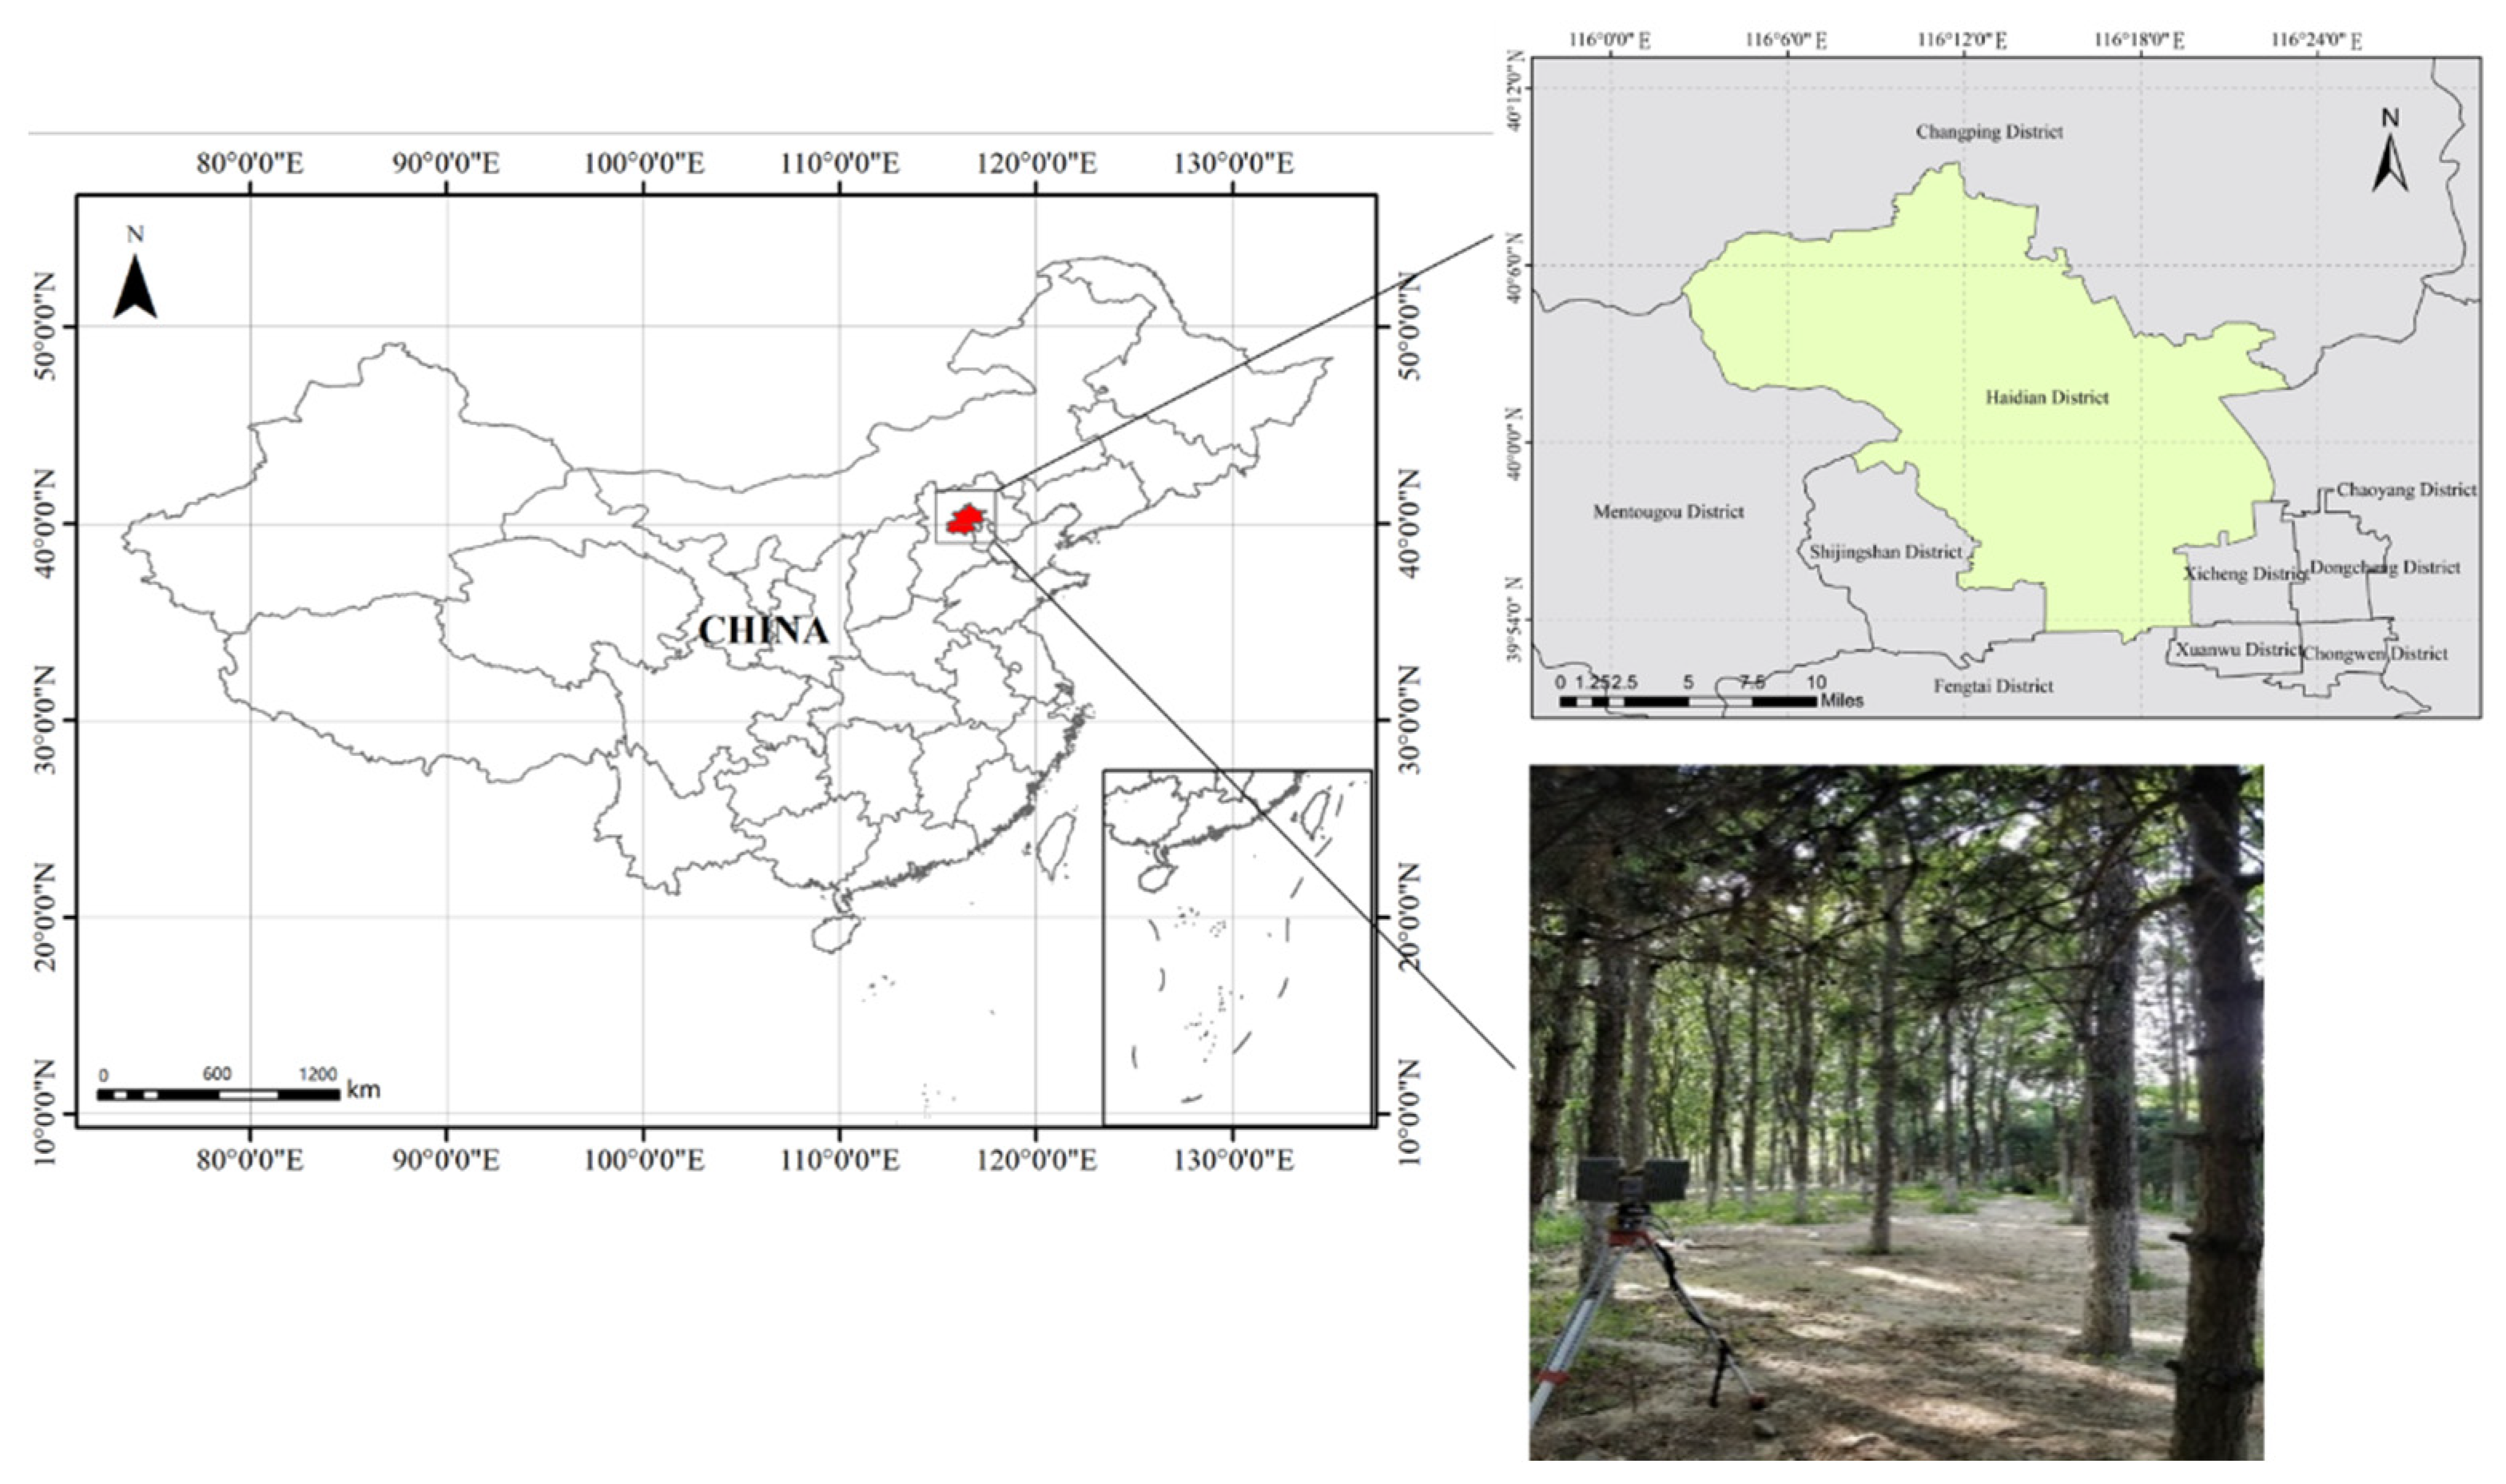
2.1. Study Area
2.2. Experimental Instruments
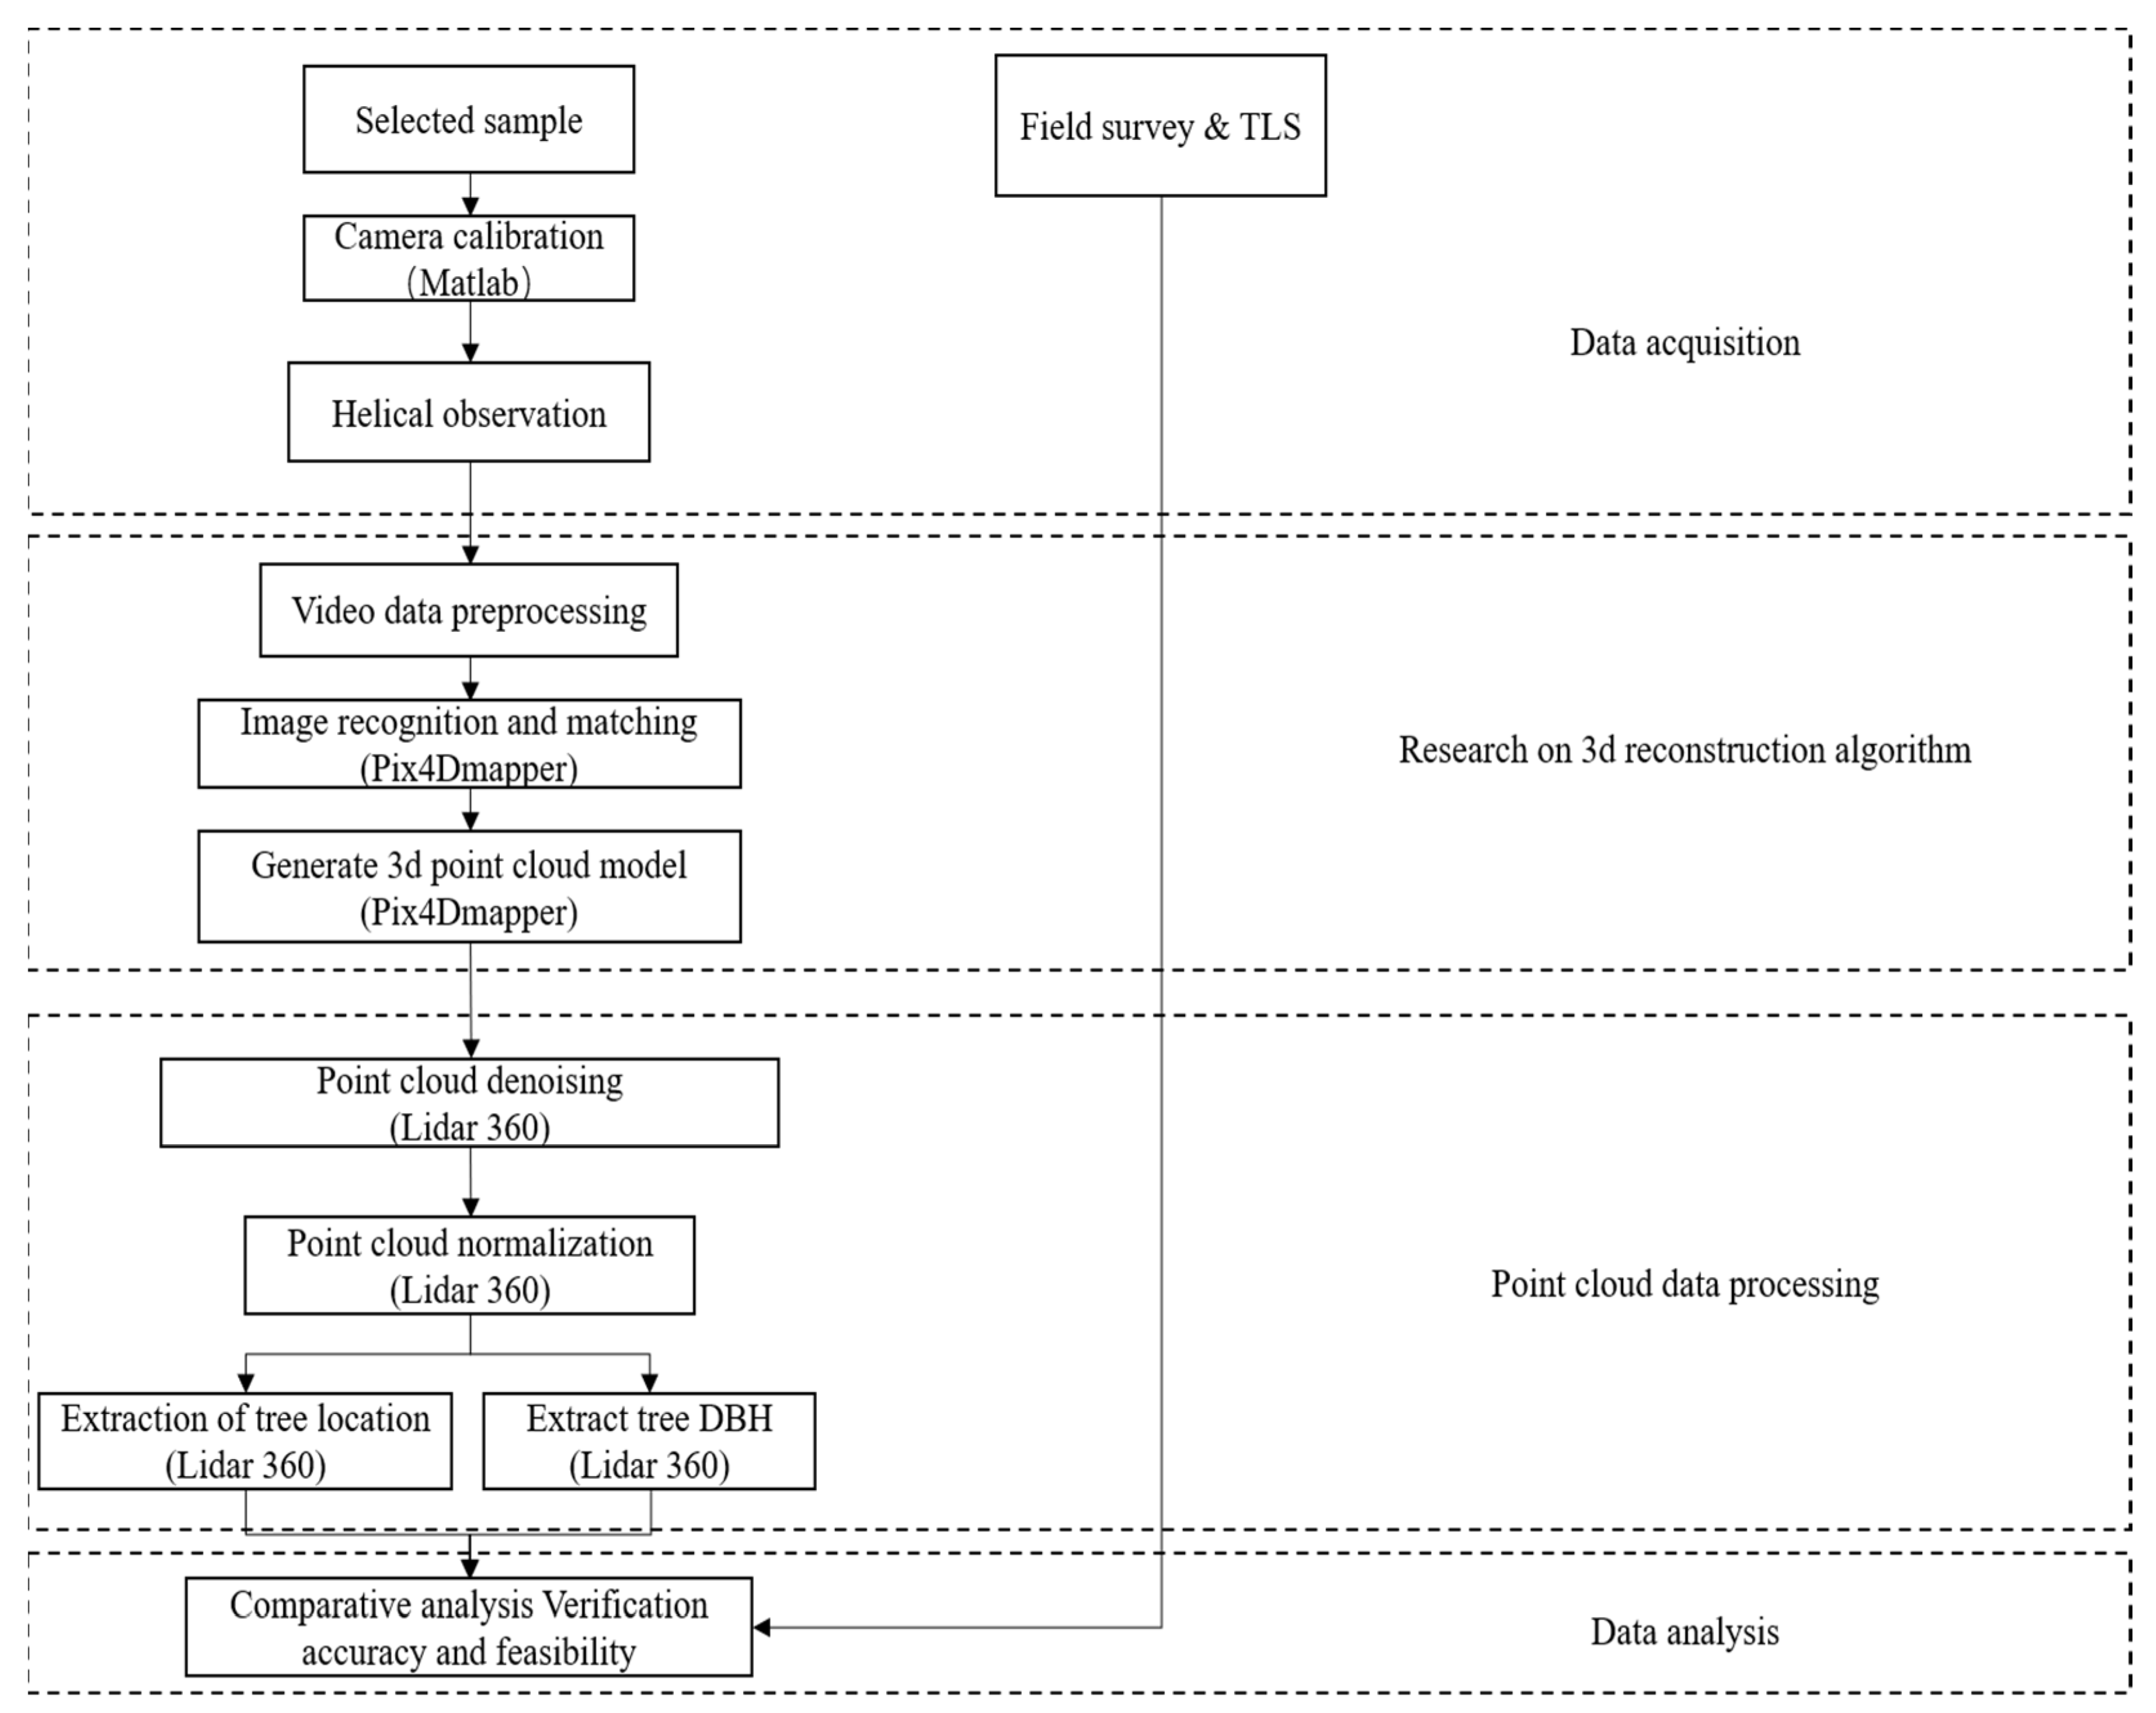
2.3. Study Methods
2.4. Acquisition of the Observational Data
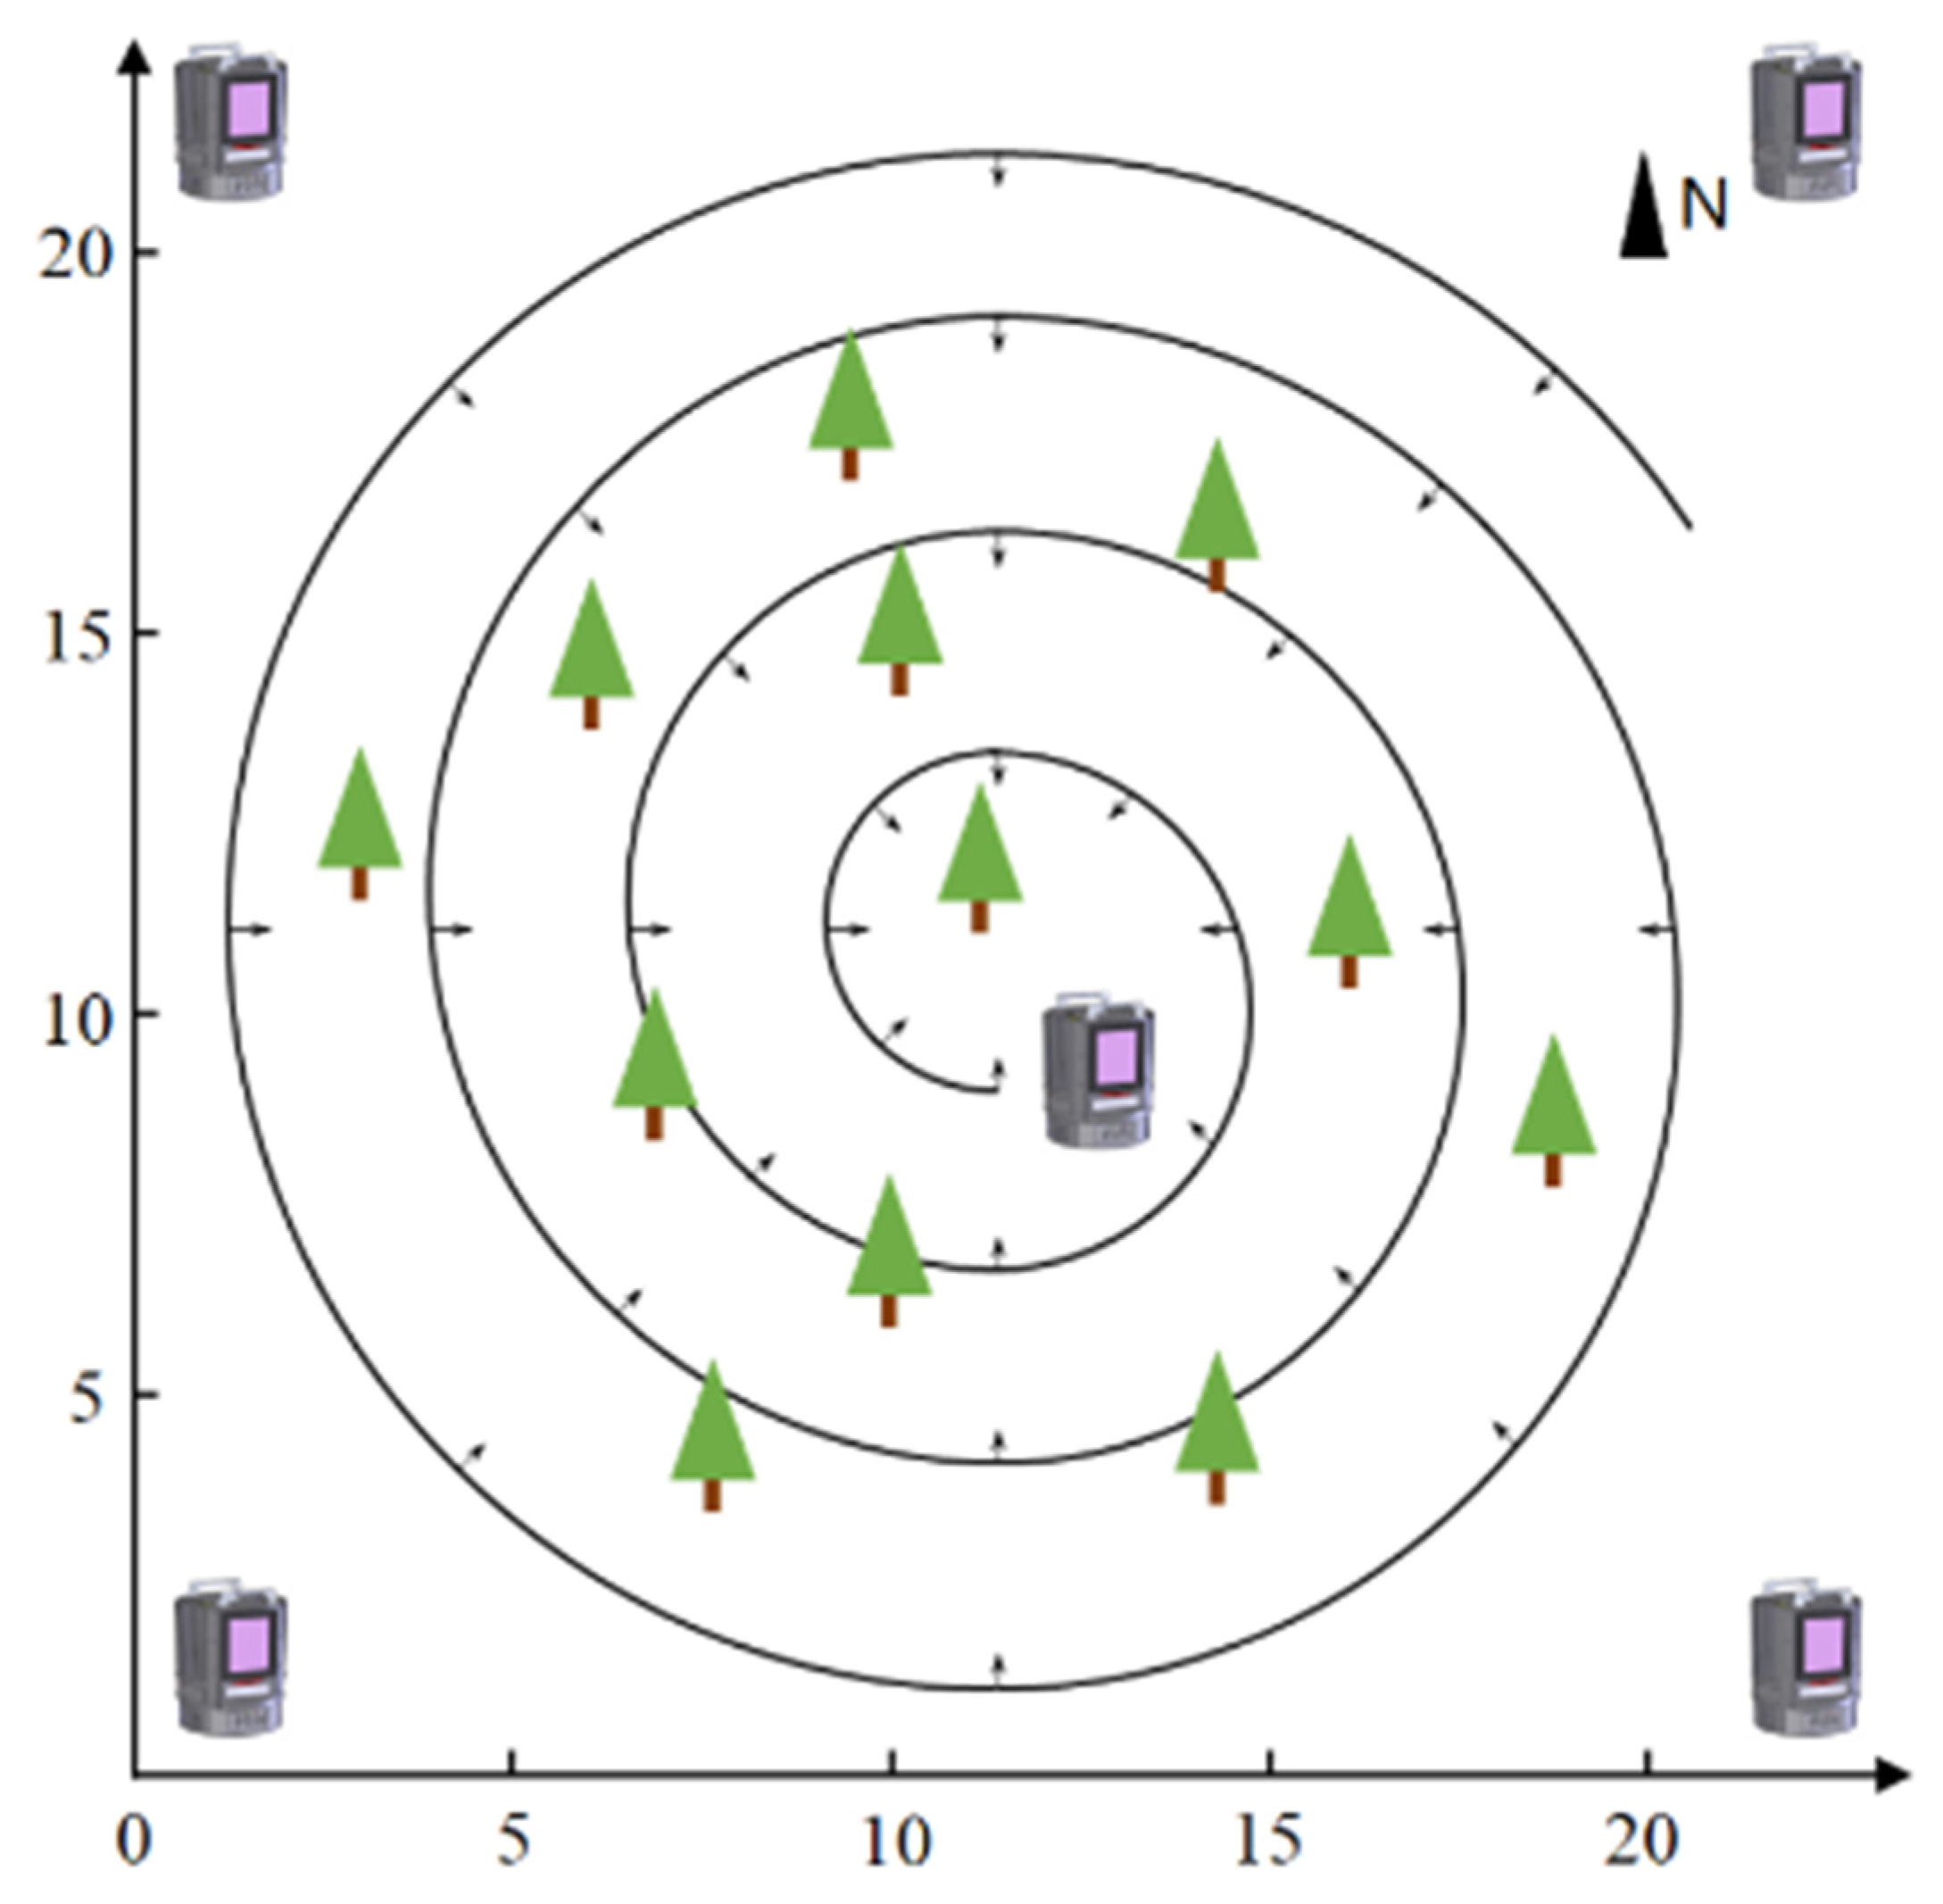
2.4.1. Spiral Collection of Video Data
2.4.2. TLS Data Acquisition
2.5. Data Processing
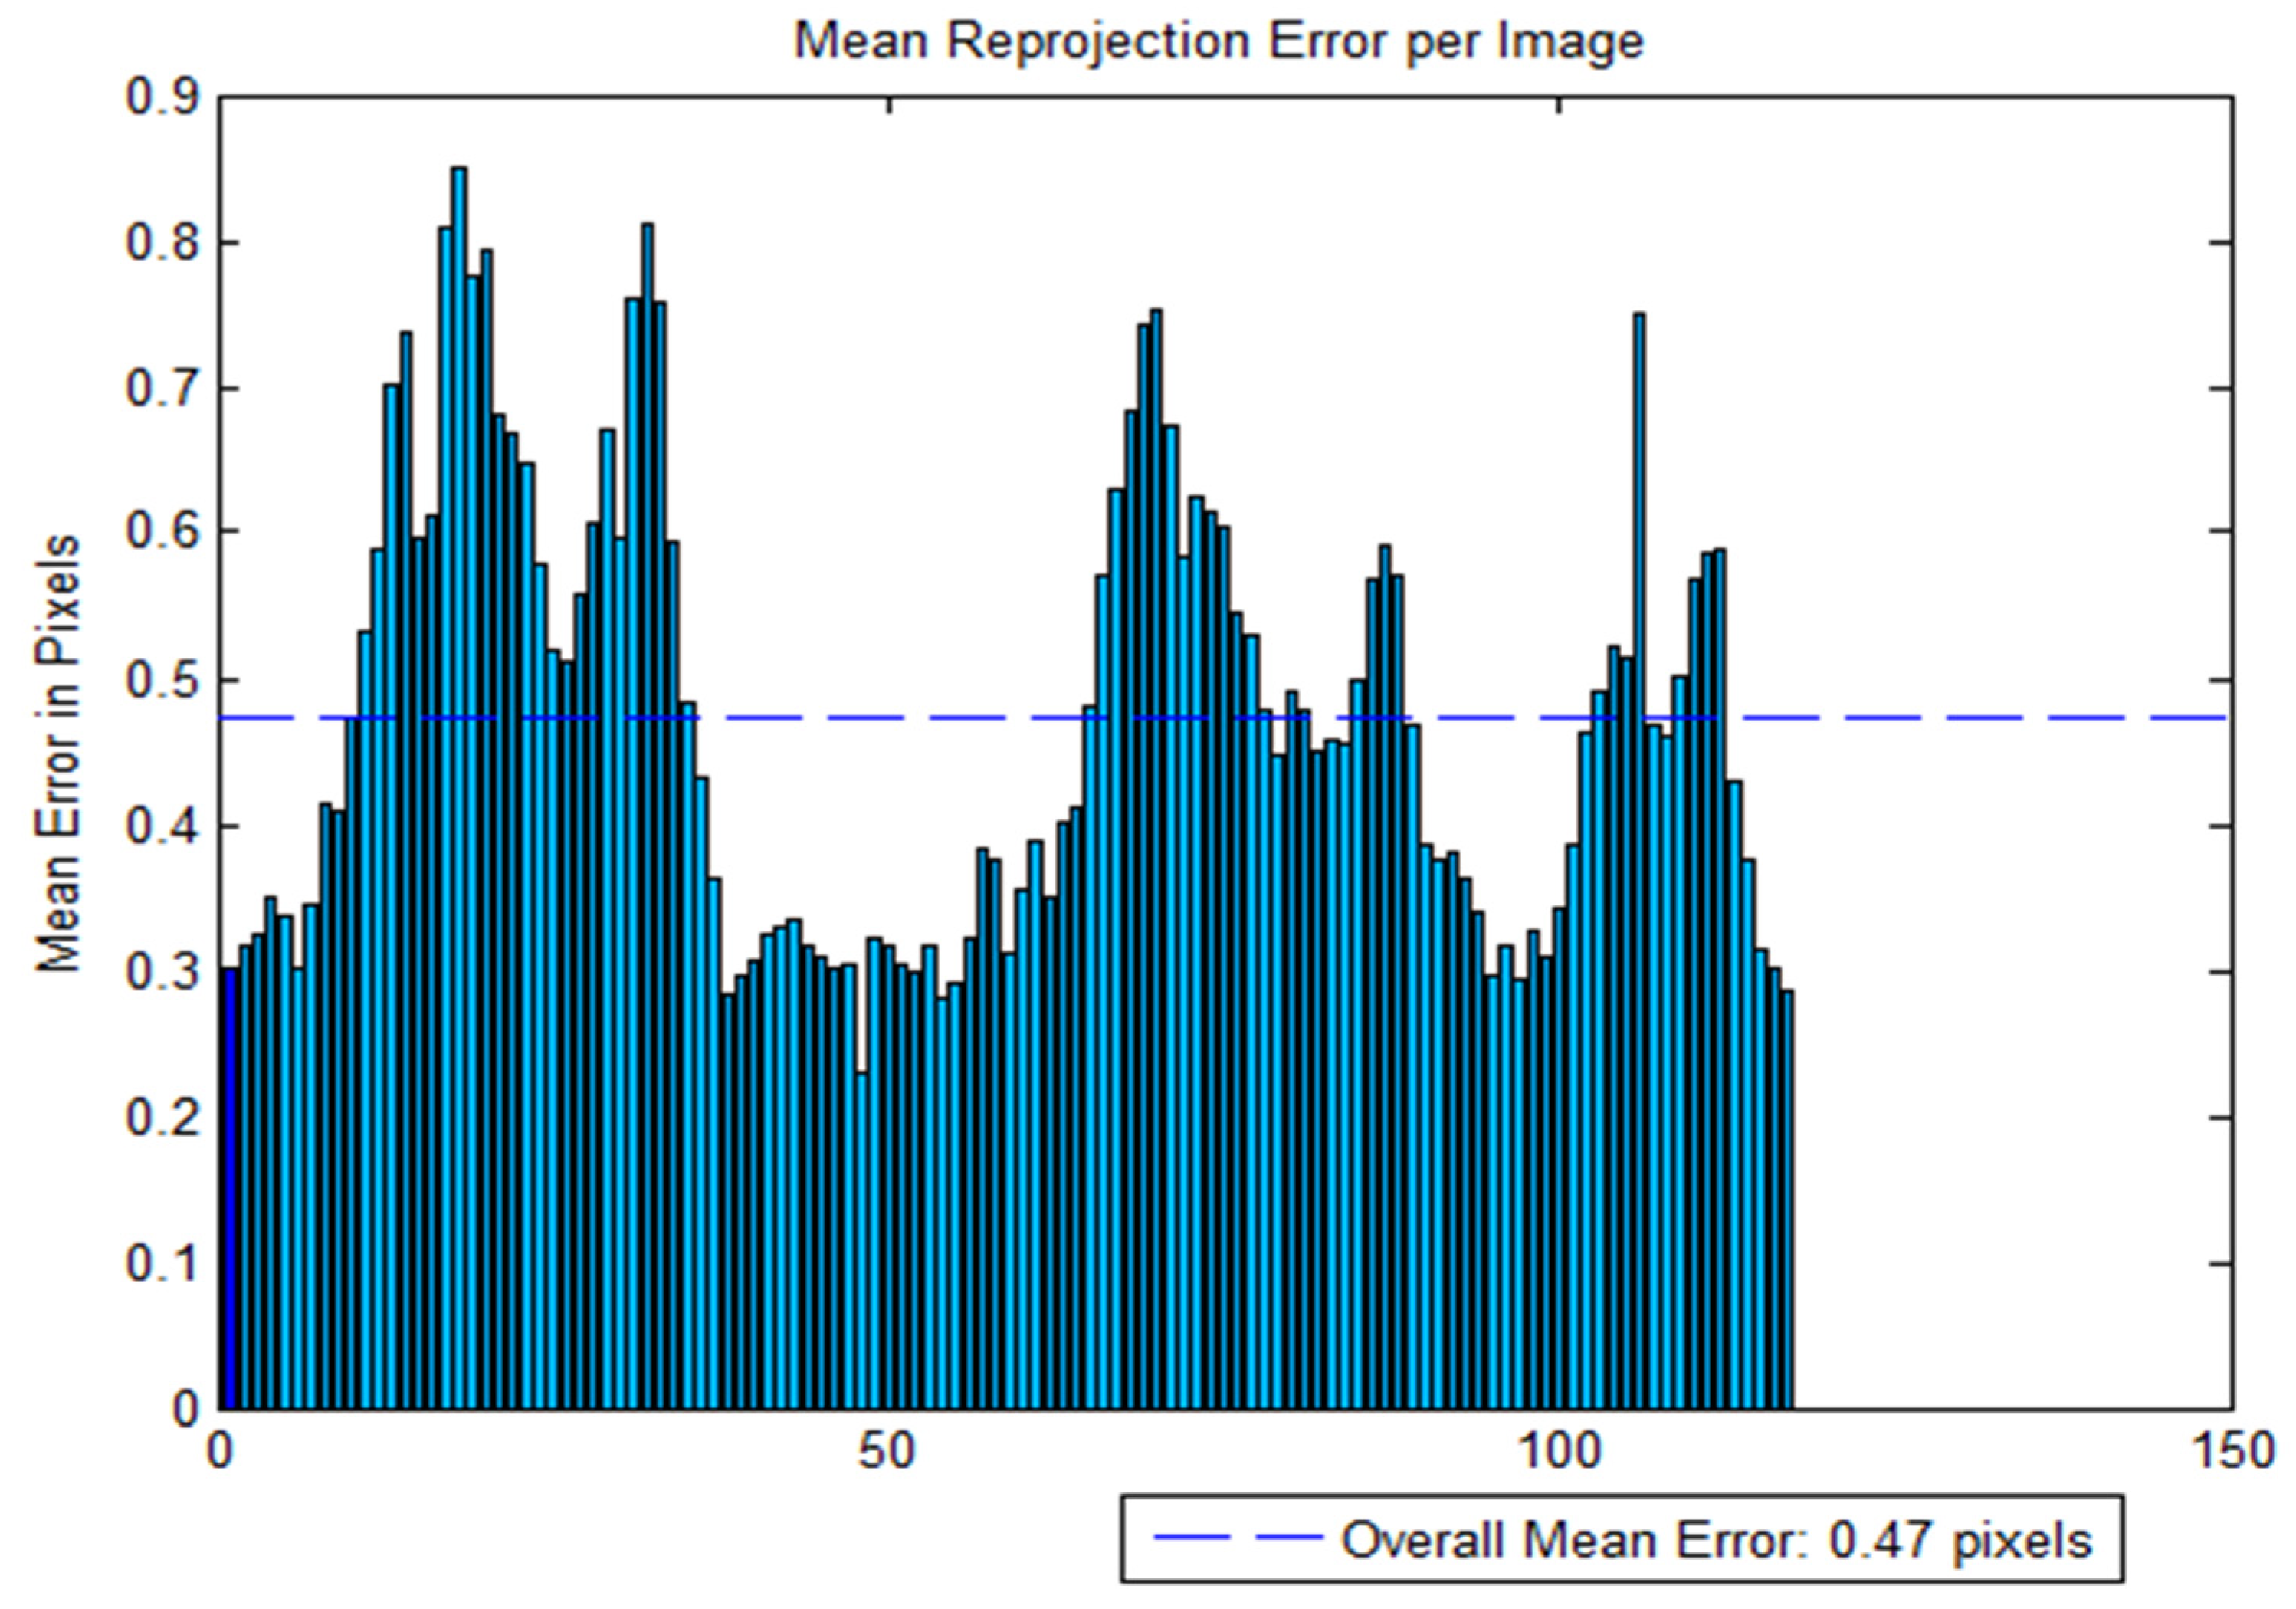
2.5.1. Camera Calibration
2.5.2. Video Data Processing
2.5.3. Establishment of the Point Cloud Model
2.6. Extraction of DBH Data
2.7. TLS Data Processing
2.8. Estimation of AGB
2.9. Precision Evaluation
3. Results
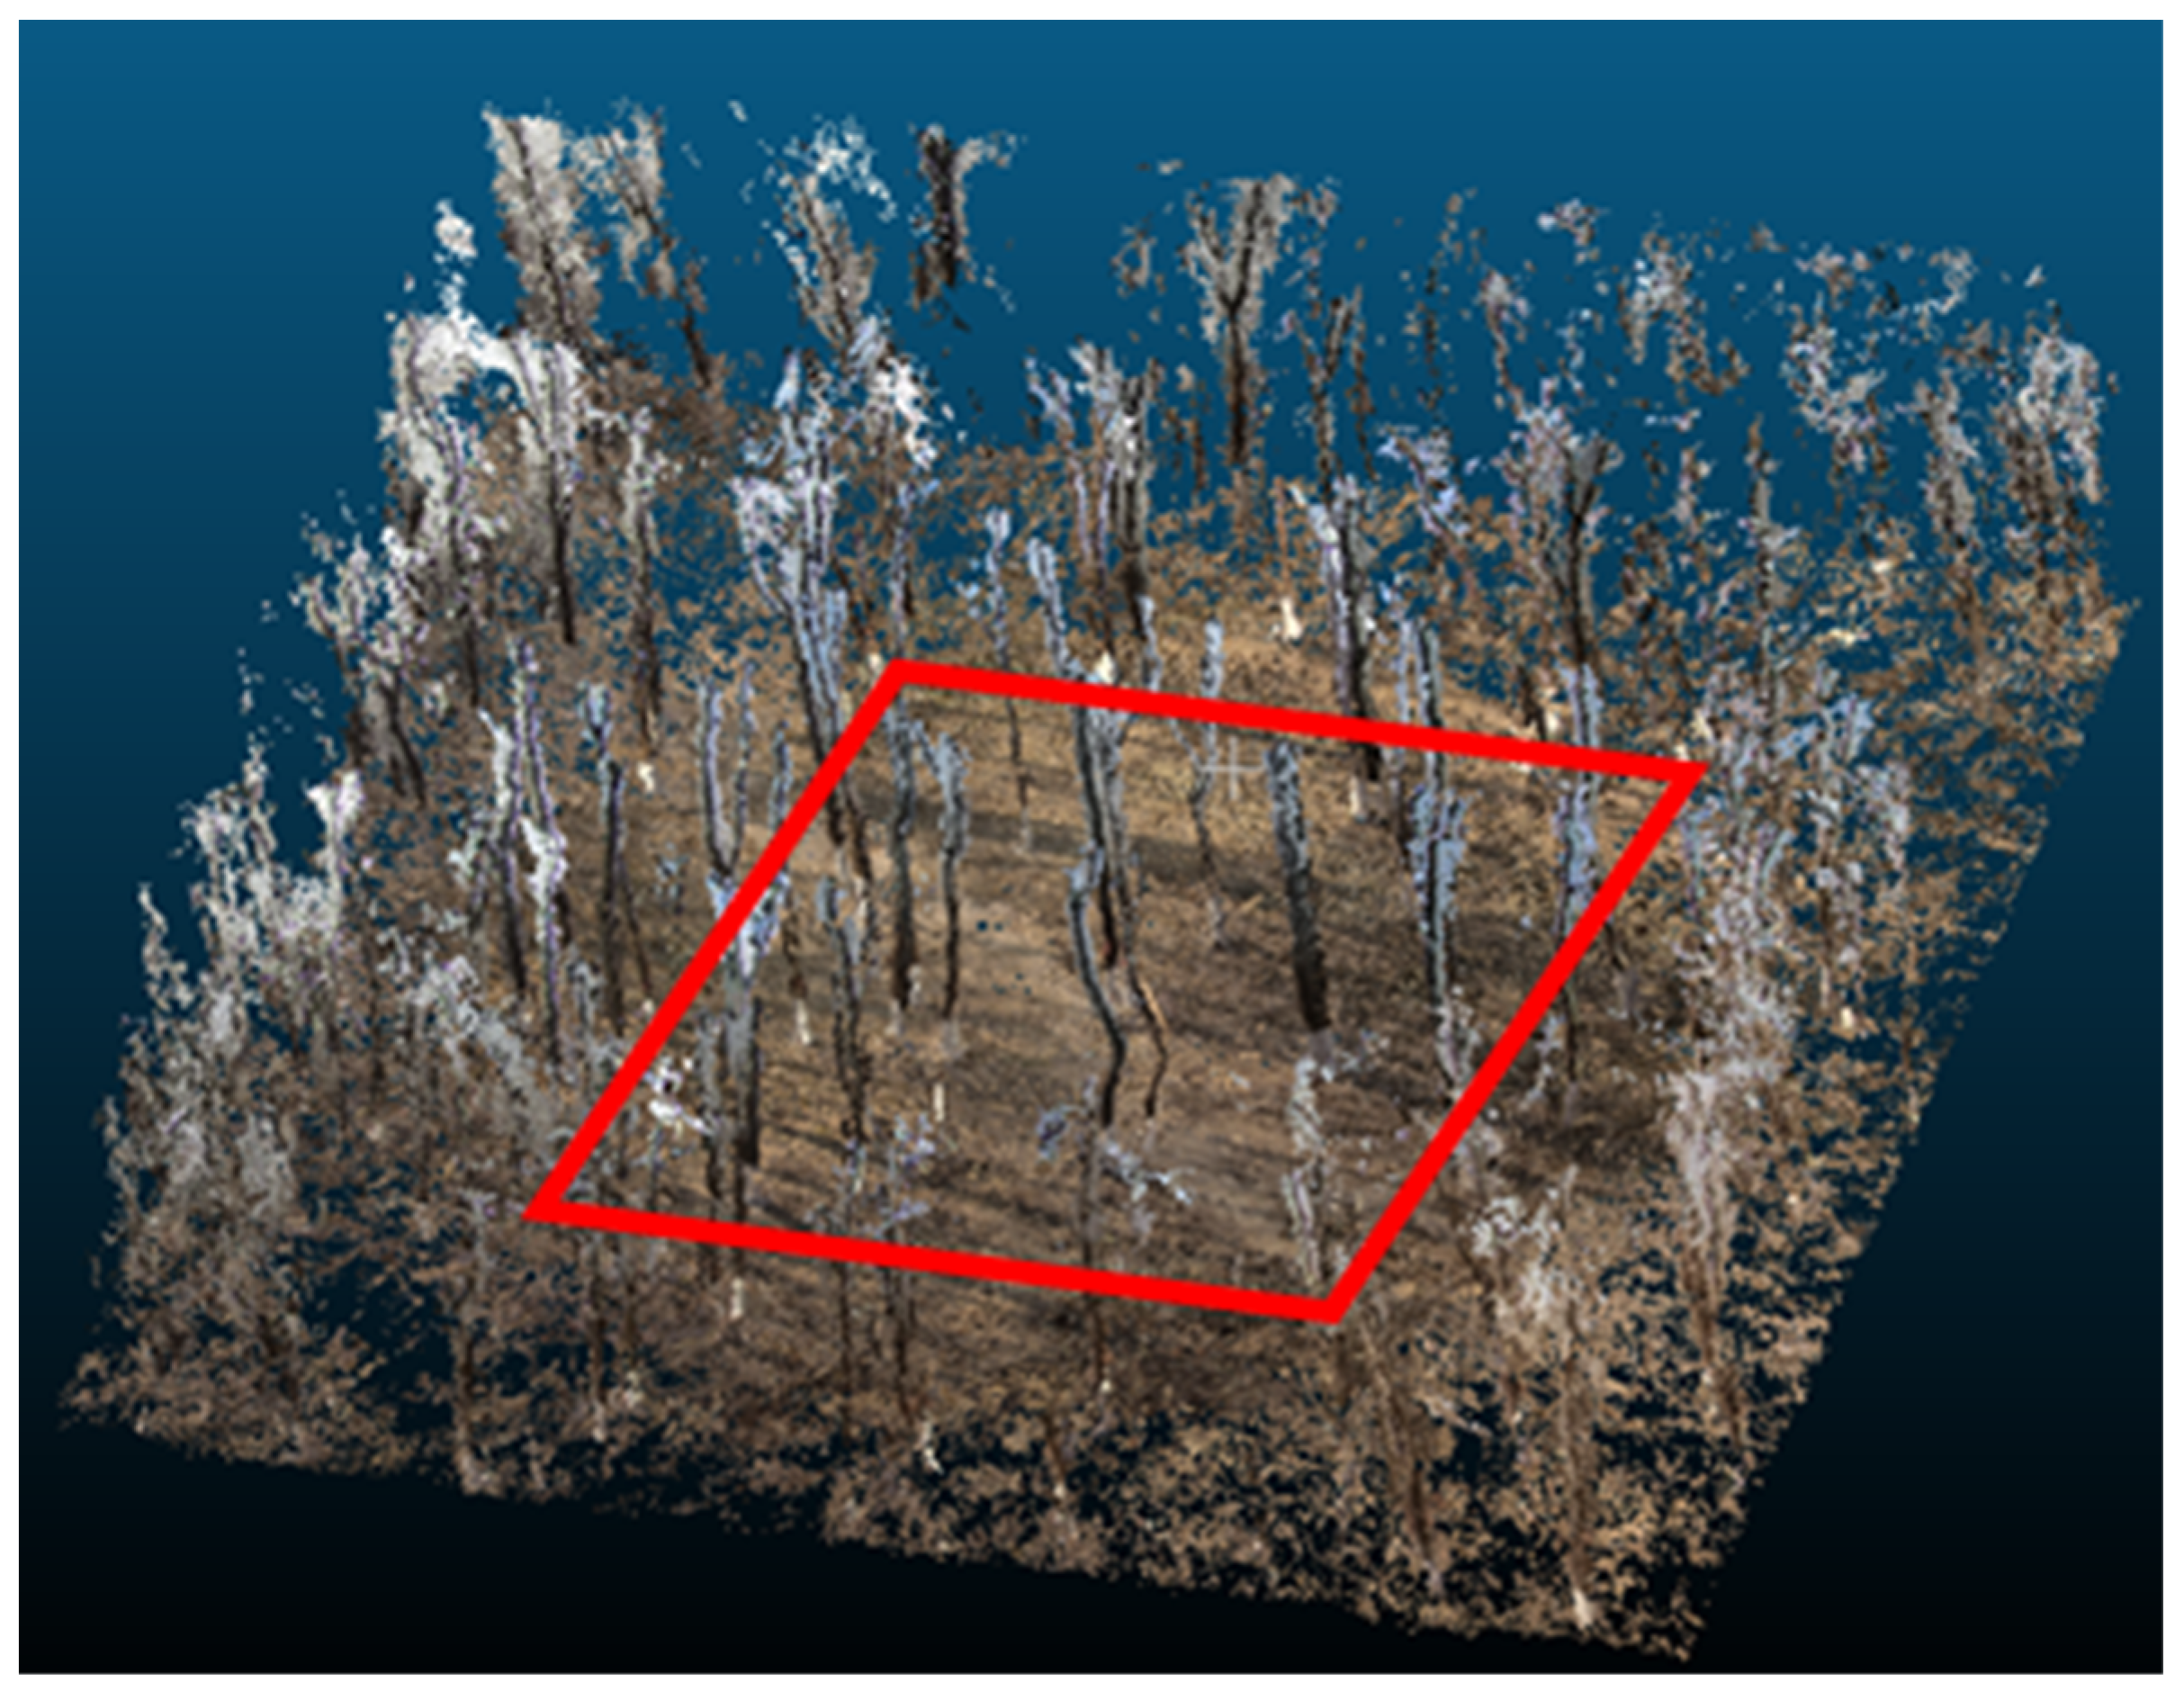
3.1. Point Cloud Data
3.2. Acquisition of DBH
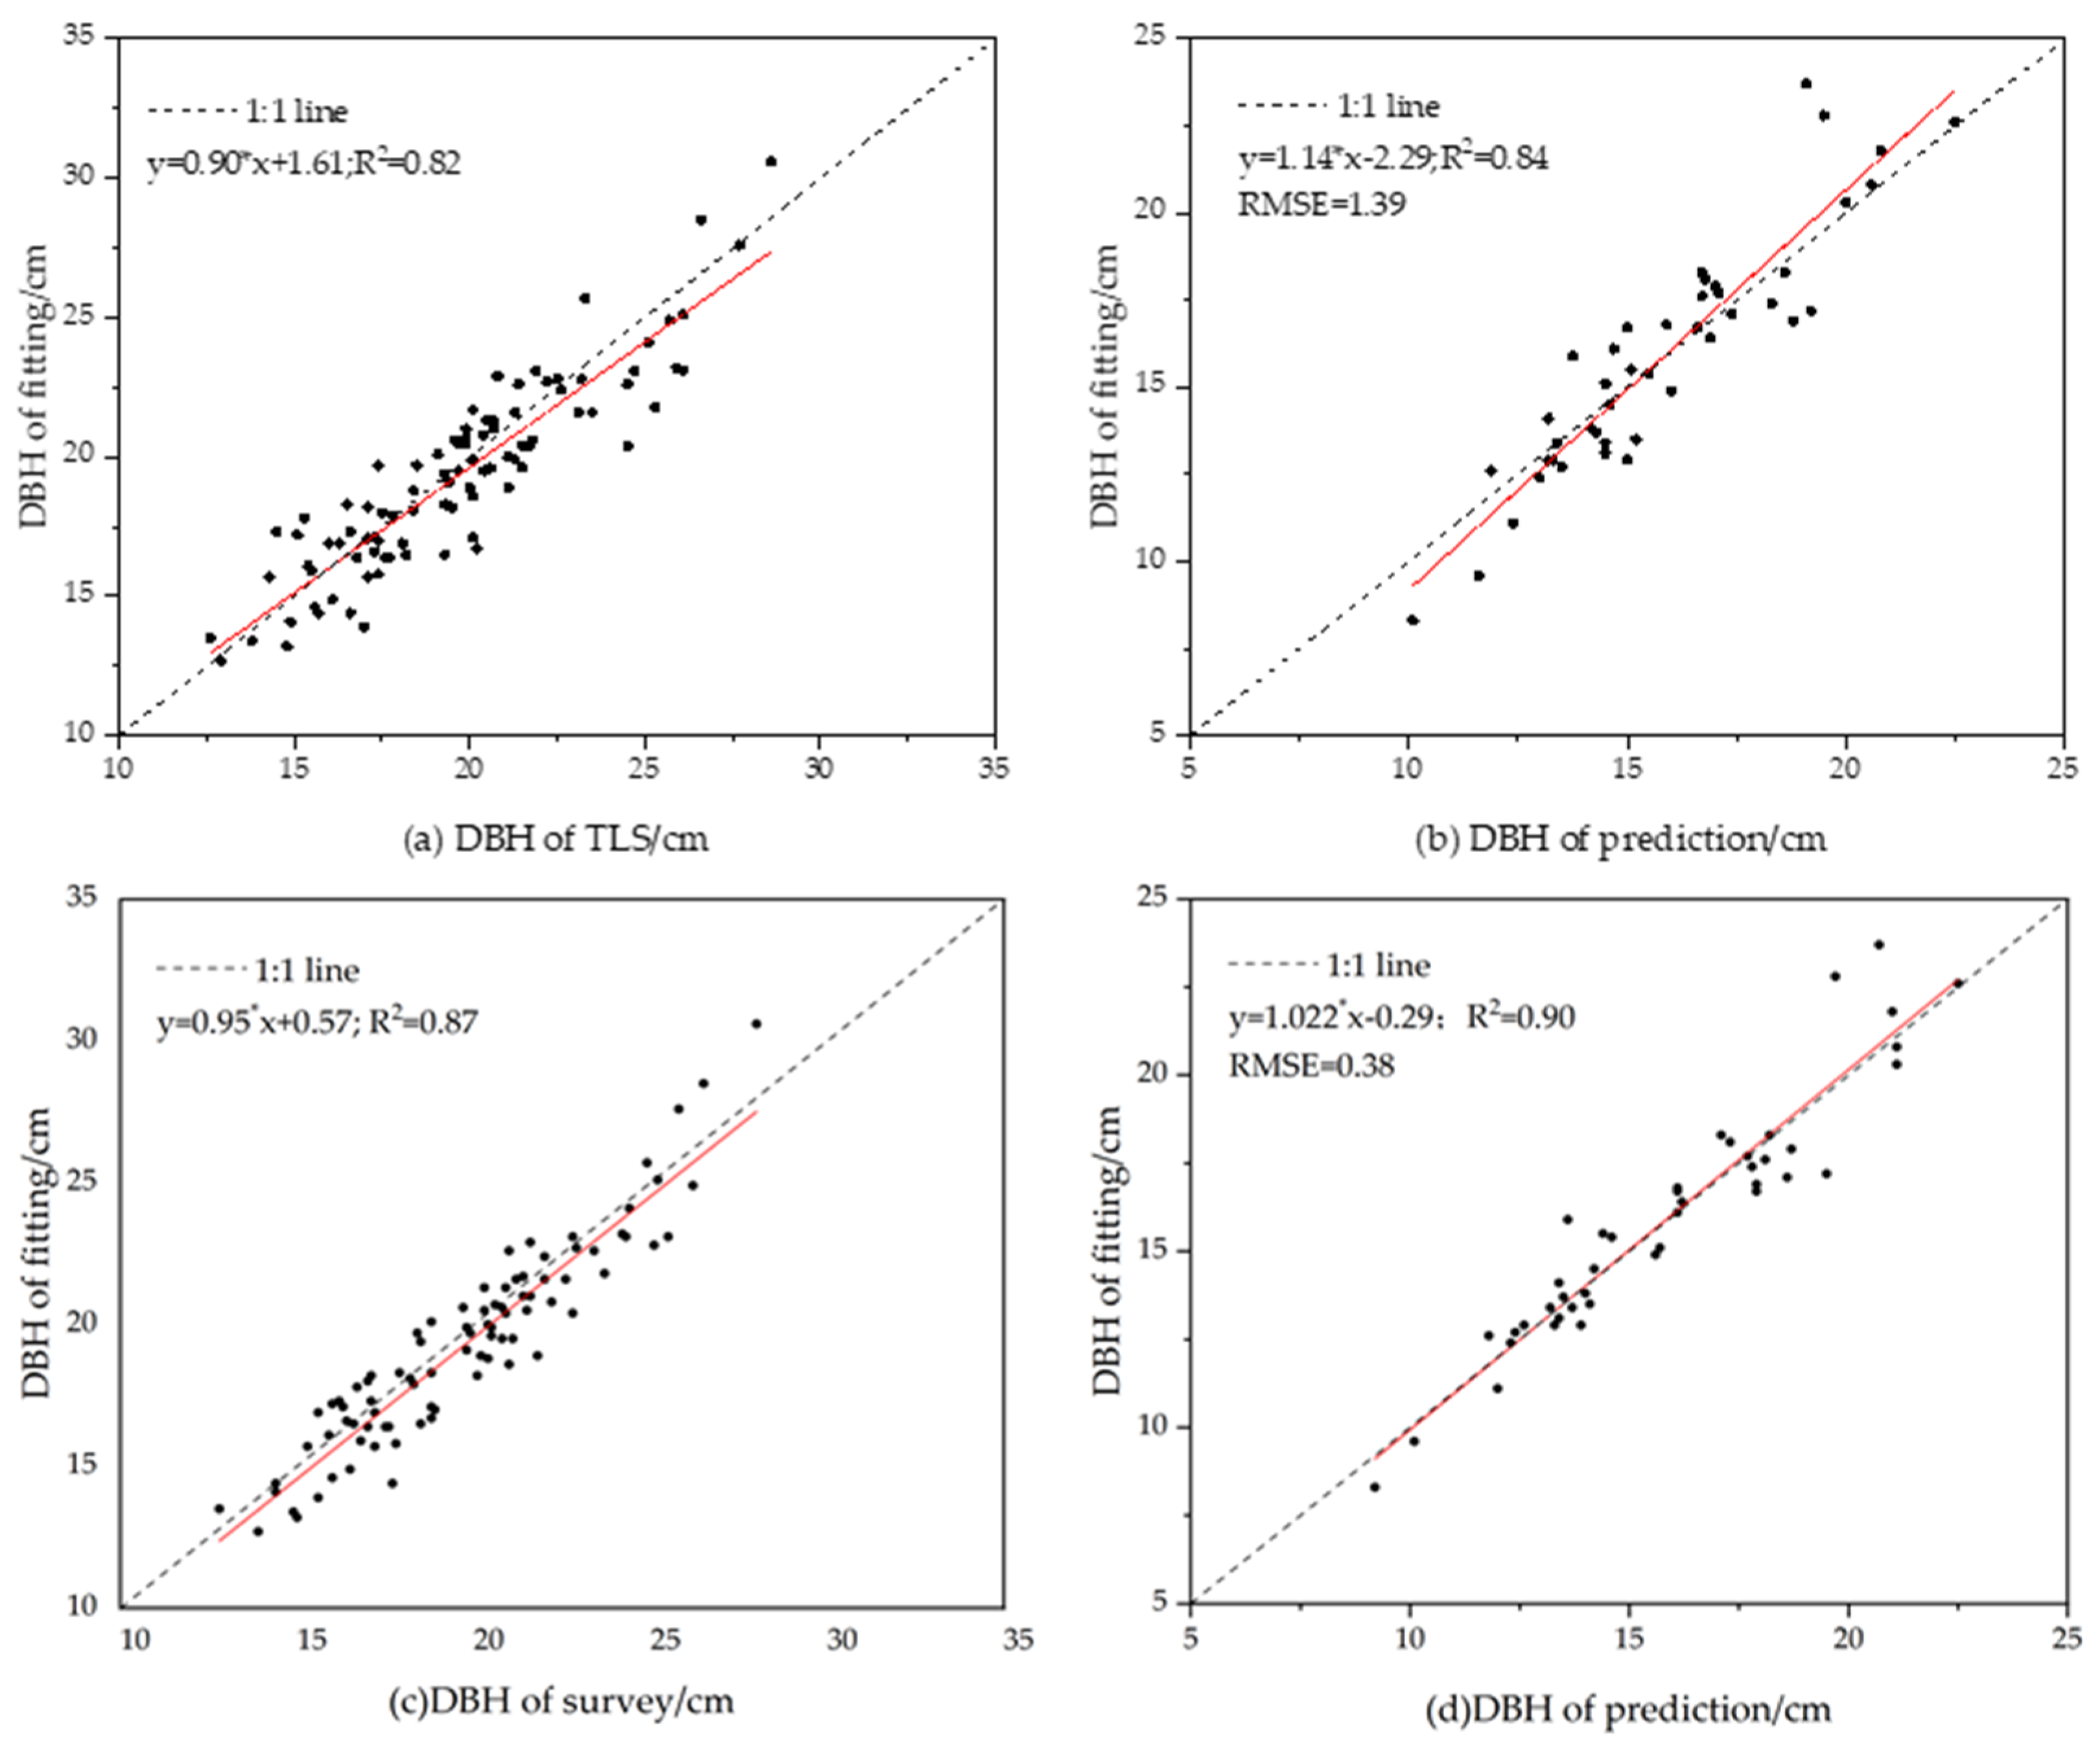
3.2.1. Accuracies of Cylinder Fitting and Circular Fitting
3.2.2. Accuracies of Videogrammetry
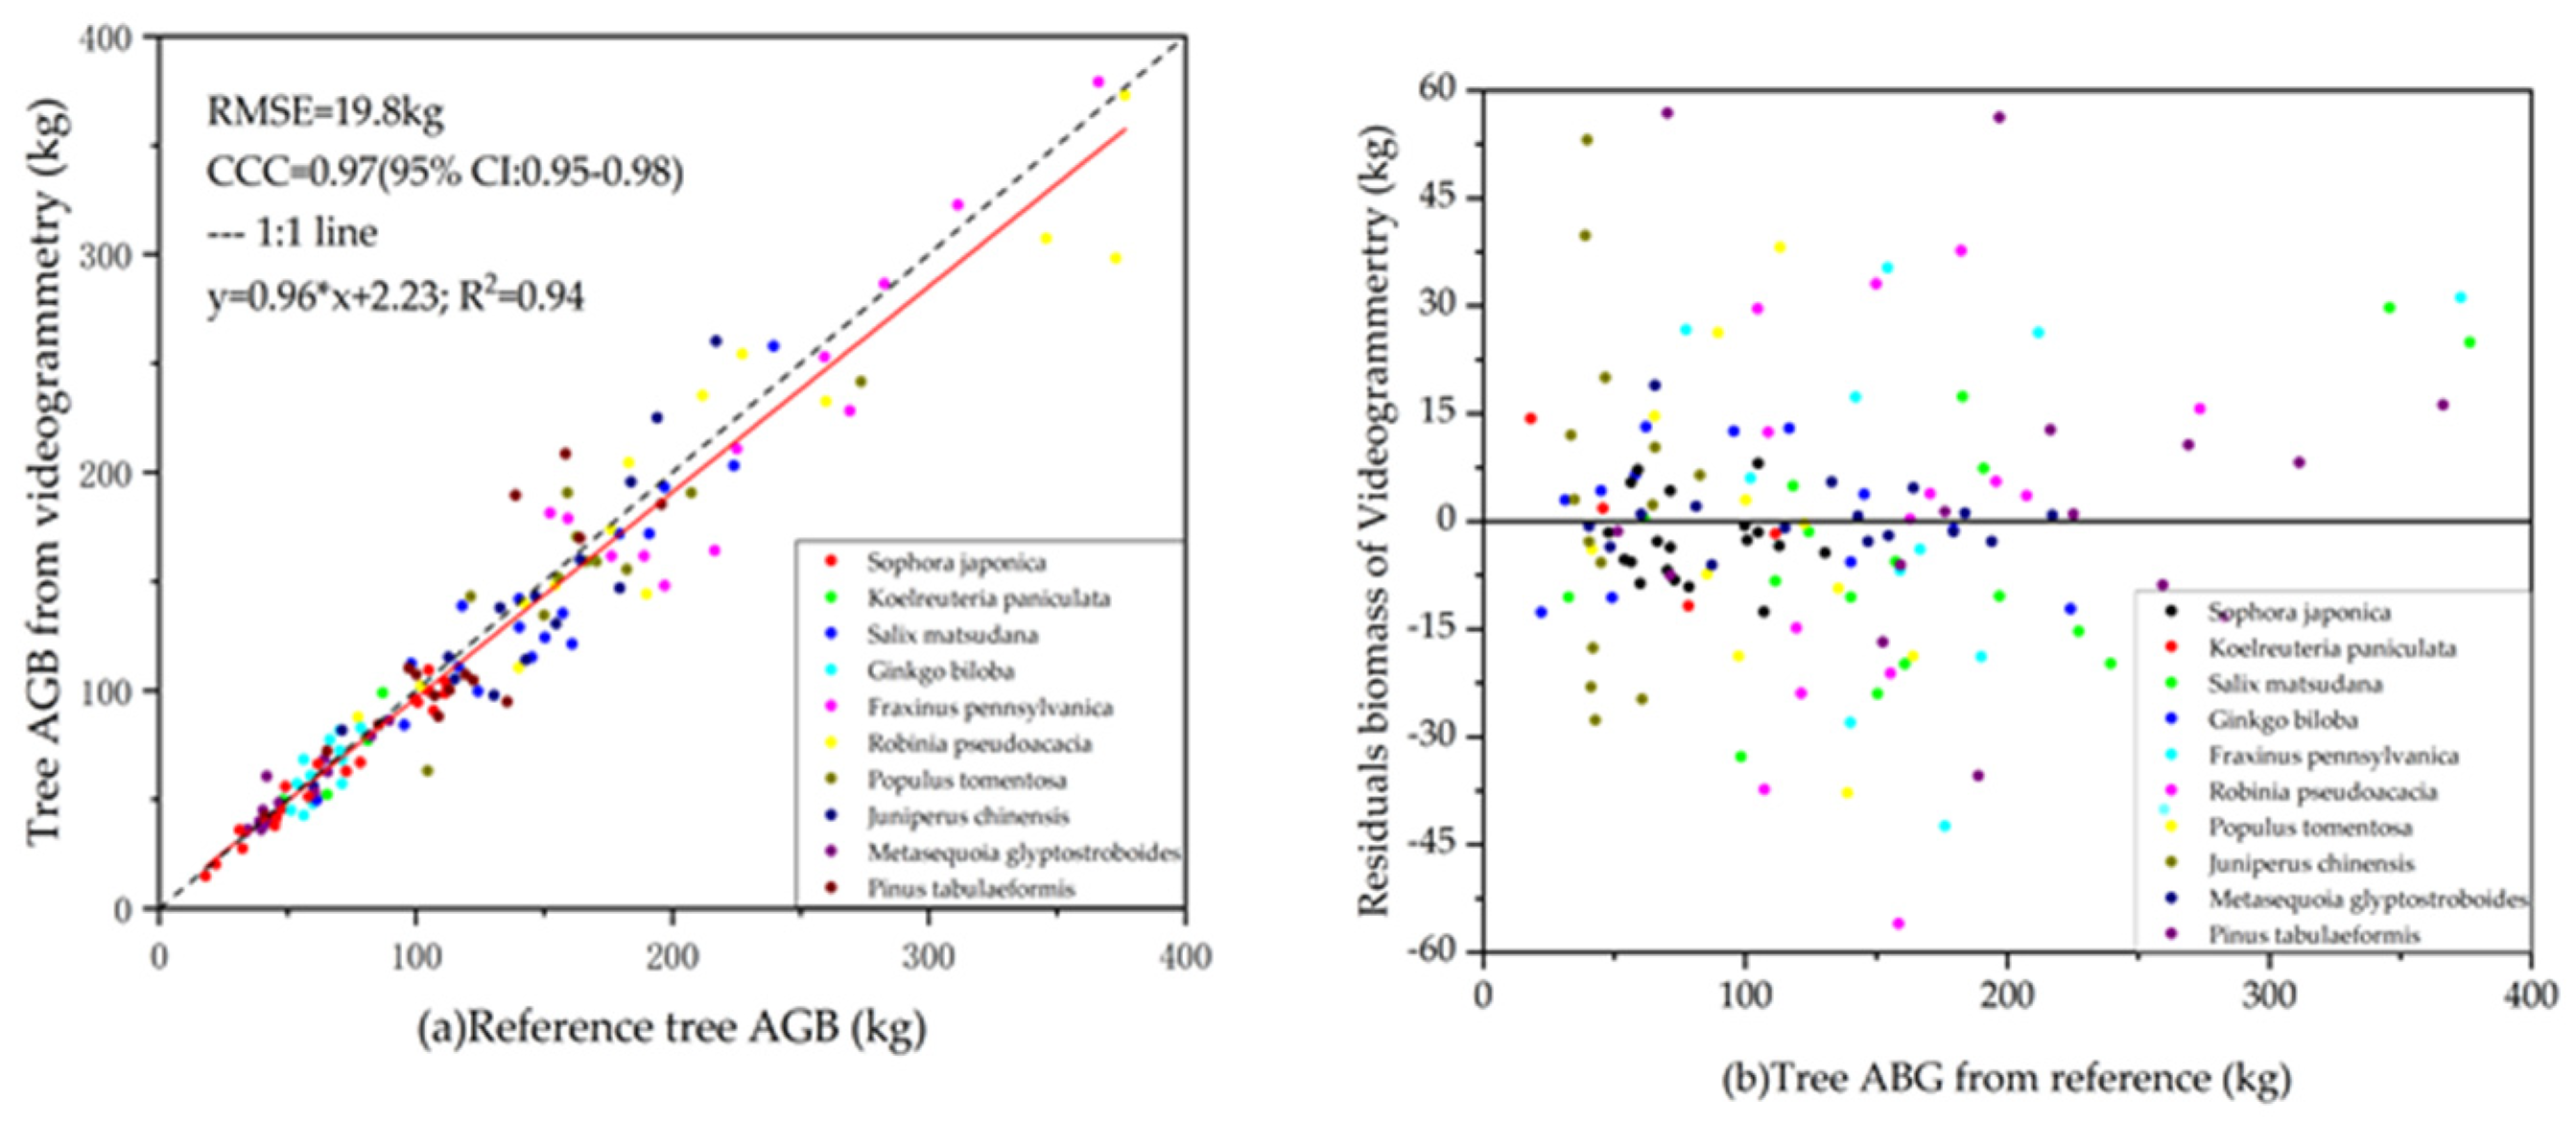
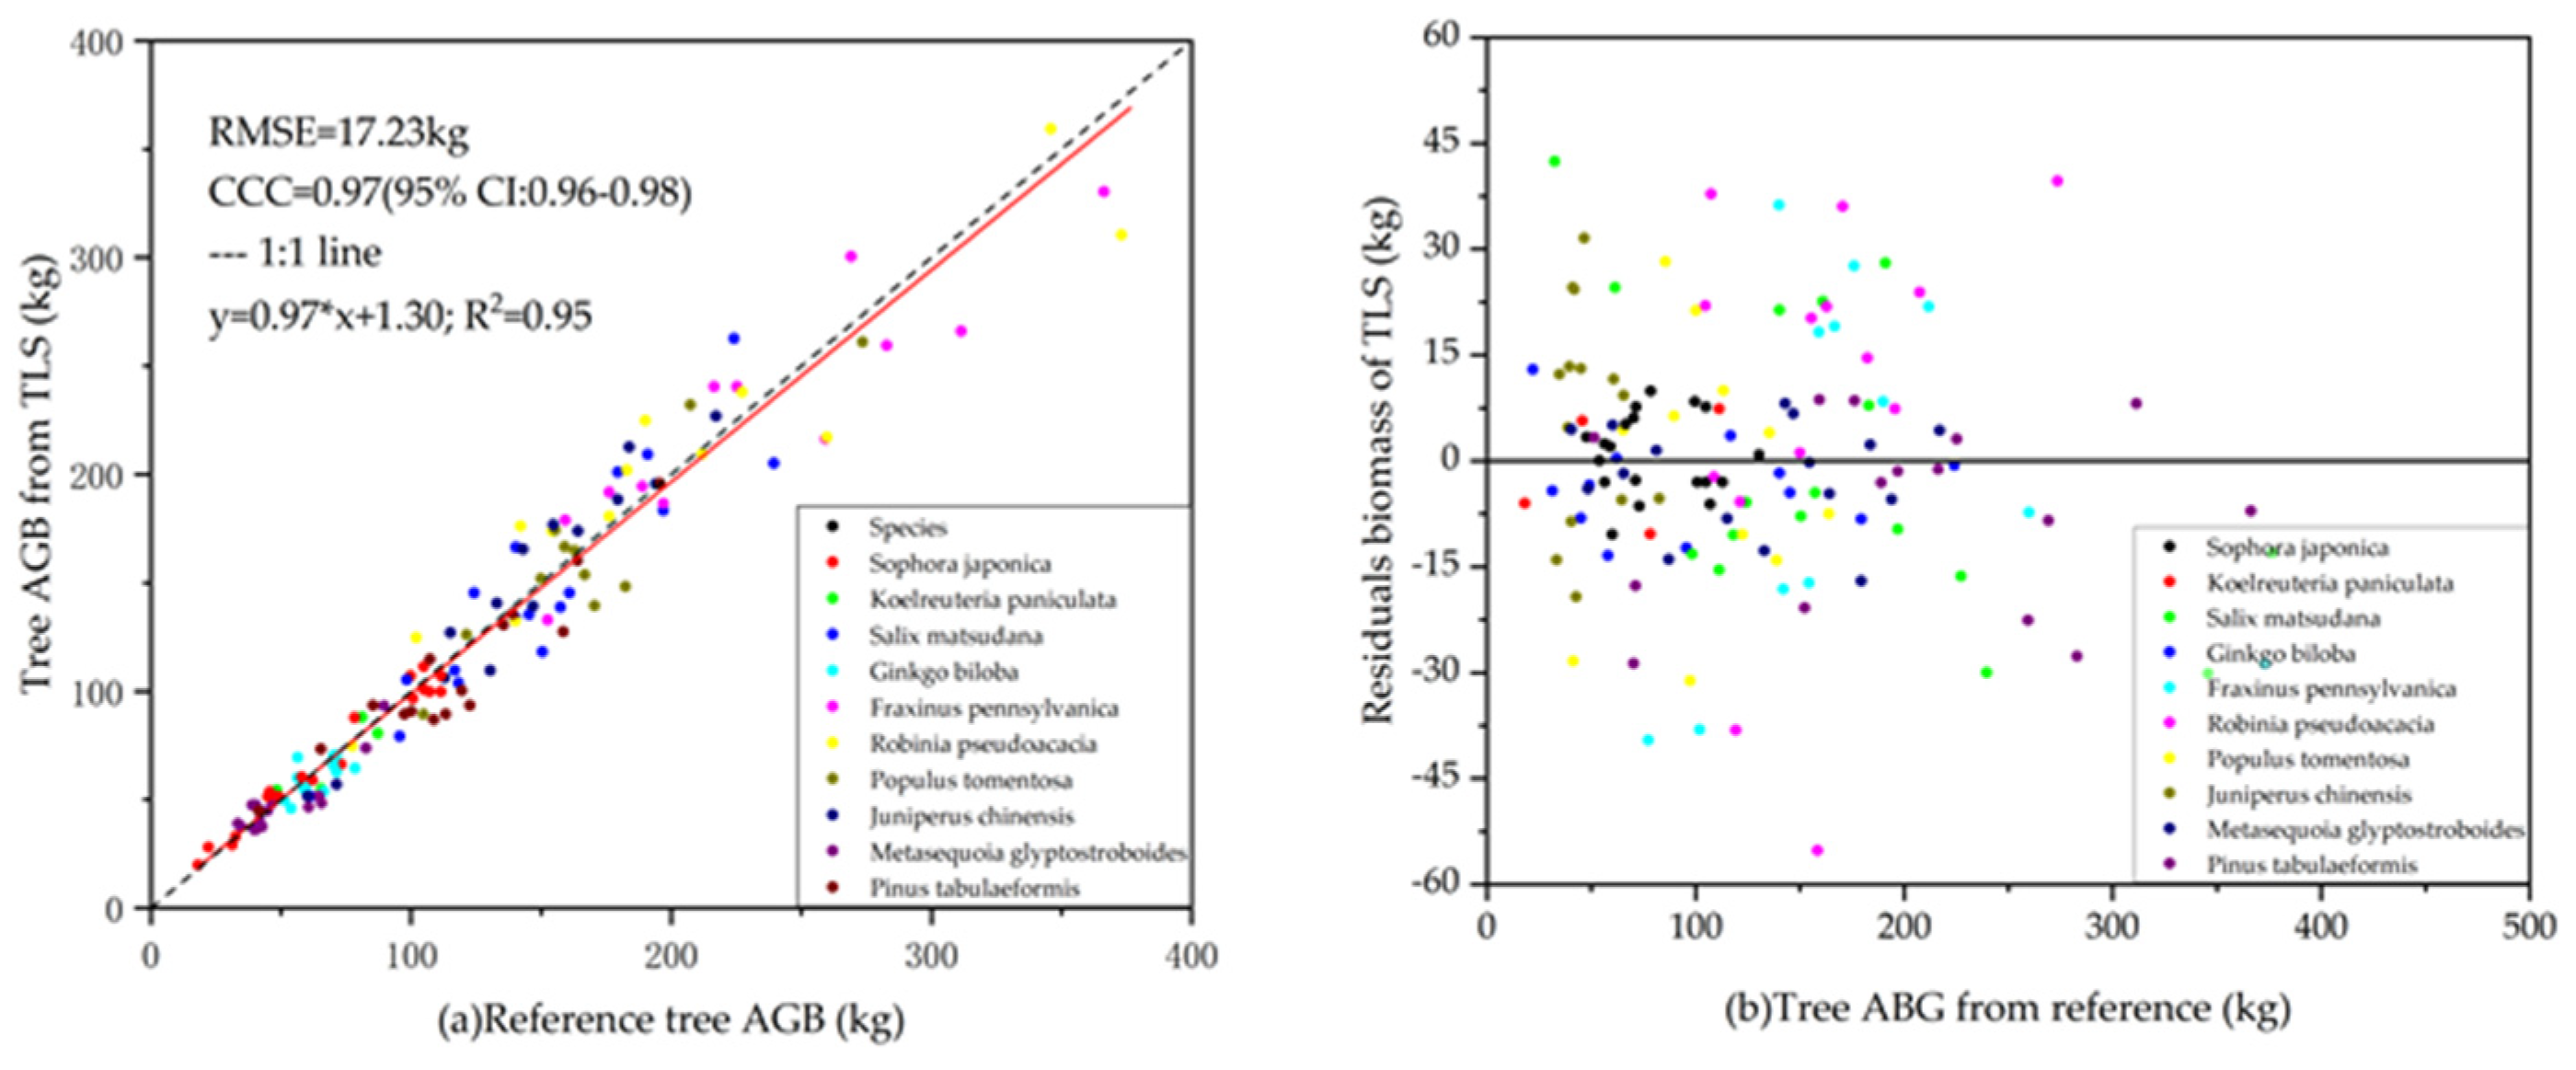
3.3. Estimation of Above-Ground Biomass
3.4. Comparison of Work Efficiency
4. Discussion
5. Conclusions
Author Contributions
Funding
Data Availability Statement
Conflicts of Interest
References
- Watt, P.; Donoghue, D. Measuring forest structure with terrestrial laser scanning. Int. J. Remote Sens. 2005, 26, 1437–1446. [Google Scholar] [CrossRef]
- Maas, H.G.; Bienert, A.; Scheller, S.; Keane, E. Automatic forest inventory parameter determination from terrestrial laser scanner data. Int. J. Remote Sens. 2008, 29, 1579–1593. [Google Scholar] [CrossRef]
- McElhinny, C.; Gibbons, P.; Brack, C.; Bauhus, J. Forest and treeland stand structural complexity: Its definition and measurement. For. Ecol. Manag. 2005, 218, 1–24. [Google Scholar] [CrossRef]
- Nehrbass-Ahles, C.; Babst, F.; Klesse, S.; Nötzli, M.; Bouriaud, O.; Neukom, R.; Dobbertin, M.; Frank, D. The influence of sampling design on tree-ring-based quantification of forest growth. Glob. Chang. Biol. 2014, 20, 2867–2885. [Google Scholar] [CrossRef] [PubMed]
- Falkowski, M.J.; Hudak, A.T.; Crookston, N.L.; Gessler, P.E.; Uebler, E.H.; Smith, A.M. Landscape-scale parameterization of a tree-level forest growth model: A k-nearest neighbor imputation approach incorporating lidar data. Can. J. For. Res. 2010, 40, 184–199. [Google Scholar] [CrossRef]
- Kitahara, F.; Mizoue, N.; Yoshida, S. Evaluation of data quality in japanese national forest inventory. Environ. Monit. Assess. 2009, 159, 331. [Google Scholar] [CrossRef]
- Wullschleger, S.D.; Hanson, P.; Todd, D. Transpiration from a multi-species deciduous forest as estimated by xylem sap flow techniques. For. Ecol. Manag. 2001, 143, 205–213. [Google Scholar] [CrossRef]
- Lemenih, M.; Bekele, T. Effect of age on calorific value and some mechanical properties of three eucalyptus species grown in ethiopia. Biomass Bioenergy 2004, 27, 223–232. [Google Scholar] [CrossRef]
- Qiu, Z.; Feng, Z.; Lu, J.; Sun, R. Design and experiment of forest telescope intelligent dendrometer. Trans. Chin. Soc. Agric. Mach. 2017, 48, 202–207, 213. [Google Scholar]
- Qiu, Z.; Feng, Z.; Jiang, J.; Fan, Y. Design and experiment of forest intelligent surveying and mapping instrument. Trans. Chin. Soc. Agric. Mach. 2017, 48, 179–187. [Google Scholar]
- Moskal, L.M.; Zheng, G. Retrieving forest inventory variables with terrestrial laser scanning (tls) in urban heterogeneous forest. Remote Sens. 2011, 4, 1–20. [Google Scholar] [CrossRef] [Green Version]
- Kankare, V.; Holopainen, M.; Vastaranta, M.; Puttonen, E.; Yu, X.; Hyyppä, J.; Vaaja, M.; Hyyppä, H.; Alho, P. Individual tree biomass estimation using terrestrial laser scanning. ISPRS J. Photogramm. Remote Sens. 2013, 75, 64–75. [Google Scholar] [CrossRef]
- Dassot, M.; Colin, A.; Santenoise, P.; Fournier, M.; Constant, T. Terrestrial laser scanning for measuring the solid tree volume, including branches, of adult standing trees in the forest environment. Comput. Electron. Agric. 2012, 89, 86–93. [Google Scholar] [CrossRef]
- Raumonen, P.; Kaasalainen, M.; Åkerblom, M.; Kaasalainen, S.; Kaartinen, H.; Vastaranta, M.; Holopainen, M.; Disney, M.; Lewis, P. Fast automatic precision tree models from terrestrial laser scanner data. Remote Sens. 2013, 5, 491–520. [Google Scholar] [CrossRef] [Green Version]
- Yu, X.; Liang, X.; Hyyppä, J.; Kankare, V.; Vastaranta, M.; Holopainen, M. Stem biomass estimation based on stem reconstruction from terrestrial laser scanning point clouds. Remote Sens. 2013, 4, 344–353. [Google Scholar] [CrossRef]
- Liang, X.; Kankare, V.; Yu, X.; Hyyppa, J.; Holopainen, M. Automated Stem Curve Measurement Using Terrestrial Laser Scanning. IEEE Trans. Geosci. Remote Sens. 2014, 52, 1739–1748. [Google Scholar] [CrossRef]
- Astrup, R.; Ducey, M.J.; Granhus, A. Approaches for estimating stand-level volume using terrestrial laser scanning in a single-scan mode. Can. J. For. Res. 2014, 44, 666–676. [Google Scholar] [CrossRef]
- Newnham, G.J.; Armston, J.D.; Calders, K. Terrestrial Laser Scanning for Plot-Scale Forest Measurement. Curr. For. Rep. 2015, 1, 239–251. [Google Scholar] [CrossRef] [Green Version]
- Yao, Y.; Yang, X. Measuring forest structure and biomass in New England forest stands using Echidna ground-based lidar. Remote Sens. Environ. 2011, 115, 2965–2974. [Google Scholar] [CrossRef]
- Lindberg, E.; Holmgren, J.; Olofsson, K.; Olsson, H. Estimation of stem attributes using a combination of terrestrial and airborne laser scanning. Eur. J. For. Res. 2012, 131, 1917–1931. [Google Scholar] [CrossRef] [Green Version]
- Marín-Buzón, C.; Pérez-Romero, A.; Tucci-Álvarez, F.; Manzano-Agugliaro, F. Assessing the Orange Tree Crown Volumes Using Google Maps as a Low-Cost Photogrammetric Alternative. Agronomy 2020, 10, 893. [Google Scholar] [CrossRef]
- Fan, Y.; Feng, Z.; Abdul, M.; Tauheed, U.K.; Shen, C.Y.; Sajjad, S. Estimating Tree Position, Diameter at Breast Height, and Tree Height in Real-Time Using a Mobile Phone with RGB-D SLAM. Remote Sens. 2018, 10, 1845. [Google Scholar] [CrossRef] [Green Version]
- Chen, S.; Feng, Z.; Chen, P.; Tauheed, U.K.; Lian, Y. Nondestructive Estimation of the Above-Ground Biomass of Multiple Tree Species in Boreal Forests of China Using Terrestrial Laser Scanning. Forests 2019, 10, 936. [Google Scholar] [CrossRef] [Green Version]
- Qin, T.; Gu, X.; Tian, Z.; Pan, H.; Deng, J.; Wan, L. An empirical analysis of the factors influencing farmer demand for forest insurance: Based on surveys from lin’an county in zhejiang province of china. J. For. Econ. 2016, 24, 37–51. [Google Scholar] [CrossRef]
- Pollefeys, M. Detailed Real-Time Urban 3D Reconstruction from Video. Int. J. Comput. Vis. 2008, 78, 143–167. [Google Scholar] [CrossRef]
- Dandois, J.P.; Ellis, E.C. High spatial resolution threedimensional mapping of vegetation spectral dynamics using computer vision. Remote Sens. Env. 2013, 136, 259–276. [Google Scholar] [CrossRef] [Green Version]
- Liu, J.; Feng, Z.; Yang, L.; Mannan, A.; Khan, T.; Zhao, Z. Extraction of sample plot parameters from 3D point cloud reconstruction based on combined RTK and CCD continuous photography. Remote Sens. 2018, 10, 1299. [Google Scholar] [CrossRef] [Green Version]
- Piermattei, L.; Karel, W.; Wang, D. Terrestrial Structure from Motion Photogrammetry for Deriving Forest Inventory Data. Remote Sens. 2019, 11, 950. [Google Scholar] [CrossRef] [Green Version]
- Kurniawan, R.A.; Ramdani, F.; Tanzil, M.T. Videogrammetry: A new approach of 3-dimensional reconstruction from video using SfM algorithm: Case studi: Coal mining area. In Proceedings of the 2017 International Symposium on Geoinformatics (ISyG), Malang, Indonesia, 24–25 November 2017; pp. 24–25. [Google Scholar]
- Beraldin, J.A.; Lin, S.Y.; Mills, J.P. Integration of videogrammetry and terrestrial laser scanning for dynamic surface modeling. Proc. SPIE Int. Soc. Opt. Eng. 2005, 5665, 243–251. [Google Scholar]
- Tang, Y. The Study on Data Processing Method of High-Speed Video for Building Health Monitoring; Beijing University of Civil Engineering and Architecture: Beijing, China, 2018. (In Chinese) [Google Scholar]
- Lai, J.; Pan, Q.; Liang, J. Model Study on Growth Factors of Fraxinus in Beijing. Chin. Agric. Sci. Bull. 2015, 31, 21–26. [Google Scholar]
- Wang, Z.; Liu, L.; Peng, D.; Liu, X. Estimating woody aboveground biomass in an area of agroforestry using airborne light detection and ranging and compact airborne spectrographic imager hyperspectral data: Individual tree analysis incorporating tree species information. J. Appl. Remote. Sens. 2016, 10, 036007. [Google Scholar] [CrossRef]
- Zhang, X.; Leng, H.; Zhao, G.; Jun, J.; Aicui1, T.; Kun, S.; Da, L. Allometric models for estimating aboveground biomass for four common greening tree species in Shanghai. J. Nanjing For. Univ. 2018, 42, 144–149. [Google Scholar]
- Zeng, W. Developing One-variable Individual Tree Biomass Models Based on Wood Density for 34 Tree Species in China. For. Resour. Manag. 2017, 6, 41–46. [Google Scholar]
- Liu, K.; Cao, L.; Wang, G.; Cao, F. Biomass allocation patterns and allometric models of Ginkgo biloba. J. Beijing For. Univ. 2017, 39, 12–20. [Google Scholar]
- Li, H.; Lei, Y. Estimation and Evaluation of Forest Biomass Carbon Storage in China; China Forestry Publishing House: Beijing, China, 2010; pp. 52–58. (In Chinese) [Google Scholar]
- Zeng, W.-S. Developing Tree Biomass Models for Eight Major Tree Species in China. In Biomass Volume Estimation and Valorization for Energy; Jaya, S.T., Ed.; Books on Demand: Pasig City, PH, USA, 2017; pp. 3–21. [Google Scholar]
- State Forestry Administration of China (SFAC). Tree Biomass Models and Related Parameters to Carbon Accounting for Cunninghamia Lanceolata; China Standard Press: Beijing, China, 2014.
- Zhuang, H.; Becuwe, X.; Xiao, C.; Wang, Y.; Wang, H.; Yin, S.; Liu, C. Allometric Equation-Based Estimationof Biomass Carbon Sequestration in Metasequoia glyptostroboides Plantations in Chongming Island, Shanghai. J. Shanghai Jiaotong Univ. 2012, 30, 48–55. (In Chinese) [Google Scholar]
- Steichen, T.J.; Nicholas, J.C. A note on the concordance correlation coefficient. Stata J. 2002, 2, 183–189. [Google Scholar] [CrossRef] [Green Version]
- Liang, X. The use of a hand-held camera for individual tree 3D mapping in forest sample plots. Remote Sens. 2014, 6, 6587–6603. [Google Scholar] [CrossRef] [Green Version]
- Liang, X.; Wang, Y.; Jaakkola, A.; Kukko, A.; Kaartinen, H.; Hyyppä, J.; Honkavaara, E.; Liu, J. Forest Data Collection Using Terrestrial Image-Based Point Clouds from a Handheld Camera Compared to Terrestrial and Personal Laser Scanning. IEEE Trans. Geosci. Remote Sens. 2015, 53, 5117–5132. [Google Scholar] [CrossRef]
- Mokroš, M.; Liang, X.; Surový, P.; Valent, P.; Cernava, J.; Chudý, F.; Mergani, J. Evaluation of close-range photogrammetry image collection methods for estimating tree diameters. ISPRS Int. J. Geo-Inf. 2018, 7, 93. [Google Scholar] [CrossRef] [Green Version]




| Type | Parameter | Type | Parameter |
|---|---|---|---|
| Model | OT110 | Lens | FOV 80° F20 |
| Size | 121.9 × 36.9 × 28.6 mm | Battery life | 140 min |
| Weight | 116 g | Video resolution | 4K Ultra HD: 3840 × 2160 |
| Cradle head jitter suppression | ±0.005° | ISO range | Video: 100–3200 |
| No. | Attribute | Parameter |
|---|---|---|
| 1 | Center x 0 | 1346.4 |
| 2 | Center y 0 | 10,262,000 |
| 4 | Radial distortion factor K1 | 0.0173 |
| 5 | Radial distortion factor K2 | 0.0099 |
| 6 | Radial distortion factor K3 | 00061 |
| 7 | Tangential distortion coefficient P1 | 0.0021 |
| 8 | Tangential distortion coefficient P2 | 0.00070178 |
| Species | Model Source | Model | R2 |
|---|---|---|---|
| Sophora japonica | Wang et al. [33] | Wagb = 0.171D2.112 | - |
| Koelreuteria paniculata | Zhang et al. [34] | Wagb = 0.12238D2.13793 | 0.95 |
| Salix matsudana | Zeng [35] | Wagb = 0.1323D7/3 | - |
| Ginkgo biloba | Liu et al. [36] | Wagb = e(−2.56+2.40lnD) | 0.98 |
| Fraxinus pennsylvanica | Li et al. [32,37] | Wagb = 0.0495502(D2H)0.952453 | - |
| Robinia pseudoacacia | Zeng [35] | Wagb = 0.2022D7/3 | - |
| Populus tomentosa | Zeng [38] | Wagb = 0.09198D2.4490 | - |
| Juniperus chinensis | SFAC [39] | Wagb = 0.2479D2.0333 | - |
| Metasequoia glyptostroboides | Zhuang et al. [40] | Wagb = 0.06291D2.4841 | 0.972 |
| Pinus tabulaeformis | LY [41] | Wagb = 0.086112D2.46157 | 0.954 |
| Sample No. | Video Duration (min) | Number of Selected Frames | Number of 3D Points | Processing Time (min) |
|---|---|---|---|---|
| 1 | 4.6 | 701 | 3,466,149 | 201 |
| 2 | 3.7 | 630 | 3,214,592 | 206 |
| 3 | 4.3 | 583 | 4,965,126 | 254 |
| 4 | 3.9 | 519 | 3,158,812 | 218 |
| 5 | 4.1 | 625 | 4,215,669 | 221 |
| 6 | 3.8 | 532 | 3,120,035 | 237 |
| 7 | 3.5 | 571 | 3,694,914 | 212 |
| 8 | 4.7 | 679 | 5,789,210 | 251 |
| 9 | 3.5 | 561 | 5,248,952 | 203 |
| 10 | 3.9 | 496 | 4,329,894 | 237 |
| Bias | Bias% | RMSE | RMSE% | |
|---|---|---|---|---|
| Cylinder fitting extracted DBH (cm) | −0.62 | −3.14 | 1.08 | 5.52 |
| Circular fitting extracted DBH (cm) | −0.01 | −0.04 | 0.79 | 4.03 |
| Sample No. | Circle Fitting vs. Survey | TLS vs. Survey | Circle Fitting vs. TLS | Number of Trees | |||||||||
|---|---|---|---|---|---|---|---|---|---|---|---|---|---|
| Bias | Bias% | RMSE | RMSE% | Bias | Bias% | RMSE | RMSE% | Bias | Bias% | RMSE | RMSE% | ||
| 1 | −0.62 | −3.14 | 1.08 | 5.52 | −0.05 | −0.27 | 0.94 | 4.80 | −0.61 | −2.88 | 1.26 | 5.96 | 13 |
| 2 | −0.17 | −1.02 | 1.121 | 6.81 | −0.38 | −2.34 | 0.84 | 5.16 | 0.22 | 1.35 | 1.58 | 9.87 | 12 |
| 3 | −0.64 | −3.19 | 1.24 | 6.20 | −0.3 | −1.50 | 1.1 | 5.47 | −0.34 | −1.72 | 1.48 | 7.47 | 15 |
| 4 | −0.42 | −2.20 | 1.07 | 5.68 | −0.15 | −0.79 | 0.85 | 4.49 | −0.27 | −1.42 | 1.58 | 8.41 | 12 |
| 5 | −0.59 | −3.08 | 1.45 | 7.53 | 0.26 | 1.37 | 1.04 | 5.42 | −0.86 | −4.40 | 1.51 | 7.74 | 14 |
| 6 | −0.51 | −2.39 | 1.38 | 6.47 | −0.25 | −1.19 | 0.98 | 4.59 | −0.25 | −1.21 | 1.19 | 5.63 | 11 |
| 7 | −0.32 | −1.43 | 1.74 | 7.70 | 0.21 | 0.95 | 1.19 | 5.26 | −0.54 | −2.35 | 2.07 | 9.12 | 14 |
| 8 | 0.42 | 2.87 | 1.07 | 7.36 | −0.12 | −1.46 | 0.91 | 6.23 | 0.24 | 1.78 | 1.02 | 7.55 | 16 |
| 9 | −0.48 | −3.19 | 0.88 | 5.91 | 0.23 | 1.68 | 0.74 | 4.94 | −0.73 | −4.78 | 1.33 | 8.80 | 12 |
| 10 | −0.12 | −0.65 | 1.43 | 7.76 | −0.55 | −2.96 | 1.05 | 5.70 | 0.43 | 2.38 | 1.64 | 9.15 | 15 |
| Strengths | Weaknesses | Opportunities | Threats | |
|---|---|---|---|---|
| Videogrammetry | 1.Lightweight equipment; 2. Fast data collection; 3. Low labor costs. | 1. Indoors data processing takes more time; 2. Need a scale. | Provide new ideas for forest resource survey methods. | Data processing algorithms need to be further optimized. |
| TLS | High precision. | 1.Heavy equipment; 2. Well-designed collection plan; 3. Time-consuming. | Has been recognized by the industry. | - |
| Field survey | High precision. | 1.High labor cost; 2. Long time in the field. | - | - |
Publisher’s Note: MDPI stays neutral with regard to jurisdictional claims in published maps and institutional affiliations. |
© 2021 by the authors. Licensee MDPI, Basel, Switzerland. This article is an open access article distributed under the terms and conditions of the Creative Commons Attribution (CC BY) license (https://creativecommons.org/licenses/by/4.0/).
Share and Cite
Lian, Y.; Feng, Z.; Huai, Y.; Lu, H.; Chen, S.; Li, N. Terrestrial Videogrammetry for Deriving Key Forest Inventory Data: A Case Study in Plantation. Remote Sens. 2021, 13, 3138. https://doi.org/10.3390/rs13163138
Lian Y, Feng Z, Huai Y, Lu H, Chen S, Li N. Terrestrial Videogrammetry for Deriving Key Forest Inventory Data: A Case Study in Plantation. Remote Sensing. 2021; 13(16):3138. https://doi.org/10.3390/rs13163138
Chicago/Turabian StyleLian, Yining, Zhongke Feng, Yongjian Huai, Hao Lu, Shilin Chen, and Niwen Li. 2021. "Terrestrial Videogrammetry for Deriving Key Forest Inventory Data: A Case Study in Plantation" Remote Sensing 13, no. 16: 3138. https://doi.org/10.3390/rs13163138
APA StyleLian, Y., Feng, Z., Huai, Y., Lu, H., Chen, S., & Li, N. (2021). Terrestrial Videogrammetry for Deriving Key Forest Inventory Data: A Case Study in Plantation. Remote Sensing, 13(16), 3138. https://doi.org/10.3390/rs13163138


