Article

Response of Total Suspended Sediment and Chlorophyll-a Concentration to Late Autumn Typhoon Events in the Northwestern South China Sea

1
Laboratory of Coastal Ocean Variation and Disaster Prediction, College of Ocean and Meteorology, Guangdong Ocean University, Zhanjiang 524088, China
2
Key Laboratory of Climate, Sources and Environments in Continent Shelf Sea and Deep Ocean, Zhanjiang 524088, China
3
Institute of Oceanology, Chinese Academy of Sciences, Qingdao 266071, China
4
Department of Atmospheric and Oceanic Science, University of Maryland, College Park, MD 20742, USA
*
Author to whom correspondence should be addressed.
Remote Sens. 2021, 13(15), 2863; https://doi.org/10.3390/rs13152863
Submission received: 28 May 2021 / Revised: 14 July 2021 / Accepted: 17 July 2021 / Published: 21 July 2021
(This article belongs to the Special Issue Remote Sensing Applications in Ocean Observation)

Abstract

:
Strong typhoon winds enhance turbulent mixing, which induces sediment to resuspend and to promote chlorophyll-a (Chl-a) blooms in the continental shelf areas. In this study, we find limited Chl-a responses to three late autumn typhoons (typhoon Nesat, Mujigae and Khanun) in the northwestern South China Sea (NWSCS) using satellite observations. In climatology, the Chl-a and total suspended sediment (TSS) concentrations are high all year round with higher value in autumn in the offshore area of the NWSCS. After the typhoon passage, the Chl-a concentration increases slightly (23%), while even TSS enhances by 280% on the wide continental shelf of the NWSCS. However, in the southern area, located approximately 100 km from the typhoon tracks, both TSS and Chl-a concentrations increase 160% and 150% after typhoon passage, respectively. In the deeper area, the increased TSS concentration is responsible for the considerable increase of the Chl-a. An empirical analysis is applied to the data, which reveals the TSS and Chl-a processes during typhoon events. The results of this study suggest a different mechanism for Chl-a concentration increase and thus contribute toward further evaluation of typhoon-induced biological responses.

Graphical Abstract

1. Introduction

Typhoons inject substantial amounts of energy into the ocean and initiate various ocean processes, e.g., mixing and near-inertial oscillations (NIOs). During typhoon passage, the main response of the upper ocean is related to wide-scale cooling. Hu and Kawmura [1] found that the cold core with a sea surface temperature (SST) difference greater than 2 °C compared to the surrounding areas may be observed using an Advanced Very High Resolution Radiometer (AVHRR) sensor. Since 2010, typhoon-forced near inertial waves have been a research focus for many projects [2]. Guan, et al. [3] examined the upper ocean dynamic response to typhoon Megi (2010) with the presence of a strong internal tide. Sun, et al. [4] found that the waveguide effect of the background shear flow redistributed the NIOs energy after the typhoon passage and trapped energy in the area of the typhoon’s negative vorticity. Typhoons induce the oceanic geostrophic response, which perturbs the underlying ocean eddy field [5]. Typhoon intensity can then be strengthened by the warm ocean mesoscale eddy [6].
In addition to the physical typhoon-induced interactions, biogeochemical interactions between the typhoon and ocean occur under the enhanced mixing and transport of water and nutrients. In 2004, enhanced chlorophyll-a (Chl-a) concentrations were revealed in the central South China Sea (SCS) in November 2001 after the passage of typhoon Lingling [7]. The NIOs induces uplift of nutrients and Chl-a into the mixed layer from below, leading to a surface Chl-a increase [8,9]. High winds can induce upwelling, and cold eddies often promote the considerable growth of phytoplankton after a typhoon [10]. Chl-a concentrations increase after typhoon passage and remain at a high concentration for around 5 days before beginning to return to initial conditions [11,12]. Moreover, Wang [13] showed that increases of Chl-a concentration occur after 70% of the typhoons in the SCS based on 16 years of data.
The SCS is one of the areas most affected by typhoons anda local typhoon birthplace [14]. Typhoons generated in October and November are known as late autumn typhoons in the SCS, which may have a stronger impact on their local environment because of their high intensity. Chl-a concentrations during this period increase over the entire SCS, but they remain at a high level (~0.3 mg m−3) in the coastal region [15]. Previous studies have described Chl-a blooms induced by late autumn typhoons. For example, the Chl-a concentration increased by 226% on the 7th day after the passage of typhoon Nesat (2011), associated with the near-inertial baroclinic shear instability [16]. The maximum increase of chlorophyll-a (Chl-a) concentration induced by typhoon Mujigae (2015) occurred in the shelf sea of the NWSCS, with features of unusual surface cooling [17,18].
Moreover, the SCS sits in the East Asian monsoon region, with northeasterly winds prevailing in winter and southwesterly wind in summer. Previous studies have indicated that a southwestward coastal current is present west of Guangdong throughout the year [19,20]. In summer, the occurrence of southwest monsoons is an important factor in the formation of the southwestward coastal current on the shelf [21], while the northeasterly wind-induced southwestward flow prevails over the continental shelf of the northern SCS in winter [22]. Sufficient nutrition and Chl-a are transported by the southwestward current from the Pearl River Estuary in the autumn and winter. Thus, the Chl-a concentration is very high on the continental shelf of the northwestern South China Sea (NWSCS).
Furthermore, the monsoon winds could mix the offshore waters well to the bottom in winter [23]. As the maximum Chl-a concentration is observed in the subsurface water (50–70 m), the vertical mixing effect would transport the Chl-a in the subsurface layer up to the surface layer and cause the Chl-a concentration to increase [24,25,26]. The prevailing winds produce onshore Ekman transport, which consists of freshwater discharge from the Pearl River. Thus, the coastal current also plays an important role in transporting the Pearl River water and sediment. In the NWSCS, there is a seasonal coastal upwelling system, which occurs from April to September with the strongest upwelling period in June and July [27].
Strong typhoon winds would induces sediment to resuspend and to promote Chl-a blooms in continental shelf areas. However, Lü, et al. [28] found that a high total suspended sediment (TSS) near the shore and a lack of nutrients in the bottom resulted in no Chl-a bloom in the shelf area. This study aims to investigate the mechanisms for Chl-a increase during three late autumn typhoons (Nesat (2011), Mujigae (2015) and Khanun (2017)) landed in the NWSCS.
This paper is organized as follows. Section 2 describes an introduction to the data and methods including algorithms for retrieval of the colored dissolved organic matter (CDOM) and TSS concentrations from satellite observations. Section 3 and Section 4 present the analysis of the monthly variation in TSS and Chl-a concentrations and the distribution of the TSS and Chl-a concentrations during typhoon passage in the NWSCS. Section 5 discusses the Pearl River water transport, mixing, and upwelling effects to the Chl-a blooms. Section 6 contains a summary.

2. Materials and Methods

2.1. Study Area

The SCS is one of the largest semi-closed marginal seas of the northwestern Pacific Ocean as shown in Figure 1. It connects the Pacific Ocean, the East China Sea, and the Indonesian Seas via the Luzon Strait, the Taiwan Strait, and the Karimata Strait, respectively. A deep basin with a maximum depth of about 5500 m sits in the center of the SCS. The wide continental shelf with a depth less than 200 m is distributed around the basin, which occupies about 48% of the total area [29,30].
The study area sits in the NWSCS. We divide it into two sub-areas: Yuexi (A1) and Qiongdong (A2) as shown in Figure 1. A1 is featured by a broad continental shelf. In the north of A1, the largest river system in South China, the Pearl River Estuary is located. The previous studies have shown that a southwestward coastal current dominates the shelf circulation of the NWSCS in autumn and winter [29]. Qiongdong coastal upwelling occupies the area of about 20–50 km from the coastline of A2 [31,32,33], and it is a seasonal coastal upwelling system occurring from April to September with the strongest upwelling period in June and July [23].

2.2. Late Autumn Typhoons

There were three late autumn typhoons—Nesat (2011), Mujigae (2015), and Khanun (2017)—which made landfall on the southwest coast of China during 2010–2019. The typhoons Nesat (2011), Mujigae (2015), and Khanun (2017) originated from the Pacific Ocean (Table 1), moved northwestward, crossed the continental shelf of the NWSCS, and made landfall on the southwest coast of China. The tracks of the typhoons, as shown in Figure 1, are downloaded from the Tropical Cyclone Data Center of the China Meteorological Administration (CMA) (http://tcdata.typhoon.org.cn, accessed on 4 March 2021) [34,35]. The typhoon center locations, minimum pressure, and two-minute mean maximum sustained wind near the typhoon center are collected at a temporal resolution of 6 h.

2.3. Satellite Ocean Color Data

The daily Chl-a data for the typhoon periods and the monthly data from 2004 to 2019 are downloaded from http://oceandata.sci.gsfc.nasa.gov/ (accessed on 7 February 2021). The dataset is a level-3 product with a spatial resolution of 4 km from the moderate resolution imaging spectroradiometer (MODIS) onboard satellites Terra and Aqua (Table 2). The data from the two platforms are merged for improving the coverage of the Chl-a data [36]. The average Chl-a concentration from the Terra and Aqua satellites is estimated and used in this study. The monthly mean Chl-a concentration from 2004 to 2019, with a spatial resolution of 4 km, are derived from http://oceandata.sci.gsfc.nasa.gov/ (accessed on 5 October 2020).
The Chl-a concentration varied with isobaths (z) in the study area was estimated using the following equation:
C Chl a Mean ( z ) = C Chl a ( x , y , z )   d x d y .
where CChl-a(x,y,z) is the Chl-a concentration obtained from daily Chl-a data.
In order to estimate the Chl-a concentration variation during the typhoon events, the Chl-a concentration anomaly is estimated with respect to a climatological mean:
A c Chl a Mean ( z ) = C Chl a Mean ( z ) C c ( z ) .
where Cc(z) is the climatological mean (2004–2019) for Chl-a concentration varied with isobaths. The climatological mean for Chl-a concentration (Cc(z)), e.g., for October, was estimated by
C c ( z ) = 1 16 i = 2004 2019 C c ( z ,   t ) | t = 10
where Cc(z,t) is the monthly mean Chl-a concentration varied with isobaths (z) from 2004 to 2019. Cc(z,t) is estimated by using Equation (1) from monthly Chl-a concentration.
The MODIS reflectance (Rrs) data at 412, 555, and 645 nm with a spatial resolution of 4 km are obtained from http://oceandata.sci.gsfc.nasa.gov/ (accessed on 7 February 2021) and used to calculate the TSS concentration (Section 2.4) and CDOM (Section 2.5).

2.4. TSS Retrieval

Remote sensing techniques have been applied to quantify the TSS concentration. Empirical relationships between TSS concentration and equivalent reflectance values were established with the linear, polynomial models, and even artificial neural networks [37,38]. Various algorithms for estimating the TSS have been developed using Rrs (443), Rrs (488), Rrs (555), and Rrs (645) data [39,40,41]. As the suspended concentration is high in the continental shelf area, especially near the Pearl River estuary, the TSS concentrations (CTSS) are estimated with retrieval algorithms using Rrs (645) data [41]:
C TSS = 0.6455 + 1455.7 × R r s 645 .
TSS concentration varied with isobaths (z) and anomaly could be estimated from Equations (1) and (2).

2.5. CDOM Retrieval

Satellite ocean color sensors (e.g., MODIS) offers global coverage of CDOM. The amount of CDOM is expressed by the absorption coefficient at 400 nm. The CDOM absorption coefficient at 400 nm is estimated by using monthly Rrs (412) and Rrs (555) data [42,43]:
a C D O M ( 400 ) = 0.2355 × R 1.3423 ,
where R = Rrs(412)/Rrs(555).

2.6. Sea Level Anomaly and Geostrophic Current

Satellite altimeter sea level anomaly (SLA) data are downloaded as a gridded product from the Copernicus Marine Environment Monitoring Service (CMEMS). The temporal resolution is daily and monthly, and the spatial resolution is 0.25° in latitude and longitude with global ocean coverage. The data merged from multiple altimetry sensors are computed with respect to a twenty-year mean.
The daily geostrophic current is provided by the Copernicus Marine Environment Monitoring Service (CMEMS). The monthly mean geostrophic current velocities are calculated using monthly mean SLA data:
u = g f η y ,
v = g f η x ,
where g is the acceleration of gravity, f is the Coriolis parameter and η is monthly mean SLA, respectively.

2.7. Sea Surface Wind and Ekman Pumping

The sea surface wind data at 10 m above the sea surface are obtained from the CMEMS at http://marine.copernicus.eu/ (accessed on 24 April 2021). The data are a level-2 product with a spatial resolution of 25 km, measured by the Advanced Scatterometer (ASCAT) instrument on the EUMETSAT Metop-A satellite. The monthly sea surface wind data from 2010 to 2019 with a spatial resolution of 0.25° are obtained from CMEMS. The climatological sea surface wind is calculated from monthly sea surface wind data.
The velocity of Ekman pumping is calculated by [44]:
W e = 1 ρ f ( × τ ) ,
where f, ρ and τ are the Coriolis parameter, the seawater density and the wind stress, respectively.
A finite difference scheme is applied to calculate wind stress curl [45]:
× τ i , j = 1 R cos φ i , j ( ( τ y ) i + 1 , j ( τ y ) i 1 , j 2 Δ λ ( τ x cos φ ) i , j + 1 ( τ x cos φ ) i , j 1 2 Δ φ ) ,
The wind stress curl is determined as [46]:
τ = ρ a C D U | U | ,
where ρa, CD, and U are the air density, the drag coefficient and the 10 m wind, respectively. The drag coefficient is calculated as [47]:
C D = { ( 0.75 + 0.067 U ) × 10 3   0 < U 26   m   s 1 2.5 × 10 3   U > 26   m   s 1   .  

3. Climatological and Time Series Analyses

3.1. Monthly Variations of TSS and Chl-a Concentrations

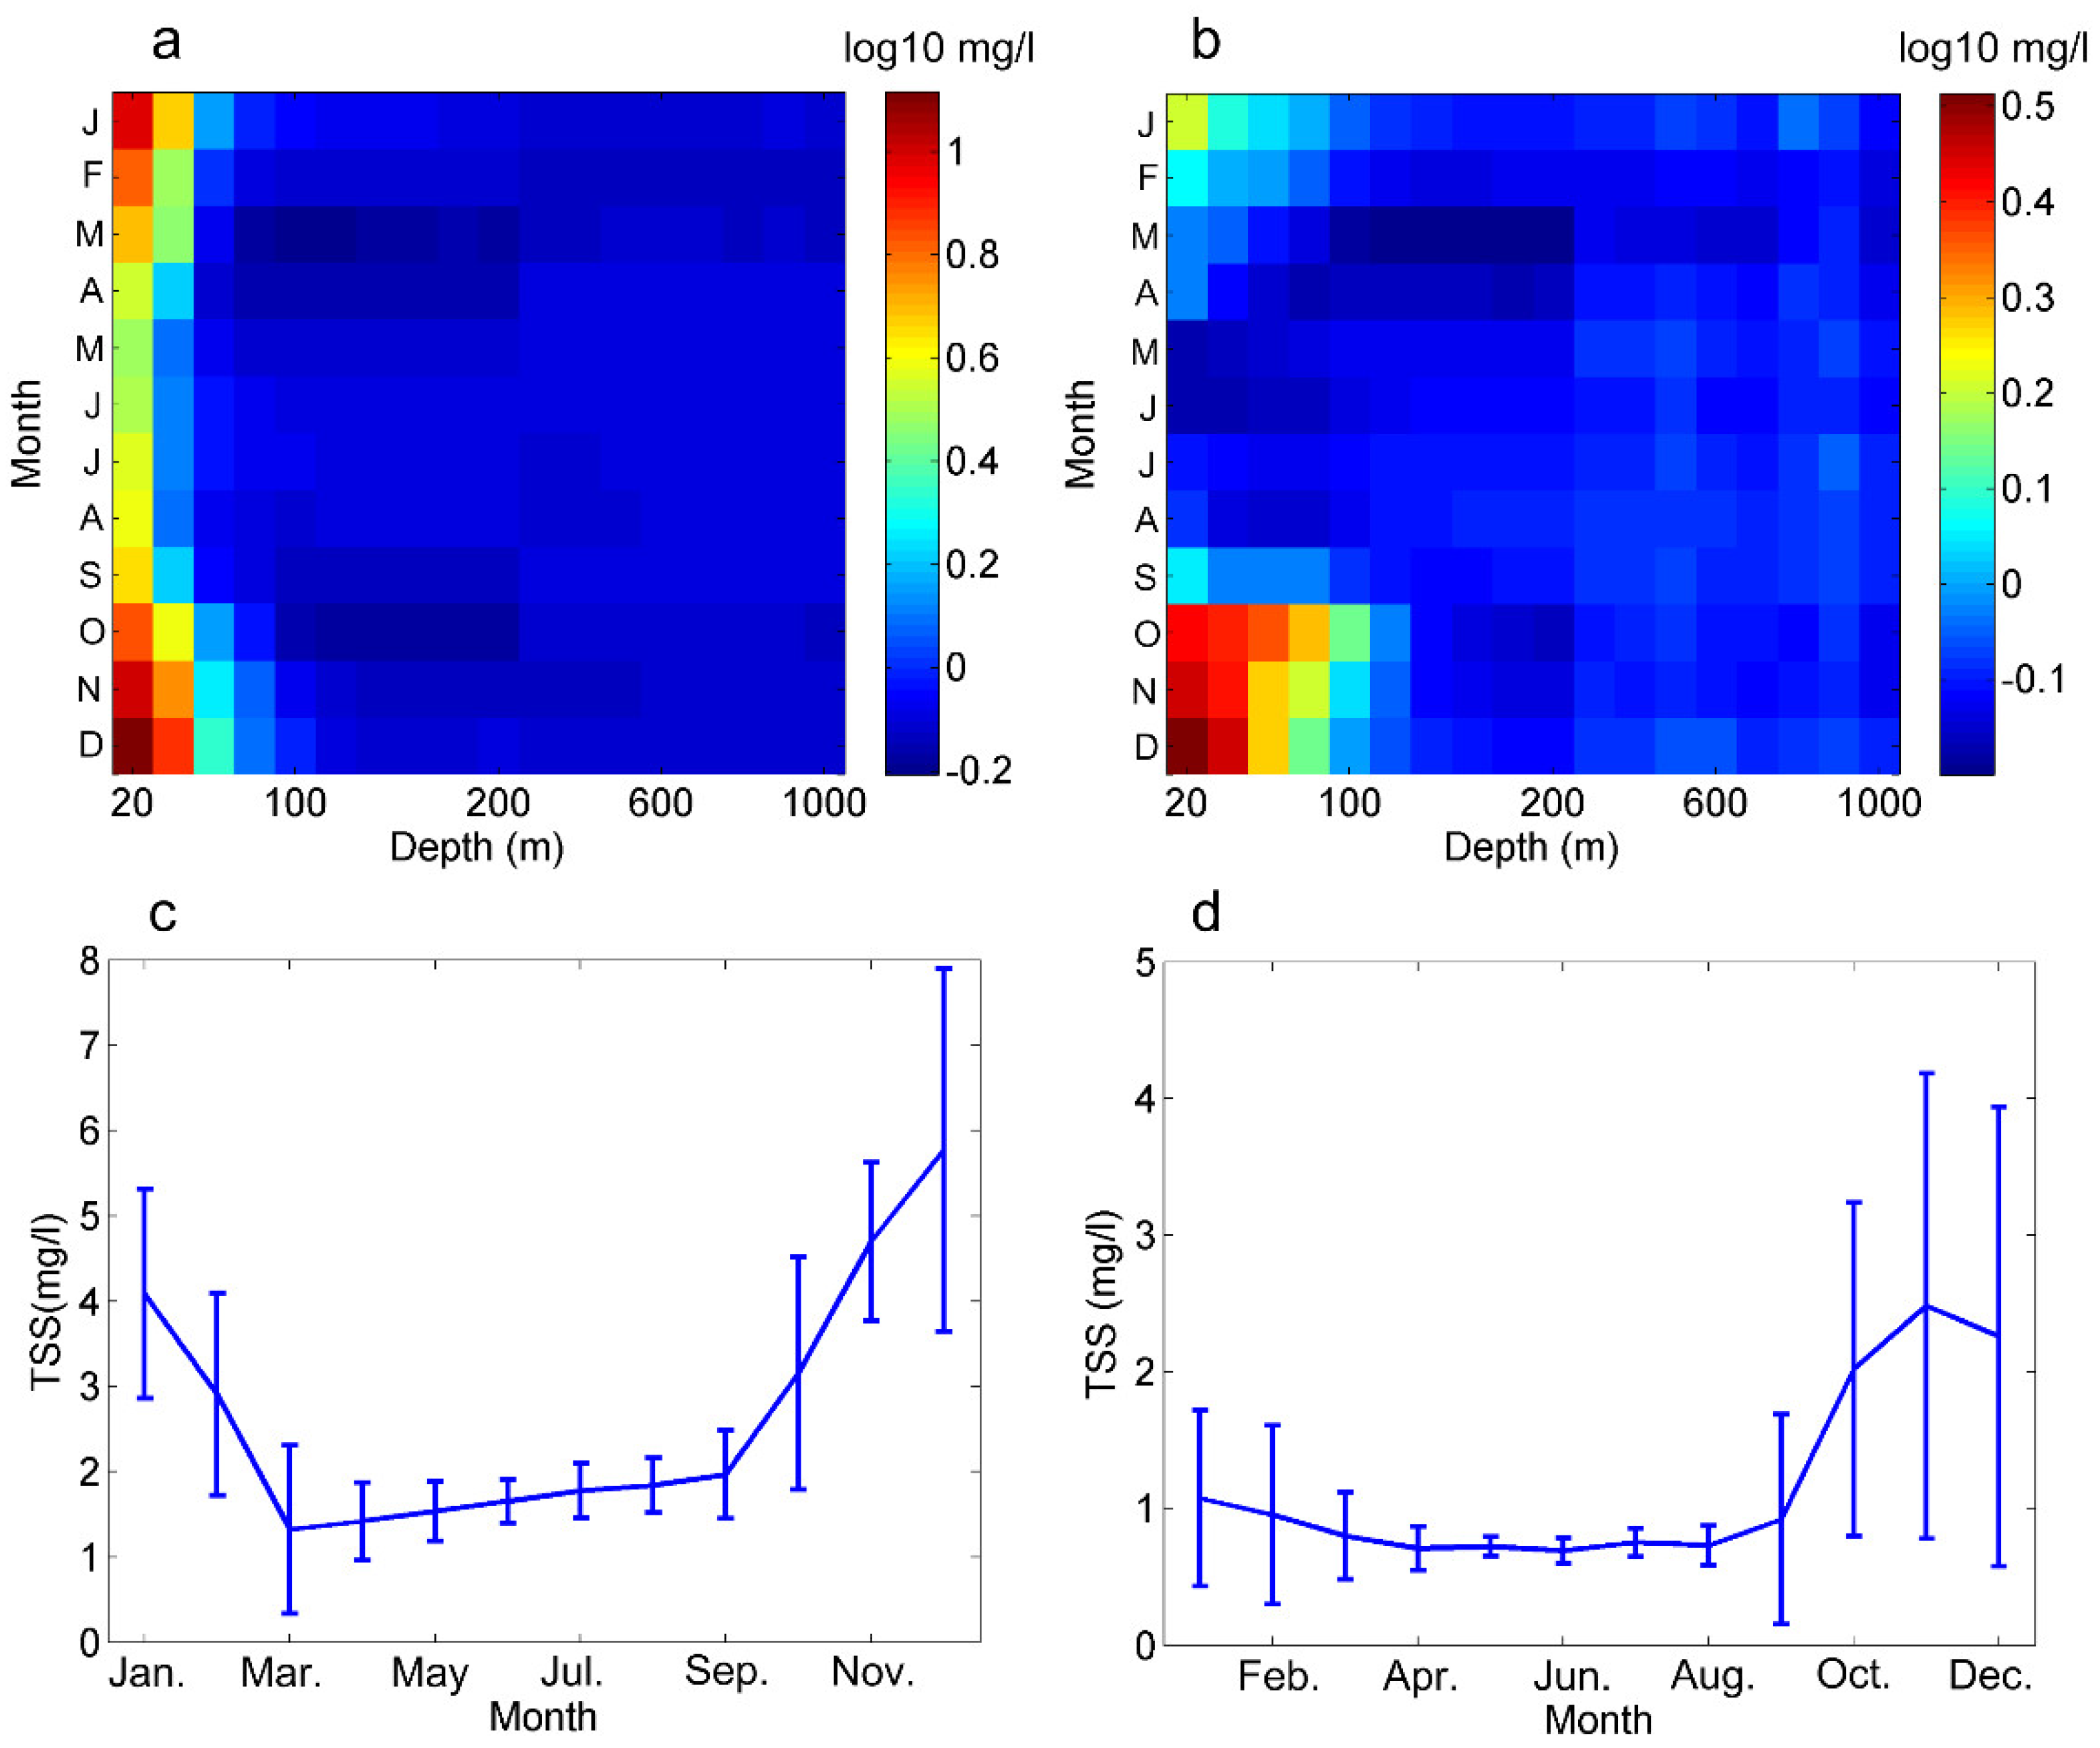
Figure 2 shows the monthly TSS concentration averaged for 2004–2019 varied with isobaths (z) in A1 and A2. The depth-averaged TSS values decrease with the depth increase in A1 throughout the year. The averaged TSS concentration in the summer half year is higher than 3 mg L−1 in the offshore area. In the winter half year, the high TSS concentrations extend to the shelf area with a depth of ~100 m.
In A2 (Figure 2b), low TSS concentration of <0.1 mg L−1 occurred in the offshore and shelf areas in the summer half year. However, a very high TSS concentration of >1.0 mg L−1 is also observed, of which the range extends to the areas as deep as 100 m.
Figure 2c,d show that the monthly TSS concentrations in both A1 and A2 in the winter half year are much higher than that in the summer half year. The TSS concentration in A1 is about 3.0 mg L−1, almost twice as that in A2. Moreover, a relatively high TSS concentration (>2 mg L−1) sustains during late autumn period in A2, and is twice as that of the remainder of the year.
From Figure 3, one can see that the monthly mean Chl-a concentrations in A1 and A2 decrease as the depth increases throughout the year. In A1 (Figure 3a), higher Chl-a concentrations (>1 mg m−3) appear in the offshore area with depths less than 40 m. Meanwhile, the Chl-a concentrations in the shelf area (40–200 m) show clear annual variations. In the summer half of the year from April to August, Chl-a concentrations higher than 0.5 mg m−3 are distributed in the areas with depths less than 40 m. In contrast, in the autumn, the main areas of high Chl-a concentrations have depths < 100 m. The Chl-a concentrations in areas with depths of 100–200 m in the autumn (~0.4 mg m−3) are more than twice as that in the summer half year. The concentrations in the deep-sea areas (>200 m) are much lower.
From Figure 3b, one can see that in A2, the Chl-a values in the offshore areas are much lower than that in A1, and higher Chl-a concentrations are observed in March and October. However, the Chl-a concentrations in the shelf area (40–100 m) are slightly higher (~0.6 mg m−3) than that in A1. Moreover, annual variations in Chl-a concentrations are observed not only in the shelf area but also in the offshore areas.
The high Chl-a concentrations are distributed in the areas with depths less than 80 m in A1 and A2 as shown in Figure 3c,d. The Chl-a concentrations in both A1 and A2 in the autumn are much higher than that in the summer half year. In the summer half year, the mean Chl-a concentrations in A1 and A2 are 0.9 and 0.4 mg m−3, respectively, with 1.4 and 0.9 mg m−3 in the winter half year, respectively. Furthermore, two Chl-a concentration in A2 peaks occur in March and October.
In general, the distribution of TSS and Chl-a concentrations in A1 are comparable, i.e., high TSS and Chl-a concentrations are mainly concentrated in the offshore area throughout the year. In the autumn, relatively high TSS and Chl-a concentrations are found in the shelf area due to a well-mixed water column. The TSS and Chl-a concentrations concurrently increase after September. The mean TSS and Chl-a concentrations in October reach 3.1 mg m−3 and 1.4 mg L−1, respectively.
In A2, the distributions of TSS and Chl-a concentrations are similar from April to December. The lower TSS concentrations (<1.0 mg L−1) occur in March, whereas the Chl-a concentration peaks at 0.8 mg m−3. Moreover, in contrast to the higher Chl-a, remarkably lower TSS concentrations (<0.1 mg L−1) in the offshore area are observed from April to August. The high TSS concentrations (>1.5 mg L−1) are accompanied by high Chl-a concentrations (>1 mg m−3), of which the distribution extends to the depth as 100 m as observed in October.

3.2. TSS and Chl-a Concentrations in A1 during the Typhoon Period

The time series of TSS concentrations varied with isobaths (z) on the continental shelf in A1 during typhoons Nesat (2011), Mujigae (2015) and Khanun (2017) are shown in Figure 4. The TSS concentration in the offshore area (<40 m) was 6.3 mg L−1 before Nesat (2011), Mujigae (2015), and Khanun (2017) arrived. This phenomenon is also shown in Figure 2a, since the monthly mean TSS was high in the offshore area, especially in the winter. The TSS concentration in the offshore area increased significantly to as high as 20.0 mg L−1, after typhoons’ landfall (red curves in Figure 4b,d,f). The significant increase of TSS was also observed at a depth of 80 m. In the basin water, the TSS concentration increased slightly. Ten days later, the TSS concentration for three cases reduced gradually to the previous level.
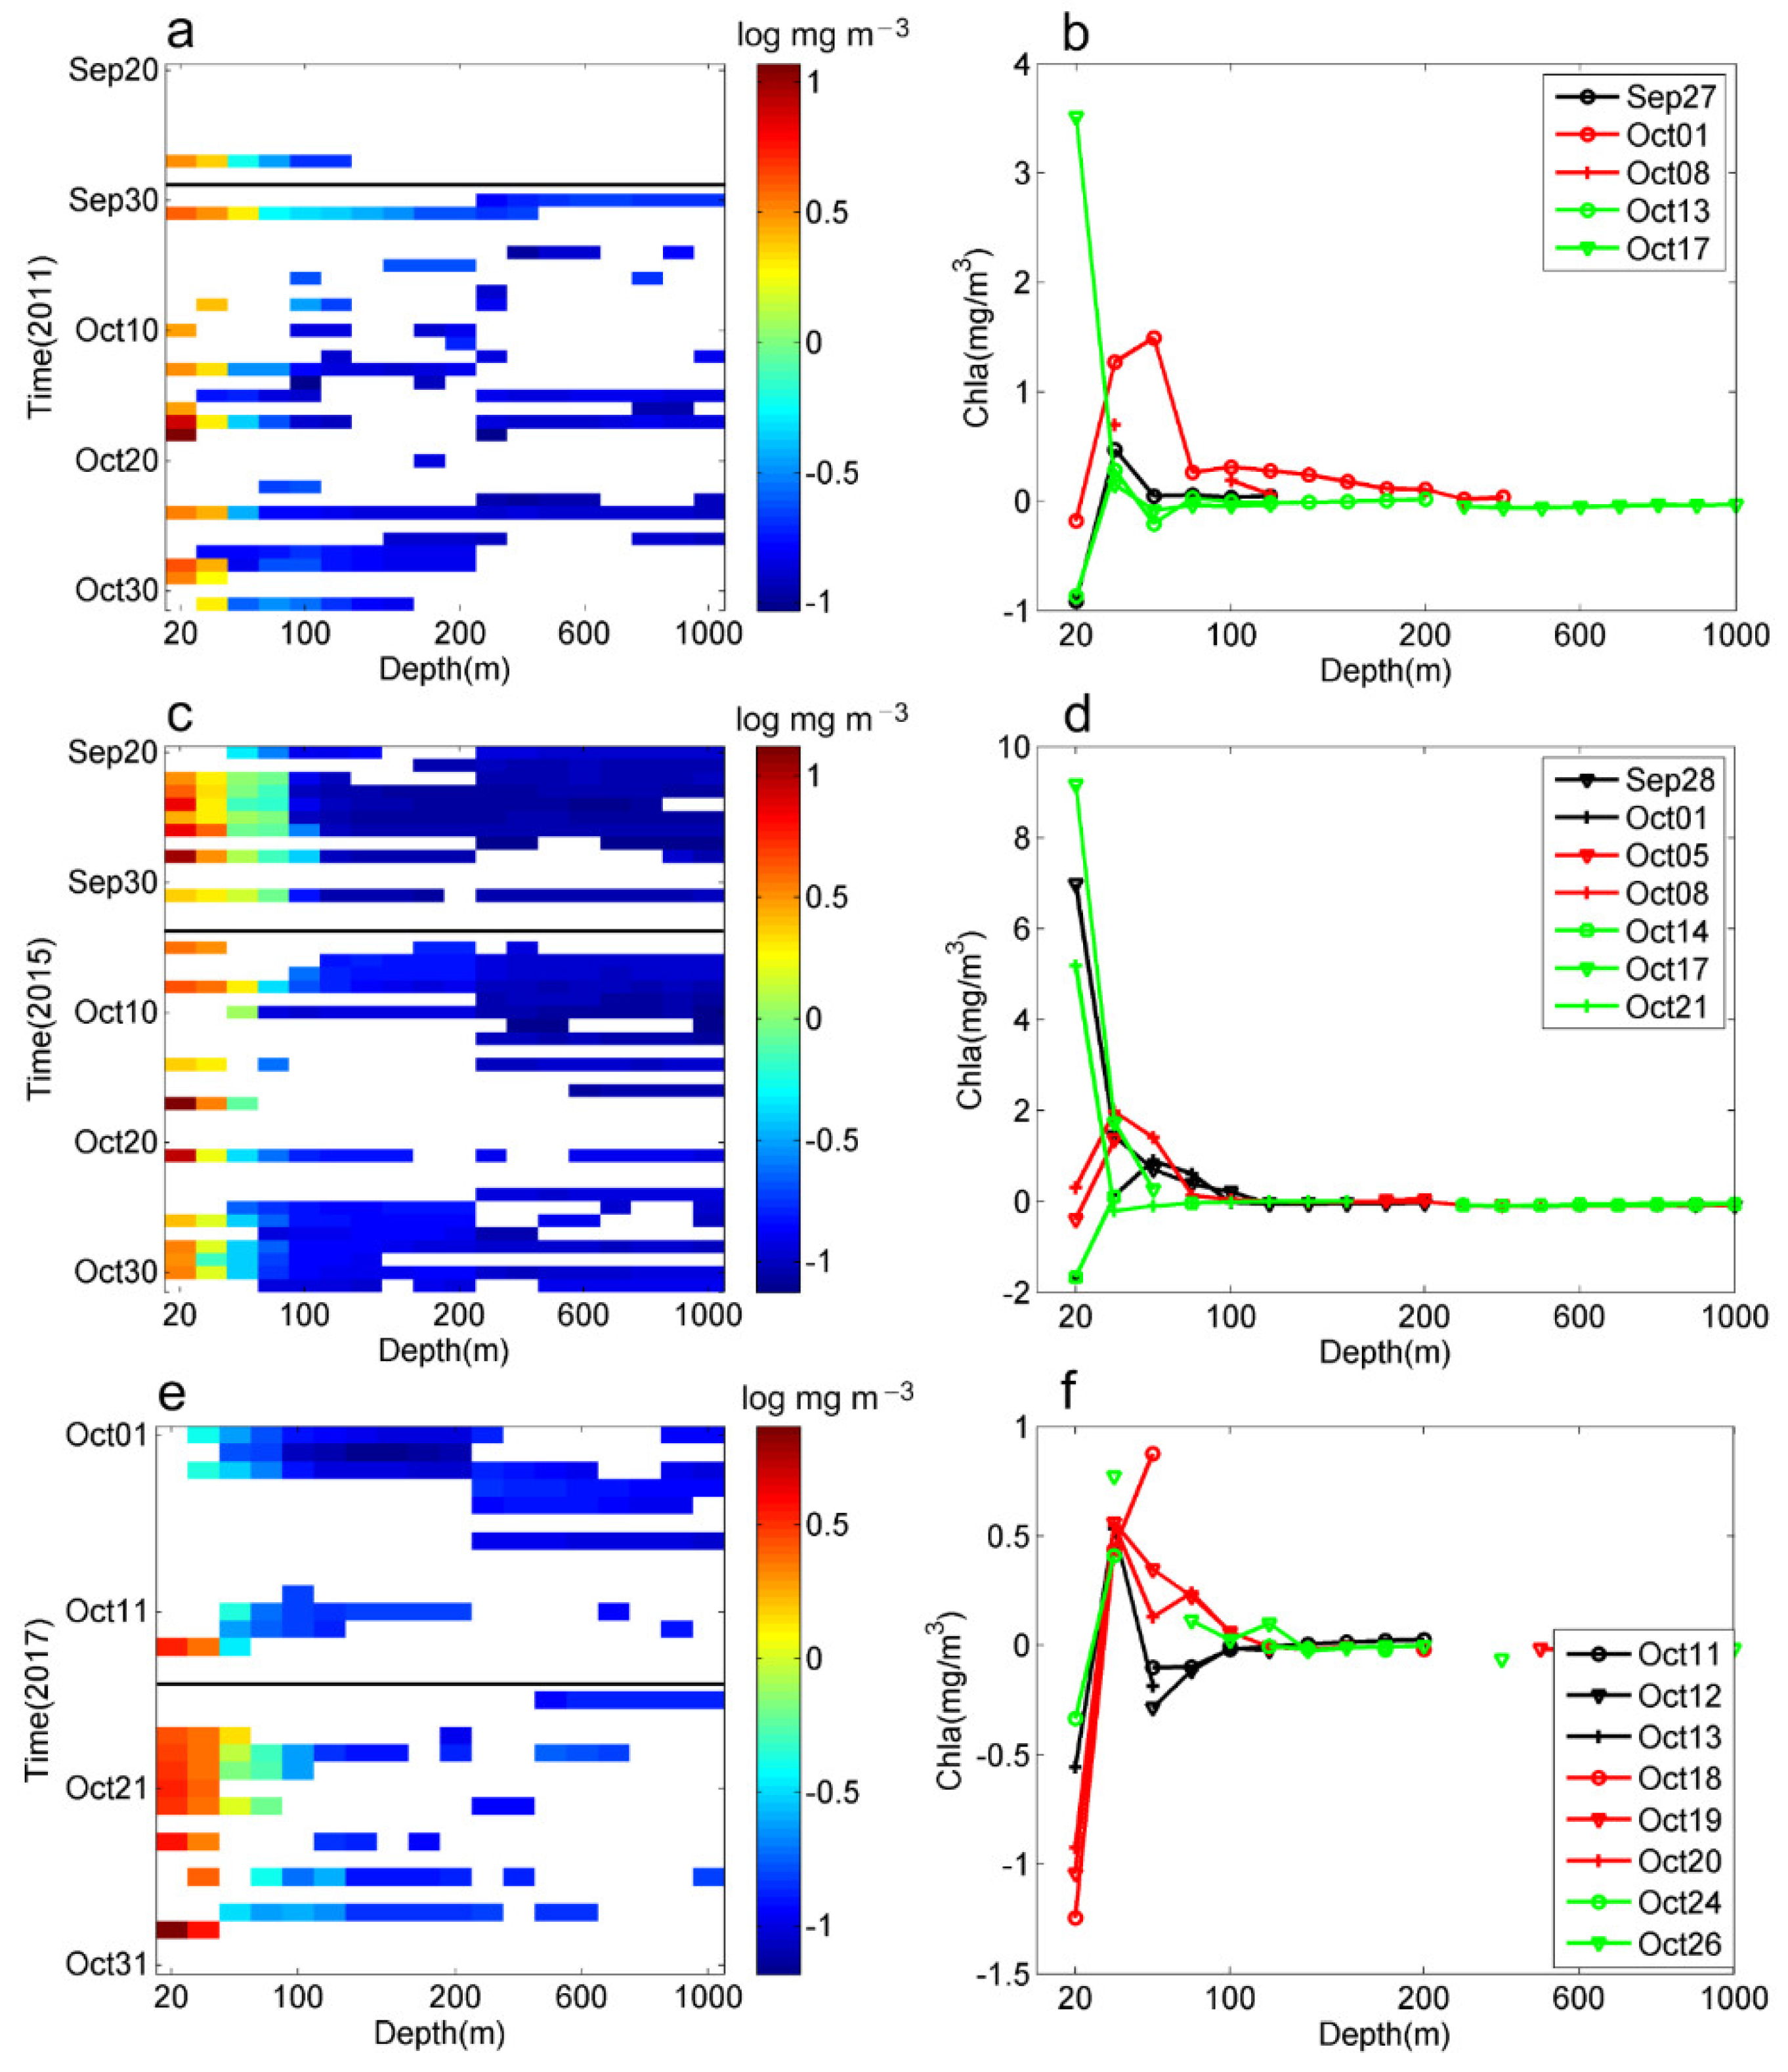
Figure 5 shows time series of Chl-a concentration during the typhoon periods. The Chl-a concentration increased slightly in the offshore areas during the typhoon period, e.g., ~1.0 mg m−3 for typhoon Mujigae (2011). The Chl-a concentrations increased about 1.5 mg m−3 in the shelf area. In the basin area, the Chl-a concentrations showed only slight fluctuation. Ten days after the typhoon passage, the Chl-a concentrations increased significantly.
Interestingly, the mean Chl-a values only increased 23% in the offshore areas after the typhoon passage. However, that of TSS concurrently increased by 280% (13.6 mg L−1). In contrast, the Chl-a concentration increased by 200% (1.3 mg m−3) at the depth of 60 m, while TSS concentration increased by 450%. Thus, there is no Chl-a bloom even with enhanced TSS, which is different from the feature in the shelf region and many previous literatures.

3.3. TSS and Chl-a Concentrations in A2 during the Typhoon Period

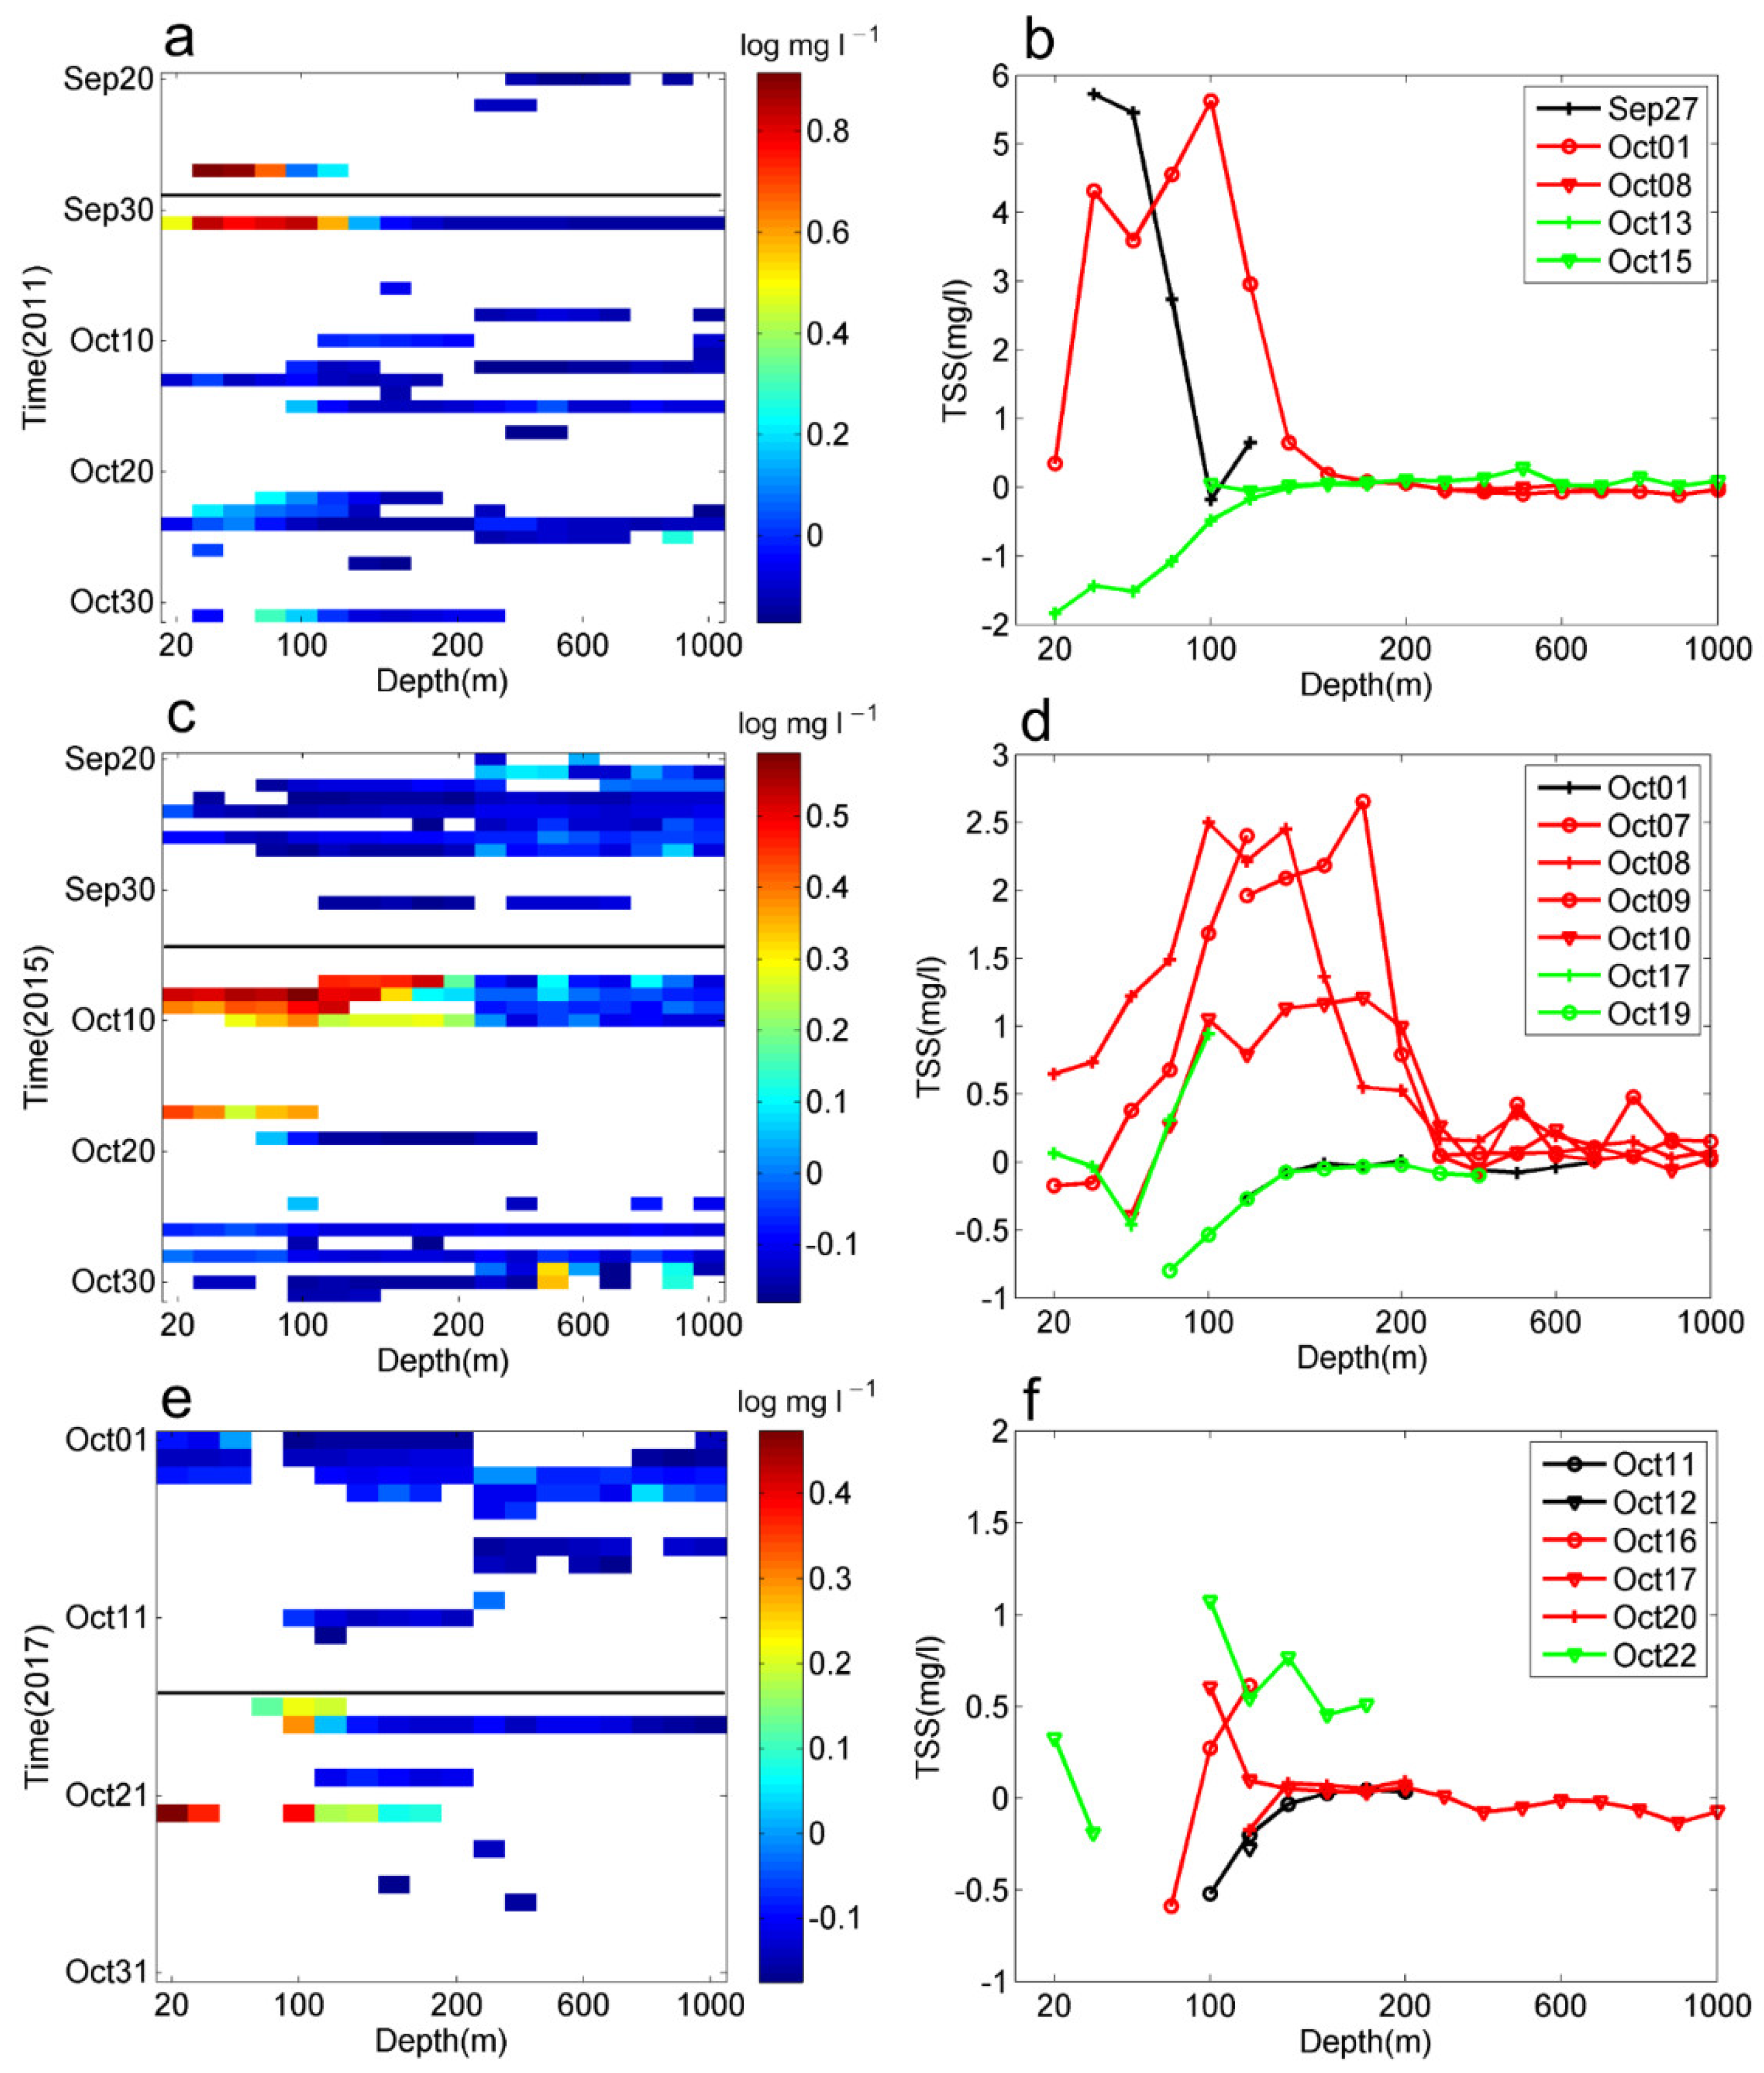
Figure 6 shows how the time series of TSS concentration responded to typhoons Nesat (2011), Mujigae (2015), and Khanun (2017) in sub-region A2. There was a remarkable response of TSS concentration to typhoons at the depth of 100 m. After Mujigae (2015) passed, high TSS concentrations were observed at 200 m depth (Figure 6c,d). Moreover, the maximum increase of the TSS concentration was shown in the shelf area (i.e., ~100 m); it increased by 5.7, 3.7, and 0.6 mg L−1 for Nesat (2011), Mujigae (2015), and Khanun (2017), respectively. The TSS concentration only increased by about 0.3 mg L−1 in the offshore areas. Ten days after the typhoon passage, the TSS concentration decreased to a background level.
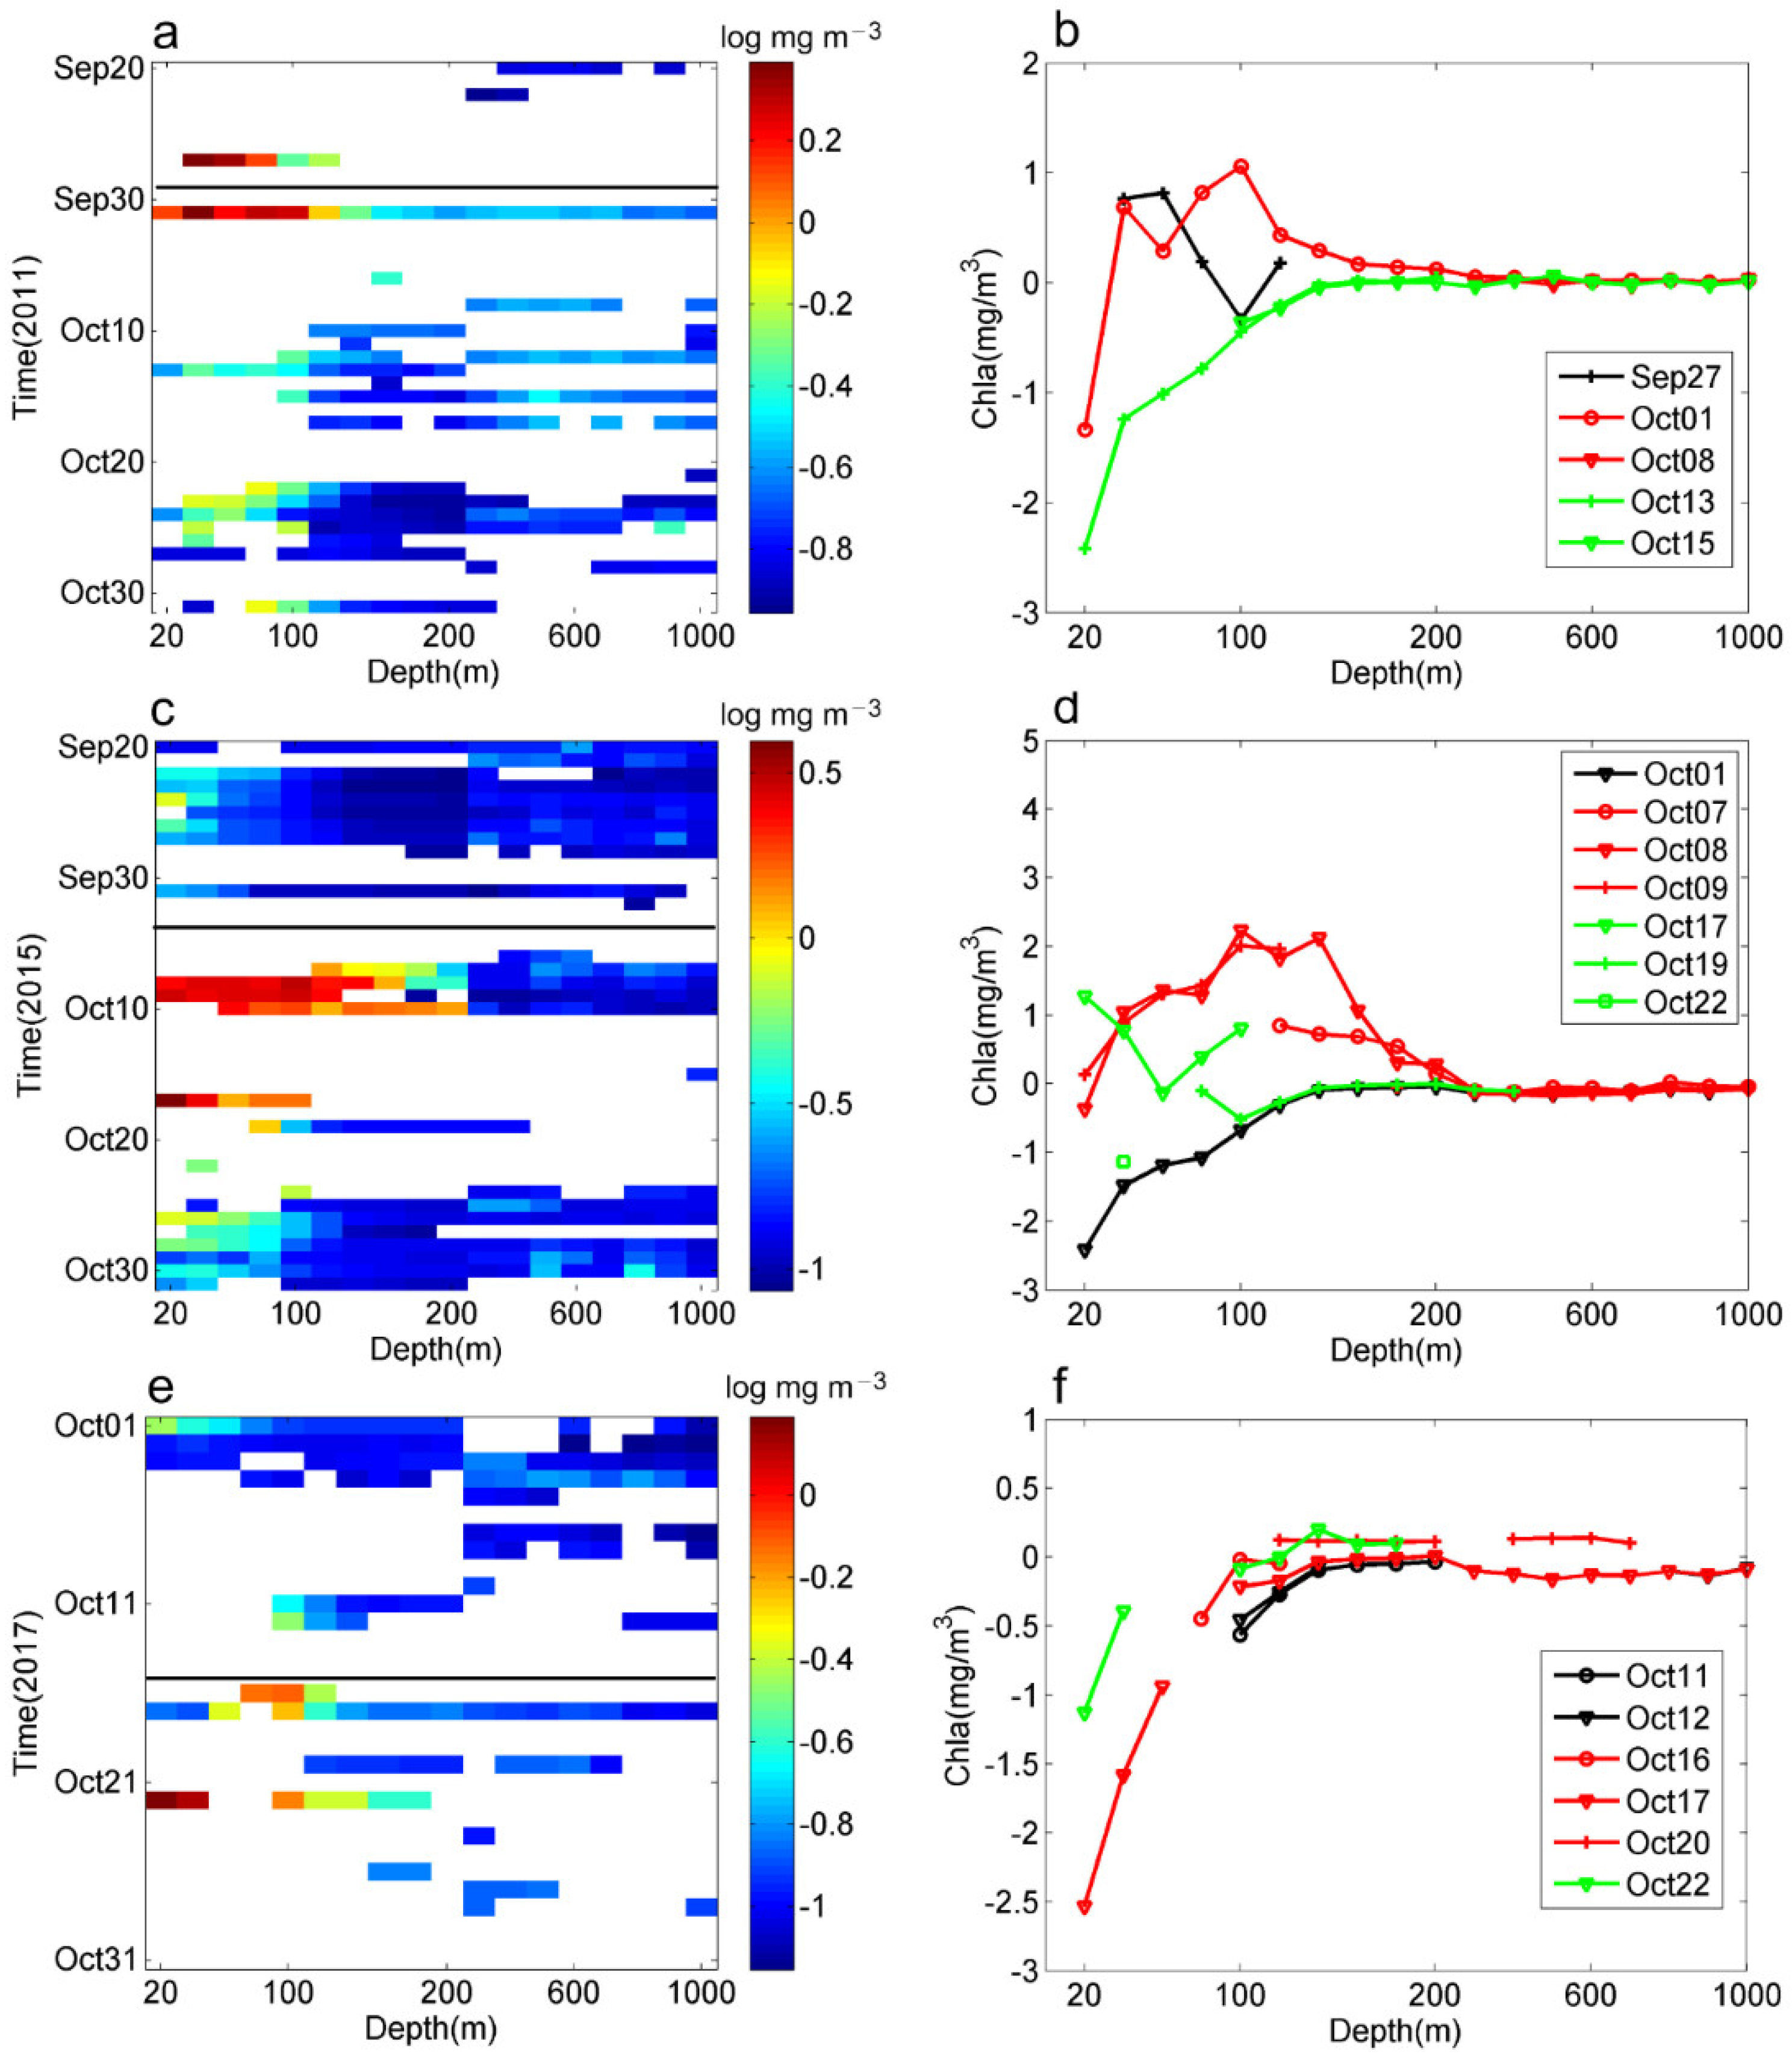
Figure 7 shows the time series of the Chl-a concentration during the three typhoon periods. The maximum increase of Chl-a concentration occurs concurrently with that of TSS in the shelf area. The concurrent phenomenon indicates that the high level concentration of Chl-a is the result of the high level concentration of TSS. The Chl-a concentrations increase by about 1.0, 3.0, and 0.5 mg m−3, respectively. In the basin area, however, the Chl-a concentrations show only slight fluctuations.
In October, the background TSS and Chl-a concentrations (Figure 2b and Figure 3b) were high in the shelf area, e.g., ~2.0 mg L−1 and 1.0 mg m−3, respectively. In all three typhoon cases, typhoons enhanced Chl-a concentrations in the offshore and shelf areas by 160% and 150%, respectively.

4. Empirical Analysis of Temporal Variations

We divide the study area into two sub-areas: the continental shelf and the basin area and calculate the mean TSS and Chl-a concentration of shelf area with a depth less than 100 m in A1, and with a depth less than 200 m in A2. Here we use a Rayleigh function to fit the time series of TSS and Chl-a concentration:
y = A ( t + T ) σ 2 exp ( ( t + T ) 2 2 σ 2 ) + Δ
where A is the coefficient of the TSS and Chl-a concentration; t is the time (d); T is the time lag (left-ward shift with a positive value); σ2 is the variance of TSS and Chl-a concentration. Δ is a background concentration of TSS and Chl-a.
Figure 8 shows the TSS concentrations 10 days before and after typhoons Nesat (2011), Mujigae (2015), and Khanun (2017). The TSS concentration in the shelf area of A1 was about 2–7 mg L−1 before typhoon landfall (Figure 8a). After typhoon landfall, the maximum of TSS concentration was as high as 22 mg L−1, then decreased to 3 mg L−1 within 10 days. Figure 8b shows that in the basin area of A1, the mean TSS concentration increased from 0.7 to 0.8 mg L−1 during typhoon passage.
In the shelf area of A2, the mean TSS concentration remained lower than 1 mg L−1 before typhoon landfall (Figure 8c), peaked to 5 mg L−1 and then reduced to 1 mg L−1 after typhoon passing. In the basin area, the mean TSS concentration (~0.7 mg L−1) only showed slight fluctuations (Figure 8d).
The empirical function explains the TSS variation process during typhoon events very well, especially for the shelf of A1. The coefficient of TSS concentration in A1 is as high as 90 mg L−1 with R2 value of 0.69 (Table 3), which means that TSS concentration could reach about 25 mg L−1 during typhoon events. In the basin, the coefficient of TSS concentration decreases to 10 mg L−1.
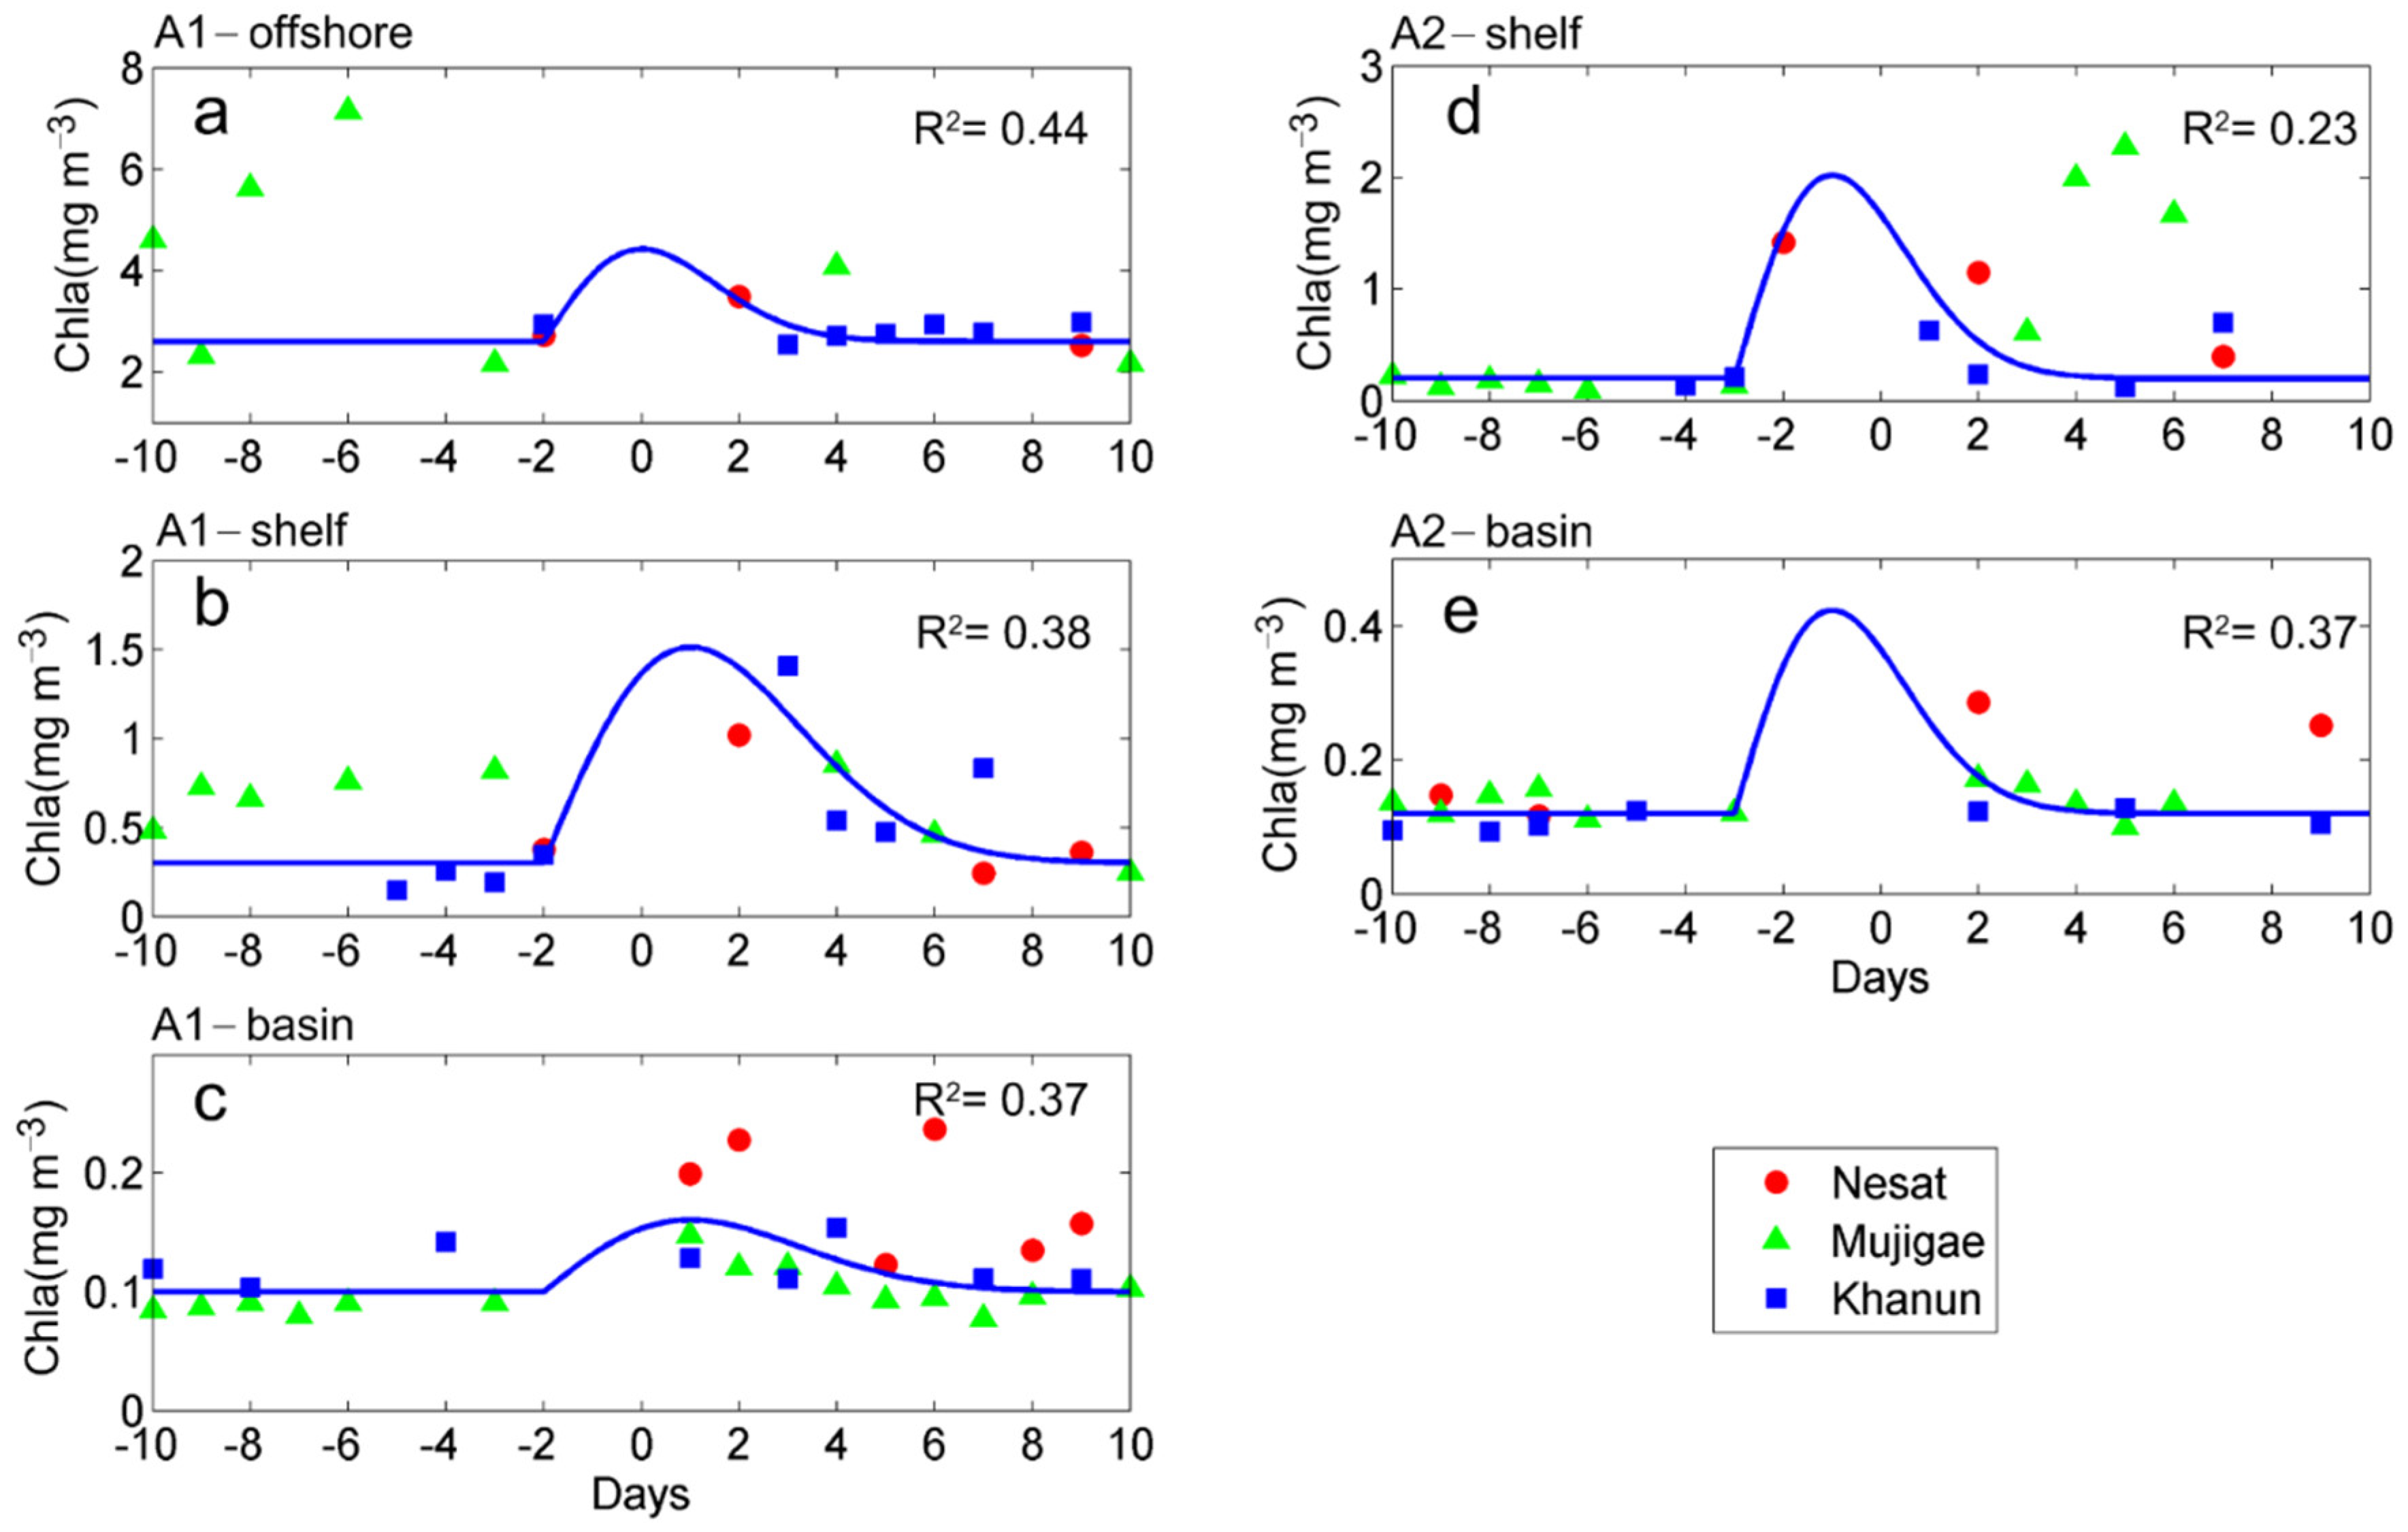
Fore Chl-a, we divided A1 into three sub-areas: the offshore (<40 m), shelf (<100 m), and the basin area. One can see that the time series Chl-a concentrations in the offshore area (Figure 9a) changed slightly. The Chl-a concentrations after typhoon landfall were even lower than those six days before typhoon passage in the case of typhoon Mujigae (2015). Moreover, in the case of typhoon Khanun (2017), Chl-a concentrations decreased from 2.9 to 2.4 mg m−3 during typhoon passage. Figure 9b shows that the Chl-a concentrations increased from ~0.5 to ~1.0 mg m−3 in the shelf area. In the basin area (Figure 9c), the Chl-a concentrations increased from ~0.1 to ~0.15 mg m−3.
Time series Chl-a concentrations in the offshore and shelf area of A2 are shown in Figure 9d. The Chl-a concentrations increased significantly after typhoon passage, from 0.2 to about 1.0 mg m−3. However, the Chl-a concentrations increased slightly in the basin area (Figure 9e).
Rayleigh function fits revealed the Chl-a variation process during typhoon events. The coefficient of the Chl-a concentration is as high as 6 mg m−3 with R2 value of 0.44 (Table 3). The R2 value is not so high, and the main reason is the data missing during the passage of typhoon.

5. Discussion

5.1. Pearl River Water Transport

Previous studies have revealed that typhoons result in substantial increases of TSS and Chl-a concentrations [7,10,48]. An offshore bloom exhibited a Chl-a peak of 0.7 mg m−3 relative to a background of 0.1 mg m−3 before landfall of typhoon Damrey [49]. The maximum Chl-a concentration was enhanced to approximately 7.5 times the climatological value after the typhoon Nuri (2008) [50,51]. Li, et al. [19] found that the Chl-a concentration in the offshore area increased three times in five days after landfall of typhoon Mangkhut (2018). The maximum Chl-a concentration in the offshore area resulted from the suspended particulate matter from runoff or mixing [52,53,54]. Hu, et al. [55] found that the photochemical reactions would transfer sedimentary organic matter into dissolved organic matter and affect ultimate fate in aquatic ecosystems. The resuspended sediments on the continental shelf would release inorganic nutrients under the effect of sunlight within a few hours [56,57,58].
However, in the current study, the TSS concentration in the offshore area of A1 (Figure 4) was very high due to the strong wind during autumn typhoon events, whereas the Chl-a concentration only increased by 23% (about 0.3 mg m−3) compared with the monthly mean Chl-a value (Figure 2). In the shelf area, the TSS concentration increased by four times, whereas the Chl-a concentration increased twice with respect to the climatological value. It remains unclear, therefore, why the increment of Chl-a concentration was so different between the offshore and shelf area during these late autumn typhoon events.
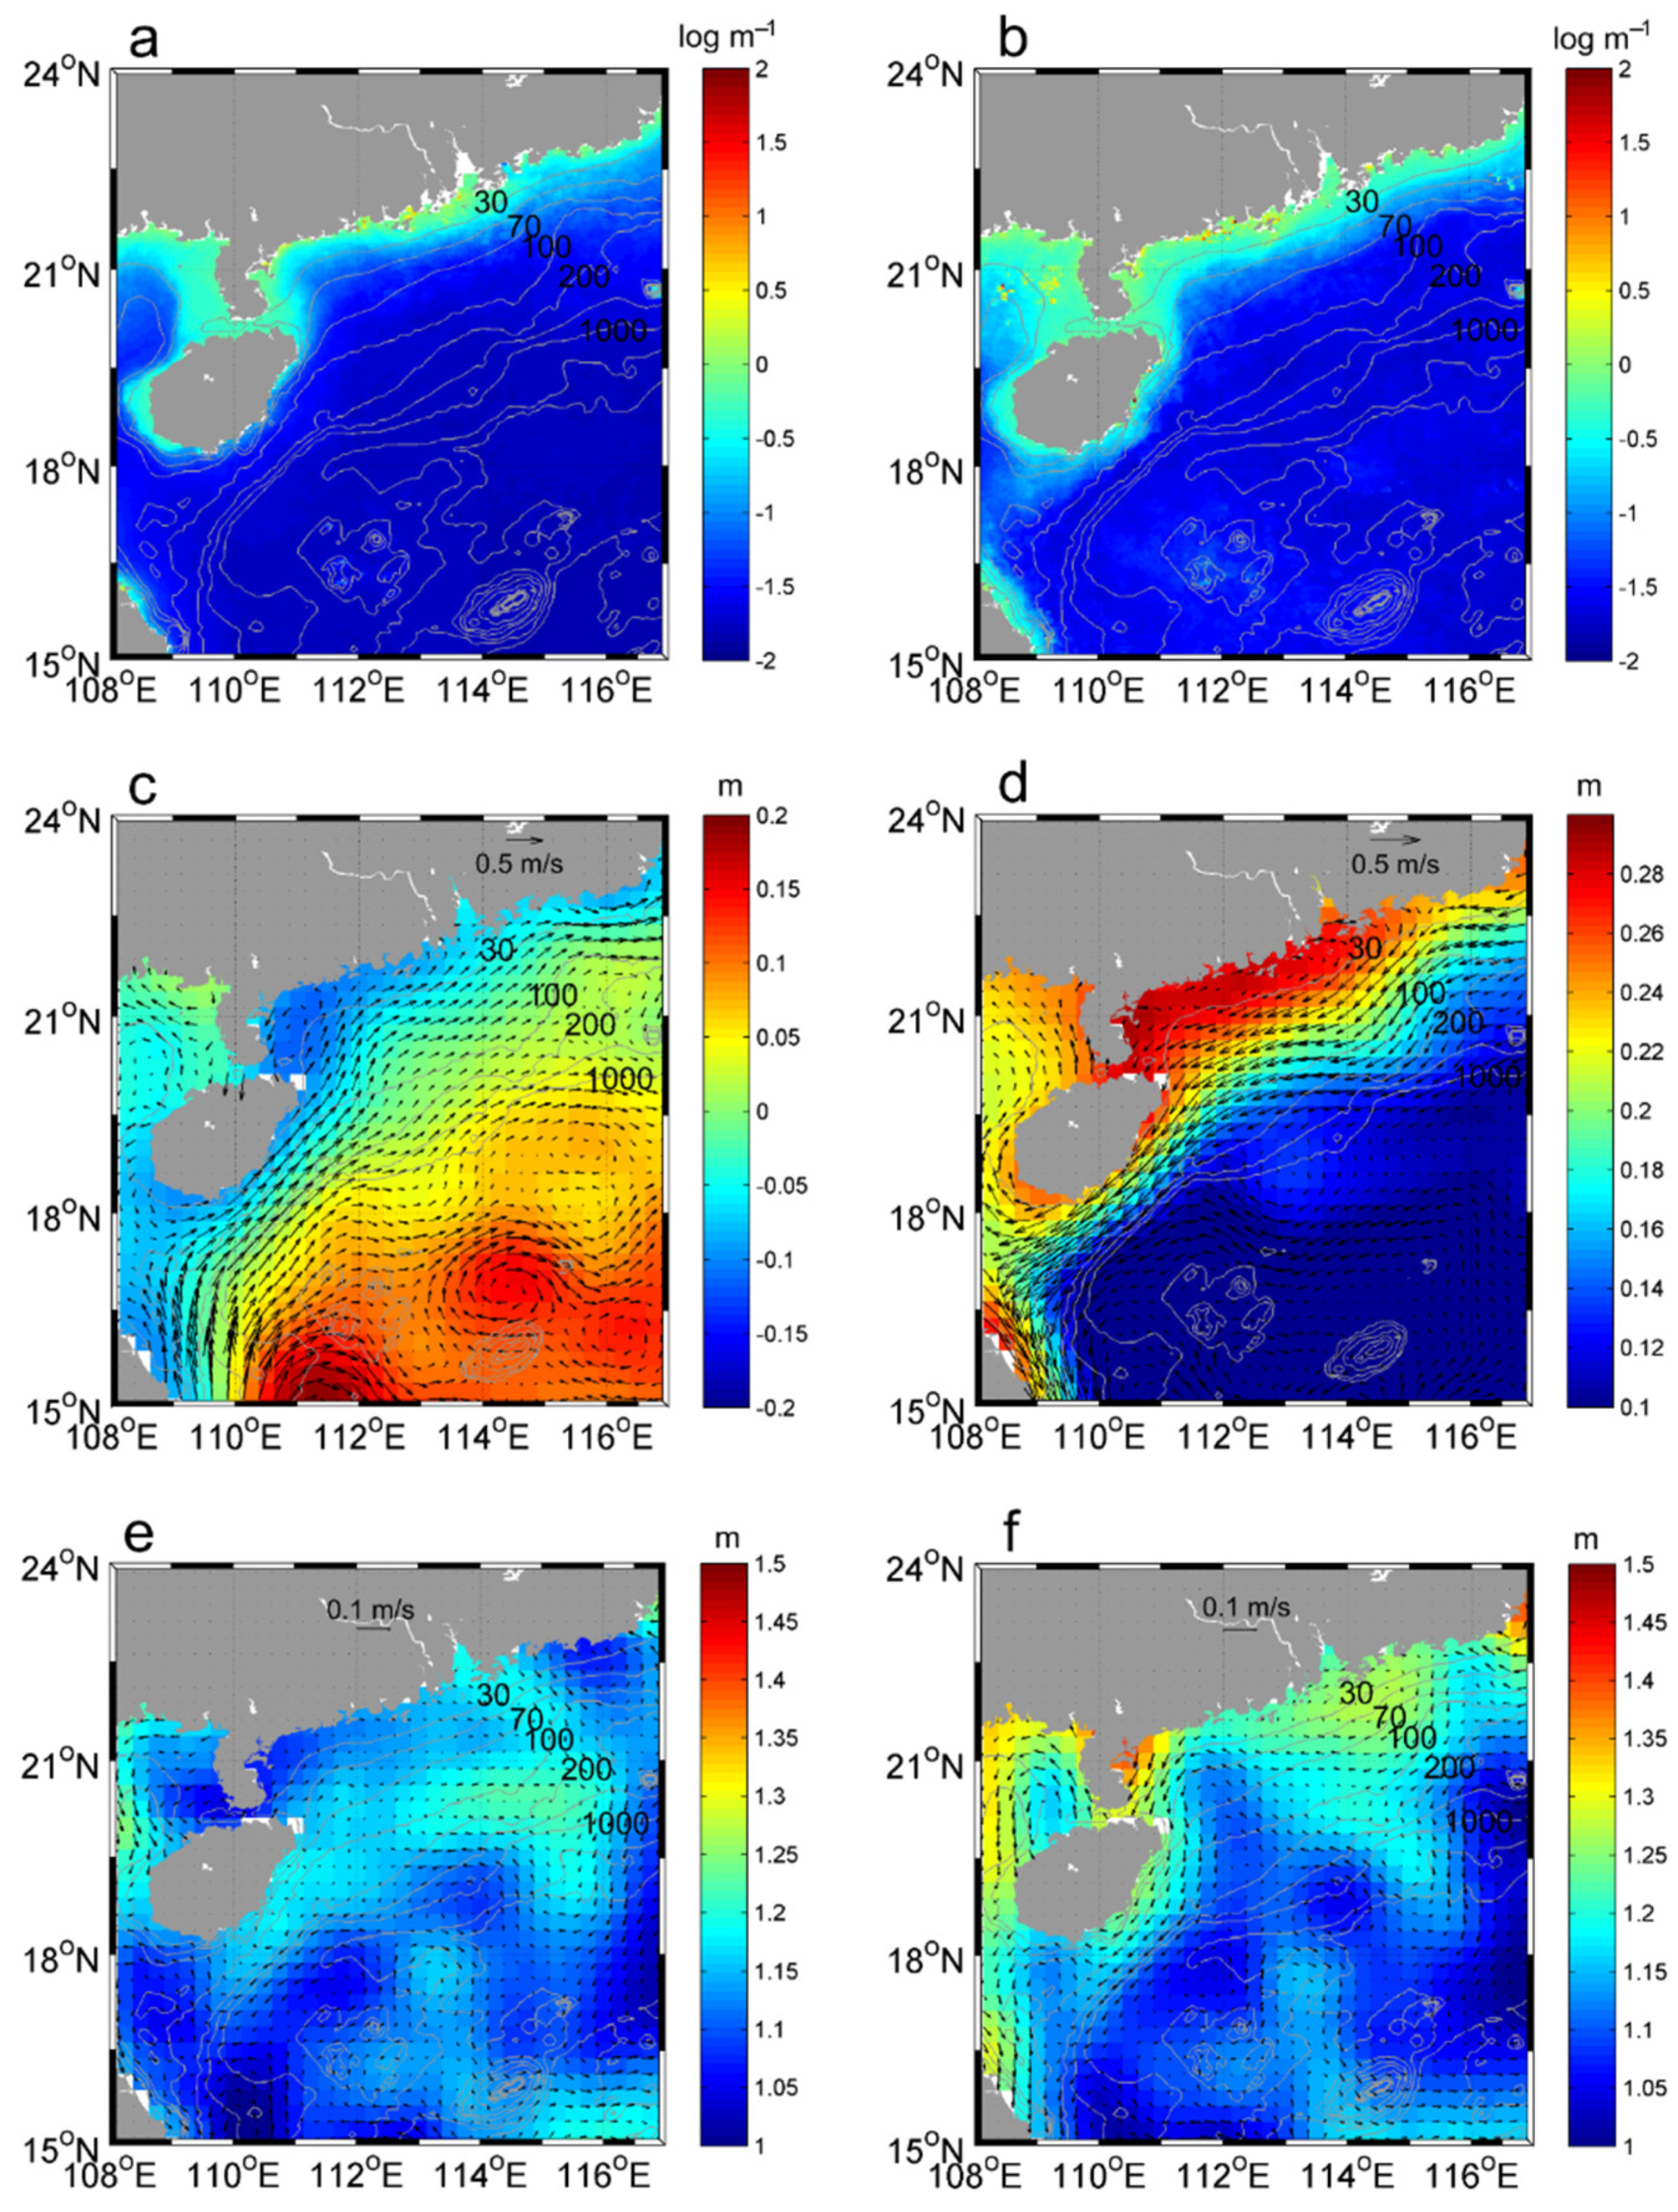
The CDOM, considered as the powerful indicators represents the degree riverine plumes to be affected by terrestrial inputs [43,59]. Figure 10a shows the climatological CDOM distribution of the study area in July. One can see that CDOM (aCDOM) is mainly distributed in the offshore area. Huang, et al. [60] observed high nutrient contents and TSS concentrations in the offshore area in summer and the terrestrial organic matter contributed 38% of TSS in the Pearl River Estuary. Lao, et al. [61] found that the nitrate content along the coast of A1 was strongly influenced by discharges from local urban areas and the westward flow of diluted Pearl River water. Therefore, it is reasonable to attribute summer CDOM to influences of local urban area discharges and Pearl River water.
Figure 10b shows that in October the CDOM is much higher than that in July and distributed over the shelf area. As above mentioned, the coastal current with the Pearl River water flows southwestward [62]. Combined with the climatological geostrophic current (Figure 10c,d), one can concludes that the Pearl River water transported by the alongshore current supplies the phytoplankton in the offshore area of A1, which results in a high Chl-a concentration in the winter half year (Figure 3a).
Figure 10e,f show the geostrophic current before and after typhoon Mujigae (2015), which reversed the geostrophic current direction, compared with the climatological geostrophic current in July (Figure 10c). The climatological geostrophic current in October (Figure 10d) flows southwestward at a velocity as high as 0.3 m s−1.
Lü, et al. [28] found no Chl-a bloom in the nearshore and shelf areas in mid-latitude regions during a typhoon event with the characteristics of coastal downwelling and insufficient sunshine. Here, we find that Chl-a increase during three late autumn typhoons (Nesat (2011), Mujigae (2015) and Khanun (2017)) landed in the NWSCS and aim to investigate the mechanisms. However, this study area sits in the low latitudes with the sufficient sunshine. The mixing effect (Section 5.2) is strong in the monsoon season in the offshore area, especially during typhoon periods, implying that the downwelling effect is weak. Thus, the case of no Chl-a bloom is seldom seen.
Furthermore, Huang, et al. [63] found that the offshore area of A1 was mainly impacted by the Pearl River water, and nutrition are sufficient to feed phytoplankton in winter. Thus, the balance of nutrition could explain why late autumn typhoons only had a slight effect on the Chl-a concentration in the offshore of A1.
The water on the offshore and shelf area originated from the same source [19], and the coefficient of Chl-a concentration for the offshore and shelf areas of A1 are similar, about 6 mg m−3. The Chl-a increments in the offshore area (1.4 mg m−3) and the shelf area (1.3 mg m−3) are almost the same.
In A2, unusually high TSS concentrations were observed in the offshore area for three cases with a weaker sea surface wind (~100 km away from the typhoon track). Zheng, et al. [64] found that the upper layer current turned southwestward after typhoon passage in the shelf area of A2. Figure 10e,f show the same result, i.e., the current transported the shelf water with high TSS from A1 into the offshore and shelf areas of A2, which induced the high TSS in A2. The transported TSS induced an increase of Chl-a concentration in the shelf area of A2 (Figure 10d).

5.2. Upwelling Effect and Mixing

Typhoon with strong winds would induce upwelling and mixing, which are important to nutrient transport. Figure 11 shows the Ekman pumping velocity on 2, 3, and 4 October 2015. The upwelling before typhoon passage was weak (about 1 × 10⁻⁶ m/s) in A1 and A2. On 4 October, when typhoon Mujigae (2015) reached A1, upwelling became stronger. The upwelling velocity for the whole layer was as high as 2 × 10⁻⁵ m s−1, representing an increase of twenty times. Because A2 is far away from the typhoon track, the upwelling effect changed little. Wang, et al. [65] pointed out that the pumping velocity in the upper layer was as high as 1 × 10⁻⁴ m s−1 during typhoon Washi (2005) using mooring observation data. The Ekman pumping velocity for the other two typhoons was almost the same. The ocean surface cooling reached ~5 °C after the typhoon events [16,17].
In addition to Ekman pumping, the mixing effect during the typhoon event is also important. The climatological wind speed in October is about 10 m s−1, whereas about 3 m s−1 in July. The mixing forced by the prevailing wind is another reason for the CDOM distribution in the shelf area (Figure 10a,b). A high nutrient concentration has been observed in the bottom water (~40 m) of the offshore area (in A1) [66]. The nutrients would be transported to the surface layer by the mixing effect together with the Ekman pumping. Moreover, wind-induced upper water mixing during the winter in the NWSCS may also provide subsurface nutrients as the ultimate marine end-member for offshore surface waters [67].

6. Conclusions

In this study, we investigate the response of TSS concentration and Chl-a blooms to late autumn typhoon events over the NWSCS. Three cases of typhoons Nesat (2011), Mujigae (2015) and Khanun (2017) in October are examined using satellite observations. The major findings and results are summarized as follows.
The high TSS and Chl-a concentrations are mainly concentrated in the offshore area throughout the year. They concurrently increase after September. The mean TSS and Chl-a concentrations in October are 1.4 mg L−1 and 3.1 mg m−3, respectively. In the upwelling area (A2), in contrast to high Chl-a, a considerably low TSS concentrations (<0.1 mg L−1) occur from April to August in the offshore area. High TSS concentrations (>1.5 mg L−1) accompanied by high Chl-a concentrations (>1 mg m−3) occur in March and October.
The mechanisms of Chl-a concentration increase, induced by late autumn typhoon events vary throughout the study area. The alongshore currents play different roles in Chl-a blooming on the track and adjacent area, which would reduce the Chl-a blooming in the NWSCS during late autumn typhoon events. Chl-a concentrations on the typhoon tracks increase 1.4 mg m−3 (23%), with TSS concurrently increasing by 13.6 mg L−1 (280%) in the offshore area. The Chl-a bloom is restrained by the alongshore current from the Pearl River Estuary with the sufficient nutrition. However, in the upwelling area, the Chl-a bloom in the shelf area is mainly associated with TSS transported from the typhoon track. The empirical analysis is applied to the time series TSS and Chl-a concentration data. The results show that the Rayleigh function describe the TSS and Chl-a variation process during typhoon events well. With three late autumn typhoons cases, this study contributes toward further evaluation of typhoon-induced biological responses.

Author Contributions

All authors have made significant contributions to this research. J.L., Z.L. and H.Z. analyzed the data; L.X. and M.L. provided important insights and suggestions on this research; J.L. and Q.Z. prepared the manuscript. All authors have read and agreed to the published version of the manuscript.

Funding

Supported by the National Natural Science Foundation of China (41706025, 41776034, 41476009), the Matched Grant of Guangdong Ocean University (P17263), the Innovation Team Project of Guangdong Ocean University (CXTD2019001, 570119020), College Students’ innovation and Entrepreneurship Project (CXXL2019151), the Guangdong Provincial College Innovation Team Project (2019KCXTF021), the First-class Discipline Plan of Guangdong Province (231419012, 231919030), and the Open Fund of the Key Laboratory of Ocean Circulation and Waves, Chinese Academy of Sciences, the Program for Scientific Research Start-up Funds of Guangdong Ocean University.

Institutional Review Board Statement

Not applicable.

Informed Consent Statement

Not applicable.

Data Availability Statement

Publicly available datasets were analyzed in this study. This data can be found here: Typhoon track is downloaded from http://tcdata.typhoon.org.cn (accessed on 17 July 2021). Satellite Ocean Color Data are downloaded from http://oceandata.sci.gsfc.nasa.gov/ (accessed on 17 July 2021). Sea surface wind data and SLA data are downloaded from http://marine.copernicus.eu/ (accessed on 17 July 2021).

Acknowledgments

The authors are grateful to the anonymous reviewers for their valuable suggestions and comments.

Conflicts of Interest

The researchers claim no conflict of interests.

References

  1. Hu, J.; Kawmura, H. Detection of cyclonic eddy generated by looping tropical cyclone in the northern South China Sea: A case study. Acta Oceanol. Sin. 2004, 232, 213–224. [Google Scholar]
  2. Zheng, Q.; Xie, L.; Xiong, X.; Hu, X.; Chen, L. Progress in research of submesoscale processes in the South China Sea. Acta Oceanol. Sin. 2020, 39, 1–13. [Google Scholar] [CrossRef]
  3. Guan, S.; Wei, Z.; Huthnance, J.; Tian, J.; Wang, J. Observed upper ocean response to typhoon Megi (2010) in the Northern South China Sea. J. Geophys. Res. Oceans 2014, 119, 3134–3157. [Google Scholar] [CrossRef] [Green Version]
  4. Sun, Z.; Hu, J.; Zheng, Q.; Gan, J. Comparison of typhoon-induced near-inertial oscillations in shear flow in the northern South China Sea. Acta Oceanol. Sin. 2015, 45, 38–45. [Google Scholar] [CrossRef]
  5. Lu, Z.; Wang, G.; Shang, X. Strength and Spatial Structure of the Perturbation Induced by a Tropical Cyclone to the Underlying Eddies. J. Geophys. Res. Oceans 2020, 125, e2020JC016097. [Google Scholar] [CrossRef]
  6. Sun, J.; Wang, G.; Xiong, X.; Hui, Z.; Hu, X.; Ling, Z.; Long, Y.; Yang, G.; Guo, Y.; Ju, X.; et al. Impact of warm mesoscale eddy on tropical cyclone intensity. Acta Oceanol. Sin. 2020, 39, 1–13. [Google Scholar] [CrossRef]
  7. Shang, S.; Li, L.; Sun, F.; Wu, J.; Hu, C.; Chen, D.; Ning, X.; Qiu, Y.; Zhang, C.; Shang, S. Changes of temperature and bio-optical properties in the South China Sea in response to Typhoon Lingling, 2001. Geophys. Res. Lett. 2008, 35, L10602. [Google Scholar] [CrossRef] [Green Version]
  8. Zhao, H.; Pan, J.; Han, G.; Devlin, A.T.; Zhang, S.; Hou, Y. Effect of a fast-moving tropical storm Washi on phytoplankton in the northwestern South China Sea. J. Geophys. Res. Oceans 2017, 122, 3404–3416. [Google Scholar] [CrossRef]
  9. Zhang, S.; Xie, L.; Hou, Y.; Zhao, H.; Qi, Y.; Yi, X. Tropical storm-induced turbulent mixing and chlorophyll-a enhancement in the continental shelf southeast of Hainan Island. J. Mar. Syst. 2014, 129, 405–414. [Google Scholar] [CrossRef] [Green Version]
  10. Liu, Y.; Tang, D.; Morozov, E. Chlorophyll Concentration Response to the Typhoon Wind-Pump Induced Upper Ocean Processes Considering Air–Sea Heat Exchange. Remote Sens. 2019, 11, 1825. [Google Scholar] [CrossRef] [Green Version]
  11. Yasuki, N.; Suzki, K.; Tsuda, A. Responses of lower trophic-level organisms to typhoon passage on the outer shelf of the East China Sea: An incubation experiment. Biogeosic. Discuss. 2013, 10, 6605–6635. [Google Scholar]
  12. Li, J.; Zheng, Q.; Li, M.; Li, Q.; Xie, L. Spatiotemporal Distributions of Ocean Color Elements in Response to Tropical Cyclone: A Case Study of Typhoon Mangkhut (2018) Past over the Northern South China Sea. Remote Sens. 2021, 13, 687. [Google Scholar] [CrossRef]
  13. Wang, Y. Composite of Typhoon-Induced Sea Surface Temperature and Chlorophyll-a Responses in the South China Sea. J. Geophys. Res. Oceans 2020, 125, e2020JC016243. [Google Scholar] [CrossRef]
  14. Wang, G.; Su, J.; Ding, Y.; Chen, D. Tropical cyclone genesis over the south China sea. J. Mar. Syst. 2007, 68, 318–326. [Google Scholar] [CrossRef]
  15. Huynh, H.; Alvera-Azcarate, A.; Beckers, J.M. Analysis of surface chlorophyll a associated with sea surface temperature and surface wind in the South China Sea. Ocean Dyn. 2020, 70, 139–161. [Google Scholar] [CrossRef]
  16. Wang, T.; Zhang, S.; Chen, F.; Ma, Y.; Jiang, C.; Yu, J. Influence of sequential tropical cyclones on phytoplankton blooms in the northwestern South China Sea. Chin. J. Oceanol. Limnol. 2020. [Google Scholar] [CrossRef]
  17. Shi, Y.; Xie, l.; Wang, L.; Zheng, M.; Shen, Y. Impacts of Typhoon Mujigea on Sea Surface Temperature and Chlorophyll-a Concentration in the Coastal Ocean of Western Guangdong. J. Guangdong Ocean Univ. 2017, 37, 49–58. (In Chinese) [Google Scholar]
  18. Shi, Y.; Xie, L.; Zheng, Q.; Zhang, S.; Li, J. Unusual coastal ocean cooling in the northern South China Sea by a katabatic cold jet associated with Typhoon Mujigea. Acta Oceanol. Sin. 2019, 38, 62–75. [Google Scholar] [CrossRef]
  19. Ding, Y.; Yao, Z.; Zhou, L.; Bao, M.; Zang, Z. Numerical modeling of the seasonal circulation in the coastal ocean of the Northern South China Sea. Front. Earth Sci. 2018, 14, 90–109. [Google Scholar] [CrossRef]
  20. Xie, L.L.; Cao, R.X.; Shang, Q.T. Progress of Study on Coastal Circulation near the Shore of Western Guangdong. J. Guangdong Ocean Univ. 2012, 32, 94–98. (In Chinese) [Google Scholar]
  21. Ding, Y.; Bao, X.; Yao, Z.; Zhang, C.; Wan, K.; Bao, M.; Li, R.; Shi, M. A modeling study of the characteristics and mechanism of the westward coastal current during summer in the northwestern South China Sea. Ocean Sci. J. 2017, 52, 11–30. [Google Scholar] [CrossRef]
  22. Li, R.; Chen, C.; Xia, H.; Beardsley, R.C.; Shi, M.; Lai, Z.; Lin, H.; Feng, Y.; Liu, C.; Xu, Q.; et al. Observed wintertime tidal and subtidal currents over the continental shelf in the northern South China Sea. J. Geophys. Res. Oceans 2014, 119, 5289–5310. [Google Scholar] [CrossRef]
  23. Zheng, M.; Li, M.; Xie, L.; Hong, Y.; He, Y.; Zong, X. Observation of hydrographic characteristics of northwestern shelf of the South China Sea in winter 2012. Oceanol. Et Limnol. Sin. 2018, 49, 734–745. (In Chinese) [Google Scholar] [CrossRef]
  24. Shan, G.; Hui, W.; Gui-Mei, L.; Liang-Min, H. The statistical estimation of the vertical distribution of chlorophyll a concentration in the South China Sea. Acta Oceanol. Sin. 2010, 5, 13–26. [Google Scholar]
  25. Liao, X.; Dai, M.; Gong, X.; Liu, H.; Huang, H. Subsurface chlorophyll a maximum and its possible causes in the southern South China Sea. J. Trop. Oceanogr. 2018, 37, 45–56. [Google Scholar] [CrossRef]
  26. Ravichandran, M.; Girishkumar, M.S.; Riser, S. Observed variability of chrolophyll-a using Argo profiling floats in the southeastern Arabian Sea. Deep Sea Res. Part I Oceanogr. Res. Pap. 2012, 65, 15–25. [Google Scholar] [CrossRef]
  27. Xie, L.L.; Zhang, S.W. Overview of studies on Qiongdong upwelling. J. Trop. Oceanogr. 2012, 31, 35–41. (In Chinese) [Google Scholar]
  28. Lü, H.; Ma, X.; Wang, Y.; Xue, H.; Chai, F. Impacts of the unique landfall Typhoons Damrey on chlorophyll-a in the Yellow Sea off Jiangsu Province, China. Reg. Stud. Mar. Sci. 2020, 39, 101394. [Google Scholar] [CrossRef]
  29. Zheng, Q.; And, G.F.; Song, Y.T. Introduction to special section: Dynamics and Circulation of the Yellow, East, and South China Seas. J. Geophys. Res. Oceans 2006, 111, C11. [Google Scholar] [CrossRef] [Green Version]
  30. Hu, J.; Kawamura, H.; Li, C.; Hong, H.; Jiang, Y. Review on Current and Seawater Volume Transport through the Taiwan Strait. J. Oceanogr. 2010, 66, 591–610. [Google Scholar] [CrossRef] [Green Version]
  31. Hu, J.; Wang, X.H. Progress on upwelling studies in the China seas. Rev. Geophys. 2016, 54, 653–673. [Google Scholar] [CrossRef]
  32. Shi, W.; Huang, Z.; Hu, J. Using TPI to Map Spatial and Temporal Variations of Significant Coastal Upwelling in the Northern South China Sea. Remote Sens. 2021, 13, 1065. [Google Scholar] [CrossRef]
  33. Xie, L.; Pallas-Sanz, E.; Zheng, Q.; Zhang, S.; Zong, X.; Yi, X.; Li, M. Diagnosis of 3-D vertical circulation in the upwelling and frontal zones east of Hainan Island, China. J. Phys. Oceanogr. 2017, 47, 755–774. [Google Scholar] [CrossRef]
  34. Lu, X.; Yu, H.; Ying, M.; Zhao, B.; Zhang, S.; Lin, L.; Bai, L.; Wan, R. Western North Pacific Tropical Cyclone Database Created by the China Meteorological Administration. Adv. Atmos. Sci. 2021, 38, 690–699. [Google Scholar] [CrossRef]
  35. Ying, M.; Zhang, W.; Yu, H.; Lu, X.; Feng, J.; Fan, Y.; Zhu, Y.; Chen, D. An Overview of the China Meteorological Administration Tropical Cyclone Database. J. Atmos. Ocean. Technol. 2014, 31, 287–301. [Google Scholar] [CrossRef] [Green Version]
  36. Kahru, M.; Kudela, R.M.; Lorenzo, E.; Manzano-Saraba, M.; Mitchell, B.G. Trends in the surface chlorophyll of the California Current: Merging data from multiple ocean color satellites. Deep Sea Res. Part II Top. Stud. Oceanogr. 2012, 77–80, 89–98. [Google Scholar] [CrossRef]
  37. Teodoro, A.C.; Veloso-Gomes, F. Quantification of the Total Suspended Matter concentration around the sea breaking zone from in situ measurements and TERRA/ASTER data. Mar. Georesour. Geotechnol. 2007, 25, 67–80. [Google Scholar] [CrossRef]
  38. Teodoro, A.C.; Veloso-Gomes, F.; Goncalves, H. Retrieving TSM Concentration from Multispectral Satellite Data by Multiple Regression and Artificial Neural Networks. IEEE Trans. Geosci. Remote Sens. 2007, 45, 1342–1350. [Google Scholar] [CrossRef]
  39. Miller, R.; McKee, B. Using MODIS Terra 250 m imagery to map concentrations of total suspended matter in coastal waters. Remote Sens. Environ. 2004, 93, 259–266. [Google Scholar] [CrossRef]
  40. Tassan, S. An Improved In-Water Algorithm for the Determination of Chlorophyll and Suspended Sediment Concentration from Thematic Mapper Data in Coastal Waters. Int. J. Remote Sens. 1993, 14, 1221–1229. [Google Scholar] [CrossRef]
  41. Zhang, M.; Tang, J.; Dong, Q.; Song, Q.; Ding, J. Retrieval of total suspended matter concentration in the Yellow and East China Seas from MODIS imagery. Remote Sens. Environ. 2010, 114, 392–403. [Google Scholar] [CrossRef]
  42. Asaoka, S.; Nakada, S.; Umehara, A.; Ishizaka, J.; Nishijima, W. Estimation of spatial distribution of coastal ocean primary production in Hiroshima Bay, Japan, with a geostationary ocean color satellite. Estuar. Coast. Shelf Sci. 2020, 244, 106897. [Google Scholar] [CrossRef]
  43. Nakada, S.; Kobayashi, S.; Hayashi, M.; Ishizaka, J.; Akiyama, S.; Fuchi, M.; Nakajima, M. High-resolution surface salinity maps in coastal oceans based on geostationary ocean color images: Quantitative analysis of river plume dynamics. J. Oceanogr. 2018, 74, 287–304. [Google Scholar] [CrossRef]
  44. Enriquez, A.; Friehe, C. Effects of Wind Stress and Wind Stress Curl Variability on Coastal Upwelling. J. Phys. Oceanogr. 1995, 25, 1651–1671. [Google Scholar] [CrossRef] [Green Version]
  45. Chen, X.; Pan, D.; He, X.; Bai, Y.; Wang, D. Upper ocean responses to category 5 typhoon Megi in the western north Pacific. Acta Oceanol. Sin. 2012, 1, 51–58. [Google Scholar] [CrossRef]
  46. Hellerman, S.; Rosenstein, M. Normal Monthly Wind Stress over the World Ocean with Error Estimates. J. Phys. Oceanogr. 1983, 13, 1093–1104. [Google Scholar] [CrossRef] [Green Version]
  47. Garratt, J.R. Review of Drag Coefficients over Oceans and Continents. Mon. Weather Rev. 1977, 105, 915–929. [Google Scholar] [CrossRef] [Green Version]
  48. Pan, G.; Chai, F.; Tang, D.; Wang, D. Marine phytoplankton biomass responses to typhoon events in the South China Sea based on physical-biogeochemical model. Ecol. Model. 2017, 356, 38–47. [Google Scholar] [CrossRef]
  49. Zheng, G.; Tang, D. Offshore and nearshore chlorophyll increases induced by typhoon winds and subsequent terrestrial rainwater runoff. Mar. Ecol. Prog. Ser. 2007, 333, 61–74. [Google Scholar] [CrossRef] [Green Version]
  50. Ye, H.J.; Sui, Y.; Tang, D.L.; Afanasyev, Y.D. A subsurface chlorophyll a bloom induced by typhoon in the South China Sea. J. Mar. Syst. 2013, 128, 138–145. [Google Scholar] [CrossRef]
  51. Zhao, H.; Tang, D.; Wang, D. Phytoplankton blooms near the Pearl River Estuary induced by Typhoon Nuri. J. Geophys. Res. 2009, 114, C12027. [Google Scholar] [CrossRef]
  52. Wang, Z.; Li, W.; Zhang, K.; Agrawal, Y.C.; Huang, H. Observations of the distribution and flocculation of suspended particulate matter in the North Yellow Sea cold water mass. Cont. Shelf Res. 2020, 204, 104187. [Google Scholar] [CrossRef]
  53. Chen, Y.Q.; Tang, D.L. Remote Sensing Analysis of Impact of Typhoon on Environment in the Sea Area South of Hainan Island. Procedia Environ. Sci. 2011, 10, 1621–1629. [Google Scholar]
  54. Yu, X.; Xu, J.; Long, A.; Li, R.; Shi, Z.; Li, Q.P. Carbon-to-chlorophyll ratio and carbon content of phytoplankton community at the surface in coastal waters adjacent to the Zhujiang River Estuary during summer. Acta Oceanol. Sin. 2020, 39, 123–131. [Google Scholar] [CrossRef]
  55. Hu, B.; Wang, P.; Bao, T.; Qian, J.; Wang, X. Mechanisms of photochemical release of dissolved organic matter and iron from resuspended sediments. J. Environ. Sci. 2021, 104, 288–295. [Google Scholar] [CrossRef] [PubMed]
  56. Southwell, M.W.; Kieber, R.J.; Mead, R.N.; Avery, G.B.; Skrabal, S.A. Effects of sunlight on the production of dissolved organic and inorganic nutrients from resuspended sediments. Biogeochemistry 2010, 98, 115–126. [Google Scholar] [CrossRef]
  57. Shank, G.C.; Evans, A.; Jaffé, R.; Yamashita, Y. Influence of solar radiation on DOM release from resuspended Florida Bay sediments. In Proceedings of the AGU Fall Meeting Abstracts, San Francisco, CA, USA, 14–18 December 2019. [Google Scholar]
  58. Schiebel, H.N.; Wang, X.; Chen, R.F.; Peri, F. Photochemical Release of Dissolved Organic Matter from Resuspended Salt Marsh Sediments. Estuaries Coasts 2015, 38, 1692–1705. [Google Scholar] [CrossRef]
  59. Bai, Y.; Su, R.; Han, X.; Zhang, C.; Shi, X. Investigation of seasonal variability of CDOM fluorescence in the southern Changjiang River Estuary by EEM-PARAFAC. Acta Oceanol. Sin. 2015, 34, 1–12. [Google Scholar] [CrossRef]
  60. Huang, C.; Chen, F.; Zhang, S.; Chen, C.; Meng, Y.; Zhu, Q.; Song, Z. Carbon and nitrogen isotopic composition of particulate organic matter in the Pearl River Estuary and the adjacent shelf. Estuar. Coast. Shelf Sci. 2020, 246, 107003. [Google Scholar] [CrossRef]
  61. Lao, Q.; Chen, F.; Liu, G.; Chen, C.; Jin, G.; Zhu, Q.; Wei, C.; Zhang, C. Isotopic evidence for the shift of nitrate sources and active biological transformation on the western coast of Guangdong Province, South China. Mar. Pollut. Bull. 2019, 142, 603–612. [Google Scholar] [CrossRef]
  62. Yang, Y.; Yan-Dong, X.U.; Wang, F.Y.; Wei, X. A Numerical Hydrodynamic and Transport Model in the West Coast of Guangdong Province. Sci. Technol. Eng. 2015, 19, 86–91. [Google Scholar]
  63. Huang, Y.; Chen, F.; Zhao, H.; Zeng, Z.; Chen, J. Concentration distribution and structural features of nutrients in the northwest of the South China Sea in winter 2012. J. Appl. Oceanogr. 2015, 34, 310–316. (In Chinese) [Google Scholar]
  64. Zheng, M.; Xie, L.; Zheng, Q.; Li, M.; Li, J. Volume and Nutrient Transports Disturbed by the Typhoon Chebi (2013) in the Upwelling Zone East of Hainan Island, China. J. Mar. Sci. Eng. 2021, 9, 324. [Google Scholar] [CrossRef]
  65. Wang, L.; Xie, L.; Zheng, Q.; Li, J.; Li, M.; Hou, Y. Tropical cyclone enhanced vertical transport in the northwestern South China Sea I: Mooring observation analysis for Washi (2005). Estuar. Coast. Shelf Sci. 2020, 235, 106599. [Google Scholar] [CrossRef]
  66. Jiang, C.; Cao, R.; Lao, Q.; Chen, F.; Zhang, S.; Bian, P. Typhoon Merbok induced upwelling impact on material transport in the coastal northern South China Sea. PLoS ONE 2020, 15, e0228220. [Google Scholar] [CrossRef]
  67. Wong, G.; Pan, X.; Li, K.-Y.; Shiah, F.-K.; Ho, T.-Y.; Guo, X. Hydrography and nutrient Dynamics in the Northern South China Sea Shelf-sea (NoSoCS). Deep Sea Res. Part II Top. Stud. Oceanogr. 2015, 117, 23–40. [Google Scholar] [CrossRef]
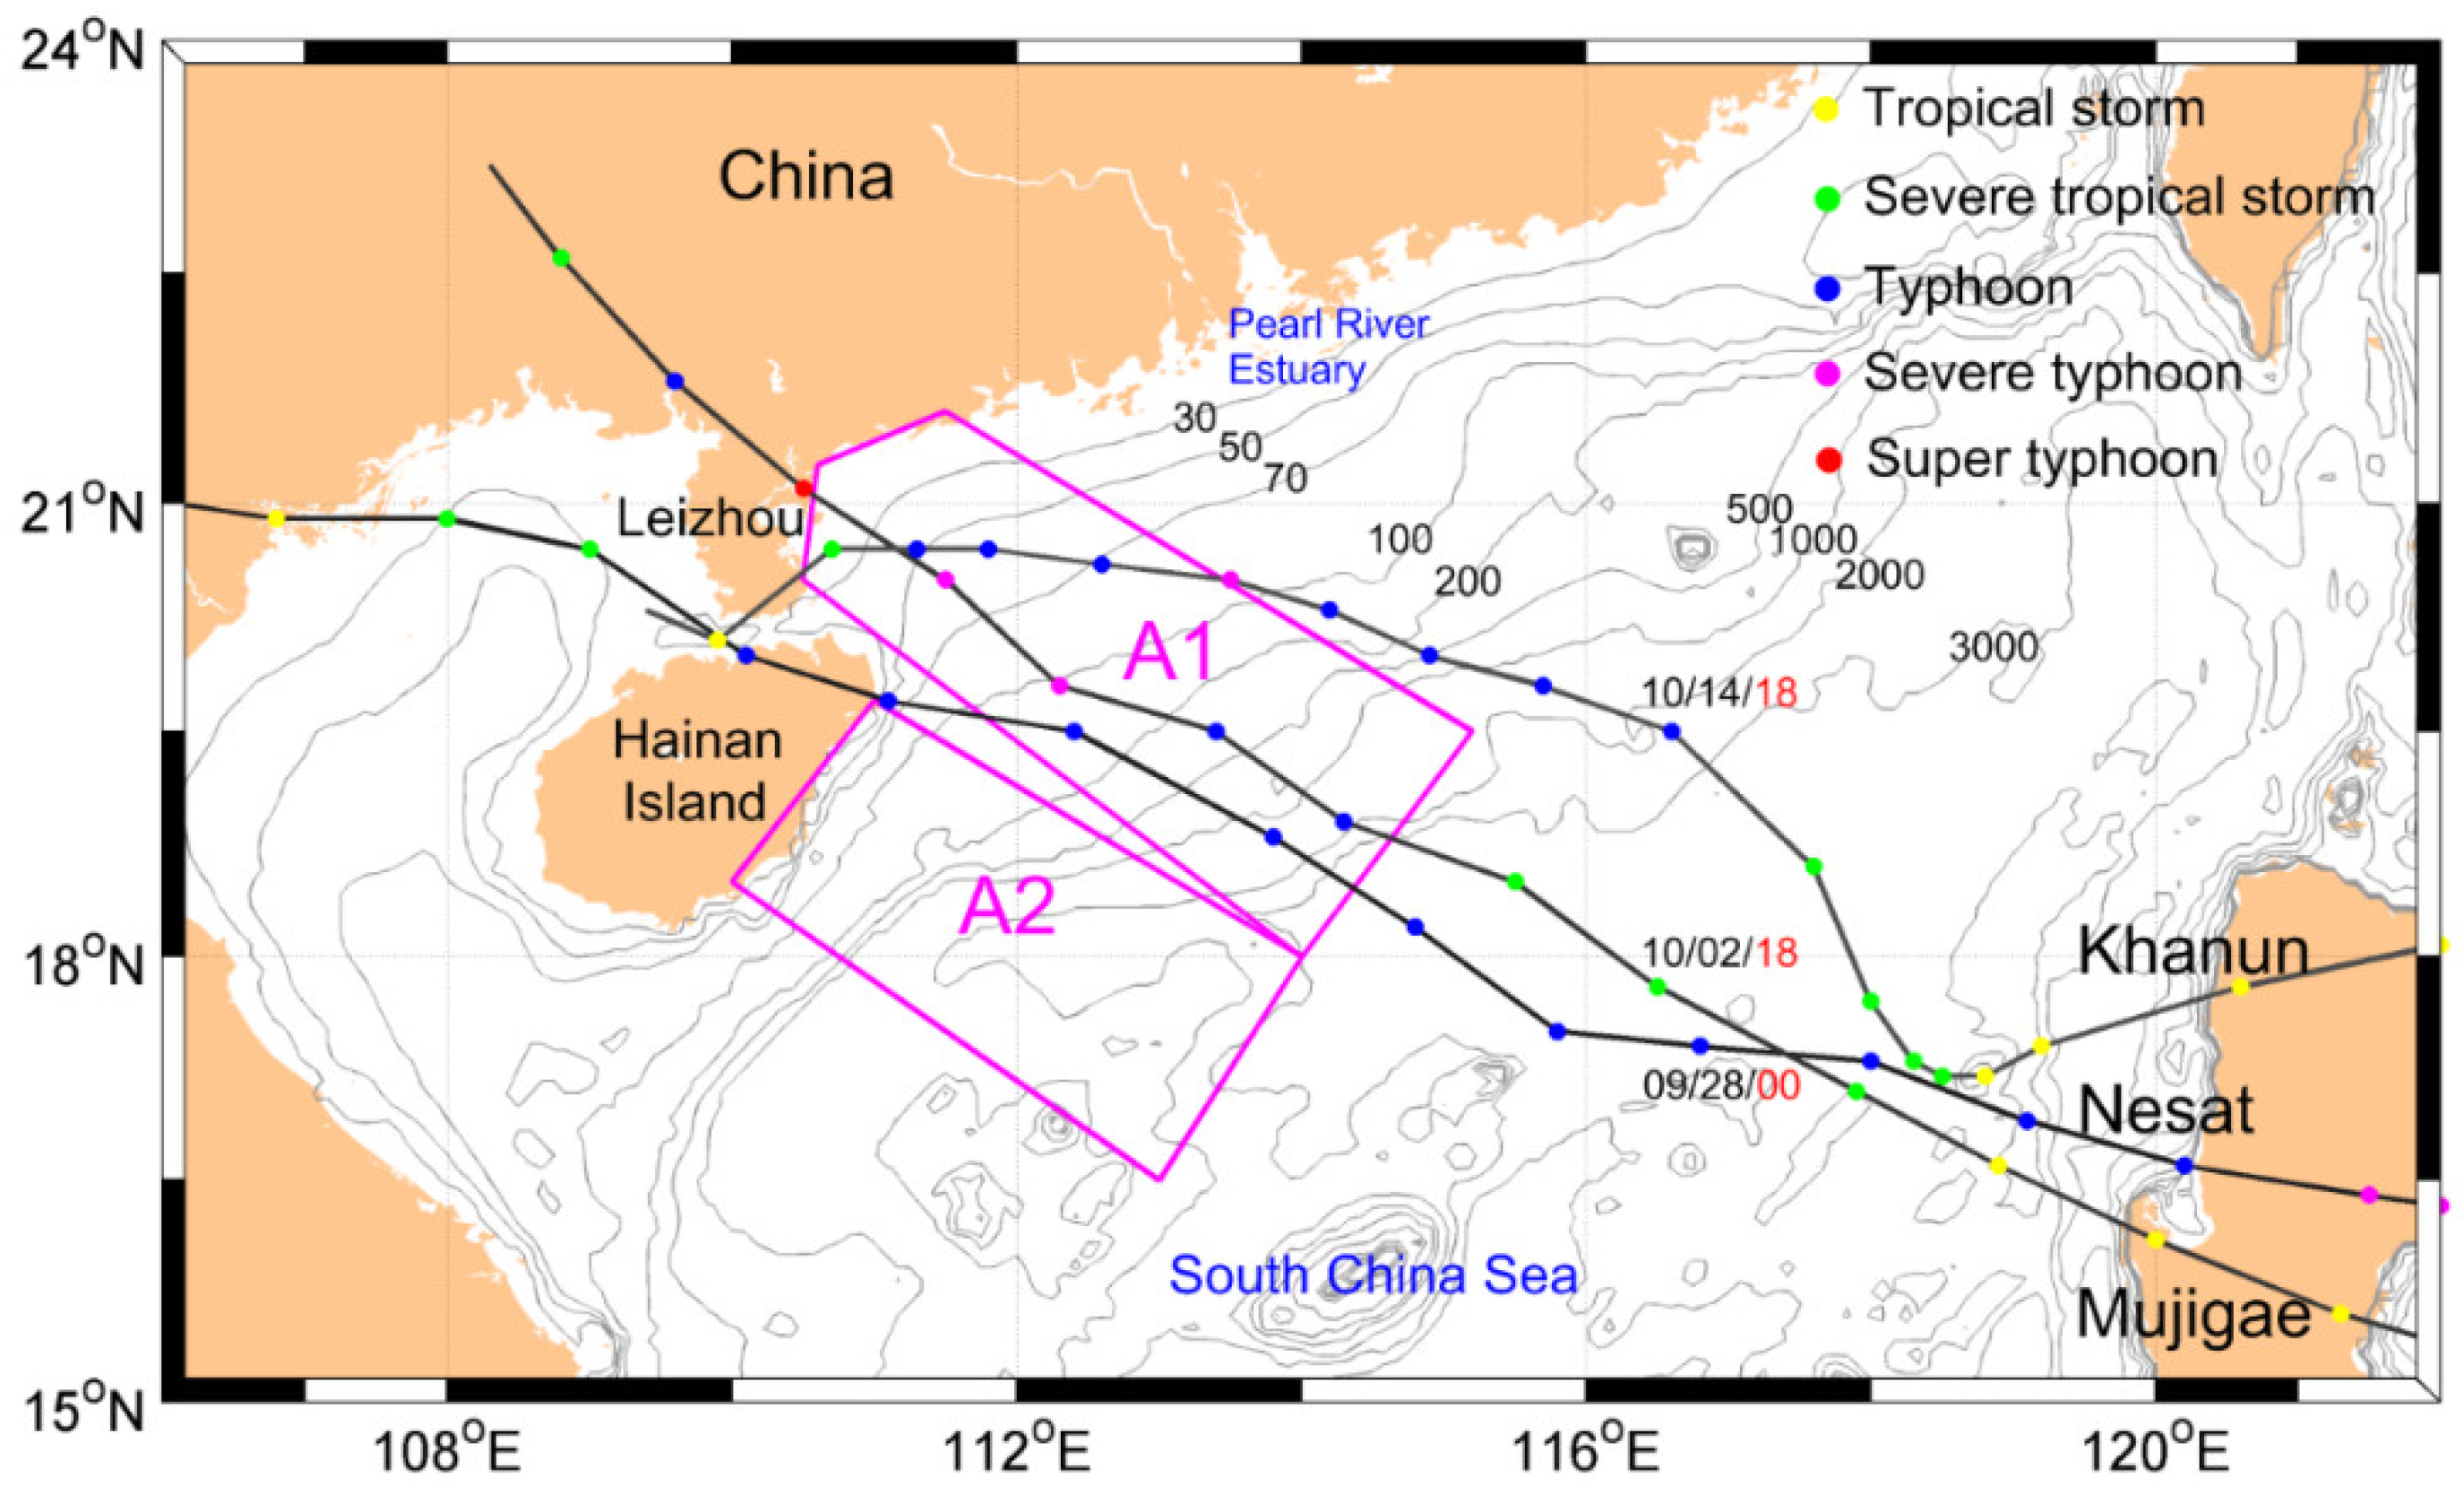
Figure 1. Study area and typhoon tracks in the NWSCS. Black curves with color dots (every 6 h) represent the typhoon tracks of typhoon Nesat (2011) Mujigae (2015), and Khanun (2017). Color dots on the black curves represent the typhoon intensity. The typhoon passing times are coded by month (first two digits), day (the middle two digits), and hour (the last two digits in red). Pink polygons represent the study area consisting of two subareas: Yuexi (A1) and Qiongdong (A2). Numerals on the isobaths are in m.
Remotesensing 13 02863 g001
Figure 2. Climatological monthly mean TSS concentration. Time series of ocean surface TSS concentration variation with isobath depth in A1 (a) and A2 (b). Mean climatological monthly mean TSS concentration with a depth less than 80 m in A1 (c) and A2 (d). Error bars in (c,d) are standard deviations of TSS. Color codes for TSS concentration (logarithmic scale) are in mg L−1.
Remotesensing 13 02863 g002
Figure 3. Climatological monthly mean Chl-a concentration variation with isobath depth in A1 (a) and A2 (b) and at depths less than 80 m (c) and (d). Error bars in (c,d) are the STD of Chl-a. Color codes for Chl-a concentration (logarithmic scale) are in mg m−3.
Remotesensing 13 02863 g003
Figure 4. Time series of TSS varied with isobaths (z) on the continental shelf of A1 (a,c,e). TSS concentration anomaly along the continental shelf (b,d,f). (a,c,e) are from Equation (1). X-axis indicates the concentration varied with isobaths (z). Y-axis indicates the time during the typhoon event. (b,d,f) are from Equation (2). Data are limited to the depth of 1000 m. Black lines in (a,c,e) represent passing times of typhoons Nesat (2011), Mujigae (2015) and Khanun (2017), respectively. Color codes for TSS concentration (logarithmic scale) are in mg L−1. In (b,d,f), black, red and green curves represent the Chl-a concentrations before, and after typhoon passage, respectively. The legend indicates the observation time of satellite.
Remotesensing 13 02863 g004
Figure 5. Time series of Chl-a concentration varied with isobaths (z) on the continental shelf of A1 (a,c,e). The Chl-a concentration anomaly along the continental shelf is shown in (b,d,f). (a,c,e) are from Equation (1). X-axis indicates the concentration varied with isobaths (z). Y-axis indicates the time during the typhoon event. (b,d,f) are from Equation (2). Data are limited to the depth of 1000 m. Black lines in (a,c,e) represent passing times of typhoons Nesat (2011), Mujigae (2015) and Khanun (2017). Color codes for Chl-a concentration (logarithmic scale) are in mg m−3. In (b,d,f), black, red and green curves represent Chl-a concentration before and after typhoon passage, respectively. The legend indicates the observation time of satellite.
Remotesensing 13 02863 g005
Figure 6. Time series of TSS concentration varied with isobaths (z) on the continental shelf of A2 (a,c,e). TSS concentrations anomaly along the continental shelf (b,d,f). (a,c,e) are from Equation (1). X-axis indicates the concentration varied with isobaths (z). Y-axis indicates the time during the typhoon event. (b,d,f) are from Equation (2). Data are limited to the depth of 1000 m. Black lines in (a,c,e) represent passing times of typhoons Nesat (2011), Mujigae (2015) and Khanun (2017). Color codes for TSS concentration (logarithmic scale) are in mg L−1. In (b,d,f), black, red, and green curves are Chl-a concentration before and after typhoon passage, respectively. The legend indicates the observation time of satellite.
Remotesensing 13 02863 g006
Figure 7. Time series of Chl-a concentration varied with isobaths (z) on the continental shelf of A2 (a,c,e). Chl-a concentrations anomaly along the continental shelf (b,d,f). (a,c,e) are from Equation (1). X-axis indicates the concentration varied with isobaths (z). Y-axis indicates the time during the typhoon event. (b,d,f) are from Equation (2). Data are limited to the depth of 1000 m. Black lines in (a,c,e) represent passing times of typhoons Nesat (2011), Mujigae (2015) and Khanun (2017). Color codes for Chl-a concentration (logarithmic scale) are in mg m−3. In (b,d,f), black, red and green curves are Chl-a concentrations before and after typhoon passage, respectively. The legend indicates the observation time of satellite.
Remotesensing 13 02863 g007
Figure 8. Rayleigh function fits of TSS time series increase after typhoon passage in A1 (a,b) and A2 (c,d). The colored symbols show the observations on the continental shelf (a,c) and basin area (b,d). The solid curves are the Rayleigh function. Averaged depths are upper 100 m and 200 m for (a) and (c), respectively.
Remotesensing 13 02863 g008
Figure 9. Rayleigh function fit of time series Chl-a concentration in A1 (ac) and A2 (d,e). The colored symbols show the observations on the continental shelf (a,b,d) and open sea (c,e). Blue lines are the Rayleigh function.
Remotesensing 13 02863 g009
Figure 10. CDOM aCDOM (a,b), monthly mean SLA (c,d), and daily SLA (e,f) in the NWSCS. (a) and (c) climatological data in July from 2010 to 2019. (b) and (d) climatological data in October from 2010 to 2019. (e) SLA on 24 September 2015. (f) SLA on 4 October 2015. Arrows in (cf) represent the geostrophic currents. Numerals on the isobaths are in m.
Remotesensing 13 02863 g010
Figure 11. Sea surface wind (arrows) and Ekman pumping velocity (colored) in the NWSCS. The unit of velocity (color bar) is m s−1. (ad) were captured at 13:45 UTC on 2 October, 2:16 UTC on 3 October, 13:24 UTC on 3 October, and 1:55 UTC on 4 October 2015, respectively.
Remotesensing 13 02863 g011
Table 1. Summary of typhoon cases passing over the study area.
TyphoonDateCategoryOrigin
Nesat24–30 September 2011TyphoonPacific Ocean
Mujigae02–05 October 2015Super typhoonPacific Ocean
Khanun11–16 October 2017TyphoonPacific Ocean
Table 2. Details of the ocean color data used in this study.
Time PeriodDataTemporal ResolutionSpatial ResolutionSatellite/Sensor
19–31 September 2011Chl-a, Rrs645daily4 kmTerra, Aqua/MODIS
20 September–31 October 2015Chl-a, Rrs645daily4 kmTerra, Aqua/MODIS
01–31 October 2017Chl-a, Rrs645daily4 kmTerra, Aqua/MODIS
2004–2019Chl-a, Rrs412, Rrs555, Rrs645monthly4 kmTerra Aqua/MODIS
Table 3. Summary of TSS and Chl-a decrease in A1 and A2.
AreaTSS (mg L−1)ATSS (mg L−1)T
(d)
σ2R2Chl-a
(mg m−3)
AChl-a
(mg L−1)
T
(d)
σ2R2
A1Offshore2.59022.50.692.66220.44
Shelf0.36230.39
Basin11022.50.450.10.3230.37
A2Shelf0.820330.110.26320.23
Basin0.80.8330.120.121320.37
Publisher’s Note: MDPI stays neutral with regard to jurisdictional claims in published maps and institutional affiliations.