Abstract
This paper reports on the activities carried out in the context of “Dragon project 32278: Three- and Four-Dimensional Topographic Measurement and Validation”. The research work was split into three subprojects and encompassed several activities to deliver accurate characterization of targets on land surfaces and deepen the current knowledge on the exploitation of Synthetic Aperture Radar (SAR) data. The goal of Subproject 1 was to validate topographic mapping accuracy of various ESA, TPM, and Chinese satellite system on test sites in the EU and China; define and improve validation methodologies for topographic mapping; and develop and setup test sites for the validation of different surface motion estimation techniques. Subproject 2 focused on the specific case of spatially and temporally decorrelating targets by using multi-baseline interferometric (InSAR) and tomographic (TomoSAR) SAR processing. Research on InSAR led to the development of robust retrieval techniques to estimate target displacement over time. Research on TomoSAR was focused on testing or defining new processing methods for high-resolution 3D imaging of the interior of forests and glaciers and the characterization of their temporal behavior. Subproject 3 was focused on near-real-time motion estimation, considering efficient algorithms for the digestion of new acquisitions and for changes in problem parameterization.
1. Introduction
The present project “Three- and Four-Dimensional Topographic Measurement and Validation” (ID: 32278) has been developed with continuity since Dragon-1. In Dragon-1 and Dragon-2, the focus was on DEM generation and surface motion estimation with medium resolution Synthetic Aperture Radar (SAR) data. Since Dragon-3, SAR datasets of high spatial and temporal resolution (TerraSAR-X, COSMO-SkyMed) were made available, and nowadays, thanks to the availability of dense time series from Sentinel-1, accurate and frequent global coverage has become a reality [1,2,3,4,5]. Moreover, the capabilities of SAR-based Earth Observation are on their way for a further improvement in the very near future, thanks to new low-frequency Missions, such as BIOMASS and ROSE-L, that will grant enhanced wave penetration in natural media, such as forests and ice [6,7]. This is the context in which this Dragon-4 project is framed. The overarching goal of the project is to develop or validate new methodologies to deliver a most complete characterization of targets on land surfaces and deepen the current knowledge on the exploitation of SAR data. The research work here reported is split into three subprojects focused on specific tasks:
- ○
- Validation of elevation and deformation maps produced by SAR Interferometry.
- ○
- Handling temporal effects on interferometric and tomographic analyses of natural scenarios.
- ○
- Near-real-time target motion estimation, considering efficient algorithms to allow for the digestion of new acquisitions and for a change in the parameterization of the estimation problem.
The context and research goals specific to each task are detailed in the remainder of this section. All data analyses were carried out by using self-developed computer codes in Matlab, Python, C, and C++. The analysis in Subproject 1 was also carried out by using the SarProZ tool.
1.1. Subproject 1: Topographic Mapping—Validation (TMV)
Digital Elevation Models (DEM) and topographic mapping are important applications for Synthetic Aperture Radar (SAR) remote sensing. Typically, SAR interferometry (InSAR) is used for this, due to the high theoretical precision of the approach. However, due to temporal decorrelation, i.e., decorrelation of the signal due to changes on the ground or in the atmosphere between the two acquisitions forming an interferogram, InSAR is often not applicable in a repeat-pass configuration. A possible way to circumvent this is by using bi-static InSAR, because in the configuration with one transmitting sensor and two receiving antennae, the temporal baseline between the acquisitions is minimal and temporal decorrelation is strongly reduced. Therefore, global DEM generation from InSAR is typically based on bi-static systems, such as SRTM [8] and TanDEM-X [9].
Beside using phase differences to derive topographic differences between objects on the ground, similar to photogrammetry, the influence of the topography on the imaging properties of a SAR image in range direction can be used to derive height differences between pixels. This approach is typically referred to as SAR stereo radargrammetry or StereoSAR [10,11]. StereoSAR strongly depends on the ability to detect homologous pixels in the SAR images, which can be challenging due to the range-dependent geometry of SAR images and the speckle effect. Due to the similarities between photogrammetry and StereoSAR, processes and methods from photogrammetry can be extended to be used for StereoSAR.
An important difference between StereoSAR and photogrammetry is the comparably stable image geometry of a SAR image. Having a good orbit estimation, SAR offers a very precise localization methodology that offers absolute positioning in the centimeter range [1,12,13]. This methodology is generally referred to as SAR geodesy. Beside Earth dynamical factors, such as solid Earth tides and ocean loading, which can be corrected with well-known methods from geodesy, the main influencing factor of the SAR signal positioning in range is the atmospheric delay. This can be separated in a constant dry-atmospheric delay, which can be well estimated, and a dynamic delay based on the dynamic atmospheric conditions, e.g., the water vapor content of the atmosphere [12,14].
In SAR geodesy, the atmospheric delay is estimated from collateral data, such as available weather models. In the permanent scatterer interferometry (PSInSAR) approaches, this information is derived from the data itself, using a large number of SAR images and assuming a spatial correlation of the atmospheric parameters. PSInSAR is an important technique to estimate surface motion from long time-series of SAR data, by circumventing temporal decorrelation, estimating the atmospheric phase delay, and solving for the best fitting solutions from a set of underdetermined linear, or linearized, equations.
1.2. Subproject 2: Multi-Baseline SAR Processing for 3D/4D Reconstruction (MBSAR)
Based on the fruitful results of research achieved within Dragon-1, -2, and -3, we continued focusing on the retrieval of information on ground target elevation and deformation in this subproject under Dragon-4. However, the research objective is switching to a more complete retrieval of 3D and 4D target information from multi-baseline SAR. In this context, we carried out investigations on new techniques of topographic mapping and deformation measuring. Regarding topographic mapping, we developed multi-baseline bi-static InSAR and stereo-radargrammetry methods with high-resolution SAR data pairs for mountainous areas of complex terrain conditions [15,16]. Regarding measuring deformation in both urban and rural environments, we refined persistent scatterer interferometry (PSI) thermal dilation modeling for precise deformation monitoring of various man-made infrastructures such as buildings, bridges, railways, highway, etc. [17,18,19,20]. Moreover, we systematically explored time series InSAR analysis with distributed scatterers (DSs), improved tropospheric path delay correction, and point-like target offset tracking (PTOT) techniques to meet the needs of landslide and subsidence detection/monitoring [21,22,23,24].
In addition to research on advanced interferometry, much interest in the SAR area has been given in the last two decades to Synthetic Aperture Radar (SAR) Tomography (TomoSAR) [25]. The rationale of TomoSAR is easily understood by considering it as an extension of SAR imaging from 2D to 3D. Conventional SAR systems transmit short pulses and receive the echoes backscattered by the illuminated targets along a single flight line, i.e., a 1D synthetic aperture in the SAR jargon. In this way, the received signal can be focused through digital signal processing techniques to produce a 2D image of the illuminated area, where targets are resolved in the range/azimuth plane. TomoSAR imaging is based on the collection of multiple flight lines, i.e., a 2D synthetic aperture. This allows focusing the received signal not only in the range/azimuth plane, as in conventional 2D SAR imaging, but also in elevation, therefore achieving 3D imaging capabilities. Related applications have been developed ranging from urban layover solution [25,26,27,28,29,30] to natural media [25,26,27,31,32,33,34,35,36,37,38,39,40,41,42,43,44,45,46,47,48,49,50,51,52,53,54,55,56,57,58,59,60,61,62,63,64,65,66,67,68,69,70,71] full 3D imaging. Differential Tomography viz full 4D SAR imaging [43] was also originated, for joint elevation and deformation retrieval of multiple targets in urban scenes [28,29,30,43]. Concerning the natural scenarios, large part of the research in the last years has focused on studying the internal structure of distributed media, such as forests, snow, and ice bodies, by the technique of TomoSAR [25,26,27,31,32,33,34,35,36,37,38,39,40,41,42,43,44,45,46,47,48,49,50,51,52,53,54,55,56,57,58,59,60,61,62,63,64,65,66,67,68,69,70,71]. Research on the use of P-Band waves (wavelength ≈ 70 cm), in particular, has accelerated since 2007 in view of the future P-Band space-borne Mission BIOMASS, which will be launched by the European Space Agency (ESA) in 2023 with the aim of providing forest Above Ground Biomass (AGB) accurately and globally [12]. Early research for the distributed media application was generally aimed at tomographic image reconstruction, including first extensive application of super-resolution Capon Tomography [26,27] to distributed targets [44], and at extensive a phenomenological interpretation of tomographic data, to complement traditional radiometric, polarimetric, and interferometric measurements [27,35,36,52,63]. Later, TomoSAR was demonstrated to be a most valuable tool to retrieve forest canopy height [69], and, by virtue of the penetration capabilities of P-Band waves, sub-canopy terrain topography [54,60,67]. In parallel, research on Tomography was carried out at L-Band (wavelength ≈ 25 cm) as well, motivated by the proposal of the L-Band bistatic SAR systems Tandem-L and SAOCOM-CS [37,56]. Important results are those concerning separation of ground and volume scattering, the impact of weather and seasonal changes [57,59], and forest classification [57,58,59,60,63]. Importantly, TomoSAR was demonstrated to provide a much closer link to forest biomass than conventional 2D SAR images both at P- and L-Band, and could be successfully used to derive novel and accurate AGB retrieval methods [31,32,39,40]. As a result, SAR Tomography has been assigned a dedicated 14-month acquisition phase in the context of the forthcoming ESA Earth Explorer mission BIOMASS, and it has increasingly been considered as a selling point for future bistatic missions operating at L-Band and higher frequencies. Still, large part of these works could not consider the role of temporal effects, since tomographic data used in the experiments were acquired in a single day and under sunny weather conditions. The role of temporal decorrelation was investigated in Reference [38], using data from the tower-based campaign TropiSCAT, which provided detailed indications on the vertical structure of temporal decorrelation. Nonetheless, the analysis did not directly consider the impact of temporal decorrelation and weather conditions on tomographic imaging and suffered from the obvious limitation of providing data from a very limited area. In this context, the concept of extending Differential Tomography imaging for information extraction in dynamic forest layers was proposed, proper were algorithms developed [45,46,47,49], and some experimental trials were carried out by using 2-month time span P-band airborne BioSAR 1 data [45,46,49]. In particular, new tomographic algorithms were developed able to compensate for temporal effects through Differential Tomography [46,47,49], and concurrent separation of long-term temporal decorrelation mechanisms of canopy and ground was also first demonstrated at large scale [45,49]. Part of the activities on SAR Tomography here reported are dedicated to filling the gaps in these previous researches. Firstly, in this paper, we present new experimental analyses to quantify the impact on temporal decorrelation on AGB retrieval by TomoSAR. Then we broaden the research by extending experimental tests of the advanced tomographic algorithms robust to temporal decorrelation [46,47,49] based on the concept of Differential Tomography [29,43]. Finally, in addition to temporal effects, we also carefully consider the need for very high resolution Tomographic imaging of natural media, showing the need for dedicated processing in the case where deep penetration occurs.
1.3. Subproject 3: Towards Near-Real-Time InSAR Estimation
The standard InSAR approaches based on data from orbiting satellite SAR platforms do not allow near real-time InSAR measurements, either DEM or deformation, considering the delay in the satellite revisit time and the limitations in the current data-processing techniques. In particular, when 3D deformation measurements are required, much longer delay in time is typically needed to acquire the necessary SAR datasets for calculating the 3D deformation information [72]. In this part of the project, we aim to address some of the problems by studying the quality of DEM generated from geosynchronous SAR, 3D deformation information retrieval based on an integration of 1D InSAR deformation measurement and a deformation model, and real-time structural dynamic deformation measurements based on a ground-based radar system, as well as issues such as better correction of tropospheric and ionospheric effects in InSAR measurements [73,74].
2. Project, Subprojects, EO, and Other Data Utilization
2.1. List of Subprojects, Teaming, and Academic Exchanges
2.1.1. Topographic Mapping—Validation (TMV)
Chinese and European PIs: Timo Balz and Norbert Haala.
Chinese Young Students: Jinghui Wang.
Academic exchanges: the main exchange of the team was the academic visit of the Chinese Young Scientist Jinghui Wang at the Institute for Photogrammetry (ifp) at the University Stuttgart for one year. The cooperation based on this continues until today, with Jinghui Wang working towards her PhD based on the joint research in the combination of photogrammetric approaches for StereoSAR.
2.1.2. Multi-Baseline SAR Processing for 3D/4D Reconstruction (MBSAR)
Chinese and European PIs: Mingsheng Liao, Stefano Tebaldini, Fabrizio Lombardini (co-PI, PI on ESA contractual side).
European Young Students: Mauro Mariotti d’Alessandro, Alessandro Vinciguerra, Claudia Zoppetti.
Chines Young Students: Xinwei Yang, Yu Bai, Yanghai Yu.
Academic exchanges: the team has tightly collaborated over the years through a number of academic exchanges from China to Europe and vice versa. Professor Fabio Rocca spent a three-week period at LIESMARS in April 2018 and gave the Keynote speech by F. Rocca at the 2nd P-Band workshop. Professor Tebaldini gave the Keynote speech at the China High Resolution Earth Observation Conference, held at the Wuhan University, 17 September 2017. Professor Minghsheng Liao spent a one-month visit at Politecnico di Milano in fall 2018. Three Chinese Young Scientists decided to spend a one- or two-year period at Politecnico di Milano under the supervision of Professor Tebaldini.
2.1.3. Towards Near-Real-Time InSAR Deformation Estimation
Chinese and European PIs: Xiaoli Ding, Lei Zhang, Ramon Hanssen.
Chines Young Students: Mi Jiang, Hongyu Liang, Xiaoqiong Qin, Songbo Wu, Bochen Zhang, Wu Zhu.
Travels and visits: Ramon Hanssen visited the group at The Hong Kong Polytechnic University twice over the project duration, and Xiaoli Ding visited Delft once to discuss collaborations.
Academic exchanges: A PhD student, now Dr. Mi Jiang spent half a year at the Delft to undertake research under the supervision of Professor Ramon Hanssen. In addition, a PhD student, now Dr. Xiaoqiong Qin, spent about one year at The Hong Kong Polytechnic University as a jointly supervised student.
2.2. Description and Summary Table of EO and Other Data Utilized
The project made use of tens of space-borne SAR images in stripmap and high-resolution spotlight mode from different satellite sensors, including TerraSAR-X, ALOS PALSAR, ALOS-2, and Sentinel 1.
In addition to satellite data, the project made use of data acquired in the context of dedicated ground-based and airborne campaigns by ESA. ESA campaign data include the following:
- ○
- TropiSCAT: TropiSCAT was implemented in 2011 as a P-Band ground-based campaign at tropical forest in Paracou, in French Guiana, with the aim of continuously monitoring the vertical structure of a tropical forests for a time span of over one year [38].
- ○
- BioSAR 1: BioSAR 1 is an airborne campaign implemented in 2007 at the semi-boreal forest in Remningstorp, Southern Sweden. SAR P-Band data provide tomographic imaging capabilities and acquisitions collected over a time span of two months [32].
- ○
- AfriSAR: AfriSAR is an airborne campaign implemented in 2015 at different tropical forest sites in Gabon. The P-Band data used for this project are those acquired at the site of La Lopé, which provide tomographic imaging capabilities and acquisitions collected over a time span of 9 days. The data are complemented by Lidar-derived maps of terrain topography and forest height [33].
- ○
- AlpTomoSAR: AlpTomoSAR is an L-Band airborne campaign implemented in 2014 to provide 3D imaging of the interior of the Mittelbergferner glacier, in Austrian Alps [65].
3. Subprojects’ Research and Approach
3.1. Topographic Mapping—Validation (TMV)
3.1.1. Research Aims
The research in Dragon-4 was focusing on three points.
- Improvements in DEM generation with amplitude-based methods.
- Improving the absolute positioning accuracy with SAR geodetic approaches.
- Using PSInSAR and similar methods and extending the usability of PSInSAR for bi-static and mono-static pursuit stacks.
3.1.2. Research Approach
StereoSAR with Semi-Global Matching
Semi-Global Matching (SGM) is commonly used in photogrammetry. It can be transferred to StereoSAR, under the precondition of generating epipolar image pairs from the corresponding SAR stereo image pairs. A projection trajectory method assisted by an external DEM is applied to generate the rectified epipolar images [11]. With the incorporation of the 3 arc-second SRTM, the inherent geometric distortion of a SAR image, e.g., foreshortening, could be largely eliminated in epipolar images, as long as the geometric distortions remain unambiguous. The SGM algorithm is composed of five main steps: matching cost computation, cost aggregation, disparity computation, disparity refinement, and disparity fusion. First, the matching cost is calculated by using the similarity measure function to measure the similarity of the patches of the left and right images. Common measurement functions include square variance SD, absolute difference AD, sum of squares of difference SSD, absolute difference and SAD, normalized correlation coefficient (NCC), mutual information MI, census, etc. Then, cost aggregation is used to accumulate matching costs within a window of the current pixel and form data items of the parallax energy function, in order to achieve the effect of the local parallax constraint. Disparity estimation is the solution of the parallax energy function composed of data items and smoothing items. At present, several commonly used optimization methods are graph cutting method, dynamic programming, BP algorithm, and so on.
Finally, by rigorous Range–Doppler forward intersection, the geodetic coordinates (lat, lon, and h) are extracted for the dense homogenous points obtained by SGM. The final DSM is retrieved after triangular interpolation [75,76].
Absolute Positioning of Point-Targets with SAR Geodesy
With SAR interferometry being an inherently relative measurement, digital surface models (DSM) derived from InSAR are relative to a given reference point in the image. To transform them into absolute heights, and therefore also correctly geo-correct the data, a reference point is necessary.
SAR geodesy offers the possibility to derive precise absolute position of point-targets from a pair acquired in a stereo geometry. A point target with a high signal-to-clutter ratio is required to achieve a high degree of sub-pixel precision. Global dynamics, such as the solid Earth tides, can be calculated based on many available tools from geodesy. The challenging part is the correction for the atmosphere. However, the dynamical part of the atmosphere is responsible only for delays in the decimeter range, whereas the larger part of the atmospheric delay, the so-called dry-atmosphere, is responsible for a delay >1 m. The meta data of TerraSAR-X provide an estimation of the dry-atmosphere delay in range, as well as a correction for the azimuth timing error. Based on this alone, position accuracies in the decimeter range are possible, which is stable, easy to achieve and sufficient for many applications that require sub-meter precision [12].
PSInSAR for Mono-Static Pursuit Data
Typical SAR satellite constellations provide repeat-pass data, ideal for PSInSAR analysis. Systems that are designed for DEM generation, such as the TanDEM-X mission, provide bi-static data, minimizing the temporal decorrelation. The small temporal baseline between the acquisitions is the main feature of this, making bi-static pairs themselves useless for estimating motion, as a measurement of motion requires a sufficient temporal difference between the acquisitions. Furthermore, the data-acquisition schemes of satellites for DEM generation normally ensure global coverage and do not build large stacks over certain areas of interest usable for PSInSAR. However, such stacks do exist from the TanDEM-X mission in certain areas and with more upcoming bi- and multi-static systems, such as Harmony or HRWS, more stacks of bi- and multi-static data for surface-motion estimation will be available.
Deriving surface motion from such data requires adjustments to the processing scheme. In our experiment, we worked with another type of experimental SAR data from the TanDEM-X science phase, the so-called mono-static pursuit data. In the mono-static pursuit mode, TerraSAR-X and TanDEM-X are not operated in bi-static mode but are shifted towards a 10-s temporal baseline and acquire data independently in the classical mono-static acquisition mode. This allows for direct processing in the available software that is used for standard mono-static data processing, without implementing the bi-static data handling. Nevertheless, the huge difference between the 10-s pairs and the 11-day pairs formed by any two consecutive passes of TerraSAR-X can lead to numerical problems in processing and require special handling. For this we separated the estimation of the target height from the estimation of the velocity, basing the former on the bi-static pairs and the latter on the 11-day pairs.
3.2. Multi-Baseline SAR Processing for 3D/4D Reconstruction (MBSAR)
3.2.1. Research Aims
Fully exploitation of distributed scatterers (DSs) with typical characteristics of gradually decorrelating for improved deformation measurements has become a hot topic in the research field of time series SAR interferometry over the last decade. In this project, we focused on addressing the following problems:
- ○
- How to increase the number and spatial density of measurement points in natural environment by combining persistent scatterers (PSs) and DSs?
- ○
- How to design a robust algorithm to identify DSs from small data stacks?
- ○
- To what extent the improvement in deformation measurement can be achieved by using DSs when compared with PSI and SBAS in the context of landslide detection and monitoring?
- ○
- What information on geohazards can be derived from InSAR observations over various time scales?
Large part of the research on SAR Tomography was focused on assessing the impact of temporal effects and testing proper countermeasures. In particular, the following questions were addressed:
- ○
- What will be the impact of changing weather conditions on AGB retrieval based on BIOMASS Tomographic data and Interferometric data?
- ○
- Can we confirm that it possible to compensate for temporal decorrelation effects by exploiting suitable signal processing algorithms based on Differential Tomography?
In addition to temporal effects, the research has considered two further topics related to tomographic processing:
- ○
- What is the most accurate signal processing approach for forest-height retrieval based on tomographic data?
- ○
- What are the driving requirements for very high resolution tomographic imaging of natural scenarios?
3.2.2. Research Approach
Development of Algorithms for DS Identification and Preprocessing
DS targets in natural environments are usually associated with the concept of statistically homogeneous pixels (SHPs) that refers to a group of SAR image pixels sharing highly similar backscattering characteristics. Therefore, SHPs identification does constitute the key issue for the exploitation of DS targets. Classical DS algorithms, such as SqueeSARTM employ the Kolmogrov–Smirnov (K–S), test to evaluate inter-pixel similarity to select candidate SHPs from a long stack of SAR datasets [77]. However, K–S test is not suitable to small data stacks, and it only makes use of SAR pixel intensity information.
In order to solve this problem, we proposed a new approach named Coherent Scatterer Interferometry (CSI) to employ the generalized likelihood ratio (GLR) test, see for example [78], instead of K–S test to evaluate inter-pixel similarity over a short data stack [79]. Particularly, the Wishart distributed complex covariance matrix (CCM) rather than pixel intensity only is taken as the input for the GLR test. Then, a threshold determined by the asymptotic distribution of the logarithm of GLR test statistics at a fixed significance level is used to select spatial SHPs for the reference pixel. In addition to SHPs selection, the proposed CSI method employed the phase linking algorithm to estimate optimal phase for each candidate DS pixel [79]. Compared with the Broyden–Fletcher–Goldfarb–Shanno (BFGS) algorithm adopted by SqueeSARTM [77], the phase linking algorithm can achieve much higher computational efficiency [80].
Improved Landslide Investigation by Joint Exploitation of DS and PS Targets
InSAR technology has long been applied to landslide investigation since the era of ERS-1/2 satellites. However, the effectiveness and reliability of InSAR results are usually problematic due to the unfavorable impacts of decorrelation effects and atmospheric disturbances. Although time series InSAR techniques can overcome these problems by focusing on persistent scatterers (PSs) and excluding those decorrelating pixels from analyses, a big problem often encountered in practical applications is the limited number and spatial density of measurement points (MPs) in natural environments, which makes the result interpretation very difficult. Aiming at this problem, we explored the possibility of using both DS and PS targets to increase MPs as much as possible so as to improve the quality of InSAR results. Specifically, the above mentioned CSI method was applied to landslide detection and monitoring in different test sites.
For the Danba area located in Southwest China, we first focused on the well-known Jiaju landslide and a stack of 19 L-Band ALOS PALSAR images were analyzed by using PSI, SBAS and CSI, respectively. Updated spatial pattern of surface deformation across the Jiaju landslide was then identified from time series InSAR results. Next, wide-area InSAR analyses were carried out to detect potential landslide hazards distributed along the upstream of Dadu River. For the Sunkoshi area of North Nepal, we analyzed multi-source satellite SAR data to characterize the evolution life cycle of the Sunkoshi landslide close to the Araniko Highway. In particular, pre-disaster surface displacements of this landslide during 2007–2011 was retrieved from 20 scenes of ALOS PALSAR images, while both L-Band ALOS-2 PALSAR-2 and C-Band Sentinel-1 data stacks were processed to quantify the post-disaster long-term deformations.
Assessment of Temporal Effects on SAR Tomography
Temporal effects were studied on an experimental basis, using data from the ground-based campaign TropiSCAT and from the two airborne campaigns BioSAR 1 and AfriSAR [32,33,38]. TropiSCAT data were used to directly mimic BIOMASS acquisitions by analyzing tomograms formed by taking the signals acquired by different antennas on different days. Since BIOMASS tomography is implemented by taking acquisitions, each separated by three days, we considered tomograms obtained by taking two TropiSCAT antennas every 3 days (and three antennas on the last day), which means that any single tomogram can be obtained by mixing seven different days. As in Reference [70], we hereafter refer to these tomograms as “7-day tomograms”. Each 7-day tomogram is associated with an “instantaneous tomogram” obtained by taking all 15 antennas at 6:00 a.m. on the seventh day, which is used as reference. Tomographic processing is then carried out by focusing the acquisitions from seven days in ground range-height coordinates by time-domain back projection. As a result, it was possible to form 66 7-day tomograms, of which 61 included acquisitions with both sunny and rainy days, so as to provide a clear experimental assessment of the radiometric error due to changing weather conditions. The error was then translated to an AGB retrieval error based on the observed sensitivity of tomographic data to forest biomass at the TropiSCAT site, which was known from airborne measurements [70].
The evaluation of the impact of temporal decorrelation on AGB retrieval based on interferometric data was carried out with reference to the ground-cancellation technique introduced in References [81,82]. The technique consists in a coherent combination of two or three SAR images that allows to cancel out the ground echo and emphasize canopy backscattering, and it is currently assumed as the baseline retrieval approach for BIOMASS [82]. Our analysis consisted of implementing the ground-cancellation technique, using airborne campaign data acquired on the same day and on different days (time lags of 4, 5, and 9 days). In doing so, we were able to provide a direct measurement of the radiometric error due to temporal decorrelation [53].
Differential SAR Tomography for Robustness to Decorrelation
The potential of advanced processing based on Differential Tomography concepts [43], to get robustness in tomographic imaging in presence of temporal decorrelation, was studied with particular reference to the fully model-based 4/5D method first introduced in Reference [46] and formalized in Reference [47], which allows to estimate temporal parameters such as target velocity or vibration rate. This approach, Generalized-MUSIC Differential Tomography, avoids the misinterpretation of spurious temporal harmonics, corresponding to the scatterers temporal perturbations coded by (long-term) decorrelation, with the spatial (baseline) harmonics corresponding to the vertical scene. This is obtained by framing the tomographic imaging from spatial-only to space–time, and generalizing the well-known super-resolution MUSIC processor [26,27] to match the nuisance temporal spectra (and possible collective phase shift trends) [47]. A semi-parametric Generalized-Capon Differential Tomography was first conceived and experimented in Reference [45], as well, robustifying the well-known Capon Tomography [26,27]. To confirm the possibility of mitigating temporal decorrelation effects by performing tomographic imaging through Differential Tomography, first demonstrated in Reference [46], the original Generalized-MUSIC trials were extended, and a comparison with plain spatial-only MUSIC Tomography was also carried out. The methods were applied to P-Band data with a two-month time span from the ESA campaign BioSAR 1.
Tomographic Forest-Height Retrieval
Optimal processing for forest-height retrieval was addressed by implementing and comparing two different approaches [69]: (1) parametric height estimation by minimizing the least-square problem between random volume over ground (RVoG) model predictions and multi-baseline SAR data and (2) thresholding the vertical backscattering obtained by tomographic focusing. Both approaches were applied to the case of P-Band data collected during the AfriSAR campaign and validated against Lidar measurements.
Very High Resolution Tomographic Processing of Natural Media
Optimal processing of tomographic data was addressed by studying imaging artefacts that arise when conventional one-dimensional (1D) focusing methods, such as beamforming or Capon filtering [27], are applied to process data collected by using largely spaced and/or largely irregular trajectories. A new processing method was proposed to produce high-quality imaging while largely reducing the computational burden, and without having to process the original raw data. The analysis was validated by results from numerical simulations, as well as from real airborne data from the ESA campaign AlpTomoSAR [71].
3.3. Towards Near-Real-Time InSAR Estimation
3.3.1. Research Aims
We aim in this project to address the identified problems in the existing InSAR approaches in near-real-time InSAR measurements. The objectives include in particular,
- Studying quality of daily DEM generated from geosynchronous SAR;
- Estimation of 3D surface displacement based on InSAR and deformation modeling;
- Better correction of tropospheric and ionospheric effects in InSAR measurements;
- Measurement of structural dynamics based on ground-based radar systems.
3.3.2. Research Approaches
Daily DEM Generation from Geosynchronous SAR Data
Airborne and low earth orbit (LEO) space-borne interferometric synthetic aperture radar (InSAR) has been proved to be a valuable tool for DEM generation. However, limited by the cost and satellite repeat cycles, it is hardly possible to generate or update DEM very frequently (e.g., on a daily basis) for a very large area (e.g., continental scale or greater). Geosynchronous synthetic aperture radar (GEOSAR) satellites fly in geostationary Earth orbits, allowing to observe the same ground area with a very short revisit time (daily or shorter). This offers a great potential for daily DEM generation that is desirable but impossible to date with space-borne sensors. We have systematically analyzed the quality of daily GEOSAR DEM [80]. The results indicate that the accuracy of daily GEOSAR DEM is in general much lower than what can be achieved with typical LEO SAR sensors and therefore it is important to develop techniques to mitigate the effects of the various errors in GEOSAR DEM generation in order to generate more accurate daily DEM [72].
Modeling and Correcting for Tropospheric and Ionospheric Effects
Tropospheric delays (TDs) in differential interferometric synthetic aperture radar (InSAR) measurements are mainly caused by spatial and temporal variation of pressure, temperature, and humidity between SAR acquisitions. These delays are one of the most significant error sources in InSAR observations. Although independent atmospheric measurements have been used to correct TDs, their sparse spatial or temporal resolution leads to uncertainties in the corrected interferograms. The performance of the conventional phase-based correction method is not always effective due to the presence of compounding signals (e.g., TDs, deformation, and topographic errors) and spatial variability of the troposphere. We have proposed a method that can simultaneously estimate in the framework of multi-temporal InSAR the stratified TDs together with parameters of deformation and topographic errors based on their distinct spatial–temporal features [73]. Spatial variability of the relationship between TDs and topographic height is addressed through localized estimation in windows divided by a quadtree based technique according to the elevation gradient.
We have also proposed a new method for more accurate estimation of the ionospheric phase screen (IPS) based on both azimuth and range displacement field maps [74]. We applied ALOS-PALSAR data that were acquired before and after the 2008 Wenchuan earthquake and the 2010 Darfield earthquake to test the proposed method. The case studies have showed that ionospheric azimuth streaks were clearly visible in the azimuth displacement field maps, one of which was generated by using MAI algorithm and the other by using an offset-tracking algorithm. The results confirmed that the long-wavelength ionospheric artifacts in the non-coseismic regions could be corrected by the use of the proposed method. The line-of-sight (LOS) displacement corrections in the two cases, Wenchuan and Darfield, were in the range of −35.9 to 21.0 cm and −6.6 to 10.0 cm along the LOS direction, respectively.
Estimation of 3D Surface Displacement Based on InSAR and Deformation Modeling
A new approach has been proposed for mapping 3D surface displacement caused by subsurface fluid volumetric change based on 1D InSAR line-of-sight measurements and surface deformation modeling [83]. The relationship between surface deformation and source fluid volumetric change is modeled according to an elastic half-space theory. A distinctive advantage of the proposed approach is that it effectively extends the capability of the sun-synchronous orbit side-looking synthetic aperture radar that has been essentially only able to measure 1D displacements accurately or at most 2D displacements when InSAR measurements from more than one orbit or platform are combined.
Dynamic Behaviors of Structures from Ground-Based Radar
We have carried out experimental studies to monitor the displacements of long-span bridges with a terrestrial microwave radar interferometer [84]. A technique for fusing the measurements from two receiving antennas of the radar instrument was proposed. In addition, a two-step phase unwrapping approach was also tested. The results have revealed the bridge dynamic responses under different loading conditions, including winds, vehicle traffic, and passing trains. The results have also shown that the terrestrial microwave radar interferometer can be used to monitor the dynamics of long-span bridges with unprecedented spatial and temporal resolutions.
4. Research Results and Conclusions
4.1. Topographic Mapping—Validation (TMV)
4.1.1. SAR Geodesy Based on Dry-Atmosphere
We validated the geolocation accuracy of high-resolution spotlight-mode TSX image over Wuhan, see Figure 1. The TSX metadata includes information on the expected delay caused by the atmosphere, without the influence of the dynamic weather situation. Based on this information alone, sub-meter geolocation accuracy for a stereo SAR configuration can be achieved based on the Range–Doppler model [12].
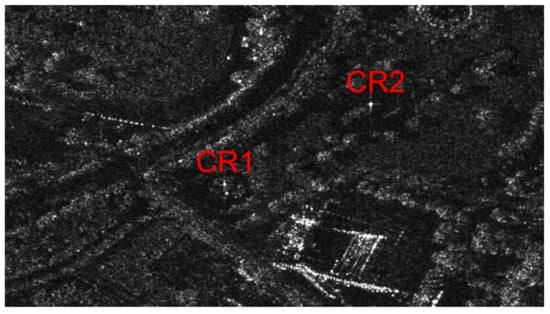
Figure 1.
Position of the corner reflectors CR-1 and CR-2 used in the experiment.
With this simple approach, TSX data can be used to extract the geolocation of targets and retrieve GCPs for ortho-rectification of other remote sensing imagery. The achievable sub-meter positioning is enough for various applications. Higher accuracies can be reached by including dynamic weather information. However, the weather models used for estimating the dynamic path delay are not always correct and can contain large errors. Thus, although generally the accuracy will be improved by integrating such weather models, under some circumstances, the errors from these models can lead to much higher errors as when basing the positioning only on the TSX metadata. This approach can therefore be more stable and even be advantageous, if sub-meter positioning is the goal. For decimeter or sub-decimeter positioning requirements, including the wet-atmosphere is necessary, though.
4.1.2. PSInSAR with Mono-Static Pursuit Data
In the pursuit-monostatic mode, two satellites fly in the same orbit, one behind another, with an increased along-track baseline of 20 km, which is equal to a temporal baseline of about 10 s. This distance allows both satellites to transmit and receive signals independently. For each target scene, an independent image pair can be obtained within a time interval of 10 s. In our experiment [13], we used a stack of 7 mono-static pursuit image pairs (i.e., 14 images) of very high resolution staring spotlight images acquired over Guangzhou in China (see Figure 2).
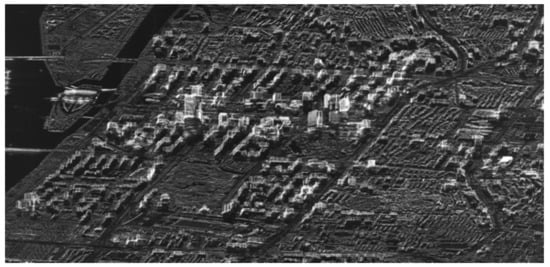
Figure 2.
Mean amplitude image of the TSX mono-static pursuit stack over Guangzhou used in our experiment © DLR, 2015.
Images acquired in the mono-static pursuit mode are similar to images acquired from a bi-static image acquisition, because the temporal baseline of 10 s is also very small and temporal decorrelation is minimized. The advantage for our application lies in the direct usability of pursuit monostatic data, which can be processed with standard PSInSAR processing tools, without the need to implement bi-static processing. Therefore, mono-static pursuit data are useful as an intermediary step when developing PSInSAR for bi-static stacks.
The main difficulty in processing such stacks is the huge difference in temporal baselines between the 10-s pairs and the 11-day temporal baselines between the pairs. Mixing these images together in a standard PSInSAR processing can cause various numerical problems when phase residuals in the 10-s pairs are being treated as range differences of the target. This should be avoided, for example by defining that there cannot be a motion induced phase element in the 10-s pairs.
As in such a way the 10-s pairs do not contribute to the velocity estimation, we separated the height from the velocity estimation completely. We used only the 10-s pairs for estimating the residual height of each PS point. This drastically improves the reliability of the height estimation, as the height is estimated from motion- and temporal-decorrelation-free images. In a second step, the estimated residual heights are fixed and the remaining 11-day pairs are only used for velocity estimation. The main advantage of this approach is the high precision of the building height estimation, which is especially prevalent for processing the skyscrapers in Guangzhou, as shown in Figure 3.
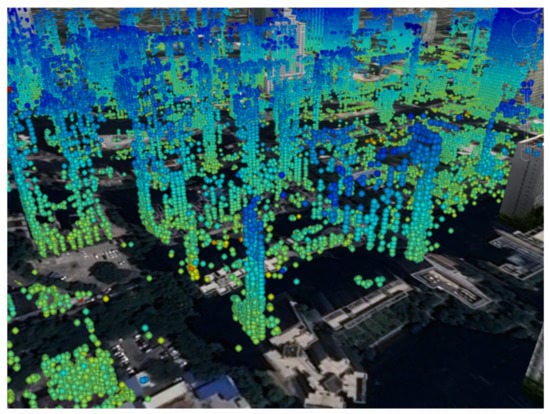
Figure 3.
Estimated PS points with the residual height color-coded in Guangzhou.
4.2. Multi-Baseline SAR Processing for 3D/4D Reconstruction (MBSAR)
4.2.1. Results
Improved Landslide Detection and Monitoring in Danba of Southwest China
The Danba County of Sichuan Province in Southwest China is well-known as a natural museum of geohazards. One of the most famous geohazards is the giant Jiaju landslide in the Niexia Township, upon which several Tibetan villages are located and rated as the most beautiful village in China. However, the local residents have long been threatened by the landslide activities. The M-shaped black curve shown in Figure 4 outlines the boundary of Jiaju landslide identified by previous studies through visual interpretation of high-resolution optical imagery, as well as field survey. The colored dots represent measurement points derived by three time-series InSAR methods, i.e., PSI, SBAS, and the proposed CSI [21]. The red color represents displacement away from the SAR satellite along the radar line-of-sight (LOS) direction, while the green color stands for stable areas.
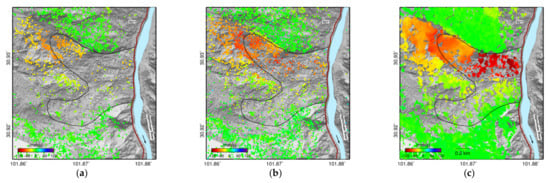
Figure 4.
Results of time series InSAR analyses over the Jiaju landslide in Danba derived from L-Band ALOS PALSAR data by different approaches: (a) PSI, (b) SBAS, and (c) CSI. The Dadu River flows from north to south through the landslide toe.
First, according to the InSAR results, the original boundary underestimated the area of active landslide deformation evidently, especially in the northern part of the slope. Therefore, an updated landslide boundary can be determined from high-quality InSAR results. Second, the number and density of MPs in the CSI result are much higher than those in PSI and SBAS results, and the CSI-measured displacement field shows more distinct spatial pattern, which confirms that joint exploitation of DS and PS targets can effectively mitigate the problem of low measurement reliability due to insufficient MPs.
Inspired by the significant improvements achieved for the Jiaju landslide, we expanded the application of CSI method to the wide area of Danba County along the valley of Dadu River. By setting the stability threshold of annual mean LOS displacement rate as ±8 mm/year, we detected and identified 17 unstable slopes in total. Effectiveness of the results was validated by a field survey in April 2017. Detailed information can be found in our previous publication [19].
InSAR-Measured Evolution Life Cycle of the Sunkoshi Landslide in North Nepal
The Sunkoshi landslide is located at the northern half of the Araniko Highway linking Nepal and Tibet of China. A catastrophic collapse of this landslide happened on 2 August 2014, resulting in enormous casualties and severe damages of the highway. Although a diversion road around the Sunkoshi landslide was put into operation in September 2015 and the traffic was flowing again on the Araniko Highway, the residual unstable rock mass on the slope may pose a long-term threat to the transportation safety. Therefore, continuous monitoring of the slope stability becomes a critical task to ensure the smooth operation of the Araniko Highway. In this study, the evolution life cycle of the Sunkoshi landslide was characterized by multi-source InSAR analyses [22].
First, 20 scenes of ALOS PALSAR data acquired from January 2007 to January 2011 were analyzed by using both SBAS and CSI methods to retrieve the pre-disaster surface displacements of the Sunkoshi landslide. As shown in Figure 5, the CSI result revealed the displacement field with much more details than SBAS once again as expected. According to the result, the upper part of the landslide has long become unstable before collapse, with the maximum mean LOS displacement rate of about −30 mm/year.
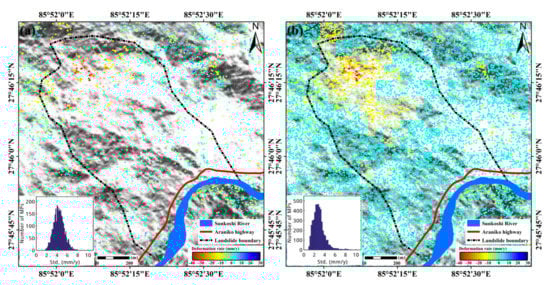
Figure 5.
Results of pre-disaster annual deformation rate of Sunkoshi landslide derived by (a) SBAS and (b) CSI methods, separately. The Sunkoshi River and Araniko Highway are rendered in their original locations before destruction. The subfigures on the lower-left corner show the histograms of standard deviation distribution of deformation rate.
Second, 11 scenes of ALOS-2 PALSAR-2 data and 82 scenes of Sentinel-1 data covering different time spans were processed by SBAS–InSAR method to evaluate the post-disaster stability of the Sunkoshi landslide. Both results shown in Figure 6 clearly indicated that the upper part of the slope was still in actively deforming since late 2014, which might evolve into a secondary failure in the future under the impacts of various factors, such as gravity, weathering, rainfall, earthquake, etc. Therefore, regular monitoring of the slope stability with operational SAR data acquisitions should be carried out to facilitate landslide risk management and disaster early warning.
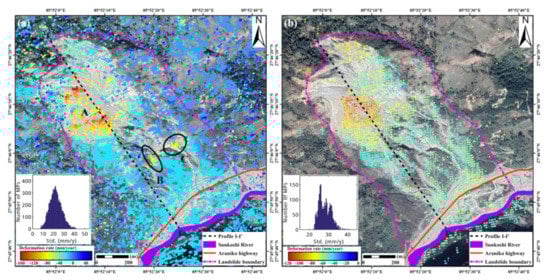
Figure 6.
Post-disaster annual mean LOS deformation rate of Sunkoshi landslide measured by (a) ALOS-2 data during the period from September 2014 to October 2017, and (b) Sentinel-1 data during the period from January 2017 to October 2019. The repaired road and dredged river are also rendered. The subfigures on the lower-left corner show the histograms of standard deviation distribution of deformation rate.
Assessment of Temporal Effects on SAR Tomography
The analysis of 7-day tomograms acquired under varying weather conditions with respect to reference “all-sunny” tomograms allowed to clearly quantify radiometric errors due to changing weather. Results clearly indicate that the intensity of scattering elements within the canopy layer is more stable than the intensity of scattering elements at ground level. The variation of the tomographic signal at canopy level can be assessed in about 1–1.5 dB r.m.s. (1 sigma) in cross-polarization [70].
The analysis of the AfriSAR dataset allowed us to analyze the radiometric variation of ground-canceled images as formed by taking images acquired at a temporal baseline ranging of 0, 4, 5, and 9 days, as shown in the top panels of Figure 1. The intensities of ground-canceled images at 4, 5, and 9 days were further analyzed to quantify the variation w.r.t. ground-canceled images from data collected on the same day. Results are shown in the bivariate histograms in the bottom panels of Figure 7. Here, it is immediate to see that the variation is larger for low-intensity regions, that correspond to short vegetation and low biomass. Regions characterized by taller trees are observed to be more robust to temporal decorrelation, showing a radiometric variation of 1 dB at most [55].
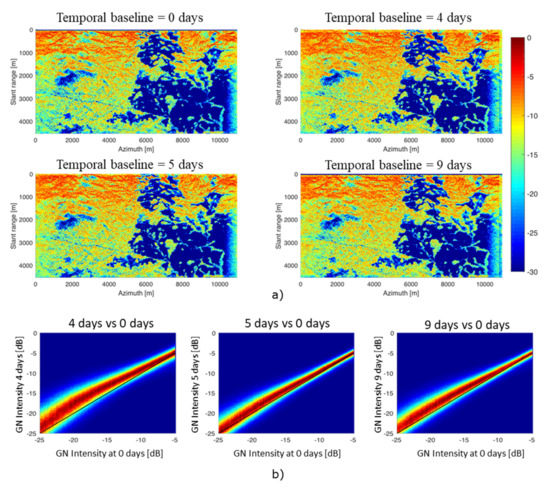
Figure 7.
(a) Intensity associated with ground-canceled images for different time lags separating master and slave images. Data from DLR AfriSAR, La Lopé. (b) Bivariate histograms showing the relationship between ground-canceled intensity at a temporal baseline of 4, 5, and 9 days w.r.t. ground-canceled intensity, using images from the same day.
Differential SAR Tomography for Decorrelation-Robust Tomography
The analysis applied to P-Band BioSAR 1 data of the functionality of tomographic focusing robust to temporal decorrelation through Differential Tomography, as introduced in References [46,47], w.r.t. plain Tomography with spatial-only processing (of the same model-based nature for a fair comparison), allowed to confirm the capability of the technique, Generalized MUSIC Differential Tomography [47] in particular providing reliable imaging results, with quality and height resolution sensibly better than conventional MUSIC Tomography [48,50]. It is worth noting that the dataset was well suited for the robust Tomography application, despite the long two-month time span, being the 9 track baseline-time acquisition pattern quite sparse [47], as beneficial for discriminating the spatial (baseline) and temporal harmonics in the Differential Tomography processing. A typical Generalized MUSIC tomogram (pseudo-power viz fitting degree, as common in model-based tomographic processors) is shown in Figure 8a. It is apparent how the canopy and ground layers are much more frequently and neatly resolved than by conventional MUSIC, whose pseudo-power is reported in Figure 8b. Thanks to the partial compensation of typical long-term decorrelation effects causing height blurring in MUSIC, Generalized MUSIC Differential Tomography is more sensitive and results in a generally higher tomogram sharpness.
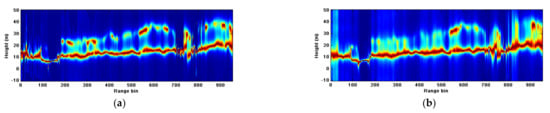
Figure 8.
(a) Tomogram from Differential Tomography. Data from BioSAR 1, Remningstorp. (b) Corresponding tomogram from plain Tomography.
Tomographic Forest-Height Retrieval
Forest-height retrieval from multi-baseline P-Band SAR data was addressed by using data from AfriSAR to compare parametric (RVoG) and non-parametric retrieval (thresholding). Both algorithms were observed to provide reliable results for forest-height values ranging from 30 to 50 m. In this height range, no substantial bias was observed, and dispersion turned out to be about 3 m or better. Height retrieval by tomography turned out to be slightly less dispersed than in the case of model-based inversion, although at the expense of a larger bias whenever forest height is lower than about 20 m [69].
Very High Resolution Tomographic Processing of Natural Media
The research in this direction resulted in a new processing technique to simultaneously correct for navigational errors and perform 3D focusing while correctly accounting for range and azimuth migration. This approach was validated by using L-Band data from AlpTomoSAR, where it was observed to produce much higher quality than conventional focusing approaches based on 1D spectral estimation [71].
4.3. Towards Near-Real-Time InSAR Estimation
Results
Selected results from the research are presented in this section. Figure 9 shows the errors in a DEM generated from GEOSAR data due to baseline errors with respect to different lengths of spatial baselines (i.e., 0 to 200 km) and baseline inclination angles (i.e., 0°, ±30°, ±60°, and ±90°). The results indicate that the spatial baselines and baseline inclination angles affect the results significantly. For the same baseline error, the larger the spatial baseline is, the smaller the DEM errors will be, and vice versa. On the other hand, for the same baseline error, the larger the inclination angle, the smaller the DEM errors will become, and vice versa. This also means that keeping a small inclination angle can improve the accuracy of the DEM estimate. The results also suggest that baseline errors are a major error source in GEOSAR DEM generation, especially for small baselines and those with large inclination angles.
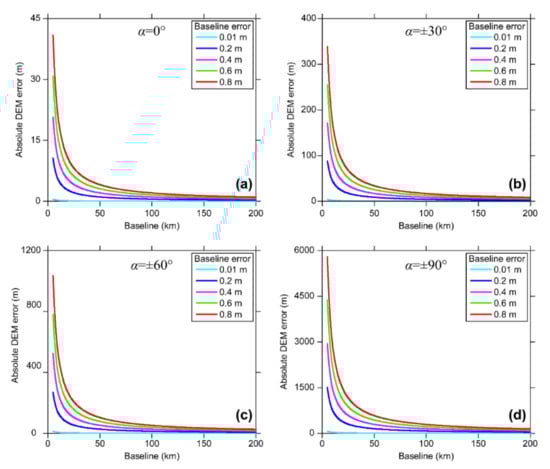
Figure 9.
DEM errors due to baseline errors with respect to different spatial baselines and baseline inclination angles (i.e., 0°, ±30°, ±60°, and ±90° for (a−d)). Nominal look angle of 4.8° is used [72].
Figure 10 shows the 3D displacements of the Kilauea volcano estimated with a joint model and a weighted-least-squares (WLS) approach [51]. In general, the three deformation components are similar, especially the up component. However, the ground subsidence at the caldera derived from WLS based method are somewhat smaller than that from the jointly model. Since the caldera switched from deflation to inflation from 19 June 2007, some subsidence was neutralized by the subsequent uplift in the PALSAR descending measurement that covers a longer period.
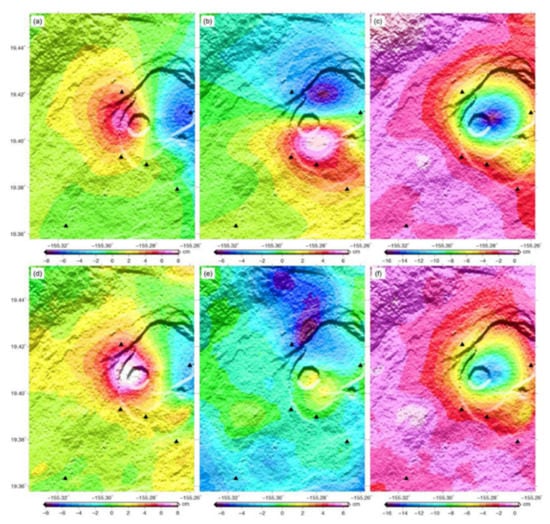
Figure 10.
(a–c) East, north, and up displacement components of Kilauea volcano from ascending PALSAR images acquired on 5 May and 20 June 2007 and a surface displacement model. (d–f) The same displacement components estimated from weighted-least-squares adjustment of InSAR and MAI results from both the ascending PALSAR data and descending PALSAR data of 28 February and 16 July 2007 [84].
5. Overall Discussion and Main Conclusions
SAR provides high-resolution and high-precision information for topographic mapping. DEM estimation and derived products are highly valuable and are still a major application for SAR, especially when using InSAR. Repeat-pass InSAR suffers from temporal decorrelation and is not useable in many areas of the world though, so that StereoSAR can be an alternative for providing up to date DEMs. Semi-Global Matching (SGM) provides an improved matching strategy that can enhance the quality of DEMs created with StereoSAR. The stricter requirements on precise epipolar image pairs for SGM can be challenging though.
Bi-static InSAR is under most circumstances the better alternative though. Currently, StereoSAR may be necessary for receiving updated DEMs, as the acquisition capability of the TanDEM-X mission is limited, but in the foreseeable future, more bi-static missions will be available, and even more SAR constellations will offer repeat-pass acquisitions with very small temporal baselines (e.g., 1 day) that can also be suitable for many scenarios.
InSAR is inherently a relative measurement process though, so that InSAR derived DEMs are always relative to a reference point. This usually requires the installation of a ground-control point to transform the relative DEM to an absolute DEM.
SAR geodesy offers a way to generate precise “ground-control points” from SAR data, using an additional image acquired in a stereo-configuration. This allows the precise generation of reference points in decimeter, or if processed even more precisely, in centimeter precision. This very high absolute positioning precision is a unique feature of SAR geodesy and invaluable for many applications.
With the foreseeable rising number of bi-static and multi-static SAR systems, an increase in available bi- and multi-static data is to be expected. Such data offer new opportunities, for example, in the estimation of surface deformations with SAR. However, as we showed in our research, the standard PSI approaches need to be adjusted to deal with the special properties of such data. This is possible though and can drastically improve the processing in dense urban areas especially in areas with many high-rise buildings [28,29,30]. Even more, we believe that, in future research, more approaches to make full use of the available data from bi- or multi-static images for surface motion estimation will be developed.
For what concerns InSAR with decorrelating targets, the following conclusions are drawn. First, joint exploitation of DS and PS targets for time series InSAR analysis can largely mitigate the problem of insufficient measurement points in natural environment. In this way, the quality of InSAR results can be improved significantly. Second, with the deformation measurements derived by the refined InSAR analysis, we can determine the landslide boundary and characterize the spatial–temporal pattern of landslide surface deformation more accurately. What is more, we can efficiently identify potential landslide hazards in active deformation from the InSAR results, which may provide key information to support disaster prevention and early warning across wide areas. Thirdly, using available archived satellite SAR data stacks, we can reconstruct the evolution life cycle of an active landslide, such as the Sunkoshi landslide in North Nepal. With the increasingly accumulated InSAR observations collected by satellites such as Sentinel-1, it is possible to implement continuous and periodic deformation monitoring to facilitate geohazard risk management.
For what concerns tomographic imaging and ground cancellation, the following conclusions are drawn. Results from TropiSCAT clearly indicate that canopy scattering is more stable than ground scattering level, consistently with the physical explanation that ground scattering is more affected by changing moisture conditions. Based on previous studies at the same test-site, the observed variation of 1–1.5 dB in the 7-day tomograms would entail a biomass retrieval error of around 50–80 t/ha, which is on the order of about 20% or better. The analysis of ground-canceled images was particularly relevant as directly linked to AGB retrieval algorithms to be implemented for the BIOMASS Mission. In accordance with theoretical models, experiments indicate that temporal decorrelation mostly affects scarcely vegetated areas, whereas in high biomass regions levels the radiometric error is limited to within 1 dB. Overall, these results support the feasibility of extracting accurate biophysical information from repeat-pass BIOMASS data, concerning both the tomographic and the interferometric phase of the Mission [12].
The research on temporal effects was not limited to a quantification of the resulting errors; it also included extending experiments of previously developed signal processing methods based on the Differential Tomography framework to compensate for such effects. The results from P-Band BioSAR 1 data clearly indicate that in particular fully model-based Differential Tomography [46,47] can be effective in sensibly compensating long-term decorrelation blurring effects in the vertical image reconstruction. It is worth noting, however, that this interesting and potentially fruitful functionality of discrimination and thus mitigation of temporal decorrelation in the tomographic imaging and information extraction is related to the availability of a sparse (non-linear) baseline-time acquisition pattern, that is not currently planned for the BIOMASS mission. A straightforward implication of these results would be thus considering the opportunity for further characterization of the technique, and its engineering, in the context of follow-on or future ESA projects for low-frequency SAR missions, in particular, but not limited to, BIOMASS and ROSE-L, in parallel to possible planning of experimental tomographic mission phases with non-linear and usefully non-monotonic baseline-time sampling.
As for forest-height retrieval, results indicate that the best approach could result from a joint use of non-parametric and parametric methods, to merge the capability of model-based retrieval to work without requiring parameter tuning and the computational efficiency and accuracy of SAR tomography [69].
The work on AlpTomoSAR data fully demonstrates that the quality of a tomographic airborne survey is not limited in any sense by platform stability during the acquisition, under the condition that tomographic processing is correctly implemented, therefore supporting the possibility of tomographic imaging by using small satellite formation [71].
The research from Subproject 3 considered the potential of daily DEM generation from using geosynchronous SAR sensors, addressing the role of spatial baselines and inclination angles, and introduced new methods for atmospheric correction and surface deformation modeling that allow for improved performance while using the available space-borne data. The research finally considered the case of terrestrial radar interferometry, demonstrating the potential for accurate monitoring of bridges with unprecedented spatial and temporal resolutions.
Author Contributions
All authors equally contributed to providing and presenting the material of this paper. All authors have read and agreed to the published version of the manuscript.
Funding
This research was partly funded by the European Space Agency under Contract No. No. 4000122774/17/I-NB.
Institutional Review Board Statement
Not applicable.
Informed Consent Statement
Not applicable.
Data Availability Statement
All campaign data are available through ESA.
Acknowledgments
The authors wish to heartedly acknowledge ESA and the Ministry of Science and Technology (MOST) of the P.R. China for giving birth to Dragon-4. This work is the result of the work by many European and Chinese Young Scientists, whom we warmly thank for their enthusiasm over these four years.
Conflicts of Interest
The authors declare no conflict of interest.
References
- Eineder, M.; Minet, C.; Steigenberger, P.; Cong, X.; Fritz, T. Imaging Geodesy—Toward Centimeter-Level Ranging Accuracy with TerraSAR-X. IEEE Trans. Geosci. Remote Sens. 2011, 49, 661–671. [Google Scholar] [CrossRef]
- Ao, M.; Zhang, L.; Dong, Y.; Su, L.; Shi, X.; Balz, T.; Liao, M. Characterizing the evolution life cycle of the Sunkoshi landslide in Nepal with multi-source SAR data. Sci. Rep. 2020, 10, 19788. [Google Scholar] [CrossRef]
- Di Lazzaro, M.; Piemontese, M.; Capuzi, A.; Leonardi, R. COSMO-SkyMed: The Dual-Use Component of a Geospatial System for Environment and Security. In Proceedings of the 2008 IEEE Aerospace Conference, Big Sky, MT, USA, 1–8 March 2008. [Google Scholar]
- Eineder, M.; Moreira, A.; Roth, A. Ten Years of TerraSAR-X—Scientific Results. Remote Sens. 2019, 11, 364. [Google Scholar] [CrossRef] [Green Version]
- Snoeij, P.; Attema, E.; Davidson, M.; Duesmann, B.; Floury, N.; Levrini, G.; Rommen, B.; Rosich, B. Sentinel-1 radar mission: Status and performance. IEEE Aerosp. Electron. Syst. Mag. 2010, 25, 32–39. [Google Scholar] [CrossRef]
- Quegan, S.; Le Toan, T.; Chave, J.; Dall, J.; Exbrayat, J.F.; Minh, D.H.T.; Lomas, M.; D’Alessandro, M.M.; Paillou, P.; Papathanassiou, K.; et al. The European Space Agency BIOMASS mission: Measuring forest above-ground biomass from space. Remote Sens. Environ. 2019, 227, 44–60. [Google Scholar] [CrossRef] [Green Version]
- Torres, R.; Davidson, M.; Geudtner, D. Copernicus Sentinel Mission at C- and L-Band: Current Status and Future Perspectives. In Proceedings of the IGARSS 2020—2020 IEEE International Geoscience and Remote Sensing Symposium, Waikoloa, HI, USA, 26 September–2 October 2020; pp. 4055–4058. [Google Scholar] [CrossRef]
- Farr, T.G.; Rosen, P.A.; Caro, E.; Crippen, R.; Duren, R.; Hensley, S.; Seal, D. The Shuttle Radar Topography Mission. Rev. Geophys. 2007, 45, RG2004. [Google Scholar] [CrossRef] [Green Version]
- Rizzoli, P.; Martone, M.; Gonzalez, C.; Wecklich, C.; Tridon, D.B.; Bräutigam, B.; Bachmann, M.; Schulze, D.; Fritz, T.; Huber, M.; et al. Generation and performance assessment of the global TanDEM-X digital elevation model. ISPRS J. Photogramm. Remote Sens. 2017, 132, 119–139. [Google Scholar] [CrossRef] [Green Version]
- Domik, G.; Leberl, F.; Cimino, J. Multiple Incidence Angle SIR-B Experiment Over Argentina: Generation of Secondary Image Products. IEEE Trans. Geosci. Remote Sens. 1986, GE-24, 492–497. [Google Scholar] [CrossRef]
- Perko, R.; Gutjahr, K.; Kruger, M.; Raggam, H.; Schardt, M. DEM-based epipolar rectification for optimized radargrammetry. In Proceedings of the 2017 IEEE International Geoscience and Remote Sensing Symposium (IGARSS), Fort Worth, TX, USA, 23–28 July 2017; pp. 969–972. [Google Scholar] [CrossRef]
- Wang, J.; Balz, T.; Liao, M. Absolute geolocation accuracy of high-resolution spotlight TerraSAR-X imagery—Validation in Wuhan. Geo-Spat. Inf. Sci. 2016, 19, 267–272. [Google Scholar] [CrossRef] [Green Version]
- Wang, Z.; Balz, T.; Zhang, L.; Perissin, D.; Liao, M. Using TSX/TDX Pursuit Monostatic SAR Stacks for PS-InSAR Analysis in Urban Areas. Remote Sens. 2019, 11, 26. [Google Scholar] [CrossRef] [Green Version]
- Cong, X.; Balss, U.; Eineder, M.; Fritz, T. Imaging Geodesy—Centimeter-Level Ranging Accuracy with TerraSAR-X: An Update. IEEE Geosci. Remote Sens. Lett. 2012, 9, 948–952. [Google Scholar] [CrossRef] [Green Version]
- Dong, Y.; Zhang, L.; Jiang, H.; Balz, T.; Liao, M. Cascaded multi-baseline interferometry with bistatic TerraSAR-X/TanDEM-X observations for DEM generation. ISPRS J. Photogramm. Remote Sens. 2021, 171, 224–237. [Google Scholar] [CrossRef]
- Dong, Y.; Zhang, L.; Balz, T.; Luo, H.; Liao, M. Radargrammetric DSM generation in mountainous areas through adaptive-window least squares matching constrained by enhanced epipolar geometry. ISPRS J. Photogramm. Remote Sens. 2018, 137, 61–72. [Google Scholar] [CrossRef]
- Qin, X.; Ding, X.; Liao, M.; Zhang, L.; Wang, C. A bridge-tailored multi-temporal DInSAR approach for remote exploration of deformation characteristics and mechanisms of complexly structured bridges. ISPRS J. Photogramm. Remote Sens. 2019, 156, 27–50. [Google Scholar] [CrossRef]
- Qin, X.; Zhang, L.; Yang, M.; Luo, H.; Liao, M.; Ding, X. Mapping surface deformation and thermal dilation of arch bridges by structure-driven multi-temporal DInSAR analysis. Remote Sens. Environ. 2018, 216, 71–90. [Google Scholar] [CrossRef]
- Qin, X.; Zhang, L.; Ding, X.; Liao, M.; Yang, M. Mapping and Characterizing Thermal Dilation of Civil Infrastructures with Multi-Temporal X-Band Synthetic Aperture Radar Interferometry. Remote Sens. 2018, 10, 941. [Google Scholar] [CrossRef] [Green Version]
- Qin, X.; Liao, M.; Zhang, L.; Yang, M. Structural Health and Stability Assessment of High-Speed Railways via Thermal Dilation Mapping with Time-Series InSAR Analysis. IEEE J. Sel. Top. Appl. Earth Obs. Remote Sens. 2017, 10, 2999–3010. [Google Scholar] [CrossRef] [Green Version]
- Dong, J.; Zhang, L.; Tang, M.; Liao, M.; Xu, Q.; Gong, J.; Ao, M. Mapping landslide surface displacements with time series SAR interferometry by combining persistent and distributed scatterers: A case study of Jiaju landslide in Danba, China. Remote Sens. Environ. 2018, 205, 180–198. [Google Scholar] [CrossRef]
- Dong, J.; Liao, M.; Xu, Q.; Zhang, L.; Tang, M.; Gong, J. Detection and displacement characterization of landslides using multi-temporal satellite SAR interferometry: A case study of Danba County in the Dadu River Basin. Eng. Geol. 2018, 240, 95–109. [Google Scholar] [CrossRef]
- Dong, J.; Zhang, L.; Liao, M.; Gong, J. Improved correction of seasonal tropospheric delay in InSAR observations for landslide deformation monitoring. Remote Sens. Environ. 2019, 233, 111370. [Google Scholar] [CrossRef]
- Li, M.; Zhang, L.; Shi, X.; Liao, M.; Yang, M. Monitoring active motion of the Guobu landslide near the Laxiwa Hydropower Station in China by time-series point-like targets offset tracking. Remote Sens. Environ. 2019, 221, 80–93. [Google Scholar] [CrossRef]
- Reigber, A.; Moreira, A. First demonstration of airborne SAR tomography using multibaseline L-band data. IEEE Trans. Geosci. Remote Sens. 2000, 38, 2142–2152. [Google Scholar] [CrossRef]
- Gini, F.; Lombardini, F.; Montanari, M. Layover solution in multibaseline SAR interferometry, Aerospace and Electronic Systems. IEEE Trans. Geosci. Remote Sens. 2002, 38, 1344–1356. [Google Scholar]
- Lombardini, F.; Montanari, M.; Gini, F. Reflectivity estimation for multibaseline interferometric radar imaging of layover extended sources. IEEE Trans. Signal Process. 2003, 51, 1508–1519. [Google Scholar] [CrossRef]
- Lombardini, F.; Pardini, M. Superresolution Differential Tomography: Experiments on Identification of Multiple Scatterers in Spaceborne SAR Data. IEEE Trans. Geosci. Remote Sens. 2012, 50, 1117–1129. [Google Scholar] [CrossRef]
- Lombardini, F.; Viviani, F. Single-Look Light-Burden Superresolution Differential SAR Tomography. IET Electron. Lett. 2016, 52, 557–558. [Google Scholar] [CrossRef]
- Reale, D.; Fornaro, G.; Pauciullo, A.; Zhu, X.X.; Bamler, R. Tomographic Imaging and Monitoring of Buildings with Very High Resolution SAR Data. IEEE Geosci. Remote Sens. Lett. 2011, 8, 661–665. [Google Scholar] [CrossRef] [Green Version]
- Blomberg, E.; Ferro-Famil, L.; Soja, M.J.; Ulander, L.M.H.; Tebaldini, S. Forest Biomass Retrieval from L-Band SAR Using Tomographic Ground Backscatter Removal. IEEE Geosci. Remote Sens. Lett. 2018, 15, 1030–1034. [Google Scholar] [CrossRef]
- Blomberg, E.; Ulander, L.M.H.; Tebaldini, S.; Ferro-Famil, L. Evaluating P-Band TomoSAR for Biomass Retrieval in Boreal Forest. IEEE Trans. Geosci. Remote Sens. 2020, 59, 3793–3804. [Google Scholar] [CrossRef]
- Dubois-Fernandez, P.; Dupuis, X.; Capdessus, P.; Baque, R. Preliminary results of the AfriSAR campaign. In Proceedings of the EUSAR 2016: 11th European Conference on Synthetic Aperture Radar, Hamburg, Germany, 6–9 June 2016; pp. 1–3. [Google Scholar]
- Fornaro, G.; Lombardini, F.; Pauciullo, A.; Reale, D.; Viviani, F. Tomographic Processing of Interferometric SAR Data: Developments, applications, and future research perspectives. IEEE Signal Process. Mag. 2014, 31, 41–50. [Google Scholar] [CrossRef]
- Frey, O.; Meier, E. Analyzing Tomographic SAR Data of a Forest with Respect to Frequency, Polarization, and Focusing Technique. IEEE Trans. Geosci. Remote Sens. 2011, 49, 3648–3659. [Google Scholar] [CrossRef] [Green Version]
- Frey, O.; Magnard, C.; Ruegg, M.; Meier, E. Focusing of Airborne Synthetic Aperture Radar Data from Highly Nonlinear Flight Tracks. IEEE Trans. Geosci. Remote Sens. 2009, 47, 1844–1858. [Google Scholar] [CrossRef] [Green Version]
- Gebert, N.; Carnicero Dominguez, B.; Davidson, M.W.J.; Diaz Martin, M.; Silvestrin, P. SAOCOM-CS—A passive companion to SAOCOM for single-pass L-band SAR interferometry. In Proceedings of the EUSAR 2014—10th European Conference on Synthetic Aperture Radar, Berlin, Germany, 3–5 June 2014; pp. 1–4. [Google Scholar]
- Dinh, H.T.M.; Tebaldini, S.; Rocca, F.; Koleck, T.; Borderies, P.; Albinet, C.; Villard, L.; Hamadi, A.; Le Toan, T. Ground-Based Array for Tomographic Imaging of the Tropical Forest in P-Band. IEEE Trans. Geosci. Remote Sens. 2013, 51, 4460–4472. [Google Scholar] [CrossRef]
- Minh, D.H.T.; Le Toan, T.; Rocca, F.; Tebaldini, S.; D’Alessandro, M.M.; Villard, L. Relating P-Band Synthetic Aperture Radar Tomography to Tropical Forest Biomass. IEEE Trans. Geosci. Remote Sens. 2014, 52, 967–979. [Google Scholar] [CrossRef]
- Minh, D.H.T.; Le Toan, T.; Rocca, F.; Tebaldini, S.; Villard, L.; Réjou-Méchain, M.; Phillips, O.; Feldpausch, T.R.; Dubois-Fernandez, P.; Scipal, K.; et al. SAR tomography for the retrieval of forest biomass and height: Cross-validation at two tropical forest sites in French Guiana. Remote Sens. Environ. 2016, 175, 138–147. [Google Scholar] [CrossRef] [Green Version]
- Huang, Y.; Levy-Vehel, J.; Ferro-Famil, L.; Reigber, A. Three-Dimensional Imaging of Objects Concealed Below a Forest Canopy Using SAR Tomography at L-Band and Wavelet-Based Sparse Estimation. IEEE Geosci. Remote Sens. Lett. 2017, 14, 1454–1458. [Google Scholar] [CrossRef]
- LaValle, M.; Hawkins, B.; Hensley, S. Tomographic imaging with UAVSAR: Current status and new results from the 2016 AfriSAR campaign. In Proceedings of the 2017 IEEE International Geoscience and Remote Sensing Symposium (IGARSS), Fort Worth, TX, USA, 23–28 July 2017. [Google Scholar]
- Lombardini, F. Differential tomography: A new framework for SAR interferometry. IEEE Trans. Geosci. Remote Sens. 2005, 43, 37–44. [Google Scholar] [CrossRef]
- Lombardini, F.; Pardini, M. Experiments of Tomography-based SAR Techniques with P-band Polarimetric Data. In Proceedings of the ESA International Workshop on Polarimetry and Polarimetric Interferometry (PolInSAR 2009), Frascati, Italy, 26–30 January 2009. [Google Scholar]
- Lombardini, F.; Cai, F.; Viviani, F.; Pasculli, D. Multidimensional SAR Tomography for Complex Non-Stationary Scenes: COSMO-SkyMed Urban and P-Band Forest Results. In Proceedings of the IEEE International Geoscience and Remote Sensing Symposium (IGARSS 2012), Munich, Germany, 22–27 July 2012; pp. 5206–5209. [Google Scholar]
- Lombardini, F.; Cai, F. New differential SAR tomography functionalities for probing 3D forest structure and dynamic processes. In Proceedings of the 2011 IEEE International Geoscience and Remote Sensing Symposium (IGARSS 2011), Vancouver, BC, Canada, 24–29 July 2011; pp. 2413–2415. [Google Scholar] [CrossRef]
- Lombardini, F.; Cai, F. Temporal Decorrelation-Robust SAR Tomography. IEEE Trans. Geosci. Remote Sens. 2014, 52, 5412–5421. [Google Scholar] [CrossRef]
- Lombardini, F.; Vinciguerra, A.; Zoppetti, C. Radiometric Problems in Superresolution 3D Forest SAR Tomography. In Proceedings of the ESA-MOST China Dragon Cooperation 2018 Dragon 4 Symposium, Xian, China, June 2018. [Google Scholar]
- Lombardini, F.; Cai, F. Generalized-Capon Method for Diff-Tomo SAR Analyses of Decorrelating Scatterers. Remote Sens. 2019, 11, 412. [Google Scholar] [CrossRef] [Green Version]
- Lombardini, F.; Bordbari, R.; Vinciguerra, A. Information Extraction in Decorrelating Forest Layers: Generalized-Capon Diff-Tomo. In Proceedings of the ESA-MOST China Dragon Cooperation 2019 Dragon 4 Symposium, Ljubljana, Slovenia, 24–28 June 2019. [Google Scholar]
- D’Alessandro, M.M.; Tebaldini, S. Phenomenology of P-Band Scattering from a Tropical Forest Through Three-Dimensional SAR Tomography. IEEE Geosci. Remote Sens. Lett. 2012, 9, 442–446. [Google Scholar] [CrossRef]
- D’Alessandro, M.M.; Tebaldini, S.; Rocca, F. Phenomenology of ground scattering in a tropical forest through polarimetric synthetic aperture radar tomography. IEEE Trans. Geosci. Remote Sens. 2013, 51, 4430–4437. [Google Scholar] [CrossRef]
- D’Alessandro, M.M.; Tebaldini, S. Retrieval of Terrain Topography in Tropical Forests Using P-Band Sar Tomography. In Proceedings of the IGARSS 2018—2018 IEEE International Geoscience and Remote Sensing Symposium, Valencia, Spain, 22–27 July 2018. [Google Scholar]
- D’Alessandro, M.M.; Tebaldini, S. Digital Terrain Model Retrieval in Tropical Forests through P-Band SAR Tomography. IEEE Trans. Geosci. Remote Sens. 2019, 57, 6774–6781. [Google Scholar] [CrossRef]
- D’Alessandro, M.M.; Bai, Y.; Tebaldini, S. Temporal Stability of Ground Notched Images. In Proceedings of the IGARSS 2019—2019 IEEE International Geoscience and Remote Sensing Symposium, Yokohama, Japan, 28 July–2 August 2019; pp. 2387–2390. [Google Scholar] [CrossRef]
- Moreira, A.; Krieger, G.; Hajnsek, I.; Papathanassiou, K.; Younis, M.; Lopez-Dekker, P.; Huber, S.; Villano, M.; Pardini, M.; Eineder, M.; et al. Tandem-L: A Highly Innovative Bistatic SAR Mission for Global Observation of Dynamic Processes on the Earth’s Surface. IEEE Geosci. Remote Sens. Mag. 2015, 3, 8–23. [Google Scholar] [CrossRef]
- Pardini, M.; Cantini, A.; Lombardini, F.; Papathanassiou, K. 3-D Structure of Forests: First Analysis of Tomogram Changes Due to Weather and Seasonal Effects at L-Band. In Proceedings of the EUSAR 2014—10th European Conference on Synthetic Aperture Radar, Berlin, Germany, 6 March–6 May 2014; pp. 1–4. [Google Scholar]
- Pardini, M.; Papathanassiou, K. On the Estimation of Ground and Volume Polarimetric Covariances in Forest Scenarios with SAR Tomography. IEEE Geosci. Remote Sens. Lett. 2017, 14, 1860–1864. [Google Scholar] [CrossRef] [Green Version]
- Pardini, M.; Papathanassiou, K.P.; Lombardini, F. Impact of Dielectric Changes on L-Band 3-D SAR Reflectivity Profiles of Forest Volumes. IEEE Trans. Geosci. Remote Sens. 2018, 56, 7324–7337. [Google Scholar] [CrossRef]
- Pardini, M.; Tello, M.; Cazcarra-Bes, V.; Papathanassiou, K.P.; Hajnsek, I. L- and P-Band 3-D SAR Reflectivity Profiles Versus Lidar Waveforms: The AfriSAR Case. IEEE J. Sel. Top. Appl. Earth Obs. Remote Sens. 2018, 11, 3386–3401. [Google Scholar] [CrossRef]
- Ponce, O.; Prats-Iraola, P.; Scheiber, R.; Reigber, A.; Moreira, A.; Aguilera, E. Polarimetric 3-D Reconstruction from Multicircular SAR at P-Band. IEEE Geosci. Remote Sens. Lett. 2014, 11, 803–807. [Google Scholar] [CrossRef]
- Rekioua, B.; Davy, M.; Ferro-Famil, L.; Tebaldini, S. Snowpack permittivity profile retrieval from tomographic SAR data. Comptes Rendus Phys. 2017, 18, 57–65. [Google Scholar] [CrossRef]
- Tebaldini, S.; Rocca, F. Multibaseline Polarimetric SAR Tomography of a Boreal Forest at P- and L-Bands. IEEE Trans. Geosci. Remote Sens. 2012, 50, 232–246. [Google Scholar] [CrossRef]
- Tebaldini, S.; Rocca, F.; D’Alessandro, M.M.; Ferro-Famil, L. Phase calibration of airborne tomographic SAR data via phase center double localization. IEEE Trans. Geosci. Remote Sens. 2016, 54, 1775–1792. [Google Scholar] [CrossRef]
- Tebaldini, S.; Nagler, T.; Rott, H.; Heilig, A. Imaging the Internal Structure of an Alpine Glacier via L-Band Airborne SAR Tomography. IEEE Trans. Geosci. Remote Sens. 2016, 54, 7197–7209. [Google Scholar] [CrossRef]
- Caicoya, A.T.; Pardini, M.; Hajnsek, I.; Papathanassiou, K. Forest Above-Ground Biomass Estimation from Vertical Reflectivity Profiles at L-Band. IEEE Geosci. Remote Sens. Lett. 2015, 12, 2379–2383. [Google Scholar] [CrossRef]
- Wasik, V.; Dubois-Fernandez, P.C.; Taillandier, C.; Saatchi, S.S. The AfriSAR Campaign: Tomographic Analysis with Phase-Screen Correction for P-Band Acquisitions. IEEE J. Sel. Top. Appl. Earth Obs. Remote Sens. 2018, 11, 3492–3504. [Google Scholar] [CrossRef] [Green Version]
- Yitayew, T.G.; Ferro-Famil, L.; Eltoft, T.; Tebaldini, S. Lake and Fjord Ice Imaging Using a Multifrequency Ground-Based Tomographic SAR System. IEEE J. Sel. Top. Appl. Earth Obs. Remote Sens. 2017, 10, 4457–4468. [Google Scholar] [CrossRef]
- Yang, X.; Tebaldini, S.; D’Alessandro, M.M.; Liao, M. Tropical Forest Height Retrieval Based on P-Band Multibaseline SAR Data. IEEE Geosci. Remote Sens. Lett. 2020, 17, 451–455. [Google Scholar] [CrossRef]
- Bai, Y.; Tebaldini, S.; Minh, D.H.T.; Yang, W. An Empirical Study on the Impact of Changing Weather Conditions on Repeat-Pass SAR Tomography. IEEE J. Sel. Top. Appl. Earth Obs. Remote Sens. 2018, 11, 3505–3511. [Google Scholar] [CrossRef]
- Yu, Y.; D’Alessandro, M.M.; Tebaldini, S.; Liao, M. Signal Processing Options for High Resolution SAR Tomography of Natural Scenarios. Remote Sens. 2020, 12, 1638. [Google Scholar] [CrossRef]
- Yang, Z.; Zhang, Q.; Ding, X.; Chen, W. Analysis of the Quality of Daily DEM Generation with Geosynchronous InSAR. Engineering 2020, 6, 913–918. [Google Scholar] [CrossRef]
- Liang, H.; Zhang, L.; Ding, X.; Lu, Z.; Li, X. Toward Mitigating Stratified Tropospheric Delays in Multitemporal InSAR: A Quadtree Aided Joint Model. IEEE Trans. Geosci. Remote Sens. 2018, 57, 291–303. [Google Scholar] [CrossRef]
- Zhang, B.; Ding, X.; Zhu, W.; Wang, C.; Zhang, L.; Liu, Z. Mitigating Ionospheric Artifacts in Coseismic Interferogram Based on Offset Field Derived from ALOS-PALSAR Data. IEEE J. Sel. Top. Appl. Earth Obs. Remote Sens. 2016. [Google Scholar] [CrossRef]
- Hirschmüller, H. Stereo Vision in Structured Environments by Consistent Semi-Global Matching. In Proceedings of the 2006 IEEE Computer Society Conference on Computer Vision and Pattern Recognition, New York, NY, USA, 17–22 June 2006. [Google Scholar]
- Hirschmüller, H. Stereo Processing by Semi-Global Matching and Mutual Information. IEEE Trans. Pattern Anal. Mach. Intell. 2008, 30, 328–341. [Google Scholar] [CrossRef] [PubMed]
- Ferretti, A.; Fumagalli, A.; Novali, F.; Prati, C.; Rocca, F.; Rucci, A. A New Algorithm for Processing Interferometric Data-Stacks: SqueeSAR. IEEE Trans. Geosci. Remote Sens. 2011, 49, 3460–3470. [Google Scholar] [CrossRef]
- Guccione, P.; Monti-Guarnieri, A.V.; Tebaldini, S. Stable Target Detection and Coherence Estimation in Interferometric SAR Stacks. IEEE Trans. Geosci. Remote Sens. 2012, 50, 3171–3178. [Google Scholar] [CrossRef]
- Dong, J.; Liao, M.; Zhang, L.; Gong, J. A Unified Approach of Multitemporal SAR Data Filtering Through Adaptive Estimation of Complex Covariance Matrix. IEEE Trans. Geosci. Remote Sens. 2018, 56, 5320–5333. [Google Scholar] [CrossRef]
- Monti-Guarnieri, A.V.; Tebaldini, S. On the Exploitation of Target Statistics for SAR Interferometry Applications. IEEE Trans. Geosci. Remote Sens. 2008, 46, 3436–3443. [Google Scholar] [CrossRef]
- D’Alessandro, M.M.; Tebaldini, S.; Quegan, S.; Soja, M.J.; Ulander, L.M.H.; Scipal, K. Interferometric Ground Cancellation for Above Ground Biomass Estimation. IEEE Trans. Geosci. Remote Sens. 2020, 58, 6410–6419. [Google Scholar] [CrossRef]
- Soja, M.; Quegan, S.; d’Alessandro, M.M.; Banda, F.; Scipal, K.; Tebaldini, S.; Ulander, L.M.H. Mapping above-ground biomass in tropical forests with ground-cancelled P-band SAR and limited reference data. Remote Sens. Environ. 2021, 253, 112153. [Google Scholar] [CrossRef]
- Hu, J.; Ding, X.-L.; Zhang, L.; Sun, Q.; Li, Z.-W.; Zhu, J.-J.; Lu, Z. Estimation of 3-D Surface Displacement Based on InSAR and Deformation Modeling. IEEE Trans. Geosci. Remote Sens. 2017, 55, 2007–2016. [Google Scholar] [CrossRef]
- Zhang, B.; Ding, X.; Werner, C.; Tan, K.; Zhang, B.; Jiang, M.; Zhao, J.; Xu, Y. Dynamic displacement monitoring of long-span bridges with a microwave radar interferometer. ISPRS J. Photogramm. Remote Sens. 2018, 138, 252–264. [Google Scholar] [CrossRef]
Publisher’s Note: MDPI stays neutral with regard to jurisdictional claims in published maps and institutional affiliations. |
© 2021 by the authors. Licensee MDPI, Basel, Switzerland. This article is an open access article distributed under the terms and conditions of the Creative Commons Attribution (CC BY) license (https://creativecommons.org/licenses/by/4.0/).