Article

A Wide Area Multiview Static Crowd Estimation System Using UAV and 3D Training Simulator

Department of Computer Science, Aberystwyth University, Aberystwyth SY23 3DB, UK
*
Author to whom correspondence should be addressed.
S.S. wrote the software, conducted the experiments and wrote the paper. B.T. and H.C.M. advised and supervised S.S., helped with the experimental design, and proof read the paper.
Remote Sens. 2021, 13(14), 2780; https://doi.org/10.3390/rs13142780
Submission received: 28 May 2021 / Revised: 30 June 2021 / Accepted: 9 July 2021 / Published: 15 July 2021
(This article belongs to the Special Issue Advances in Object and Activity Detection in Remote Sensing Imagery)

Abstract

:
Crowd size estimation is a challenging problem, especially when the crowd is spread over a significant geographical area. It has applications in monitoring of rallies and demonstrations and in calculating the assistance requirements in humanitarian disasters. Therefore, accomplishing a crowd surveillance system for large crowds constitutes a significant issue. UAV-based techniques are an appealing choice for crowd estimation over a large region, but they present a variety of interesting challenges, such as integrating per-frame estimates through a video without counting individuals twice. Large quantities of annotated training data are required to design, train, and test such a system. In this paper, we have first reviewed several crowd estimation techniques, existing crowd simulators and data sets available for crowd analysis. Later, we have described a simulation system to provide such data, avoiding the need for tedious and error-prone manual annotation. Then, we have evaluated synthetic video from the simulator using various existing single-frame crowd estimation techniques. Our findings show that the simulated data can be used to train and test crowd estimation, thereby providing a suitable platform to develop such techniques. We also propose an automated UAV-based 3D crowd estimation system that can be used for approximately static or slow-moving crowds, such as public events, political rallies, and natural or man-made disasters. We evaluate the results by applying our new framework to a variety of scenarios with varying crowd sizes. The proposed system gives promising results using widely accepted metrics including MAE, RMSE, Precision, Recall, and F1 score to validate the results.

1. Introduction

Crowd estimation refers to the practice of calculating the total number of people present in a crowd. Manual crowd estimation and automated crowd estimation are the two most common broad approaches to measuring crowd size, but the method varies according to the crowd size. Manually monitoring and estimating a small crowd by splitting people into groups is a traditional way that still exists. However, manual estimation of a large crowd is not possible and may be very expensive and time-consuming. It has prompted scientists and researchers from various disciplines across the globe to develop automated crowd estimation systems that calculate the number of people in a large crowd. In the last five years, the domain has expanded rapidly. The introduction of deep learning methods, coupled with easy availability of powerful GPU based systems, has provided a step change in computer vision algorithms across a range of problem domains, starting with classification, but it has quickly moved on to other areas such as crowd estimation. A number of well-publicized crowd-related incidents and gatherings have drawn the attention of researchers and the computer vision community; it has prompted them to develop accurate crowd surveillance systems.
An example application is for use in major disasters. In such a scenario, a crowd estimation system would give a more accurate picture of the crowd and number of affected people and their geographical spread. This would enable proper coordination of the disaster teams, leading to more efficient relief-aid work.
Crowd estimation systems using Unmanned Aerial Vehicles (UAVs) is an emerging research area, due to its potential to cover a wide area in a short period. However, it presents automated estimation issues. Both the camera and the crowd are likely to be moving, so there is a risk of multiple counting of the same person. Most of the existing automated methods focus on individual frames from a single static camera. Recently, there has been some promising research conducted in multiple view systems and UAV-based cameras. UAVs can cover a large area. However, they pose problems of (1) a moving camera, (2) the crowd that may move during the capture time and (3) different view points which require extensive additional training and testing data.
Given the challenges of gathering and annotating data, our paper explores the use of a simulator to generate the training images and annotated ground-truth data. Furthermore, we have introduced a novel automated 3D crowd estimation system using a UAV, that was trained and tested with our simulator. In the initial phase, we have focused on the problem of static crowds and intend to move towards more dynamic crowds in the future. The motivation for developing our system is for crowd flow management, large-scale public gathering monitoring, public event security and relief-aid work by welfare organisations in disaster-hit areas.
This paper covers the following contributions:
  • We have extensively studied the existing crowd estimation methods, data sets, and open-source crowd simulators, along with an assessment of their shortcomings. We have focused on the intended use to identify the need to develop a new simulator for estimating the crowd using UAV.
  • We have explored in detail the development of a new 3D crowd simulation system that can generate the required training images and annotated ground truth data. Furthermore, we have generated various 3D models along with accompanying camera locations and orientations.
  • We have trained, tested and validated the simulation system against real-crowd data, where we have tested synthetic data against real crowd data sets using various state-of-the-art methods. Furthermore, we have trained a new model based on our aerial synthetic data and tested it against the real-crowd data.
  • We have introduced a novel 3D crowd estimation technique using UAV for a robust and accurate estimation of a crowd spread over a large geographical area. Our proposed solution overcomes the issue of counting of the same individual multiple times from a moving UAV.
  • We also discuss the remaining challenges for wide area crowd estimation and suggest future directions for research. Additionally, we have covered significant issues for aerial crowd data collection and have put across some promising research challenges that needs to be explored.
The remainder of this paper is organized as follows:
Section 2 provides an up-to-date review of the most relevant recent literature including recently introduced crowd estimation methods. Section 3 provides a detailed step-by-step discussion of our approach and describes the benchmarks used for evaluation. In Section 4, we discuss the implementation and setup of our system. In Section 5, we present and analyze the results of our experimental evaluation of the system. The work presented in the paper is summarized and the results and their interpretation have been discussed in Section 6. Finally, we discuss the conclusion and future directions in Section 7.

2. Related Work and Scope

2.1. Manual Crowd Estimation

In 1967, Herbert Jacobs [1], a professor at the University of California, Berkeley, proposed a simple method of dealing with scenarios where estimating the crowd size is not as easy as counting the number of tickets sold. His office looked out onto the plaza where students assembled to protest the Vietnam War. The concrete on this plaza was divided into grids. Jacobs used the layout to develop his method for estimating crowd size based on area times density. As he observed numerous demonstrations, Jacobs gathered plenty of information that led him to come up with a few basic rules of thumb, which are still used today. According to Jacobs, in a loose crowd, where the distance between each person is about one arm’s length, one person would occupy 10 square feet of space. People occupy 4.5 square feet for a dense crowd, and 2.5 square feet for a mosh-pit density crowd.
In other words, if you knew the area that the crowd was covering and you applied Jacob’s rule of thumb for the density of the crowd, you could easily estimate the size of the crowd by multiplying the area by density. In practice, however, it is not always easy to determine the specific area crowds cover, and densities may vary across a crowd. Suppose a crowd has gathered to hear a speaker up on a stage. We might predict that the crowd would be denser up front and less dense during the back and around the edges. To address these problems, it may be helpful to divide the crowds into low, medium, and high density zones and collect samples from each. The sample method would allow us to obtain a more reliable representation of the crowd area and density along with an estimate of standard error for both. We can use the delta rule to find the relative standard error for our estimation of the crowd size, if we have the standard errors for area and density and assume they are at least roughly independent.
Manually detecting the development and movement of a crowd around the clock, or manually counting persons in exceptionally dense crowds, is a time-consuming process. When it comes to static linear and static nonlinear events, where the entire crowd is present at the same time in a single-session event, such as a Christmas Parade or a Pride Parade, there is a higher chance of getting a false estimate due to a shift in the crowd and counting the same person multiple times. Manual crowd estimating techniques like Jacob’s Crowd Formula (JCF) are inefficient in dealing with such a large flow of crowd, these methods are confined to finding the average of the overlapped or shifting crowd sizes. Thus, it is very likely to estimate a larger crowd size than expected that would result in a crowd count with an unknown error rate. Considering the challenging situations such as dynamic linear or dynamic nonlinear events, it is extremely difficult to count and maintain an accurate estimate as these events often have free-flowing crowds with various entry points and can be stretched across several sessions or days. These methods are suitable for estimating the maximum crowd capacity in an area, but when it comes to accurate estimation, there is a need to develop automatic crowd estimation methods.

2.2. Computer Vision for Crowd Estimation and Analysis

Computer vision-based crowd estimation has gained considerable attention in various aspects of crowd analysis. In 2017, Marsden et al. [2] described that crowd analysis focuses on developing task-specific systems that perform a single analysis task such as crowd counting, crowd behavior recognition, crowd density level classification and crowd behavior anomaly detection. For crowd estimation purposes, crowd counting approaches may vary based on factors like estimating the crowd from an image or from a real-time video. Loy et al. [3] classified the crowd counting approaches into three different categories known as detection-based [4,5], regression-based [6,7] and density-based estimation [8]. The evolving interest of researchers in the last five years has contributed to new developments and rapid expansion in the crowd counting domain, where the researches have mainly concentrated on crowd tracking, pedestrian counting and crowd behavior analysis, among other tasks.
Idrees et al. [9] performed dense crowd estimation using a locally consistent scale to capture the similarity between local neighbourhoods and its smooth variation using images. The high crowd density and challenging nature of the data set led to several failure cases. A high-confidence detection in the first iteration often made the method over-sensitive to detection hypotheses occurring at the desired scale in neighboring areas. Similarly, at early iterations, high confidence nonhuman detection drastically degraded the prior scale, because they provided incorrect scale information. It led to misdetections in the surrounding areas that later papers tried to address.
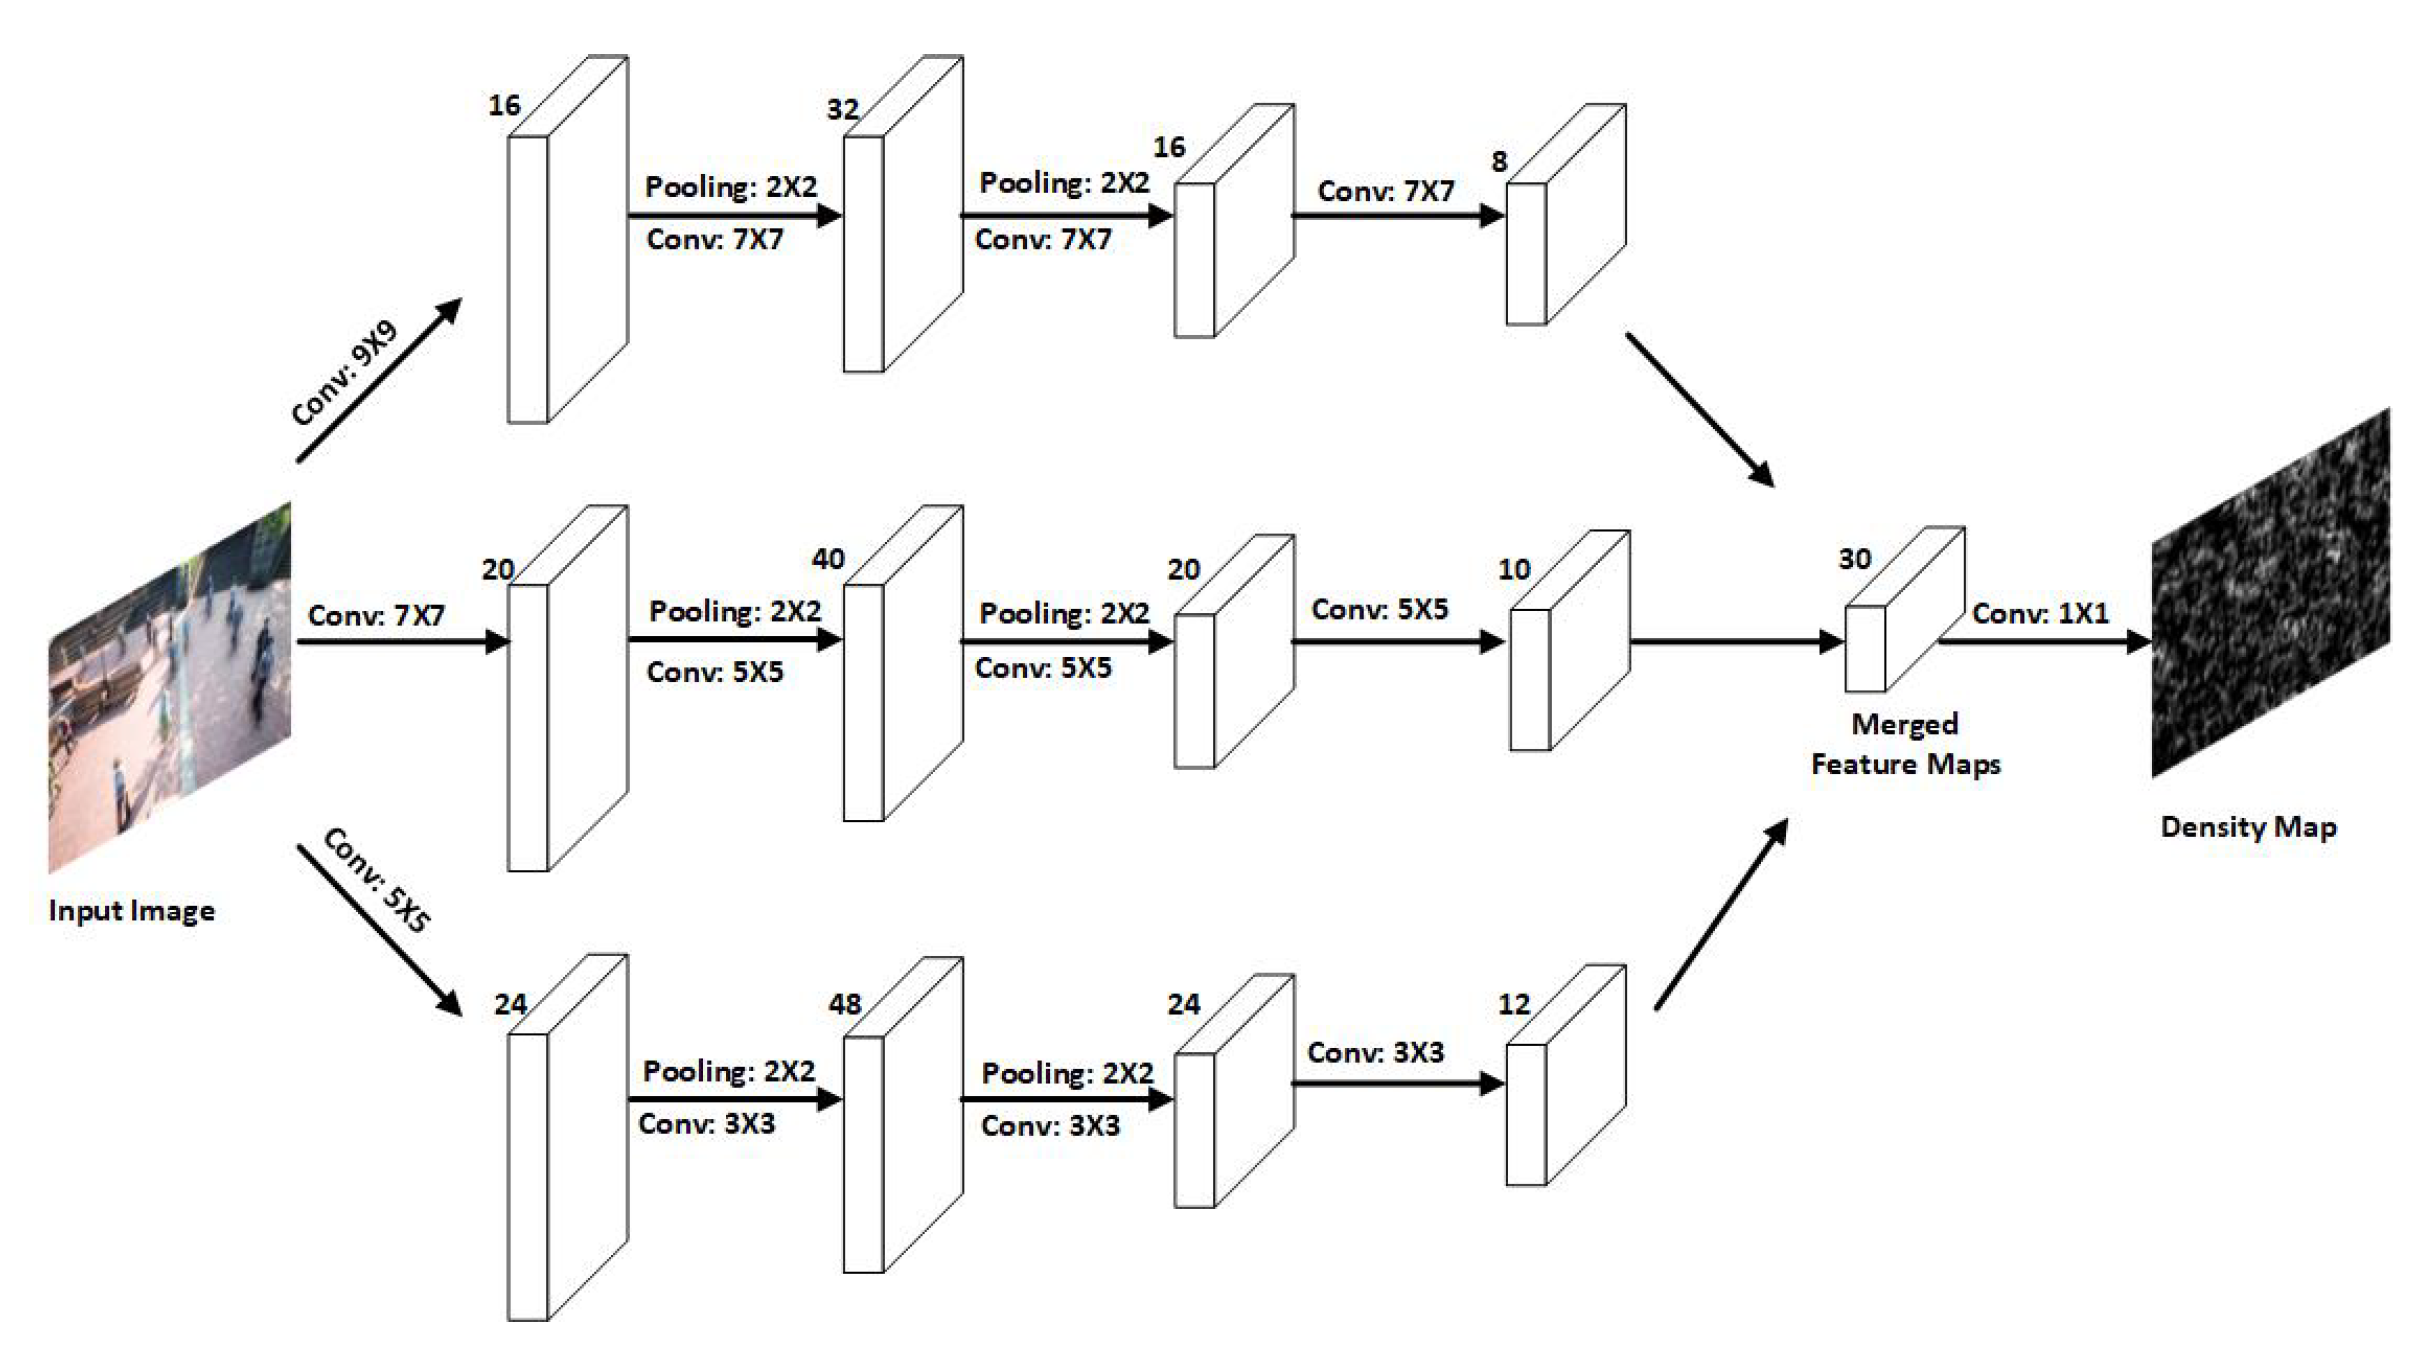
Zhang et al. [10] proposed a multicolumn convolutional neural network architecture (MCNN) which could estimate the number of people in a single image. By creating a network comprising of three columns corresponding to filters with receptive fields of varying sizes, the proposed approach offers resistance to huge variations in object scales (large, medium, small). The three columns were created to accommodate various object scales in the images. In addition, it offered a novel method to generate ground truth crowd density maps. In contrast to the existing methods that either summed up Gaussian kernels with a fixed variance or perspective maps, Zhang et al. also proposed that perspective distortion should be taken into consideration by estimating the spread parameter of the Gaussian kernel based on the size of each person’s head within the image. However, using density maps to determine head sizes and their underlying relationships is impractical. Instead, the authors employed a key feature noticed in high-density crowd images: the relationship between head size and distance between the centres of two neighbouring people. Each person’s spread parameter was calculated using data-adaptive methods based on their average distance from their neighbours. It is worth noting that the ground truth density maps generated using this method included distortion information without employing perspective maps.
Zhang et al. [11] recently introduced a multiview crowd counting method using 3D features fused with 3D scene-level density maps. The deep neural network-based (DNN) 3D multiview counting method was integrated with camera views to estimate the 3D scene-level density maps. This method used 3D projection and fusion, which could address situations where people were not all at the same height (e.g., people standing on a staircase) and provided a way to tackle the scale variation issue in 3D space without a scale selection operation. However, increasing the height resolution did not contribute to the body’s information, but could introduce more noise (other people’s features) along the z-dimension, resulting in poor performance.
Zhao et al. [12] introduced crowd counting with limited supervision. Initially, it labeled the most informative images and later introduced a classifier to align the data and then performed estimation based on density. The number of labeled individuals varied over the course of trials and cycles. However, the ground truth was unknown, so it was difficult to determine the exact number of people, which led to a higher or lower detection rate. A ground truth verification is necessary to overcome the problem or justify the introduced method since labeling more or fewer heads does not imply a better or worse performance.
Recently, Wang et al. [13] developed a new Scale Tree Network (STNet) for crowd counting that aimed to improve scale variety and pixel-wise background recognition. The STNet network consistently met the challenges of drastic scale variations, density changes, and complex backgrounds. A tree-based scale enhancer dealt with scale variations and a multilevel auxiliator filtered pixels from complex backgrounds and adjusted them to density changes. STNet proved to be superior to the state-of-the-art approaches on four popular crowd counting data sets, while employing fewer parameters at the same time. They also proposed a method for addressing the crowd and background imbalance problem using pure background images. This concept could be easily incorporated in other crowd counting algorithms to further improve accuracy.
Ranjan et al. [14] recently published a crowd counting method based on images with imprecise estimation. The majority of the presented work focused on estimating crowd density and using a random sample selection technique to eliminate the need for labeled data. They provided results that showed improved performance based on selecting only 17% of the training samples previously used.
Mustapha et al. [15] presented a study that used CNN and Support Vector Machines (SVM) with sensor data adapted from both structure sensors and accelerometers of wearable devices to study crowd flows and bridge loads. A classification was used to determine crowd flow classification either as a binary choice of motion speed being fast or slow or as a multiclass decision based on high, medium, low, heavy, and light crowd loads, with heavy and light corresponding to crowd load designation. The load estimate of the crowd on the structure was calculated using regression to obtain the overall weight in kilograms. However, the regression results revealed inconsistency in fusion performance and a huge percentage of errors, when using the raw signal for SVM. Additionally, the study was conducted on a small scale. While considering the size of the crowd, however, any size can be considered in the future. That said, a large-scale crowd flow study is required to establish and comprehend the relationship between crowd flow and bridge load.
Almeida et al. [16] recently proposed a crowd flow filtering method to analyze crowd flow behavior. It converted the input for the optical flow from an image plane into world coordinates to perform a local motion analysis, while exploring the Social Forces Model. The filtered flow was then returned to the image plane. The method was evaluated using an image plane and needs to be expanded for the image’s analysis to world coordinates. However, the work was confined to static cameras and could monitor behavior in a limited area. In addition, there is a pressing need to implement the proposed filtering approach on GPUs to achieve even faster execution times. However, the possibility for substantial speedups must be assessed.
Choi et al. [17] recently presented 3DCrowdNet, a 2D human pose-guided 3D crowd pose and shape estimation system for in-the-wild scenes. The 2D human pose estimation methods provide relatively robust outputs on crowd scenes than 3D human pose estimation methods. After all, they can exploit in-the-wild multiperson 2D data sets. Nevertheless, the challenge remains in recovering accurate 3D poses from images with close interaction. Extreme instances frequently entail difficult poses and substantial interperson occlusion, which are both uncommon in the existing trained data.
Fahad et al. [18] attempted to address the issue of public venues by using static camera positions that only record the top view of the images. To deal with events like strikes and riots, the proposed approach captured both the top and front view of the photos. The congested scene recognition (CSRNet) model assessed in this study utilized two separate test cases, one with only top view photos and the other with only front view images. However, the mean absolute error (MAE) and mean squared error (MSE) values of the front view images were higher than the top view images which needs to be reconsidered using other state-of-the-art networks. The gradient adversarial neural network (GANN) network could be effective in resolving the problem of projecting images from multiple viewpoints.

2.3. Previous Reviews and Surveys

Zhan et al. [19] presented the first assessment of crowd analysis approaches used in computer vision research and discussed how diverse research disciplines can assist computer vision approach. Later on, Junior et al. [20] provided a survey on crowd analysis using computer vision techniques, which covered topics including people monitoring, crowd density estimation, event detection, validation, and simulation. The research focused on three key issues in crowd analysis: density estimation, tracking in crowded settings, and analysing crowd behavior at a higher level, such as temporal evolution, primary directions, velocity predictions, and detection of unexpected situations. In terms of crowd synthesis, the review mostly focused on crowd models that either used computer vision algorithms to extract real-world data to improve simulation realism or were used to train and test computer vision techniques.
Teixeira et al. [21] presented the first human sensing survey offering a comprehensive analysis of the presence, count, location, and track of a crowd. It focused on five commonly encountered spatio-temporal properties: identity, presence, count, location, and track. The survey provided an inherently multidisciplinary literature of human-sensing, focusing mainly on the extraction of five commonly needed spatio-temporal properties: namely presence, count, location, track and identity. It also covered a new taxonomy of observable human attributes and physical characteristics, as well as the sensing technologies that may be utilized to extract them. In addition, it compared active and passive sensors, sensor fusion techniques, and instrumented and uninstrumented settings.
Loy et al. [3] discussed and evaluated state-of-the-art approaches for crowd counting based on video images as well as a systematic comparison of different methodologies using the same procedure. The review concluded that regression models capable of dealing with multicollinearity among features, such as Kernel ridge regression (KRR), Partial least-squares regression (PLSR), and Least-squares support vector regression (LSSVR), perform better than linear regression (LR) and random forest regression (RFR). The findings also revealed that depending on the crowd structure and density, certain features may be more useful. In sparse settings, foreground segment-based features could give all of the information required to estimate crowd density. Edge-based features and texture-based features, on the other hand, became increasingly important when a scene becomes packed with frequent interobject occlusions. Depending on the data set and regression model used, the final results affirmed that combining all attributes does not always help.
In 2014, Ferryman et al. [22] presented a PETS2009 crowd analysis data set and highlighted performance in detection and tracking. It first published a performance review of state-of-the-art crowd image analysis visual surveillance technologies, using defined metrics to objectively evaluate their detection and tracking algorithms. Comparing results with others, whether anonymous or not, was a practical and encouraging research strategy for advanced, robust, real-time visual systems. Furthermore, the latest findings highlighted the requirement for ground truth data sets, which may be used to showcase the different systems capabilities, such as accuracy, precision, and robustness.
Li et al. [23] examined the state-of-the-art techniques for crowded scene analysis in three major areas: motion pattern segmentation, crowd behavior recognition, and anomaly detection, using various methods such as crowd motion pattern learning, crowd behavior, activity analysis, and anomaly detection in crowds. The survey concluded that crowded settings frequently involve extreme clutter and object occlusions, making current visual-based techniques difficult to use. Fusion of data from several sensors is a proven tool to eliminate confusion and enhance accuracy [24]. Another finding revealed that many existing video analysis systems track, learn, and detect by integrating the functional modules, without taking into account the interactions between them. It was preferable for crowded scene analysis systems to execute tracking, model learning, and behavior recognition in a completely online and unified manner to effectively utilise the hierarchical contextual information. Despite the development of several approaches for feature extraction and model learning in crowded scene analysis, there is no widely acknowledged crowded scene representation.
Ryan et al. [25] offered a comparison of holistic, local, and histogram-based approaches as well as numerous picture characteristics and regression models, across multiple data sets. The performance of five public data sets was evaluated using a K-fold cross-validation protocol: the UCSD [26], PETS 2009 [27], Fudan [28], Mall [29], and Grand Central [30] data sets. The survey of the various methods concluded that the usage of local features consistently surpassed holistic and histogram features. Despite their extensive use in literature, edge and texture traits did not deliver ideal performance for a holistic approach. As a result, further data sets must be examined to corroborate these findings and to see if other feature sets or regression models might boost performance.
Later, Saleh et al. [31] considered crowd density and visual surveillance to be the most significant aspects in the computer vision research context. The survey focused on two approaches: direct (i.e., object-based target detection) and indirect (e.g., pixel-based, texture-based, and corner points based analysis). As long as people were adequately segregated, direct approaches tracked and counted people simultaneously. The indirect technique, on the other hand, used a collection of measuring features and crowd learning algorithms to conduct the counting and estimating processes. While concluding the direct crowd estimating approach, the survey highlights that in lower-density groups, recognising individuals is easier. When detecting people in large groups or in the presence of occlusions, however, this process became more challenging and complex. That’s why despite recent breakthroughs in computer vision and pattern recognition algorithms, many recent studies have avoided the task of detecting individuals to save processing time. Instead, majority of the research has focused on indirect crowd estimation approaches based on a learning mapping between a set of observable variables and the number of people.
Zitouni et al. [32] attempted to provide an explanation of such challenges by extrapolating relevant statistical evidence from the literature and making recommendations for focusing on the general elements of approaches rather than any specific algorithm. The study focused on existing crowd modeling approaches from the literature, concluding that the methods are still density dependent. In addition, real-world applications in surveillance, behavioral understanding, and other areas necessitate that crowd analysis that begins at the macro-level and branches into the micro-level. Let us consider the case of a crowd splitting due to an individual target crossing. Although macro-analysis (in this case, splitting) could detect changes in crowd behavior, micro-analysis (individual target crossing) is required to understand the cause of the behavior. To meet such realistic expectations, crowd representation and inference must concentrate on development at both macro and micro levels as well as in the middle. Most techniques, according to the study, operate under strong and restrictive assumptions such as camera perspective, environmental conditions, density, background and occlusion which must be addressed in the future.
Grant et al. [33] investigated crowd analysis in relation to two main research areas: crowd statistics and behavior analysis. To address the challenge of measuring large crowds with high densities, the survey determined that good data including photographs collected at a variety of standoffs, angles, and resolutions as well as ground-truth labels for comparisons, is essential. It also shed light on the intriguing topic of detecting crowd demographics, where knowing demographics like gender, ethnicity, and age could be beneficial for event planning and marketing. The study also indicated that combining behavior recognition could help determine factors like the quantity of persons walking versus sprinting in a scene. It was strongly stated that synthetic crowd videos filled many gaps, and that these videos were useful in generating important ground-truth information for evaluating and comparing algorithms as well as providing scenes of situations that are too dangerous to re-enact. Plus, it justified the need to generate synthetic crowd data set in the future to avoid such scenarios.
Sindagi et al. [34] compared and contrasted several single-image crowd counting pioneering methodologies and density estimation methods that used hand-crafted representations, with a strong emphasis on newer CNN-based approaches. Across all the data sets, the most recent CNN-based algorithms outperformed the traditional approaches, according to the study. While CNN-based methods performed well in high-density crowds with a variety of scene conditions, traditional approaches had substantial error rates in these situations. Additionally, the multicolumn CNN architecture [10] was tested on three diverse data sets such as UCSD, WorldExpo ’10, and ShanghaiTech and the method attained state-of-the-art results on all the three data sets. The CNN-boosting approach by Walach and Wolf [35] achieved the best results on the Mall data set. Optimum results on the UCF_CC_50 data set were achieved by joint local and global count approach [36] and Hydra-CNN [37].
Kang et al. [38] examined crowd density maps created using various methodologies on a variety of crowd analysis tasks, such as counting, detection, and tracking. While fully-convolutional neural networks (e.g., MCNN) produce reduced-resolution density maps performed well at counting, their accuracy decreased at localisation tasks due to the loss of spatial resolution, which cannot be entirely recovered using upsampling and skip connections. It was also recommended that dense pixel-prediction of a full resolution density map using CNN-pixel generated the best density map for localisation tasks, with a minor decrease in counting tasks. Dense prediction, on the other hand, had a larger computational complexity than fully-convolutional networks.
Tripathi et al. [39] offered a thorough overview of contemporary convolution neural network (CNN)-based crowd behavior analysis approaches. The goal of the approaches that were examined was to give law enforcement agencies a real-time and accurate visual monitoring of a busy area. The study identified a shortage of training data sets as a major difficulty when utilising CNN to analyze distinct population types. A list of numerous data sets was offered in this survey. These data sets, however, only comprised a few hundred training examples that were insufficient to train a CNN. CNN-based methods require a large pool of labeled training data sets and major manual interventions that were both complex and time-consuming. Another study found that CNN-based approaches require specialized hardware for training, such as GPUs, because training a CNN is a computationally expensive proposition. To overcome this issue, it would be interesting to look into transfer learning approaches that used previously taught models rather than having to train the model from scratch. Because a shortage of training examples for various types of crowd can impair the system’s performance, online CNN training could become an exciting research domain.
Most recently, Gao et al. [40] presented a review of over 220 methods that looked at crowd counting models, primarily CNN-based density map estimates from a variety of angles, including network design and learning paradigms. It tested various state-of-the-art approaches and benchmarked crowd counting algorithms against several crowd data sets such as the National Forum for Urban Research, UCSD, Mall, WorldExpo’10, SHA and UCF-QNRF. The study suggested that PGCNet [41], S-DCNet [42] and PaDnet [43] methods outperformed on Shanghai Tech data set with a MAE of 57.0%, 58.3% and 59.2%, respectively. The study demonstrated, however, that mainstream models were intended for domain-specific applications. Furthermore, supervised learning necessitates precise annotations could be time-consuming to manually label data, especially in highly congested scenarios. Given the unanticipated domain gap, generalising the training model to unseen scenarios might provide sub-optimal outcomes. The study also found that MCNN’s [10] head size is proportional to the distance between two people. This notion prompted the creation of a geometry-adaptive kernel-based density map creation method, which has inspired many crowd estimation works to use this tool to prepare training data.
The studies [34,38,39,40] found that CNN methods are successful and outperform traditional approaches in high-density crowds with a variety of scene variables, whereas traditional approaches suffer from high-error margins in such settings. Sindagi et al. [34] compared different methods for single-image crowd counts and density estimation, the multicolumn CNN architecture [10] performed best on the data sets from UCSD, WorldExpo 10, and ShanghaiTech. Another study from Kang et al. [38] found that MCNN-generated reduced-resolution density maps performed well in crowd counting. Tripathi et al. [39] highlighted a shortage of training data sets as a major issue in utilising CNN to analyze diverse crowd types. It indicated that the existing data sets only had a limited amount of training examples, which were insufficient to train a CNN. Hence, it validated the need to create more training data. After examining more than 220 works, which primarily included CNN-based density map estimation methods, the most recent study from Gao et al. [
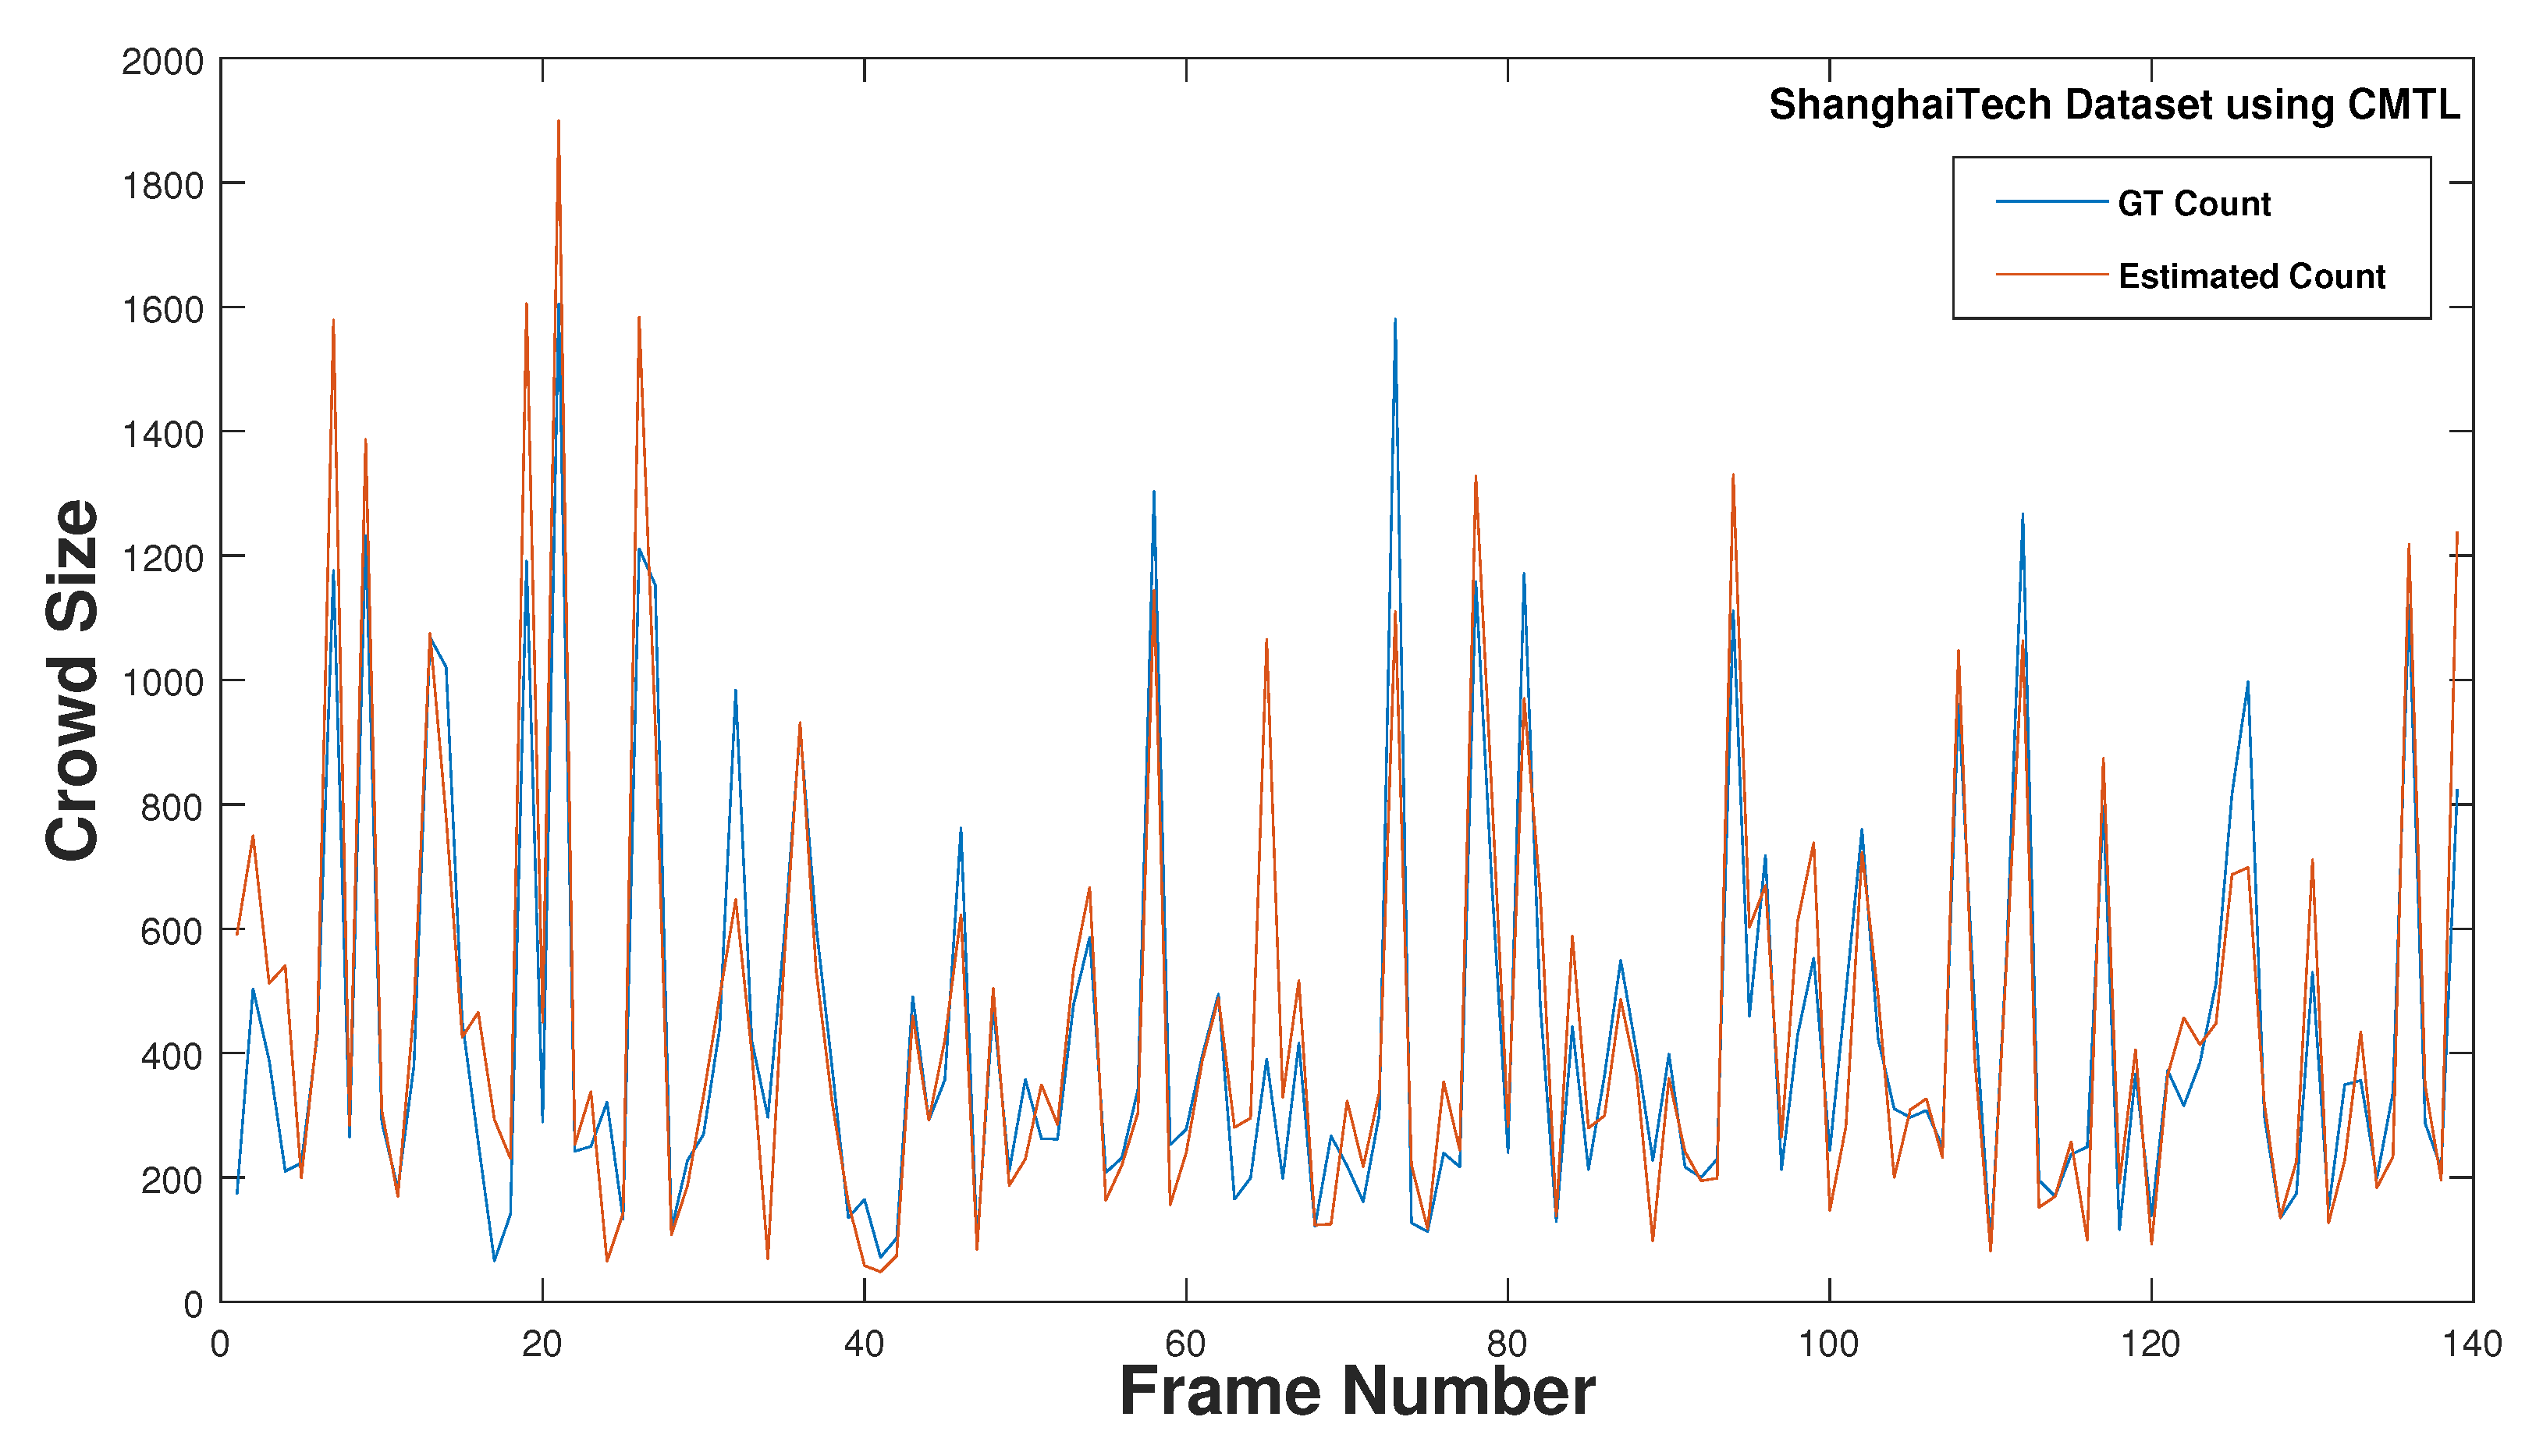
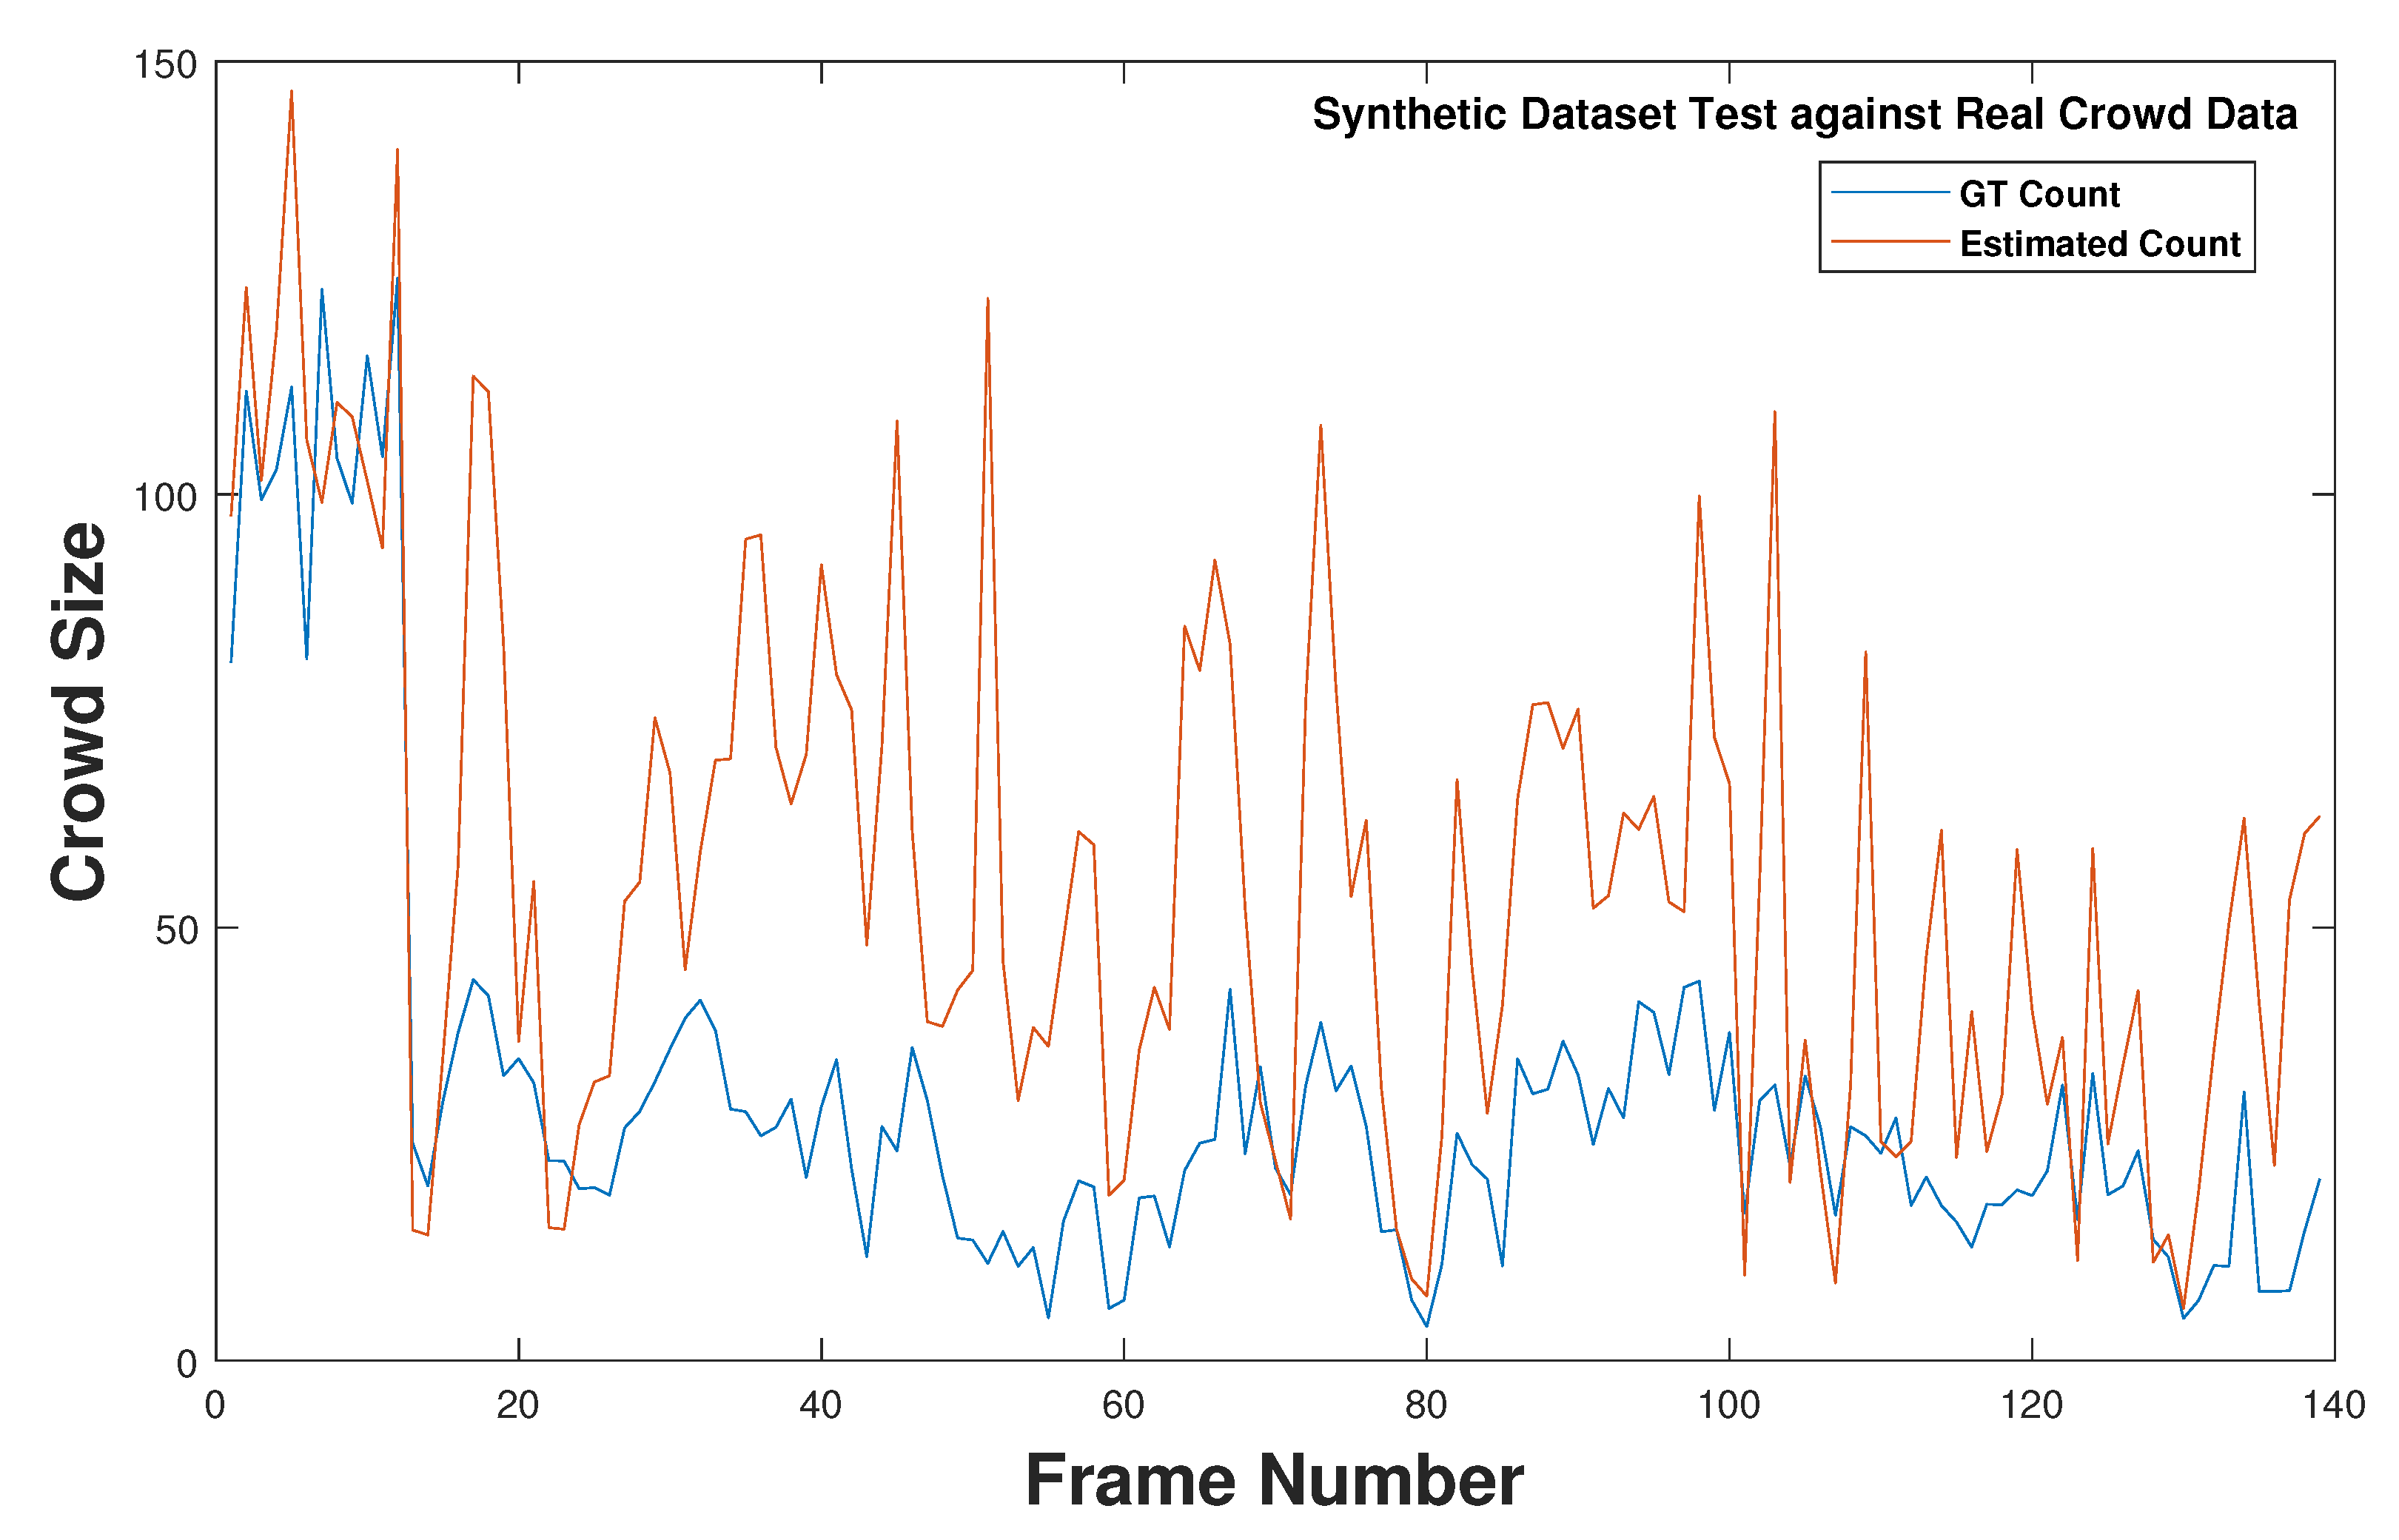
40] highlighted that MCNN [10] performed well in dense crowd scenes. Considering the suggestions from the most recent studies, we have applied the MCNN and used ShanghaiTech data set to train, test, and validate the simulation system against real-crowd data and have discussed it further in Section 3.4.

2.4. Related Open Source Crowd Simulator

Considering the recent growth in crowd estimation, testbed for generating crowd training and testing data is a major issue. Capturing the crowd has never been easy and ethical issues don’t allow to capture the crowd in most countries. Furthermore, the process of capturing the crowd is expensive and can backfire. Simulators are the best solution to overcome the testbed issue because they are cost-effective and can easily produce data for training and testing. To resolve the issue, we have reviewed the existing crowd simulators, determined its limitations, and demonstrated why a new 3D crowd simulation system with an integrated UAV simulator is required.
Kleinmeier et al. [44] introduced Vadere, a framework for simulation of crowd dynamics. It consists of features that allowed interaction with the microscopic pedestrian. As a result, it has contributed to many simulation models and comprises of models like the gradient navigation model and social force model for further research purposes, which are restricted to 2D simulations. Maury et al. [45] introduced Cromosim, a library specifically designed for Python that was mainly used to model crowd movements. It is simple to set up, and there are some examples models available to monitor the trend, such as follow-the-leader and social powers. However, its use is limited in other respects, such as crowd motion tracking. Curtis et al. [46] developed Menge, a full-featured 3D crowd simulator designed for crowd simulation and dynamics that compared two different models. Since the crowd and its aspects do not appear to be real, it could only be used for tracking purposes within the developed environment.
Crowd Dynamics is another 2D simulation system intended to develop for crowd movement. However, the system is still in the early stages of development. PEDSIM is a microscopic pedestrian crowd library with limited application. Consequently, the documents simply mention the use of PEDSIM to implement several models such as cellular automata and social force, but nothing else is specified. Wagoum et al. [47] presented JUPEDSIM framework to map crowd dynamics. The framework is an open source one and can be used for research purposes such as mapping and measuring crowd dynamics, data visualization etc. Mesa [48] is a python library limited to modeling functions and can’t be used for simulation. There isn’t enough data available for RVO2 [49], Fire Dynamics [50] and AgentJL. These frameworks have been developed specifically for crowd dynamics navigation and haven’t been updated in a long while. Other licensed and paid crowd simulators such as CrowdSim3D and Urho3D are also available with built-in tracking and mapping features, but their use is limited and they are expensive.
To summarise, except for Menge, most open-source simulators are limited to 2D and are specifically designed to track the crowd dynamics and motion. A detailed review of the available open-source simulators summarised in Table 1 has revealed that most simulators are designed for specific tasks such as crowd dynamics or fire dynamics study in 2D and are not efficient enough to generate 3D synthetic data and avatars to mimic real-world conditions. Considering the available 3D simulator ’Menge’, it consists of repeated characters and encounters problems in distinguishing various features of individuals such as gender, age, weight, height, ethnicity, proportion, outfit, pose, color, and geometry. As a result, this 3D simulator cannot be used to envision any scenario that mimics real-world settings. Furthermore, various geometric shapes and topologies for each individual’s eyes, hair, teeth, eyebrows, eyelashes, and other features are necessary to produce a realistic prototype. Menge does not provide this functionality. All these factors validate the need for developing a new 3D crowd simulator that can generate reams of data in any scenario, visualise a realistic 3D world, as well as relative locations for crowd estimation.

2.5. Crowd Data Sets

Traditional surveillance systems for crowd estimation are effective when dealing with small crowd sizes. Nevertheless, the traditional approach has some design issues including slow frame processing speeds, resulting in a major breakdown in the process because it cannot handle high-density crowds. Most of the methods have been developed and tested for single images or videos, with majority of the approaches perform crowd testing with low-density crowds [2]. This study analyzes crowd data sets and subclassifies them into free, surveillance and drone-view crowds. The data sets have been categorized based on release year, attribute, number of samples, and average count per image. The primary objective of this study is to identify why existing drone view data sets cannot be used for the estimation of crowds using UAV, and why synthetic data is required.
The first free-view data sets UCF_CC_50 [51] were released in 2013 with a sample size of 50 and 63,974 instances. UCF_CC_50 is the only available large density crowd data set as shown in Table 2. ShanghaiTech Part A [10] is another congested attributed data set containing 241,677 instances with an average count of 501 people. Sindagi et al. [52] discussed available data sets for crowd surveillance and estimations. Some of the popular and easily accessible data sets include UCSD [26] which consists of 2000 frames of size 238 × 158, and the Mall data set [29] containing 2000 frames of size 320 × 240 with 6000 instances and large number of labeled pedestrians. The ShanghaiTech crowd data set [10] discussed in Table 3 includes both part A and part B of the dataset. It consists of 1198 images with a large number of 330,000 annotated heads.
Bahmanyar et al. [66] presented the first drone-view crowd data set in 2019 for crowd estimation known as DLR’s Aerial Crowd Data Set. The images were captured through a helicopter providing 33 aerial images from 16 different fights of a slowly moving crowd. Zhu et al. [67] presented the second aerial data set of the crowd. As shown in Table 4, this data set comprised of 112 video clips collected from 70 different scenarios.
According to the pattern since 2008, when UCSD’s first crowd data set was released, the majority of publicly available crowd data sets have been captured with static cameras [34] and have been limited to 2D. The first aerial crowd data set was released in 2019 with a sample size of 33. That said, the data set is inaccessible and has no annotations. In fact, most aerial crowd data sets are not widely available for study. Previous studies [39] evidenced and highlighted the shortage of training examples for various crowd types. Ref. [20] focused primarily on simulation realism and highlighted the importance of virtual data sets that will address the issue in the near future. Our study also concluded that gathering and manually annotating crowd data sets are both expensive and time-consuming. Considering the current laws and ethical issues, there is a justified need of a testbed that can generate virtual crowd data set and contain in-depth information of both 2D and 3D images.
The study of various traditional and most recent 2D crowd estimation approaches discussed in Section 2.2 and Section 2.3 highlighted the inherent limitations of 2D approaches which include static camera monitoring that can monitor a specific area with a high possibility of counting the same individual multiple times, nonhuman or false detections, and lack of information and inconsistency in performance, which leads to a high percentage of errors, among others. Extensive work has been done for different segments of 2D crowd estimation and received a lot of attention, but work related to 3D crowd estimation is limited. Recently, promising research has been conducted on density estimation [69,70,71,72] and advances have been made in 3D pose estimation from 2D [11,73,74,75,76,77,78,79,80] but the work related to 3D crowd estimation using UAV is not prevalent. Interestingly, UAVs have immense potential to estimate the crowd spread over a huge geographical area in a shorter duration. Recent advances in optical instrumentation and computer vision techniques have facilitated the use of 3D models to explore in-depth information. In contrast, very little research has been done regarding 3D crowd estimations with UAVs. This fact alone underscores the necessity to devise a new way to overcome the traditional and inherent limitations. It also demonstrates how our 3D work varies from existing and conventional 2D crowd estimation methodologies. To summarise, taking into account the existing shortcomings, we have presented a 3D crowd simulator in Section 3.3, trained, tested and validated the simulation system against real-crowd data in Section 3.4. In addition, we have introduced a novel 3D crowd estimation technique using UAV for a robust and accurate estimation of a crowd spread over a large geographical area in the subsequent sections.

3. 3D Crowd Estimation Using UAV

In this section, various techniques and tools used to develop 3D crowd estimation technique with UAVs have been covered in detail. We have also highlighted the way these tools can be used in conjunction with one another. An overview of the development of a crowd simulation for training and testing data has also been discussed. Unreal Engine has been used as the main tool for simulation and Make Human and Anima have been employed to design and import random crowd that mimic real-life settings. Furthermore, we have discussed the process used for training, testing and validation of synthetic data against real crowd data and vice-versa. Finally, we have introduced our novel method of 3D crowd estimation using UAVs in real time.

3.1. 3D Simulation and Modeling

Unreal Engine [81] is a game engine developed by Epic Games that focuses on first person shooter games. It was created using Blueprint and C++ as the main languages in version 4 (v4). With features such as blueprint interface, game mode, simulation, real-time output and automatic annotations, it is the perfect fit for reproducing 3D framework, especially for simulating real-life scenarios that rarely occur.
Make Human [82] is an open-source 3D computer graphics software used to create realistic humanoids. Make Human is used to design and create crowds size considering different genders, age and features. Given a larger community comprising of programmers, artists and people with academic interests in 3D modeling of characters, this tool is written in Python and is compatible with almost all the available operating systems. Make human is easy to use and extracts the skeleton or a static mesh as per the requirements of any other simulation tool such as unreal engine.
Anima [83] is a 3D people animation application developed specifically for architects and designers and is ideal for creating amazing 3D animated people quickly and easily. The tool has been used to create many 3D animated people and realistic scenarios. The crowd flow and movement direction are plotted in such a way to avoid collision and maintain a realistic flow. Many realistic 3D models such as stairs, escalators, tracks, and moving sidewalks are pre-designed and easy to access for UE4 which not only helps to design and simulate any complex scenarios quickly but also saves time while creating any new realistic setting.
Colmap [84] is a 3D reconstruction tool and uses the patch-based stereo to reconstruct 3D dense point clouds. In our proposed method, it has been used to generate 3D models using images extracted from Unreal Engine. The Colmap provides intrinsic parameters such as camera model and extrinsic parameters such as camera location, rotation, etc. Several studies [85,86] critically compared the results of popular multiview stereo (MVS) techniques and concluded that COLMAP achieves the best completeness and on average, it produced promising results for most individual categories.

3.2. Why 3D Simulation?

3D simulation is less time-consuming and cost-effective to build a 3D simulator of a crowd to train and test the system as well as provide accurate ground truth information about people and their locations. In addition, a 3D simulator is useful to create and design simulations of seldom occurring events and understanding the real-world outcomes. Additionally, it can be useful to self-train the system by finding out about those uneven possibilities, such as stampedes, public gatherings, etc. within the crowd data sets. Another factor that influences and attracts computer vision researchers toward 3D simulation is the virtual data set. It makes it possible to consider and construct a virtual data set by creating various scenarios, events, and their outcomes in real time, which can help to train and test the system [87].

3.3. Overview of the Proposed Testbed

In a limited time, UAVs have gained enormous prominence due to their ability to resolve major issues. Obtaining a licence and permission to fly a UAV near a crowd in most countries is hard, expensive, and time-consuming due to rigorous restrictions and regulatory limits. Navigating and coping with a variety of precise settings and unforeseen situations can also be difficult. Handling a UAV in a gusty environment with a shorter flying time and distance, for example, highlights the inefficiency of mapping a large area, which could be dangerous in real life. All of these variables make 3D simulation the ideal solution because it has no negative implications or ethical issues.
Considering the challenges of gathering and annotating real data, we built the crowd simulation system using the Unreal Engine version 4 (UEv4). The design of the basic prototypes and reusable meshes such as houses and trees was the first step involved in creating a virtual environment and shown in Figure 1. Furthermore, we placed all those meshes within the environment to give a real-life look. We have used smooth, linear, and spherical features to flatten and reduce surface noise. Animation and wind effects were incorporated to make the virtual environment more realistic, but only in 3D. These models can be imported and utilized in a variety of settings, making the process of building and generating scenarios quick, easy, and adaptive to the requirement.
Having said that, it is necessary to create a synthetic crowd prototype comprised of different genders before simulating the environment. Hence, we have used Make Human and Anima to design and generate random crowds using random sets of features for different random variables to mimic the real world. The random crowd consists of individuals of different genders, ages, weights, heights, ethnicities, proportions, outfits, poses, colors, and geometries. For proper representation, we have used different geometric shapes and topologies for the eyes, hair, teeth, eyebrows, eyelashes, etc. of each individual.
Manually annotating the crowd in any dense crowded image is an extremely laborious and time-consuming task with a higher possibility of getting false annotations or multiple count of the same individual. While the captured 2D data holds good image resolution, the inherent limitation of 2D does not make it efficient to provide every single detail required for estimating the crowd in 3D. That said, data collection within the 3D simulation system is relatively easy and accurate to generate reams of data, especially when using a moving camera over a large crowd. Our proposed 3D simulation system is efficient enough to generate automatic annotations and can provide 3D world and relative locations to estimate the crowd in any static or dynamic event. The simulation system is also able to generate virtual data sets that could be beneficial in future research within the domain. Furthermore, it resolves existing issues such as the availability of massive crowd data sets, among others. The flowchart in Figure 2 depicts the steps taken to capture the frame while storing ground truth (GT) positions at the same time. The collected data was used in the subsequent Section 3.4 for the training, testing and validation of the simulation system and generation of synthetic data. Furthermore, the 3D annotations collected by flying the UAV were extracted from the simulator and further used in the final 3D method introduced in Section 3.5.

3.4. Training, Testing and Validation the Simulation System against Real-Crowd Data

Given the requirement for a UAV crowd estimation and limitations of a flying UAV in the real world, we have introduced a novel way to estimate the crowd using synthetic images extracted from our simulation system. We started by implementing our initial idea of building and testing the simulation system. Using aerial photos gathered from the drone as a foundation for assessment was a very challenging task. So we prototyped photo-realistic humanoids of various sizes and integrated all of their meshes and skeletons into the simulator to make it as realistic as possible.
With a variety of methods discussed in Section 2.3, we have evaluated the advantages and disadvantages of the broad approaches. Most recent studies [34,38,39,40] suggest that multicolumn CNN [10] method achieves the best results on ShanghaiTech data set and is efficient enough to train, test and validate the simulation system against real-crowd data. ShanghaiTech is the best fit as it is one of the largest large-scale crowd counting data sets in previous few years. It consists of 1198 images with 330,165 annotations. According to different density distributions, the data set has been divided into two parts: Part A (SHA) and Part B (SHB). SHA contains images randomly selected from the internet, whereas Part B includes images taken from a busy street of a metropolitan area in Shanghai. The density in Part A is much larger than that in Part B which make SHA a more challenging data set and an ideal fit for large crowd testing.
To test and validate the simulation system, we extracted the aerial video captured through UAV within the simulator and split it into different frames. Initially, we set up the ShanghaiTech data set for testing and validation against the synthetic images (Figure 3). For testing the system, we set up data and created the training and validation set along with ground truth files. We calculated the errors using mean absolute error (MAE) and root mean square error (RMSE), and the output in the form of density maps.
We trained the model on synthetic data using multicolumn convolutional neural network (MCNN) after obtaining a high throughput and validating the simulated data. Three parallel CNNs, whose filters were attached with local receptive fields of different sizes, were used as shown in Figure 4. We utilized the same network structures for all the columns (i.e., conv–pooling–conv–pooling) except for the sizes and numbers of filters. Max pooling was applied to each 2 × 2 region, and Rectified linear unit (ReLU) was adopted as the activation function. We used fewer filters to minimise computation time.

3.5. Our Approach to Crowd Estimation Using UAV

In this section, various tools and techniques used to develop the 3D crowd estimation technique using UAV have been discussed. We have highlighted step-by-step how these tools are interlinked with each other. We have briefly discussed the Make Human and Anima for designing and importing random crowd that mimic real-life settings.
In the most recent studies, counting the same individual from a moving camera has been a major issue. We have attempted to overcome the issue by introducing a novel 3D crowd estimation technique using UAV for a robust and accurate estimation of a crowd spread over a large geographical area. Figure 5 shows the step-by-step process of our presented method where the basic prototypes and meshes were designed to setup a simulation environment in Unreal Engine. Anima and Make Human were used to generate random crowds size using random sets of features for different random variables to mimic real-life settings. After preparing the simulation environment, we flew a virtual UAV around the crowd and captured the ground truth 3D locations which we will use at the end to map the estimated 3D crowd locations. Various frames were also captured associated with the crowd to train, test and validate the system. After extracting the captured data from Unreal Engine, we tested the captured virtual data using state-of-the-art method MCNN. Later, Laplacian of Gaussian (LOG) was applied in the extraction of the density map provided by the MCNN to identify the possible 2D crowd location. It was later used to ray trace the possible crowd locations in 3D. In the third step, we reconstructed the 3D model from the frames captured using UE4 and collected in-depth details of the model such as camera location, quaternion matrix, camera translation and points such as screen points and 3D points for every 2D image provided as input. Finally, we initiated a ray hit testing and traced the possible 2D crowd location extracted from the blob-detector and stored the intersection points between ray and plane, considering them as the possible crowd locations in 3D model. Although the traced 3D locations overlapped in the initial frame capturing, we set up an averaging method and discarded most of the overlapping points from each frame. To map the output estimated point with the ground truth point captured from UE4, we used the ICP algorithm for registering both point sets. Once it converged, we mapped the ground truth points with the estimated points using the nearest neighbour search algorithm and extracted the matched pair between the two sets, where p i is considered a match to q j if the closest point in Q to p i is q j and the closest point in P to q j is p i and tested it against various universally-agreed and popularly adopted measures for crowd counting model evaluation which have been discussed further in Section 3.6.
To make a clearer representation of the method, we divided the process into several steps and tried to present the working of every step. To give a realistic vision, we also attempted to visualise how the output would look like. The steps involved in the presented method are as follows:
Step 1: Make Human and Anima have been used to design and generate random crowds size using random sets of features for different random variables. They give a random crowd that mimics real-life settings. Furthermore, this image covers people of different genders, age, weight, height, ethnicity, proportion, clothes, pose, colour, geometries etc. Different geometries for each person have been used to make the synthetic crowd more appropriate for the real crowd, including eyes, hair, teeth, topologies, eyebrows, eyelashes, and so on. Furthermore, these individuals were involved in the simulation system’s estimation process.
Step 2: Unreal Engine (UE4) is primarily used as a platform to simulate various real-life scenarios that rarely occur. To make it more practical and closer to real-life situations, we have used random crowd distribution (Figure 6). Because of the random distribution, the crowd size for each simulated scenario is unknown before testing. Algorithm 1 demonstrates steps 1 and 2 with a detailed overview of how the simulation scenario was created and 3D locations were extracted for the simulated crowd within the system.
Algorithm 1 Algorithm for 3D simulation and data collection.
Remotesensing 13 02780 i001
Step 3: Density estimation and blob detection were used for projection and verification. To gather all the information and evaluate the output images, the system was trained using real images and tested on synthetic images provided by the simulator. Few state-of-the-art pre-trained models were considered for checking against both the synthetic and real data to train and test the system. Moreover, we incorporated a multicolumn convolutional neural network for single image crowd counting. We repeated this process for all the data. The density heat maps generated using the person detector (Figure 7) for all the 2D images were used for mapping the 3D data. Later, we used a Gaussian blob detector to extract the individual’s 2D locations from the density maps. The coordinates were later used to ray trace these 2D locations to obtain the 3D locations. These points were crucial for filtration and determining whether or not the estimate point in the 3D model belonged to a person. Algorithm 2 demonstrates step 3 and highlights the procedure followed to extract the 2D coordinates for each person from each image that has been extracted.
Algorithm 2 Algorithm for density estimation and Blob detection.
Remotesensing 13 02780 i002
Step 4: Colmap is used to generate 3D models using the synthetic data (Figure 8) gathered from the simulator. Various simulated images were captured by flying the UAV over the randomly distributed crowd. The gathered data was merged into a realistic model using structure-from-motion (SfM) and multiview stereo (MVS). The whole pipeline returned the 3D parameters such as camera location, quaternion matrix, camera translation and points such as screen points and 3D points for every 2D image provided as input.
This approach uses a set of multiview images captured by RGB cameras to reconstruct a 3D model from the object of interest. 3D reconstruction is often identified as SfM-MVS. SfM is an acronym for structure-from-motion. It creates a sparse point cloud model from the input images.
First, the SfM technique determines intrinsic (distortion, focal length, etc) and extrinsic (position and orientation) camera parameters (Figure 9) for putting the multiview images into context by identifying the local features/keypoints of the images. The corresponding points were then used to measure the 3D model and find the relationship between images. Algorithm 3 represents how the 3D model (Figure 10) has been reconstructed as explained in step 4.
Algorithm 3 Algorithm for 3D model reconstruction using COLMAP.
Remotesensing 13 02780 i003
Step 5: A ray hit test was set up using the starting point and direction to find the intersection point between the ray and 3D model plane. It was used to track down and estimate the crowd size in 3D, while considering the challenge of a moving camera and crowd. It is possible to ray trace every point in each 2D image, but it would be a very expensive and time-consuming process. To overcome this problem, unrelated points were filtered and discarded and ray trace was set up only for the points extracted after the blob detection obtained the exact 3D location points. The returned ray intersection points with the relevant frame numbers were stored and used in the next step to overcome the issue of counting the same individual multiple times.
Structure-from-Motion (SfM) is the process of reconstructing 3D structure from its projections into a series of images. The input is a set of overlapping images of the same object taken from different viewpoints. The output is a 3D reconstruction of the object as well as the reconstructed intrinsic and extrinsic camera parameters of all images. Typically, Structure-from-Motion systems divides this process into three stages: feature detection and extraction, feature matching and geometric verification and structure and motion reconstruction. Furthermore, multiview stereo (MVS) takes the SfM output to compute depth and normal information for every pixel in an image. Fusion of the depth and normal maps of multiple images in 3D then produces a dense point cloud of the scene. Using the depth and normal information of the fused point cloud, algorithms such as the Poisson surface reconstruction [88] can then recover the 3D surface geometry of the scene.
Figure 11 depicts the original model reconstructed using an overlapped image provided as input. Before moving forward, plotting the traced point back is an efficient way of checking the accuracy. For this, we used the reconstructed intrinsic and extrinsic camera parameters of all images stored in a database. Later, we plotted the same traced points back to create the same model to double-check the data accuracy. Figure 12 refers to the back projected traced points to the point cloud which creates an accurate model and proves the reconstructed model’s accuracy. Various steps followed in step 5 have been presented in Algorithm 4 that demonstrate how the intersection points were extracted using a ray hit test.
Algorithm 4 Algorithm for Ray Hit Testing.
Remotesensing 13 02780 i004
Step 6: A merging algorithm was developed to find the average of the total number of points hit by the ray tracer. Then, a list of intersection points for each ID and the threshold was set up as the input. The closest point to the threshold was selected. Each point of the frame number (from ID 1 to N-1) was checked against all the neighbouring points with the same ID. If the difference between the point P and the intersection point Q was greater than the threshold, the point was appended to a new point set while the rest were discarded. The detailed explanation and the steps involved in the algorithm have been discussed in Algorithm 5.
Algorithm 5 Merging of Ray traced intersection points.
Remotesensing 13 02780 i005
Step 7: Point matching for evaluation was carried out in the final step. To evaluate our detections, we had to match the ground truth 3D locations to the estimated locations from our system. The Iterative Closest Point (ICP) [89,90] algorithm was used to find the best fit transform and to validate the estimated points against the ground truth points. Fast Library for Approximate Nearest Neighbors (FLANN) [91] was used for the nearest neighbour search. A two-way matching of points was carried out and cross-checked between the two 3D point sets pairs. Algorithm 6 demonstrates the procedure followed for the two-way matching from the two different point sets where Q represented the estimated average points and P represented the ground truth points extracted from the simulation system. It has been explained in step 1 of the presented method.
Algorithm 6 Algorithm for 2-way point matching using ICP.
Input: P = p 0 , p 1 , , p N ;
 Q = q 0 , q 1 , , q M ;
Output: Matched pairs
 Initialize transform M to be the identity;
 until converged;
 R = Find 2-way closest points between P and MQ ( M Q = M q 0 , M q 1 , M q M ) ;
 update M based on matches in R;
return Pairs ( P M Q ) and ( M Q P );

3.6. Evaluation Metrics

Many evaluation metrics are available to predict the estimation and ground truths. They are universally agreed and popularly adopted measures for crowd counting model evaluation. They are classified as image-level for evaluating the counting performance, pixel-level for measuring the density map quality and point-level for assessing the precision of localisation.
The most commonly used metrics include Mean Absolute Error (MAE) and Mean Squared Error (RMSE), which are defined as follows:
M A E = 1 N i = 1 N | C I i p r e d C I i g t |
where N is the number of the test images, C I i p r e d and C I i g t represent the prediction results and ground truth, respectively.
R M S E = 1 N i = 1 N | C I i p r e d C I i g t | 2
Roughly speaking, M A E determines the accuracy of the estimates whereas R M S E indicates the robustness of the estimates.
Precision is a good measure to determine when the costs of False Positive are high. For instance, in the current crowd estimation approach, a false positive means that a point hit by the model is not the right point (actual negative) and has been identified as a person (predicted crowd). The crowd estimation system might lose the actual individual out of the crowd, if the precision is not high for the crowd estimation model.
P r e c i s i o n = T r u e P o s i t i v e s T r u e P o s i t i v e s + F a l s e P o s i t i v e s
Recall calculates how many of the Actual Positives our model has captured by labeling it as Positive (True Positive). For instance, in the current system, if an individual (Actual Positive) is not predicted and counted null (Predicted Negative), then the cost associated with False Negative will be extremely high, and it might collapse the whole estimation model.
R e c a l l = T r u e P o s i t i v e s T r u e P o s i t i v e s + F a l s e N e g a t i v e
F1 Score may be a better measure to use, if we need to strike a balance between Precision and Recall and see if there is an uneven class distribution (a large number of Actual Negatives).
F 1 = 2 × P r e c i s i o n R e c a l l P r e c i s i o n + R e c a l l

4. Implementation Details

In our experiments, we used Pytorch for training and testing synthetic data. For the hardware equipment, the training was done on a 64-bit computer with 32 cores Intel(R) Xeon(R) Gold 6130 CPU @ 2.10GHz processors, 48 GB RAM and two Tesla P100-PCIE-16GB GPU devices. To improve the training set for training using MCNN, we cropped 9 patches from each image at different locations; each patch was 1 4 size of the original image. We trained 133 images that contained 1197 patches using the MCNN model. The 2D detector model was trained on a shared network of 2 Convolutional layers with a Parametric Rectified Linear Unit (PReLU) activation function after every layer to enhance the accuracy of the traced blob points. For the CMTL training, we cropped 16 patches from each image at different locations; each patch was compressed to 1 4 size of the original image. We trained 133 images containing 2128 patches using the CMTL model.
The implementation of 3D crowd estimation was performed using a ray caster on the reconstructed 3D model. The model was reconstructed using the 127 images that were captured from our 3D simulator. The model was rebuilt using an Intel Core i7-8750H processor with a 6 Cores/12 Threads @ 4.1 GHz CPU, Windows 10 on 16 GB RAM, and an NVIDIA Geforce GTX 1060 Max-Q graphics card (6GB of dedicated memory). We used a simple radial camera to capture the data while flying the UAV above the crowd. Initially, the data was captured by following a circular path. The capturing angel varied from 45 to 90 while keeping the height and speed constant. The crowd was randomly placed considering the fact that there is no ground truth in real-time.

5. Experimental Results

Blob detection aimed to detect regions, either in a digital image or synthetic image. They were tested on the pre-existing state-of-the-art methods known as: From Open Set to Closed Set: Supervised Spatial Divide-and-Conquer for Object Counting (S-DCNet) [42], Locate, Size and Count: Accurately Resolving People in Dense Crowds via Detection (LSC-CNN) [92], CNN-based Cascaded Multitask Learning of High-level Prior and Density Estimation for Crowd Counting (CMTL) [93], and Single-Image Crowd Counting via Multicolumn Convolutional Neural Network (MCNN) [10]. The estimated count of our data set against the ground truth was promising and presented in the form of MAE and RMSE. Moreover, we demonstrated that the simulator data is compatible and worked appropriately with real-world crowd data.
The simulated images we used demonstrated a high degree of realism and quality that worked with crowd estimation algorithms trained on real images. As demonstrated in Table 5, S-DCNet, MCNN and CMTL showed promising results on our data set against SHA. CMTL performed better and provided the best MAE of 27.6 and RMSE of 34.6.
Comparing the publicly available aerial crowd data sets using individual state-of-the-art methods (Figure 13), our synthetic data set performed comparatively better than the other two data sets (Table 6). A similar number of images were used for testing and chosen randomly. The VisDone2020_CC data performed better than our data set on S-DCNet with a MAE of 71.39 and RMSE of 123.5. However, our data set performed better than the other two data sets in the remaining methods as shown in Table 6 with a lowest MAE of 27.6 and RMSE of 34.6. For an accurate estimation, the original model was trained on a source domain and can be easily transferred to a target domain by fine-tuning only the last two layers of the trained model, which demonstrates good generalisability. To augment the training sample set for training the MCNN, we cropped 16 patches from each image at various locations and each patch was compressed to 1 4 size of the original image. The pre-training crowd density was very high where it used geometry-adaptive kernels to generate the density maps and calculate the overlapping region density by calculating the average of the generated maps to assist in more accurate estimation.
For any method, data augmentation is important. The S-DCNet results suggest that S-DCNet method is able to adapt to the crowded scenes. The method cropped the original image into 9 sub-images of 1 4 resolution. Mirroring performance and random scaling doesn’t work well on our data. Due to random crowd distribution in our data, the first 4 cropped 224 × 224 sub-images which refers the four corners of the image, didn’t fit well and failed to identify the crowded regions in some images which downgraded the performance of our data set. On the other hand, the randomly cropped images improved the downgraded performance and identified the crowded regions which eventually delivered a better performance. However, the VisDrone2020-CC data contains a higher density crowd than ours where the sub-images or cropped patches located the crowd easily. It performed comparatively better on high-density images that justifies that S-DCNet effectively generalises to large crowd data and makes accurate predictions.
After analysing the methods and their best results, we chose CMTL and MCNN for training the model on synthetic data. We selected the CMTL’s and MCNN’s best model using error on the validation set during training, and set 10% of the training data for validation. Then, we obtained the ground truth density maps using simple Gaussian maps and compared them against network output (Figure 14). The method performed better when the system was trained using synthetic data and tested against the ShanghaiTech data set.
Table 7 shows the output comparison between CMTL model, MCNN model and model trained on our synthetic data set. Our model demonstrates a better performance against the original CMTL model using the same data set which is evident by a low MAE of 98.08 and RMSE of 131.22 which is comparatively better than the original CMTL model. To show the advantage of using our simulator in training with various scenarios, we have additionally trained a multicolumn convolutional neural network (MCNN) on synthetic data and tested against SHA.
Finally, we tested our own data set as shown in Table 8 using the model trained on synthetic images. The CMTL performed better with the results depicting a lower MAE of 8.58 and RMSE of 10.39. This model offered an accurate estimation of the synthetic data and significantly improved the accuracy of 3D crowd estimation method.
To the best of our knowledge, this is the first UAV-based system for crowd estimation. The developed system efficiently captures and calculates large crowds spread over a large geographical area. To determine the system’s robustness, the results have been compared to standard metrics such as accuracy, recall, RMSE, and MAE. Our proposed method outperforms with a randomly distributed static crowd from a moving camera in 3D and shows a throughput with an accuracy of 89.23%. The output shows the accurate estimation of 116 people out of 130 which highlights the robustness of the proposed method with a possibility to improve the detection rate in further testing. With a precision of 94.30% and recall of 95.86% shown in Table 9, the RMSE of 0.0002748 justifies that the proposed method is efficient to capture and estimate a large geographical area as well as produce an accurate count in minimal time. The method also validated using two-way mapping methods where the output was matched with the ground truth points to cross-check the initial performance.
Figure 15 illustrates the final output from the ICP [94] where the ground truth points (P) were plotted against the 3D estimated points (MQ). In the ICP, we provided the input point set as P and Q and initialized transform M to be the identity until it was converged. The converged ICP in 1 iteration highlighted the accuracy of the estimated and ground-truth locations. FLANN [91] was used for the nearest neighbour search. Two-way matching of points was carried out and cross-checked between P and MQ. The final result outputs with a list of closest points and 116 pairs matched between P and MQ out of 128 pairs. A wider comparison of our results with the state-of-the-art methods, however, is not possible as no similar method that can justify and motivate us to compare the results with the ground truth exists.

6. Discussion

The simulation system generated virtual crowd data set was initially tested in conjunction with four well-known state-of-the-art approaches. While performing experiments with virtual crowd data set, we encountered less errors, which is evident by the low MAE and RMSE. The CMTL method outperforms with a MAE of 27.6 and RMSE of 34.6. During the testing, we noted that annotating the accurate position is the most important aspect in accurate computation and generation of density maps. Crowds with distinct features and geometries are important to obtain better results from the virtual data. It not only reduces the chances of overlapping but also helps to create a robust reconstruction model.
In the aerial data set comparison, our simulation system generated data outperforms against DLR_ACD and VisDron2020-CC data sets when tested against S-DCNet. Due to the sparse crowd distribution in our data, the methods which evaluates the entire image as an input such as MCNN and CMTL preforms better than the approaches like S-DCNet that divide the whole image into patches where the accuracy depends on the image density. It should also be noted that the number of patches that lie in the empty region surpasses the crowded region and could not help much in estimation and the error rate will be high.
For a better evaluation of the crowd counting method performance under practical conditions, we have simulated and labeled our new data set. Furthermore, our model has been trained on a source domain that can be easily transferred to a target domain by fine-tuning only the last few layers of the trained model. To enhance the training sample set for training the MCNN, we have cropped 16 patches from each image at various locations and each patch is compressed to 1 4 size of the original image. Our data set outperforms against the state-of-art CMTL model with a higher throughput and lowest MAE of 98.08 and RMSE of 131.22. We have also tested our data against the model trained on the same set of data which shows a MAE of 8.58 and RMSE of 10.39. This trained model is helpful especially with the same synthetic data and provides a higher accuracy than any other methods but is limited to the same set of data. Further testing needs to be done on the existing publicly available data sets where we want to see how these synthetic data trained model behaves with a new set of data.
The proposed method of 3D crowd estimation system has been tested on various scenes using random crowd distribution. Further testing needs to be done to improve the consistency of the method. Initial test on a moving camera and static crowd provided the accuracy of 89.23% which need to be improve and tested on a large scale. That said, the problem of moving crowd and moving UAV is still being worked on. Here, the reconstruction of a 3D model needs to be considered carefully because the points not aligned properly leads to a false estimation or an output with a lower accuracy. The overlapping of the data and stability of the moving camera is very crucial and needs to be considered while capturing the crowd.
At any given time, the most important issue is optimising the flight path over a wide area to get the most accurate estimate of the available crowd. For example, crowd density may be higher along roads or maybe spilling out radially from the town centre which needs to be dealt in the near future for more accurate estimation. We have captured the data and gathered information for future analysis of different crowd distribution. This data needs to be studied in terms of how synthetic data differs from real data considering domain randomisation, transfer learning and adaptation.

7. Conclusions

Crowd estimation in the 3D domain has grabbed the attention of the computer vision industry, as it provides a more reliable and comprehensive information of the crowd. In this article, we have presented an up-to-date review of open-source simulators and relevant crowd data sets with their shortcomings. It primarily justifies the need of a 3D simulator and explains the type of data the simulator should generate. The paper describes the initial issues of crowd estimation from a moving camera and proposes a solution by developing a 3D crowd simulator for training and testing. It also covers the testing of 3D simulator data by implementing the pre-existing techniques such as LSC-CNN, S-DCNet, CMTL and MCNN. Moreover, it highlights a pre-developed approach to train the synthetic data precisely and validate it using state-of-the-art methods, which justifies that virtual data is as effective as the existing data captured in reality. This will contribute in future development by generating more virtual data sets which could be useful for training deep learning models. In addition, it identifies three big and precise crowd estimation issues, along with introducing a method for 3D crowd estimation using UAV. The presented method can estimate large crowd spread over a large geographical area. Lastly, it explores the limitations that the current model do not address, as well as what needs to be addressed in the future and how the current state will assist in addressing future problems.
In the future, our presented approach could be extended for various potential 3D applications which include tourist attraction [95] using video information to attract and maintain tourist flow, suspicious action detection [96] by monitoring crowded areas and alerting authorities of any suspicious activities and safety monitoring [97] in various facilities, such as religious gatherings, airports, and public areas to monitor crowds, among others.

Author Contributions

Conceptualization, S.S., B.T. and H.C.M.; methodology, S.S. and B.T.; validation, S.S., B.T. and H.C.M.; formal analysis, B.T. and H.C.M.; resources, S.S. and B.T.; data curation, S.S. and B.T.; writing—original draft preparation, S.S.; writing—review and editing, B.T. and H.C.M.; visualization, S.S.; supervision, B.T. and H.C.M. All authors have read and agreed to the published version of the manuscript.

Funding

This research received no external funding.

Institutional Review Board Statement

Not applicable.

Informed Consent Statement

Not applicable.

Data Availability Statement

The data and the details regarding where data supporting reported results in this paper are available from the corresponding author.

Acknowledgments

In this section you can acknowledge any support given which is not covered by the author contribution or funding sections. This may include administrative and technical support, or donations in kind (e.g., materials used for experiments).

Conflicts of Interest

The authors declare no conflict of interest.

Abbreviations

The following abbreviations are used in this manuscript:
2D2-Dimensional
3D3-Dimensional
CMTLCascaded Multitask Learning
CPUCentral Processing Unit
FLANNFast Library for Approximate Nearest Neighbors
GPUGraphics Processing Unit
GTGround Truth
ICPIterative Closest Point
LSC-CNNLocate, Size and Count
MAEMean Absolute Error
MCNNMulticolumn Convolutional Neural Network
MVSMultiview Stereo
PReLUParametric Rectified Linear Unit
RMSERoot Mean Square Error
S-DCNetSpatial Divide-and-Conquer
SfMStructure-from-Motion
UE4Unreal Engine 4
UAVUnmanned Aerial Vehicle

References

  1. Jacobs, H. To count a crowd. Columbia J. Rev. 1967, 6, 37. [Google Scholar]
  2. Marsden, M.; McGuinness, K.; Little, S.; O’Connor, N.E. ResnetCrowd: A residual deep learning architecture for crowd counting, violent behaviour detection and crowd density level classification. In Proceedings of the 2017 14th IEEE International Conference on Advanced Video and Signal Based Surveillance (AVSS), Lecce, Italy, 29 August–1 September 2017; pp. 1–7. [Google Scholar]
  3. Loy, C.C.; Chen, K.; Gong, S.; Xiang, T. Crowd counting and profiling: Methodology and evaluation. In Modeling, Simulation and Visual Analysis of Crowds; Springer: Berlin/Heidelberg, Germany, 2013; pp. 347–382. [Google Scholar]
  4. Dollar, P.; Wojek, C.; Schiele, B.; Perona, P. Pedestrian detection: An evaluation of the state of the art. IEEE Trans. Pattern Anal. Mach. Intell. 2012, 34, 743–761. [Google Scholar] [CrossRef]
  5. Li, M.; Zhang, Z.; Huang, K.; Tan, T. Estimating the number of people in crowded scenes by mid based foreground segmentation and head-shoulder detection. In Proceedings of the IEEE 2008 19th International Conference on Pattern Recognition (ICPR), Tampa, FL, USA, 8–11 December 2008; pp. 1–4. [Google Scholar]
  6. Arteta, C.; Lempitsky, V.; Zisserman, A. Counting in the wild. In European Conference on Computer Vision; Springer: Cham, Switzerland, 2016; pp. 483–498. [Google Scholar]
  7. Ryan, D.; Denman, S.; Fookes, C.; Sridharan, S. Crowd counting using multiple local features. In Proceedings of the IEEE Digital Image Computing: Techniques and Applications (DICTA’09), Melbourne, Australia, 1–3 December 2009; pp. 81–88. [Google Scholar]
  8. Ma, R.; Li, L.; Huang, W.; Tian, Q. On pixel count based crowd density estimation for visual surveillance. In Proceedings of the 2004 IEEE Conference on Cybernetics and Intelligent Systems, Singapore, 1–3 December 2004; Volume 1, pp. 170–173. [Google Scholar]
  9. Idrees, H.; Soomro, K.; Shah, M. Detecting humans in dense crowds using locally-consistent scale prior and global occlusion reasoning. IEEE Trans. Pattern Anal. Mach. Intell. 2015, 37, 1986–1998. [Google Scholar] [CrossRef] [PubMed]
  10. Zhang, Y.; Zhou, D.; Chen, S.; Gao, S.; Ma, Y. Single-image crowd counting via multi-column convolutional neural network. In Proceedings of the IEEE Conference on Computer Vision and Pattern Recognition, Las Vegas, NV, USA, 27–30 June 2016; pp. 589–597. [Google Scholar]
  11. Zhang, Q.; Chan, A.B. 3d crowd counting via multi-view fusion with 3d gaussian kernels. In Proceedings of the AAAI Conference on Artificial Intelligence, New York, NY, USA, 7–12 February 2020; Volume 34, pp. 12837–12844. [Google Scholar] [CrossRef]
  12. Zhao, Z.; Shi, M.; Zhao, X.; Li, L. Active Crowd Counting with Limited Supervision. In Proceedings of the Computer Vision-ECCV 2020: 16th European Conference, Glasgow, UK, 23–28 August 2020. [Google Scholar]
  13. Wang, M.; Cai, H.; Han, X.; Zhou, J.; Gong, M. STNet: Scale Tree Network with Multi-level Auxiliator for Crowd Counting. arXiv 2020, arXiv:2012.10189. [Google Scholar]
  14. Ranjan, V.; Wang, B.; Shah, M.; Hoai, M. Uncertainty estimation and sample selection for crowd counting. In Proceedings of the Asian Conference on Computer Vision, Kyoto, Japan, 30 November–4 December 2020. [Google Scholar]
  15. Mustapha, S.; Kassir, A.; Hassoun, K.; Dawy, Z.; Abi-Rached, H. Estimation of crowd flow and load on pedestrian bridges using machine learning with sensor fusion. Autom. Constr. 2020, 112, 103092. [Google Scholar] [CrossRef]
  16. Almeida, I.; Jung, C. Crowd flow estimation from calibrated cameras. Mach. Vis. Appl. 2021, 32, 1–12. [Google Scholar] [CrossRef]
  17. Choi, H.; Moon, G.; Park, J.; Lee, K.M. 3DCrowdNet: 2D Human Pose-Guided3D Crowd Human Pose and Shape Estimation in the Wild. arXiv 2021, arXiv:2104.07300. [Google Scholar]
  18. Fahad, M.S.; Deepak, A. Crowd Estimation of Real-Life Images with Different View-Points. In Proceedings of the International Conference on Innovative Computing and Communications, Delhi, India, 21–23 February 2021; pp. 1053–1062. [Google Scholar]
  19. Zhan, B.; Monekosso, D.N.; Remagnino, P.; Velastin, S.A.; Xu, L.Q. Crowd analysis: A survey. Mach. Vis. Appl. 2008, 19, 345–357. [Google Scholar] [CrossRef]
  20. Junior, J.C.S.J.; Musse, S.R.; Jung, C.R. Crowd analysis using computer vision techniques. IEEE Signal Process. Mag. 2010, 27, 66–77. [Google Scholar]
  21. Teixeira, T.; Dublon, G.; Savvides, A. A survey of human-sensing: Methods for detecting presence, count, location, track, and identity. ACM Comput. Surv. 2010, 5, 59–69. [Google Scholar]
  22. Ferryman, J.; Ellis, A.L. Performance evaluation of crowd image analysis using the PETS2009 dataset. Pattern Recognit. Lett. 2014, 44, 3–15. [Google Scholar] [CrossRef]
  23. Li, T.; Chang, H.; Wang, M.; Ni, B.; Hong, R.; Yan, S. Crowded scene analysis: A survey. IEEE Trans. Circuits Syst. Video Technol. 2014, 25, 367–386. [Google Scholar] [CrossRef] [Green Version]
  24. Hu, W.; Tan, T.; Wang, L.; Maybank, S. A survey on visual surveillance of object motion and behaviors. IEEE Trans. Syst. Man Cybern. Part C Appl. Rev. 2004, 34, 334–352. [Google Scholar] [CrossRef]
  25. Ryan, D.; Denman, S.; Sridharan, S.; Fookes, C. An evaluation of crowd counting methods, features and regression models. Comput. Vis. Image Underst. 2015, 130, 1–17. [Google Scholar] [CrossRef] [Green Version]
  26. Chan, A.B.; Liang, Z.S.J.; Vasconcelos, N. Privacy preserving crowd monitoring: Counting people without people models or tracking. In Proceedings of the 2008 IEEE Conference on Computer Vision and Pattern Recognition (CVPR), Anchorage, AK, USA, 23–28 June 2008; pp. 1–7. [Google Scholar]
  27. Ferryman, J.; Shahrokni, A. Pets2009: Dataset and challenge. In Proceedings of the 2009 Twelfth IEEE International Workshop on Performance Evaluation of Tracking and Surveillance, Snowbird, UT, USA, 7–9 December 2009; pp. 1–6. [Google Scholar]
  28. Tan, B.; Zhang, J.; Wang, L. Semi-supervised elastic net for pedestrian counting. Pattern Recognit. 2011, 44, 2297–2304. [Google Scholar] [CrossRef]
  29. Chen, K.; Loy, C.C.; Gong, S.; Xiang, T. Feature mining for localised crowd counting. BMVC 2012, 1, 3. [Google Scholar]
  30. Zhou, B.; Wang, X.; Tang, X. Understanding collective crowd behaviors: Learning a mixture model of dynamic pedestrian-agents. In Proceedings of the 2012 IEEE Conference on Computer Vision and Pattern Recognition, Providence, RI, USA, 16–21 June 2012; pp. 2871–2878. [Google Scholar]
  31. Saleh, S.A.M.; Suandi, S.A.; Ibrahim, H. Recent survey on crowd density estimation and counting for visual surveillance. Eng. Appl. Artif. Intell. 2015, 41, 103–114. [Google Scholar] [CrossRef]
  32. Zitouni, M.S.; Bhaskar, H.; Dias, J.; Al-Mualla, M.E. Advances and trends in visual crowd analysis: A systematic survey and evaluation of crowd modelling techniques. Neurocomputing 2016, 186, 139–159. [Google Scholar] [CrossRef]
  33. Grant, J.M.; Flynn, P.J. Crowd scene understanding from video: A survey. ACM Trans. Multimed. Comput. Commun. Appl. (TOMM) 2017, 13, 1–23. [Google Scholar] [CrossRef]
  34. Sindagi, V.A.; Patel, V.M. A survey of recent advances in cnn-based single image crowd counting and density estimation. Pattern Recognit. Lett. 2018, 107, 3–16. [Google Scholar] [CrossRef] [Green Version]
  35. Walach, E.; Wolf, L. Learning to count with cnn boosting. In Proceedings of the European Conference on Computer Vision, Amsterdam, The Netherlands, 11–14 October 2016; Springer: Berlin/Heidelberg, Germany, 2016; pp. 660–676. [Google Scholar]
  36. Shang, C.; Ai, H.; Bai, B. End-to-end crowd counting via joint learning local and global count. In Proceedings of the 2016 IEEE International Conference on Image Processing (ICIP), Phoenix, AZ, USA, 25–28 September 2016; pp. 1215–1219. [Google Scholar]
  37. Onoro-Rubio, D.; López-Sastre, R.J. Towards perspective-free object counting with deep learning. In Proceedings of the European Conference on Computer Vision, Amsterdam, The Netherlands, 11–14 October 2016; Springer: Berlin/Heidelberg, Germany, 2016; pp. 615–629. [Google Scholar]
  38. Kang, D.; Ma, Z.; Chan, A.B. Beyond counting: Comparisons of density maps for crowd analysis tasks—Counting, detection, and tracking. IEEE Trans. Circuits Syst. Video Technol. 2018, 29, 1408–1422. [Google Scholar] [CrossRef]
  39. Tripathi, G.; Singh, K.; Vishwakarma, D.K. Convolutional neural networks for crowd behaviour analysis: A survey. Vis. Comput. 2019, 35, 753–776. [Google Scholar] [CrossRef]
  40. Gao, G.; Gao, J.; Liu, Q.; Wang, Q.; Wang, Y. Cnn-based density estimation and crowd counting: A survey. arXiv 2020, arXiv:2003.12783. [Google Scholar]
  41. Yan, Z.; Yuan, Y.; Zuo, W.; Tan, X.; Wang, Y.; Wen, S.; Ding, E. Perspective-guided convolution networks for crowd counting. In Proceedings of the IEEE/CVF International Conference on Computer Vision, Seoul, Korea, 27 October–2 November 2019; pp. 952–961. [Google Scholar]
  42. Xiong, H.; Lu, H.; Liu, C.; Liang, L.; Cao, Z.; Shen, C. From Open Set to Closed Set: Counting Objects by Spatial Divide-and-Conquer. In Proceedings of the IEEE/CVF International Conference on Computer Vision (ICCV), Seoul, Korea, 27 October–2 November 2019; pp. 8362–8371. [Google Scholar]
  43. Tian, Y.; Lei, Y.; Zhang, J.; Wang, J.Z. Padnet: Pan-density crowd counting. IEEE Trans. Image Process. 2019, 29, 2714–2727. [Google Scholar] [CrossRef] [PubMed] [Green Version]
  44. Kleinmeier, B.; Zönnchen, B.; Gödel, M.; Köster, G. Vadere: An open-source simulation framework to promote interdisciplinary understanding. arXiv 2019, arXiv:1907.09520. [Google Scholar] [CrossRef] [Green Version]
  45. Maury, B.; Faure, S. Crowds in Equations: An Introduction to the Microscopic Modeling of Crowds; World Scientific: Singapore, 2018. [Google Scholar]
  46. Curtis, S.; Best, A.; Manocha, D. Menge: A modular framework for simulating crowd movement. Collect. Dyn. 2016, 1, 1–40. [Google Scholar] [CrossRef]
  47. Wagoum, A.K.; Chraibi, M.; Zhang, J.; Lämmel, G. JuPedSim: An open framework for simulating and analyzing the dynamics of pedestrians. In Proceedings of the 3rd Conference of Transportation Research Group of India, Kolkata, India, 17–20 December 2015; Volume 12. [Google Scholar]
  48. Grimm, V.; Revilla, E.; Berger, U.; Jeltsch, F.; Mooij, W.M.; Railsback, S.F.; Thulke, H.H.; Weiner, J.; Wiegand, T.; DeAngelis, D.L. Pattern-oriented modeling of agent-based complex systems: Lessons from ecology. Science 2005, 310, 987–991. [Google Scholar] [CrossRef] [Green Version]
  49. Van Den Berg, J.; Patil, S.; Sewall, J.; Manocha, D.; Lin, M. Interactive navigation of multiple agents in crowded environments. In Proceedings of the 2008 Symposium on Interactive 3D Graphics and Games, Redwood City, CA, USA, 15–17 February 2008; pp. 139–147. [Google Scholar]
  50. McGrattan, K.; Hostikka, S.; McDermott, R.; Floyd, J.; Weinschenk, C.; Overholt, K. Fire dynamics simulator user’s guide. NIST Spec. Publ. 2013, 1019, 1–339. [Google Scholar]
  51. Idrees, H.; Saleemi, I.; Seibert, C.; Shah, M. Multi-source multi-scale counting in extremely dense crowd images. In Proceedings of the IEEE Conference on Computer Vision and Pattern Recognition, Portland, OR, USA, 23–28 June 2013; pp. 2547–2554. [Google Scholar]
  52. Sindagi, V.A.; Patel, V.M. Generating high-quality crowd density maps using contextual pyramid cnns. In Proceedings of the 2017 IEEE International Conference on Computer Vision (ICCV), Venice, Italy, 22–29 October 2017; pp. 1879–1888. [Google Scholar]
  53. Wang, Q.; Gao, J.; Lin, W.; Li, X. NWPU-Crowd: A Large-Scale Benchmark for Crowd Counting and Localization. IEEE Trans. Pattern Anal. Mach. Intell. 2020. [Google Scholar] [CrossRef]
  54. Sindagi, V.A.; Yasarla, R.; Patel, V.M. JHU-CROWD++: Large-Scale Crowd Counting Dataset and A Benchmark Method. IEEE Trans. Pattern Anal. Mach. Intell. 2020. [Google Scholar] [CrossRef]
  55. Idrees, H.; Tayyab, M.; Athrey, K.; Zhang, D.; Al-Maadeed, S.; Rajpoot, N.; Shah, M. Composition loss for counting, density map estimation and localization in dense crowds. In Proceedings of the European Conference on Computer Vision (ECCV), Glasgow, UK, 23–28 August 2018; pp. 532–546. [Google Scholar]
  56. Hu, D.; Mou, L.; Wang, Q.; Gao, J.; Hua, Y.; Dou, D.; Zhu, X.X. Ambient Sound Helps: Audiovisual Crowd Counting in Extreme Conditions. arXiv 2020, arXiv:2005.07097. [Google Scholar]
  57. Lian, D.; Li, J.; Zheng, J.; Luo, W.; Gao, S. Density Map Regression Guided Detection Network for RGB-D Crowd Counting and Localization. In Proceedings of the IEEE Conference on Computer Vision and Pattern Recognition (CVPR), Long Beach, CA, USA, 15–20 June 2019. [Google Scholar]
  58. Fang, Y.; Zhan, B.; Cai, W.; Gao, S.; Hu, B. Locality-constrained Spatial Transformer Network for Video Crowd Counting. arXiv 2019, arXiv:1907.07911. [Google Scholar]
  59. Wang, Q.; Gao, J.; Lin, W.; Yuan, Y. Learning from Synthetic Data for Crowd Counting in the Wild. In Proceedings of the IEEE Conference on Computer Vision and Pattern Recognition (CVPR), Long Beach, CA, USA, 16–20 June 2019; pp. 8198–8207. [Google Scholar]
  60. Liu, W.; Lis, K.M.; Salzmann, M.; Fua, P. Geometric and Physical Constraints for Drone-Based Head Plane Crowd Density Estimation. In Proceedings of the IEEE/RSJ International Conference on Intelligent Robots and Systems (IROS), Macau, China, 3–8 November 2019. [Google Scholar]
  61. Zhang, Q.; Chan, A.B. Wide-Area Crowd Counting via Ground-Plane Density Maps and Multi-View Fusion CNNs. In Proceedings of the IEEE Conference on Computer Vision and Pattern Recognition, Long Beach, CA, USA, 15–20 June 2019; pp. 8297–8306. [Google Scholar]
  62. Deng, L.; Wang, S.H.; Zhang, Y.D. Fully Optimized Convolutional Neural Network Based on Small-Scale Crowd. In Proceedings of the 2020 IEEE International Symposium on Circuits and Systems (ISCAS), Seville, Spain, 12–14 October 2020; pp. 1–5. [Google Scholar]
  63. Mallapuram, S.; Ngwum, N.; Yuan, F.; Lu, C.; Yu, W. Smart city: The state of the art, datasets, and evaluation platforms. In Proceedings of the 2017 IEEE/ACIS 16th International Conference on Computer and Information Science (ICIS), Wuhan, China, 24–26 May 2017; pp. 447–452. [Google Scholar]
  64. Lim, M.K.; Kok, V.J.; Loy, C.C.; Chan, C.S. Crowd saliency detection via global similarity structure. In Proceedings of the IEEE 2014 22nd International Conference on Pattern Recognition, Stockholm, Sweden, 24–28 August 2014; pp. 3957–3962. [Google Scholar]
  65. Zhang, C.; Kang, K.; Li, H.; Wang, X.; Xie, R.; Yang, X. Data-driven crowd understanding: A baseline for a large-scale crowd dataset. IEEE Trans. Multimed. 2016, 18, 1048–1061. [Google Scholar] [CrossRef]
  66. Bahmanyar, R.; Vig, E.; Reinartz, P. MRCNet: Crowd counting and density map estimation in aerial and ground imagery. arXiv 2019, arXiv:1909.12743. [Google Scholar]
  67. Zhu, P.; Wen, L.; Du, D.; Bian, X.; Hu, Q.; Ling, H. Vision Meets Drones: Past, Present and Future. arXiv 2020, arXiv:2001.06303. [Google Scholar]
  68. Zhu, P.; Sun, Y.; Wen, L.; Feng, Y.; Hu, Q. Drone Based RGBT Vehicle Detection and Counting: A Challenge. arXiv 2020, arXiv:2003.02437. [Google Scholar]
  69. Chen, L.; Wang, G.; Hou, G. Multi-scale and multi-column convolutional neural network for crowd density estimation. Multimed. Tools Appl. 2021, 80, 6661–6674. [Google Scholar] [CrossRef]
  70. Guo, L.; Zhou, W. Crowd Density Estimation Based on Multi-Column Hybrid Convolutional Network. J. Phys. Conf. Ser. 2021, 1828, 012025. [Google Scholar] [CrossRef]
  71. Jingying, W. A Survey on Crowd Counting Methods and Datasets. In Advances in Computer, Communication and Computational Sciences; Springer: Berlin/Heidelberg, Germany, 2021; pp. 851–863. [Google Scholar]
  72. Ma, Y.J.; Shuai, H.H.; Cheng, W.H. Spatiotemporal Dilated Convolution with Uncertain Matching for Video-based Crowd Estimation. IEEE Trans. Multimed. 2021. [Google Scholar] [CrossRef]
  73. Chen, H.; Guo, P.; Li, P.; Lee, G.H.; Chirikjian, G. Multi-person 3D Pose Estimation in Crowded Scenes Based on Multi-view Geometry. In Proceedings of the European Conference on Computer Vision, Glasgow, UK, 23–28 August 2020; Springer: Berlin/Heidelberg, Germany, 2020; pp. 541–557. [Google Scholar]
  74. Benzine, A.; Chabot, F.; Luvison, B.; Pham, Q.C.; Achard, C. Pandanet: Anchor-based single-shot multi-person 3d pose estimation. In Proceedings of the IEEE/CVF Conference on Computer Vision and Pattern Recognition, Seattle, WA, USA, 13–19 June 2020; pp. 6856–6865. [Google Scholar]
  75. Song, J.Y.; Chung, J.J.Y.; Fouhey, D.F.; Lasecki, W.S. C-Reference: Improving 2D to 3D Object Pose Estimation Accuracy via Crowdsourced Joint Object Estimation. Proc. ACM Hum.-Comput. Interact. 2020, 4, 1–28. [Google Scholar] [CrossRef]
  76. Chen, H.; Guo11, P.; Li, P.; Lee, G.H.; Chirikjian, G. Multi-person 3D Pose Estimation in Crowded Scenes Based on Multi-View Geometry—Supplementary Material. Available online: https://www.ecva.net/papers/eccv_2020/papers_ECCV/papers/123480545.pdf (accessed on 10 January 2021).
  77. Hashmi, M.F.; Ashish, B.K.K.; Keskar, A.G. GAIT analysis: 3D pose estimation and prediction in defence applications using pattern recognition. In Proceedings of the Twelfth International Conference on Machine Vision (ICMV 2019), International Society for Optics and Photonics, Amsterdam, The Netherlands, 16–18 November 2020; Volume 11433, p. 114330S. [Google Scholar]
  78. Zheng, C.; Zhu, S.; Mendieta, M.; Yang, T.; Chen, C.; Ding, Z. 3d human pose estimation with spatial and temporal transformers. arXiv 2021, arXiv:2103.10455. [Google Scholar]
  79. Li, W.; Liu, H.; Ding, R.; Liu, M.; Wang, P. Lifting Transformer for 3D Human Pose Estimation in Video. arXiv 2021, arXiv:2103.14304. [Google Scholar]
  80. Kumarapu, L.; Mukherjee, P. Animepose: Multi-person 3d pose estimation and animation. Pattern Recognit. Lett. 2021, 147, 16–24. [Google Scholar] [CrossRef]
  81. Epic Games; Unreal Engine/The Most Powerful Real-Time 3D Creation Platform. Available online: https://www.unrealengine.com (accessed on 10 January 2021).
  82. Human, M. Make Human. Available online: http://www.makehumancommunity.org/ (accessed on 22 February 2021).
  83. AXYZ; Anima. Available online: https://secure.axyz-design.com/ (accessed on 5 March 2021).
  84. Schönberger, J.L.; Frahm, J.M. Colmap/Structure-from-Motion Revisited. Available online: https://colmap.github.io/ (accessed on 21 April 2021).
  85. Schops, T.; Schonberger, J.L.; Galliani, S.; Sattler, T.; Schindler, K.; Pollefeys, M.; Geiger, A. A multi-view stereo benchmark with high-resolution images and multi-camera videos. In Proceedings of the IEEE Conference on Computer Vision and Pattern Recognition, Honolulu, HI, USA, 21–26 July 2017; pp. 3260–3269. [Google Scholar]
  86. Stathopoulou, E.K.; Remondino, F. Open-source image-based 3D reconstruction pipelines: Review, comparison and evaluation. In Proceedings of the 6th International Workshop LowCost 3D—Sensors, Algorithms, Applications, Strasbourg, France, 2–3 December 2019; ISPRS: Strasbourg, France, 2019; pp. 331–338. [Google Scholar]
  87. Leudet, J.; Mikkonen, T.; Christophe, F.; Männistö, T. Virtual Environment for Training Autonomous Vehicles. In Proceedings of the Annual Conference Towards Autonomous Robotic Systems, Bristol, UK, 25–27 July 2018; Springer: Berlin/Heidelberg, Germany, 2018; pp. 159–169. [Google Scholar]
  88. Kazhdan, M.; Hoppe, H. Screened poisson surface reconstruction. ACM Trans. Graph. (ToG) 2013, 32, 1–13. [Google Scholar] [CrossRef] [Green Version]
  89. Contributor, Wiki. Iterative Closest Point. Available online: https://en.wikipedia.org/wiki/Iterative_Closest_Point (accessed on 24 June 2021).
  90. Marden, S.; Guivant, J. Improving the performance of ICP for real-time applications using an approximate nearest neighbour search. In Proceedings of the Australasian Conference on Robotics and Automation, Wellington, New Zealand, 3–5 December 2012; pp. 1–6. [Google Scholar]
  91. Muja, M.; Lowe, D.G. Fast approximate nearest neighbors with automatic algorithm configuration. VISAPP (1) 2009, 2, 2. [Google Scholar]
  92. Sam, D.B.; Peri, S.V.; Sundararaman, M.N.; Kamath, A.; Radhakrishnan, V.B. Locate, Size and Count: Accurately Resolving People in Dense Crowds via Detection. IEEE Trans. Pattern Anal. Mach. Intell. 2020. [Google Scholar] [CrossRef]
  93. Sindagi, V.A.; Patel, V.M. Cnn-based cascaded multi-task learning of high-level prior and density estimation for crowd counting. In Proceedings of the 2017 14th IEEE International Conference on Advanced Video and Signal Based Surveillance (AVSS), Lecce, Italy, 29 August–1 September 2017; pp. 1–6. [Google Scholar]
  94. Liu, H.; Wang, S.; Zhao, D. Initial alignment for point cloud registration by improved differential evolution algorithm. Optik 2021, 243, 166856. [Google Scholar] [CrossRef]
  95. Li, L. A Crowd Density Detection Algorithm for Tourist Attractions Based on Monitoring Video Dynamic Information Analysis. Complexity 2020, 2020, 6635446. [Google Scholar] [CrossRef]
  96. Penmetsa, S.; Minhuj, F.; Singh, A.; Omkar, S. Autonomous UAV for suspicious action detection using pictorial human pose estimation and classification. ELCVIA Electron. Lett. Comput. Vis. Image Anal. 2014, 13, 0018–0032. [Google Scholar] [CrossRef] [Green Version]
  97. Zhou, B.; Tang, X.; Wang, X. Learning collective crowd behaviors with dynamic pedestrian-agents. Int. J. Comput. Vis. 2015, 111, 50–68. [Google Scholar] [CrossRef] [Green Version]
Figure 1. The figure demonstrates various steps involved before simulating the crowd, whereas (a) shows the skeleton design sample of a person containing in-depth details which can be exported and further used in UE4, (b) shows one of the samples designed to be a part of the crowd, (c) contains the basic template for the first person used as a map to place various objects, (d) demonstrates the designing and animating of the mesh. A tree sample has been presented in this image. (e) shows a sample blueprint command line to calibrate and establish the working between different objects, (f) shows an initial output map designed before placing the crowd in the environment, (g) demonstrates how different crowd samples look like when they are ready for simulation, (h) depicts the final image after starting the simulation where the image was captured from the top view and showed our UAV prototype used in UE4, (il) demonstrates various scenarios where the crowd was randomly distributed in diverse settings.
Remotesensing 13 02780 g001
Figure 2. The flowchart presents the whole pipeline for capturing synthetic data with a 3D simulation system.
Remotesensing 13 02780 g002
Figure 3. The pipeline shows the steps involved in testing of synthetic data against publically available crowd data set.
Remotesensing 13 02780 g003
Figure 4. The figure depicts the network architecture design and overview of single image crowd counting via multi-column network.
Remotesensing 13 02780 g004
Figure 5. The system architecture diagram provides a detail representation and steps involved in our approach to crowd estimation using UAV.
Remotesensing 13 02780 g005
Figure 6. The figure shows the demonstrations from Steps (1–2), where the synthetic image has been captured from the UAV.
Remotesensing 13 02780 g006
Figure 7. The figure shows the demonstrations of step 3, whereas (a) shows the network output from MCNN in the form of density map and (b) represents the Step 3, where the blob detected from the density map are shown and further used for mapping and tracing the crowd.
Remotesensing 13 02780 g007
Figure 8. The image presents the first step of COLMAP 3D reconstruction where a set of simulated overlapped images have been provided as an input.
Remotesensing 13 02780 g008
Figure 9. The figure shows the UAV path trajectory. The data was captured by following a circular path to store every crowd detail from the scene.
Remotesensing 13 02780 g009
Figure 10. The figure explains the final step involved in the COLMAP reconstruction. A 3D model has been provided as an output.
Remotesensing 13 02780 g010
Figure 11. The figure shows the original 3D Model reconstructed using five humanoid prototypes.
Remotesensing 13 02780 g011
Figure 12. The figure has traced points back projected to the point cloud, while reconstructing the original model.
Remotesensing 13 02780 g012
Figure 13. This graph shows the estimated and ground truth count of the CMTL method tested using ShanghaiTech data set.
Remotesensing 13 02780 g013
Figure 14. The graph shows the comparison between the ground truth (GT) and the estimated count (ET) that were tested against the CNN-based Cascaded Multitask Learning of High-level Prior and Density Estimation for Crowd Counting (CMTL) [93] method using the aerial synthetic images. We randomly selected 140 images from the synthetic data for testing and compared them against the ground truth.
Remotesensing 13 02780 g014
Figure 15. The figure shows the output from the ICP. The plot shows the GT points as P and possible estimated points as MQ.
Remotesensing 13 02780 g015
Table 1. Summary of Open-Source Simulators and Supporting Libraries.
SimulatorLanguageOS2D/3DIntended Use
Vadere [44]JavaWindows, Linux2DCrowd Dynamics
Cromosim [45]Python LibraryWindows2DCrowd Motion
Menge [46]C++Windows, LinuxBothCross-Platform
Crowd DynamicsPythonUbuntu 16.042D-
PEDSIMC++Win, Linux2DPedestrian Library
JuPedSim [47]Python, C++Windows, Linux2DPedestrian Dynamics
Mesa [48]JavaWindows, JVM2DCrowd Simulation
RVO2 [49]C++-2DMobile Robots
Fire Dynamics [50]-Windows, MacOS2DFire Dynamics
Agent.JLJulia-2DAgent-Based Model
Table 2. Summary of Different Free-View Crowd Data Sets.
Data SetYearAttributeNo. SamplesNo. InstancesAvg. Count
NWPU-Crowd [53]2020Localization51092,133,375418
JHU-CROWD++ [54]2020Congested43721,515,005346
UCF-QNRF [55]2018Congested15351,251,642815
SanghaiTech Part A [10]2016Congested482241,677501
UCF_CC_50 [51]2013Congested5063,9741279
Table 3. Summary of Different Surveillance-View Crowd Data Sets.
Data SetYearAttributeNo. SamplesNo. InstancesAvg. Count
DISCO [56]2020Audiovisual1935170,27088
Crowd Surveillance [41]2019Free scenes13,945386,51328
ShanghaiTechRGBD [57]2019Depth---
Fudan-ShanghaiTech [58]2019Video15,000394,08127
GCC [59]2019400 Fixed Scenes15,2117,625,843501
Venice [60]20194 Fixed Scenes167--
CityStreet [61]2019Multiview500--
Beijing-BRT [62]20191 Fixed Scene128016,79513
SmartCity [63]2018-503697
CityUHK-X [61]201755 Fixed Scenes3191106,78333
ShanghaiTech Part B [10]2016Free Scenes71688,488123
AHU-Crowd [64]2016-10745,000421
WorldExpo’10 [65]2015108 Fixed Scenes3980199,92350
Mall [29]20121 Fixed Scene200062,32531
UCSD [26]20081 Fixed Scene200049,88525
Table 4. Summary of Different Drone-View Crowd Data Sets.
Data SetYearAttributeNo. SamplesNo. InstancesAvg. Count
DroneVehicle [68]2020Vehicle31,064441,64214.2
DroneCrowd [67]2019Video33,6004,864,280145
DLR-ACD [66]20191 Fixed Scene33226,2916857
Table 5. Testing of Our Data against Shanghai Tech Part_A (SHA) using state-of-the-art methods where the highlighted text demonstrates the methods which performed better on our data set.
MethodsSHAOur Data Set
MAERMSEMAERMSE
S-DCNet [42]58.395.064.4103.2
LSC-CNN [92]66.4117.072.7128.3
CMTL [93]101.3152.427.634.6
MCNN [10]110.2173.257.272.2
Table 6. Comparison of aerial crowd data set against state-of-the-art methods.
MethodsDLR_ACD [66]VisDrone2020-CC [67]Our Data Set
MAERMSEMAERMSEMAERMSE
LSC-CNN [92]71.4104.365.41107.464.4103.2
S-DCNet [42]76.3134.871.39123.572.7128.3
CMTL [93]97.2168.2103.4148.227.634.6
MCNN [10]122.1193.6118.6169.657.272.2
Table 7. The table presents the results of CMTL model, MCNN model and our synthetic data trained model that were tested against the ShanghaiTech data set.
MethodSHA
MAERMSE
CMTL Model101.3152.4
Our Model98.08131.22
MCNN Model110.2173.2
Our Model117.01194.79
Table 8. The table shows the output of synthetic data model tested against our synthetic data set.
MethodsMAERMSE
CMTL8.5810.39
MCNN17.4324.46
Table 9. The table shows the results for 3D crowd estimation using UAV method.
RMSEAccuracyPrecisionRecallF1
0.000274889.23%94.30%95.86%0.9507
Publisher’s Note: MDPI stays neutral with regard to jurisdictional claims in published maps and institutional affiliations.

