Article

Superior PM2.5 Estimation by Integrating Aerosol Fine Mode Data from the Himawari-8 Satellite in Deep and Classical Machine Learning Models

1
State Key Laboratory of Remote Sensing Science, College of Global Change and Earth System Science, Beijing Normal University, Beijing 100875, China
2
Department of Land Surveying and Geo-Informatics, The Hong Kong Polytechnic University, Hong Kong, China
*
Author to whom correspondence should be addressed.
Remote Sens. 2021, 13(14), 2779; https://doi.org/10.3390/rs13142779
Submission received: 5 June 2021 / Revised: 9 July 2021 / Accepted: 12 July 2021 / Published: 15 July 2021
(This article belongs to the Special Issue Remote Sensing of Aerosols and Gases in Cities)

Abstract

:
Artificial intelligence is widely applied to estimate ground-level fine particulate matter (PM2.5) from satellite data by constructing the relationship between the aerosol optical thickness (AOT) and the surface PM2.5 concentration. However, aerosol size properties, such as the fine mode fraction (FMF), are rarely considered in satellite-based PM2.5 modeling, especially in machine learning models. This study investigated the linear and non-linear relationships between fine mode AOT (fAOT) and PM2.5 over five AERONET stations in China (Beijing, Baotou, Taihu, Xianghe, and Xuzhou) using AERONET fAOT and 5-year (2015–2019) ground-level PM2.5 data. Results showed that the fAOT separated by the FMF (fAOT = AOT × FMF) had significant linear and non-linear relationships with surface PM2.5. Then, the Himawari-8 V3.0 and V2.1 FMF and AOT (FMF&AOT-PM2.5) data were tested as input to a deep learning model and four classical machine learning models. The results showed that FMF&AOT-PM2.5 performed better than AOT (AOT-PM2.5) in modelling PM2.5 estimations. The FMF was then applied in satellite-based PM2.5 retrieval over China during 2020, and FMF&AOT-PM2.5 was found to have a better agreement with ground-level PM2.5 than AOT-PM2.5 on dust and haze days. The better linear correlation between PM2.5 and fAOT on both haze and dust days (dust days: R = 0.82; haze days: R = 0.56) compared to AOT (dust days: R = 0.72; haze days: R = 0.52) partly contributed to the superior accuracy of FMF&AOT-PM2.5. This study demonstrates the importance of including the FMF to improve PM2.5 estimations and emphasizes the need for a more accurate FMF product that enables superior PM2.5 retrieval.

Graphical Abstract

1. Introduction

Accurate monitoring of particulate matter that has a diameter of less than 2.5 µm (PM2.5) is vital to the atmospheric environment and human health [1,2]. Ground-based PM2.5 monitoring sites have limited connectivity and thus lack extensive spatial coverage; this in turn restricts investigations of spatial dynamics of PM2.5 and its impact on human health. To overcome this issue, satellite-based remote sensing has been widely used to obtain spatially continuous ground-level PM2.5 values [3]. Given their significant linear correlation, traditional satellite-based PM2.5 estimations mostly rely on building models between the aerosol optical thickness (AOT) and PM2.5 (Figure 1) [4]. Such models include empirical statistical models [5,6], chemical transport models [7], and physical models [8]. AOT products can be commonly obtained at various spatial and temporal resolutions by many satellites, such as the Moderate Resolution Imaging Spectroradiometer (MODIS) [9], the Ozone Monitoring Instrument (OMI) [10], the Visible Infrared Imaging Radiometer Suite (VIIRS) [11], and the Advanced Himawari Imager (AHI) onboard Himawari-8 [12].
AOT is an assembled optical parameter that associates with the columnar quantity of all sizes of suspended particles, as well as their composition, mixing state, density, vertical distribution, and so on, while PM2.5 is the near-surface concentration of small-sized particulate matter with an aerodynamic diameter of less than 2.5 µm. Therefore, it is difficult to find a general and uniform expression that directly converts AOT to PM2.5, and this issue has been widely ignored in previous estimations of PM2.5 [13]. The impact of fine mode fraction (FMF) on the correlation between PM2.5 and AOT is non-negligible [14], and studies have used FMF to separate the contribution of fine particles from AOT [15]. In this respect, Yan et al. [16] used ground-based experimental data of a one-month duration and found that the linear correlation between fAOT and PM2.5 (R = 0.74) was higher than the correlation between AOT and PM2.5 (R = 0.49); this result provides evidence that fAOT is more suitable for use in estimating PM2.5.
In recent years, machine learning models have been extensively applied in PM2.5 estimations [17,18] because of their ability to capture the nonlinear relationship between PM2.5 and AOT [19,20]. However, to our knowledge, in over 100 studies based on machine learning retrieved PM2.5 (Table S1) during 2014–2021, most employed the AOT for PM2.5 estimations. Only a limited number of studies have considered utilizing aerosol size information, such as the FMF, as the input parameter for the model. Therefore, the role of FMF in machine learning-based PM2.5 retrieval models requires further intensive investigation.
Unfortunately, the reliability and accuracy of FMF data hinders its application in modeling PM2.5. Only a limited number of satellites, such as the MODIS, Himawari-8, the Geostationary Ocean Color Imager (GOCI), and Polarization and Directionality of Earth’s Reflectance (POLDER) provide FMF or fAOT products, albeit with poor accuracy. Levy et al. [21] reported that the MODIS-retrieved FMF over land remained highly uncertain, and it was then deleted in the MODIS Collection 6 global aerosol dataset (MOD08 and MYD08). For Himawari-8, Yang et al. [22] found that its V2.1 FMF data had a low accuracy (with a high RMSE of 0.30). Furthermore, Choi et al. [23] evaluated the GOCI FMF with AERONET FMF for AERONET AOD > 0.3, and the results showed a mediocre RMSE of 0.264. Therefore, the lack of satellite-based FMF data accuracy makes it difficult to explore the role of aerosol size information in estimating PM2.5. POLDER/Generalized Retrieval of Aerosol and Surface Properties (GRASP) FMF has substantially improved agreement with ground measurements compared with MODIS FMF [24,25], with an RMSE of 0.170 in China. However, the POLDER/FMF provided global coverage every two days, which results in a coarse temporal resolution compared to MODIS [26].
Nevertheless, Himawari-8, which was launched on 7 October 2014, is a promising geostationary satellite in this respect. It contains a state-of-the-art imager, the Advanced Himawari Imager (AHI), with 16 spectral bands from visible to infrared at high spatial (0.5–1.0 km at nadir for the visible and near-infrared bands, and 2 km at nadir for the infrared bands) and temporal (10 min for full disk coverage) resolutions [12]. This unparalleled spatiotemporal resolution enables detailed observations of aerosol properties to be made, and AOT and aerosol size information (the AE (Ångström exponent) and FMF) can be obtained over Asia and Oceania [27]. Himawai-8 updated its aerosol products from V2.1 to V3.0 on 30 October 2020, providing a valuable opportunity for investigating the impact of FMF on the accuracy of PM2.5 estimations in machine learning modeling.
Therefore, this study aimed to determine the relationships between fAOT and PM2.5 using the FMF, and then test the use of the FMF in the PM2.5 retrieval ability of deep learning and classical machine models. Applying FMF in these models has rarely been considered in previous studies. By comparing the V2.1 and V3.0 Himawari-8 aerosol products (AE and FMF), we ascertained whether the improved FMF results enabled highly accurate PM2.5 estimations. This study not only enhances our understanding of the use of aerosol size information and the FMF in satellite-based PM2.5 retrieval by machine learning models, but also emphasizes the importance of a more accurate FMF product in PM2.5 retrieval.

2. Data and Methods

2.1. Study Area and Himawari-8 V2.1 & V3.0 Aerosol Products

Himawari-8 hovers over the equator at 140E longitude and has an observation range of 80E–160W and 60S–60N. Figure S1 shows the geographical domain of Himawari-8 covering East Asia, Southeast Asia, Oceania, and the western Pacific Ocean. China is one of the largest developing countries within its domain, and it has experienced severe air pollution in recent years [28].
Himawari-8/AHI aerosol products were derived based on the methods of Fukuda et al. [29] and Yoshida et al. [30]. V2.1 has now been upgraded to V3.0, and the improvements include the use of canonical correlation analysis and a model forecast to enable an a priori estimate of retrieval. Himawari-8 V3.0 provides products that include AE at 440–675 nm and FMF over land and ocean, with spatial and temporal resolutions of 0.05° and 10 min, respectively; therefore, Himawari-8 V3.0 products can provide sufficient samples and detailed information about daily variations in aerosols [31]. The Himawari-8 V3.0 dataset also includes the Quality Assurance Flags of four values (“very good,” “good,” “marginal,” “no confidence”); only “very good” products were considered in this study.

2.2. AERONET V3.0 Level 1.5 and Level 2.0

In this study, AERONET data were used to explore the role of FMF in estimating PM2.5. AERONET is a globally distributed network of sun/sky radiometers that provide data with a low uncertainty and high temporal resolution (15 min) for all sites [32]. AERONET data were provided in different quality levels: level 1.0 (unscreened), level 1.5 (L1.5, cloud-screened and quality controlled) and L2 (cloud-screened and quality assured). In this study, the newly updated version 3 (V3.0) level 2 (L2) spectral deconvolution algorithm (SDA) data, including AOT [33], AE, and FMF [34], were selected when available. Although L1.5 data have comparatively higher uncertainty than L2 data, L1.5 were used when L2 data were inadequate or unavailable. The distribution of the selected 89 AERONET stations is shown in Figure S1, and detailed information is given in Table S2.
It should be noted that AERONET SDA FMF is assumed as the weighting between one fine mode and one coarse mode, separating by spectral fashion [34]. While the fine and coarse mode in Himawari-8 is regarded as a monomodal lognormal volume size distribution with a defined radius cutoff for fine (0.143 μm) and coarse (2.834 μm) mode [30], for MODIS and VIIRS, FMF is defined as the contribution of fine-dominated aerosol to AOT, where the fine-dominated aerosol actually contains a coarse mode [35,36]. Therefore, these satellite FMF products and SDA FMF are not physically identical. However, AERONET SDA FMF is still considered comparable to satellite FMF products [35,37] and is widely used in FMF validation [22,38], thus, we use the AERONET SDA FMF as the ground truth in this study. Moreover, in satellite retrievals, the equation of fAOT = AOT × FMF is based on the assumption of single scattering approximation, which is suitable over the ocean. While over land, this could be problematic when AOT is high [39].

2.3. Ground-Based PM2.5, Meteorological, and Radiosonde Data

To investigate the impact of aerosol size data on estimations over China, the ground-based hourly PM2.5 data were collected from the National Urban Air Quality Real-Time Publishing Platform. 1701 PM2.5 monitoring stations’ data were obtained and their distributions showed in Figure S2a. The PM2.5 data from 2015–2019 were used to explore the relationship between fAOT and PM2.5, then the PM2.5 data in 2020 were used to test the satellite-based PM2.5 retrieval accuracy with or without aerosol size information. Meteorological factors are important for estimating PM2.5 [40], and the in situ meteorological data were obtained from the National Center for Environment Information (NCEI). Via 405 meteorological stations over China (Figure S2c), temperature, dew point temperature, and wind speed data were obtained, and the relative humidity (RH) was further determined by temperature and dew point temperature. In addition, the data at 8:00 am (local time) for 95 radiosonde stations from Integrated Global Radiosonde Archive (IGRA) (Figure S2b) were collected, and the daytime boundary layer height (PBLH) was determined by the ‘parcel method’ [41,42], which is the height with the same virtual potential temperature as the surface one.

2.4. Classical Machine Learning Models

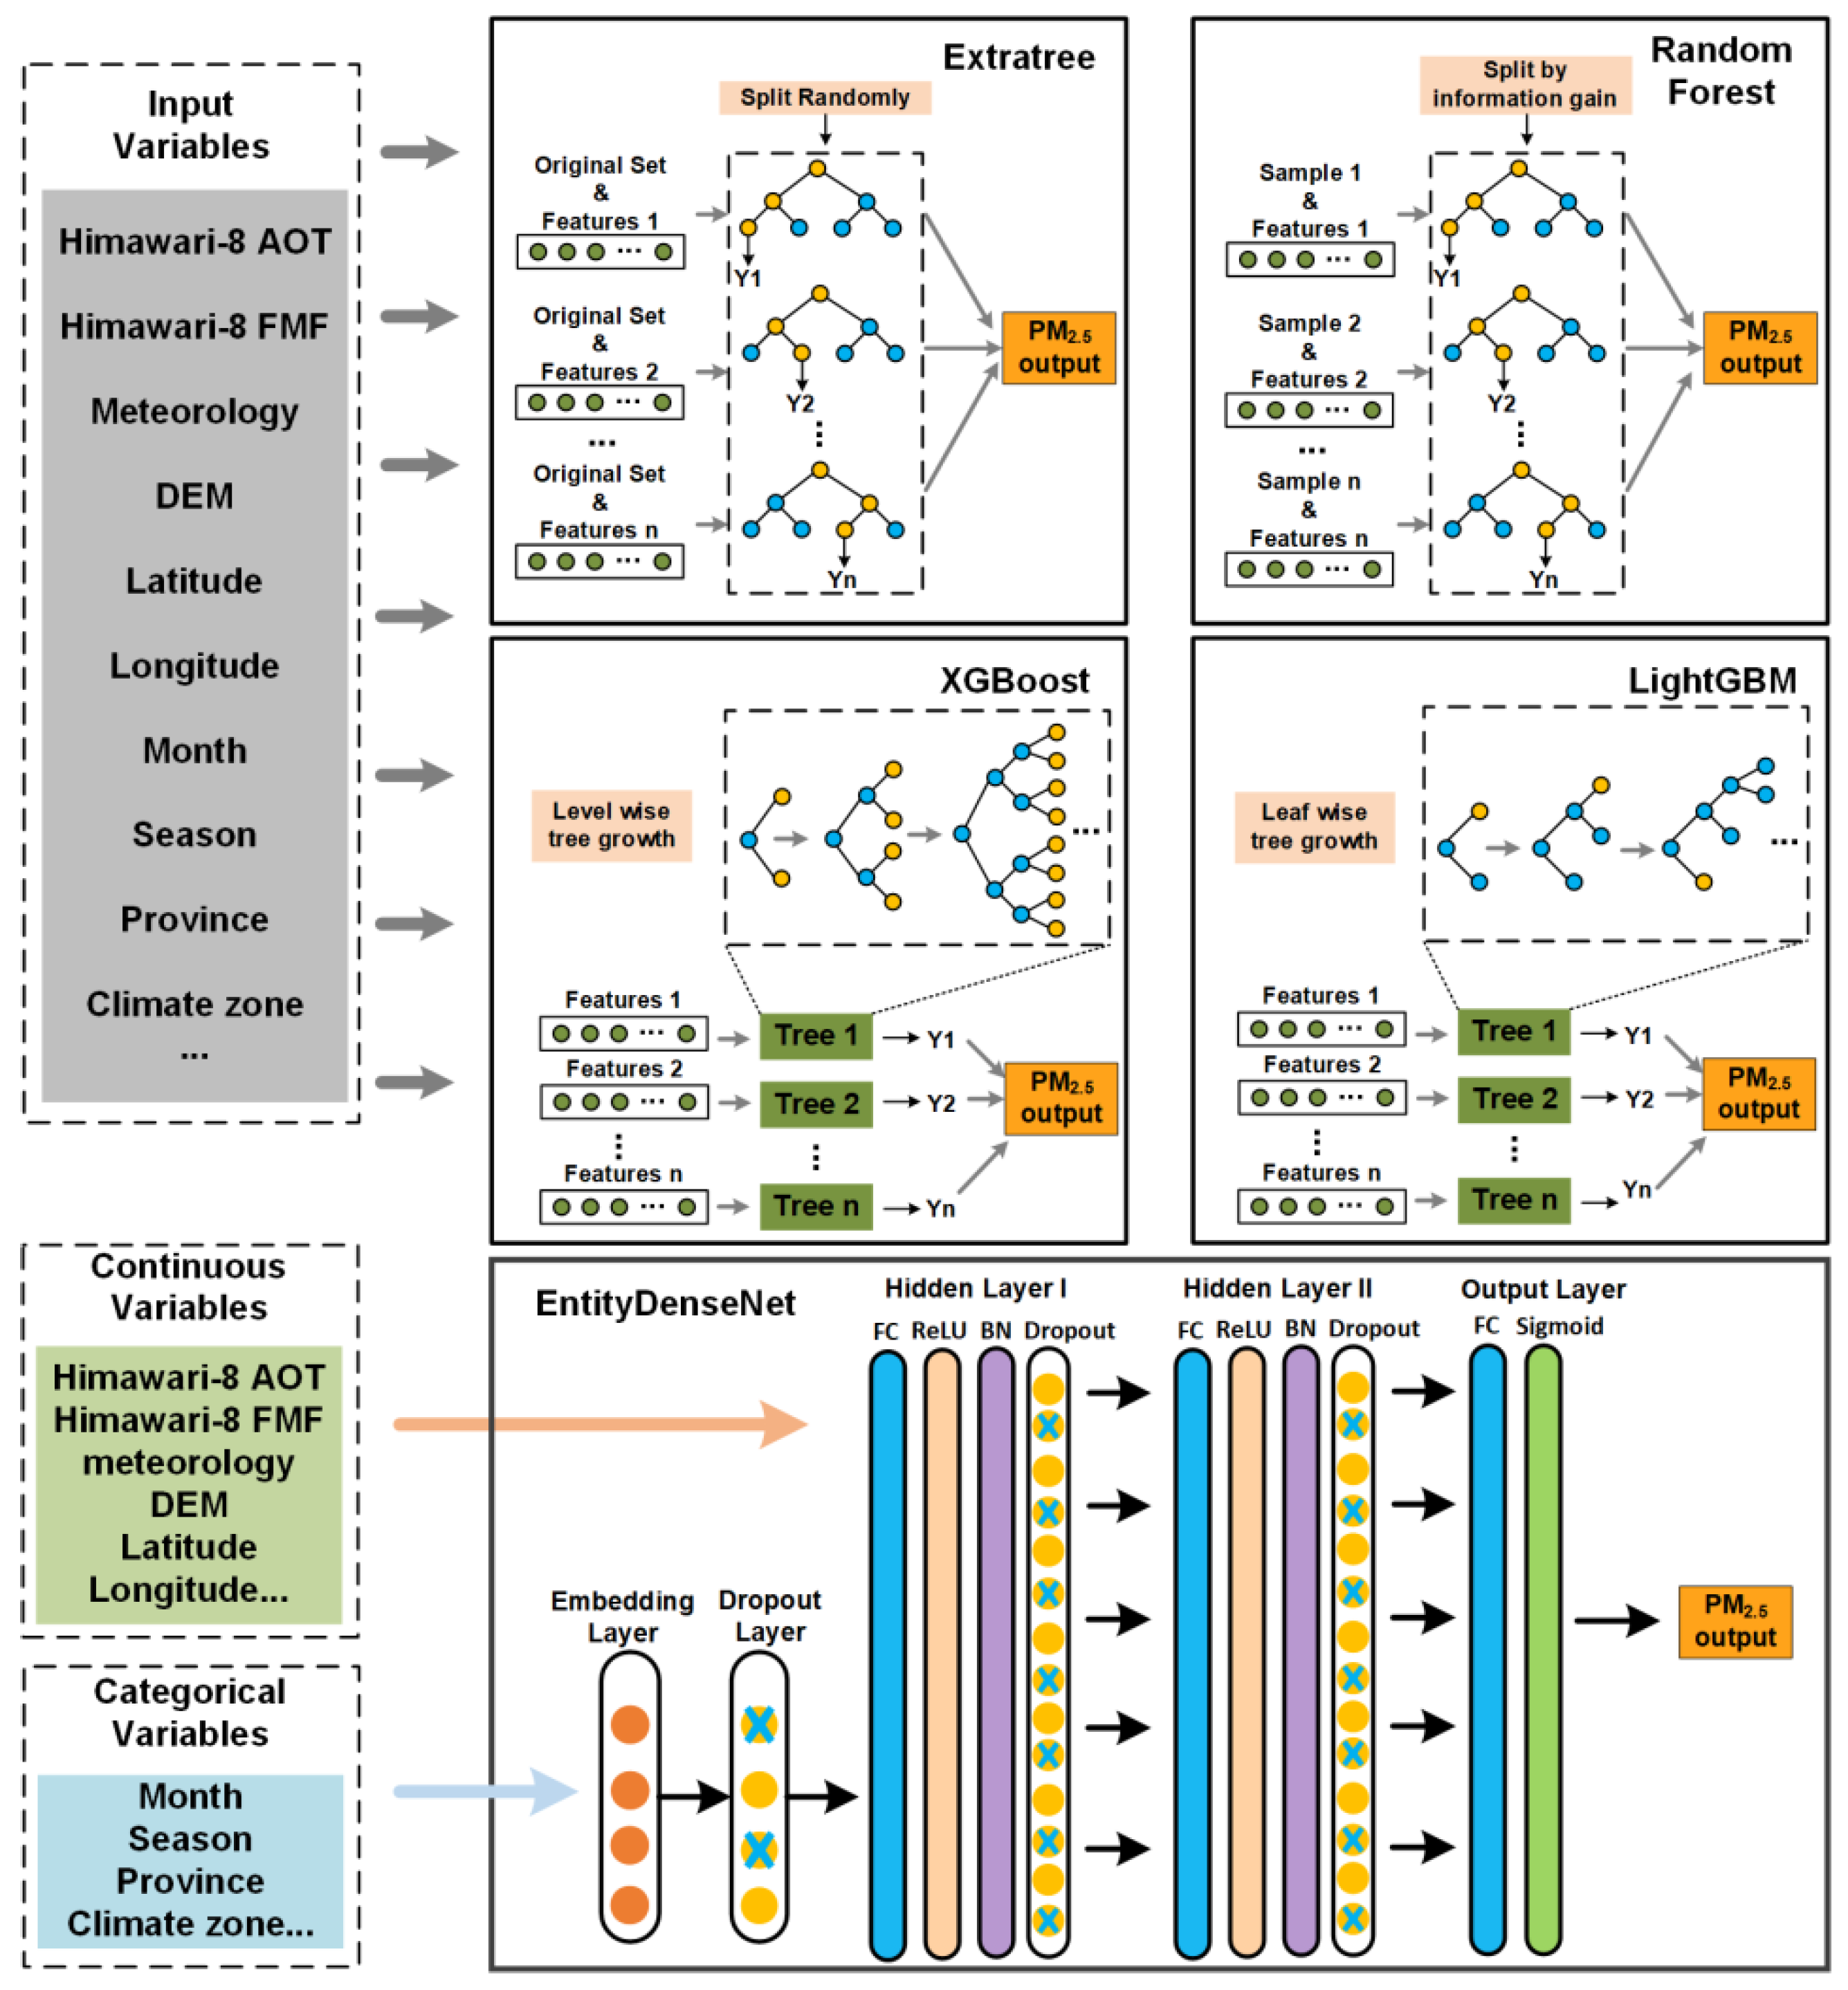
In this study, four traditional machine learning models were introduced to estimate PM2.5 when using different input variables, and schematic diagrams of these models are shown in Figure 2. The models used are described as follows and the detailed parameter settings for the four machine learning models is shown in Table S3:
(1)
Extratree is a supervised ensemble learning model that consists of the ensembles of unpruned classification or regression trees [43]. It uses a random value for the split of each node, which leads to more diversified trees and fewer splitters. Previous studies have used Extratree in both prediction [44] and classification [45].
(2)
Random Forest (RF) is a supervised ensemble learning model introduced by Ho [46], and its construction is based on the ensembles of unpruned classification or regression trees. It operates by selecting random features in the tree induction and bootstrap samples of the training data, and it splits each node in accordance with the largest information gain. RF has been widely applied in PM2.5 estimations in previous studies [17].
(3)
Extreme Gradient Boosting (XGBoost) is a machine learning algorithm based on the gradient boosting decision tree (GBDT) proposed by Chen and Guestrin [47]. It can conduct parallel computation efficiently, and it uses fewer computing resources than other methods. In XGBoost, each decision tree is split by a level-wise algorithm that is based on different independent variables. Pan [48] used XGBoost to forecast hourly PM2.5 in Tianjin based on data from air-monitoring stations.
(4)
LightGBM also has a GBDT framework. It grows trees using a leaf-wise algorithm and it only grows a leaf with the max delta loss. Compared to a level-wise algorithm, LightGBM shows higher loss reduction on the same leaf. Zhong et al. [49] utilized LightGBM to predict historical PM2.5 based on meteorological observations.

2.5. Deep Learning Model EntityDenseNet

EntityDenseNet is a deep learning model that can reduce the overfitting problem, and it has a great capacity for capturing nonlinear relationships between variables [50]. As shown in Figure 2, it consists of one input layer, two hidden layers, and one output layer. Traditional neural network approaches (such as BPNN) cannot directly use categorical data, but EntityDenseNet uses an embedding layer to process categorical variables. This not only accelerates the training, but it also helps the neural network to learn about the intrinsic relationships between categorical variables [51]. Each hidden layer consists of one fully connected layer, a rectified linear unit (ReLU) layer, one Batch Normalization (BN) layer, and one dropout layer [52]. The ReLU layer is used as the activation function because it overcomes the saturated and vanishing gradient problem [53], and is faster than traditional activation functions, such as the sigmoid activation function [54]. The BN layer accelerates the training speed by equally distributing the data in each layer [54] and the dropout layer reduces overfitting of the neural networks [55]. Further details about EntityDenseNet are found in the work of Yan et al. [50]. In this study, the optimal parameters (epochs = 40, hidden nodes = 256, dropout rate = 0.3, learning rate = 0.001, batch size = 128, weight decay = 0.0001) for EntityDenseNet were used by parameter tuning.

2.6. Model Training and Validation

In this study, Himawari-8 and meteorological data for 2020 were used as modeling inputs. Ground-based PM2.5 data were provided on an hourly scale; therefore, the 10-min resolution satellite data were averaged on an hourly scale. In EntityDenseNet, we selected month, season, administrative divisions, and global climate zones (Figure S2d and Table S4) [56] as categorical variables, while AOT, FMF, digital elevation model (DEM), temperature, wind speed, RH, PBLH, longitude, and latitude were employed as continuous variables. In the four classical machine-learning methods, all variables were directly used as input data.
To integrate the input data with site-based PM2.5 data, the meteorological data and DEM were interpolated into the same spatial resolution as Himawari-8 AOT and FMF (0.05°). Then, the pixels of input data closest to the PM2.5 site were extracted and match the PM2.5 value at the same hour. Therefore, the matched data is for retrieving hourly PM2.5 at the spatial resolution of 0.05°.
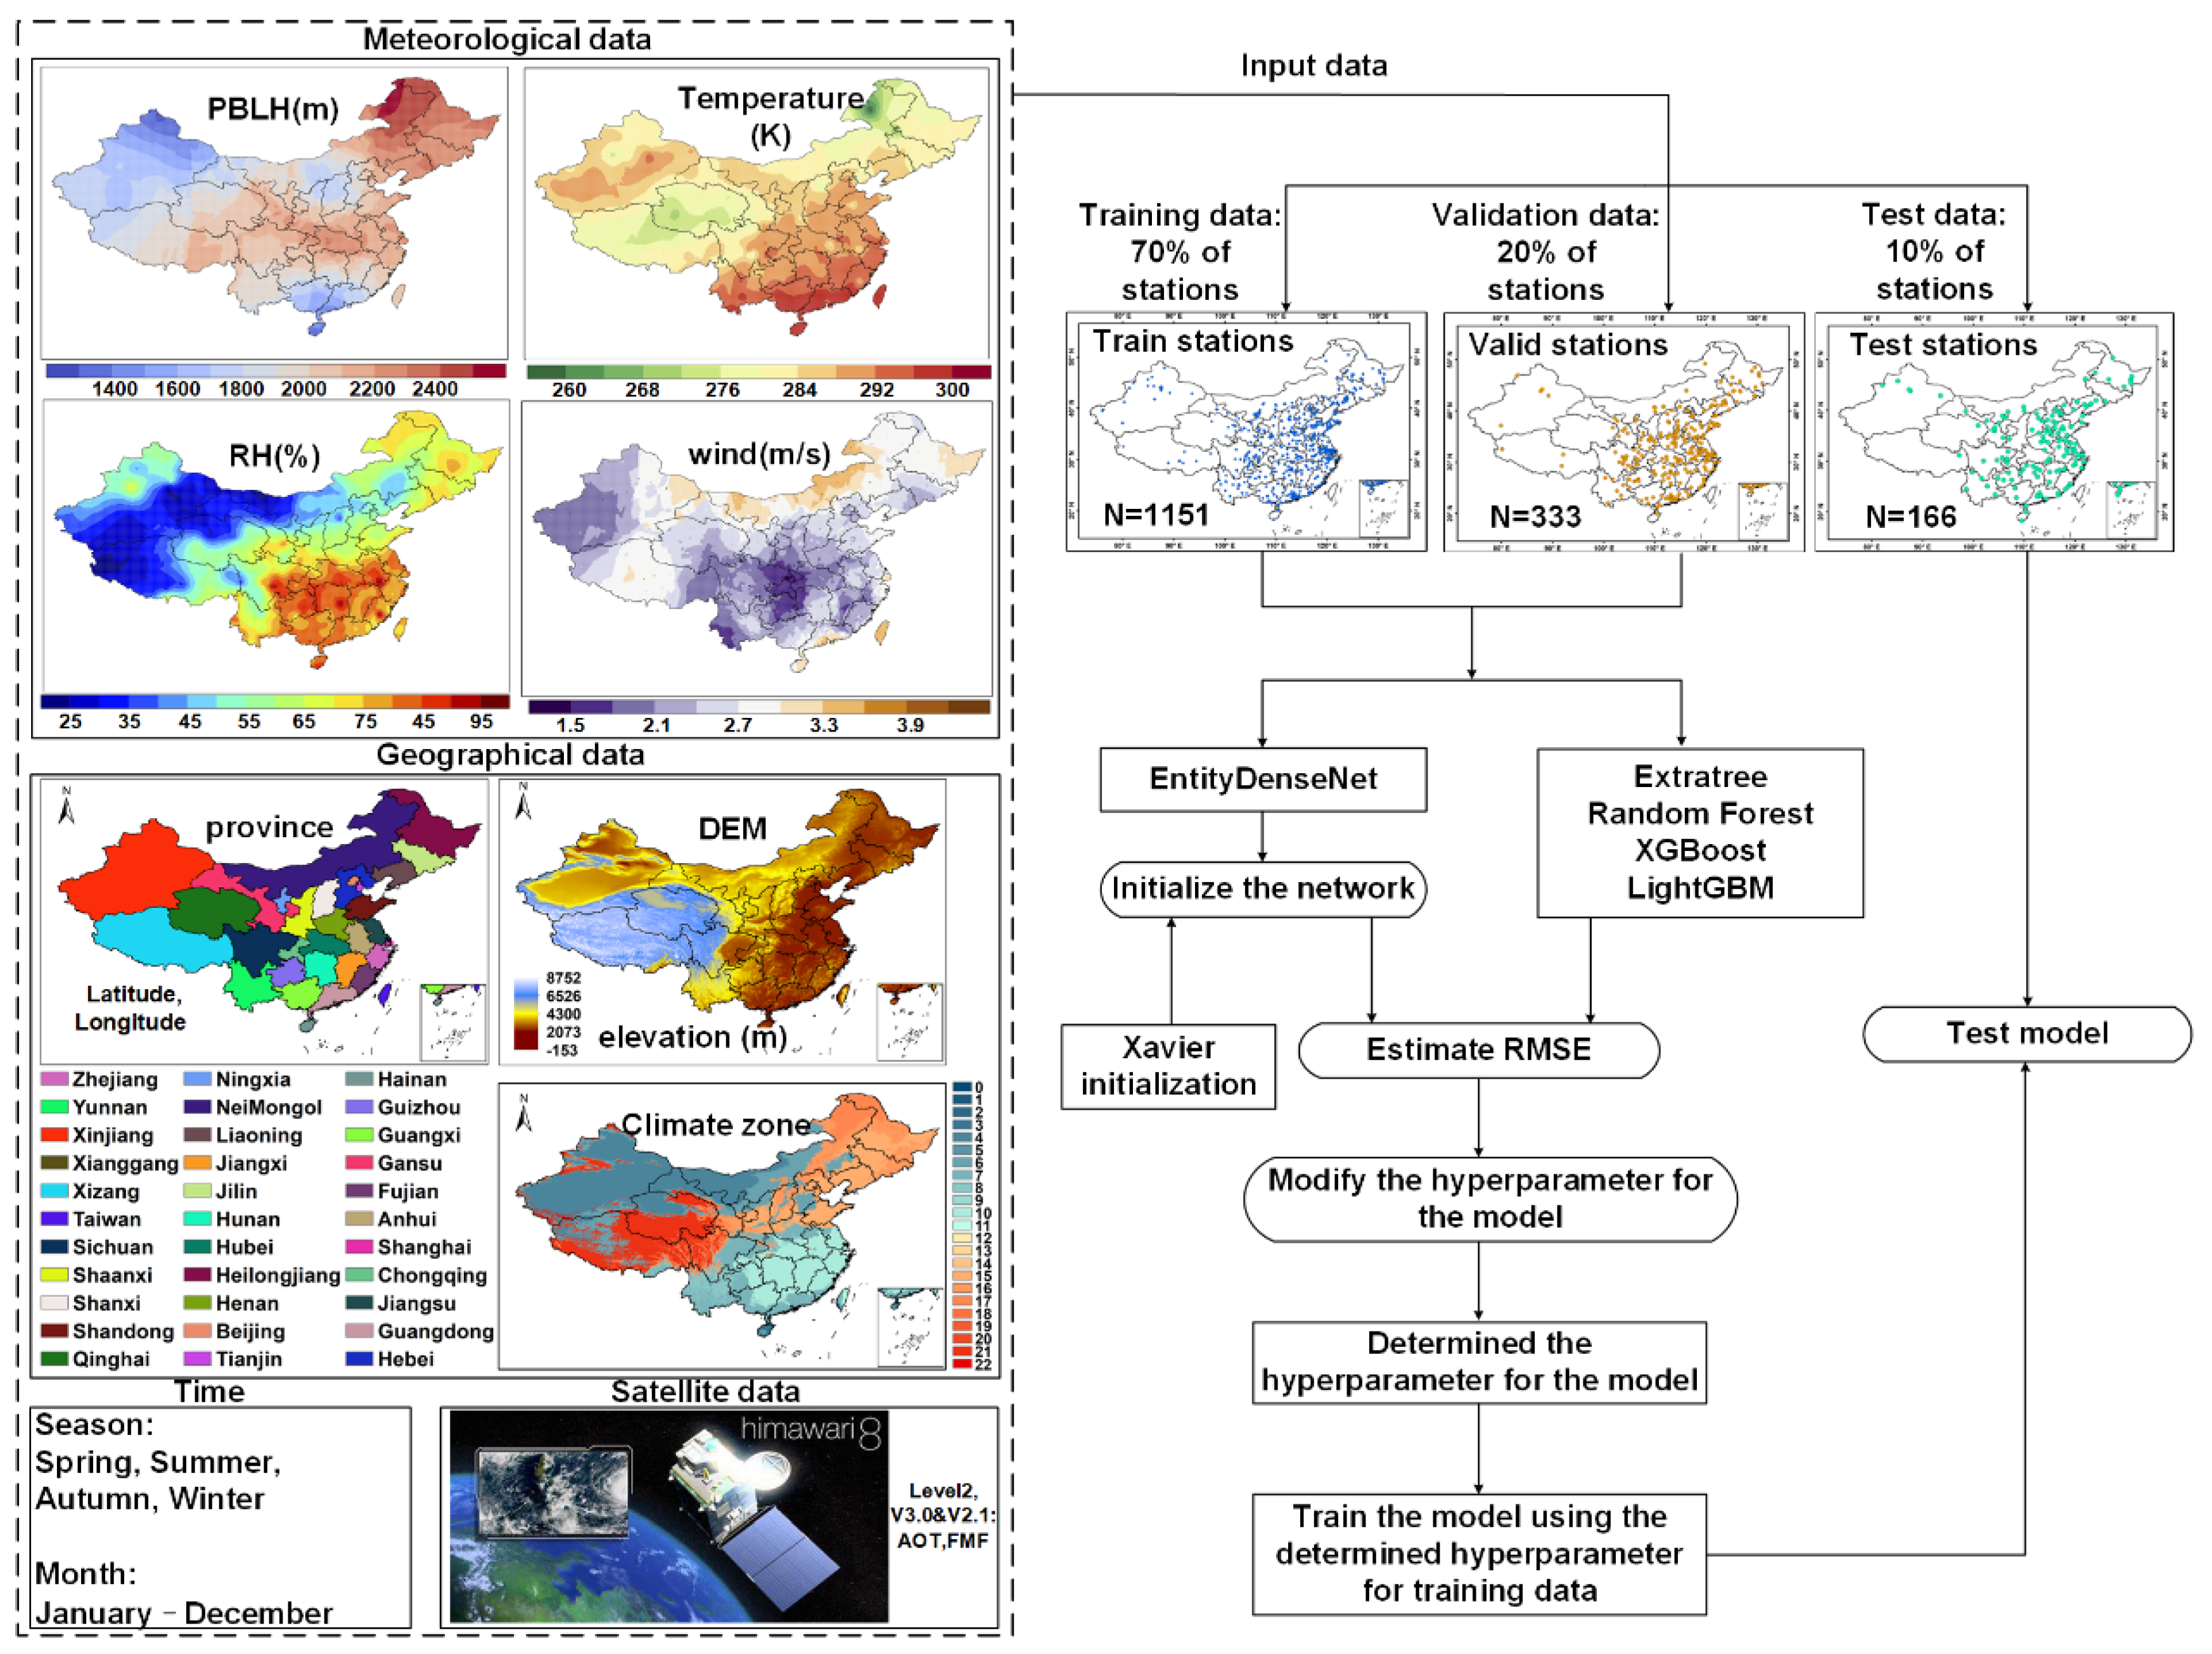
Figure 3 shows the training process employed by all the models used in this study. The input data of 1650 stations were first separated into training, validation, and test data using the station-based method [57]. Specifically, we randomly selected input data from over 70% of the PM2.5 stations for training, from 20% of the PM2.5 stations for validation, and from 10% of the PM2.5 stations for testing. The training and validation data were then used to determine the hyperparameters in the models. EntityDenseNet was first initialized using the Xavier initialization scheme [58], which ensures that moderate weight values are used during the propagation of the network, and the hyperparameters were then determined using the validation data. The hyperparameters in the other machine learning models were directly determined using the validation data. Using the hyperparameters, the models were subsequently trained using the training data. Finally, the test dataset (41,836 samples) was used to evaluate the performances of the trained models. This station-based validation accurately reflects the spatial performance of each model and has been used in previous studies, such as that of Wang et al. [56].

3. Results

3.1. Linear and Non-Linear Relationships between fAOT and PM2.5

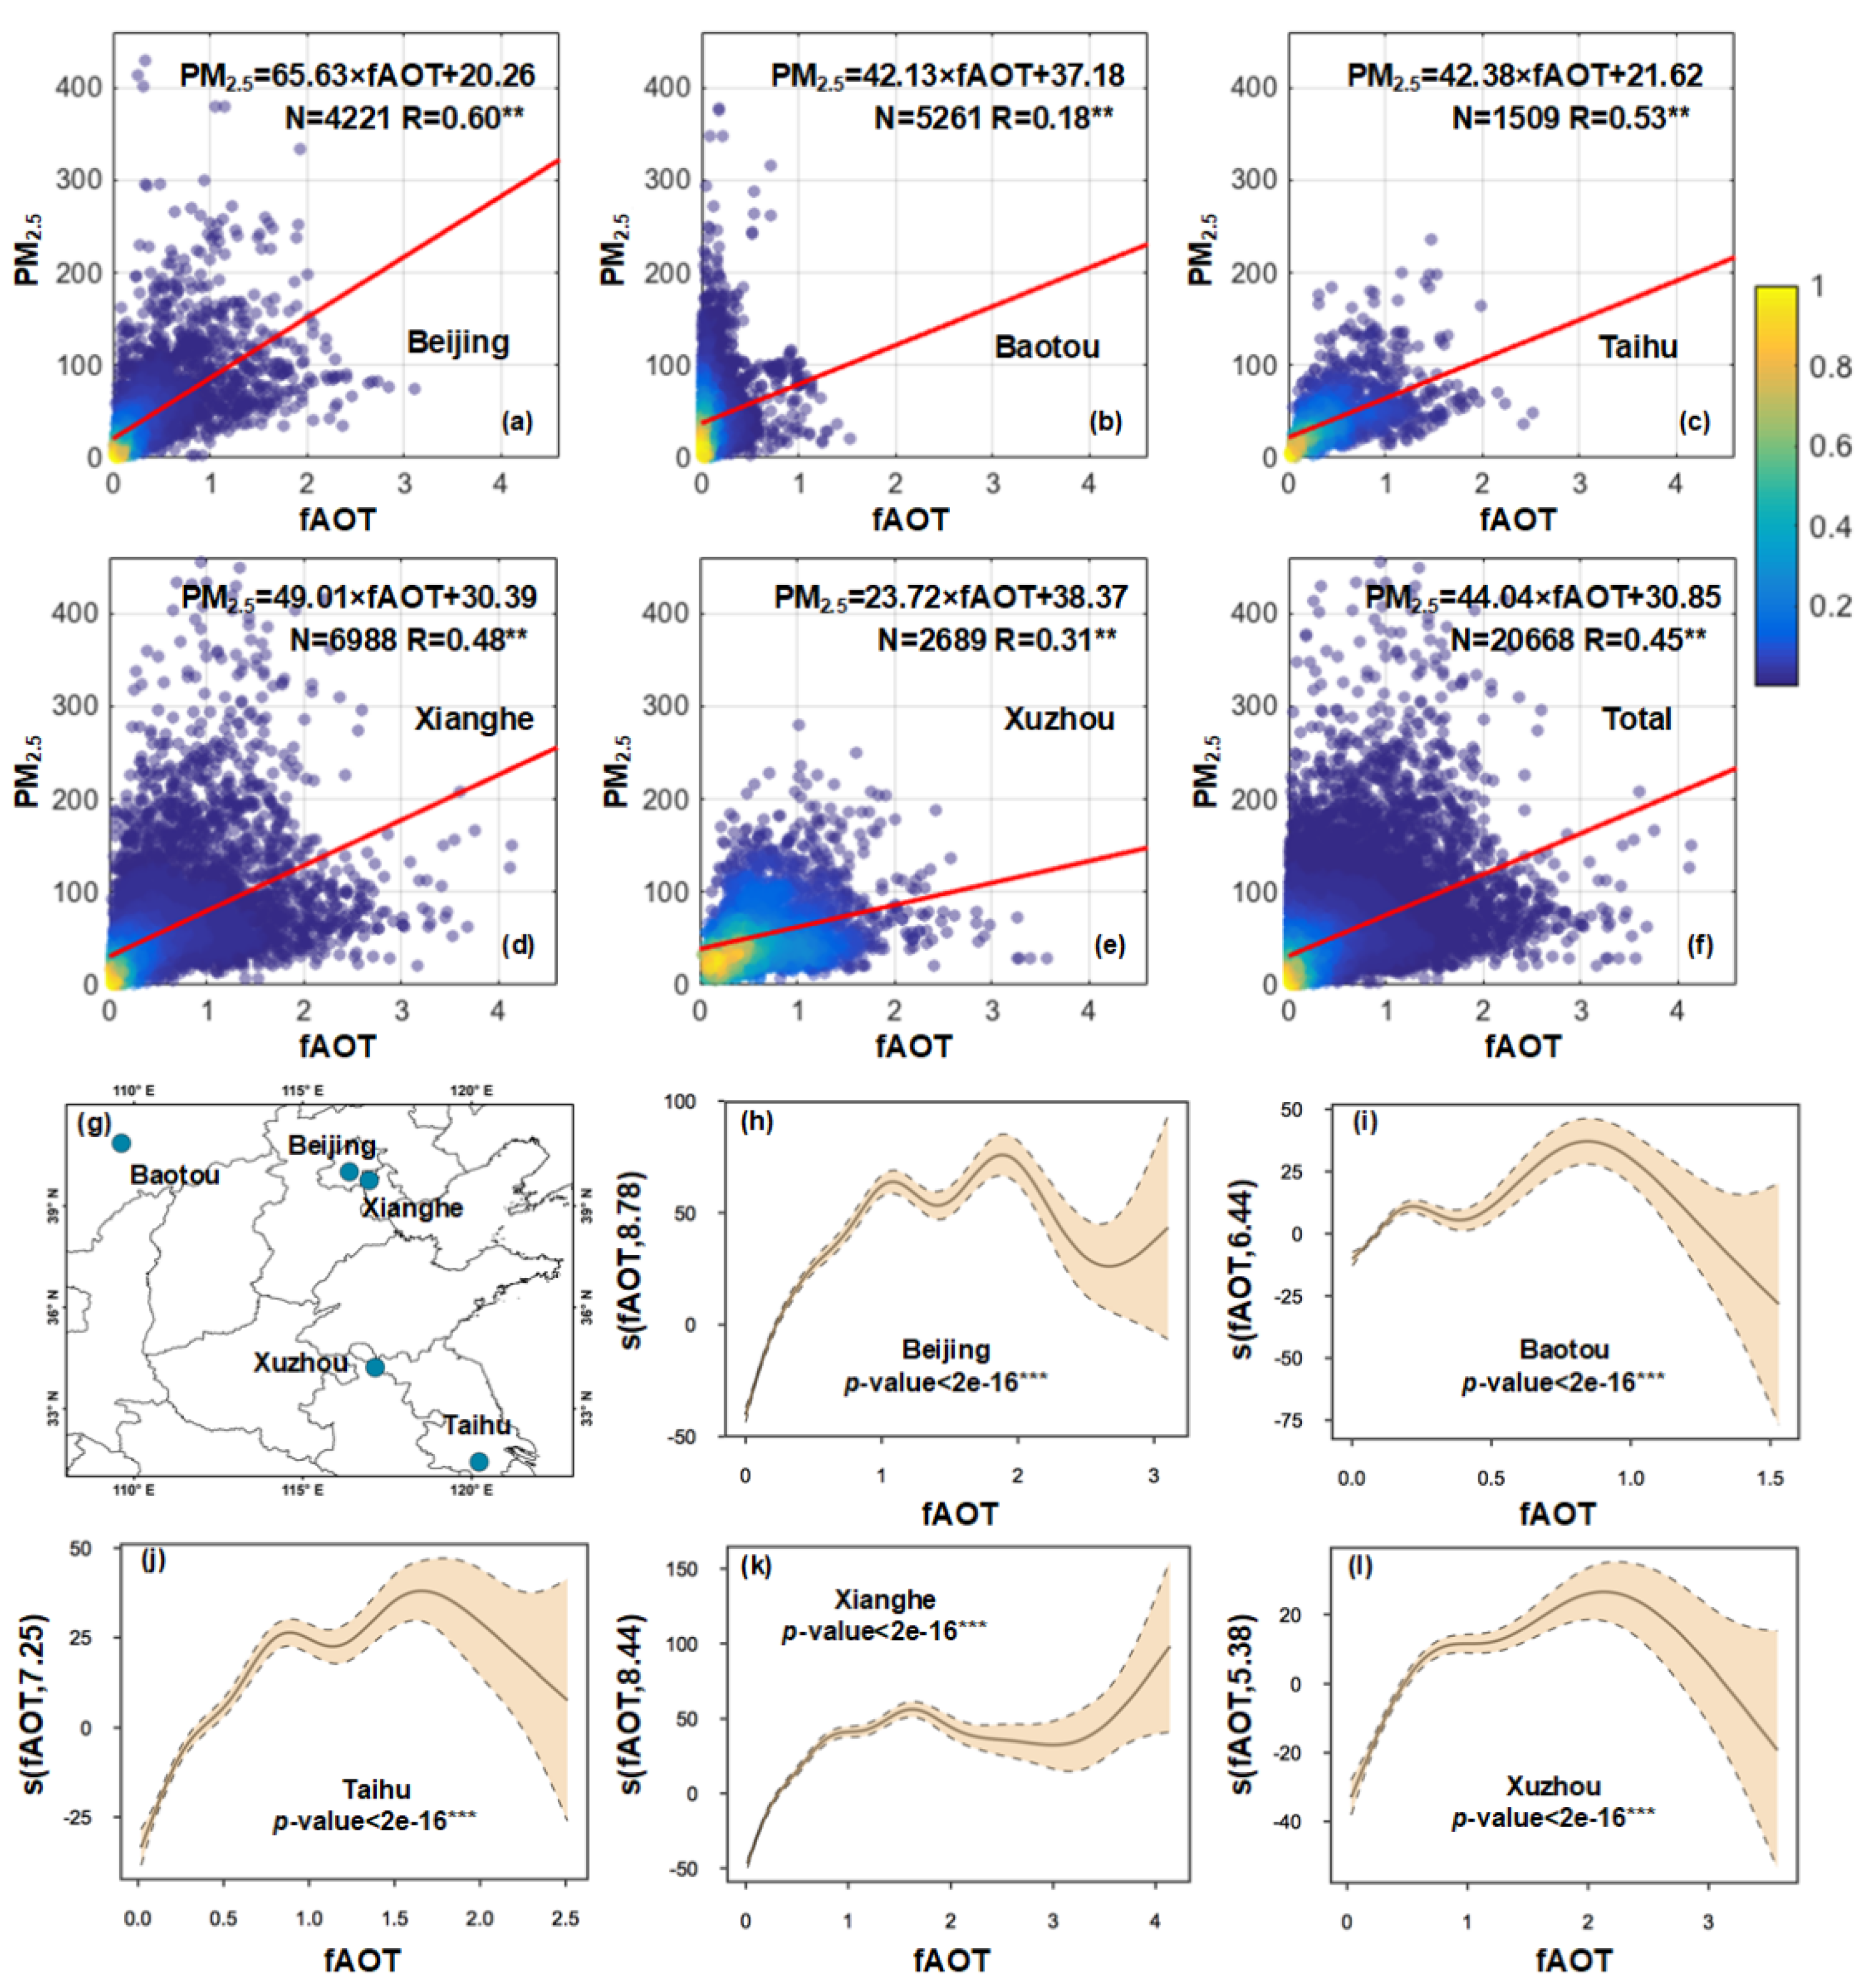
To explore the relationship between fAOT and PM2.5, data were collected from five AEROENT stations (in Beijing, Baotou, Taihu, Xianghe, Xuzhou) (Figure 4g) and PM2.5 over stations located nearest to the AEROENT stations in mainland China during 2015–2019. Using FMF, the fAOT was separated from the AOT (fAOT = AOT × FMF); this represents the AOT of fine mode particles with radii ranging from 0.439–0.992 µm. Both linear and non-linear relationships between fAOT and PM2.5 were investigated, and the results are shown in Figure 4. The linear relationships between fAOT and PM2.5 show significant correlation values at the 95% significance level for the five stations, and the R of fAOT and PM2.5 reached 0.48 on average. Of the five stations, Beijing showed the highest correlation between fAOT and PM2.5 (R = 0.60), while other stations had correlation values ranging from 0.18 to 0.53. A significant linear relationship between fAOT and PM2.5 was also reported by Zhang and Li [59] (with an R of 0.88) on haze days, and by Yan et al. [16] (with an R of 0.74) in Xingtai during May 2016.
The generalized additive model (GAM) was used to test the non-linear relationships between fAOT and PM2.5, and the results showed that the non-linear relationships were significant at the 99% significance level (Figure 4h–l). In Beijing and Baotou, fAOT positively influenced PM2.5 when fAOT was less than 1 and 0.8, respectively, and PM2.5 had a negative influence on fAOT with a further increase in fAOT. This means that fine mode aerosols were not the only component in severe haze events in Beijing and Baotou, and the proportion of coarse mode aerosols was non-negligible [60]. The PM2.5 in Taihu and Xuzhou responded positively to fAOD when fAOD was less than approximately 1.7 and 2, but it was negatively correlated with a further increase in fAOD. This is partly related to the fact that although fine mode aerosols dominate local PM2.5 on severe pollution days, fine particles can absorb moisture and increase in size [61]. The dominant coarse-mode aerosols on severe pollution days caused this negative response between fAOT and PM2.5. In Xianghe, there was a strong positive response between fAOT and PM2.5, even when fAOT was greater than 3, which indicated that PM2.5 in Xianghe consisted mainly of fine mode particles on both clean and heavy pollution days [62]. Figure 4 shows the relationship between fAOT and PM2.5, which indicates the importance of using aerosol size information when estimating PM2.5.

3.2. Evaluation of Himawari-8 V3.0 Aerosol Size Data and Its Performance in PM2.5 Retrievals

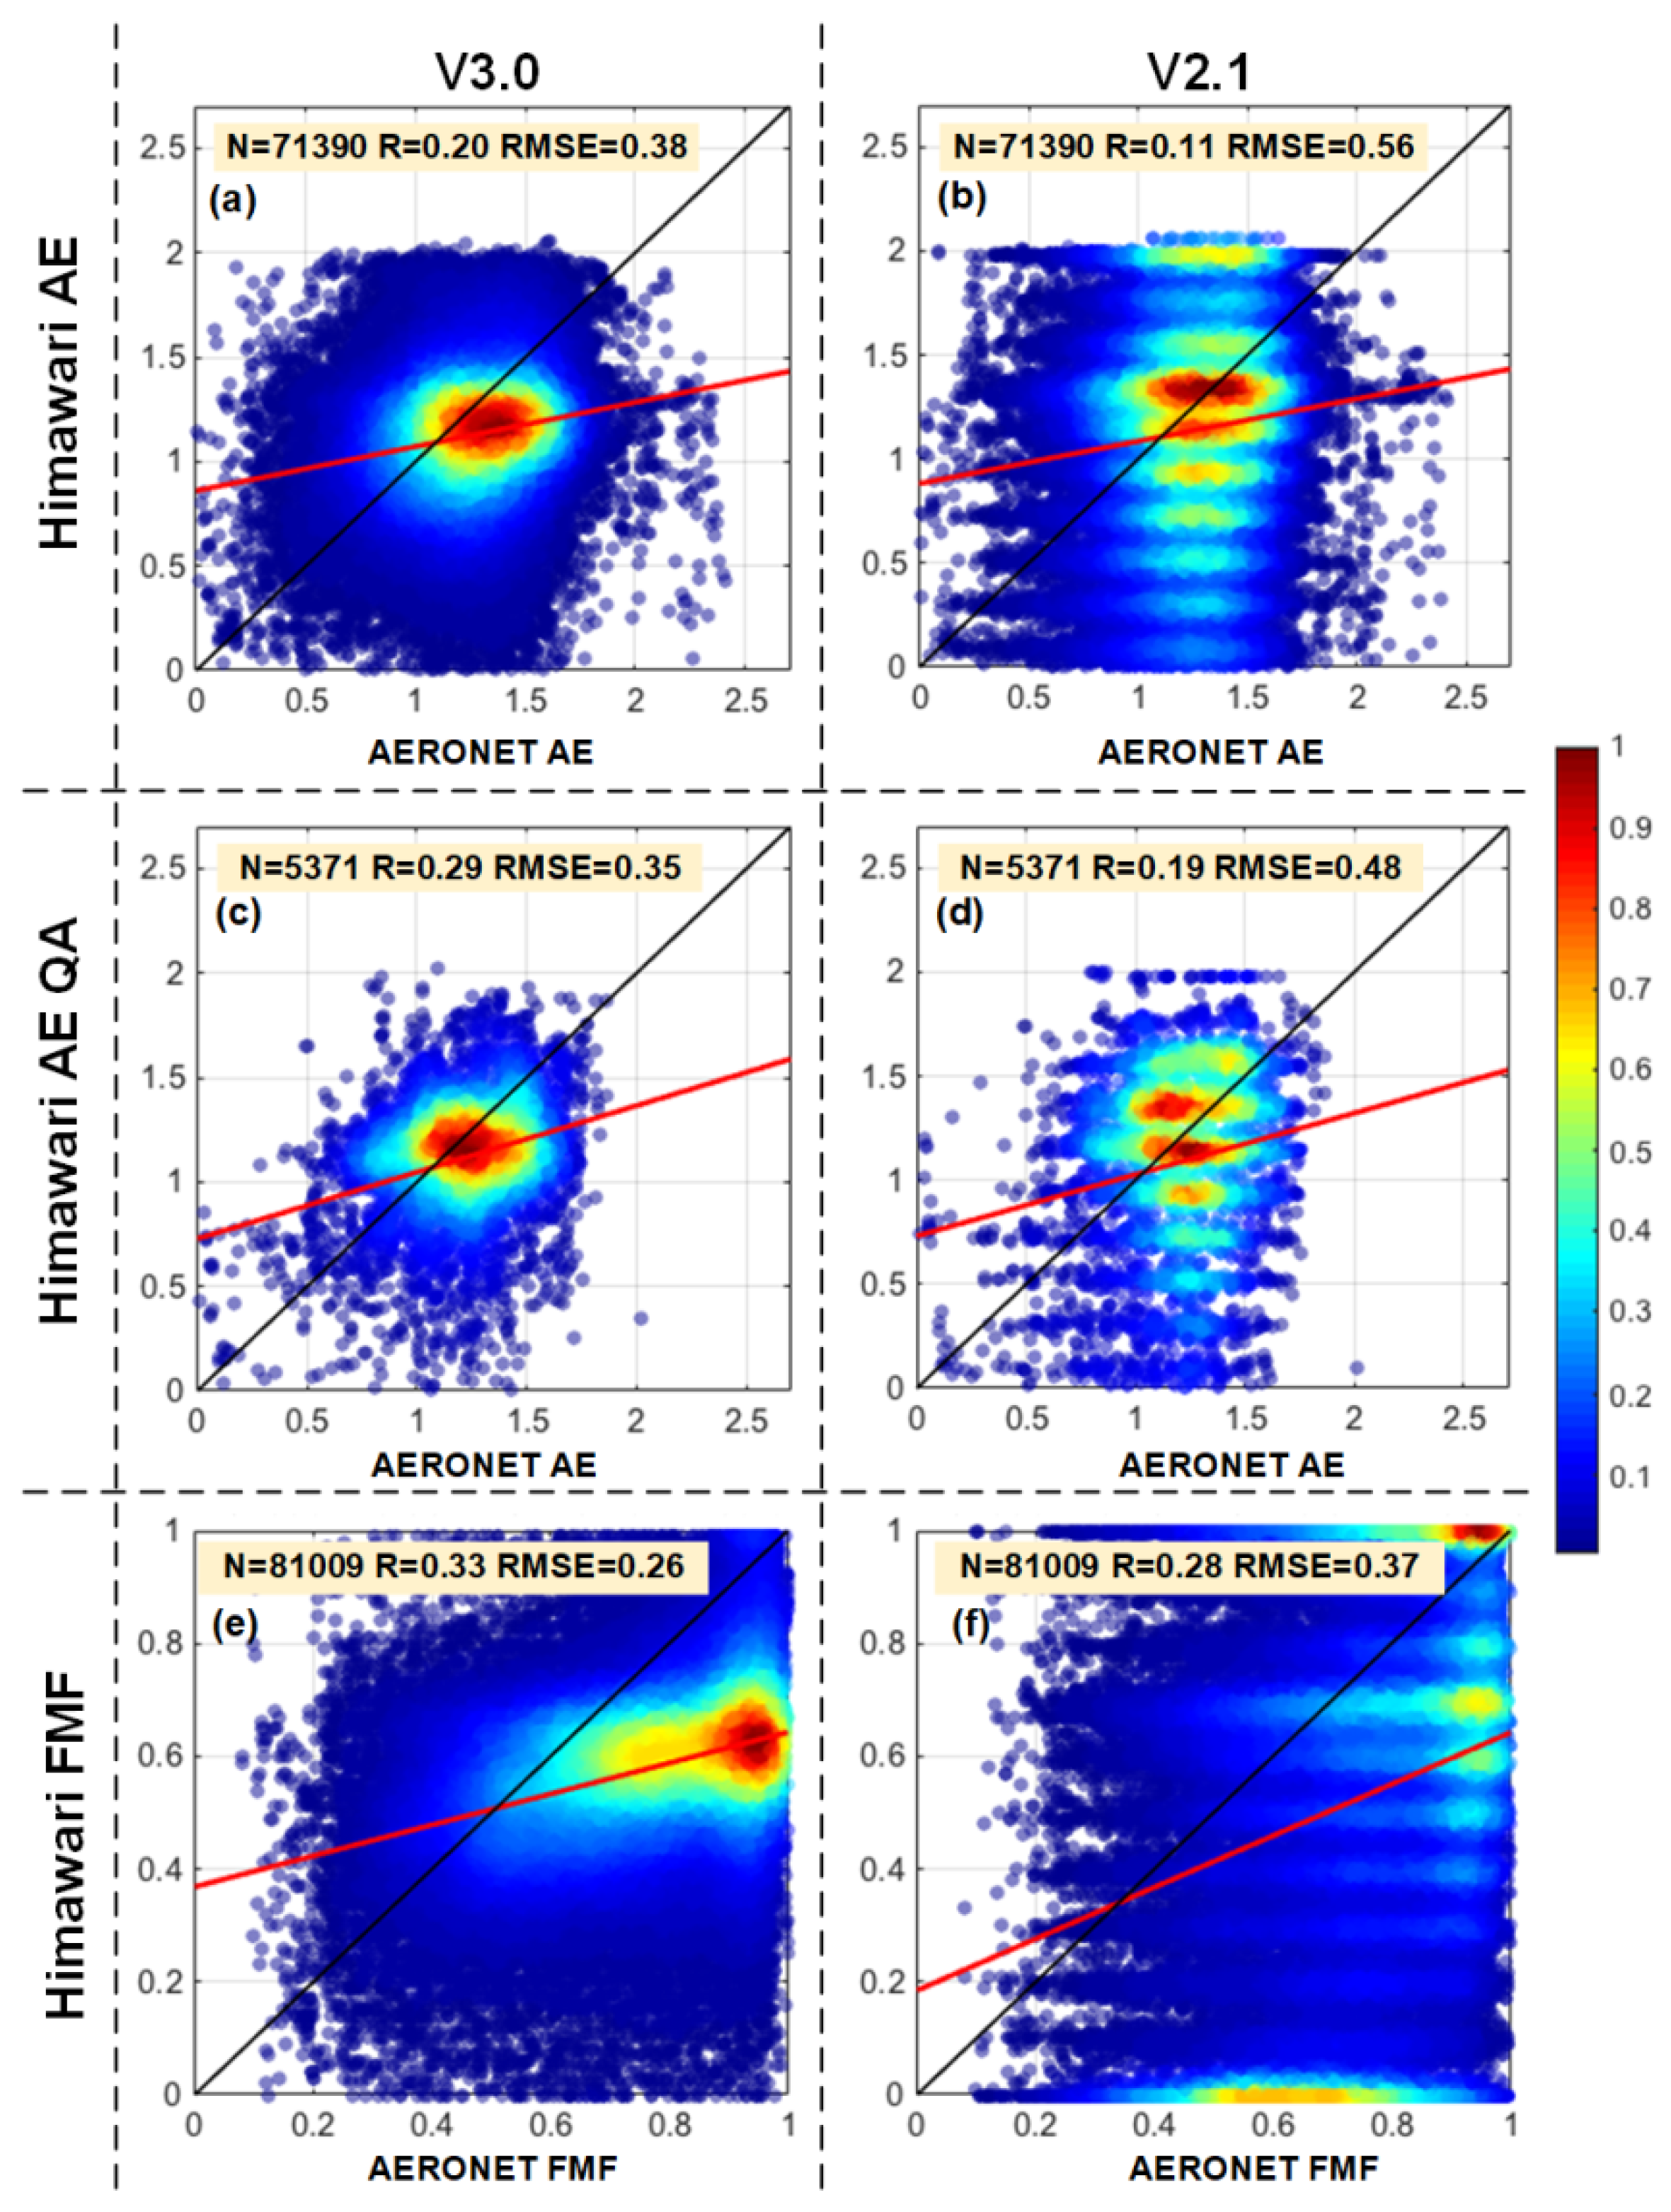
Figure 5 shows the overall evaluations of V3.0 and V2.1 AE (a,b), AE with quality assurance (AE QA) (c,d), and FMF (e,f). Both AE and AE QA were superior when using the V3.0 data compared to the V2.1 data, and a tighter clustering of points was seen around the 1:1 line. Specifically, there were improvements for AE in the correlation with AERONET for V3.0 (R = 0.20, RMSE 0.38) and V2.1 (R = 0.11 and RMSE = 0.56). After quality control, the data volume of AE QA decreased from 71,390 to 5371, while the performance of AE QA was superior to that of AE. In addition, V3.0 AE QA (R = 0.29, RMSE = 0.35) outperformed V2.1 AE QA (R = 0.19, RMSE = 0.48). For FMF, the V3.0 FMF (R = 0.33, RMSE = 0.26) also showed an overall better retrieval than V2.1 FMF (R = 0.28, RMSE = 0.37). In addition, the significant underestimation and overestimation phenomena of V2.1 FMF were reduced in V3.0 FMF, which provided a more reliable FMF product. The site-based validation results are shown in Figures S3–S5, where it is evident that V3.0 AE performed better than V2.1 AE before and after quality control, and that FMF was generally improved over the sites. The validations suggest that using FMF with the Himawari-8 L2 V3.0 AE provides an overall improvement compared with using FMF with V2.1 AE.
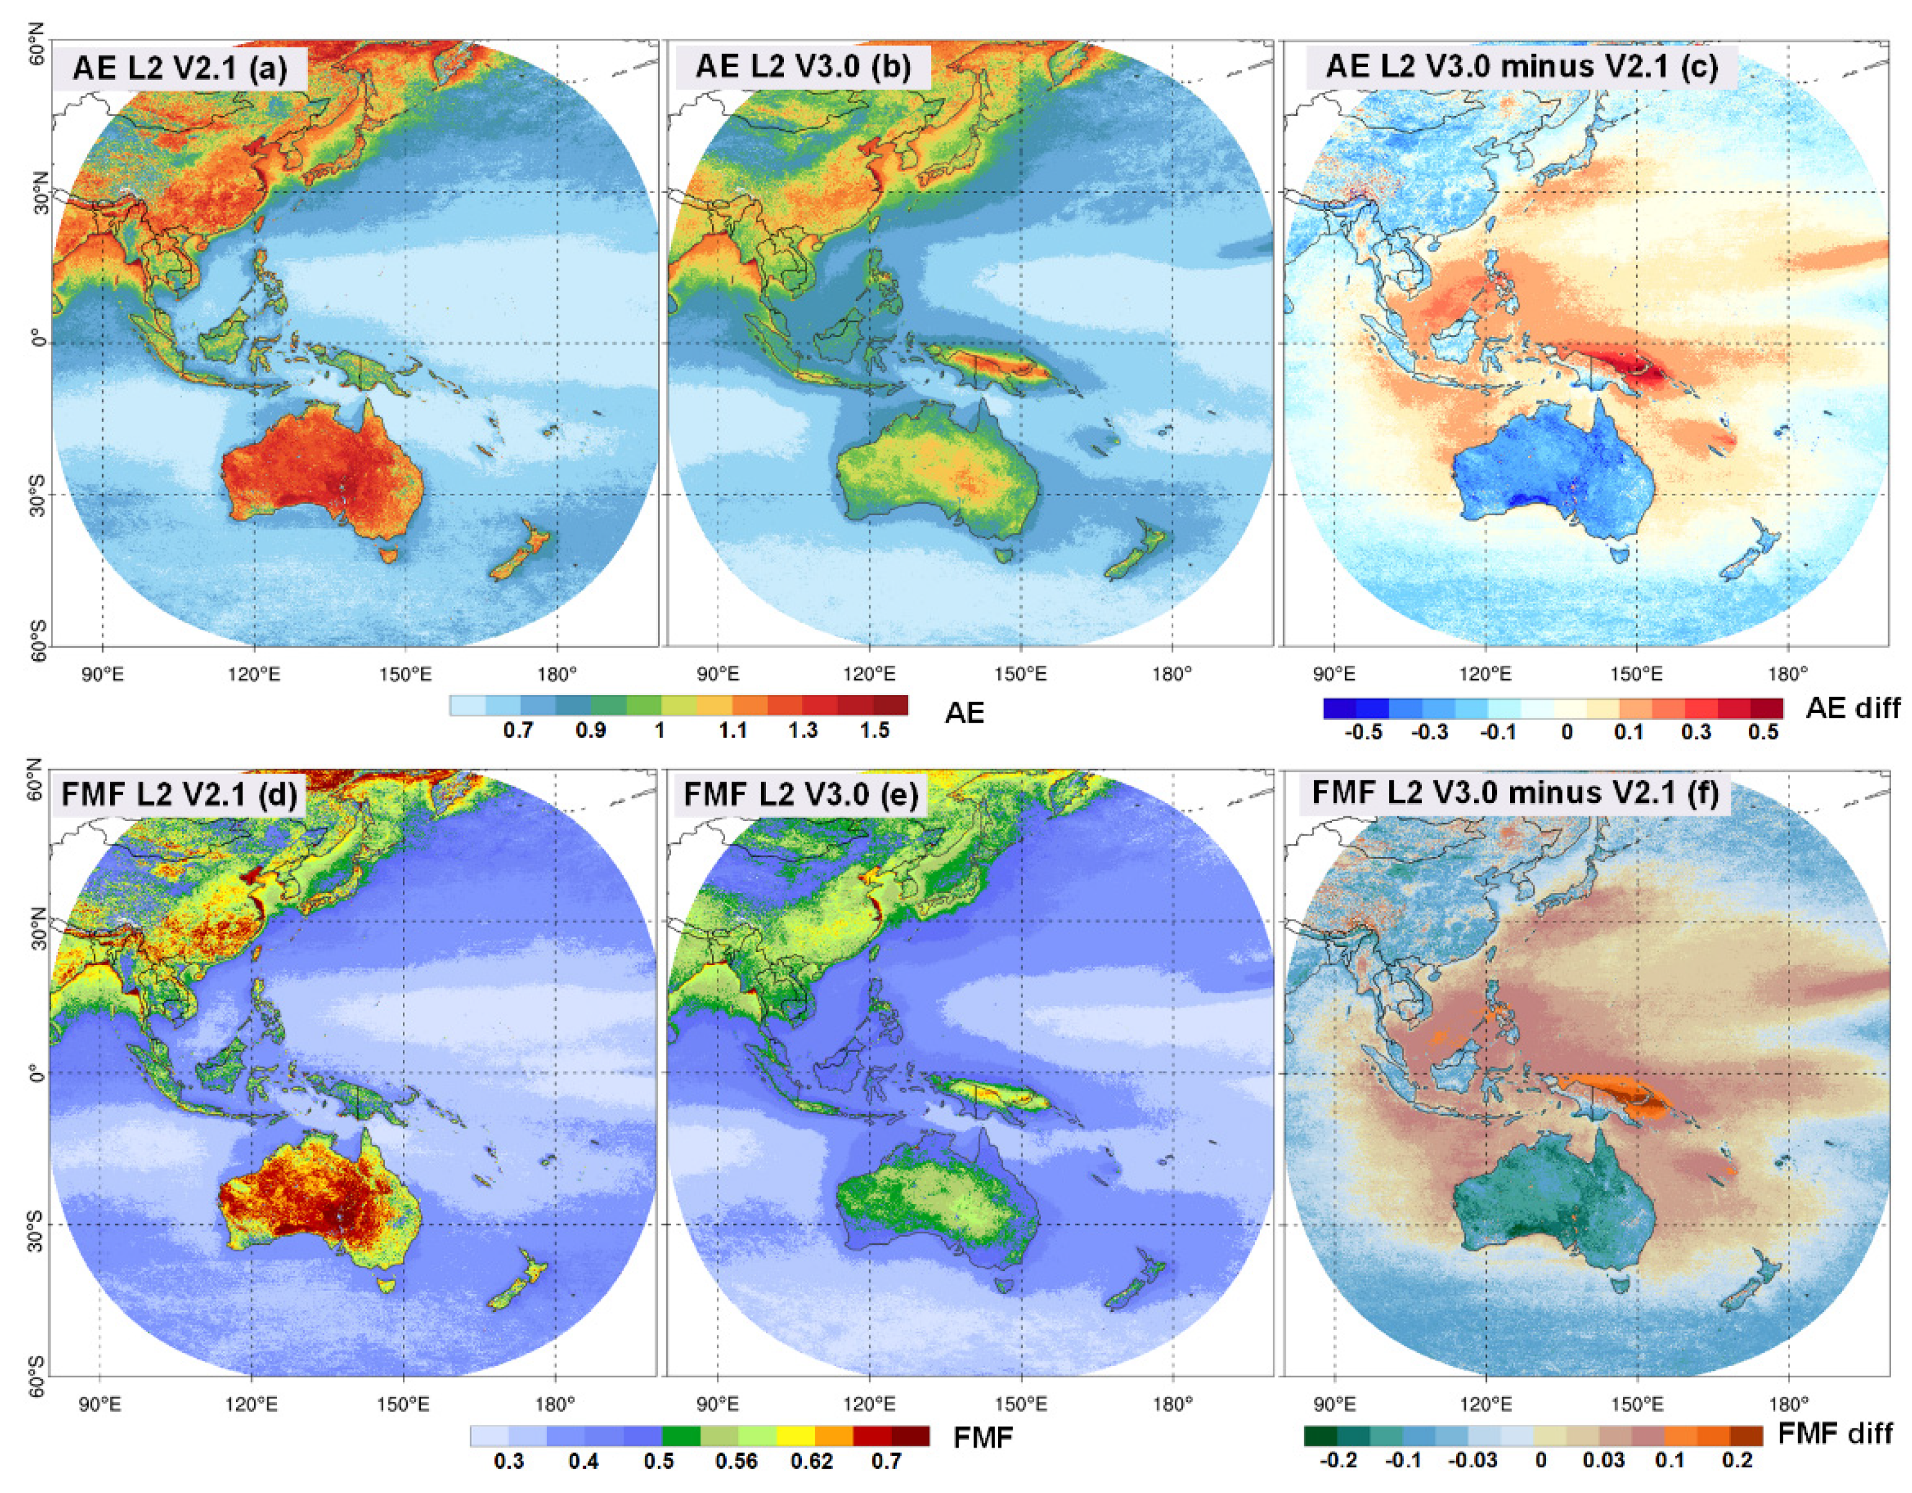
To compare the spatial distribution of V3.0, V2.1 AE, and FMF, the annual means of V3.0, V2.1 AE, and FMF, and their differences (V3.0 minus V2.1) are shown in Figure 6. It is clear that for both V3.0 and V2.1 AE, high values (>1.1) were observed over southeastern Asia, northern India, northeastern China, and central Australia, and these corresponded to the dominance of fine mode aerosols due to biomass burning and anthropogenic emissions [63,64,65,66]. However, compared with V2.1 AE, the value of V3.0 AE was much lower over northeastern China and central Australia, where the difference exceeded −0.4. In southeastern Asia, the values of V3.0 AE was much higher than that of V2.0 AE, with a difference greater than 0.2. The high values of both V3.0 and V2.1 FMF (>0.6) corresponded well with regions where there were fine mode aerosols, such as southeastern Asia, northern India, northeastern China, and central Australia. The difference between V3.0 and V2.1 FMF also showed a large positive value (>0.2) over southeastern Asia and a negative value over central Australia (>−0.2).
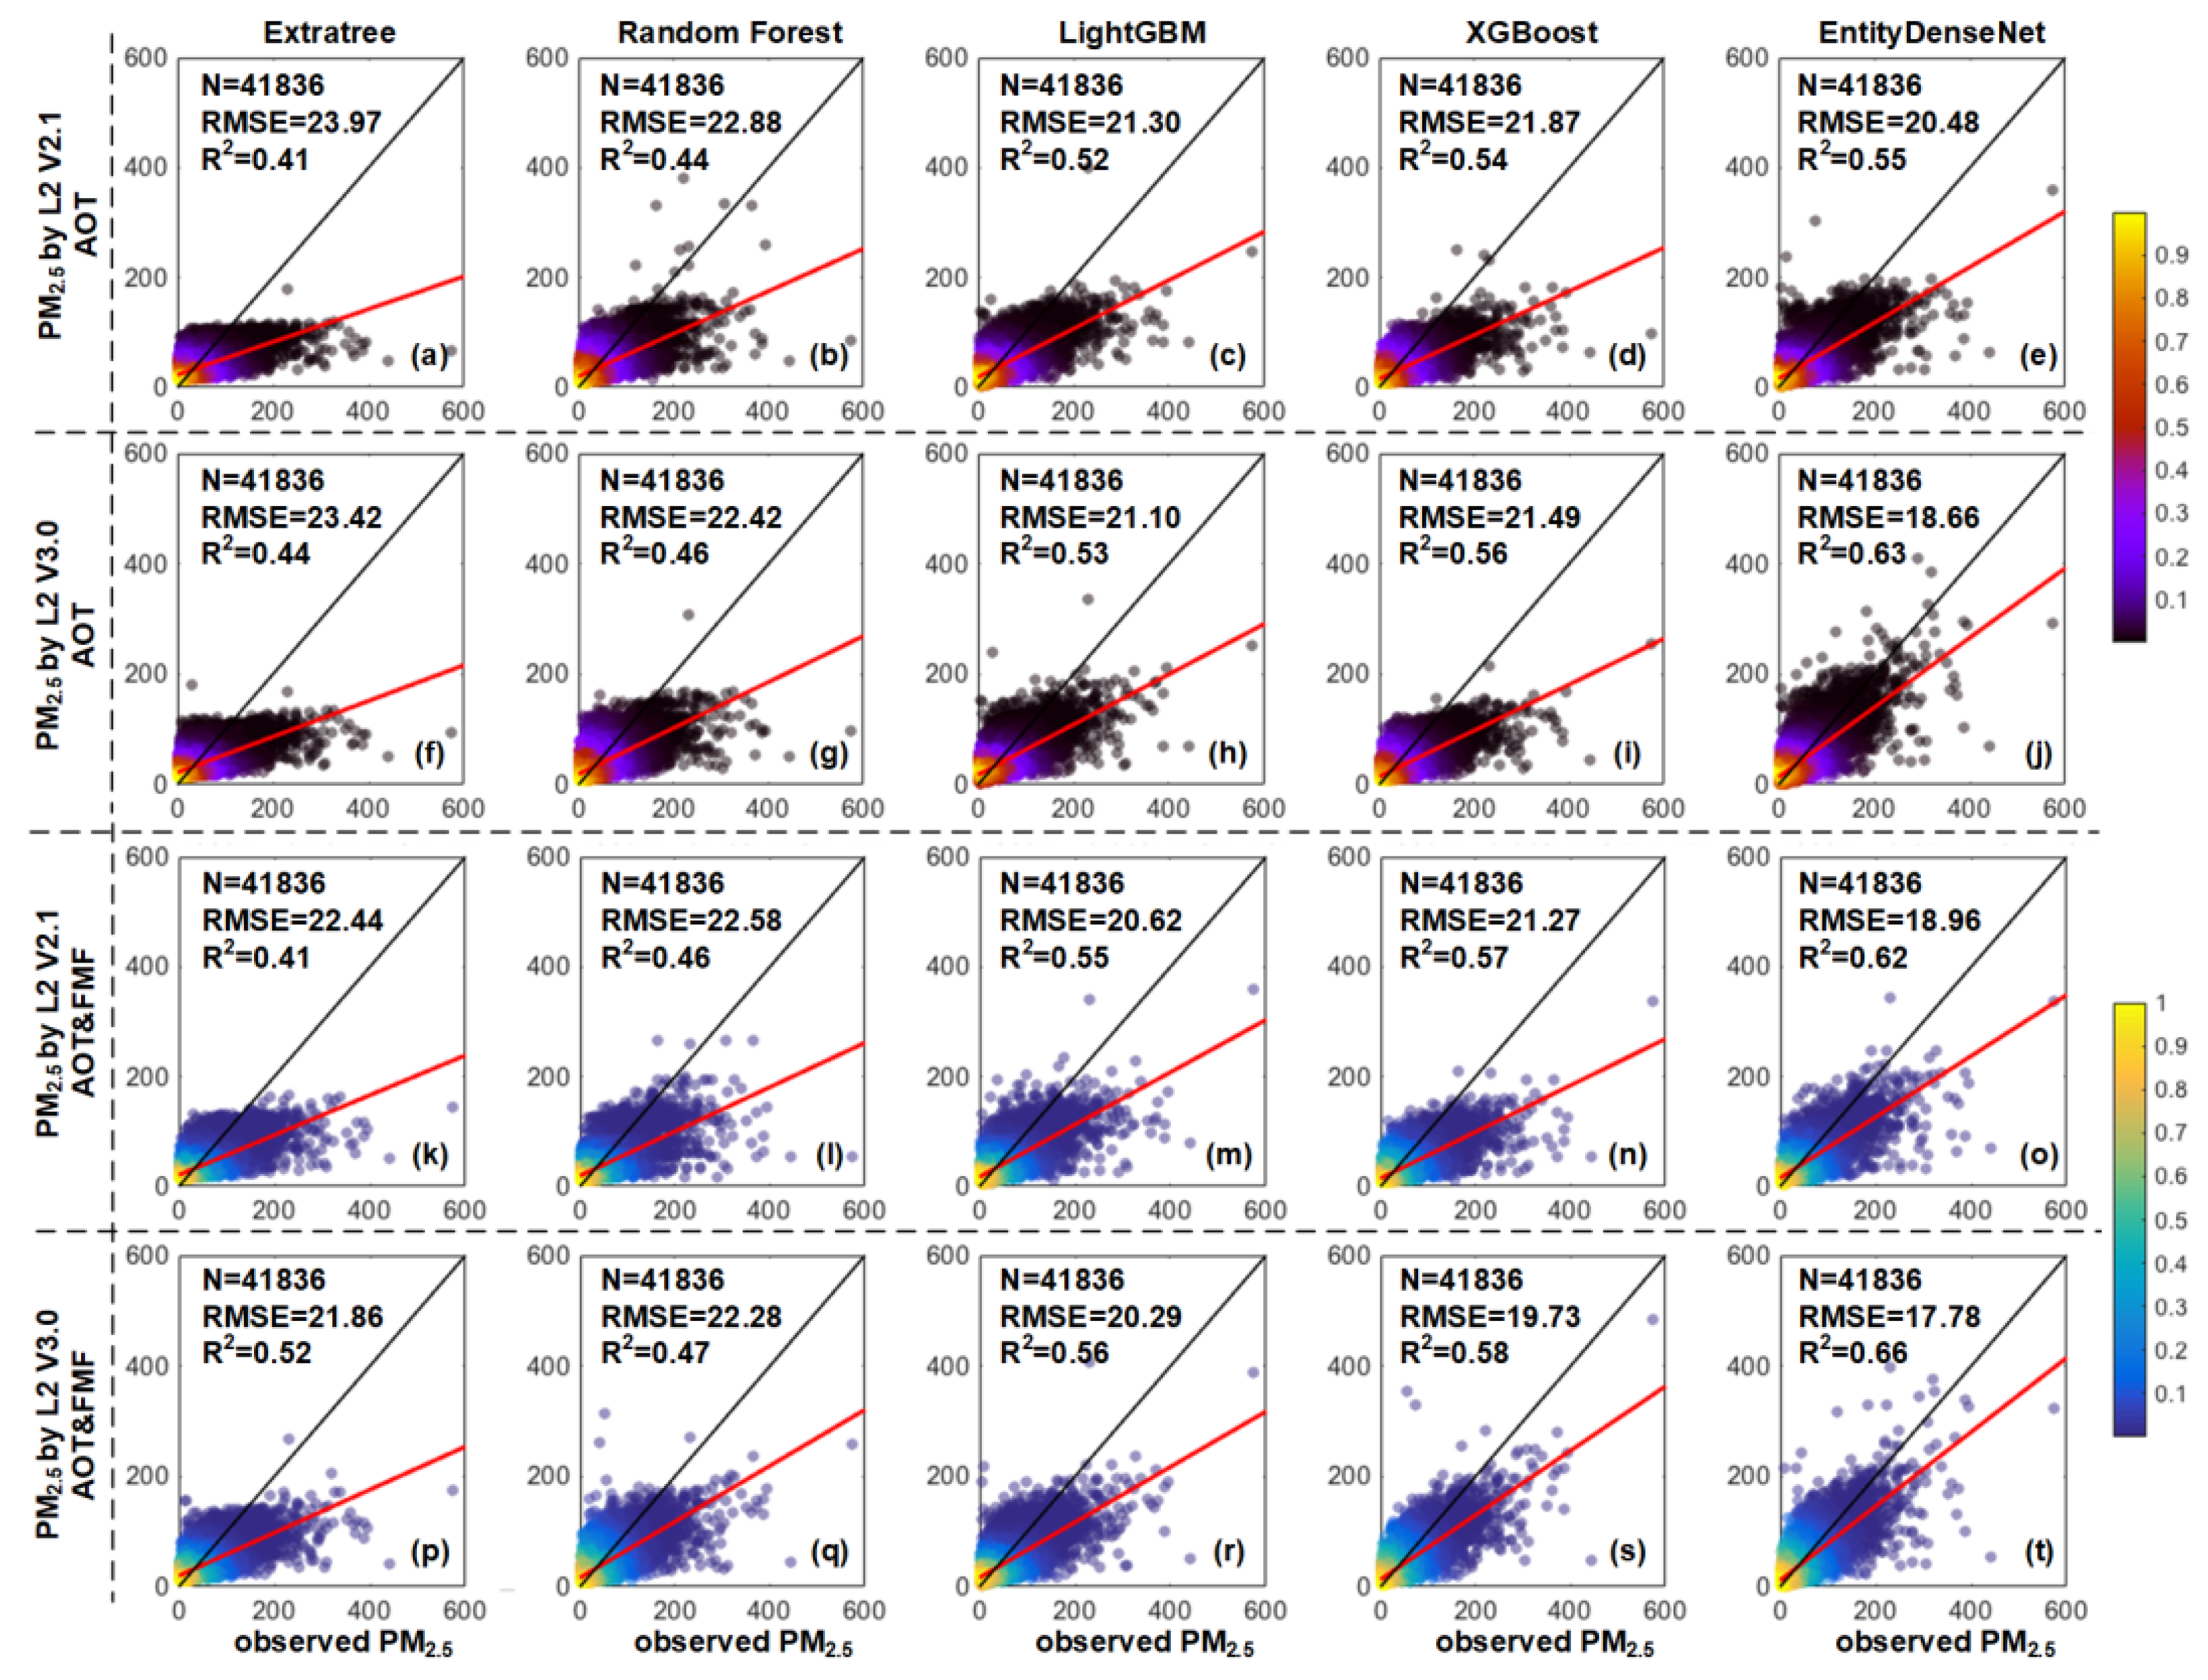
Figure 7 shows the estimation of PM2.5 obtained from the deep learning model (EntityDenseNet) and the four classical machine learning methods (Extratree, Random Forest, LightGBM, and XGBoost) using Himawari-8 V2.1 and V3.0. To ensure consistency in PM2.5, we used the same training and test data for all the models. The results clearly show that for all models, PM2.5 based on both FMF and AOT (FMF&AOT-PM2.5) performed better than PM2.5 based only on AOT (AOT-PM2.5), which indicates the importance of using FMF to improve the estimation of PM2.5. EntityDenseNet exhibited the best improvement of all models: R2 increased by 0.11 (0.03) and RMSE decreased by 1.82 (0.88) µg/m3 for V2.1 (V3.0) data.
MODIS daily Level-2 data (MOD04_L2) [36] and the Suomi National Polar-orbiting Partnership (SNPP) VIIRS L2 dark target products (AERDT_L2_VIIRS_SNP) [36,67] also provide the FMF over land at the spatial resolution of 10km and 6km, respectively. In this study, we further used MODIS and VIIRS FMF for comparison. Table S5 evaluated the MODIS, VIIRS, Himawari-8 V2.1, and Himawari-8 V3.0 FMF against the AERONET stations in mainland China during 2020. We can see that the MODIS and VIIRS FMF has significantly lower accuracy (RMSE > 0.50) compared to Himawari-8 V3.0 FMF (RMSE = 0.21). Because MODIS and VIIRS are polar-orbiting satellites, they have smaller match-ups (N < 500) with AERONET data in comparison to Himawari-8 (N > 7000). Figure S6 shows the application of the four FMF products to estimate PM2.5 over China. We found that the PM2.5 estimated by MODIS and VIIRS FMF have a poorer performance than by the Himawari-8 V3.0 FMF.
Previous studies have also shown improvements in PM2.5 estimation accuracy with the addition of FMF. For example, Choi et al. [68] used a global chemical transport model (GEOS-Chem) and reported a considerable improvement in the results of PM2.5, with regression slopes between estimated and observed PM2.5 closer to 1. The results in our study also showed that for FMF&AOT-PM2.5, the accuracy of V3.0 was better than that of V2.1. The most significant improvement was found in the EntityDenseNet modeling results, where the R2 increased by 0.04 and the RMSE decreased by 1.18 µg/m3. The improvement in the accuracy of the V3.0 FMF was superior to that of the V2.1 FMF (Figure 5); this implies that when the FMF is more accurate, superior PM2.5 estimation can be obtained. Zhao et al. [13] used MODIS FMF (mean error = 0.38) and the fused FMF, which showed a superior accuracy (mean error = 0.13), to estimate PM2.5, and the PM2.5 estimated from the fused FMF (mean error = 41.8 µg/m3) was superior to that of the MODIS FMF (mean error = 45.3 µg/m3). Our results are consistent with those of earlier studies.

3.3. Application of FMF for Conducting PM2.5 Estimations in China

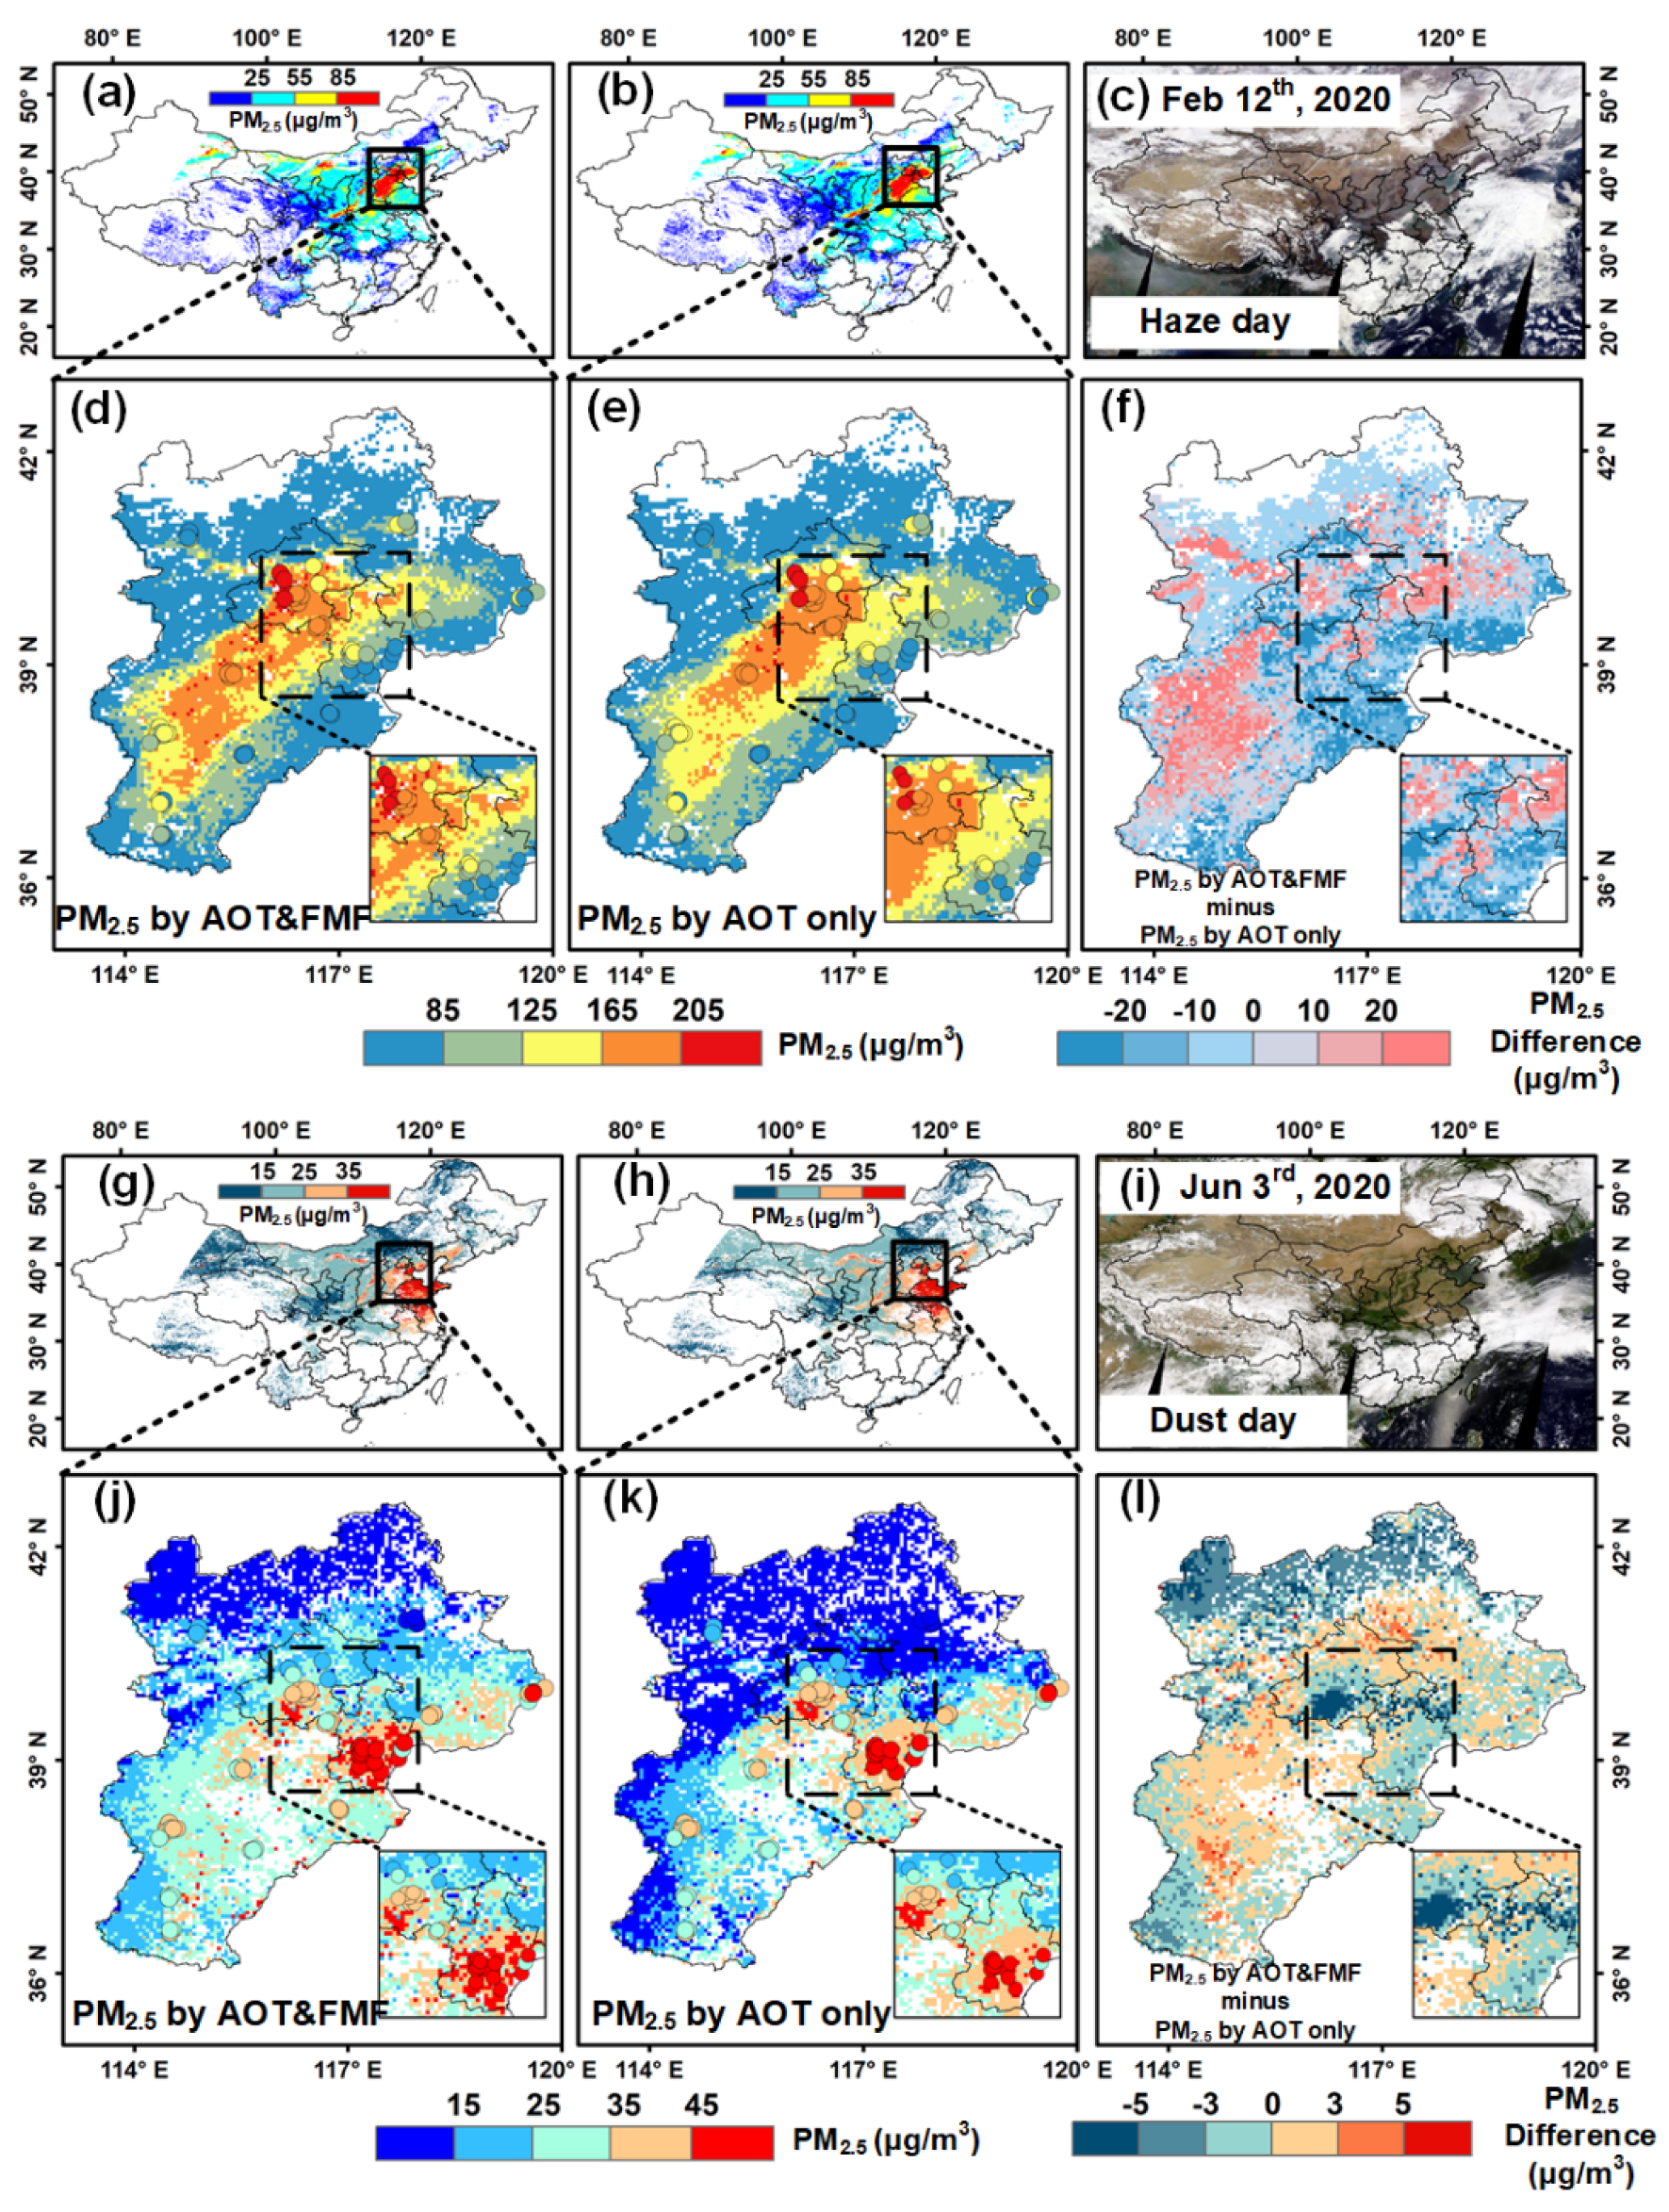
As the EntityDenseNet model and Himawari-8 L2 V3.0 data provided the best results, we used them to retrieve PM2.5 in 2020 over China to verify their potential in providing superior PM2.5 estimations. PM2.5 estimations, including AOT&FMF-PM2.5 and AOT-PM2.5, were further compared with ground-level PM2.5 values. The results showed that AOT&FMF-PM2.5 provided significantly better accuracy than AOT-PM2.5 on dust and haze days. Figure 8 shows the regional performances of AOT&FMF-PM2.5 and AOT-PM2.5 over China on typical dust and haze days. On 12 February 2020, according to the true color image (Figure 8c), haze covered the Beijing-Tianjin-Hebei (BTH) region, and the PM2.5 concentration was significantly higher (>85 µg/m3) than in other regions of China (Figure 8a,b). AOT&FMF-PM2.5 showed close agreement with ground-based PM2.5 (Figure 8d) and it thus captured the high PM2.5 concentration within the central BTH region. In contrast (Figure 8e), AOT-PM2.5 underestimated the PM2.5 concentration in the main urban area of Beijing, where the ground-based PM2.5 exceeded 205 µg/m3. In addition, AOT-PM2.5 overestimated PM2.5, where the ground-based measurement was less than 85 µg/m3 in southeastern Tianjin. The difference between the modeling results (Figure 8f) shows that, compared with AOT&FMF-PM2.5, AOT-PM2.5 tended to overestimate PM2.5 in areas with lower pollution levels (PM2.5 < 85 µg/m3), particularly in the southeastern part of the BTH regions when the reading was over 20 µg/m3, but it also underestimated PM2.5 in seriously polluted areas (PM2.5 > 125 µg/m3) by over 10 µg/m3.
Figure 8i shows that on 3 June 2020, the BTH region experienced a dust day, and there was a moderate concentration of PM2.5 nationwide (<35 µg/m3) (Figure 8g,h). Compared with ground-level PM2.5, AOT&FMF-PM2.5 (Figure 8d) corresponded well with the low PM2.5 levels (<25 µg/m3) in the northern BTH region and the high PM2.5 (>45 µg/m3) in southeastern Tianjin, while AOT-PM2.5 (Figure 8k) clearly underestimated PM2.5, with a PM2.5 value of less than 45 µg/m3. Moreover, the difference in the modeling results (Figure 8l) shows that, compared with AOT&FMF-PM2.5, AOT-PM2.5 significantly overestimated PM2.5 in the northern BTH region, the main urban area of Beijing, and southeastern Tianjin by over 5 µg/m3. In general, Figure 8 reveals that, although FMF had little influence on the overall distribution of PM2.5 estimations in China, it significantly improved the estimation of PM2.5, and differences between AOT&FMF-PM2.5 and AOT-PM2.5 are evident on a regional scale.
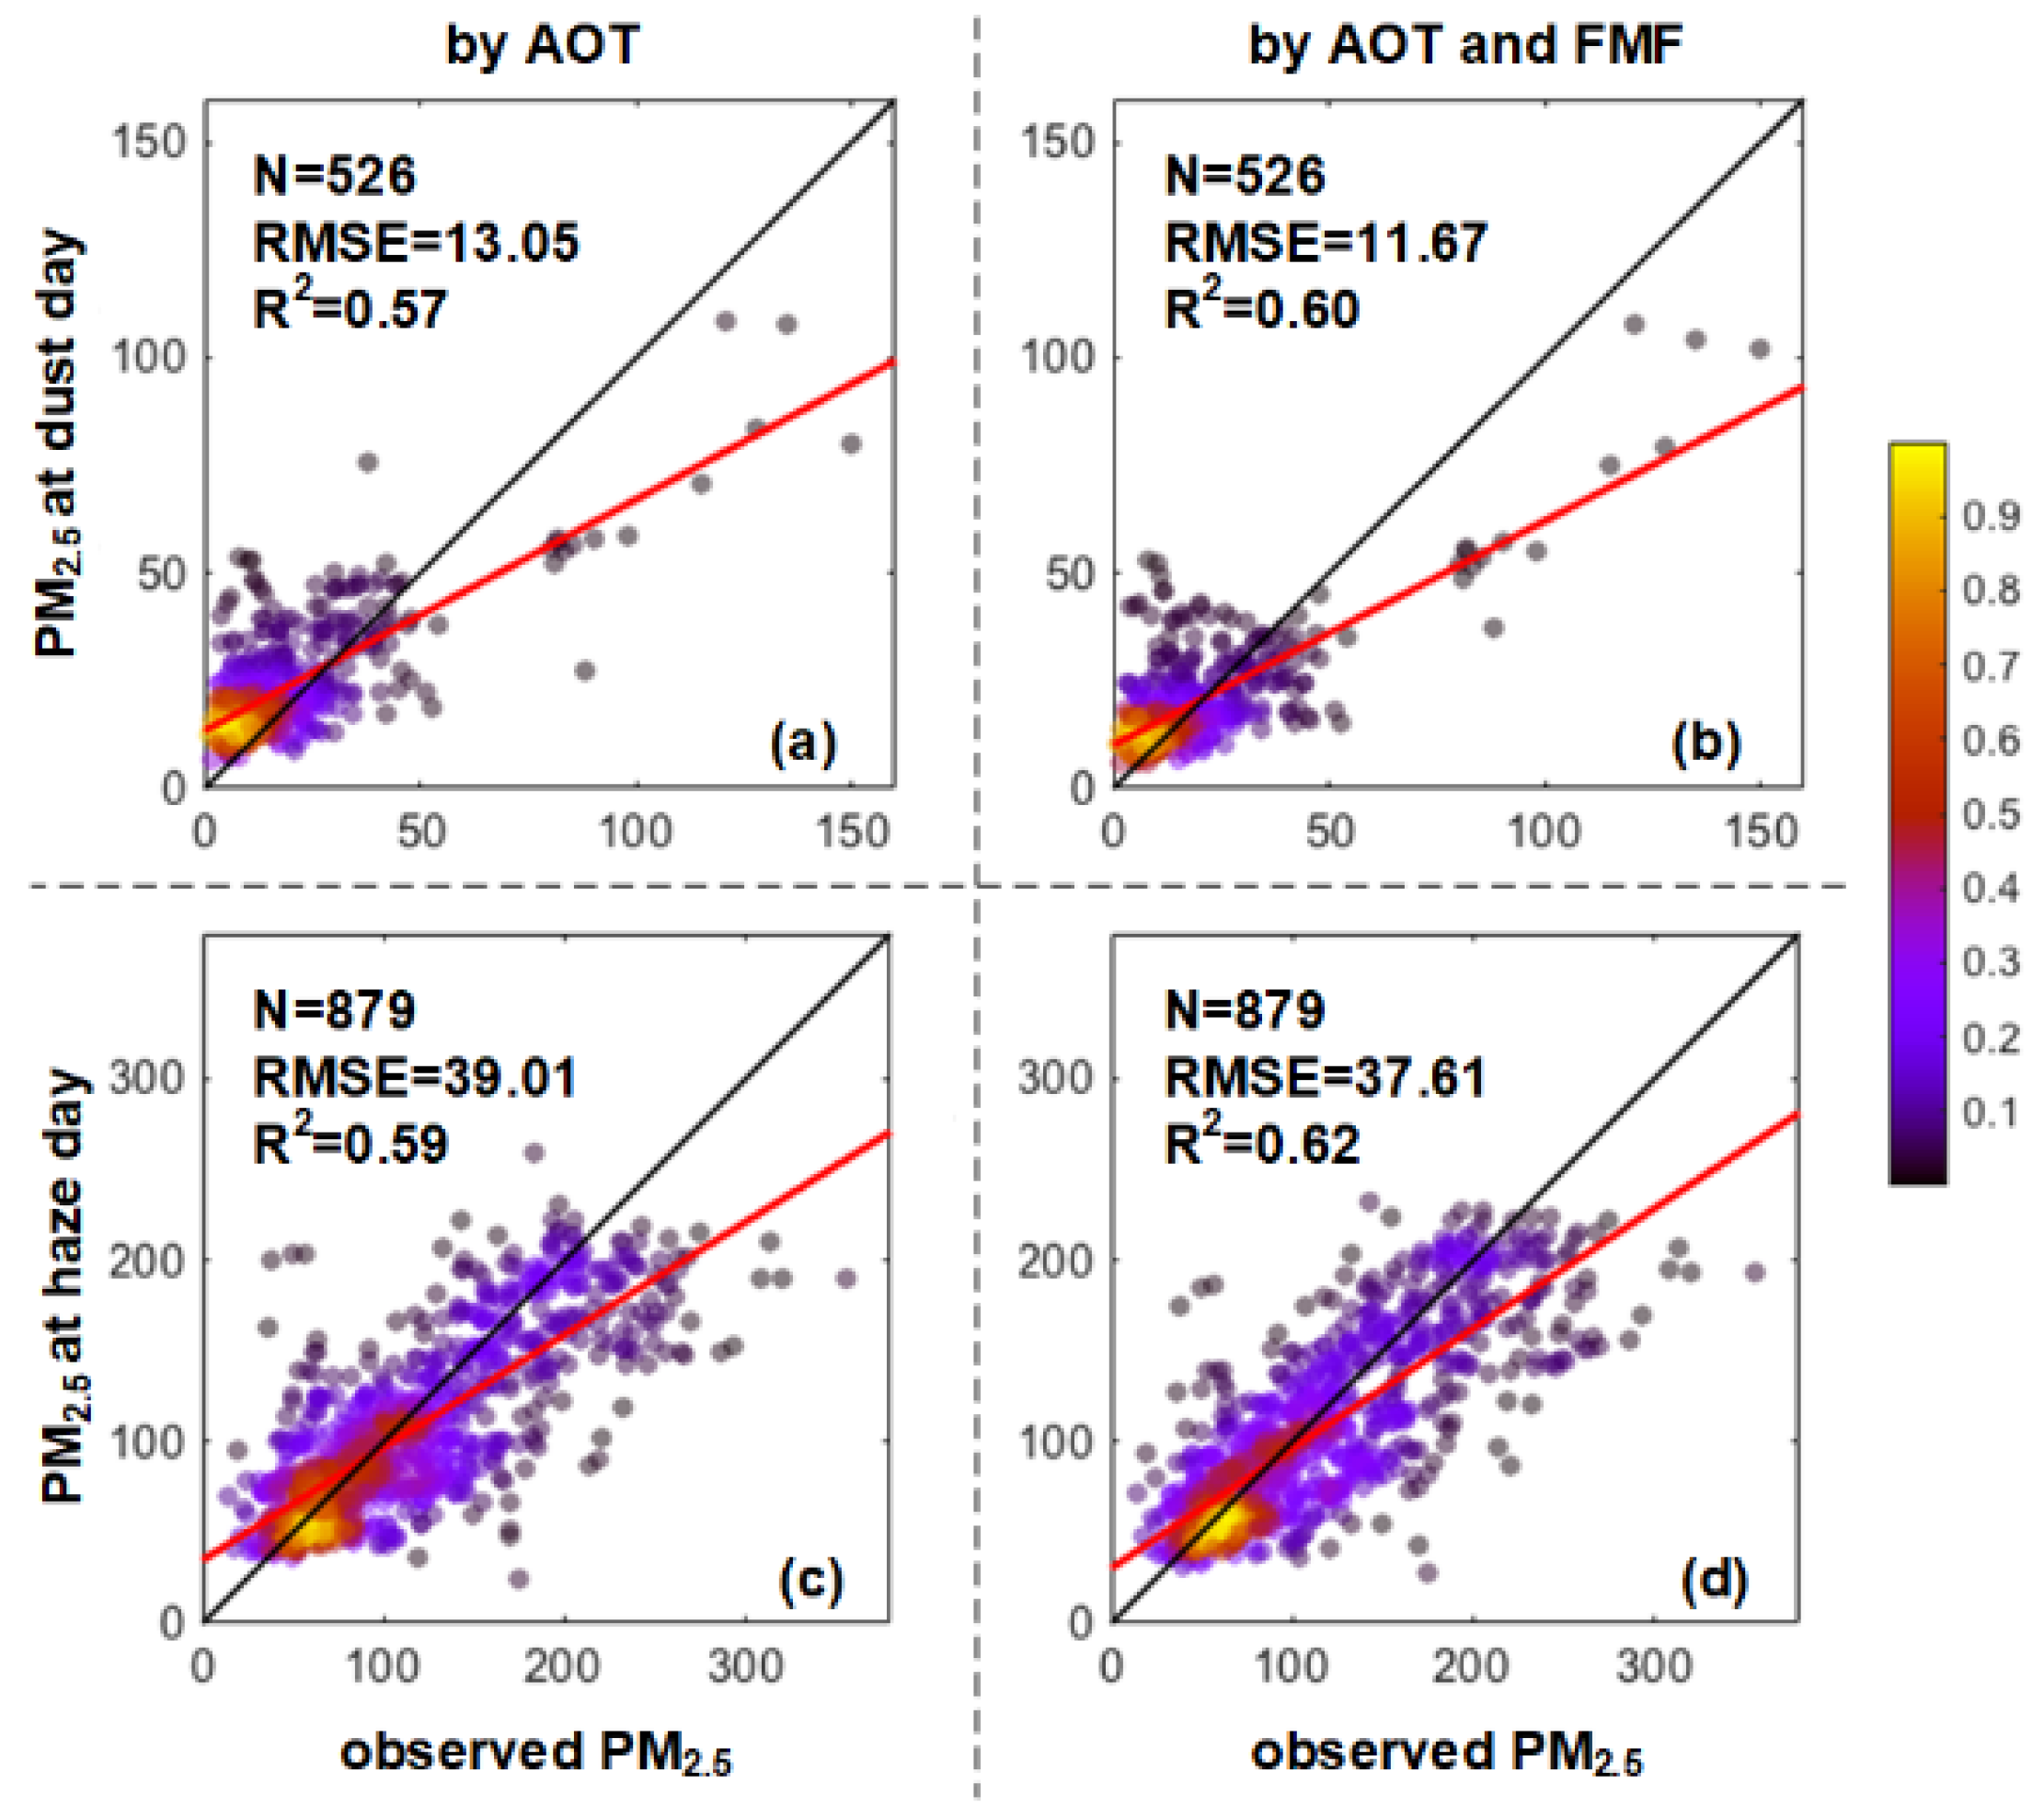
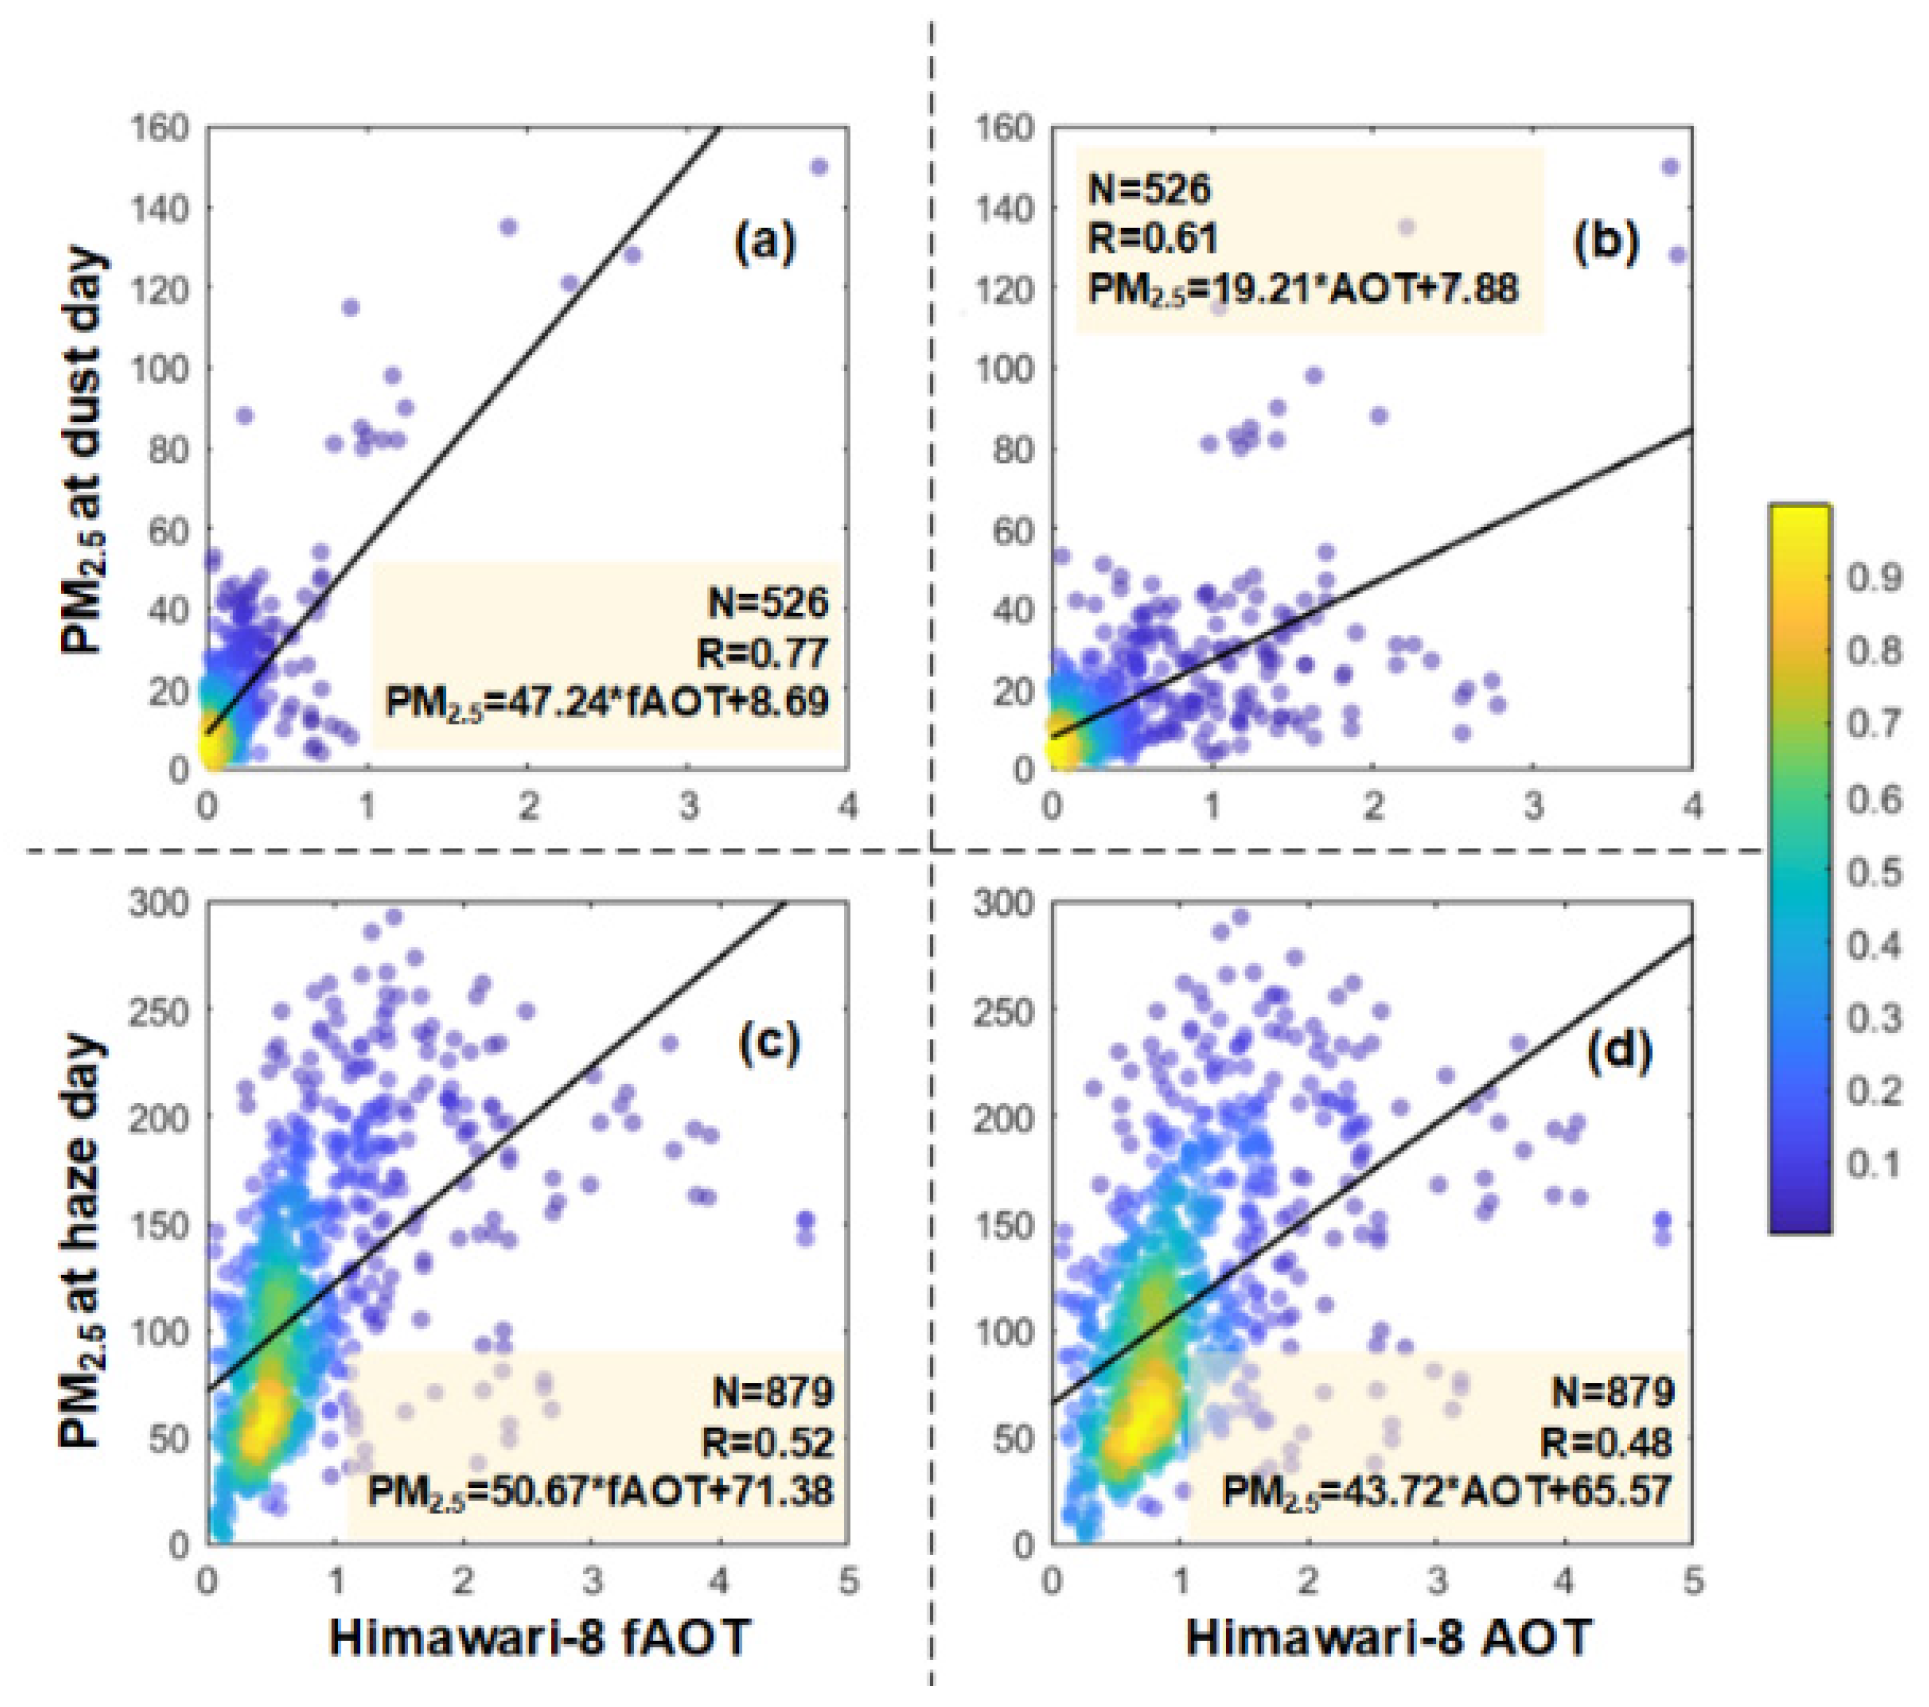
According to Figure 9a,b, AOT&FMF-PM2.5 provided R2 and RMSE values of 0.60 and 11.67 µg/m3, respectively, on dust days, which were better than the results of AOT-PM2.5 (R2 = 0.57, RMSE = 13.05 µg/m3). In addition, the overall accuracy of AOT&FMF PM2.5 (R2 = 0.62, RMSE=37.61 µg/m3) on haze days also outperformed AOT-PM2.5 (R2 = 0.59, RMSE = 39.01 µg/m3) (Figure 9c,d). This improvement can be attributed to the greater correlation achieved between fAOT and surface PM2.5. As shown by the linear relationships in Figure 10, fAOT calculated by Himawari-8 FMF and AOT had a higher correlation with PM2.5 (dust day: R = 0.77; haze day: R = 0.52) than Himawari-8 AOT (dust day: R = 0.61; haze day: R = 0.48) under both conditions. Moreover, in Figure 11, AERONET fAOT (dust day: R = 0.82; haze day: R = 0.56) also showed better correlation with AOT (dust day: R = 0.72; haze day: R = 0.52) in both dust and haze days from 2015–2019. According to the number of haze and dust days occurring every year from to 2015–2019 (Figure 11c), Beijing experienced frequent haze and dust days, especially in 2015 when 90 haze days were recorded. As haze days are dominated by fine mode aerosols and prohibitively high PM2.5, fAOT becomes more important than AOT with respect to estimating PM2.5. These results therefore prove that using fAOT to estimate PM2.5 is more suitable than using AOT, and this is in agreement with the results of previous studies, such as those of Di Nicolantonio et al. [69] and Yan et al. [16]. In addition, on haze days, Zhang and Li [59] found that the R2 of PM2.5 with fAOT was higher than that with AOT (0.69), which indicates that dominant fine mode aerosols on haze days result in a close association between fAOT and AOT, which makes the estimation of PM2.5 more accurate when using FMF.

4. Discussion

Satellite data have been used with various models to estimate ground-level PM2.5 by building a relationship between PM2.5 and AOT (Figure 1). However, as shown in Figure 10, the correlations between PM2.5 and AOT are mediocre because they lack identical size information, and this difference in aerosol size information affects the correlations between PM2.5 and AOT. For example, when coarse mode aerosols are dominant, the relationships between PM2.5 and AOT are weakened compared to when fine mode aerosols dominate [28]. Yang et al. [70] reported that, although all the cities in the BTH region are located in urban agglomerations, the aerosols in the region mainly consist of fine particles, such as sulfates and nitrates. This means that the correlations between PM2.5 and AOT are higher than in cities within the Pearl River Delta (PRD) region, where aerosols comprise coarse particles, such as sea salt. In the BTH region, the proportions of fine particles vary among seasons, with higher numbers of fine mode aerosols during winter and higher numbers of coarse mode aerosols during spring; therefore, the relationship between PM2.5 and AOT is better in winter [71]. As PM2.5 is mainly composed of fine particles, separating the fine mode information from the total AOT helps to build a better and closer relationship with PM2.5.
In this study, we found that fAOT separated by FMF from total AOT had both significant linear and non-linear correlations with PM2.5 (Figure 4). This phenomenon has also been reported in a previous study, which showed that fAOT (R = 0.74) had a better correlation with PM2.5 than AOT (R = 0.49) [16]. In addition, the study of Wei et al. [24] also found that the distribution of fAOT was closer to PM2.5 than AOT over China, which indicated the superiority of the relationship between fAOT and PM2.5.
FMF has already been introduced in statistical models for estimating PM2.5; for example, the study of She et al. [72] employed a linear mixed effect model that also combines FMF to estimate PM2.5 in the Yangtze River Delta, China. However, FMF has rarely been applied in machine learning models. In this study, we used the deep learning model, EntityDenseNet, and four traditional machine learning methods to apply FMF in estimating PM2.5 over China. The results showed that, compared with using only AOT, estimations of PM2.5 with FMF provided higher R2 and lower RMSE values for all the models (Figure 7). This indicates that the use of aerosol size information can assist in providing estimations of PM2.5 that are more accurate than those previously obtained. Zhang and Li [59] also reported that using fAOT provides better PM2.5 estimates than AOT during haze days, with a reduction in the RMSE from 61 to 53 µg/m3. Spatially, on haze days (Figure 8), AOT-PM2.5 showed an obvious overestimation in the southeastern BTH region (>20 µg/m3) and an underestimation in the southern BTH region (>10 µg/m3). On dust days, AOT-PM2.5 provided a large overestimation in the main urban area of Beijing (of over 5 µg/m3). The superior accuracy of AOT&FMF-PM2.5 is partly due to the better correlation between PM2.5 and fAOT than AOT and PM2.5 (Figure 10 and Figure 11). Therefore, using FMF in models can achieve different distributions of PM2.5 estimations compared to using only AOT. Owing to the high spatial and temporal resolutions of satellites such as Himawari-8, improvements in PM2.5 estimation will generate data providing more accurate fine spatial distributions and variations of PM2.5. This can enhance our understanding of the changes and transportation of fine mode pollutants.
In addition, Figure 7 shows that the FMF&AOT-PM2.5 by Himawari-8 V3.0 outperforms FMF&AOT-PM2.5 by Himawari-8 V2.1, which indicates that a more accurate FMF product is required to provide superior estimations of PM2.5. Although Figure 5 provides evidence of the improvements in V3.0 FMF compared to V2.1, it still provides a low accuracy (R = 0.33) and large RMSE of 0.26, which hinders the application of FMF on PM2.5 estimations. Some studies have proposed using modified satellite-based FMF retrievals to improve the accuracy of FMF. For example, Yan et al. [38] applied an improved LUT-SDA for FMF retrieval, which resulted in an RMSE of 0.168, and Chen et al. [73] used deep learning to improve the accuracy of FMF, and achieved an RMSE of 0.157. However, FMF products with a high spatial resolution on a global scale are currently rare. Although Yan et al. [74] generated a 10-year FMF product on a global scale, it has a spatial resolution of 1° × 1°, which cannot fulfill the needs of estimating PM2.5 at a high spatial resolution. Therefore, the generation of a highly accurate FMF product with a high spatial resolution is urgently required.

5. Conclusions

This study investigated the linear and non-linear relationships between fAOT and PM2.5 over five AERONET stations in China (Beijing, Baotou, Taihu, Xianghe, and Xuzhou) using AERONET fAOT and ground-level PM2.5 data. The linear relationships were significant over the stations (with an overall R of 0.45), and the non-linear relationships between fAOT and PM2.5 were significant for all stations in China. Data obtained from Himawari-8 aerosol product data and meteorological data obtained in the year 2020 were then used to estimate PM2.5 employing a deep learning method (EntityDenseNet) and four traditional machine learning methods (Extratree, RF, XGBoost, and LightGBM). The PM2.5 estimations were found to be more accurate when adding FMF as input data (FMF&AOT-PM2.5) than when using only AOT (AOT-PM2.5). Compared with the FMF&AOT-PM2.5 by V2.1 FMF, the FMF&AOT-PM2.5 by V3.0 FMF showed further improvement. These results indicate that when FMF is more accurate, superior PM2.5 estimations can be obtained. When both FMF&AOT-PM2.5 and AOT-PM2.5 from 2020 over China were applied, the agreement between FMF&AOT-PM2.5 and ground-level PM2.5 was obviously closer than that of AOT-PM2.5 on both dust and haze days. These results are related in part to the better correlation between PM2.5 and fAOT (dust days: R = 0.82; haze days: R = 0.56) than with AOT (dust days: R = 0.72; haze days: R = 0.52).
This study demonstrates that incorporating FMF can effectively improve the ability of machine learning models to accurately estimate PM2.5 from satellite data. However, a more accurate, higher spatial and temporal resolution of the FMF product is required to further improve PM2.5 estimation.

Supplementary Materials

The following are available online at https://www.mdpi.com/article/10.3390/rs13142779/s1. Figure S1: Map of Himawari-8/AHI imaging zone with the base map showing the DEM in meters. Blue and orange dots represent Level 1.5 (L1.5) and Level 2.0 (L2.0) AERONET stations that were used in validation, respectively; Figure S2: The study area (China) for PM2.5 estimation and the ground-level stations of (a) 1701 PM2.5 stations (pink scatters), (b) 95 radiosonde stations (black scatters) and the DEM over China, (c) 405 meteorology stations (magenta scatters) and (d) climate zones over China classified by Koppen-Geiger climate classifications; Figure S3. Differences between validation results (R and RMSE) for Himwari-8 V3.0 and V2.1 (V3.0 minus V2.1) data over AERONET sites: (a,b) for AE; (c,d) for AE after quality control (AE QA); and (e,f) for FMF; Figure S4. Validation results (R and RMSE) for Himwari-8 V3.0 and V2.1 AE over AEROENT sites: (a,e) for V2.1 AE; (b,f) for V3.0 AE; (c,g) for V2.1 AE QA; (d,h) for V3.0 AE QA; Figure S5. Validation results (R and RMSE) for Himwari-8 V3.0 and V2.1 FMF over AEROENT sites: (a,c) for V2.1 FMF; (b,d) for V3.0 FMF; Figure S6. Density scatter plots of modeling results of ground-based PM2.5 retrieved by four machine learning models (Extratree, Random Forest, LightGBM and XGBoost) based on four different FMF products (Himawari-8 V2.1 and V3.0 FMF, MODIS and VIIRS FMF) with the same lengths for training and test datasets. The black and red lines represent 1:1 and fitting lines, respectively. Because the amount of training data is small (N = 1321), which is unsuitable for applying deep learning models, EntityDenseNet was not used for PM2.5 estimations here. Table S1. Previous studies of machine learning retrieved PM2.5 since 2014. Table S2. AERONET stations and their data level used in this study. Table S3. The parameters for the four machine learning models used in this study. Table S4. The class types and their abbreviations of global climate zone. Table S5. The evaluation of MODIS, VIIRS and Himawari-8 V2.1 and V3.0 FMF against the AERONET stations mainland China.

Author Contributions

Conceptualization, X.Y. and Z.Z.; methodology, X.Y.; software, X.Y.; validation, Z.Z.; formal analysis, Z.Z.; investigation, Y.G.; data curation, D.L.; writing—original draft preparation, Z.Z.; writing—review and editing, W.S.; visualization, Z.Z.; supervision, X.Y.; funding acquisition, X.Y. All authors have read and agreed to the published version of the manuscript.

Funding

This work was funded by the National Natural Science Foundation of China (42030606, 41801329 and 91837204), the National Key Research and Development Plan of China (2017YFC1501702), the Open Fund of State Key Laboratory of Remote Sensing Science (OFSLRSS201915) and the Fundamental Research Funds for the Central Universities.

Data Availability Statement

The Himawari-8 was collected from the Himawari Monitor and the P-Tree system (ftp.ptree.jaxa.jp, accessed on 4 June 2021). The AERONET data are available at https://aeronet.gsfc.nasa.gov/ (accessed on 4 June 2021). The radionsonde data are from NOAA’s Integrated Global Radiosonde Archive data (https://www.ncdc.noaa.gov/data-access/weather-balloon/integrated-global-radiosonde-archive, accessed on 4 June 2021). The in-situ meteorological data are from NOAA’s National Centers for Environmental Information (https://www.ncei.noaa.gov/products/integrated-surface-database, accessed on 4 June 2021). The in-situ PM2.5 data are available at the China National Environmental Monitoring Center (http://www.cnemc.cn) (accessed on 4 June 2021).

Acknowledgments

The authors gratefully acknowledge the Japan Meteorological Agency (JMA) for providing Himawari-8 data, Goddard Space Flight Center for providing the AERONET ground-based measurements, NOAA’s National Centers for Environmental Information (NCEI) for providing the Global Historical Climatology Network data and the Integrated Global Radiosonde Archive data, and the China National Environmental Monitoring Center for providing the ground-based PM2.5 data.

Conflicts of Interest

The authors declare no conflict of interest.

References

  1. Bell, M.L.; Ebisu, K.; Peng, R.D. Community-level spatial heterogeneity of chemical constituent levels of fine particulates and implications for epidemiological research. J. Expo. Sci. Environ. Epidemiol. 2011, 21, 372–384. [Google Scholar] [CrossRef] [Green Version]
  2. Xu, P.; Chen, Y.; Ye, X. Haze, air pollution, and health in China. Lancet 2013, 382, 2067. [Google Scholar] [CrossRef]
  3. Van Donkelaar, A.; Martin, R.; Brauer, M.; Hsu, N.C.; Kahn, R.A.; Levy, R.C.; Lyapustin, A.; Sayer, A.; Winker, D.M. Global Estimates of Fine Particulate Matter using a Combined Geophysical-Statistical Method with Information from Satellites, Models, and Monitors. Environ. Sci. Technol. 2016, 50, 3762–3772. [Google Scholar] [CrossRef]
  4. Schaap, M.; Apituley, A.; Timmermans, R.M.A.; Koelemeijer, R.B.A.; De Leeuw, G. Exploring the relation between aerosol optical depth and PM2.5 at Cabauw, the Netherlands. Atmos. Chem. Phys. Discuss. 2009, 9, 909–925. [Google Scholar] [CrossRef] [Green Version]
  5. Gupta, P.; Christopher, S.A.; Wang, J.; Gehrig, R.; Lee, Y.; Kumar, N. Satellite remote sensing of particulate matter and air quality assessment over global cities. Atmos. Environ. 2006, 40, 5880–5892. [Google Scholar] [CrossRef]
  6. Guo, Y.; Feng, N.; Christopher, S.A.; Kang, P.; Zhan, F.B.; Hong, S. Satellite remote sensing of fine particulate matter (PM2.5) air quality over Beijing using MODIS. Int. J. Remote Sens. 2014, 35. [Google Scholar] [CrossRef]
  7. Van Donkelaar, A.; Martin, R.V.; Brauer, M.; Kahn, R.; Levy, R.; Verduzco, C.; Villeneuve, P.J. Global Estimates of Ambient Fine Particulate Matter Concentrations from Satellite-Based Aerosol Optical Depth: Development and Application. Environ. Health Perspect. 2010, 118, 847–855. [Google Scholar] [CrossRef] [Green Version]
  8. Zhang, Y.; Li, Z.; Bai, K.; Wei, Y.; Xie, Y.; Zhang, Y.; Ou, Y.; Cohen, J.; Zhang, Y.; Peng, Z.; et al. Satellite remote sensing of atmospheric particulate matter mass concentration: Advances, challenges, and perspectives. Fundam. Res. 2021, 1, 240–258. [Google Scholar] [CrossRef]
  9. Remer, L.A.; Kaufman, Y.J.; Tanré, D.; Mattoo, S.; Chu, D.A.; Martins, J.V.; Li, R.R.; Ichoku, C.; Levy, R.C.; Kleidman, R.G.; et al. The MODIS Aerosol Algorithm, Products, and Validation. J. Atmos. Sci. 2005, 62, 947–973. [Google Scholar] [CrossRef] [Green Version]
  10. Veihelmann, B.; Levelt, P.P.; Stammes, P.; Veefkind, J.P. Simulation study of the aerosol information content in OMI spectral reflectance measurements. Atmos. Chem. Phys. Discuss. 2007, 7, 3115–3127. [Google Scholar] [CrossRef] [Green Version]
  11. Jackson, J.M.; Liu, H.; Laszlo, I.; Kondragunta, S.; Remer, L.A.; Huang, J.; Huang, H.-C. Suomi-NPP VIIRS aerosol algorithms and data products. J. Geophys. Res. Atmos. 2013, 118, 12673–12689. [Google Scholar] [CrossRef]
  12. Bessho, K.; Date, K.; Hayashi, M.; Ikeda, A.; Imai, T.; Inoue, H.; Kumagai, Y.; Miyakawa, T.; Murata, H.; Ohno, T.; et al. An Introduction to Himawari-8/9—Japan’s New-Generation Geostationary Meteorological Satellites. J. Meteorol. Soc. Jpn. 2006, 94, 151–183. [Google Scholar] [CrossRef] [Green Version]
  13. Zhao, A.; Li, Z.; Zhang, Y.; Zhang, Y.; Li, D. Merging MODIS and Ground-Based Fine Mode Fraction of Aerosols Based on the Geostatistical Data Fusion Method. Atmosphere 2017, 8, 117. [Google Scholar] [CrossRef] [Green Version]
  14. Zhang, Y.; Li, Z. Remote sensing of atmospheric fine particulate matter (PM2.5) mass concentration near the ground from satellite observation. Remote Sens. Environ. 2015, 160, 252–262. [Google Scholar] [CrossRef]
  15. Liang, C.; Zang, Z.; Li, Z.; Yan, X. An Improved Global Land Anthropogenic Aerosol Product Based on Satellite Retrievals From 2008 to 2016. IEEE Geosci. Remote Sens. Lett. 2021, 18, 944–948. [Google Scholar] [CrossRef]
  16. Yan, X.; Shi, W.; Li, Z.; Li, Z.; Luo, N.; Zhao, W.; Wang, H.; Yu, X. Satellite-based PM2.5 estimation using fine-mode aerosol optical thickness over China. Atmos. Environ. 2017, 170, 290–302. [Google Scholar] [CrossRef]
  17. Geng, G.; Meng, X.; He, K.; Liu, Y. Random forest models for PM2.5 speciation concentrations using MISR fractional AODs. Environ. Res. Lett. 2020, 15, 034056. [Google Scholar] [CrossRef]
  18. Huang, K.; Xiao, Q.; Meng, X.; Geng, G.; Wang, Y.; Lyapustin, A.; Gu, D.; Liu, Y. Predicting monthly high-resolution PM2.5 concentrations with random forest model in the North China Plain. Environ. Pollut. 2018, 242, 675–683. [Google Scholar] [CrossRef]
  19. Li, L. A Robust Deep Learning Approach for Spatiotemporal Estimation of Satellite AOD and PM2.5. Remote Sens. 2020, 12. [Google Scholar] [CrossRef] [Green Version]
  20. Wang, Q.; Ding, X.; Tong, X.; Atkinson, P. Spatio-temporal spectral unmixing of time-series images. Remote Sens. Environ. 2021, 259, 112407. [Google Scholar] [CrossRef]
  21. Levy, R.C.; A Remer, L.; Kleidman, R.; Mattoo, S.K.; Ichoku, C.; Kahn, R.; Eck, T.F. Global evaluation of the Collection 5 MODIS dark-target aerosol products over land. Atmos. Chem. Phys. Discuss. 2010, 10, 10399–10420. [Google Scholar] [CrossRef] [Green Version]
  22. Yang, X.; Zhao, C.; Luo, N.; Zhao, W.; Shi, W.; Yan, X. Evaluation and Comparison of Himawari-8 L2 V1.0, V2.1 and MODIS C6.1 aerosol products over Asia and the oceania regions. Atmos. Environ. 2020, 220, 117068. [Google Scholar] [CrossRef]
  23. Choi, M.; Kim, J.; Lee, J.; Kim, M.; Park, Y.J.; Jeong, U.; Kim, W.; Hong, H.; Holben, B.; Eck, T.F.; et al. GOCI Yonsei Aerosol Retrieval (YAER) algorithm and validation during the DRAGON-NE Asia 2012 campaign. Atmos. Meas. Tech. 2016, 9, 1377–1398. [Google Scholar] [CrossRef] [Green Version]
  24. Wei, Y.; Li, Z.; Zhang, Y.; Chen, C.; Dubovik, O.; Xu, H.; Li, K.; Chen, J.; Wang, H.; Ge, B.; et al. Validation of POLDER GRASP aerosol optical retrieval over China using SONET observations. J. Quant. Spectrosc. Radiat. Transf. 2020, 246, 106931. [Google Scholar] [CrossRef]
  25. Zhang, Y.; Li, Z.; Liu, Z.; Wang, Y.; Qie, L.; Xie, Y.; Hou, W.; Leng, L. Retrieval of aerosol fine-mode fraction over China from satellite multiangle polarized observations: Validation and comparison. Atmos. Meas. Tech. 2021, 14, 1655–1672. [Google Scholar] [CrossRef]
  26. Wang, Q.; Tang, Y.; Tong, X.; Atkinson, P. Virtual image pair-based spatio-temporal fushion. Remote Sens. Environ. 2020, 249, 112009. [Google Scholar] [CrossRef]
  27. Okuyama, A.; Andou, A.; Date, K.; Hoasaka, K.; Mori, N.; Murata, H.; Tabata, T.; Takahashi, M.; Yoshino, R.; Bessho, K. Preliminary validation of Himawari-8/AHI navigation and calibration. Earth Obs. Syst. XX 2015, 9607, 96072. [Google Scholar] [CrossRef]
  28. Xu, Q.; Chen, X.; Yang, S.; Tang, L.; Dong, J. Spatiotemporal relationship between Himawari-8 hourly columnar aerosol optical depth (AOD) and ground-level PM2.5 mass concentration in mainland China. Sci. Total Environ. 2021, 765, 144241. [Google Scholar] [CrossRef]
  29. Fukuda, S.; Nakajima, T.; Takenaka, H.; Higurashi, A.; Kikuchi, N.; Nakajima, T.Y.; Ishida, H. New approaches to removing cloud shadows and evaluating the 380 nm surface reflectance for improved aerosol optical thickness retrievals from the GOSAT/TANSO-Cloud and Aerosol Imager. J. Geophys. Res. Atmos. 2013, 118, 13520–13531. [Google Scholar] [CrossRef]
  30. Yoshida, M.; Kikuchi, M.; Nagao, T.M.; Murakami, H.; Nomaki, T.; Higurashi, A. Common Retrieval of Aerosol Properties for Imaging Satellite Sensors. J. Meteorol. Soc. Jpn. 2018, 96B, 193–209. [Google Scholar] [CrossRef] [Green Version]
  31. Gao, L.; Chen, L.; Li, C.; Li, J.; Che, H.; Zhang, Y. Evaluation and possible uncertainty source analysis of JAXA Himawari-8 aerosol optical depth product over China. Atmos. Res. 2021, 248, 105248. [Google Scholar] [CrossRef]
  32. Eck, T.F.; Holben, B.N.; Reid, J.S.; Dubovik, O.; Smirnov, A.; O’Neill, N.T.; Slutsker, I.; Kinne, S. Wavelength dependence of the optical depth of biomass burning, urban, and desert dust aerosols. J. Geophys. Res. Atmos. 1999, 104, 31333–31349. [Google Scholar] [CrossRef]
  33. Giles, D.M.; Sinyuk, A.; Sorokin, M.G.; Schafer, J.S.; Smirnov, A.; Slutsker, I.; Eck, T.F.; Holben, B.N.; Lewis, J.R.; Campbell, J.R.; et al. Advancements in the Aerosol Robotic Network (AERONET) Version 3 database–automated near-real-time quality control algorithm with improved cloud screening for Sun photometer aerosol optical depth (AOD) measurements. Atmos. Meas. Tech. 2019, 12, 169–209. [Google Scholar] [CrossRef] [Green Version]
  34. O’Neill, N.T.; Eck, T.F.; Smirnov, A.; Holben, B.N.; Thulasiraman, S. Spectral discrimination of coarse and fine mode optical depth. J. Geophys. Res. Space Phys. 2003, 108, 4559–4573. [Google Scholar] [CrossRef]
  35. Levy, R.C.; Remer, L.A.; Mattoo, S.; Vermote, E.F.; Kaufman, Y.J. Second-generation operational algorithm: Retrieval of aerosol properties over land from inversion of Moderate Resolution Imaging Spectroradiometer spectral reflectance. J. Geophys. Res. Space Phys. 2007, 112. [Google Scholar] [CrossRef] [Green Version]
  36. Levy, R.C.; Munchak, L.A.; Mattoo, S.K.; Patadia, F.; Remer, L.A.; Holz, R.E. Towards a long-term global aerosol optical depth record: Applying a consistent aerosol retrieval algorithm to MODIS and VIIRS-observed reflectance. Atmos. Meas. Tech. 2015, 8, 4083–4110. [Google Scholar] [CrossRef] [Green Version]
  37. Kleidman, R.G.; O’Neill, N.T.; Remer, L.A.; Kaufman, Y.J.; Eck, T.F.; Tanré, D.; Dubovik, O.; Holben, B.N. Comparison of Moderate Resolution Imaging Spectroradiometer (MODIS) and Aerosol Robotic Network (AERONET) remote-sensing retrievals of aerosol fine mode fraction over ocean. J. Geophys. Res. Space Phys. 2005, 110. [Google Scholar] [CrossRef]
  38. Yan, X.; Li, Z.; Shi, W.; Luo, N.; Wu, T.; Zhao, W. An improved algorithm for retrieving the fine-mode fraction of aerosol optical thickness, part 1: Algorithm development. Remote Sens. Environ. 2017, 192, 87–97. [Google Scholar] [CrossRef] [Green Version]
  39. Chen, C.; Dubovik, O.; Fuertes, D.; Litvinov, P.; Lapyonok, T.; Lopatin, A.; Ducos, F.; Derimian, Y.; Herman, M.; Tanré, D.; et al. Validation of GRASP algorithm product from POLDER/PARASOL data and assessment of multi-angular polarimetry potential for aerosol monitoring. Earth Syst. Sci. Data 2020, 12, 3573–3620. [Google Scholar] [CrossRef]
  40. Yan, X.; Zang, Z.; Jiang, Y.; Shi, W.; Guo, Y.; Li, D.; Zhao, C.; Husi, L. A Spatial-Temporal Interpretable Deep Learning Model for improving interpretability and predictive accuracy of satellite-based PM2.5. Environ. Pollut. 2021, 273, 116459. [Google Scholar] [CrossRef]
  41. Holzworth, G.C. Estimates of Mean Maximum Mixing Depths in the Contiguous United States. J. Mon. Weather Rev. 1964, 92, 235. [Google Scholar] [CrossRef] [Green Version]
  42. Seibert, P.; Beyrich, F.; Gryning, S.-E.; Joffre, S.; Rasmussen, A.; Tercier, P. Chapter 20 Review and intercomparison of operational methods for the determination of the mixing height. Atmos. Environ. 2000, 34, 1001–1027. [Google Scholar] [CrossRef]
  43. Geurts, P.; Ernst, D.; Wehenkel, L. Extremely randomized trees. Mach. Learn. 2006, 63, 3–42. [Google Scholar] [CrossRef] [Green Version]
  44. Chu, Z.; Yu, J.; Hamdulla, A. Throughput prediction based on ExtraTree for stream processing tasks. Comput. Sci. Inf. Syst. 2021, 18, 1–22. [Google Scholar] [CrossRef]
  45. Carruba, V.; Aljbaae, S.; Domingos, R.C.; Lucchini, A.; Furlaneto, P. Machine learning classification of new asteroid families members. Mon. Not. R. Astron. Soc. 2020, 496, 540–549. [Google Scholar] [CrossRef]
  46. Ho, T.K. Random decision forests. In Proceedings of the 3rd International Conference on Document Analysis and Recognition, Montreal, QC, Canada, 14–16 August 1995; Volume 1, p. 278. [Google Scholar]
  47. Chen, T.; Guestrin, C. XGBoost: A Scalable Tree Boosting System. In Proceedings of the 22nd ACM Sigkdd International Conference on Knowledge Discovery and Data Mining, San Francisco, CA, USA, 13–17 August 2016; pp. 785–794. [Google Scholar]
  48. Pan, B. Application of XGBoost algorithm in hourly PM2.5 concentration prediction. IOP Conf. Ser. Earth Environ. Sci. 2018, 113, 012127. [Google Scholar] [CrossRef] [Green Version]
  49. Zhong, J.; Zhang, X.; Gui, K.; Wang, Y.; Che, H.; Shen, X.; Zhang, L.; Zhang, Y.; Sun, J.; Zhang, W. Robust prediction of hourly PM2.5 from meteorological data using LightGBM. Natl. Sci. Rev. 2021. [Google Scholar] [CrossRef]
  50. Yan, X.; Zang, Z.; Luo, N.; Jiang, Y.; Li, Z. New interpretable deep learning model to monitor real-time PM2.5 concentrations from satellite data. Environ. Int. 2020, 144, 106060. [Google Scholar] [CrossRef] [PubMed]
  51. Guo, C.; Berkhahn, F. Entity Embeddings of Categorical Variables. arXiv 2016, arXiv:1604.06737. [Google Scholar]
  52. Yan, X.; Liang, C.; Jiang, Y.; Luo, N.; Zang, Z.; Li, Z. A Deep Learning Approach to Improve the Retrieval of Temperature and Humidity Profiles from a Ground-Based Microwave Radiometer. IEEE Trans. Geosci. Remote Sens. 2020, 58, 8427–8437. [Google Scholar] [CrossRef]
  53. Nair, V.; Hinton, G.E. Rectified linear units improve restricted boltzmann machines. In Proceedings of the 27th International Conference on Machine Learning, Haifa, Israel, 21 June 2010; pp. 807–814. [Google Scholar]
  54. Ioffe, S.; Szegedy, C. Batch normalization: Accelerating deep network training by reducing internal covariate shift. In Proceedings of the 32nd International Conference on International Conference on Machine Learning, Lille, France, 6–11 July 2015; Volume 37, pp. 448–456. [Google Scholar]
  55. Srivastava, N.; Hinton, G.; Krizhevsky, A.; Sutskever, I.; Salakhutdinov, R. Dropout: A Simple Way to Prevent Neural Networks from Overfitting. J. Mach. Learn. Res. 2014, 15, 1929–1958. [Google Scholar]
  56. Beck, H.E.; Zimmermann, N.E.; McVicar, T.; Vergopolan, N.; Berg, A.; Wood, E.F. Present and future Köppen-Geiger climate classification maps at 1-km resolution. Sci. Data 2018, 5, 180214. [Google Scholar] [CrossRef] [PubMed] [Green Version]
  57. Wang, B.; Yuan, Q.; Yang, Q.; Zhu, L.; Li, T.; Zhang, L. Estimate hourly PM2.5 concentrations from Himawari-8 TOA reflectance directly using Geo-intelligent long short-term memory network. Environ. Pollut. 2020, 271, 116327. [Google Scholar] [CrossRef] [PubMed]
  58. Glorot, X.; Bengio, Y. Understanding the difficulty of training deep feedforward neural networks. J. Mach. Learn. Res. Proc. Track 2010, 9, 249–256. [Google Scholar]
  59. Zhang, Y.; Li, Z. Estimation of PM2.5 from fine-mode aerosol optical depth. J. Remote Sens. 2013, 17, 929–943. [Google Scholar]
  60. Tian, S.; Pan, Y.; Liu, Z.; Wen, T.; Wang, Y. Size-resolved aerosol chemical analysis of extreme haze pollution events during early 2013 in urban Beijing, China. J. Hazard. Mater. 2014, 279, 452–460. [Google Scholar] [CrossRef]
  61. Lang, H.; Qin, K.; Yuan, L.; Xiao, X.; Hu, M.; Rao, L.; Wang, L. Particles size distributions and aerosol optical properties during haze-fog episodes in the winter of Xuzhou. China Environ. Sci. 2016, 36, 2260–2269. [Google Scholar]
  62. Jiang, Q.; Wang, F.; Sun, Y.-L. Analysis of Chemical Composition, Source and Evolution of Submicron Particles in Xianghe, Hebei Province. China Environ. Sci. 2018, 39, 3022–3032. [Google Scholar]
  63. Butler, T.; Lawrence, M.; Gurjar, B.R.; van Aardenne, J.; Schultz, M.; Lelieveld, J. The representation of emissions from megacities in global emission inventories. Atmos. Environ. 2008, 42, 703–719. [Google Scholar] [CrossRef]
  64. De Meij, A.; Pozzer, A.; Lelieveld, J. Global and regional trends in aerosol optical depth based on remote sensing products and pollutant emission estimates between 2000 and 2009. Atmos. Chem. Phys. Discuss. 2010, 10, 30731–30776. [Google Scholar]
  65. Kaskaoutis, D.G.; Kharol, S.K.; Sinha, P.R.; Singh, R.P.; Badarinath, K.V.S.; Mehdi, W.; Sharma, M. Contrasting aerosol trends over South Asia during the last decade based on MODIS observations. Atmos. Meas. Tech. Discuss. 2011, 4, 5275–5323. [Google Scholar]
  66. Reisen, F.; Meyer, C.P.; Keywood, M. Impact of biomass burning sources on seasonal aerosol air quality. Atmos. Environ. 2013, 67, 437–447. [Google Scholar] [CrossRef]
  67. Sawyer, V.; Levy, R.C.; Mattoo, S.; Cureton, G.; Shi, Y.; Remer, L.A. Continuing the MODIS Dark Target Aerosol Time Series with VIIRS. Remote Sens. 2020, 12, 308. [Google Scholar] [CrossRef] [Green Version]
  68. Choi, Y.-S.; Park, R.J.; Ho, C.-H. Estimates of ground-level aerosol mass concentrations using a chemical transport model with Moderate Resolution Imaging Spectroradiometer (MODIS) aerosol observations over East Asia. J. Geophys. Res. Atmos. 2009, 114. [Google Scholar] [CrossRef] [Green Version]
  69. Di Nicolantonio, W.; Cacciari, A.; Bolzacchini, E. MODIS Aerosol Optical Properties Over North Italy for Estimating Surface-level PM2.5. In Proceedings of the Envisat Symposium, Montreux, Switzerland, 23–27 April 2007; pp. 3–27. [Google Scholar]
  70. Yang, Q.; Yuan, Q.; Yue, L.; Li, T.; Shen, H.; Zhang, L. The relationships between PM2.5 and aerosol optical depth (AOD) in mainland China: About and behind the spatio-temporal variations. Environ. Pollut. 2019, 248, 526–535. [Google Scholar] [CrossRef] [PubMed]
  71. Zheng, C.; Zhao, C.; Zhu, Y.; Wang, Y.; Shi, X.; Wu, X.; Chen, T.; Wu, F.; Qiu, Y. Analysis of influential factors for the relationship between PM2.5 and AOD in Beijing. Atmos. Chem. Phys. Discuss. 2017, 17, 13473–13489. [Google Scholar] [CrossRef] [Green Version]
  72. She, Q.; Choi, M.; Belle, J.H.; Xiao, Q.; Bi, J.; Huang, K.; Meng, X.; Geng, G.; Kim, J.; He, K.; et al. Satellite-based estimation of hourly PM2.5 levels during heavy winter pollution episodes in the Yangtze River Delta, China. Chemosphere 2020, 239, 124678. [Google Scholar] [CrossRef]
  73. Chen, X.; de Leeuw, G.; Arola, A.; Liu, S.; Liu, Y.; Li, Z.; Zhang, K. Joint retrieval of the aerosol fine mode fraction and optical depth using MODIS spectral reflectance over northern and eastern China: Artificial neural network method. Remote Sens. Environ. 2020, 249, 112006. [Google Scholar] [CrossRef]
  74. Yan, X.; Zang, Z.; Liang, C.; Luo, N.; Ren, R.; Cribb, M.; Li, Z. New global aerosol fine-mode fraction data over land derived from MODIS satellite retrievals. Environ. Pollut. 2021, 276, 116707. [Google Scholar] [CrossRef]
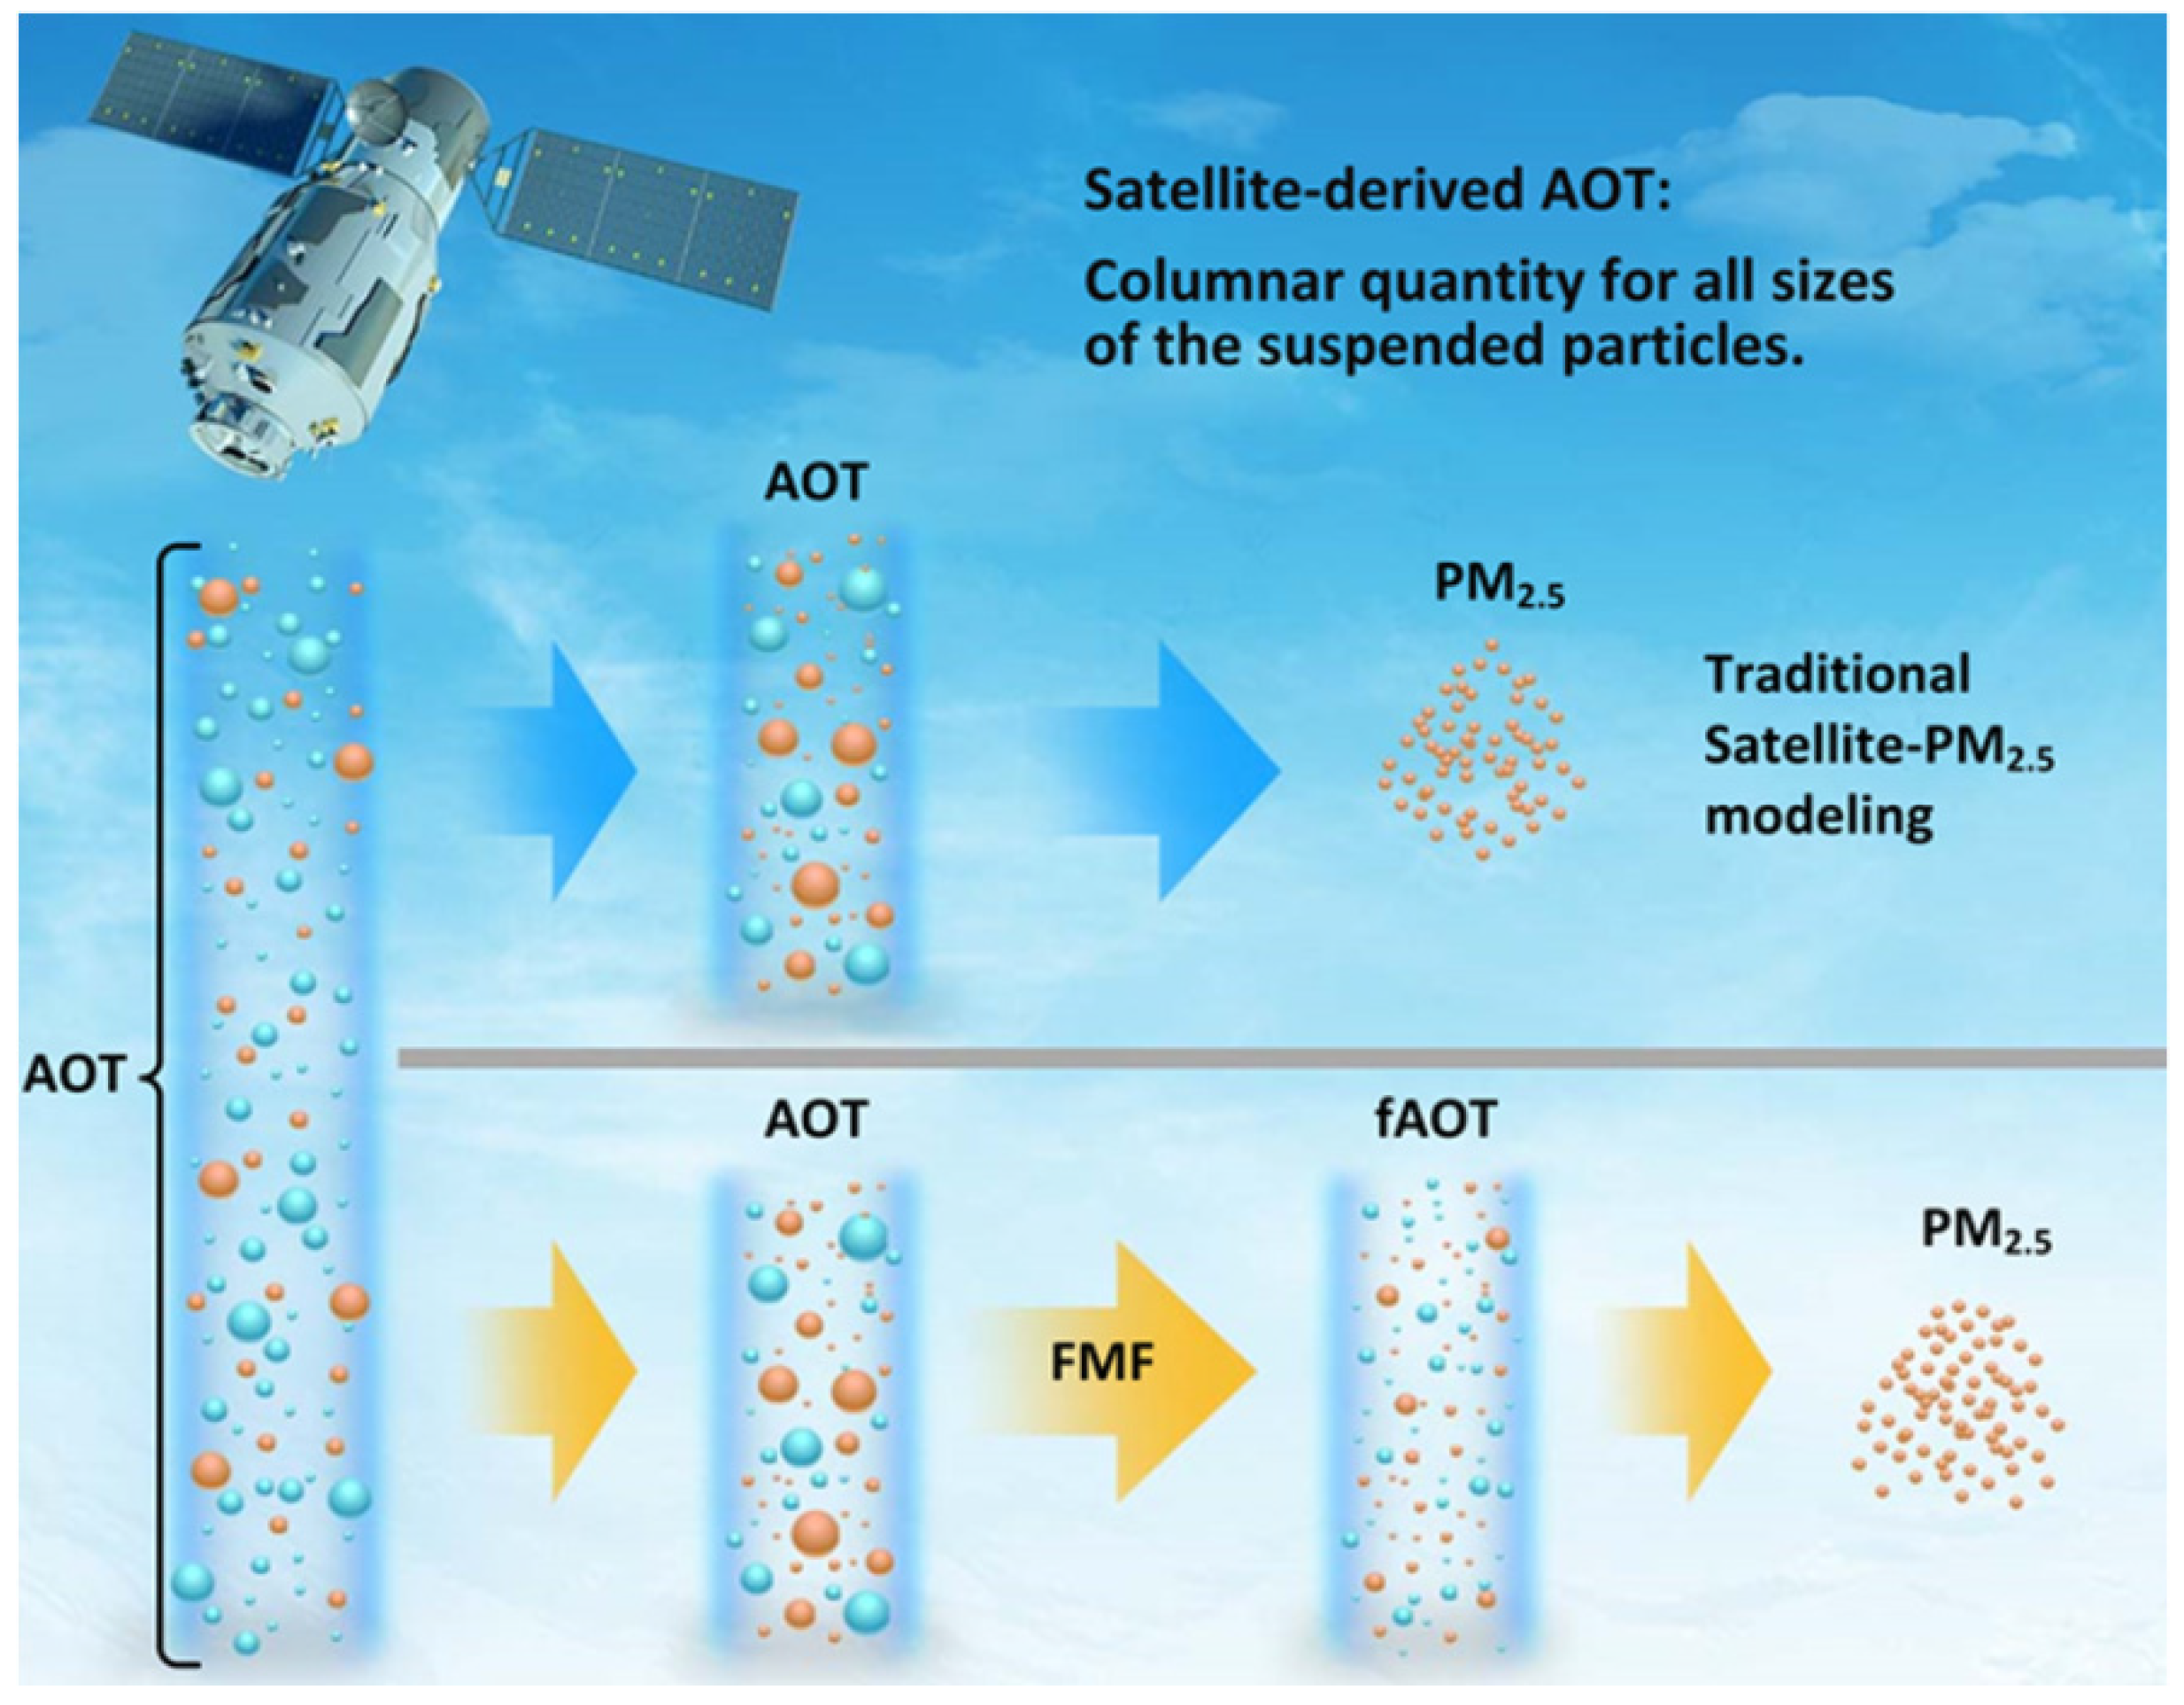
Figure 1. Schematic diagram showing traditional AOT-based and new fAOT-based PM2.5 modeling based on satellite data.
Remotesensing 13 02779 g001
Figure 2. Schematic diagrams of the four traditional machine learning models (Extratree, Random Forest, XGBoost, and LightGBM) and the deep learning model (EntityDenseNet) used in this study.
Remotesensing 13 02779 g002
Figure 3. Flowchart of the entire training process for both EntityDenseNet and the four traditional machine learning models. The distributions of meteorological data were interpolated by the Kringing method using averaged values in 2020 over meteorology stations (for temperature, relative humidity (RH), and wind speed) and radiosonde stations (for the boundary layer height (PBLH)) in China.
Remotesensing 13 02779 g003
Figure 4. (af) The linear correlation of fAOT with PM2.5 over five stations (Beijing, Baotou, Taihu, Xianghe, Xuzhou) each and total in China during 2015–2019. The red lines represent fitting lines and the “**” after each R value represents the correlation significance > 95%, (g): the location of the 5 stations. (hl): the GAM plots of fAOT and PM2.5 in five AERONET stations over China. The light brown shaded color represents the 95% confidence interval of fitting, and the y-axis represents the smooth fitted values with the degrees of freedom of fitting shows in the parentheses. The p-value attached with “***” means the significant GAM fitting at 99% significance level.
Remotesensing 13 02779 g004
Figure 5. Density scatter plots of the Himawari-8 AE (a,b), Himawari AE after quality control (AE QA) (c,d), and Himawari FMF (e,f) with their ground-based AEROENT values for both V3.0 and V2.1 data. The black and red lines represent 1:1 and fitting lines, respectively.
Remotesensing 13 02779 g005
Figure 6. Spatial distribution of the averaged Himwari-8 L2 V2.1 AE (a)/FMF (d), the averaged Himwari-8 L2 V3.0 AE (b)/FMF (e), difference of the averaged V3.0 and V2.1 AE (c)/FMF (f) (V3.0 minus V2.1) in 2020.
Remotesensing 13 02779 g006
Figure 7. Density scatter plots of modeling results of ground-based PM2.5 retrieved by five models: Extratree (a,f,k,p), Random Forest (b,g,l,q), LightGBM (c,h,m,r), XGBoost (d,i,n,s) and EntityDenseNet (e,j,o,t), based on four different input data (V2.1 and V3.0 data and AOT and AOT&FMF data). The black and red lines represent 1:1 and fitting lines, respectively.
Remotesensing 13 02779 g007
Figure 8. PM2.5 estimation on 12 February 2020 (haze day) and on 3 June 2020 (dust day). (a,g) AOT&FMF-PM2.5 in China; (b,h) AOT-PM2.5 in China; (c,i) true color image on haze/dust day where the black line is the boundary of China; (d,j) AOT&FMF-PM2.5 in Beijing-Tianjin-Hebei (BTH) region; (e,k) AOT-PM2.5 in BTH region; (f,l) differences in PM2.5 between AOT&FMF-PM2.5 and AOT-PM2.5 in BTH regions.
Remotesensing 13 02779 g008
Figure 9. Density plot of EntityDenseNet retrieved PM2.5 with ground-based PM2.5 on dust (a,b) and haze (c,d) days in 2020 based on different Himwari-8 V3.0 input data (AOT only/AOT&FMF data). The black and red lines are 1:1 and fitting lines, respectively.
Remotesensing 13 02779 g009
Figure 10. (a) linear correlation between Himawari-8 fAOT and PM2.5 on dust day (3 June 2020); (b) linear correlation between Himawari-8 AOT and PM2.5 on dust day (3 June 2020); (c) linear correlation between Himawari-8 fAOT and PM2.5 on haze day (12 February 2020); (d) linear correlation between Himawari-8 AOT and PM2.5 on haze day (12 February 2020).
Remotesensing 13 02779 g010
Figure 11. (a) Linear correlation between AERONET AOT (blue) and fAOT (orange) and PM2.5 on dust days during 2015–2019; (b) linear correlation between AERONET AOT (blue) and fAOT (orange) and PM2.5 on haze days during 2015–2019; (c) the number of haze and dust days occurring every year during 2015–2019.
Remotesensing 13 02779 g011
Publisher’s Note: MDPI stays neutral with regard to jurisdictional claims in published maps and institutional affiliations.