Article

Cold Wave-Induced Reductions in NDII and ChlRE for North-Western Pacific Mangroves Varies with Latitude and Climate History

1
Department of Life Science, National Taiwan Normal University, No. 88, Section 4, TingChow Road, Taipei 11677, Taiwan
2
Department of Biological Sciences, Florida International University, Miami, FL 33199, USA
*
Author to whom correspondence should be addressed.
Remote Sens. 2021, 13(14), 2732; https://doi.org/10.3390/rs13142732
Submission received: 29 May 2021 / Revised: 17 June 2021 / Accepted: 9 July 2021 / Published: 12 July 2021

Abstract

:
Mangrove forests growing at the poleward edges of their geographic distribution are occasionally subject to freezing (<0 °C) and cold wave (>0 °C) events. Cold wave effects on mangrove trees are well documented and adaptation to cold stress has been reported for local mangrove populations in the North Atlantic. However, there is less understanding of effects of cold waves on mangroves in the northern Pacific, especially at the regional scale. Moreover, it is unclear if cold tolerant mangrove species of North Asia display variation in resistance to cold temperatures across their geographic distribution. Using a cold wave event that occurred in January 2021, we evaluated the effects of low temperatures on vegetation index (VI) change (relative to a recent five-year baseline) for mangrove forests dominated by Kandelia obovata (Rhizophoraceae) and Avicennia marina (Acanthaceaee) at the northern edge of their geographical range. We used two VIs derived from Sentinel-2 imagery as indicators for canopy health: the normalized difference infrared index (NDII) and the chlorophyll red-edge index (ChlRE), which reflect forest canopy water content and chlorophyll concentration, respectively. We isolated the cold wave effects on the forest canopy from phenology (i.e., cold wave induced deviation from a five-year baseline) and used multiple linear regression to identify significant climatic predictors for the response of mangrove forest canopy VI change to low temperatures. For areas where the cold wave resulted in temperatures <10 °C, immediate decreases in both VIs were observed, and the VI difference relative to the baseline was generally greater at 30-days after the cold wave than when temperatures initially recovered to baseline values, showing a slight delay in VI response to cold wave-induced canopy damage. Furthermore, the two VIs did not respond consistently suggesting that cold-temperature induced changes in mangrove canopy chlorophyll and water content are affected independently or subject to differing physiological controls. Our results confirm that local baseline (i.e., recent past) climate predicts canopy resistance to cold wave damage across K. obovata stands in the northern Pacific, and in congruence with findings from New World mangroves, they imply geographic variation in mangrove leaf physiological resistance to cold for Northern Pacific mangroves.

Graphical Abstract

1. Introduction

Mangrove forests are wetlands distributed in tropical to equatorial regions but with poleward limits in the subtropics, with few occurrences at temperate latitudes (e.g., New Zealand and Japan) [1]. The poleward limits of mangrove distributions, globally, are the product of species-specific niche development and environmental filtering due to site availability, dispersal limitation, hydromorphology, salinity, and climate (i.e., rainfall temperature) [2].
Temperature extremes stress mangrove trees (see review by Krauss et al. [3]), with minimum temperature having the greatest effect on mangrove diversity at higher latitudes [4,5]. Subzero temperatures can cause leaf scorch, leaf senescence and increased litterfall, bud injury, xylem embolism, and tree mortality [6,7,8]. Low, but non-freezing temperatures (i.e., chilling) lead to physiological stress, which often manifests as reductions in leaf chlorophyll concentration, photosynthetic rate, stomatal conductance, and stem sap flow, which sometimes results in sapling mortality for cold-sensitive species [9,10,11,12,13,14,15]. In addition, low temperatures have been shown to regulate mangrove forest expansion and local mangrove-saltmarsh competition dynamics [7,16,17,18]. Consequently, the frequency of cold events is an important factor controlling the northbound extension of mangroves in the North Atlantic and East Asia [19,20,21].
Different mangrove tree species have different cold-temperature tolerances. In general, species naturally distributed at low latitudes are particularly sensitive to low temperatures. For instance, Sonneratia caseolaris and S. apetala (Lythraceae)—two tropical mangrove species [22]—were more sensitive to low temperatures than established, native mangrove species in their newly introduced northern range in subtropical China [11,13]. Avicennia marina (Acanthaceae), Aegiceras corniculatum (Primulaceae), and Kandelia obovata (Rhizophoraceae) have been described as cold-resistant species [11,23], however, at their northern geographical limit in East Asia, K. obovata and A. corniculatum have been shown to be more tolerant than A. marina to air temperatures between 5 °C and 15 °C [10,14]. Additionally, within species there can be considerable variation in cold-tolerance, which likely relates to climatic conditions along the latitudinal extent of species geographical ranges. For example, it has been shown that the northernmost populations of Floridian mangroves are more adapted to cold temperatures than more-southerly Caribbean populations [24]. Increased resistance of mangrove populations to temperature stress at their range limits could be the product of physical changes in leaf morphology (e.g., thicker and smaller leaves) [9,24,25] or physiological adaptions (i.e., leaf biochemical acclimation) that increase photosynthetic activity and reduce oxidative damage [12]. The observations of disparity in cold tolerances among populations across geographical range limits suggest that not only the mean temperature, but also the frequency and duration of cold events are drivers of the variation in low-temperature stress response among mangrove stands.
Numerous studies of the effects of cold events on mangroves are based on field observations [6,11,24], however, satellite imagery and remote sensing techniques have also been used to examine mangrove phenology and forest dynamics, as well as to observe and model their responses to disturbances from local to regional scales [19,26,27,28,29,30,31]. Remote sensing approaches allow for standardized temporal analyses over large areas, which makes them ideal to monitor mangrove environments [32,33,34,35] that are otherwise difficult to study through field-based surveys [36]. On the other hand, mangrove remote sensing is limited by the frequent cloud cover in coastal tropical and subtropical regions [37], and by the relationships between image-derived indices (e.g., vegetation indices) and forest structural or canopy characteristics. Nevertheless, ground-based studies have validated that remotely sensed-derived indices, such as the normalized difference infrared index, reflect real changes in mangrove forest canopy properties following cold and wind disturbances, including both canopy damage and recovery dynamics [38,39]. However, most of the assessments of mangrove response to low temperatures using remote sensing techniques are conducted for the North Atlantic [19,39,40] in comparison with the North-West Pacific [41], even though northeastern Asian mangroves (of distinct species composition) are also subject to relatively frequent cold waves (e.g., winters of 2008, 2011, and 2016) and have roughly the same northerly latitudes as North Atlantic mangroves. As a result, our understanding of how cold temperatures shape the northern geographical limits of Asian mangroves is more limited, and particularly with respect to mangrove species inter-populational variability in cold tolerance (but see [42] based on ground observations).
Finally, there is a need for standardized comparisons of cold temperature effects across forest stands dominated by the same species to identify how climate interacts with interspecific variation in cold-tolerance to shape mangrove range limits. Therefore, remotely sensed data can help fill a key knowledge gap because they are standardized and global in their geographic extent. Here, we use Sentinel-2-derived vegetation indices (VIs) to examine the short-term effects of an unusual cold wave in January 2021 (i.e., <3 standard deviations from the mean temperature) on mangrove canopies of multiple estuarine and riverine stands growing at their northern limits in East Asia. The mangrove areas we analyze are environmentally protected and are not subject to hypersalinity or water deficit stress. Moreover, no typhoons occurred during the 2021 typhoon season, so low temperatures were likely the main stressor for mangrove forest canopies during this time. Comparing winter 2021 to a previous five-year baseline, we ask the following questions: (1) Do unusually cold temperatures lead to significant decreases in VIs relative to baselines? (2) Is the absolute decrease in temperature during a cold wave predictive of VI change? (3) Is mangrove canopy VI resistance to cold waves related to past cold wave frequency? We expected that cold waves would decrease VI values due to leaf senescence and fall, as well as changes in the physiological properties of leaves (i.e., freezing in the palisade layer, or degradation of leaf chlorophyll). Second, we expected that VI decrease would be strongly related to cold wave minimum temperature. Finally, we hypothesized that mangrove stands which experience more frequent or severe cold waves might be more resistance to them, as evidenced by a smaller decrease in VI to a single cold wave event of similar magnitude relative to mangrove stands which experience infrequent cold waves.

2. Materials and Methods

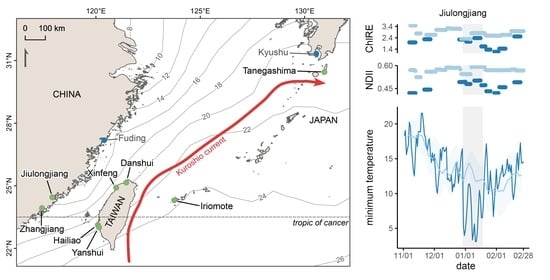
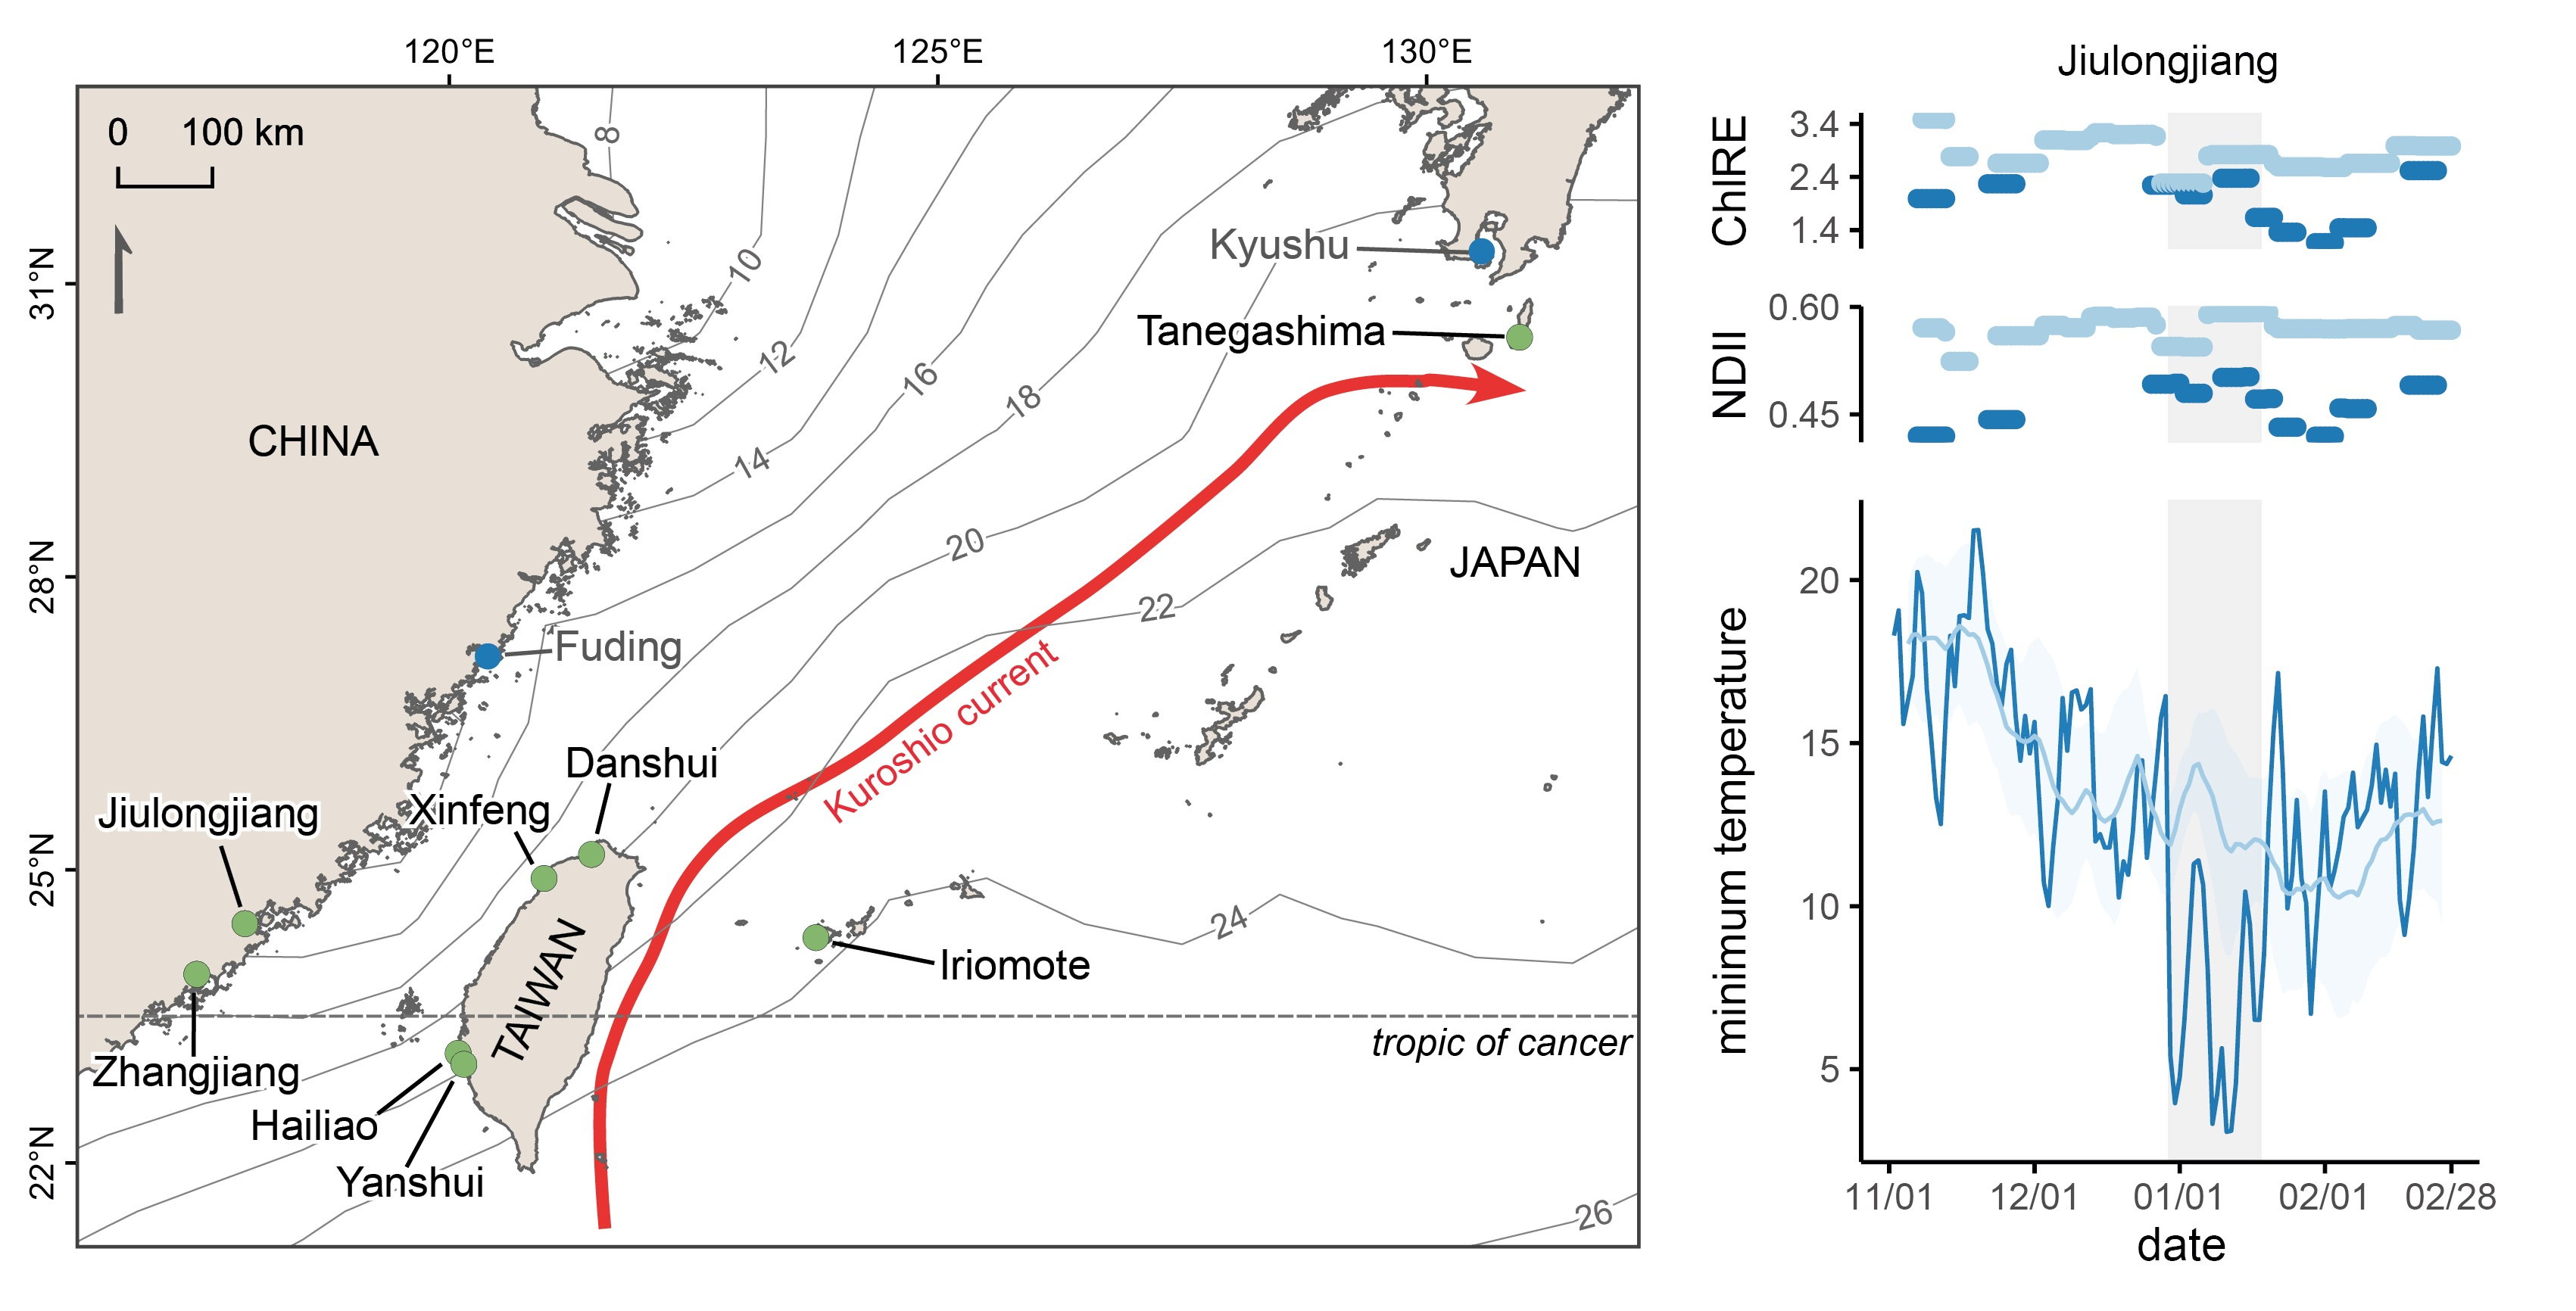
2.1. Sites Selection and Description

We selected eight sites along the northern geographic range limits of western Pacific mangroves (Figure 1). Our selection was based on the following criteria: natural and protected forests (e.g., within reserves and not planted), in a riverine-estuarine settings (i.e., moderate salinity), and with >1 ha area so that they could be identified in the USGS Global Distribution of Mangroves dataset 1.3 (GDM) [43].
The latitudinal distribution of the sites ranged between the 23°55′N and 30°27′N. The northernmost site was located in Tanegashima Island (15 ha), Japan (18.8 °C mean annual temperature for 2010–2020, Japan Meteorological Agency), which are the northernmost natural mangroves in the western Pacific, excepting a few small stands (≤0.2 ha) found on the southern coast of Kyushu island, Japan. These mangrove stands set the limit for the northern boundary for the geographical distribution of natural East Asian mangroves (Figure 1) [44]. Two sites were selected from the northernmost mangroves in Taiwan, from the estuaries of the Danshui (40 ha) and Xinfeng (14 ha) rivers (22.7 °C mean annual temperature, Taiwan Weather Bureau). The fourth site, a mangrove stand bordering the Kuira and Hidori rivers of Iriomote Island (51 ha), Japan is at comparable latitude but under a warmer climate due to its location within the Kuroshio Current (24.2 °C mean annual temperature, Figure 1). Additionally, two mangrove stands were selected from southern Taiwan in the Hailiao (3 ha) and Yanshui (7 ha) estuaries in the Taijiang National Park, and like the stand on Iriomote Island, they represented mangroves growing under warmer climate (24.5 °C mean annual temperature). Finally, we selected two stands outside the influence of the Kuroshio Current [23] in the Jiulongjiang (22 ha) and Zhangjiang (31 ha) estuaries with mean annual temperatures of 20.9 °C and 21.2 °C, respectively [45,46]. Although the northernmost natural Chinese mangroves are located in Fuding (Figure 1) [23], the mangroves of Fuding were not included because of their limited size and their association within a large aquaculture setting, which is subject to direct anthropogenic influence. Moreover, we did not include mangroves from Central Taiwan given that most of them have been restored (i.e., are not of natural origin according to Hsueh et al. [47]) and are not present in the GDM dataset.
The mangrove forests of the northwestern Pacific have a low tree species diversity. The six northernmost selected stands are dominated by K. obovata, a species described by Sheue et al. [50] and which correspond to the populations that were previously described as K. candel (Table 1). Although K. obovata forms monospecific stands in Tanegashima and Danshui, the other mangroves contain one (Xinfeng) to two (Jiulongjiang, Zhangjiang, and Iriomote) other true mangrove tree species [44,46,51]. On the other hand, the two mangroves from southern Taiwan (Hailiao and Yanshui) are dominated by A. marina in association with smaller populations of Laguncularia racemosa and Rhizophora stylosa (Rhizophoraceae) [47]. In addition, the stands were characterized by low canopy height according to ground-based measurements: the lowest mean tree height was reported in Tanegashima and Hailiao at around 2 to 3 m [44,52], whereas to highest mean height (6–7 m) was measured in Iriomote and Jiulongjiang [44,53]. Zhangjiang, Danshui, and Xinfeng mangroves had a mean height ranging between 3.5 and 5 m [46,54,55].
In addition to cold events, the mangroves of northeastern Asia are occasionally disturbed by typhoons. Since 2016, a total of three high intensity typhoons (≥178 m s−1 sustained wind speed) [56] and five low intensity typhoons (119 m s−1 ≤ wind speed ≤ 177 m s−1) have passed within 100 km of the eight sites.

2.2. Data

2.2.1. Mangrove Stand Identification and Satellite Imagery

The eight mangrove forests were identified and delimited using the GDM dataset which is based on field surveys and Landsat imagery. The accuracy of this dataset for the studied sites was confirmed using high resolution Google Earth imagery and visual interpretation. Given the dynamism of mangrove environments, anthropogenic pressures, and mangrove wetlands restoration efforts in China and Taiwan [47,53], we used the Global Mangrove Watch dataset (GMW) [57] to restrict our analysis to land surfaces that were identified as mangroves between 1996 and 2016. Although the mangroves of Tanegashima island are not identified in the GMW dataset, we included this site in our analysis as it was described as a mangrove forest stand in 1973 [44]. Similarly, we added the Yanshui mangroves because they are within the Taijian National Park, which has been designated as a wildlife sanctuary since 1992 [47].
Sentinel-2 imagery was used to derive the VIs used in this study. Its sensors provide imagery of spatial resolutions ranging from 10-m for blue, green, red, and near-infrared (NIR) wavelengths, to 20-m for red edge (RE) and short-wave infrared (SWIR) bands, and 60-m for the coastal aerosol band. Being based on the twin satellites Sentinel-2A and Sentinel-2B, which were set into orbit in 2015 and 2017, respectively, Sentinel-2 imagery has a temporal resolution of 5 days, and hence, is suitable to assess the relationships between vegetation and temperature. In addition, imagery with a fine temporal resolution is ideal to study mangroves given that they are located in regions often obstructed by clouds.
We used the ‘sen2r’ package in R [58] to download all non-cloudy scenes captured between 1 November and 10 March for the 2020–2021 winter and complete annual time-series for the five previous winters that were used as the baseline. The sensing dates of all scenes are shown in Table S1 (Supplementary data).

2.2.2. Climate Characteristics

We used the daily mean and minimum temperature (°C) to characterize the cold wave event of 2021 and the general winter climate for the past five years (2015–2020). In addition, we used total rainfall (mm), mean wind speed (m s−1), and maximum sustained wind speed (m s−1) to assess whether abnormal rainfall or strong winds occurred during the 2020–2021 winter. Data for five winters between 2015 and 2020, as well as for winter 2020–2021 (i.e., the cold wave event), were obtained from weather stations operated by the Taiwan Central Weather Bureau (https://www.cwb.gov.tw/V8/C/), the Japan Meteorological Agency (http://www.jma.go.jp/jma/index.html) for the sites in Taiwan and Japan, and from the global land assimilation system dataset 2.1 (GLDAS, https://ldas.gsfc.nasa.gov/gldas/) for the two sites in China. The GLDAS uses ground- and satellite-data to produce 3-h estimates of surface meteorological conditions at 0.25° spatial resolution. Comparisons with ground-data have shown that they accurately represent air surface temperatures [59]. Data from meteorological stations were used for the sites in Japan and Taiwan given the unavailability of GLDAS data for small islands and some parts of the Taiwanese coastline. Locations of each of the meteorological stations are listed in Table 1.

2.3. Processing

2.3.1. Image Correction

All scenes were atmospherically corrected, either by the European Space Agency (ESA; i.e., for scenes after 2020) or using the sen2cor algorithm (‘sen2r’ R package) [58] to produce bottom-of-atmosphere images from the top-of-atmosphere data. Clouds and cloud shadows were removed from all scenes. However, no topographical correction was applied given the relatively flat topography of mangrove environments.

2.3.2. Vegetation Indices

Mangrove canopy dynamics were assessed using two VIs, the normalized difference infrared index (NDII) and the chlorophyll-red edge index (ChlRE). The NDII [60] is based on the NIR band (band 8) and SWIR band (band 11; Equation (1)). NDII is a one index that is representative of canopy leaf water and chlorophyll content [61,62]. NDII values range between −1 and 1, with higher values indicating healthy vegetation cover. NDII has been used to monitor mangrove disturbances including cold events, and comparisons with other frequently used VIs have shown that NDII is sensitive to canopy responses to disturbances, including change in leaf physiology [39,63,64].
NDII = NIR SWIR NIR + SWIR
We took advantage of the availability of RE bands in Sentinel-2 imagery to use a VI that cannot be computed with multispectral sensors such as Landsat. We used the ChlRE [65] to monitor the variation in canopy leaf chlorophyll content associated with cold stress [10,14]. The ChlRE is based on the first RE band of Sentinel-2 (RE1, band 5) and NIR (RE3, band 7, Equation (2)). Band 5 of Sentinel-2 imagery is centered on the 705 nm wavelength, which corresponds to the RE position of K. candel leaves with low chlorophyll concentrations in southern China [66]. Therefore, ChlRE decreases when the quantity of canopy leaf chlorophyll decreases and the RE position shifts from longer wavelengths toward 705 nm. In addition, Sun et al. [67] compared the three RE bands of Sentinel-2 for crops, and they found that the band 5 was the most sensitive and band 7 the least sensitive to crop chlorophyll content; moreover, the authors showed that ChlRE had a strong relationship with crop canopy leaf area index. It is worth noting that band 7 (a 783 nm central wavelength band) of Sentinel-2 is described as a RE band by the ESA (RE3), but it is used to match the NIR band described as reflectance at ≥760 nm wavelengths in the ChlRE formula of Gitelson et al. [65].
ChlRE = NIR RE 1
Given that our VIs were based on RE and SWIR bands of 20-m spatial resolution, all images were set to a spatial resolution of 20 m using bilinear interpolation. We reprojected plot shapefiles to match Sentinel-2 scene projections before extracting data from all scenes with the ‘raster’ package in R [68]. Values of common pixels across all dates (i.e., never covered by clouds or cloud shadows) were used for subsequent analyses.

2.4. Analysis

2.4.1. Identification of Cold Wave Events

We produced moving 7-day average baselines of mean and minimum daily temperatures from November to February 2015–2020. Given that cold wave events are relative to the baseline climate of a site, we used 3 standard deviations (SD) from site baselines of mean temperature to define the threshold of cold wave occurrence (see [17,69]).

2.4.2. Baseline of Vegetation Indices and Change Detection

Although abnormally cold temperatures are known to induce decreases in photosynthetic rates even in cold tolerant species [70], regular winter temperatures are also often accompanied by a reduction in photosynthesis at the northern geographical limits of East Asian mangroves, because of phenological leaf turnover [71,72]. Hence, we used the images taken during the five previous winters (2015–2016 to 2019–2020) to compute a baseline of the two VIs in order to distinguish phenological leaf turnover from the effect of low temperatures on VI values. The five-year winter baseline was computed using a 15-day moving maximum, which obtained the highest VI values for each date (avoiding atmospheric interference) and spread variation in single-day observations across a 15-day period. Moreover, using a 15-day moving maximum as the baseline permitted us to avoid dates without data, which helped to match the baseline to corresponding imagery from before and after the 2021 cold wave event. The 15-moving maximum also limited inter-annual variability by using maximum values over the given 15-day period for multiple scenes. On the other hand, 2020–2021 winter VI data were processed using a 7-day moving maximum. We used a smaller window for the cold wave because the temperature drop occurred over the course of a few days, while still being a large enough temporal deviation to include two Sentinel-2 scenes (which have a 5-day temporal resolution).
For each of the eight mangroves, we identified the Sentinel-2 sensing scenes with dates closest to the beginning and the end of the cold wave as t1 and t2, respectively. The VI difference between t1 and t2, Δ VI t 1 t 2 - 2021 , is defined as the absolute VI variation during that time (Equation (3)), and a greater positive ΔVI indicates a greater reduction in the VI due to the cold wave. We removed the effect of phenology occurring normally during winter ( Δ VI t 1 t 2 - baseline , Equation (4)), to calculate the net VI variation ( Δ VI t 1 t 2 - net , Equation (5)) which could be attributed to the effect of normal seasonal cooling and not to the cold wave event. Therefore, a greater positive Δ VI t 1 t 2 - net   indicates that the VI decrease associated with the 2021 cold waves is greater than that of the comparable period during the winters of 2015–2020 and therefore can be directly attributed to the 2021 cold wave.
Δ VI t 1 t 2 - 2021 = VI t 1 - 2021 VI t 2 - 2021
Δ VI t 1 t 2 - baseline = VI t 1 - baseline VI t 2 - baseline
Δ VI t 1 t 2 - net = Δ VI t 1 t 2 - 2021 Δ VI t 1 t 2 - baseline
Moreover, we defined t3 as approximately 30 days after the end of the 2021 cold wave in order to account for any delayed damage that may appear within weeks after cold disturbance (e.g., delayed leaf senescence and fall) [6,8]. Replacing t2 by t3 in Equations (3)–(5), we calculated Δ VI t 1 t 3 - 2021 , Δ VI t 1 t 3 - baseline , and Δ VI t 1 t 3 - net .

2.4.3. Change Detection and Difference with Baseline

We used bootstrapped comparisons of means (with 5000 iterations) to test whether pre-cold wave VI values were identical to those of the baseline at the same time as VI t 1 - 2021 VI t 1 - baseline . Then, we analyzed the change direction and magnitude of VIs following the cold wave by comparing Δ VI t 1 t 2 - 2021 and Δ VI t 1 t 2 - baseline , as well as Δ VI t 1 t 3 - 2021 and Δ VI t 1 t 3 - baseline using bootstrapped comparisons in order to see whether the 2021 cold event led to a greater change in VIs than due to phenological variation of a normal seasonal winter. Furthermore, we compared the net change in VI measured right after the end of the 2021 cold wave to the net change after 30 days, as Δ VI t 1 t 3 - net Δ VI t 1 t 2 - net , through bootstrapped comparisons. Relationships between the two VIs at t1 ( VI t 1 ), as well as between their net change at t3 ( Δ VI t 1 t 3 - net ) were explored using correlation analysis with Spearman’s ρ.

2.4.4. Differences between Sites and Relationships with Site Characteristics

Because most sites showed delayed damages, differences in Δ VI t 1 t 3 - net among the eight sites were analyzed following the procedure of Herberich et al. [73] using the ‘sandwich’ and ‘multcomp’ R packages [74,75]. This method is based on simultaneous inference [74], and allows for Tukey’s pairwise comparisons of means between groups of different sample sizes, without the assumption of a normal distribution and homoscedasticity. Additionally, the method controls for the familywise error rate using Dunnett’s adjusted p-value, and 95% confidence intervals are produced for each pairwise comparison of means.
Finally, we investigated whether canopy damage was related to site climate using multiple linear (ordinary least squares) regressions. We used backward stepwise model selection based on the Akaike information criterion (AIC) to produce the most parsimonious models for the Δ VI t 1 t 3 - net response across sites with predictors related to the site climatic history and dominant species. The first predictor considered was the mean minimum temperature for the 2015–2020 baseline for the day of the year where we observed the lowest temperature in 2021 ( T min 2021 ). We did not include T min 2021 in the model selection because it is strongly correlated to the baseline mean minimum temperature (ρ = 0.85, p = 0.01). Our second predictor considered was the number of days during the winter seasons of 2015–2020 where the minimum temperature was less than or equal to three standard deviations from the baseline mean temperature (i.e., was delineated as cold wave event as described in Section 2.4.1). The third predictor considered was the temperature anomaly, Δ T min , defined as the difference between the average mean temperature on the baseline and T min 2021 on the same date (Equation (6)). Finally, we used the dominant species (i.e., K. obovata or A. marina) as the fourth predictor. To control for the multicollinearity among predictors, we computed the variance inflation factors (VIF) before model selection and removed predictors with VIF > 2.5 one by one until all remaining predictors VIFs ≤ 2.5. We did not include Iriomote in the linear regression models because its T min remained above 10 °C.
Δ T min   =     T mean   baseline T min 2021

3. Results

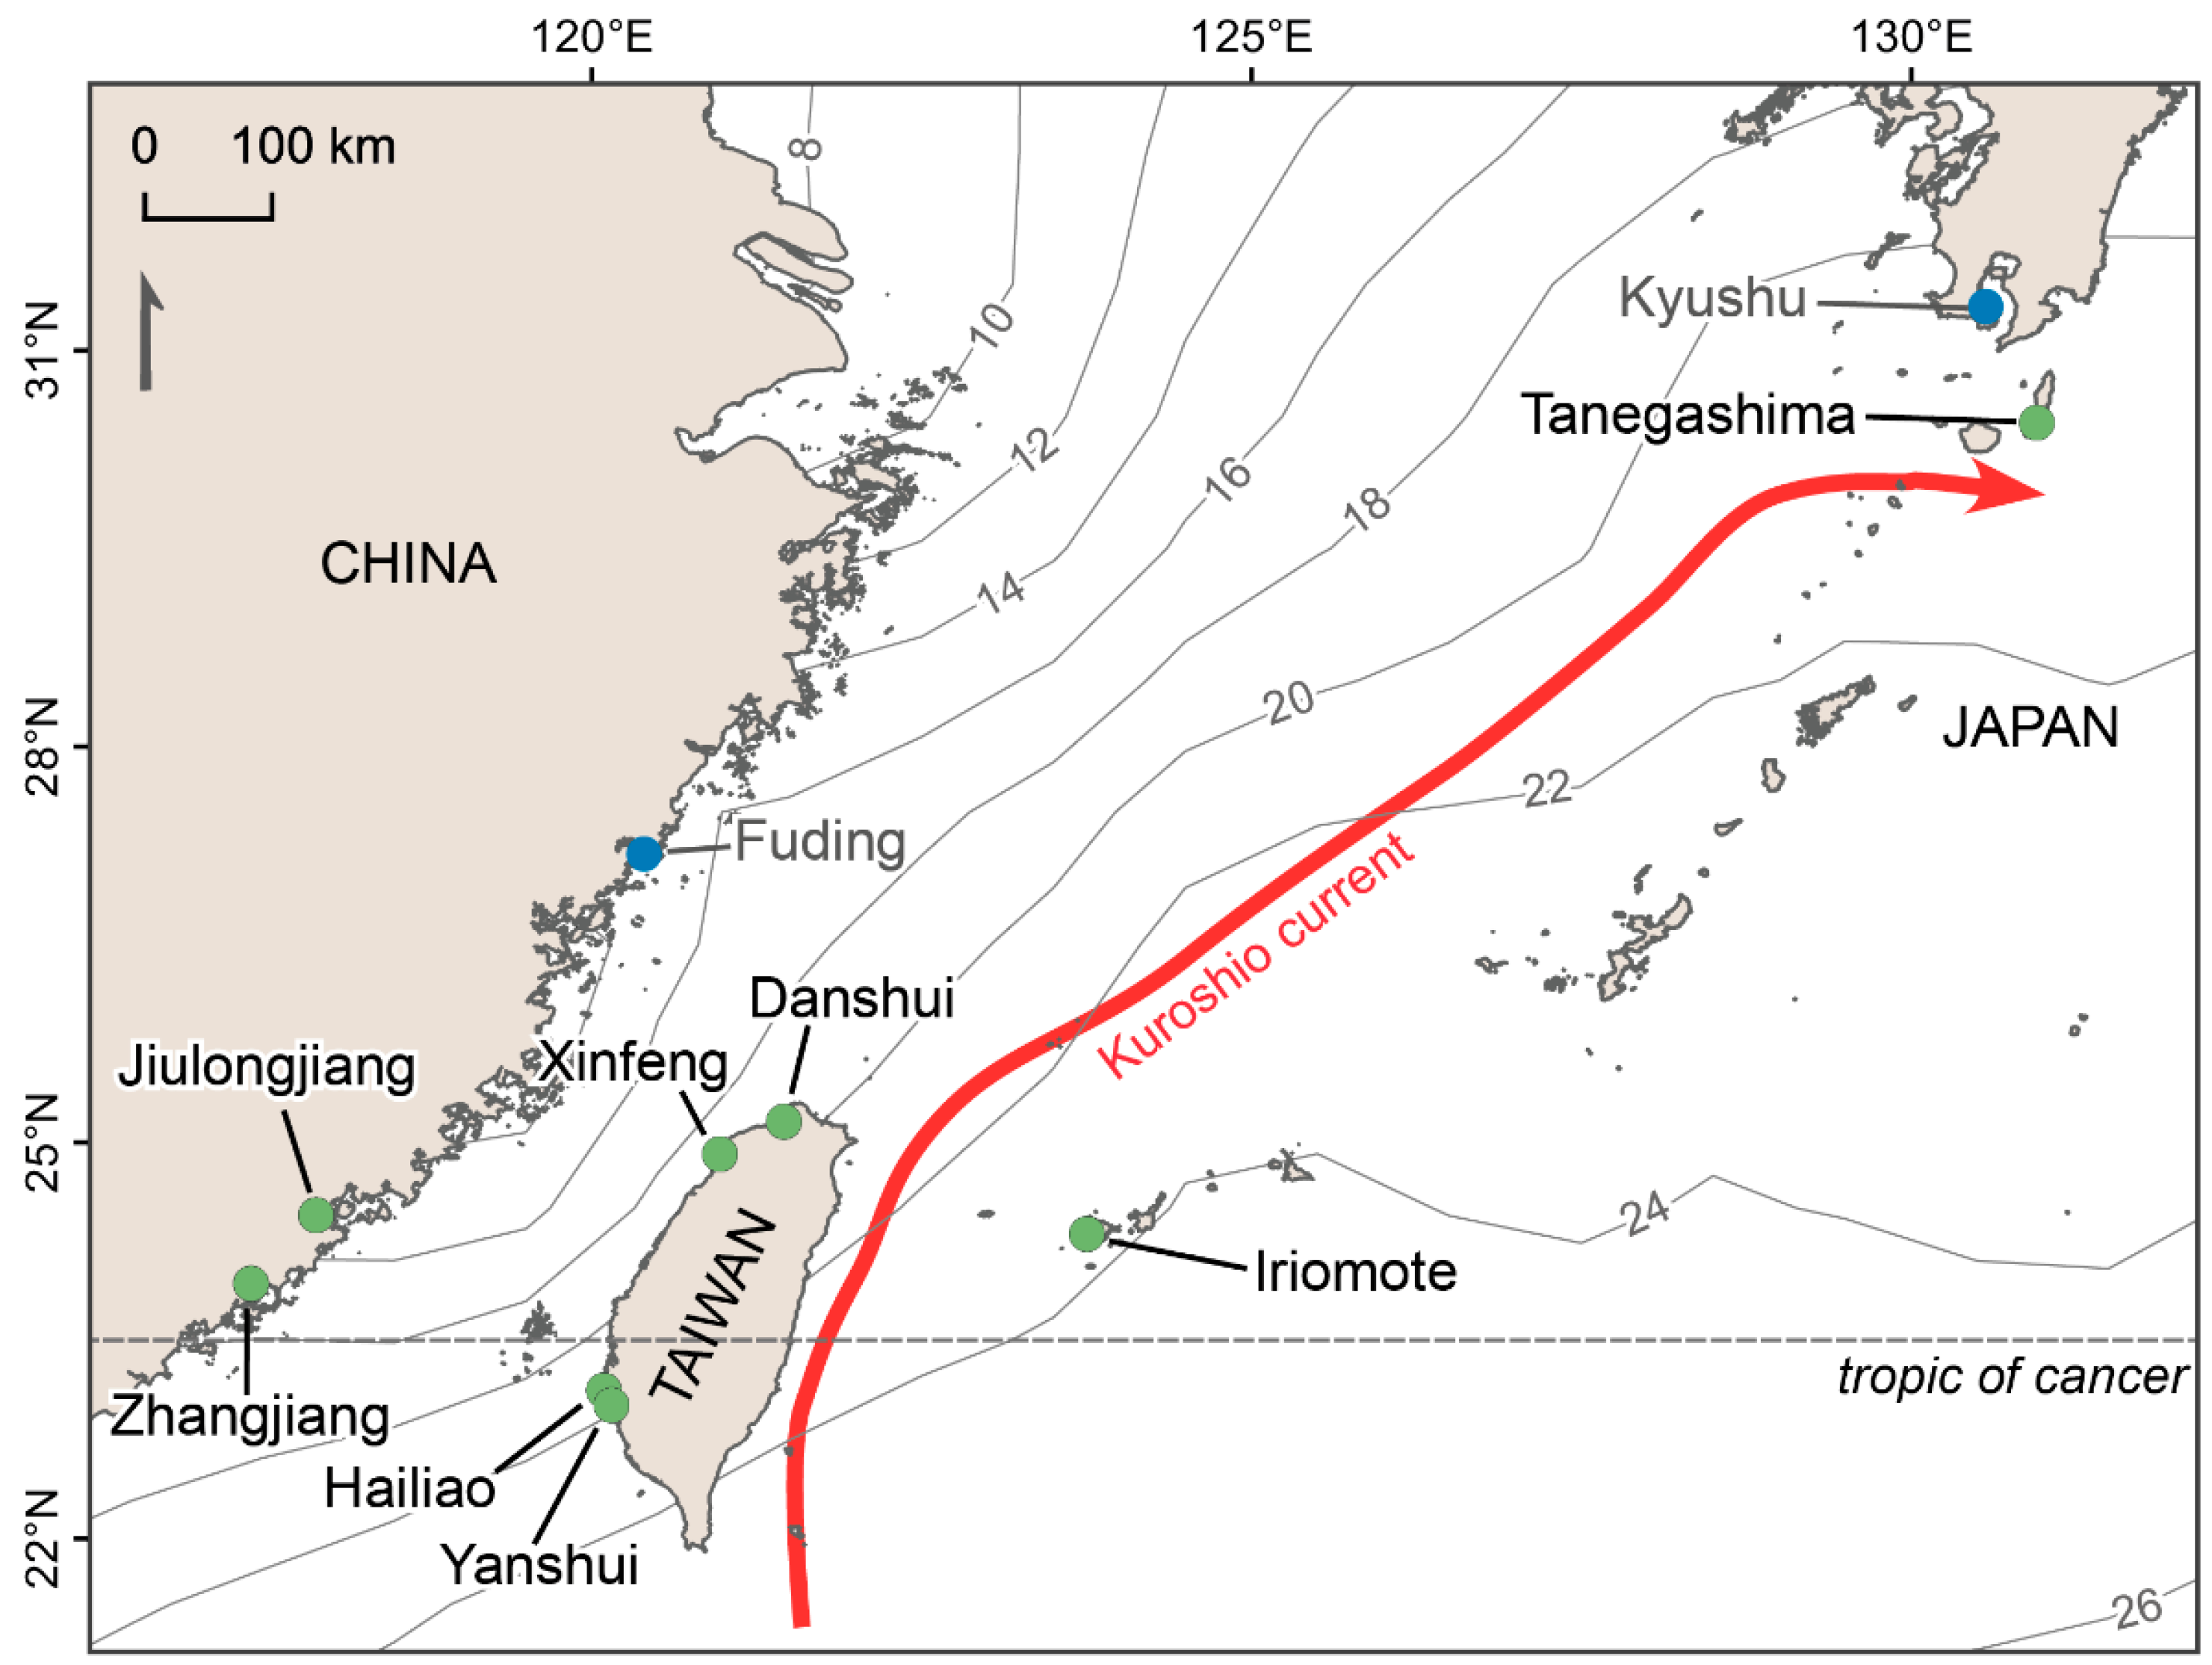
3.1. Temperature, Rainfall, and Windspeed during the Cold Wave Event

During the cold wave, which took place from 30 December 2020 to 19 January 2021, the minimum daily temperature dropped below 8 °C in all sites except for Iriomote ( T min = 10.3 °C). The lowest temperature during the cold wave was measured in Tanegashima (1.0 °C, Table 2, Figure 2). The change in minimum temperature ( Δ T min ) ranged between 10.04 °C and 13.15 °C, and the largest changes were observed for sites outside the influence of the Kuroshio Current (i.e., Danshui, Xinfeng, Jiulongjiang, and Zhangjiang). Furthermore, the length of the 2020–2021 cold wave varied among sites. The number of days with minimum temperatures under three standard deviations below the mean baseline temperature (i.e., the definition of the cold wave) ranged from 7 days in Tanegashima to 17 days in Zhangjiang.
However, lower temperatures were recorded for all stations during the cold wave of 2015–2016 that could not be observed with Sentinel-2 (Table 2). Since 2015, lower temperatures than those measured in 2021 were observed during three other winters in Yanshui-Hailiao and one winter for each of the other sites.
The eight mangrove stands were not subject to strong wind disturbance during the cold wave. The maximum mean wind speed recorded in each site during the 2021 winter ranged between 1.8 m s−1 (measured in Xinfeng station) and 11.8 m s−1 in Tanegashima (Table S2). The measured maximum wind speeds are close to those of the corresponding period between 2015 and 2020 that ranged between 2.1 m s−1 in Xinfeng and 14.1 m s−1 in Iriomote. However, the period of time spanning from November 2020 to February 2021 was characterized by low rainfall, with less than half of the average rainfall occurring from November 2020 to February 2021 than during the same periods from 2015 to 2020 in the Xinfeng, Jiulongjiang, and Zhangjiang sites (Table S2).

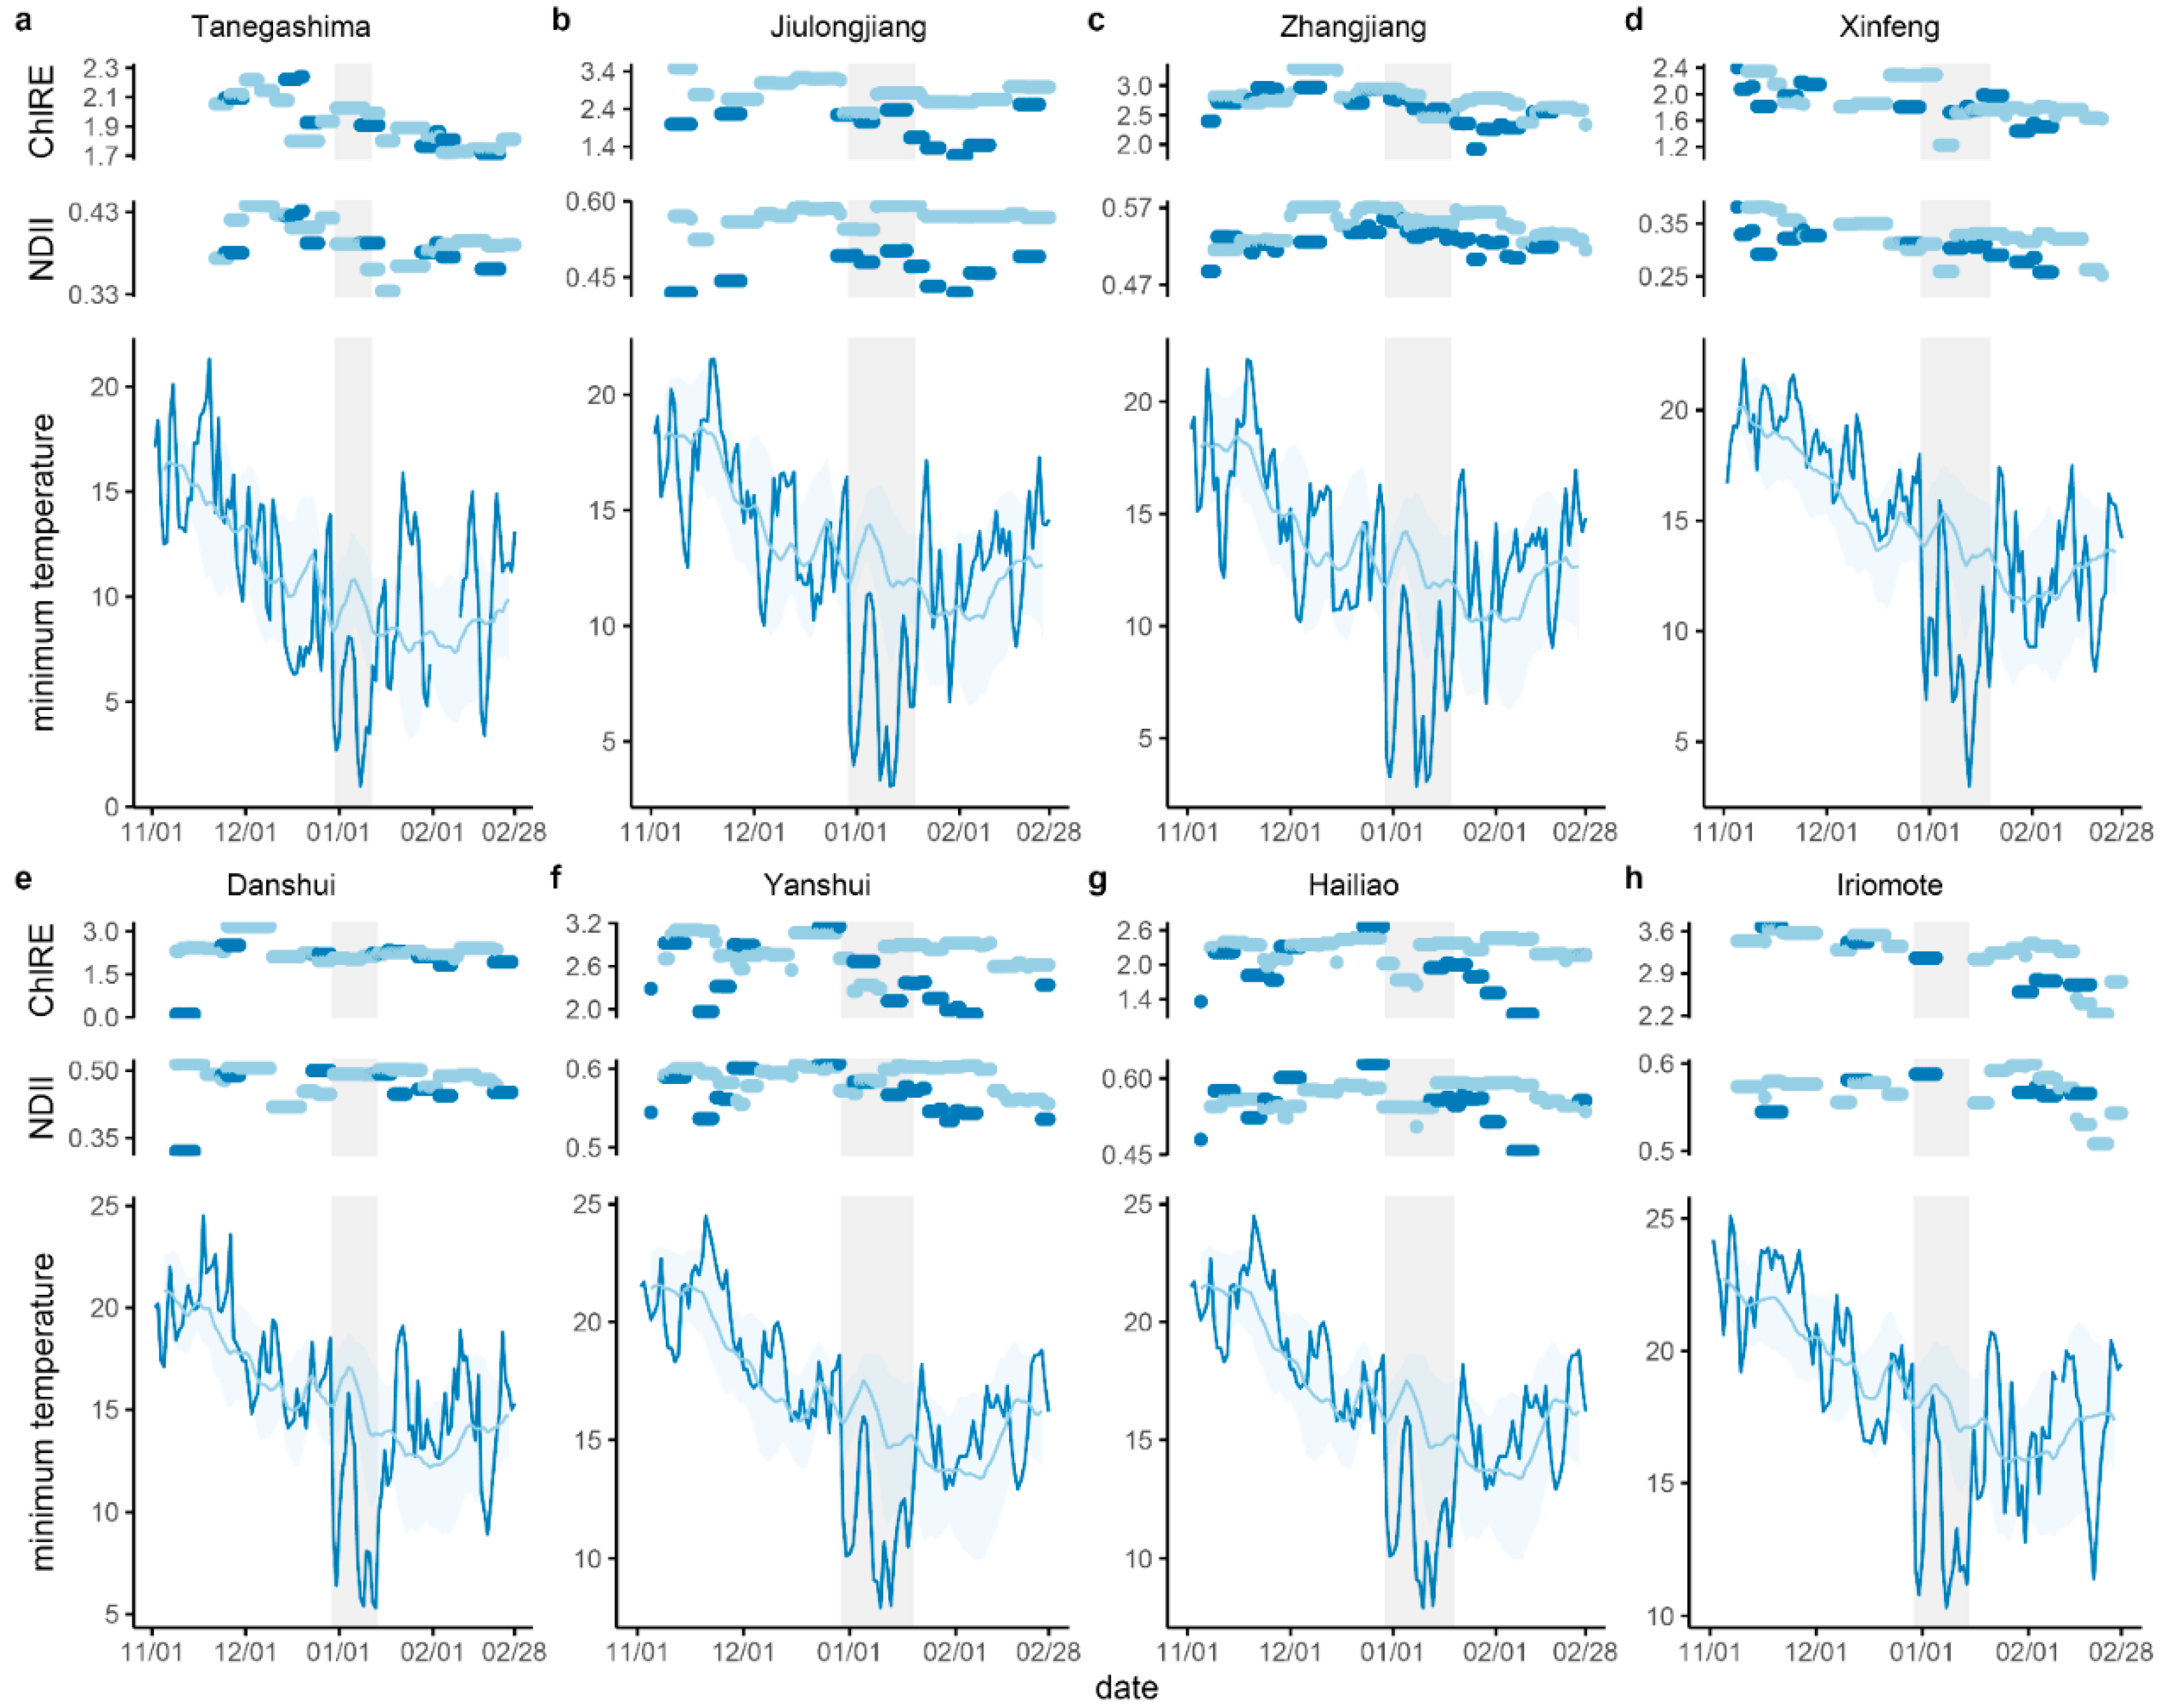
3.2. Vegetation Indices Change Following Cold

Significant differences between pre-cold wave VI values during the 2021 cold wave and the 2015-2020 baseline were detected in all sites except for Tanegashima (the two 95%CIs including 0, Table S3). However, there was no consistent trend for higher or lower VIs in 2021 relative to the baseline period across the eight sites.
The VI change from immediately before to after the cold wave (i.e.,   Δ VI t 1 t 2 ) was different in 2021 compared to the 2015–2020 baseline (Table 3). Across sites, Δ NDII t 1 t 2 - 2021 was generally positive (i.e., NDII decreased in 2021 after the cold wave) whereas Δ NDII t 1 t 2 - baseline was mostly negative (i.e., NDII increased over the same date range for the 2015–2020 baseline period). Hence, the cold event was followed by a change of NDII significantly different, and more negative, than for the baseline period (positive 95%CIs besides Tanegashima and Jiulongjiang, Table 3). Similarly, ChlRE generally decreased after the 2021 cold wave but mostly increased over the same date range in the baseline years, with Δ ChlRE t 1 t 2 - 2021 significantly higher than Δ ChlRE t 1 t 2 - baseline in all sites in 2021 except for Xinfeng and Zhangjiang (negative 95%CIs, Table 3). The analyses of VI change for up to 30 days following the end of the cold wave (i.e., Δ VI t 1 t 3 ) showed similar patterns with decreasing ChlRE and NDII in all sites following the cold wave ( Δ ChlRE t 1 t 3 - 2021 and Δ NDII t 1 t 3 - 2021 > 0, Table 3). The ChlRE and NDII had decreased significantly more 30 days after the end of the cold wave than the corresponding baseline variation Δ VI t 1 t 3 - baseline (95% CIs > 0), except for Tanegashima and Iriomote for ChlRE and NDII, and Xinfeng for ChlRE (95% ≤ CIs 0).
In comparison with t2 (the date corresponding to the end of the cold wave), the ChlRE and NDII had decreased further by t3 (30 days after the end of the cold wave) in most sites (i.e., Δ VI t 1 t 3 - net was greater than Δ VI t 1 t 2 - net , Table 4). However, by t3 in the northernmost site (Tanegashima), both VIs had returned closer to their baseline value ( Δ VI t 1 t 3 - net measured closer to 0). In the warmest site (Iriomote), ChlRE and NDII indicated recovery 30 days after the disturbance (i.e., Δ VI t 1 t 2 - net > 0 and Δ VI t 1 t 3 - net < 0). However, for one of the sites outside the Kuroshio Current (Zhangjiang), Δ ChlRE t 1 t 2 - net < 0 and Δ ChlRE t 1 t 3 - net > 0 indicated that there was no decrease of ChlRE right after disturbance (t2), but a drop approximately 30 days later (t3). On the other hand, Zhangjiang did not display a significant difference between the two intervals for NDII (95%CI including 0).
Besides differences in the change in direction (i.e., Δ VI t 1 t 3 - net < or > 0), the eight mangroves also showed significantly different magnitudes of change in Δ VI t 1 t 3 - net . By t3, two of the warmest sites which experienced T min < 10 °C (Hailiao, Yanshui) showed the largest net changes in ChlRE and NDII, meaning the measured VI values decreased the most (Figure 3, Table S4). The most negative Δ VI t 1 t 3 - net (i.e., VI changes indicating no canopy damage) were observed for both VIs in Iriomote, the site which experienced the highest T min and is located in the overall warmest setting.

3.3. Relationships between Vegetation Indices

Prior to the cold wave, ChlRE had positive and moderate to strong correlations with NDII, except in Iriomote and Hailiao where ρ = 0.18 and 0.34 (Table 5). However, the net changes between t1 and t3 of ChlRE and NDII were weakly correlated (ρ = 0.29 to 0.32, Table 5) except in Xinfeng with ρ = 0.61.

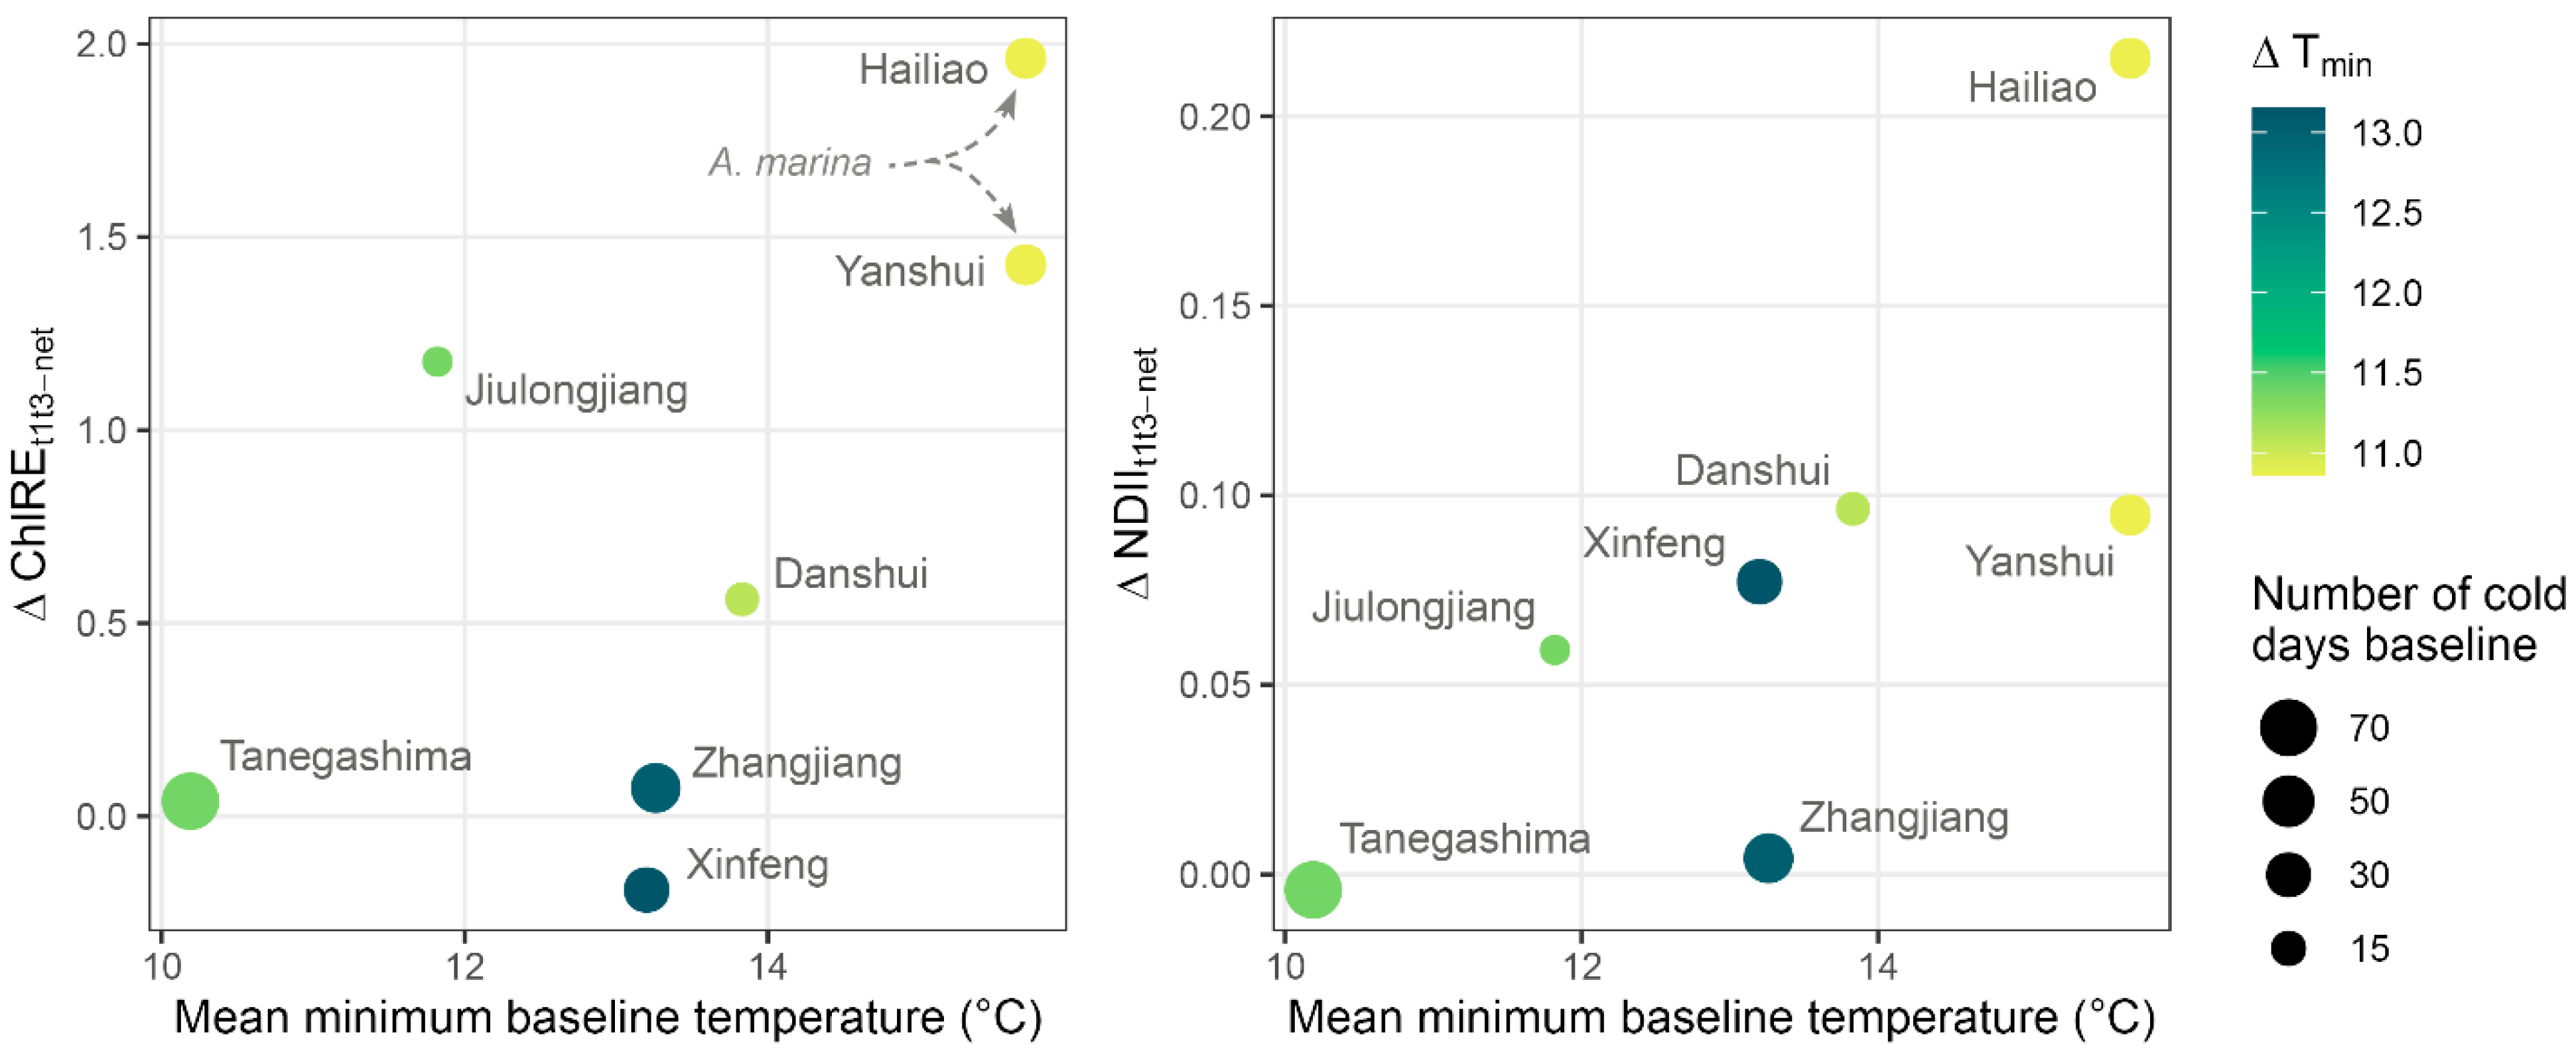
3.4. Canopy Change and Sites Climate

VIFs computed using the four predictors ranged from 2.53 (number of cold days in the baseline), 7.87 ( Δ T min ), and 9.79 (mean minimum temperature in the baseline) to 10.42 for species. After removing the predictor with the largest VIF (species), multicollinearity among predictors became very weak as VIFs were 1.17, 1.38, and 1.40 for mean minimum baseline temperature, the number of cold days in the baseline, and Δ T min , respectively. The model selection procedure kept the three predictors related to the climate of the seven sites for both linear regression models (Table 6, Figure 4). The relationships between VI change and the climate predictors were similar for both VIs. Sites showed larger changes in mangrove canopy VI values (greater Δ ChlRE t 1 t 3 - net and Δ NDII t 1 t 3 - net ) when they had a warmer mean minimum temperature over the 2015–2020 baseline or had experienced fewer cold days. On the other hand, damages were more severe when the difference between the minimum temperature of the 2021 cold event and the mean baseline temperature ( Δ T min ranging between 13.15 and 10.04) was smaller (Figure 4).

4. Discussion

4.1. Effects of Cold Wave on Mangrove Canopies

Both NDII and ChlRE decreased in East Asian mangrove canopies after the 2021 cold wave event. This finding is similar to that of Zhang et al. [39] where NDII for a Floridian mangrove decreased following low temperatures. VIs such as NDII have been successfully used to track the phenology of tropical forests, including mangroves [26,64]. Indeed, we associate the variation of two VIs in the baseline to tree phenology given that K. obovata canopies display seasonal variation in rates of photosynthesis at the northern edge of their distribution [71,72]. More importantly, we also identified significant differences between the seasonal and cold-wave driven VI reductions. Hence, changes in canopy reflectance in comparison with the baseline certainly reflected canopy-level reductions in leaf pigment (i.e., chlorophyll-a) concentrations or increased leaf senescence and fall as a result of the 2021 cold wave. Such changes in canopy reflectance are usually low in northwestern Pacific mangroves during winter [76,77]. In fact, we suggest that VI change can be partially attributed to canopy leaf temperature-stress, damage, and fall given that litterfall generally occurs over the course of a few weeks following chilling or wind disturbances (i.e., delayed damage) [6,8,78]. This process would explain why the decreasing trend for ChlRE and NDII continued for 30 days after the event (i.e., t3) in comparison with the end of the event (i.e., t2). Moreover, a reduction in canopy chlorophyll concentration, as reported by Chen et al. [11] on K. obovata following cold events even without defoliation, is also detected in our analysis through the decrease of ChlRE in most sites by t3.

4.2. Sites Characteristics Dictate Vegetation Response to Cold

The wide differences in net-VI change among sites are likely the product of the variation in the effect of the cold wave among sites and not the effect of other disturbances. Indeed, no site had experienced other stressors, such as strong winds or hypersalinity [15,79], in conjunction with the cold wave—as the eight mangroves are in comparable estuarine settings. Moreover, differences in sensitivity due to tree canopy age [80] are unlikely given that we selected only mature stands dominated by K. obovata or A. marina. Our linear regression models indicated that differences in cold sensitivity across sites were related to the site’s climatic history, as seen through greater canopy disturbance in sites with warmer historical mean minimum temperatures and with fewer cold days in the past five years (Section 3.4). For instance, mangroves at Tanegashima experience the coldest climate of the eight selected sites, but the canopy showed very little to no change in comparison with the baseline 30 days after the end of the cold wave, although the temperature had dropped to 1 °C (the lowest among all sites) during the cold wave. Therefore, the mangrove forest canopy in Tanegashima can be considered the most resistant to cold-wave damage of the eight sites selected. Our observations support the report of the absence of defoliation in a stand of K. obovata (in Ningde, China) exposed to a temperature of 1.4 °C, a temperature comparable to the one measured here for Tanegashima [11]. It is likely that factors such as local cold-temperature acclimation may have helped mangrove stands growing in colder environments recover rapidly to pre-disturbance state ( Δ VI t 1 t 2 - net is significant but not Δ VI t 1 t 3 - net in Tanegashima, Table 3). A common-garden experiment in northeastern America found clear differences in cold tolerance among mangrove populations [24], suggesting that acclimation relates to cold-tolerance in mangroves. Moreover, in the northwestern Pacific, relationships between increased resistance to disturbance and their frequency have been suggested for typhoons [81,82], which provides anecdotal evidence for a relationship between acclimation (i.e., resistance) and resilience to environmental stressor. Hence, we suggest that acclimation or cold-temperature driven selection is likely the mechanism leading to the greater cold tolerance of mangroves which experience colder winter temperatures and more frequent cold events, as our sites are composed of mostly the same species (K. obovata), although A. marina is also present in the southernmost sites and has been shown to be less tolerant to low temperatures [10,14].
Δ T min had a very limited range (from 10.04 °C to 13.15 °C) and contrary to our expectations it was negatively related to changes in VI values, our proxy for canopy damage, across our sites. This relationship implies that there was greater damage in sites exposed to a smaller drop in temperature. Along with the influence of cold event history, this pattern suggests that the magnitude of temperature change alone is not a driver of damage severity across our sites. Instead, it is the magnitude of temperature change in relation to temperature history that the mangroves are adapted to, that is key to the response of the mangroves to the cold event. In fact, the three sites with the largest Δ T min are also the three sites with the lowest historical minimum winter temperature among the seven sites included in the regression models (Table 2), supporting the understanding that mangroves growing in colder sites were less vulnerable (i.e., more resistant) to the 2021 cold wave event.
The large Δ VI t 1 t 3 - net measured in the sites dominated by A. marina (Yanshui and Hailiao) confirms the reports of other studies of A. marina’s higher sensitivity to cold in comparison with K. obovata [10,14]. In fact, A. marina’s threshold of sensitivity may be well above that of K. obovata because its VI variation was relatively large even though Hailiao and Yanshui mangroves were exposed to the warmest T min of all sites and a Δ T min of small amplitude (after Iriomote). The minimum temperature of cold events may explain why A. marina distribution in Taiwan does not extend to the northern sites such as Danshui and Xinfeng [47].
Finally, in 2021, Iriomote experienced a temperature anomaly similar to the other sites, however the minimum recorded temperature remained relatively high (>10.3 °C), and, therefore, it may not have been low to enough to induce any Sentinel-2 observable physiological leaf stress (Table 2). For the North Asian mangroves dominated by K. obovata, the threshold of significant cold sensitivity may be air temperatures <10 °C, even though the coastal climate is generally warm, and it is likely that mangrove populations may have developed little cold resilience. However, given the limited number of sites and uncertainties linked to the local microclimates because of complexities in terrain-climate interactions, even in mangroves [41,83], future analysis of other cold events in this region and field-based validation of leaf physiology in relation to remotely sensed VI data would help to improve understanding of how remotely sensed data products can capture relationships between mangrove forest characteristics and canopy cold resistance.

4.3. Complementarity of Vegetation Indices to Monitor Vegetation Disturbance

Although the ChlRE and NDII both measured changes in canopy reflectance following the 2021 cold wave, they are related to different canopy parameters. Changes in leaf chlorophyll concentrations, leaf damage to the mesophyll, and subsequent leaf fall (hence variation in canopy water concentration) take place in mangrove canopies because of cold stress, however these processes operate over varying timescales [6,14,84]. It has not been entirely clear how remotely sensed changes in canopy chlorophyll content correlate to changes in canopy water content. In our study, pre-disturbance correlations of ChlRE-NDII were strong, however it is likely that changes in canopy chlorophyll and water content in response to the cold event occurred differently across the eight mangroves given that their net change by t3 were at most weakly correlated, if at all. We suggest that using multiple VIs tailored to different canopy parameters would help identify the various effects of disturbances on leaf canopy physiological parameters. Moreover, we show that in addition to NDII, the less frequently used ChlRE also clearly identified canopy disturbance and its use to monitor forest processes should be strongly considered in future remote sensing studies. Further field studies of the relationships between evergreen vegetation-ChlRE are needed to improve our understanding of the relationship between leaf chlorophyll with this VI. Other remote sensing indices which reflect leaf physiological function, such as solar induced chlorophyll fluorescence (SIF) [85,86] may help identify whether variation in ChlRE (i.e., leaf chlorophyll content) also accompany a decrease in net photosynthetic rates or gross primary productivity. Coupling SIF to ChlRE has potential to improve our understanding of relationships between environmental drivers (i.e., temperature in this case), chlorophyll content and leaf functional at the scale of mangrove canopies [87].

4.4. Implications for the Future of North Asian Mangroves

Climate change is leading to increasing temperatures at the historical mangrove limits in the northern Atlantic and the western Pacific [88]. Mangroves may migrate poleward following shifts of temperature niches [19,20] (but see [89]) when they are not limited by other factors such as propagule dispersal or site availability [18]. Mangrove plantations have successfully established small populations north of their historical geographic range limits in the northern hemisphere (Figure 1), for example as far as the Izu peninsula, Japan (34°38′N) [90] or the Zhejiang province, China (28°20′N) [80]. Moreover, we did not detect disturbance in the second northernmost stand of our site selection. Hence, Asian mangroves may continue to naturally expand northward to available sites from the most cold-tolerant populations. However, in mature mangrove forests, where the frequency of extreme cold events decreases as mean annual temperatures increase toward the tropics, it is likely that increasing climate variability, including a potential increase in the frequency of cold waves, may affect canopy physiology and the carbon dynamics of North Asian mangroves [5].

5. Conclusions

Low temperatures are a well-known stressor for mangrove trees. Low temperatures regulate mangroves forest function, and geographic range expansion at the regional and local scales [18,20,21]. Although mangroves growing at the poleward edge of their distribution are cold tolerant, they still display evidence of cold stress through reduction in leaf chlorophyll content, reduced growth, and even leaf mortality and fall when temperatures are cold enough [6,11,14]. Our study of a cold wave that affected northeastern Asia in January 2021 confirms that canopies of Kandelia obovata and Avicennia marina stands were stressed by low temperatures, showing reductions in canopy leaf water and chlorophyll content. However, reductions in chlorophyll and water content are typically not distributed uniformly throughout the canopy as there is variation in cold-temperature stress among leaves, hence, we recommend using complementary vegetation indices to monitor cold disturbances. Our results clearly showed that mangrove forest sites regularly subject to low temperatures manifested greater leaf physiological tolerance to the cold wave of 2021 than sites growing in warmer climates. Hence, cold wave canopy damage in northwestern Pacific mangroves is the product of site-specific climate history, which implies that local adaptation occurs over longer time scales which interacts with acclimation in response to cold wave events to lead to the increased resilience of more northern mangrove stands to cold waves.

Supplementary Materials

The following are available online at https://www.mdpi.com/article/10.3390/rs13142732/s1, Table S1: Scenes used to analyze the 2021 cold event in eight mangrove forest sites of northeastern Asia (Taiwan, Japan and coastal China). Table S2: Wind speed and rainfall at the eight sites between November and February in 2021 and between 2015 and 2020. Table S3: 95% confidence intervals computed through bootstrapped comparisons on means between pre-cold wave vegetation index value in 2021 and the VI value at the same period on the baseline. Table S4: 95% confidence intervals computed through multiple comparisons of ΔVIt1t3-net measured in the eight sites and for the two vegetation indices chlorophyll red-edge index and normalized difference infrared index.

Author Contributions

Conceptualization, T.-C.L. and J.P.; methodology, T.-C.L. and J.P.; software, J.P.; validation, T.-C.L., J.P., and J.A.H.; formal analysis, T.-C.L. and J.P.; investigation, J.P.; resources, T.-C.L. and J.P.; data curation, J.P.; writing—original draft preparation, T.-C.L. and J.P.; writing—review and editing, T.-C.L., J.P., and J.A.H.; visualization, T.-C.L., J.P., and J.A.H.; supervision, T.-C.L.; project administration, T.-C.L.; funding acquisition, T.-C.L. All authors have read and agreed to the published version of the manuscript.

Funding

This research was funded by the Ministry of Science and Technology, Taiwan, grant numbers 108-2313-B-003-001-MY3 and 109-2811-B-003-501.

Informed Consent Statement

Not applicable.

Data Availability Statement

All original data are from publicly available sources and are clearly identified in the paper.

Acknowledgments

We acknowledge the library of National Taiwan Normal University for facilitating access to literature.

Conflicts of Interest

The authors declare no conflict of interest.

References

  1. Spalding, M.; Blasco, F.; Field, C. World Mangrove Atlas; The International Society for Mangrove Ecosystems: Okinawa, Japan, 1997. [Google Scholar]
  2. Duke, N.C.; Ball, M.C.; Ellison, J.C. Factors influencing biodiversity and distributional gradients in mangroves. Glob. Ecol. Biogeogr. Lett. 1998, 7, 27–47. [Google Scholar] [CrossRef] [Green Version]
  3. Krauss, K.W.; Lovelock, C.E.; McKee, K.L.; López-Hoffman, L.; Ewe, S.M.L.; Sousa, W.P. Environmental drivers in mangrove establishment and early development: A review. Aquat. Bot. 2008, 89, 105–127. [Google Scholar] [CrossRef]
  4. Wu, Y.; Ricklefs, R.E.; Huang, Z.; Zan, Q.; Yu, S. Winter temperature structures mangrove species distributions and assemblage composition in China. Glob. Ecol. Biogeogr. 2018, 27, 1492–1506. [Google Scholar] [CrossRef]
  5. Osland, M.J.; Feher, L.C.; Griffith, K.T.; Cavanaugh, K.C.; Enwright, N.M.; Day, R.H.; Stagg, C.L.; Krauss, K.W.; Howard, R.J.; Grace, J.B.; et al. Climatic controls on the global distribution, abundance, and species richness of mangrove forests. Ecol. Monogr. 2017, 87, 341–359. [Google Scholar] [CrossRef] [Green Version]
  6. Ellis, W.L.; Bowles, J.W.; Erickson, A.A.; Stafford, N.; Bell, S.S.; Thomas, M. Alteration of the chemical composition of mangrove (Laguncularia racemosa) leaf litter fall by freeze damage. Estuar. Coast. Shelf Sci. 2006, 68, 363–371. [Google Scholar] [CrossRef]
  7. Stuart, S.A.; Choat, B.; Martin, K.C.; Holbrook, N.M.; Ball, M.C. The role of freezing in setting the latitudinal limits of mangrove forests. New Phytol. 2007, 173, 576–583. [Google Scholar] [CrossRef] [Green Version]
  8. Wang, W.; You, S.; Wang, Y.; Huang, L.; Wang, M. Influence of frost on nutrient resorption during leaf senescence in a mangrove at its latitudinal limit of distribution. Plant Soil 2011, 342, 105–115. [Google Scholar] [CrossRef]
  9. Markley, J.L.; McMillan, C.; Thompson, G.A., Jr. Latitudinal differentiation in response to chilling temperatures among populations of three mangroves, Avicennia germinans, Laguncularia racemosa, and Rhizophora mangle, from the western tropical Atlantic and Pacific Panama. Can. J. Bot. 1982, 60, 2704–2715. [Google Scholar] [CrossRef]
  10. Peng, Y.-L.; Wang, Y.-S.; Fei, J.; Sun, C.-C.; Cheng, H. Ecophysiological differences between three mangrove seedlings (Kandelia obovata, Aegiceras corniculatum, and Avicennia marina) exposed to chilling stress. Ecotoxicology 2015, 24, 1722–1732. [Google Scholar] [CrossRef] [PubMed]
  11. Chen, L.; Wang, W.; Li, Q.Q.; Zhang, Y.; Yang, S.; Osland, M.J.; Huang, J.; Peng, C. Mangrove species’ responses to winter air temperature extremes in China. Ecosphere 2017, 8, e01865. [Google Scholar] [CrossRef]
  12. Liu, W.; Zheng, C.; Chen, J.; Qiu, J.; Huang, Z.; Wang, Q.; Ye, Y. Cold acclimation improves photosynthesis by regulating the ascorbate–glutathione cycle in chloroplasts of Kandelia obovata. J. For. Res. 2019, 30, 755–765. [Google Scholar] [CrossRef]
  13. Gu, X.; Yang, C.; Zhao, H.; Hu, N.; Krauss, K.W.; Deng, C.; Chen, L. Sap flow evidence of chilling injury and recovery in mangroves following a spring cold spell. Trees 2021, 35, 907–917. [Google Scholar] [CrossRef]
  14. Kao, W.-Y.; Shih, C.-N.; Tsai, T.-T. Sensitivity to chilling temperatures and distribution differ in the mangrove species Kandelia candel and Avicennia marina. Tree Physiol. 2004, 24, 859–864. [Google Scholar] [CrossRef]
  15. Devaney, J.L.; Pullen, J.; Feller, I.C.; Parker, J.D. Low humidity and hypersalinity reduce cold tolerance in mangroves. Estuar. Coast. Shelf Sci. 2021, 248, 107015. [Google Scholar] [CrossRef]
  16. Stevens, P.W.; Fox, S.L.; Montague, C.L. The interplay between mangroves and saltmarshes at the transition between temperate and subtropical climate in Florida. Wetlands Ecol. Manag. 2006, 14, 435–444. [Google Scholar] [CrossRef]
  17. Osland, M.J.; Enwright, N.; Day, R.H.; Doyle, T.W. Winter climate change and coastal wetland foundation species: Salt marshes vs. mangrove forests in the southeastern United States. Glob. Chang. Biol. 2013, 19, 1482–1494. [Google Scholar] [CrossRef]
  18. Saintilan, N.; Wilson, N.C.; Rogers, K.; Rajkaran, A.; Krauss, K.W. Mangrove expansion and salt marsh decline at mangrove poleward limits. Glob. Chang. Biol. 2014, 20, 147–157. [Google Scholar] [CrossRef] [Green Version]
  19. Cavanaugh, K.C.; Kellner, J.R.; Forde, A.J.; Gruner, D.S.; Parker, J.D.; Rodriguez, W.; Feller, I.C. Poleward expansion of mangroves is a threshold response to decreased frequency of extreme cold events. Proc. Natl. Acad. Sci. USA 2014, 111, 723–727. [Google Scholar] [CrossRef] [PubMed] [Green Version]
  20. Cavanaugh, K.C.; Parker, J.D.; Cook-Patton, S.C.; Feller, I.C.; Williams, A.P.; Kellner, J.R. Integrating physiological threshold experiments with climate modeling to project mangrove species’ range expansion. Glob. Chang. Biol. 2015, 21, 1928–1938. [Google Scholar] [CrossRef] [Green Version]
  21. Osland, M.J.; Day, R.H.; Hall, C.T.; Brumfield, M.D.; Dugas, J.L.; Jones, W.R. Mangrove expansion and contraction at a poleward range limit: Climate extremes and land-ocean temperature gradients. Ecology 2017, 98, 125–137. [Google Scholar] [CrossRef]
  22. Mao, L.; Foong, S.Y. Tracing ancestral biogeography of Sonneratia based on fossil pollen and their probable modern analogues. Palaeoworld 2013, 22, 133–143. [Google Scholar] [CrossRef]
  23. Li, M.S.; Lee, S.Y. Mangroves of China: A brief review. For. Ecol. Manag. 1997, 96, 241–259. [Google Scholar] [CrossRef]
  24. Cook-Patton, S.C.; Lehmann, M.; Parker, J.D. Convergence of three mangrove species towards freeze-tolerant phenotypes at an expanding range edge. Funct. Ecol. 2015, 29, 1332–1340. [Google Scholar] [CrossRef]
  25. Kennedy, J.P.; Preziosi, R.F.; Rowntree, J.K.; Feller, I.C. Is the central-marginal hypothesis a general rule? Evidence from three distributions of an expanding mangrove species, Avicennia germinans (L.) L. Mol. Ecol. 2020, 29, 704–719. [Google Scholar] [CrossRef] [PubMed] [Green Version]
  26. Pastor-Guzman, J.; Dash, J.; Atkinson, P.M. Remote sensing of mangrove forest phenology and its environmental drivers. Remote Sens. Environ. 2018, 205, 71–84. [Google Scholar] [CrossRef] [Green Version]
  27. Jia, M.; Wang, Z.; Zhang, Y.; Mao, D.; Wang, C. Monitoring loss and recovery of mangrove forests during 42 years: The achievements of mangrove conservation in China. Int. J. Appl. Earth Obs. Geoinf. 2018, 73, 535–545. [Google Scholar] [CrossRef]
  28. Younes, N.; Northfield, T.D.; Joyce, K.E.; Maier, S.W.; Duke, N.C.; Lymburner, L. A novel approach to modelling mangrove phenology from satellite images: A case study from Northern Australia. Remote Sens. 2020, 12, 4008. [Google Scholar] [CrossRef]
  29. Lagomasino, D.; Fatoyinbo, T.; Lee, S.; Feliciano, E.; Trettin, C.; Simard, M. A comparison of mangrove canopy height using multiple independent measurements from land, air, and space. Remote Sens. 2016, 8, 327. [Google Scholar] [CrossRef] [PubMed] [Green Version]
  30. Asbridge, E.; Lucas, R.; Rogers, K.; Accad, A. The extent of mangrove change and potential for recovery following severe Tropical Cyclone Yasi, Hinchinbrook Island, Queensland, Australia. Ecol. Evol. 2018, 8, 10416–10434. [Google Scholar] [CrossRef] [Green Version]
  31. Zhang, C.; Durgan, S.D.; Lagomasino, D. Modeling risk of mangroves to tropical cyclones: A case study of Hurricane Irma. Estuar. Coast. Shelf Sci. 2019, 224, 108–116. [Google Scholar] [CrossRef]
  32. Friess, D.A.; Rogers, K.; Lovelock, C.E.; Krauss, K.W.; Hamilton, S.E.; Lee, S.Y.; Lucas, R.; Primavera, J.; Rajkaran, A.; Shi, S. The state of the world’s mangrove forests: Past, present, and future. Annu. Rev. Environ. Resour. 2019, 44, 89–115. [Google Scholar] [CrossRef] [Green Version]
  33. Pham, T.D.; Yokoya, N.; Bui, D.T.; Yoshino, K.; Friess, D.A. Remote sensing approaches for monitoring mangrove species, structure, and biomass: Opportunities and challenges. Remote Sens. 2019, 11, 230. [Google Scholar] [CrossRef] [Green Version]
  34. Kuenzer, C.; Bluemel, A.; Gebhardt, S.; Quoc, T.V.; Dech, S. Remote sensing of mangrove ecosystems: A review. Remote Sens. 2011, 3, 878. [Google Scholar] [CrossRef] [Green Version]
  35. Giri, C. Observation and monitoring of mangrove forests using remote sensing: Opportunities and challenges. Remote Sens. 2016, 8, 783. [Google Scholar] [CrossRef] [Green Version]
  36. Wang, L.; Jia, M.; Yin, D.; Tian, J. A review of remote sensing for mangrove forests: 1956–2018. Remote Sens. Environ. 2019, 231, 111223. [Google Scholar] [CrossRef]
  37. De Beurs, K.M.; McThompson, N.S.; Owsley, B.C.; Henebry, G.M. Hurricane damage detection on four major Caribbean islands. Remote Sens. Environ. 2019, 229, 1–13. [Google Scholar] [CrossRef]
  38. Otero, V.; Van De Kerchove, R.; Satyanarayana, B.; Mohd-Lokman, H.; Lucas, R.; Dahdouh-Guebas, F. An analysis of the early regeneration of mangrove forests using Landsat time series in the Matang Mangrove Forest Reserve, Peninsular Malaysia. Remote Sens. 2019, 11, 774. [Google Scholar] [CrossRef] [Green Version]
  39. Zhang, K.; Thapa, B.; Ross, M.; Gann, D. Remote sensing of seasonal changes and disturbances in mangrove forest: A case study from South Florida. Ecosphere 2016, 7, e01366. [Google Scholar] [CrossRef] [Green Version]
  40. Thapa, B. Spatio-Temporal Analysis of Chilling Events in Mangrove Forests of South Florida. Master’s Thesis, Florida International University, Miami, FL, USA, 2014. [Google Scholar]
  41. Liu, K.; Liu, L.; Liu, H.; Li, X.; Wang, S. Exploring the effects of biophysical parameters on the spatial pattern of rare cold damage to mangrove forests. Remote Sens. Environ. 2014, 150, 20–33. [Google Scholar] [CrossRef]
  42. Chen, L.; Wang, W.Q.; Zhang, Y.H.; Huang, L.; Zhao, C.L.; Yang, S.C.; Yang, Z.W.; Chen, Y.C.; Xu, H.L.; Zhong, C.R.; et al. Damage to mangroves from extreme cold in early 2008 in southern China. Chin. J. Plant Ecol. 2010, 34, 186–194. [Google Scholar] [CrossRef]
  43. Giri, C.; Ochieng, E.; Tieszen, L.L.; Zhu, Z.; Singh, A.; Loveland, T.; Masek, J.; Duke, N. Status and distribution of mangrove forests of the world using earth observation satellite data. Glob. Ecol. Biogeogr. 2011, 20, 154–159. [Google Scholar] [CrossRef]
  44. Nakasuga, T. Analysis of the mangrove stand. Sci. Bull. Fac. Agric. Univ. Ryukyus Okinawa 1979, 26, 413–519. [Google Scholar]
  45. Alongi, D.M.; Pfitzner, J.; Trott, L.A.; Tirendi, F.; Dixon, P.; Klumpp, D.W. Rapid sediment accumulation and microbial mineralization in forests of the mangrove Kandelia candel in the Jiulongjiang Estuary, China. Estuar. Coast. Shelf Sci. 2005, 63, 605–618. [Google Scholar] [CrossRef]
  46. Zhang, Y.; Wang, W.; Wu, Q.; Fang, B.; Lin, P. The growth of Kandelia candel seedlings in mangrove habitats of the Zhangjiang estuary in Fujian, China. Acta Ecol. Sin. 2006, 26, 1648–1655. [Google Scholar] [CrossRef]
  47. Hsueh, M.-L.; Lee, H.-H. Diversity and distribution of the mangrove forests in Taiwan. Wetlands Ecol. Manag. 2000, 8, 233–242. [Google Scholar] [CrossRef]
  48. Hurrell, J.W.; Hack, J.J.; Shea, D.; Caron, J.M.; Rosinski, J. A new sea surface temperature and sea ice boundary dataset for the community atmosphere model. J. Clim. 2008, 21, 5145–5153. [Google Scholar] [CrossRef]
  49. Shea, D.; Hurrell, J.; Phillips, A. Merged Hadley-OI Sea Surface Temperature and Sea Ice Concentration Data Set, 2nd ed.; UCAR/NCAR—DASH Repository: Boulder, CO, USA, 2021. [Google Scholar] [CrossRef]
  50. Sheue, C.-R.; Liu, H.-Y.; Yong, J.W.H. Kandelia obovata (Rhizophoraceae), a new mangrove species from Eastern Asia. Taxon 2003, 52, 287–294. [Google Scholar] [CrossRef]
  51. Wang, L.; Shi, C.; Tian, J.; Song, X.; Jia, M.; Li, X.; Liu, X.; Zhong, R.; Yin, D.; Yang, S.; et al. Researches on mangrove forest monitoring methods based on multi-source remote sensing. Biodivers. Sci. 2018, 26, 838–849. [Google Scholar] [CrossRef]
  52. Ho, C.-Y. Estimation of Carbon Sequestration for a Mangrove Wetland in Southern Taiwan. Master’s Thesis, Chia-Nan University of Pharmacy and Science, Tainan, Taiwan, 2012. [Google Scholar]
  53. Wang, M.; Cao, W.; Guan, Q.; Wu, G.; Wang, F. Assessing changes of mangrove forest in a coastal region of southeast China using multi-temporal satellite images. Estuar. Coast. Shelf Sci. 2018, 207, 283–292. [Google Scholar] [CrossRef]
  54. Kao, W.Y.; Chang, K.W. Stable carbon isotope ratio and nutrient contents of the Kandelia candel mangrove populations of different growth forms. Bot. Bull. Acad. Sin. 1998, 39, 39–45. [Google Scholar]
  55. Lin, C.-W.; Kao, Y.-C.; Chou, M.-C.; Wu, H.-H.; Ho, C.-W.; Lin, H.-J. Methane emissions from subtropical and tropical mangrove ecosystems in Taiwan. Forests 2020, 11, 470. [Google Scholar] [CrossRef] [Green Version]
  56. Simpson, R.H.; Riehl, H. The Hurricane and Its Impact; Louisiana State University Press: Baton Rouge, LA, USA, 1981; p. 398. [Google Scholar]
  57. Bunting, P.; Rosenqvist, A.; Lucas, R.M.; Rebelo, L.-M.; Hilarides, L.; Thomas, N.; Hardy, A.; Itoh, T.; Shimada, M.; Finlayson, C.M. The Global Mangrove Watch—A new 2010 Global baseline of mangrove extent. Remote Sens. 2018, 10, 1669. [Google Scholar] [CrossRef] [Green Version]
  58. Ranghetti, L.; Boschetti, M.; Nutini, F.; Busetto, L. “sen2r”: An R toolbox for automatically downloading and preprocessing Sentinel-2 satellite data. Comput. Geosci. 2020, 139, 104473. [Google Scholar] [CrossRef]
  59. Ji, L.; Senay, G.B.; Verdin, J.P. Evaluation of the Global Land Data Assimilation System (GLDAS) air temperature data products. J. Hydrometeorol. 2015, 16, 2463–2480. [Google Scholar] [CrossRef]
  60. Hardisky, M.A.; Klemas, V.; Smart, R.M. The influence of soil salinity, growth form, and leaf moisture on the spectral reflectance of Spartina alterniflora canopies. Photogramm. Eng. Remote Sens. 1983, 49, 77–83. [Google Scholar]
  61. Cheng, Y.-B.; Zarco-Tejada, P.J.; Riaño, D.; Rueda, C.A.; Ustin, S.L. Estimating vegetation water content with hyperspectral data for different canopy scenarios: Relationships between AVIRIS and MODIS indexes. Remote Sens. Environ. 2006, 105, 354–366. [Google Scholar] [CrossRef]
  62. Gao, B.-C. NDWI—A normalized difference water index for remote sensing of vegetation liquid water from space. Remote Sens. Environ. 1996, 58, 257–266. [Google Scholar] [CrossRef]
  63. Wang, W.; Qu, J.J.; Hao, X.; Liu, Y.; Stanturf, J.A. Post-hurricane forest damage assessment using satellite remote sensing. Agr. For. Meteorol. 2010, 150, 122–132. [Google Scholar] [CrossRef]
  64. Gang, C.; Pan, S.; Tian, H.; Wang, Z.; Xu, R.; Bian, Z.; Pan, N.; Yao, Y.; Shi, H. Satellite observations of forest resilience to hurricanes along the northern Gulf of Mexico. For. Ecol. Manag. 2020, 472, 118243. [Google Scholar] [CrossRef]
  65. Gitelson, A.A.; Keydan, G.P.; Merzlyak, M.N. Three-band model for noninvasive estimation of chlorophyll, carotenoids, and anthocyanin contents in higher plant leaves. Geophys. Res. Lett. 2006, 33. [Google Scholar] [CrossRef] [Green Version]
  66. Dou, Z.; Cui, L.; Li, J.; Zhu, Y.; Gao, C.; Pan, X.; Lei, Y.; Zhang, M.; Zhao, X.; Li, W. Hyperspectral estimation of the chlorophyll content in short-term and long-term restorations of mangrove in Quanzhou Bay estuary, China. Sustainability 2018, 10, 1127. [Google Scholar] [CrossRef] [Green Version]
  67. Sun, Y.; Qin, Q.; Ren, H.; Zhang, T.; Chen, S. Red-edge band vegetation indices for leaf area index estimation from Sentinel-2/MSI imagery. IEEE Trans. Geosci. Remote Sens. 2020, 58, 826–840. [Google Scholar] [CrossRef]
  68. Hijmans, R.J. Package ‘Raster’. R Package Version 2.9-23. 2019. Available online: https://cran.r-project.org/web/packages/raster/index.html (accessed on 20 July 2019).
  69. Hayes, M.A.; Shor, A.C.; Jesse, A.; Miller, C.; Kennedy, J.P.; Feller, I. The role of glycine betaine in range expansions; protecting mangroves against extreme freeze events. J. Ecol. 2019, 108, 61–69. [Google Scholar] [CrossRef]
  70. Zheng, C.; Ye, Y.; Liu, W.; Tang, J.; Zhang, C.; Qiu, J.; Chen, J. Recovery of photosynthesis, sucrose metabolism, and proteolytic enzymes in Kandelia obovata from rare cold events in the northernmost mangrove, China. Ecol. Process. 2016, 5, 9. [Google Scholar] [CrossRef] [Green Version]
  71. Suwa, R.; Hagihara, A. Seasonal changes in canopy photosynthesis and foliage respiration in a Rhizophora stylosa stand at the northern limit of its natural distribution. Wetl. Ecol. Manag. 2008, 16, 313. [Google Scholar] [CrossRef]
  72. Suwa, R.; Khan, M.N.I.; Hagihara, A. Canopy photosynthesis, canopy respiration and surplus production in a subtropical mangrove Kandelia candel forest, Okinawa Island, Japan. Mar. Ecol. Prog. Ser. 2006, 320, 131–139. [Google Scholar] [CrossRef] [Green Version]
  73. Herberich, E.; Sikorski, J.; Hothorn, T. A robust procedure for comparing multiple means under heteroscedasticity in unbalanced designs. PLoS ONE 2010, 5, e9788. [Google Scholar] [CrossRef] [Green Version]
  74. Hothorn, T.; Bretz, F.; Westfall, P. Simultaneous inference in general parametric models. Biom. J. 2008, 50, 346–363. [Google Scholar] [CrossRef] [Green Version]
  75. Zeileis, A.; Köll, S.; Graham, N. Various versatile variances: An object-oriented implementation of clustered covariances in R. J. Stat. Softw. 2020, 95, 36. [Google Scholar] [CrossRef]
  76. Mfilinge, P.L.; Meziane, T.; Bachok, Z.; Tsuchiya, M. Litter dynamics and particulate organic matter outwelling from a subtropical mangrove in Okinawa Island, South Japan. Estuar. Coast. Shelf Sci. 2005, 63, 301–313. [Google Scholar] [CrossRef]
  77. Ye, Y.; Chen, Y.P.; Chen, G.C. Litter production and litter elemental composition in two rehabilitated Kandelia obovata mangrove forests in Jiulongjiang Estuary, China. Mar. Environ. Res. 2013, 83, 63–72. [Google Scholar] [CrossRef]
  78. Radabaugh, K.R.; Moyer, R.P.; Chappel, A.R.; Dontis, E.E.; Russo, C.E.; Joyse, K.M.; Bownik, M.W.; Goeckner, A.H.; Khan, N.S. Mangrove damage, delayed mortality, and early recovery following Hurricane Irma at two landfall sites in Southwest Florida, USA. Estuar. Coasts 2020, 43, 1104–1118. [Google Scholar] [CrossRef]
  79. Yang, S.; Li, Y.; Lin, P. Effect of soil salinity on cold tolerance of mangrove Kandelia candel. Chin. J. Oceanol. Limnol. 2005, 23, 98–103. [Google Scholar] [CrossRef]
  80. Zheng, C.; Liu, W.; Qiu, J.; Huang, L.; Huang, X.; Chen, S. Comparison of physiological characteristics of Kandelia obovata at different ages in winter in the northernmost mangrove transplanted area of China. Acta Ecol. Sin. 2013, 33, 132–138. [Google Scholar] [CrossRef]
  81. Mabry, C.M.; Hamburg, S.P.; Lin, T.-C.; Horng, F.-W.; King, H.-B.; Hsia, Y.-J. Typhoon disturbance and stand-level damage patterns at a subtropical forest in Taiwan. Biotropica 1998, 30, 238–250. [Google Scholar] [CrossRef]
  82. Lin, T.-C.; Hamburg, S.P.; Lin, K.-C.; Wang, L.-J.; Chang, C.-T.; Hsia, Y.-J.; Vadeboncoeur, M.A.; Mabry McMullen, C.M.; Liu, C.-P. Typhoon disturbance and forest dynamics: Lessons from a Northwest Pacific subtropical forest. Ecosystems 2011, 14, 127–143. [Google Scholar] [CrossRef]
  83. Osland, M.J.; Hartmann, A.M.; Day, R.H.; Ross, M.S.; Hall, C.T.; Feher, L.C.; Vervaeke, W.C. Microclimate influences mangrove freeze damage: Implications for range expansion in response to changing macroclimate. Estuar. Coasts 2019, 42, 1084–1096. [Google Scholar] [CrossRef]
  84. Song, W.; Feng, J.; Krauss, K.W.; Zhao, Y.; Wang, Z.; Lin, G. Non-freezing cold event stresses can cause significant damage to mangrove seedlings: Assessing the role of warming and nitrogen enrichment in a mesocosm study. Environ. Res. Commun. 2020, 2, 031003. [Google Scholar] [CrossRef]
  85. Magney, T.S.; Bowling, D.R.; Logan, B.A.; Grossmann, K.; Stutz, J.; Blanken, P.D.; Burns, S.P.; Cheng, R.; Garcia, M.A.; Kӧhler, P.; et al. Mechanistic evidence for tracking the seasonality of photosynthesis with solar-induced fluorescence. Proc. Natl. Acad. Sci. USA 2019, 116, 11640. [Google Scholar] [CrossRef] [PubMed] [Green Version]
  86. Mohammed, G.H.; Colombo, R.; Middleton, E.M.; Rascher, U.; van der Tol, C.; Nedbal, L.; Goulas, Y.; Pérez-Priego, O.; Damm, A.; Meroni, M.; et al. Remote sensing of solar-induced chlorophyll fluorescence (SIF) in vegetation: 50 years of progress. Remote Sens. Environ. 2019, 231, 111177. [Google Scholar] [CrossRef]
  87. Zhu, X.; Hou, Y.; Zhang, Y.; Lu, X.; Liu, Z.; Weng, Q. Potential of sun-induced chlorophyll fluorescence for indicating mangrove canopy photosynthesis. J. Geophys. Res. Biogeosci. 2021, 126, e2020JG006159. [Google Scholar] [CrossRef]
  88. Burrows, M.T.; Schoeman, D.S.; Buckley, L.B.; Moore, P.; Poloczanska, E.S.; Brander, K.M.; Brown, C.; Bruno, J.F.; Duarte, C.M.; Halpern, B.S.; et al. The Pace of Shifting Climate in Marine and Terrestrial Ecosystems. Science 2011, 334, 652–655. [Google Scholar] [CrossRef] [PubMed] [Green Version]
  89. Hickey, S.M.; Phinn, S.R.; Callow, N.J.; Van Niel, K.P.; Hansen, J.E.; Duarte, C.M. Is climate change shifting the poleward limit of mangroves? Estuar. Coasts 2017, 40, 1215–1226. [Google Scholar] [CrossRef]
  90. Wakushima, S.; Kuraishi, S.; Sakurai, N. Soil salinity and pH in Japanese mangrove forests and growth of cultivated mangrove plants in different soil conditions. J. Plant Res. 1994, 107, 39–46. [Google Scholar] [CrossRef]
Figure 1. Location of the eight mangrove stands in North-West Pacific (green) along with the major oceanic current and sea-surface temperature isotherms (gray lines, °C) of January 2021 [48,49]. The northern limits of the natural mangroves distribution in the western Pacific are denoted with the two blue dots in Fuding and southern Kyushu.
Remotesensing 13 02732 g001
Figure 2. Chronologies of the chlorophyll red-edge index (ChlRE), normalized difference infrared index (NDII), and minimum temperature (°C) from November 1 to March 1 for 2020–2021 winter (dark blue) and its baseline over 2015–2020 (light blue line) along with its standard variation (SD, light blue ribbon). The light grey bands depict the 2021 cold wave in the eight sites based on the three standard deviation threshold from the mean temperature. The ChlRE and NDII measured in 2015–2020 (light blue) are based on a 15-day moving maximum whereas the 2021 ChlRE and NDII are computed over a 7-day window. The temperature baseline is based on a 7-day moving average. The sites (ah) are arranged from the lowest to the highest mean temperature.
Remotesensing 13 02732 g002
Figure 3. Net change of the chlorophyll red-edge index (ChlRE) and normalized difference infrared index (NDII) between t1 (pre-cold wave) and t3 (one month after cold wave) in eight mangrove sites in East Asia. Letters denote statistical grouping (i.e., for each index different groups are significantly different) based on the procedure of Herberich et al. [73] that compares means of groups of unequal sizes and in absence of normal distribution (95% confidence intervals in Table S4).
Remotesensing 13 02732 g003
Figure 4. Mean change in chlorophyll red-edge index ( Δ ChlRE t 1 t 3 - net ) and normalized difference infrared index ( Δ NDII t 1 t 3 - net ) in seven East Asian mangrove stands a month after the 2021 cold wave event relative to the 2015–2020 baseline temperature in relation to mean minimum baseline temperature (i.e., 2015–2020) for the temporal period of the 2021 cold spell. The difference between the minimum temperature of 2021 cold event and the mean temperature of the same date range in 2015–2020 (i.e., Δ T min ) is shown by point color, and point size indicates the total number of cold days that occurred during the winters of the baseline period (2015–2020). All sites are dominated by K. obovata except Hailiao and Yanshui where A. marina is dominant (indicated in the first panel).
Remotesensing 13 02732 g004
Table 1. Characteristics of the eight sites and their associated meteorological stations. Species compositional and management data from [44,46,47,53].
SiteCoordinates
Latitude, Longitude
Dominant SpeciesWeather Station
NameElevation (m)Distance (km)
Danshui25.15266, 121.45770K. obovataDanshui191
Xinfeng24.90940, 120.96920K. obovata, A. marinaShiangshan1519
Hailiao23.11786, 120.09012A. marinaYongkang8.117
Yanshui23.00215, 120.15111A. marinaYongkang8.19
Japan
Tanegashima30.45068, 130.95517K. obovataKaminaka1507
Iriomote24.29597, 123.74971K. obovata, R. mucronata, Bruguiera gymnorhizaIriomotejima1015
China
Jiulongjiang24.44507, 117.91111K. obovata
Zhangjiang23.92832, 117.41522K. obovata, A. marina
Table 2. Mean and minimum recorded temperature for the 2021 winter (1 November 2020–1 March 2021), as well as corresponding winter mean and mean minimum temperature from the past five years (2015 to 2020) along with their standard deviations (SD). Dates for 2021 minimum temperatures are given. Δ T min is computed as the difference between the mean temperature for 2015–2020 baseline and the 2021 minimum temperature. A moving 7-day average was applied to the 5-year baseline daily temperatures to compute the mean temperature and the mean minimum temperature.
Site2021 Temperature (°C)2015–2020 Temperature (°C) Δ T m i n ( ° C )
MeanMinDateMean (±SD)Mean Min (±SD)Min
Tanegashima3.11.08 January12.37 (±2.12)10.19 (±2.18)−0.311.37
Iriomote11.610.38 January20.34 (±1.97)18.26 (±1.93)8.110.04
Danshui12.15.313 January16.38 (±3.02)13.83 (±3.15)3.811.08
Xinfeng11.23.013 January16.15 (±2.47)13.20 (±3.01)2.913.15
Yanshui13.67.910 January18.76 (±2.79)15.70 (±2.88)5.710.86
Hailiao13.67.910 January18.76 (±2.79)15.70 (±2.88)5.710.86
Jiulongjiang7.83.111 January14.46 (±2.77)11.82 (±3.34)1.0211.36
Zhangjiang7.02.98 January15.92 (±2.58)13.26 (±2.67)0.413.02
Table 3. Absolute VI change (standard error) for the chlorophyll red-edge index (ChlRE) and normalized difference infrared index (NDII) between t1 and t2 ( Δ VI t 1 t 2 = VI t 1 VI t 2 ) and between t1 and t3 ( Δ VI t 1 t 3 = VI t 1 VI t 3 ) for the 2015–2020 baseline and the cold wave of 2021, where t1 corresponds to the onset of the cold wave (December 16–30), t2 corresponds to the end of the cold wave (January 10–29), and t3 corresponds to the date approximately 30 days after the end of the cold wave (February 07–19). The 95% confidence intervals (95%CI) was calculated using bootstrapped comparisons of means as Δ VI 2021 Δ VI baseline (using 5000 iterations) are also given. Positive 95% CIs, not including zero, show statistically significant decreases in the VI value for the 2021 cold wave relative to the baseline, whereas negative 95% CIs, not including zero, show statistically significant increases in the VI for the 2021 cold wave relative to the baseline.
SiteΔVIt1t2ΔVIt1t3
2015–2020 Baseline202195%CI2015–2020 Baseline202195%CI
ChlRE
Tanegashima−0.19 (0.043)0.02 (0.014)0.12;0.300.08 (0.03)0.12 (0.02)−0.03;0.11
Iriomote0.22 (0.015)0.82 (0.015)0.56;0.641.13 (0.02)0.70 (0.02)−0.49;−0.37
Danshui−0.28 (0.021)−0.03 (0.018)0.19;0.30−0.19 (0.03)0.38 (0.03)0.48;0.64
Xinfeng0.52 (0.035)−0.17 (0.02)−0.77;−0.620.49 (0.03)0.30 (0.01)−0.26;−0.12
Yanshui−0.19 (0.028)0.79 (0.03)0.89;1.06−0.21 (0.03)1.22 (0.04)1.33;1.52
Hailiao−0.36 (0.040)0.67 (0.04)0.91;1.13−0.44 (0.04)1.53 (0.06)1.81;2.11
Jiulongjiang−0.54 (0.01)−0.13 (0.01)0.38;0.43−0.37 (0.01)0.80 (0.01)1.15;1.20
Zhangjiang0.49 (0.01)0.37 (0.01)−0.14;−0.100.32 (0.01)0.39 (0.01)0.05;0.09
NDII
Tanegashima0.05 (0.006)−0.0001 (0.002)−0.06;−0.040.02 (0.004)0.02 (0.004)−0.01;0.01
Iriomote−0.02 (0.002)0.01 (0.002)0.03;0.040.05 (0.002)0.02 (0.002)−0.04;−0.03
Danshui−0.05 (0.005)0.01 (0.002)0.05;0.07−0.04 (0.004)0.06 (0.004)0.09;0.11
Xinfeng−0.03 (0.003)0.02 (0.003)0.04;0.06−0.02 (0.004)0.06 (0.002)0.07;0.09
Yanshui−0.03 (0.002)0.03 (0.007)0.05;0.08−0.03 (0.002)0.06 (0.006)0.08;0.11
Hailiao−0.05 (0.002)0.08 (0.008)0.11;0.15−0.04 (0.003)0.17 (0.004)0.20;0.23
Jiulongjiang−0.05 (0.001)−0.01 (0.001)0.03;0.04−0.03 (0.001)0.03 (0.001)0.06;0.06
Zhangjiang0.02 (0.001)0.02 (0.001)−0.001;0.0040.03 (0.001)0.04 (0.001)0.002;0.01
Table 4. Net change (standard error) of the chlorophyll red-edge index (ChlRE) and normalized difference infrared index (NDII) between t1 and t2 ( Δ VI t 1 t 2 = VI t 1 VI t 2 ), and t1 and t3 ( Δ VI t 1 t 3 = VI t 1 VI t 3 ) for the eight mangrove sites in the East Asia, and their 95% confidence interval (95% CI) was calculated using bootstrapped comparisons on means as Δ VI t 1 t 3 Δ VI t 1 t 2 .
SiteChlRENDII
Δ V I t 1 t 2 - n e t Δ V I t 1 t 3 - n e t 95%CI Δ V I t 1 t 2 - n e t Δ V I t 1 t 3 - n e t 95%CI
Tanegashima0.21 (0.04)0.04 (0.03)−0.28;−0.06−0.05 (0.006)−0.004 (0.005)0.03;0.06
Iriomote0.60 (0.02)−0.43 (0.03)−1.09;−0.970.03 (0.002)−0.03 (0.003)−0.07;−0.06
Danshui0.25 (0.03)0.56 (0.04)0.22;0.410.06 (0.006)0.10 (0.005)0.02;0.05
Xinfeng−0.70 (0.04)−0.19 (0.03)0.41;0.600.05 (0.004)0.08 (0.005)0.01;0.04
Yanshui0.97 (0.04)1.43 (0.05)0.32;0.590.06 (0.008)0.09 (0.006)0.01;0.05
Hailiao1.02 (0.05)1.96 (0.10)0.72;1.160.13 (0.008)0.22 (0.007)0.07;0.11
Jiulongjiang0.41 (0.01)1.18 (0.02)0.74;0.810.04 (0.001)0.06 (0.001)0.02;0.03
Zhangjiang−0.12 (0.01)0.07 (0.01)0.16;0.220.002 (0.001)0.004 (0.001)−0.001;0.01
Table 5. Correlation coefficients between the chlorophyll red-edge index (ChlRE) and the normalized difference infrared index (NDII) before the cold wave of 2021 (t1) and for their net change between 30 days after the end of the 2021 cold wave (t3) and pre- and the post-cold wave values in the eight East Asian mangrove sites. p-values are indicated in parentheses next to Spearman’s ρ.
Site V I t 1 - 2021 Δ V I t 1 t 3 - n e t
Tanegashima0.73 (<0.01)0.29 (<0.01)
Iriomote0.18 (<0.01)0.29 (<0.01)
Danshui0.78 (<0.01)−0.10 (0.52)
Xinfeng0.90 (<0.01)0.61 (<0.01)
Yanshui0.71 (<0.01)0.03 (0.81)
Hailiao0.34 (0.01)−0.16 (0.19)
Jiulongjiang0.87 (<0.01)0.32 (<0.01)
Zhangjiang0.82 (<0.01)0.30 (<0.01)
Table 6. Results of the stepwise model selection based on Akaike information criterion (AIC) for the net variation of chlorophyll red-edge index and normalized difference infrared index by t3 ( Δ ChlRE t 1 t 3 - net and Δ NDII t 1 t 3 - net ). Input predictors before model selection were: mean minimum temperature baseline, the amplitude in temperature in comparison with baseline ( Δ T min ), and the number of cold days in the last five years using the same threshold.
PredictorEstimateSEt-Valuep
Δ C h l R E t 1 t 3 - n e t
Intercept5.980.1638.23<0.01
Mean minimum temperature baseline0.100.0111.56<0.01
Number of cold days baseline−0.010.01−19.22<0.01
Δ T min −0.520.01−39.15<0.01
Statisticsn = 1736; Residual standard error = 0.4226; df = 1732;
Mult. R2= 0.6744; Adj. R2 = 0.6738; F = 1196; p < 0.01;
AIC = −2986.30
Δ N D I I t 1 t 3 - n e t
Intercept0.130.027.01<0.01
Mean minimum temperature baseline0.020.00118.3<0.01
Number of cold days baseline−0.0010.0001−11.1<0.01
Δ T min −0.020.002−15.35<0.01
Statisticsn = 1736; Residual standard error = 0.0519; df = 1732;
Mult. R2= 0.3761; Adj. R2 = 0.3750; F = 348; p < 0.01;
AIC = −10,269.23
Publisher’s Note: MDPI stays neutral with regard to jurisdictional claims in published maps and institutional affiliations.

