Abstract
Recent observations of rising snow lines and reduced snow-covered areas on glaciers during the October 2020–January 2021 period in the Nepal–China region of Mount Everest in Landsat and Sentinel imagery highlight observations that significant ablation has occurred in recent years on many Himalayan glaciers in the post-monsoon and early winter periods. For the first time, we now have weather stations providing real-time data in the Mount Everest region that may sufficiently transect the post-monsoon snow line elevation region. These sensors have been placed by the Rolex National Geographic Perpetual Planet expedition. Combining in situ weather records and remote sensing data provides a unique opportunity to examine the impact of the warm and dry conditions during the 2020 post-monsoon period through to the 2020/2021 winter on glaciers in the Mount Everest region. The ablation season extended through January 2021. Winter (DJF) ERA5 reanalysis temperature reconstructions for Everest Base Camp (5315 m) for the 1950–February 2021 period indicate that six days in the January 10–15 period in 2021 fell in the top 1% of all winter days since 1950, with January 13, January 14, and January 12, being the first, second, and third warmest winter days in the 72-year period. This has also led to the highest freezing levels in winter for the 1950–2021 period, with the January 12–14 period being the only period in winter with a freezing level above 6000 m.
1. Introduction
A six-decade-long mass record of glaciers in the Mount Everest region compiled by [1] found increasingly negative balances each decade, with thinning evident at an elevation up to 6000 m. The mass balance loss has been driven by increased summer ablation and rising freezing levels during the summer monsoon [2,3]. The higher freezing line during the summer monsoon identifies that the elevation where frozen precipitation predominates in the area has risen to 5400 m [4].
Mount Everest glaciers are summer accumulation-type glaciers with approximately 75% of annual precipitation occurring during the summer monsoon period [4,5]. The summer monsoon period is also the period with the highest melt rates at lower elevations on the glaciers. October has been considered the end of the melt season in the region, with little precipitation in the post-monsoon and early winter season (October–December), averaging ~3% of the total annual precipitation [4]. Winters (DJF) are characterized as cold and dry, though they do have the most variable precipitation [6]. Ablation was observed in winter on the Mera Glacier at all elevations due to wind erosion and sublimation [5].
The higher snow line at the end of summer monsoon season, combined with warmer post-monsoon and early winter conditions, can drive a snow line to rise from October into the winter on Himalayan glaciers, thus extending the melt season [7,8]. For the first time, we now have weather stations providing real-time data in the Mount Everest region that are high enough to transect the region of post-monsoon snow line elevation. These sensors have been placed by the 2019 National Geographic and Rolex Perpetual Planet expedition. Combining in situ weather records with reanalysis and remote sensing data provides a unique opportunity to examine and contextualize the impact of the exceptional warm and dry conditions during the 2020 post-monsoon period through to the 2020/2021 winter on glaciers in the Mount Everest region, including a warm January event that generated the highest winter temperatures in the last 70 years in the region (Figure 1). A rising snow line elevation on glaciers in the region from October through to mid-winter would indicate significant ablation occurs during the first half of the winter season on glaciers in the Mount Everest region at elevations up to the snow line.
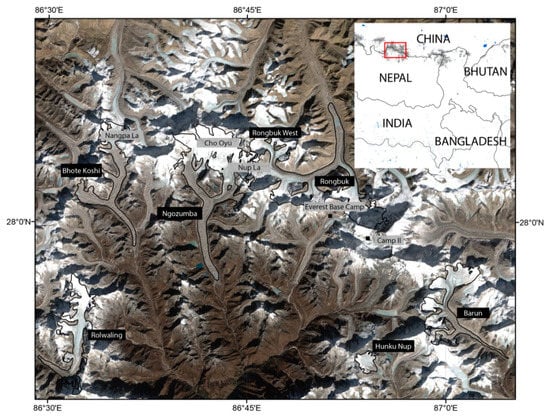
Figure 1.
Field area indicating glaciers observed, weather stations, and landmarks labeled on a Landsat true color image from 16 December 2020.
2. Material and Methods
2.1. Weather Condition Observations and Modeling
Local observations of weather conditions at automatic weather stations (AWSs) combined with Landsat 8 and Sentinel-2 images during the October 2020–January 2021 period allow the identification of conditions that led to observable ablation on glaciers.
The new AWS network on Mount Everest has been detailed fully in [9]. Here, we use winter (December–February of 2019–2020) records of the daily maximum temperature from Everest Base Camp (EBC: 5315 m) and Camp II (6464 m). We also reconstruct daily maximum winter temperatures at these sites for 1950–2018 using the ERA5 reanalysis and the empirical quantile-mapping bias correction employed by [7]. Specifically, we linearly interpolate hourly air temperature with pressure levels to the latitude, longitude, and elevation of the EBC and Camp II AWSs, compute daily maxima, and then bias correct these results to the AWS observations using the empirical quantile-mapping procedure employed by [9]. A continuous 1950–2021 series was produced by appending the observed series (2019–2021) on to these (bias corrected) ERA5 data. The elevation of the zero-degree isotherm () could then be computed from the following equation:
where is the daily maximum air temperature at the EBC AWS and is the lapse rate (°C m−1), which is computed as the difference in the daily maximum temperature at the EBC and Camp II AWSs, divided by the 1149 m of elevation that separates them.
2.2. Remote Sensing Methods
During the 13 October 2020–27 January 2021 period, 6 Landsat 8 and 16 Sentinel-2 images were used to assess snow line elevation on six glaciers and the snow/ice covered area ratios on two glaciers.
We utilized freely accessible, orthorectified, and georeferenced Landsat 8 OLI, and Sentinel-2 scenes to observe the snow lines on selected glaciers that had lower slopes, limited shading, and no icefall in the area of snow line determination. All Landsat satellite images used were level 1 terrain-corrected Landsat products, and Mount Everest is located in path/row 140/41. The images are pan-sharpened Tier 1 images which contain the highest quality level 1 terrain precision (L1TP) data. The geo-registration is consistent and within prescribed tolerances for Landsat 8 OLI/TIRS products with a <12 m root-mean-square error (RMSE) [10]. For Sentinel-2, Mount Everest is in tile 45RVL. Sentinel-2 is a wide swath, high resolution, multispectral imaging instrument which contains 13 spectral bands representing TOA reflectance. Each level 1C product is a 100 km x 100 km tile with a UTM/WGS84 (Universal Transverse Mercator/World Geodetic System 1984) projection and datum. The Sentinel-2 product is a simulated natural color composite image created from three selected bands (11, 8A, 4) with a ground resolution of 20 m. Sentinel-2 data products include a full resolution true color image as a RGB (red, green, blue) composite image created from bands 4, 3, and 2 [11].
The snow line was determined manually by means of the visual separation of bare ice and snow, which is less error-prone than automatic classification and is practical when applied to a limited number of glaciers in a limited number of scenes [12,13,14,15]. The SRTM DEM was utilized for elevation determination. On two glaciers (Hunku Nup and Rolwaling) the snow-covered areas were determined automatically for Sentinel-2 images using a script developed and validated by [16]. This application in Google Earth Engine classifies glacier surfaces over time and extracts information regarding the snow cover ratio and the snow line altitude using Landsat and Sentinel imagery [16]. The snow cover ratio is a separate measure of the same parameter as SLA. In terms of the melt rate, it is a more important measure when considering the different melt rates for snow and ice under melt conditions. The script utilizes the ALOS DEM (Advanced Land Observing Satellite) which has a resolution of approximately 30 m and was generated from a stereo mapping sensor operated from 2006 to 2011. For this application, in the first step, a glacier is classified for snow, ice, debris cover, water, clouds, and shadows. Subsequently, the SLA (snow line altitude) is extracted based on the main patches approach, whereby the SLA is determined as the median altitude of the pixels at the intersection of the largest patches of snow and ice. The snow cover ratio (SCR) is the area classified as snow in proportion to the total area of the glacier.
3. Results
3.1. Glacier Snow Line and SCR Observations
Landsat imagery acquired on 13 October 2020 indicates the snow line on Mount Everest glaciers averaged 5718 m (Figure 2 and Figure 3; Table 1). This is slightly above the observed mean freezing level during precipitation events during the June–September 2020 period of 5554 m [4]. The snow-covered areas on the Hunku Nup Glacier and Rolwaling Glacier were approximately 75% and 66% respectively. At EBC there were eight days with a maximum temperature of at least 1 °C during November and December 2020. By 16 December 2020, the mean snow line had risen to 5889 m on the examined glaciers (Figure 4; Table 1). The snow-covered areas on Hunku Nup Glacier and Rolwaling Glacier had declined to 70% and 55%, respectively, by late December in 2020. On 17 January 2021, the mean snow line had risen to 5929 m (Figure 3 and Figure 4; Table 1), indicating that melt conditions were dominant in this elevation range during this period of the winter season.
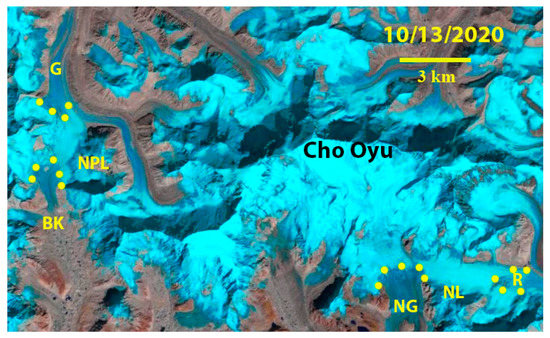
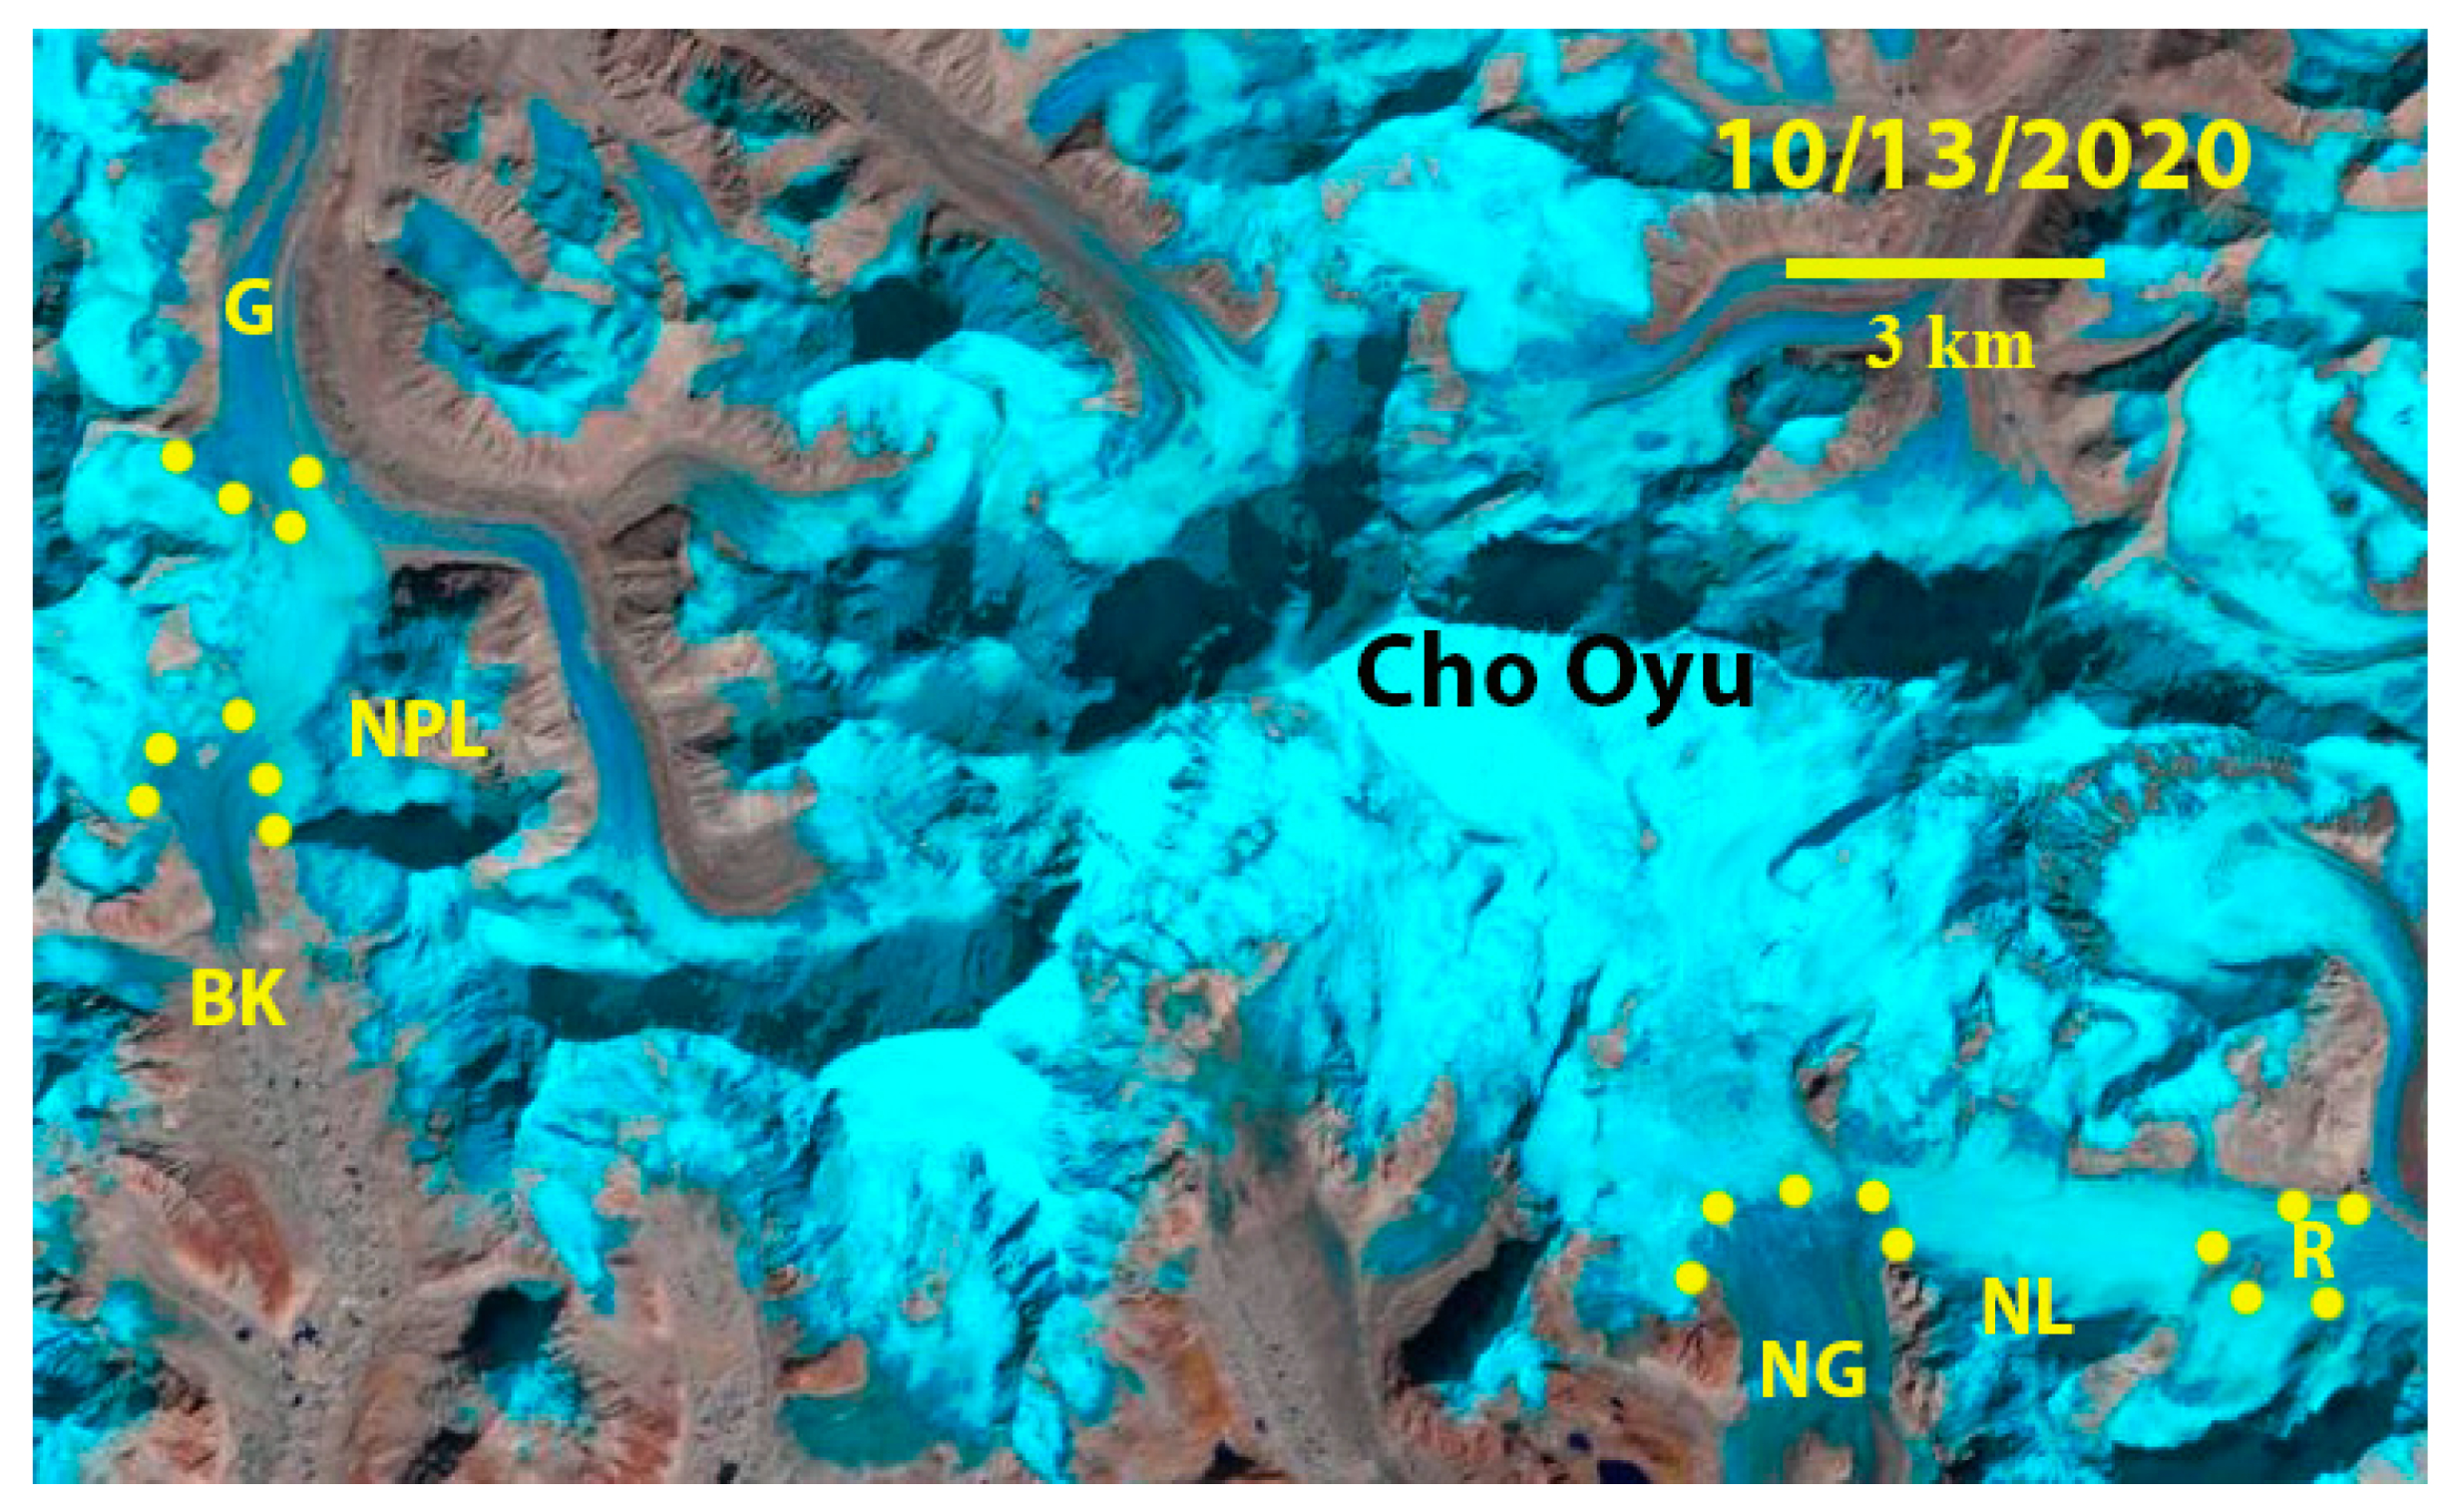
Figure 2.
Glacier snow line on Mount Everest glaciers on 13 October 2020 as per a Landsat image. NG = Ngozumpa Glacier; NL = Nup La; R = Rongbuk West Glacier; NPL = Nangpa La; G = Gyabrag Glacier and BK = Bhote Koshi Glacier. Yellow dots mark locations of snow line elevation determination.
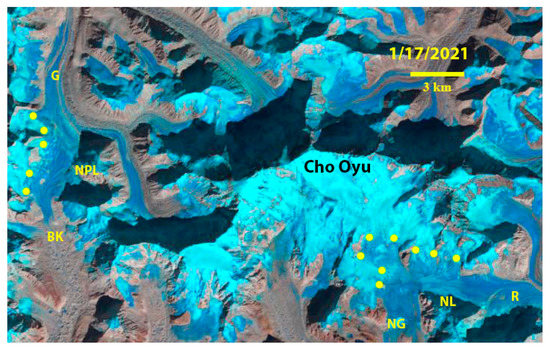
Figure 3.
Glacier snow line on Mount Everest glaciers on 17 January 2021 as per a Landsat image. NG = Ngozumpa Glacier; NL = Nup La; R = Rongbuk West Glacier; NPL = Nangpa La; G = Gyabrag Glacier and BK = Bhote Koshi Glacier. Yellow dots mark locations of snow line elevation determination.

Table 1.
Snow line elevation (meters above sea level) on selected glaciers from Landsat image observations indicating the increase both from October 2017 to February 2018 and from October 2020 to January 2021.
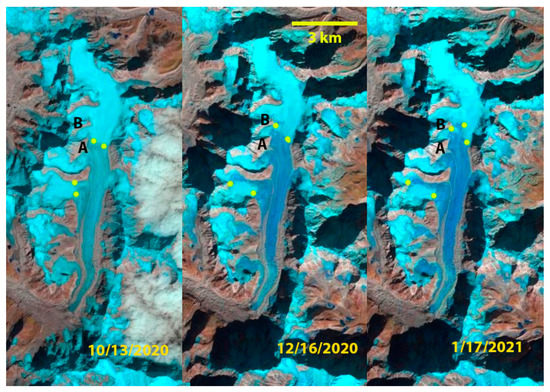
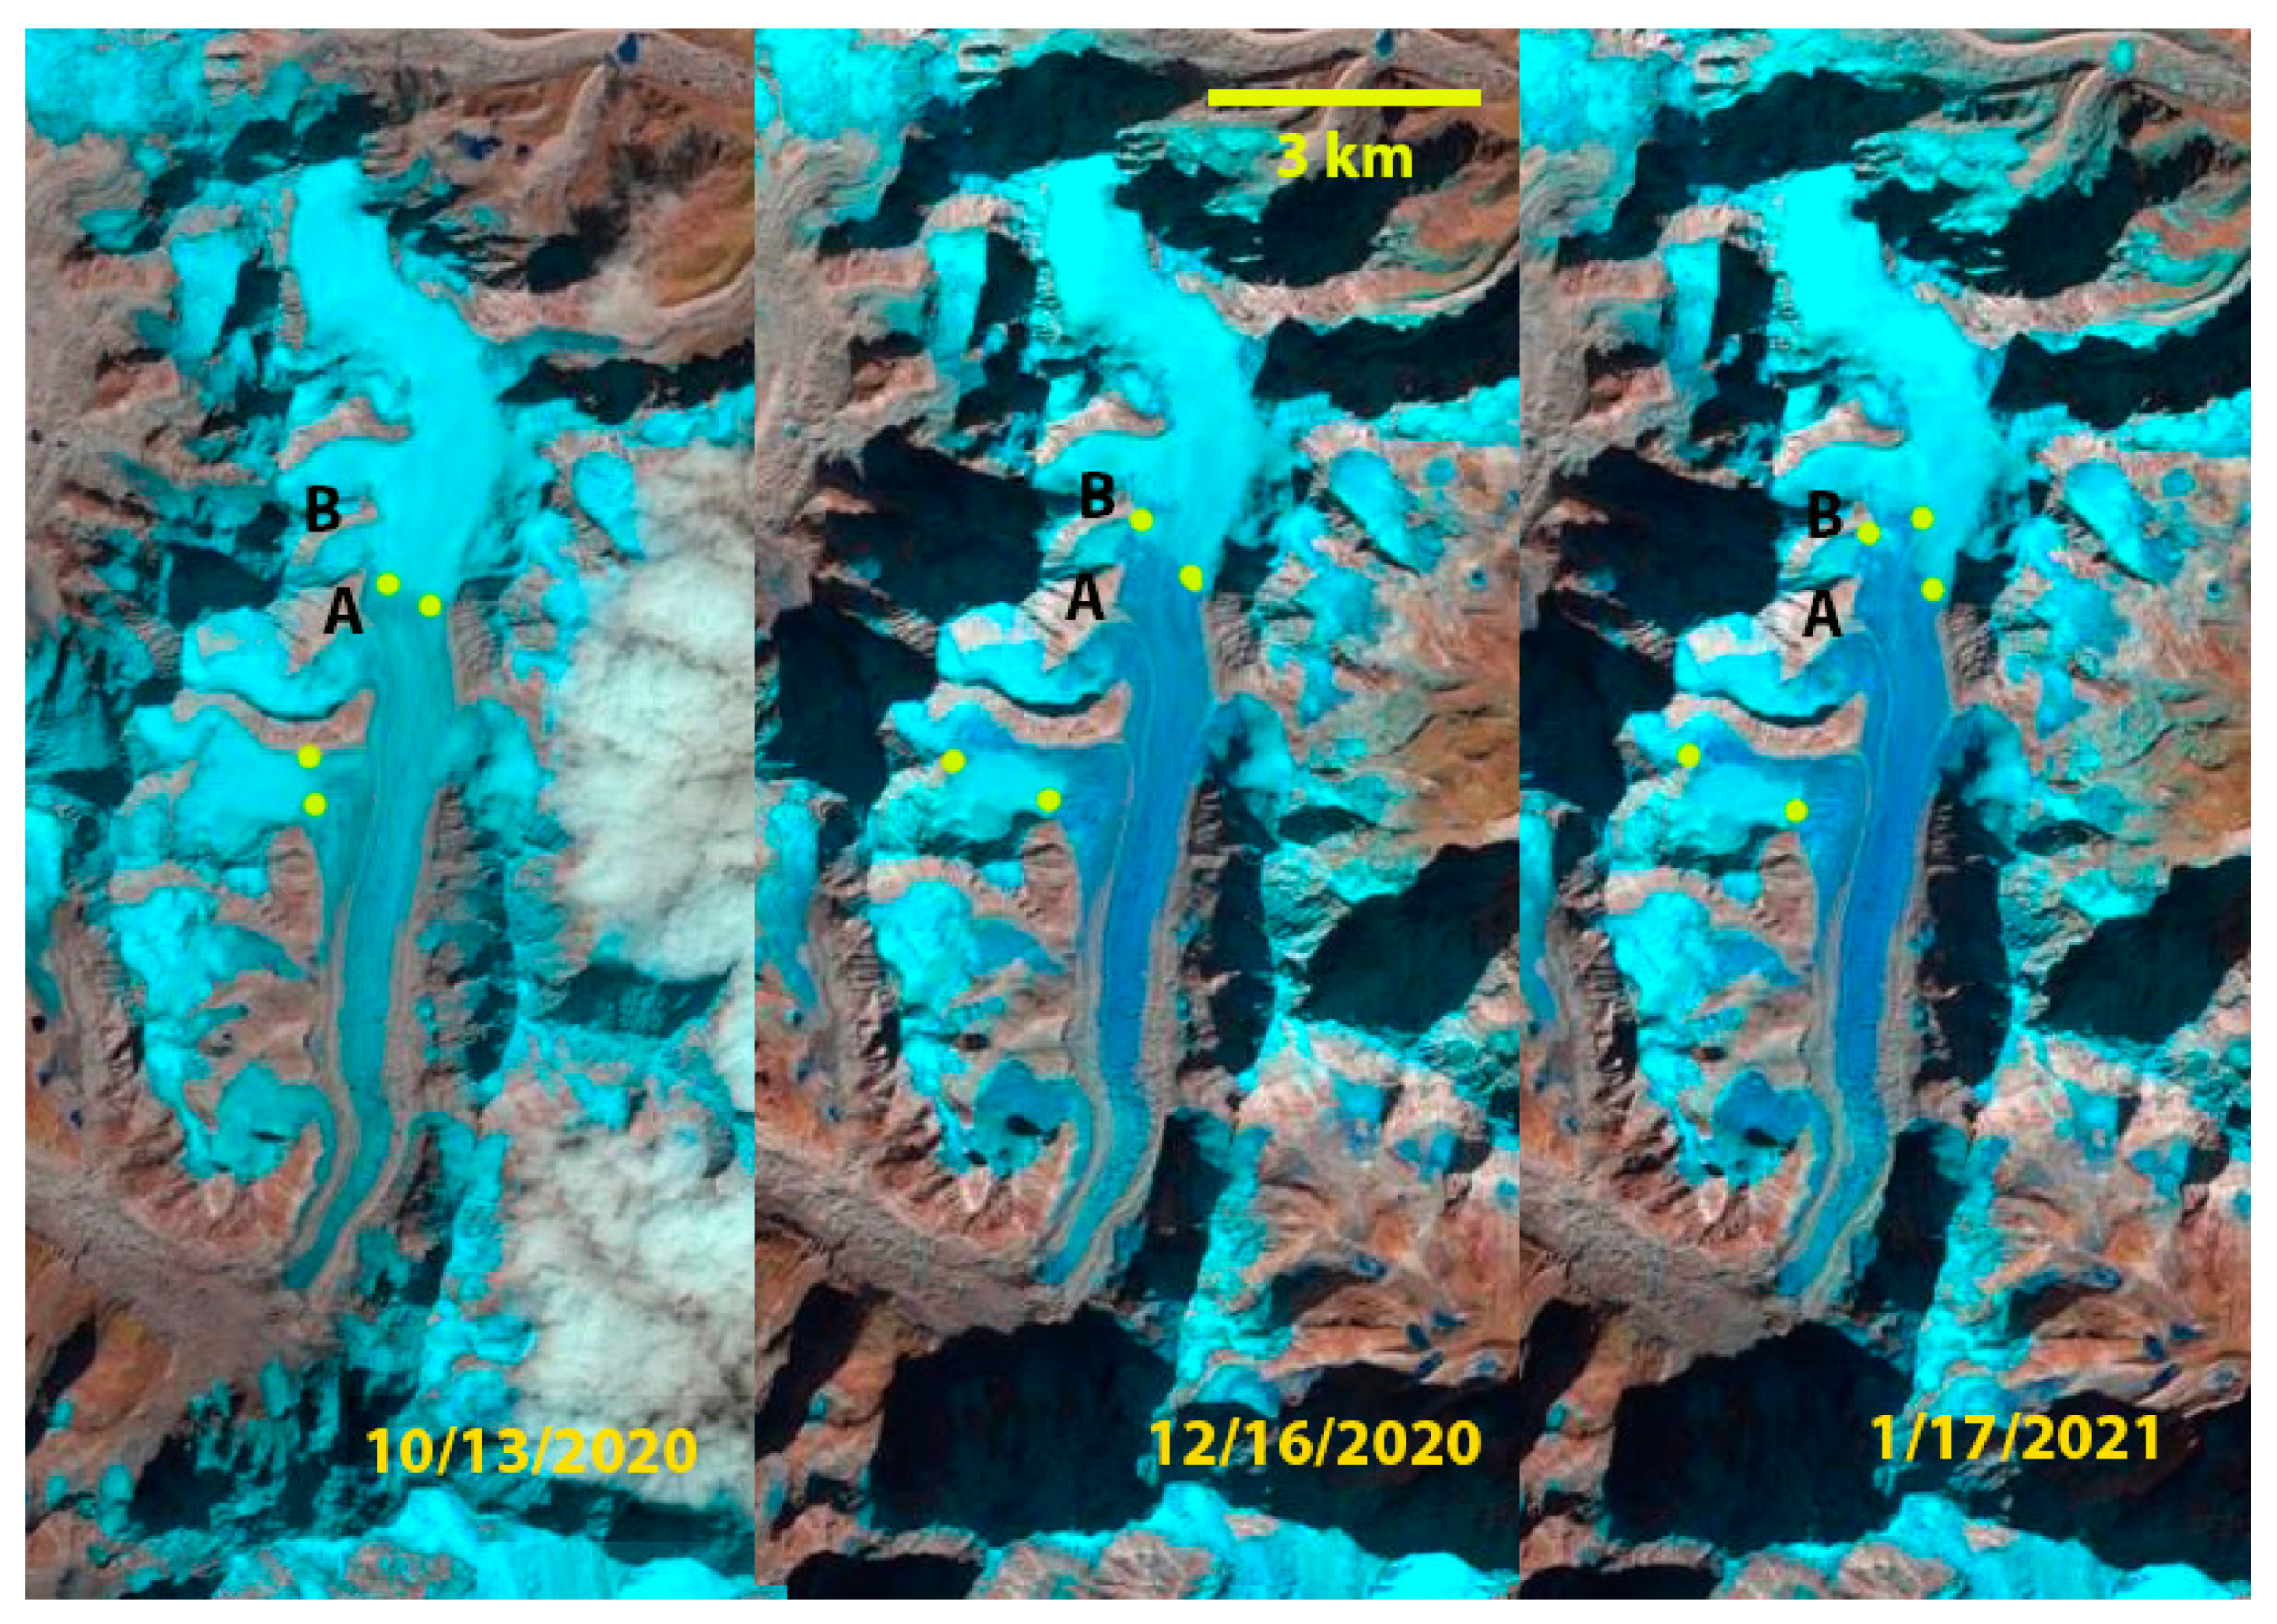
Figure 4.
Transient snow lines on Rolwaling Glacier in Landsat images from 13 October 2020, 16 December 2020, and 17 January 2021. Yellow dots mark locations of snow line elevation determination.
The Landsat image for 1 January 2021 indicated no appreciable change in the snow line over the last two weeks of December (Figure 5a). On 4–5 January 2021, a minor snow event (1.8 mm water equivalent precipitation at Everest Base Camp) covered the glaciers. A Sentinel-2 image from 7 January 2021 indicated new snow cover on most glacier areas in the 5000–5900 m region (Figure 5b). This snow cover was subsequently ablated during an unusually warm period that extended from 10–15 January 2021 as evidenced by the 17 January 2021 Landsat 8 image (Figure 5c) and 22 January 2021 Sentinel-2 image. Both images indicate the snow line elevation increased by 25–75 m from the 16 December and 1 January positions near Nangpa La on the Bhote Koshi Glacier, near Nup La on the Ngozumpa Glacier, and Rolwaling Glacier. The snow line for the 17–22 January period averaged 5929 m, representing a 210 m rise since 13 October, and a 40 m rise since 16 December (Table 1). The snow-covered areas of Hunku Nup and Rolwaling Glacier had declined to 65% and 53%, respectively, by 22 January 2021 (Figure 6). The rise in snow line elevation and decrease in snow covered area from the 13 October–22 January indicate that the ablation season continued well into the winter season.
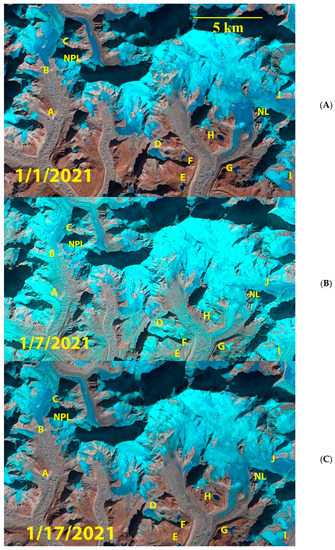
Figure 5.
Nanpa La, Cho Oyu, and Nup La regions: (A) 1 January 2021 Landsat image. A-J are specific locations for comparison between the three images. Point C is near Nangpa La (NPL); point J is near Nup La (NL); points A and B are locations on Bhote Koshi Glacier. Points D-I are locations on or adjacent to Ngozumpa Glacier. (B) 7 January 2021 Sentinel-2 image after snowfall on 4–5 January. (C) 17 January 2021 Landsat image after the period of record January warmth ablated the snow that fell on 4–5 January and further raised the snow line in some areas from 1 January.

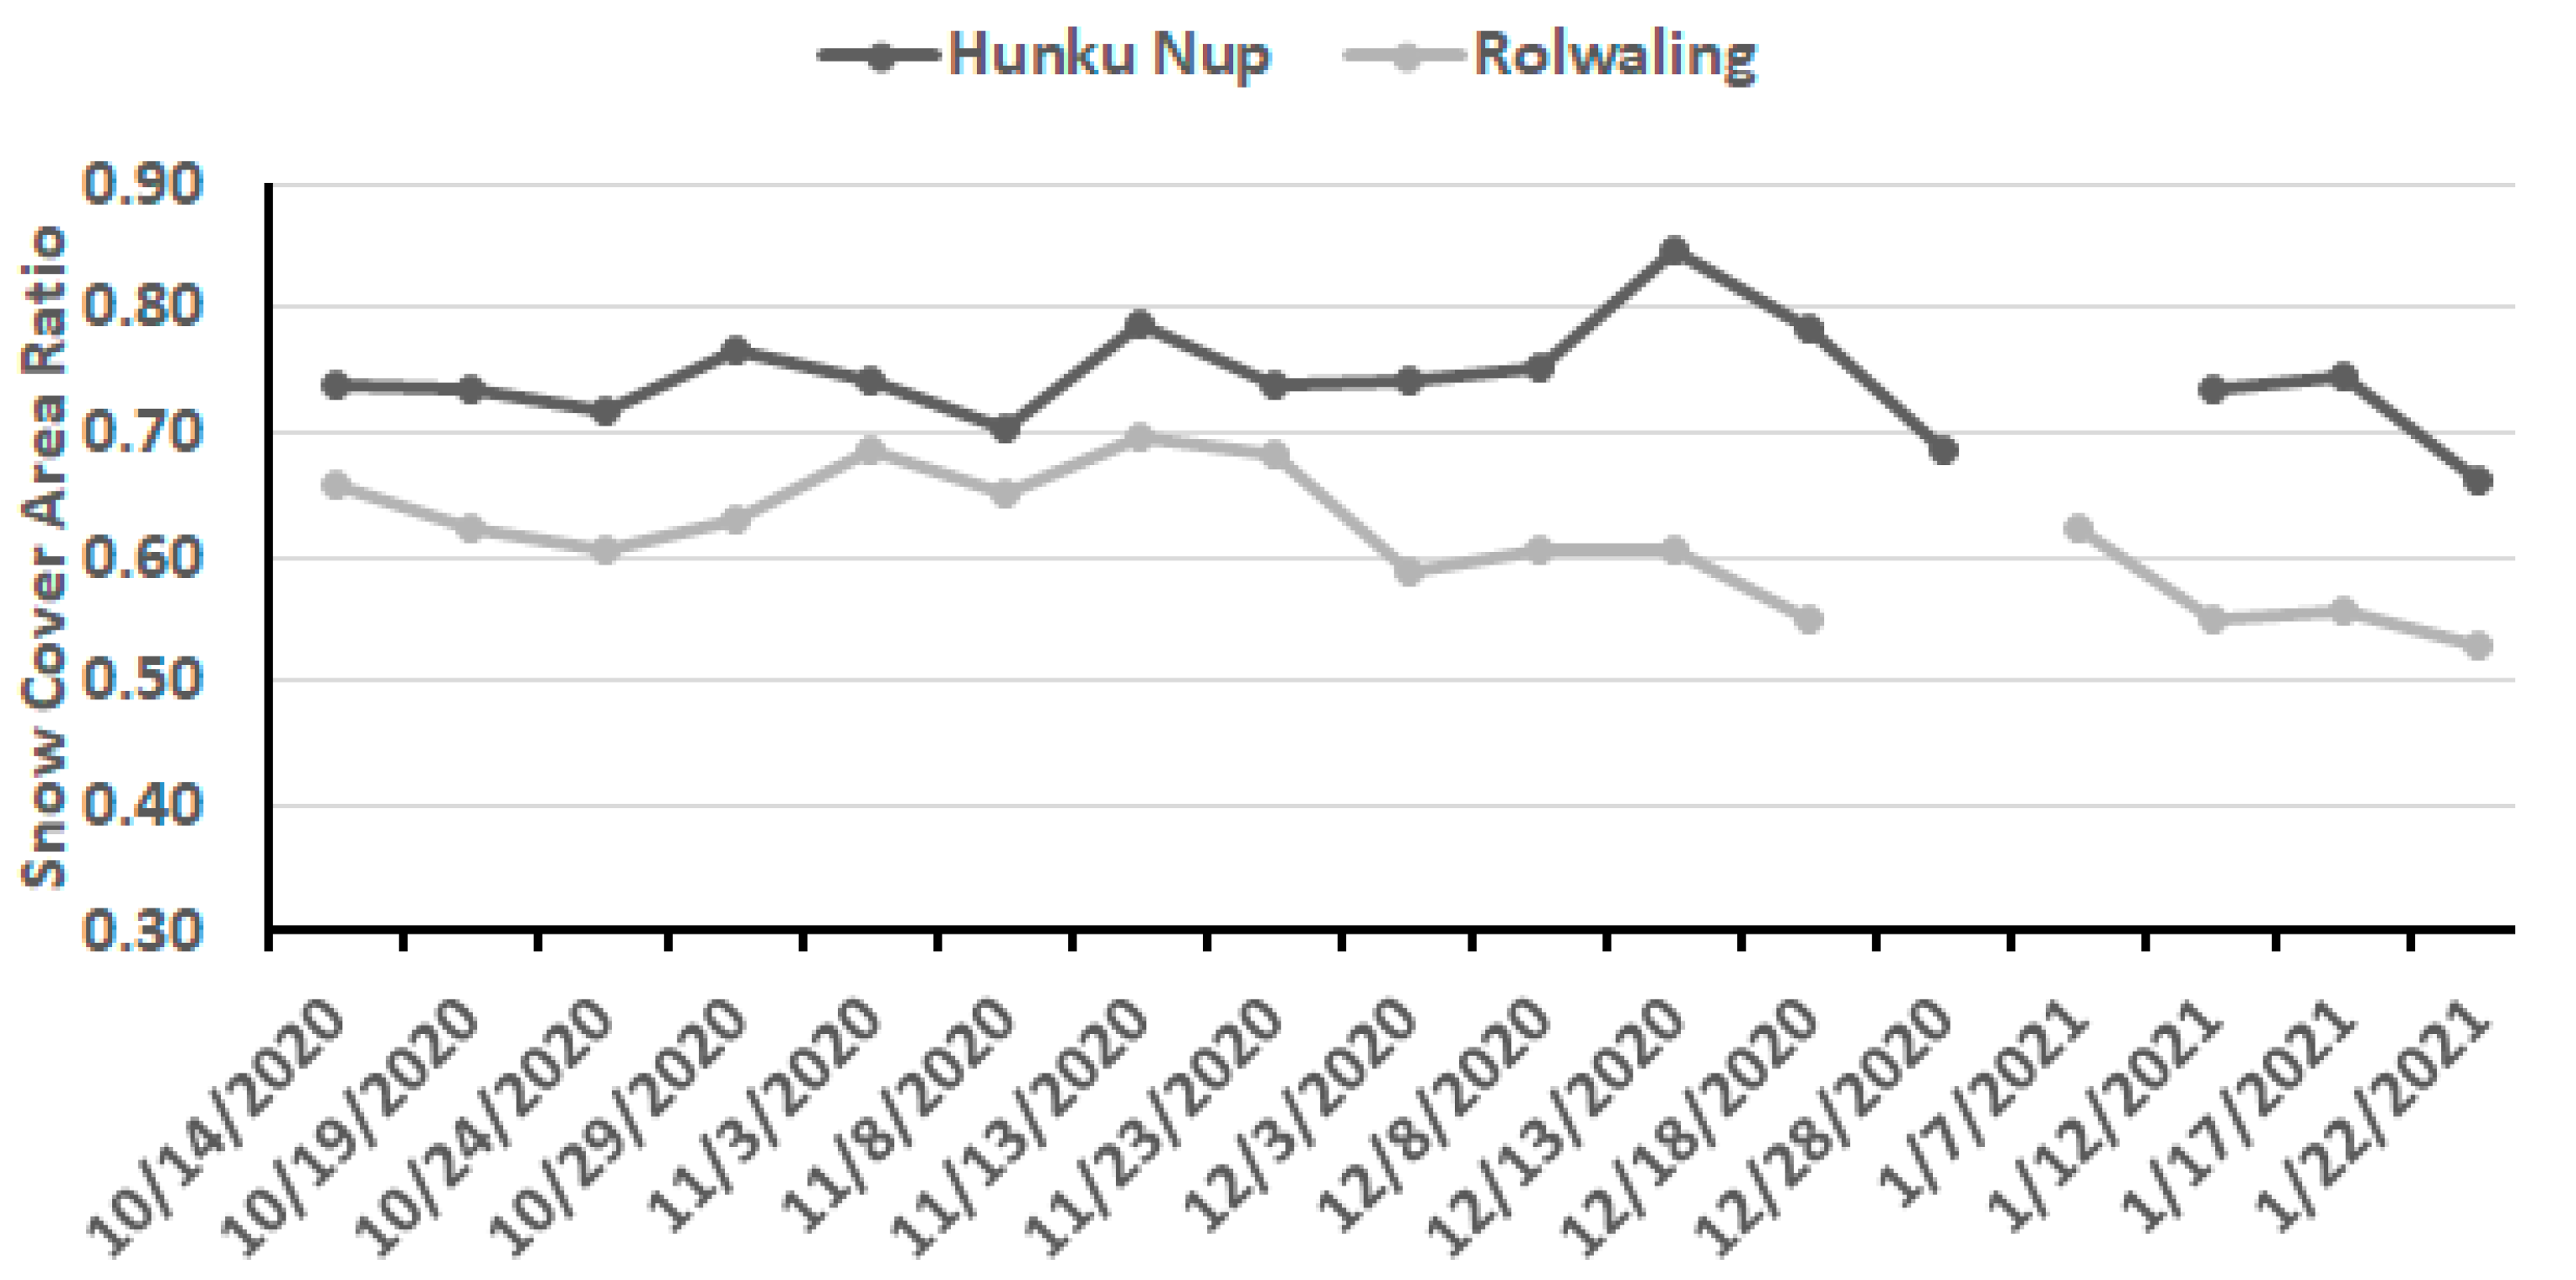
Figure 6.
Snow covered area on Hunku Nup Glacier and Rolwaling Glacier in Sentinel-2 imagery from 14 October 2020 to 22 January 2021.
3.2. Weather Observations
During the six-day January thaw, the daily maximum temperature reached 3 °C at EBC at 5315 m each day, peaking at 7 °C on 13 January. The average maximum temperature was 5 °C. At the Camp II weather station at 6464 m, temperatures reached above –4 °C each day during this period, with a maximum of 1 °C on the 10th and 13th of January. From 9–22 January the EBC maximum temperature exceeded 0 °C on eight days (Figure 7). The daily maximum freezing line during the six-day melt event given the winter lapse rate of ~0.8 °C/100m is 5940 m [17]. This indicates melting was extremely likely in the vicinity of the snow line (Figure 8), particularly as the high levels of insolation typical in the Western Cwm can drive surface melting when air temperatures are below 0 °C [7]. In winter (DJF), only three days since 1950 have had a freezing level that exceeded 6000 m, and all occurred during the 12–14 January 2021 period. The highest freezing level was 6211 m on 13 January 2021.
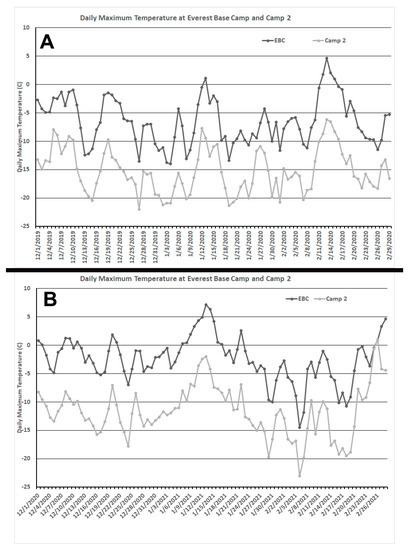
Figure 7.
Daily maximum temperature at Everest Base Camp and Camp 2 for the winter seasons of (A) 2019/2020 and (B) 2020/2021.

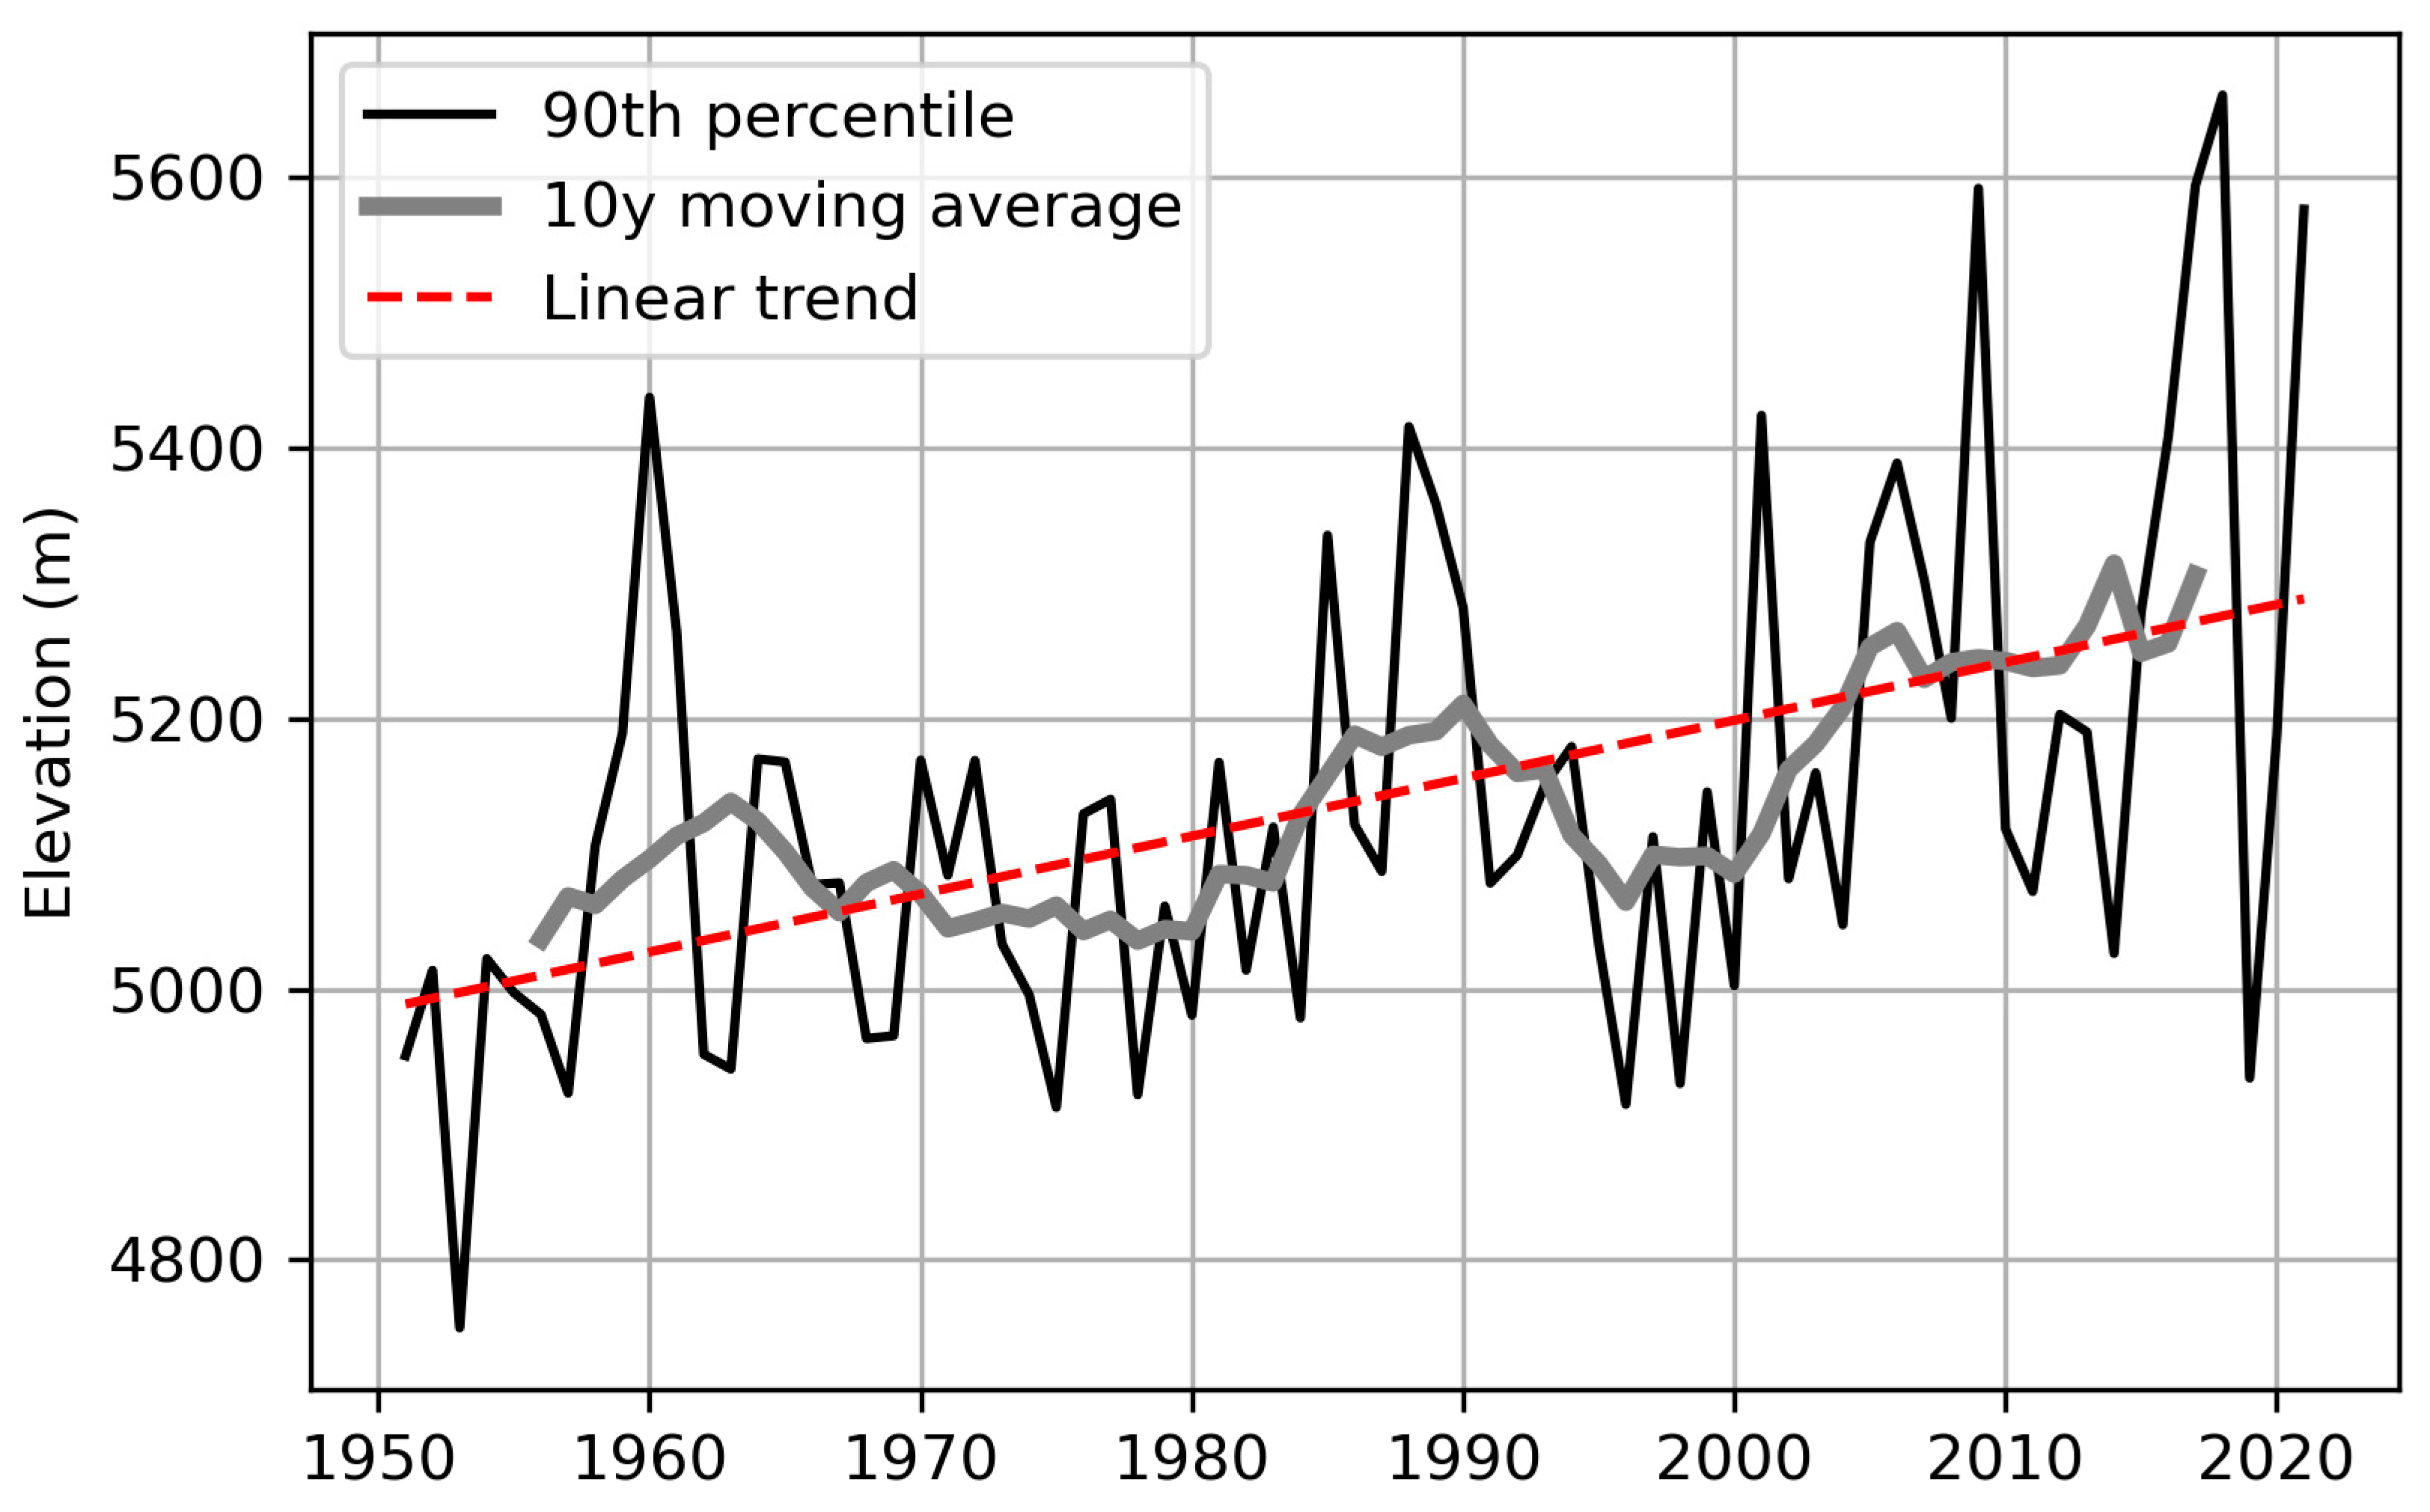
Figure 8.
Mean daily maximum winter season freezing level from 1950–2021 (black line) based on bias-corrected ERA-5 temperatures (1950–2018) and observations (2019–2020) for Everest Base Camp and Camp II daily temperatures and daily lapse rate. Bold grey line is the 10-year moving average and the dashed red line is the linear trend.
Confidence in our ERA5 reconstruction is underpinned by strong agreement between the observed and bias corrected series with (Pearson) correlation coefficients of 0.97 and 0.98 at EBC and Camp II, respectively. We estimate the uncertainty in the reconstructions (± one standard deviation of the errors) as 1.33 °C (EBC) and 1.37 °C (Camp II).
The resulting 1950–2021 winter series indicates that the days in the 10–15 January 2021 period all fell in the top 1% of all winter days since 1950 at EBC, with 13 January (7.1 °C), 14 January (6.3 °C), and 12 January (4.9 °C), being the first, second and third warmest winter days in the 72-year period. We estimate that the highest temperature during 1950–2018 occurred on January 11, 2018 (4.6 °C); however, the reconstructed temperatures are subject to uncertainty. We thus used the (1.33 °C) standard deviation of the error distribution and the assumption of normally distributed errors to estimate the probability that this reconstructed temperature exceeded the warmth recorded in 2019. The results indicate a 3%, 10%, and 41% chance that 11 January 2018 experienced a higher air temperature than the 13th, 14th, and 12th of January, respectively. The temperatures at EBC during January 2021 (particularly on the 13th) do therefore appear exceptional when viewed in a multi-decadal context. We caveat that the reduced observational quality earlier in ERA5 likely translates to greater uncertainty in the earlier part of the reconstruction [18], so the record-breaking nature of the 2021 winter heat should not be overstated.
Assessing the 1950–2021 reconstruction for episodes of persistent warmth, we identify 14 periods with at least five consecutive days where the maximum temperature exceeded 1 °C at EBC, of these six have occurred from 2014–2021 (1971/72, 1988/89, 1989/90, 1992/93, 2000/01, 2007/08, 2008/09, 2011/12, 2014/2015, 2 in 2016/17, 2 in 2017/2018, and 2021/2021). There have been only five such periods in winter where the maximum temperature averaged at least 3 °C: 2011/12, 2014/15, 2016/17, 2017/18, and 2020/21, with just one exceeding 4 °C, that being 10–15 January 2021 at 5 °C (Table 2). Each of these five periods is sufficient to generate a significant melt up to at least 5700 m (Table 2). The winter of 2018 featured the most days (17) with temperatures above 1 °C at EBC in the ERA5 1950–2021 reconstruction, with 14 days in the winter of 2021 reaching that temperature according to the EBC weather station.
Table 2.
The timing of mean temperature and mean freezing level of the only five periods in winter with an average temperature above 3 °C since 1951 at Everest Base Camp.
4. Discussion
4.1. Ablation Season Duration
In previous studies, winter ablation was assumed to only be significant near the terminus of glaciers on the southern flank of Mount Everest [19]. Glacier mass balance models typically have not accounted for potential winter ablation over most of the elevation range of a glacier [20,21]. Examination of the mass balance of Changri Nup Glacier led [22] to the conclusion that the winter mass balance is close to zero at all elevations, which is based on the 2010–2015 period. The assumption that the ablation season ends in October and insignificant ablation occurs in winter appears appropriate prior to the last decade. It is acknowledged that sublimation did occur in winter, but that it was secondary to winter accumulation [23,24].
During the four winters surveyed from 2009–2012 at 5505 m on Mera Glacier in the Dudh Koshi Basin, the authors of [5] noted that ablation was significant in the ablation zone ranging from −0.1 to −0.5 m. Wind and sublimation were observed as important ablation processes for Rikha Samba Glacier in Nepal in winter [23]. This indicates that, at least in recent years, we now need to account for winter ablation on Himalayan glaciers when determining an annual mass balance. The authors of [4] identified that ablation is ongoing in winter on the Khumbu Glacier. This is evident for the post-monsoon period of 2017 through late winter of 2018, where the snow line rose from an average of 89 m from a mean of 5836 m on 21 October 2017 to 5925 m on 10 February 2018, indicating ablation up to ~5900 m (Table 1). The snow line rose an average of 211 m from 13 October 2020 to 17 January 2021, with freezing levels indicating ablation to ~6000 m.
4.2. Equilibrium Line and Snow Line Altitude
Mass balance modeling identifies a basin-wide ELA of 5500 m for Dudh Koshi [20]. ELA values of ~5500 m on the Mera Glacier and Naulek Glacier have been reported by [5]. The authors of [19,24] identified a snow line altitude rise from 5289 m in 1962 to 5471 m in 2011 on the south side of Mount Everest. The authors of [25] reported that on West Kangri Nup Glacier, which is a tributary to the Khumbu Glacier, in the 5400–5500 m range, significant accumulation is no longer being retained through the summer monsoon. The work in [26] considered Rolwaling (Trambau) Glacier and observed an ELA at 5770 m to 5830 m during October 2016–2018. The work in [6] noted that from 2008–2016, the ELA on Mera Glacier observed in October ranged from 5335–5680 m, and then rose to above 5700 m each year from 2017–2019. A cumulative rise between 1962 and 2011 of 182 m was reported for the region [24]. The rising SLA trend led to an SLA of ~5600 m on several glaciers in the Dudh Koshi basin near Lobuje, Imja, and Kangri by 2011 [24]. The recent high snow line on Mera Glacier is indicative of the approximate 100-m rise in the summer freezing level since 1980 as indicated by ERA5 for the June, July, August, and September (JJAS) freeze heights [4]. On the Middle Lhonak Glacier, east of the study region, rising snow lines have been reported from October into December [7]. Rising freeze heights likely indicate a higher frequency of liquid precipitation in glacier ablation zones and higher ELA values for glaciers.
The higher snow line at the end of the summer monsoon, combined with warmer post-monsoon and early winter conditions, has led to a snow line rise from October into mid-winter in the winter of 2017/2018 and 2020/2021 in the Mount Everest region (Table 1). In both cases, the SLA is above 5900 m. The mean snow line on 10 February 2018 is approximately the same as that for 17 January 2021, indicating that the 2021 mid-winter high glacier snow line altitude is not unprecedented.
4.3. Changing Ablation Area
The rising snow line is expanding the ablation zone upward. When combined with an expanded ablation season, this can further increase thinning, particularly in areas above extensive debris cover and immediately below the snow line. The work in [27] indicated that the thinning on Khumbu Glacier was greatest in the area of thin/patchy debris cover where the cover increases melt in the range of 5100–5250 m. The work in [1] found the highest thinning rates of ~1 ma−1 in the 5300–5500 m range for land-terminating debris covered glaciers in the region from 1984–2018. This elevation range is typically above thick debris cover and is in the zone that transitions from thin debris cover to clean ice. They observed thinning of 10–15 m during the 1984–2019 up to 5700 m on the south side of the divide, such as on Khumbu Glacier [1]. For clean glacier ice, the thinning rate for the 2000–2008 period in the 5000–5150 m range is higher (1.5–2 m a−1) [28]. Most of the glacier surface is covered by debris in this area and has a thinning rate of less than 1 m a−1 [28]. This high thinning rate is both because of the lower albedo of ice increasing the amount of solar radiation absorbed versus snow cover and the lack of a sufficiently thick debris cover to be insulating. On all larger Mount Everest glaciers, debris cover is extensive. The region of the glacier where the SLA was observed to rise from October into winter in 2017/2018 and 2020/2021 is above the zone where debris cover is common [27] and is a zone that typically was snow covered and now commonly features bare ice. The work in [29] identified a reversed mean surface-mass-balance gradient on the low-elevation portions of these glaciers, switching to a positive mean gradient of above an average elevation of 5520 ± 50 m. The reverse balance gradient occurs in the transition zone from debris cover to clean ice. We also note that melt rates on Mount Everest are extremely sensitive to albedo (and therefore surface type) due to the extreme insolation, with the results of [7] suggesting a typical ice surface ablating approximately eight times faster than snow. The rising snow line elevation has, in the short term, expanded the zone of bare clean ice between the debris cover and generally snow-covered glacier. The work in [30] identified a sharp increase in thinning below 6000 m during the 2001–2016 period versus the 1975–2000 period, highlighting the impact of rising freezing levels and snow line altitudes. For the Nepal Himalaya region, an average AAR of 0.40 and mean annual balance of −0.33 m/a from 2000–2016 [31] is from a period prior to the frequent winter warm events that should enhance the ablation imbalance reported [31].
5. Conclusions
A prolonged period of warm dry weather extended from the post-monsoon season of 2020 into late January of 2021 in regions of Mount Everest. This led to rising glacier snow lines and reduced snow-covered areas during this interval. From 10–15 January 2021, the warmest period of winter weather since 1950 occurred based on the observations at EBC. This led to additional snow loss on Mount Everest glaciers in the vicinity of the snow line at 5700 to 6100 m, depending on the location. This expanded the area of clean glacier ice exposed at the surface, which has a higher ablation rate than snow covered areas. The combination of high elevation weather records and remote sensing imagery allows identification of an extended ablation season that is becoming a frequent feature in the region and must be considered in mass balance modeling. The rising snowline indicates that ablation is occurring but does not quantify this. Remote observations or otherwise observations in winter will be crucial to validate the significance of the ablation.
Author Contributions
The conceptualization of combining the glacier snow line and meteorology was jointly discussed and realized by M.P., T.M., J.M., and L.B.P. All satellite image assessment and glacier data were derived by M.P. and P.P. All weather station data, ERA5 temperature reconstruction, and freezing level calculation was performed by T.M., J.M., and L.B.P. Writing—original draft preparation, M.P.; writing—review and editing by T.M. and P.P. All authors have read and agreed to the published version of the manuscript.”
Funding
The AWSs underpinning this research were deployed in partnership with the National Geographic Society, Rolex, and Tribhuvan University, with approval from all relevant agencies of the government of Nepal.
Institutional Review Board Statement
Not applicable.
Informed Consent Statement
Not applicable.
Data Availability Statement
AWS Weather station data may be obtained at https://www.nationalgeographic.org/projects/perpetual-planet/everest/weather-data/ accessed on 2 May 2021.
Acknowledgments
All Landsat and Sentinel images were obtained from the USGS EarthExplorer platform.
Conflicts of Interest
The authors declare no conflict of interest.
References
- King, O.; Bhattacharya, A.; Ghuffar, S.; Tait, A.; Guilford, S.; Elmore, A.C.; Bolch, T. Six Decades of Glacier Mass Changes around Mt. Everest Are Revealed by Historical and Contemporary Images. One Earth 2020, 3, 608–620. [Google Scholar] [CrossRef]
- King, O.; Quincey, D.J.; Carrivick, J.L.; Rowan, A.V. Spatial variability in mass loss of glaciers in the Everest region, central Himalayas, between 2000 and 2015. Cryosphere 2017, 11, 407–426. [Google Scholar] [CrossRef] [Green Version]
- Brun, F.; Wagnon, P.; Berthier, E.; Jomelli, V.; Maharjan, S.B.; Shrestha, F.; Kraaijenbrink, P. Heterogeneous Influence of Glacier Morphology on the Mass Balance Variability in High Mountain Asia. J. Geophys. Res. Earth Surf. 2019, 124, 1331–1345. [Google Scholar] [CrossRef]
- Perry, L.B.; Matthews, T.; Guy, H.; Koch, I.; Khadka, A.; Elmore, A.C.; Shrestha, D.; Tuladhar, S.; Baidya, S.K.; Maharjan, S.; et al. Precipitation Characteristics and Moisture Source Regions on Mt. Everest in the Khumbu, Nepal. One Earth 2020, 3, 594–607. [Google Scholar] [CrossRef]
- Wagnon, P.; Vincent, C.; Arnaud, Y.; Berthier, E.; Vuillermoz, E.; Gruber, S.; Ménégoz, M.; Gilbert, A.; Dumont, M.; Shea, J.M.; et al. The cryosphere seasonal and annual mass balances of Mera and Pokalde Glaciers (Nepal Himalaya) since 2007. Cryosphere 2013, 7, 1769–1786. [Google Scholar] [CrossRef] [Green Version]
- Wagnon, P.; Brun, F.; Khadka, A.; Berthier, E.; Shrestha, D.; Vincent, C.; Arnaud, Y.; Six, D.; Dehecq, A.; Ménégoz, M.; et al. Reanalysing the 2007–19 glaciological mass-balance series of Mera Glacier, Nepal, Central Himalaya, using geodetic mass balance. J. Glaciol. 2021, 67, 117–125. [Google Scholar] [CrossRef]
- Pelto, M. Recent Climate Change Impacts on Mountain Glaciers; Wiley-The Cryosphere Science Series; 2017; pp. 152–170. Available online: https://www.wiley.com/en-us/Recent+Climate+Change+Impacts+on+Mountain+Glaciers-p-9781119068112 (accessed on 18 March 2021)ISBN 978-1-119-06811-2.
- Racoviteanu, A.E.; Rittger, K.; Armstrong, R. An Automated Approach for Estimating Snowline Altitudes in the Karakoram and Eastern Himalaya from Remote Sensing. Front. Earth Sci. 2019, 7. [Google Scholar] [CrossRef] [Green Version]
- Matthews, T.; Perry, L.B.; Lane, T.P.; Elmore, A.C.; Khadka, A.; Aryal, D.; Shrestha, D.; Tuladhar, S.; Baidya, S.K.; Gajurel, A.; et al. Into Thick(er) Air? Oxygen Availability at Humans’ Physiological Frontier on Mount Everest. iScience 2020, 23, 101718. [Google Scholar] [CrossRef]
- European Spatial Agency (ESA). Sentinel-2 User Handbook; ESA Standard Document. 64; 2015; Available online: https://sentinel.esa.int/documents/247904/685211/Sentinel-2_User_Handbook (accessed on 18 March 2021).
- Landsat 8 OLI/TIRS Digital Object Identifier. 2019. Available online: https://www.usgs.gov/centers/eros/science/usgs-eros-archive-landsat-archives-landsat-8-oli-operational-land-imager-and?qt-science_center_objects=0#qt-science_center_objects (accessed on 18 March 2021).
- Pelto, M.; Pelto, M. Utility of late summer transient snowline migration rate on Taku Glacier, Alaska. Cryosphere 2011, 5, 1127–1133. [Google Scholar] [CrossRef]
- Mernild, S.H.; Pelto, M.; Malmros, J.; Yde, J.C.; Knudsen, N.T.; Hanna, E. Identification of snow ablation rate, ELA, AAR and net mass balance using transient snowline variations on two Arctic glaciers. J. Glaciol. 2013, 59, 649–659. [Google Scholar] [CrossRef] [Green Version]
- Hulth, J.; Denby, C.R.; Hock, R. Estimating glacier snow accumulation from backward calculation of melt and snowline tracking. Ann. Glaciol. 2013, 54, 1–7. [Google Scholar] [CrossRef] [Green Version]
- Barandun, M.; Huss, M.; Usubaliev, R.; Azisov, E.; Berthier, E.; Kääb, A.; Bolch, T.; Hoelzle, M. Multi-decadal mass balance series of three Kyrgyz glaciers inferred from modelling constrained with repeated snow line observations. Cryosphere 2018, 12, 1899–1919. [Google Scholar] [CrossRef] [Green Version]
- Zeller, J. Automated Classification of Supraglacial Surface Facies for Snow Line Altitude Monitoring Using the Google Earth Engine. Master’s Thesis, University of Zurich, Zurich, Switzerland, 2020. [Google Scholar]
- Matthews, T.; Perry, L.B.; Koch, I.; Aryal, D.; Khadka, A.; Shrestha, D.; Abernathy, K.; Elmore, A.C.; Seimon, A.; Tait, A.; et al. Going to Extremes: Installing the World’s Highest Weather Stations on Mount Everest. Bull. Am. Meteorol. Soc. 2020, 101, E1870–E1890. [Google Scholar] [CrossRef]
- Hersbach, H.; Bell, B.; Berrisford, P.; Hirahara, S.; Horányi, A.; Muñoz-Sabater, J.; Nicolas, J.; Peubey, C.; Radu, R.; Schepers, D.; et al. The ERA5 global reanalysis. Q. J. R. Meteorol. Soc. 2020, 146, 1999–2049. [Google Scholar] [CrossRef]
- Salerno, F.; Guyennon, N.; Thakuri, S.; Viviano, G.; Romano, E.; Vuillermoz, E.; Cristofanelli, P.; Stocchi, P.; Agrillo, G.; Ma, Y.; et al. Weak precipitation, warm winters and springs impact glaciers of south slopes of Mt. Everest (central Himalaya) in the last 2 decades (1994–2013). Cryosphere 2015, 9, 1229–1247. [Google Scholar] [CrossRef] [Green Version]
- Shea, J.M.; Immerzeel, W.; Wagnon, P.; Vincent, C.; Bajracharya, S.R. Modelling glacier change in the Everest region, Nepal Himalaya. Cryosphere 2015, 9, 1105–1128. [Google Scholar] [CrossRef] [Green Version]
- Litt, M.; Shea, J.; Wagnon, P.; Steiner, J.; Koch, I.; Stigter, E.; Immerzeel, W. Glacier ablation and temperature indexed melt models in the Nepalese Himalaya. Sci. Rep. 2019, 9, 1–13. [Google Scholar] [CrossRef] [Green Version]
- Sherpa, S.F.; Wagnon, P.; Brun, F.; Berthier, E.; Vincent, C.; Lejeune, Y.; Arnaud, Y.; Kayastha, R.B.; Sinisalo, A. Contrasted surface mass balances of debris-free glaciers observed between the southern and the inner parts of the Everest region (2007–2015). J. Glaciol. 2017, 63, 637–651. [Google Scholar] [CrossRef] [Green Version]
- Stumm, D.; Joshi, S.P.; Gurung, T.R.; Silwal, G. Mass balances of Yala and Rikha Samba Glacier, Nepal from 2000 to 2017. Earth Syst. Sci. Data Discuss 2020. [Google Scholar] [CrossRef]
- Thakuri, S.; Salerno, F.; Smiraglia, C.; Bolch, T.; D’Agata, C.; Viviano, G.; Tartari, G. Tracing glacier changes since the 1960s on the south slope of Mt. Everest (central Southern Himalaya) using optical satellite imagery. Cryosphere 2014, 8, 1297–1315. [Google Scholar] [CrossRef] [Green Version]
- Bocchiola, D.; Bombelli, G.M.; Camin, F.; Ossi, P.M. Field Study of Mass Balance, and Hydrology of the West Khangri Nup Glacier (Khumbu, Everest). Water 2020, 12, 433. [Google Scholar] [CrossRef] [Green Version]
- Sunako, S.; Fujita, K.; Sakai, A.; Kayastha, R.B. Mass balance of Trambau Glacier, Rolwaling region, Nepal Himalaya: In-situ observations, long-term reconstruction and mass-balance sensitivity. J. Glaciol. 2019, 65, 605–616. [Google Scholar] [CrossRef] [Green Version]
- Bolch, T.; Pieczonka, T.; Benn, D.I. Multi-decadal mass loss of glaciers in the Everest area (Nepal Himalaya) derived from stereo imagery. Cryosphere 2011, 5, 349–358. [Google Scholar] [CrossRef] [Green Version]
- Nuimura, T.; Fujita, K.; Yamaguchi, S.; Sharma, R.R. Elevation changes of glaciers revealed by multitemporal digital elevation models calibrated by GPS survey in the Khumbu region, Nepal Himalaya, 1992-2008. J. Glaciol. 2012, 58, 648–656. [Google Scholar] [CrossRef] [Green Version]
- Bisset, R.R.; Dehecq, A.; Goldberg, D.N.; Huss, M.; Bingham, R.G.; Gourmelen, N. Reversed Surface-Mass-Balance Gradients on Himalayan Debris-Covered Glaciers Inferred from Remote Sensing. Remote. Sens. 2020, 12, 1563. [Google Scholar] [CrossRef]
- Maurer, J.M.; Schaefer, J.M.; Rupper, S.; Corley, A. Acceleration of ice loss across the Himalayas over the past 40 years. Sci. Adv. 2019, 5, eaav7266. [Google Scholar] [CrossRef] [Green Version]
- Miles, E.; McCarthy, M.; Dehecq, A.; Kneib, M.; Fugger, S.; Pellicciotti, F. Health and sustainability of glaciers in High Mountain Asia. Nat. Commun. 2021, 12, 1–10. [Google Scholar] [CrossRef]


Publisher’s Note: MDPI stays neutral with regard to jurisdictional claims in published maps and institutional affiliations. |
© 2021 by the authors. Licensee MDPI, Basel, Switzerland. This article is an open access article distributed under the terms and conditions of the Creative Commons Attribution (CC BY) license (https://creativecommons.org/licenses/by/4.0/).