Abstract
Regional changes in the flow velocity of Antarctic glaciers can affect the ice sheet mass balance and formation of surface crevasses. The velocity anomaly of a glacier can be detected using the Double-Differential Interferometric Synthetic Aperture Radar (DDInSAR) technique that removes the constant displacement in two Differential Interferometric SAR (DInSAR) images at different times and shows only the temporally variable displacement. In this study, two circular-shaped ice-velocity anomalies in Campbell Glacier, East Antarctica, were analyzed by using 13 DDInSAR images generated from COSMO-SkyMED one-day tandem DInSAR images in 2010–2011. The topography of the ice surface and ice bed were obtained from the helicopter-borne Ice Penetrating Radar (IPR) surveys in 2016–2017. Denoted as A and B, the velocity anomalies were in circular shapes with radii of ~800 m, located 14.7 km (A) and 11.3 km (B) upstream from the grounding line of the Campbell Glacier. Velocity anomalies were up to ~1 cm/day for A and ~5 cm/day for B. To investigate the cause of the two velocity anomalies, the ice surface and bed profiles derived from the IPR survey crossing the anomalies were analyzed. The two anomalies lay over a bed hill along the glacial valley where stick-slip and pressure melting can occur, resulting in temporal variation of ice velocity. The bright radar reflection and flat hydraulic head at the ice bed of A observed in the IPR-derived radargram strongly suggested the existence of basal water in a form of reservoir or film, which caused smaller friction and the reduced variation of stick-slip motion compared to B. Crevasses began to appear at B due to tensile stress at the top of the hill and the fast flow downstream. The sporadic shift of the location of anomalies suggests complex pressure melting and transportation of the basal water over the bed hill.
1. Introduction
Antarctic glaciers flow from the inland to the shore, forming an ice shelf or glacier tongue, and are eventually discharged into the ocean. As the motion of the glacier is closely related to the seaward ice flux, ice flow velocity is an important indicator of global climate change and sea level rise [1,2,3]. The flow velocity of a glacier changes due to mass balance variations caused by snowfall accumulation or sublimation on the surface of the glacier, changes in physical properties occurring inside and at the bed of the glacier, and basal sliding [4,5,6].
Apart from the surface mass balance, a number of studies have been conducted on the observation of glacial flow rates due to the action of the ice bed influenced by the basal water. The presence of melt water at the ice bed is an important factor in the change in ice velocity because it causes lubrication, reducing friction between ice and the bedrock, and accelerating the flow velocity of the ice [6,7,8]. The melt water generated on the ice bottom moves along the bedrock topography to form a water channel, and is stored in the hollow to form a subglacial lake. Subglacial lakes and water channels also affect the behavior of the glacier flow [9,10,11]. Lubrication occurs at the boundary between ice and the bedrock to accelerate the flow velocity of the glacier by reducing the frictional force. The sediments saturated with water also reduces the basal shear stress to easily cause basal sliding to accelerate the flow velocity of the glacier [12].
Satellite Synthetic Aperture Radar (SAR) is a very effective instrument in Antarctic glacial research because it can provide high-quality images regardless of the sun altitudes and weather conditions. Differential interferometric SAR (DInSAR) can be applied to measure the displacement of the glacier with centimeter accuracy. Han and Lee [13,14] calculated the precise flow velocity and strain rates of Campbell Glacier Tongue, a seaward extension of the Campbell Glacier in East Antarctica, through the DInSAR technique with tidal phase correction. The DInSAR phase of inland glacier can include vertical displacement due to the surface elevation change or the activity of subglacial lakes as well as horizontal ice flow. Gray et al. [15] used DInSAR to observe the changes in the surface elevation of the West Antarctic Ice Sheet due to the movement of water level of subglacial lakes. In the study conducted by Palmer et al. [16], the displacement of Greenland Ice Sheet observed from DInSAR was interpreted as the depression of glacier surface due to the drainage of the subglacial lakes in the radar line-of-sight (LOS) direction.
Double-differential interferometric SAR (DDInSAR) removes the constant displacement at two different times and shows only the temporally variable displacement. The DDInSAR technique has been mainly used to study the deformation of ice shelves and glacier tongues to detect the vertical displacement caused by tide by removing horizontal ice flow from the DInSAR signals and thus to define grounding line and hinge zone of glaciers [17,18,19,20]. As the displacement derived from the DDInSAR technique is the remainder of removing constant displacement from the DInSAR at two different times, it is possible to observe the velocity anomaly by applying the technique to the inland glaciers. Glacier velocity anomalies can affect not only changes in seaward ice flux, but also the formation of surface crevasses. Therefore, it is very important to detect the velocity anomalies of glacier and analyze their occurrence mechanism.
It is difficult to identify the mechanism of the velocity anomalies with the DDInSAR technique alone. The velocity anomalies can be influenced by the bedrock topography and the presence of basal water. In order to clearly explain the mechanism of velocity anomalies, geophysical exploration data on the glacier should be acquired and analyzed. However, to the best of our knowledge, no studies have been conducted to detect the velocity anomalies of glaciers using the DDInSAR technique and to investigate the mechanism of the anomalies through combined analysis with the geophysical exploration data.
In this study, the DDInSAR technique was applied to the Campbell Glacier, East Antarctica, to analyze the velocity anomalies. The existence of basal water in the form of subglacial lake or water film was proposed by analyzing seasonal variation of the anomalies observed by a series of COSMO-SkyMED one-day tandem interferometric SAR (InSAR) pairs and a high-resolution bed topography obtained from a helicopter-borne field survey using Ice Penetrating Radar (IPR). Section 2 describes the study area and data used for this study. Section 3 presents the velocity anomalies found from the DDInSAR and the IPR profiles. Section 4 discusses the cause of the anomalies, while Section 5 concludes this study.
2. Materials
2.1. Study Area
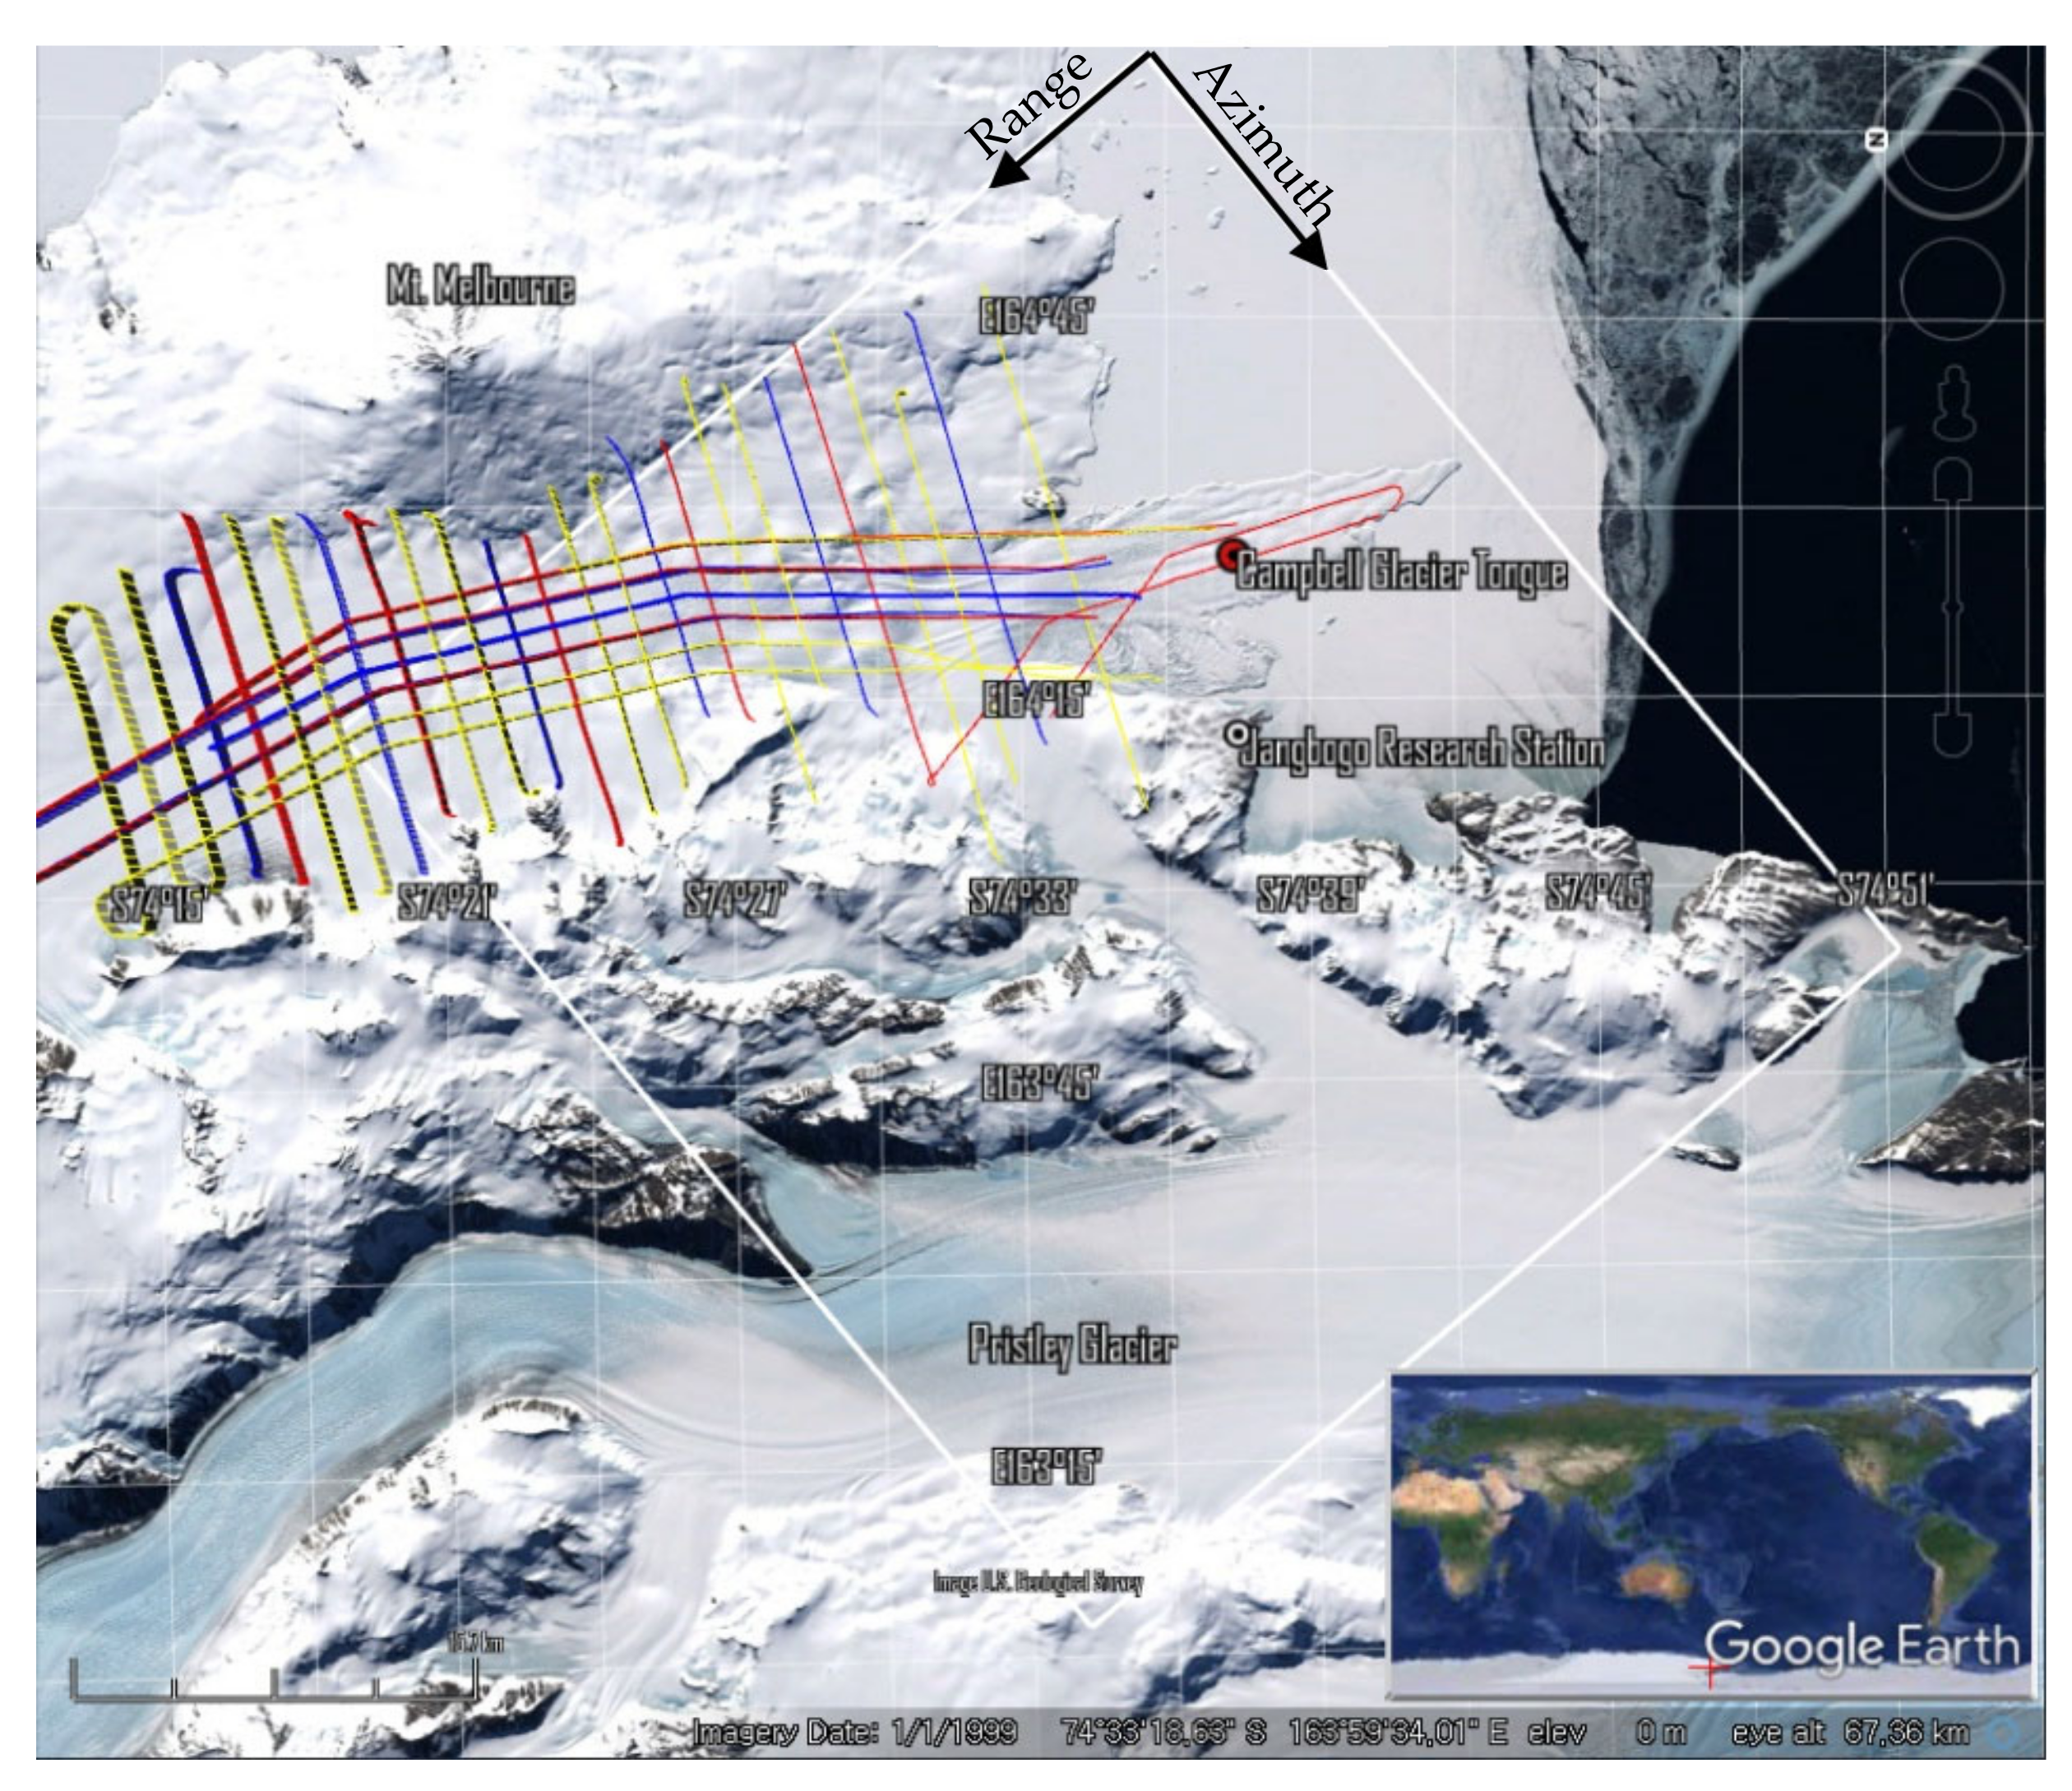
Campbell Glacier is an outlet glacier located in Northern Victoria Land in East Antarctica (Figure 1). The length of the glacier is about 100 km and the area of the glacier basin is about 4000 km2. Campbell Glacier flows between the Deep Freeze Range and Mt. Melbourne, and is discharged into Terra Nova Bay through Campbell Glacier Tongue. The Jang Bogo Station, an Antarctic research station operated by South Korea since 2014, is located on the coast of Terra Nova Bay, which is the closest station to the Campbell Glacier in the region. Air temperature typically varies from −30 °C to 5 °C annually, according to the measurement of automatic weather station operated at the Jang Bogo Station. Mt. Melbourne is considered a dormant volcano and the most recent eruptions were estimated to have occurred between 1862 and 1922 [21]. Campbell Glacier Tongue is surrounded by landfast sea ice that receives stress from glacial and tidal motion [22]. Ice velocity near the upstream edge of the COSMO-SkyMED SAR image area in Figure 1 is approximately 20 cm/day, and increases downstream up to 67 cm/day near the ice front of the Campbell Glacier Tongue, according to the study of Han and Lee [13] which used the same COSMO-SkyMED dataset with this study.
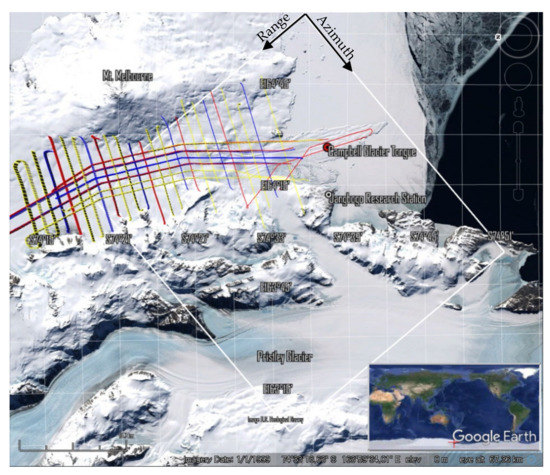
Figure 1.
Map of the study area. The white rectangle is the COSMO-SkyMED SAR image area and the lines are the helicopter-borne IPR survey routes over Campbell Glacier with different colors of acquisition data quality: blue (good), yellow (poor), and red (erroneous).
2.2. COSMO-SkyMED One-Day Tandem DDInSAR
Campbell Glacier is one of the fastest glaciers in East Antarctica. With a revisit cycle of more than 10 days for conventional single-satellite repeat pass interferometry, the fast-flowing glaciers would have very low coherence, making it difficult to observe surface displacement using DInSAR. COSMO-SkyMED is a constellation of four satellites equipped with X-band SAR (center frequency of 9.6 GHz). Each satellite of the constellation has a repeat cycle of 16 days; however, interferometric observation can be achieved in a day by sharing the same orbital plane [23]. Therefore, the COSMO-SkyMED one-day tandem pair is currently unique for the study of the fast-flowing downstream of Campbell Glacier. A total of 28 COSMO-SkyMED SAR images acquired with 3 m resolution in strip-map mode, VV-polarization, and an incidence angle of 40° in descending node from June 2010 to November 2011 were used in this study (Table 1).

Table 1.
List of COSMO-SkyMED one-day tandem DInSAR pairs used in this study.
The InSAR is a technique for mapping surface topography and displacement from the phase difference of two or more SAR images acquired in the same area. The InSAR processing was performed by using SNAP software provided freely by European Space Agency. Firstly, a one-day tandem interferometric pair of COSMO-SkyMED SAR data were co-registered with one over 32nd pixel accuracy to generate an initial interferogram. The initial interferogram includes the phases due to the earth ellipsoid, surface topography, surface displacement, and noise. The surface displacement is derived by removing the ellipsoidal earth phase and topographic phase from the initial interferogram. The phase from the noise is very small compared to that from the surface displacement of the glacier, which can be neglected. TanDEM-X 12 m digital elevation model (DEM) provided by the German Aerospace Center was used to eliminate phase from earth ellipsoid and topography from the interferogram and to generate DInSAR image. Goldstein phase filtering was applied to enhance the signal to noise ratio of the interferogram. A total of 14 one-day DInSAR images were generated from June 2010 to November 2011. The resulting DInSAR images include interferometric signals from glacier flow and also tidal deflection in the ice shelf or glacier tongue [19]. If glacier flow is constant over time, it can be cancelled by subtracting two DInSAR data, which is the concept of DDInSAR used to highlight diurnal change of tidal deflection of a floating glacier [19].
For grounded ice, the DDInSAR can be used to detect the difference of velocity field between the two DInSAR data. For DDInSAR operation, unwrapping the DInSAR phase was performed by using SNAPHU software [24] and the subtraction was also done by using the band math functions of SNAP. The first DInSAR pair [20100616_20100617] was used as a master data for all DDInSAR operations. Except for the Campbell Glacier Tongue, the DDInSAR phase would be constant for the stable regions and constant-flowing glacier surface. As exceptions to this, velocity anomalies over grounded glacier will be reported in Section 3.
2.3. Helicopter-Borne Ice Penetrating Radar Survey
Ice penetration radar (IPR) is one of the most powerful geophysical exploration tools for observing glaciers. The IPR transmits radio waves regularly and records the returning echoes. The resulting standard image consists of the x-axis of each pulse's transmission time (commonly called as along-track) and the y-axis of the time window (64,000 ns in this study) of each record. Because glaciers have a small dielectric absorption in the radio frequency band, radio echoes can be detected from the bottom of the ice sheet with a glacier thickness of 2 km or more.
During the Antarctic summer seasons in 2016–2017, a team of Korea Polar Research Institute (KOPRI) organized a helicopter-borne survey over Campbell Glacier. An AS-350 helicopter was equipped with an IPR, Trimble Net-R9 dual-frequency (1 Hz, 2 Hz) Global Navigation Satellite System (GNSS), Novatel SPAN IGM-1A inertial navigation system, and Renishaw ILM-1200HR laser altimeter (average of 1000 data sample, accuracy of 10 cm, and resolution of 1 cm). The IPR measurement were conducted for a total of 655 km survey line over Campbell Glacier, especially intensively in the downstream of the glacier that is covered by the SAR dataset.
The IPR used for this study is a High Capability Airborne Radar Sounder 2 (HiCARS2) designed by the University of Texas Institute for Geophysics (UTIG), with a center frequency of 60 MHz and 1 wide chirp, linearly sweeping the frequency from 52.7 to 67.5 MHz with a 6250 Hz pulse repetition frequency, and 8 kW peak pulse power to improve propagation [25]. It is a phase coherent radar system with about 2.8 m vertical resolution on ice [26,27,28]. All measurements from these pieces of equipment were received, controlled, and recorded in a storage by the Environment for Linked Streams Acquisition (ELSA) system developed by UTIG in 2009 [25,26]. The IPR used in this study was first carried on a Twin Otter airplane in 2001 to survey the Siple Coast [29] and B15a iceberg [30] in Antarctica.
The glacier surface and the glacier/bedrock interface are picked using a semi-automatic method as follows. The altitude of the glacier surface () is obtained from the GPS-measured altitude () and the laser altimeter-driven distance of the helicopter from the surface () by:
The altitude of the glacier/bedrock interface () is obtained from the glacier-bedrock peaking value in the radargram:
Here, a nominal velocity of glacial ice, 0.17 m/ns, was used to calculate the ice thickness [31,32]. IPR-derived surface and bed map of the downstream part of the Campbell Glacier were produced by kriging interpolation [33] of the survey profiles. The kriging technique is a regression analysis method used in geostatistics. The basis of kriging is predicting a function value at a given point by calculating the weighted average of the known function values neighborhood that point. The predicted value at position () is calculated by:
where is the number of observations, is the weight of observation point , and is the observation value at position . The weight () decreases as the distance () between and in Equation (4). In this study, ordinary kriging is used among kriging methods. Ordinary kriging ensures that the sum of weights () to 1 (Equation (5)) so that the estimation is not biased.
The hydraulic head at the bed [34] was calculated from the radar data to find out the characteristics of the ice bottom water and subglacial lake. The hydraulic head at the bed is based on the assumption that the whole weight of the ice body above is supported by the underlying water reservoir. It represents the state of water pressure at the ice bottom because the water flows from the high point to the low point of the head. The hydraulic head (H) can be calculated by
where is ice density (915 kg/m3), is the water density (1010 kg/m3). According to Cuffey and Paterson [35], the ice density ranged from 910 to 920 kg/m3, and in Vaughan et al. [34], the water density ranged from 1004 to 1015 kg/m3. In this study, the average values were used. Equation (6) states that the altitude of the glacier surface affects the hydraulic head by about 10 times the altitude of the glacier/bedrock interface. It states that the change in the altitude of the glacier surface is more important evidence than bed topography for determining the flow direction of the basal water or the presence of subglacial lake. When ice bottom lakes exist, the hydraulic head slope appears flat [36,37].
Among several radar data that pass near the anomalies in a crisscross pattern, a line of data was used so that the GNSS record was good and the ice-bedrock interface was well distinguished. To remove outliers in the radar data, we computed the difference between the laser altimeter-derived surface height and the mean value of the height in a moving window size of 10. When the difference was found to be greater than 1% (0.2–1.1 m) of the mean value of surface height, the corresponding radar data was identified as an outlier and excluded from the analysis. The quality of surface topography and ice bathymetry was compared with the Bedmap2 data produced by British Antarctic Survey [38].
3. Results
This section shows the results of data processing of DInSAR and DDInSAR images and the profiles along the survey line and the valley line showing ice surface topography, ice bed topography, hydraulic head, and radargram.
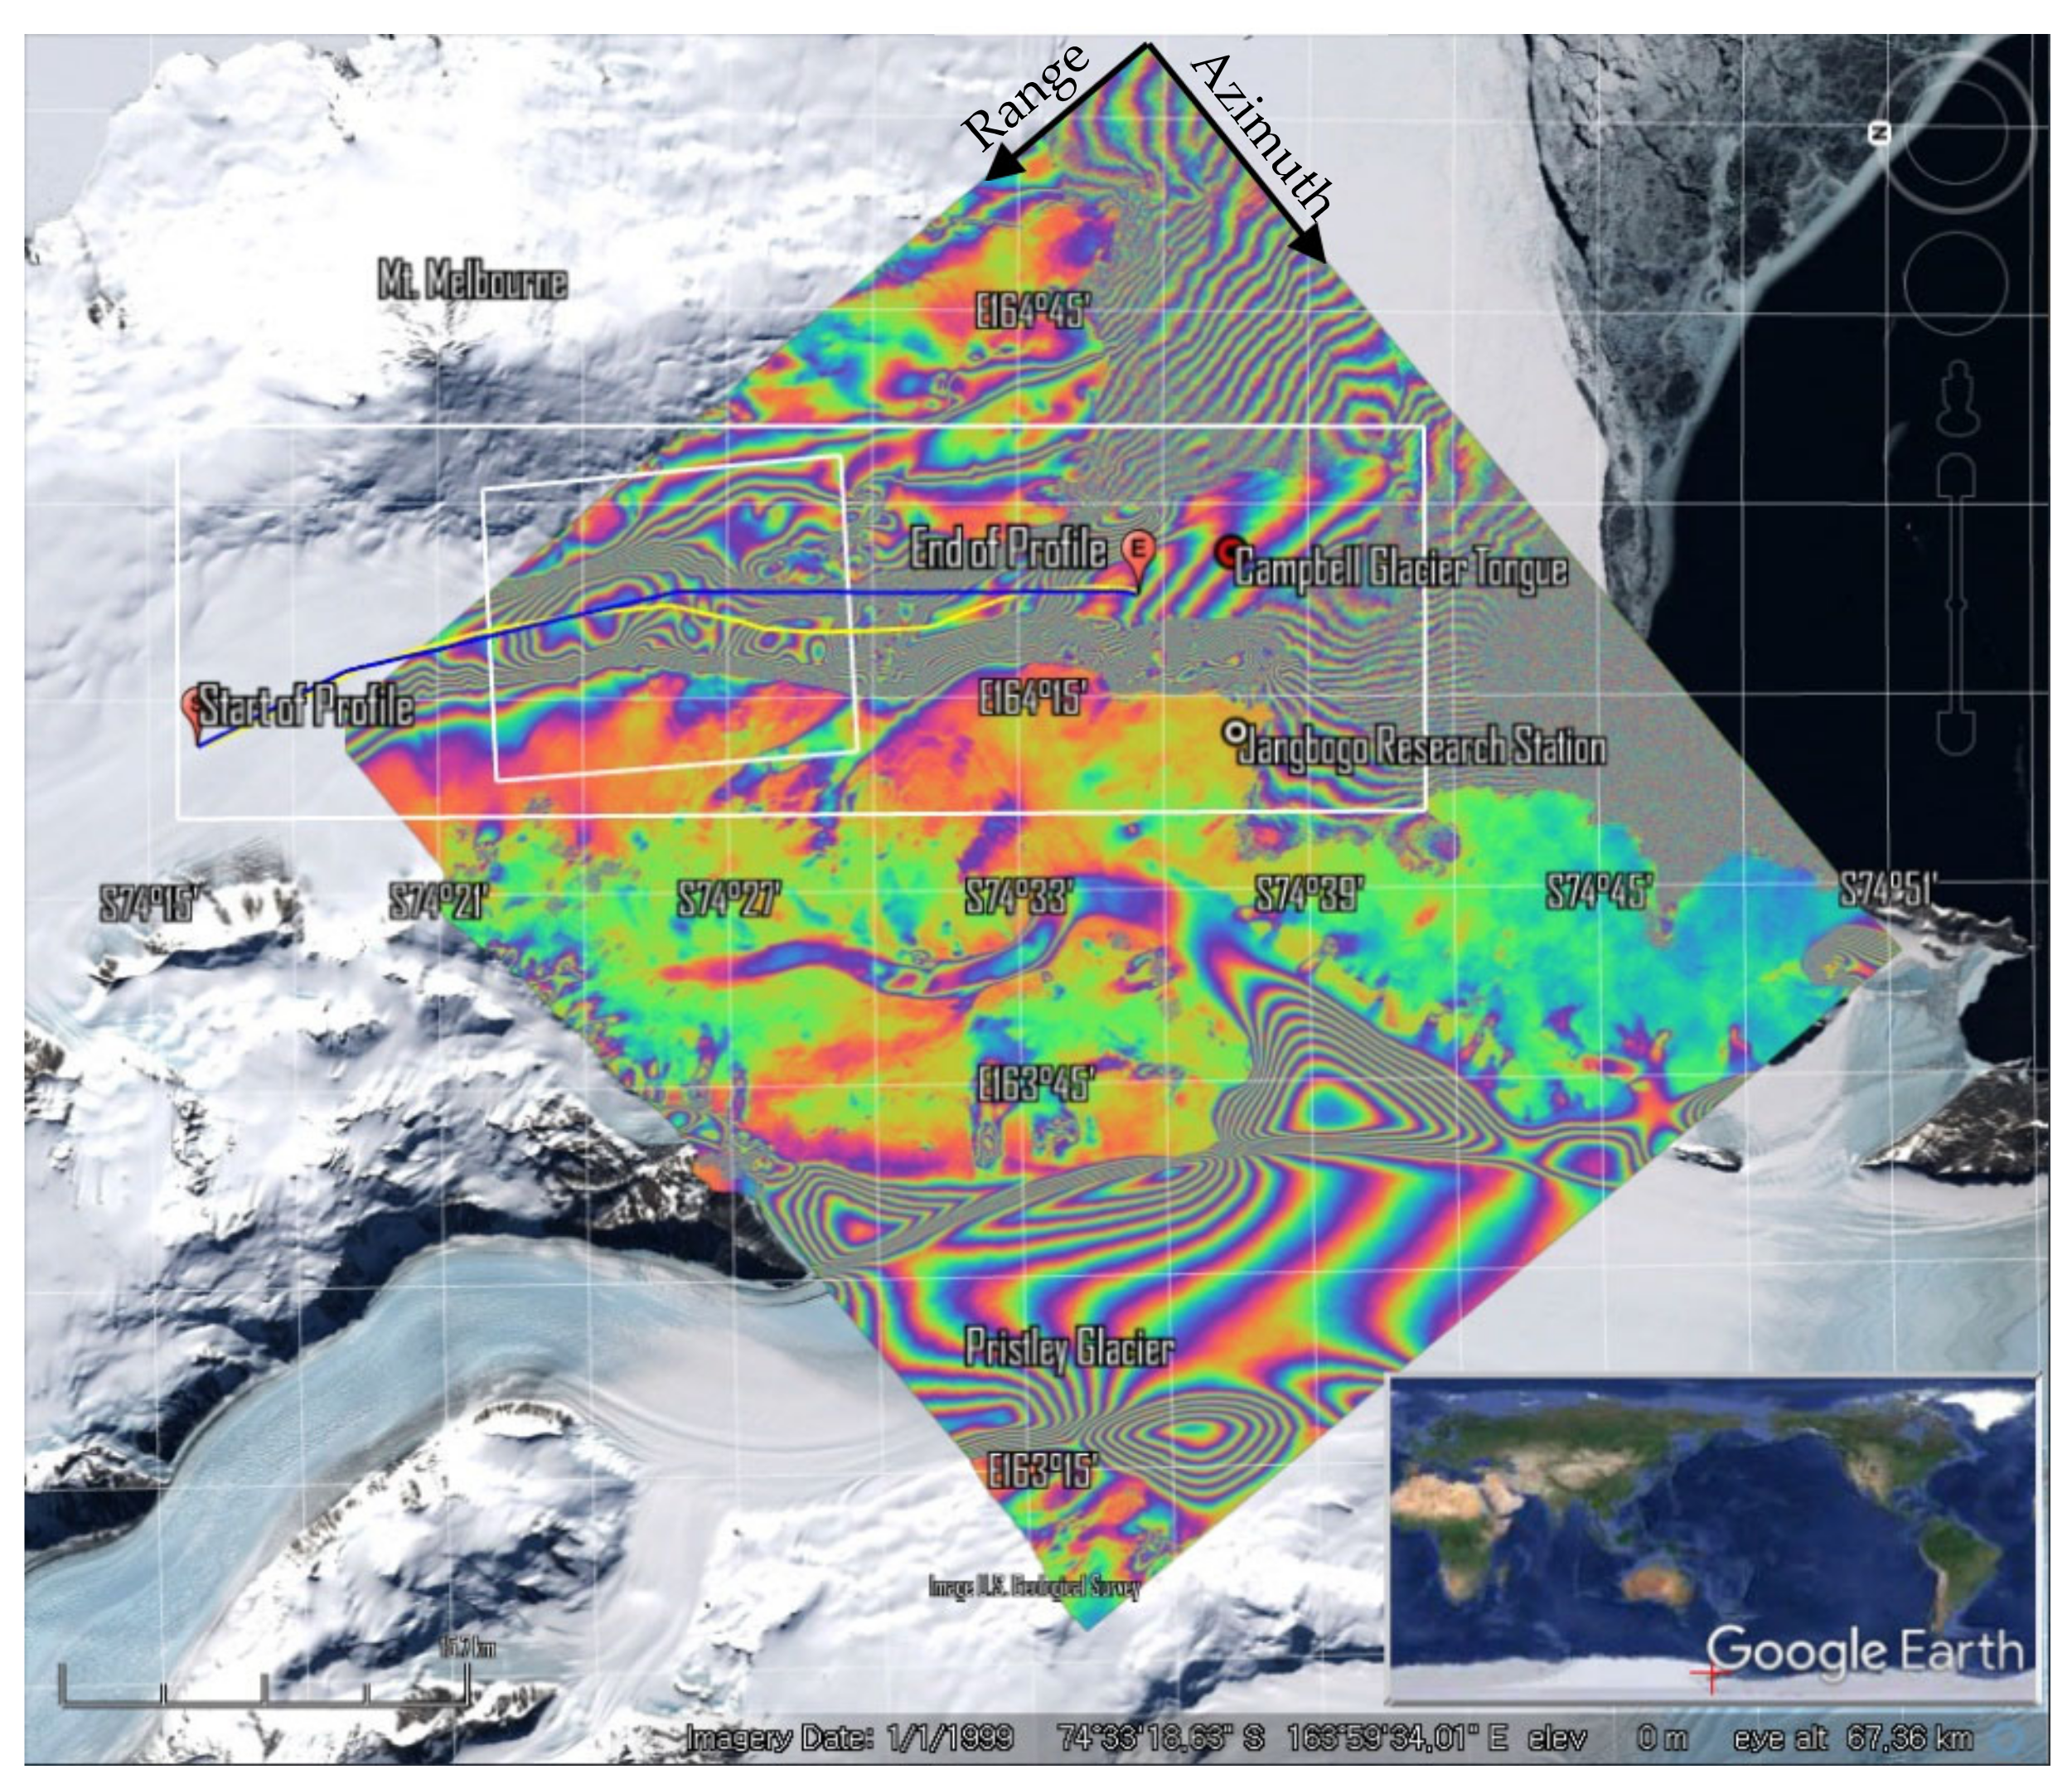
Figure 2 shows an example of a one-day DInSAR image generated from the SAR images obtained on 16 and 17 June 2010. Interferometric fringes are equi-displacement lines in every half wavelength LOS direction while the density of fringes represents strain rate. The yellow line connects the maximum ice velocity points across the ice flow at the center of the valley, while the blue line is one of the IPR survey routes close to the yellow line. Note that part of the yellow line is hidden under the blue line, but they share the same starting and ending nodes. Radargram can be observed along the blue survey line but not along the yellow line. Those lines are used to compare the ice surface and bottom topography.
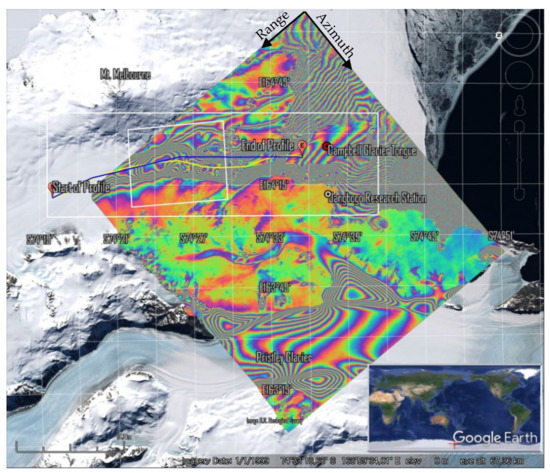
Figure 2.
An example of one-day DInSAR images (the pair of [20100616_20100617]). The yellow line is the steepest ice-velocity gradient line at the center of the valley while the blue line is one of the IPR routes close to the white line. White boxes are image areas for Figure 4 (smaller one) and Figure 6 (bigger one), respectively. Note that part of the yellow line is hidden under the blue line, but they share the same starting and ending nodes.
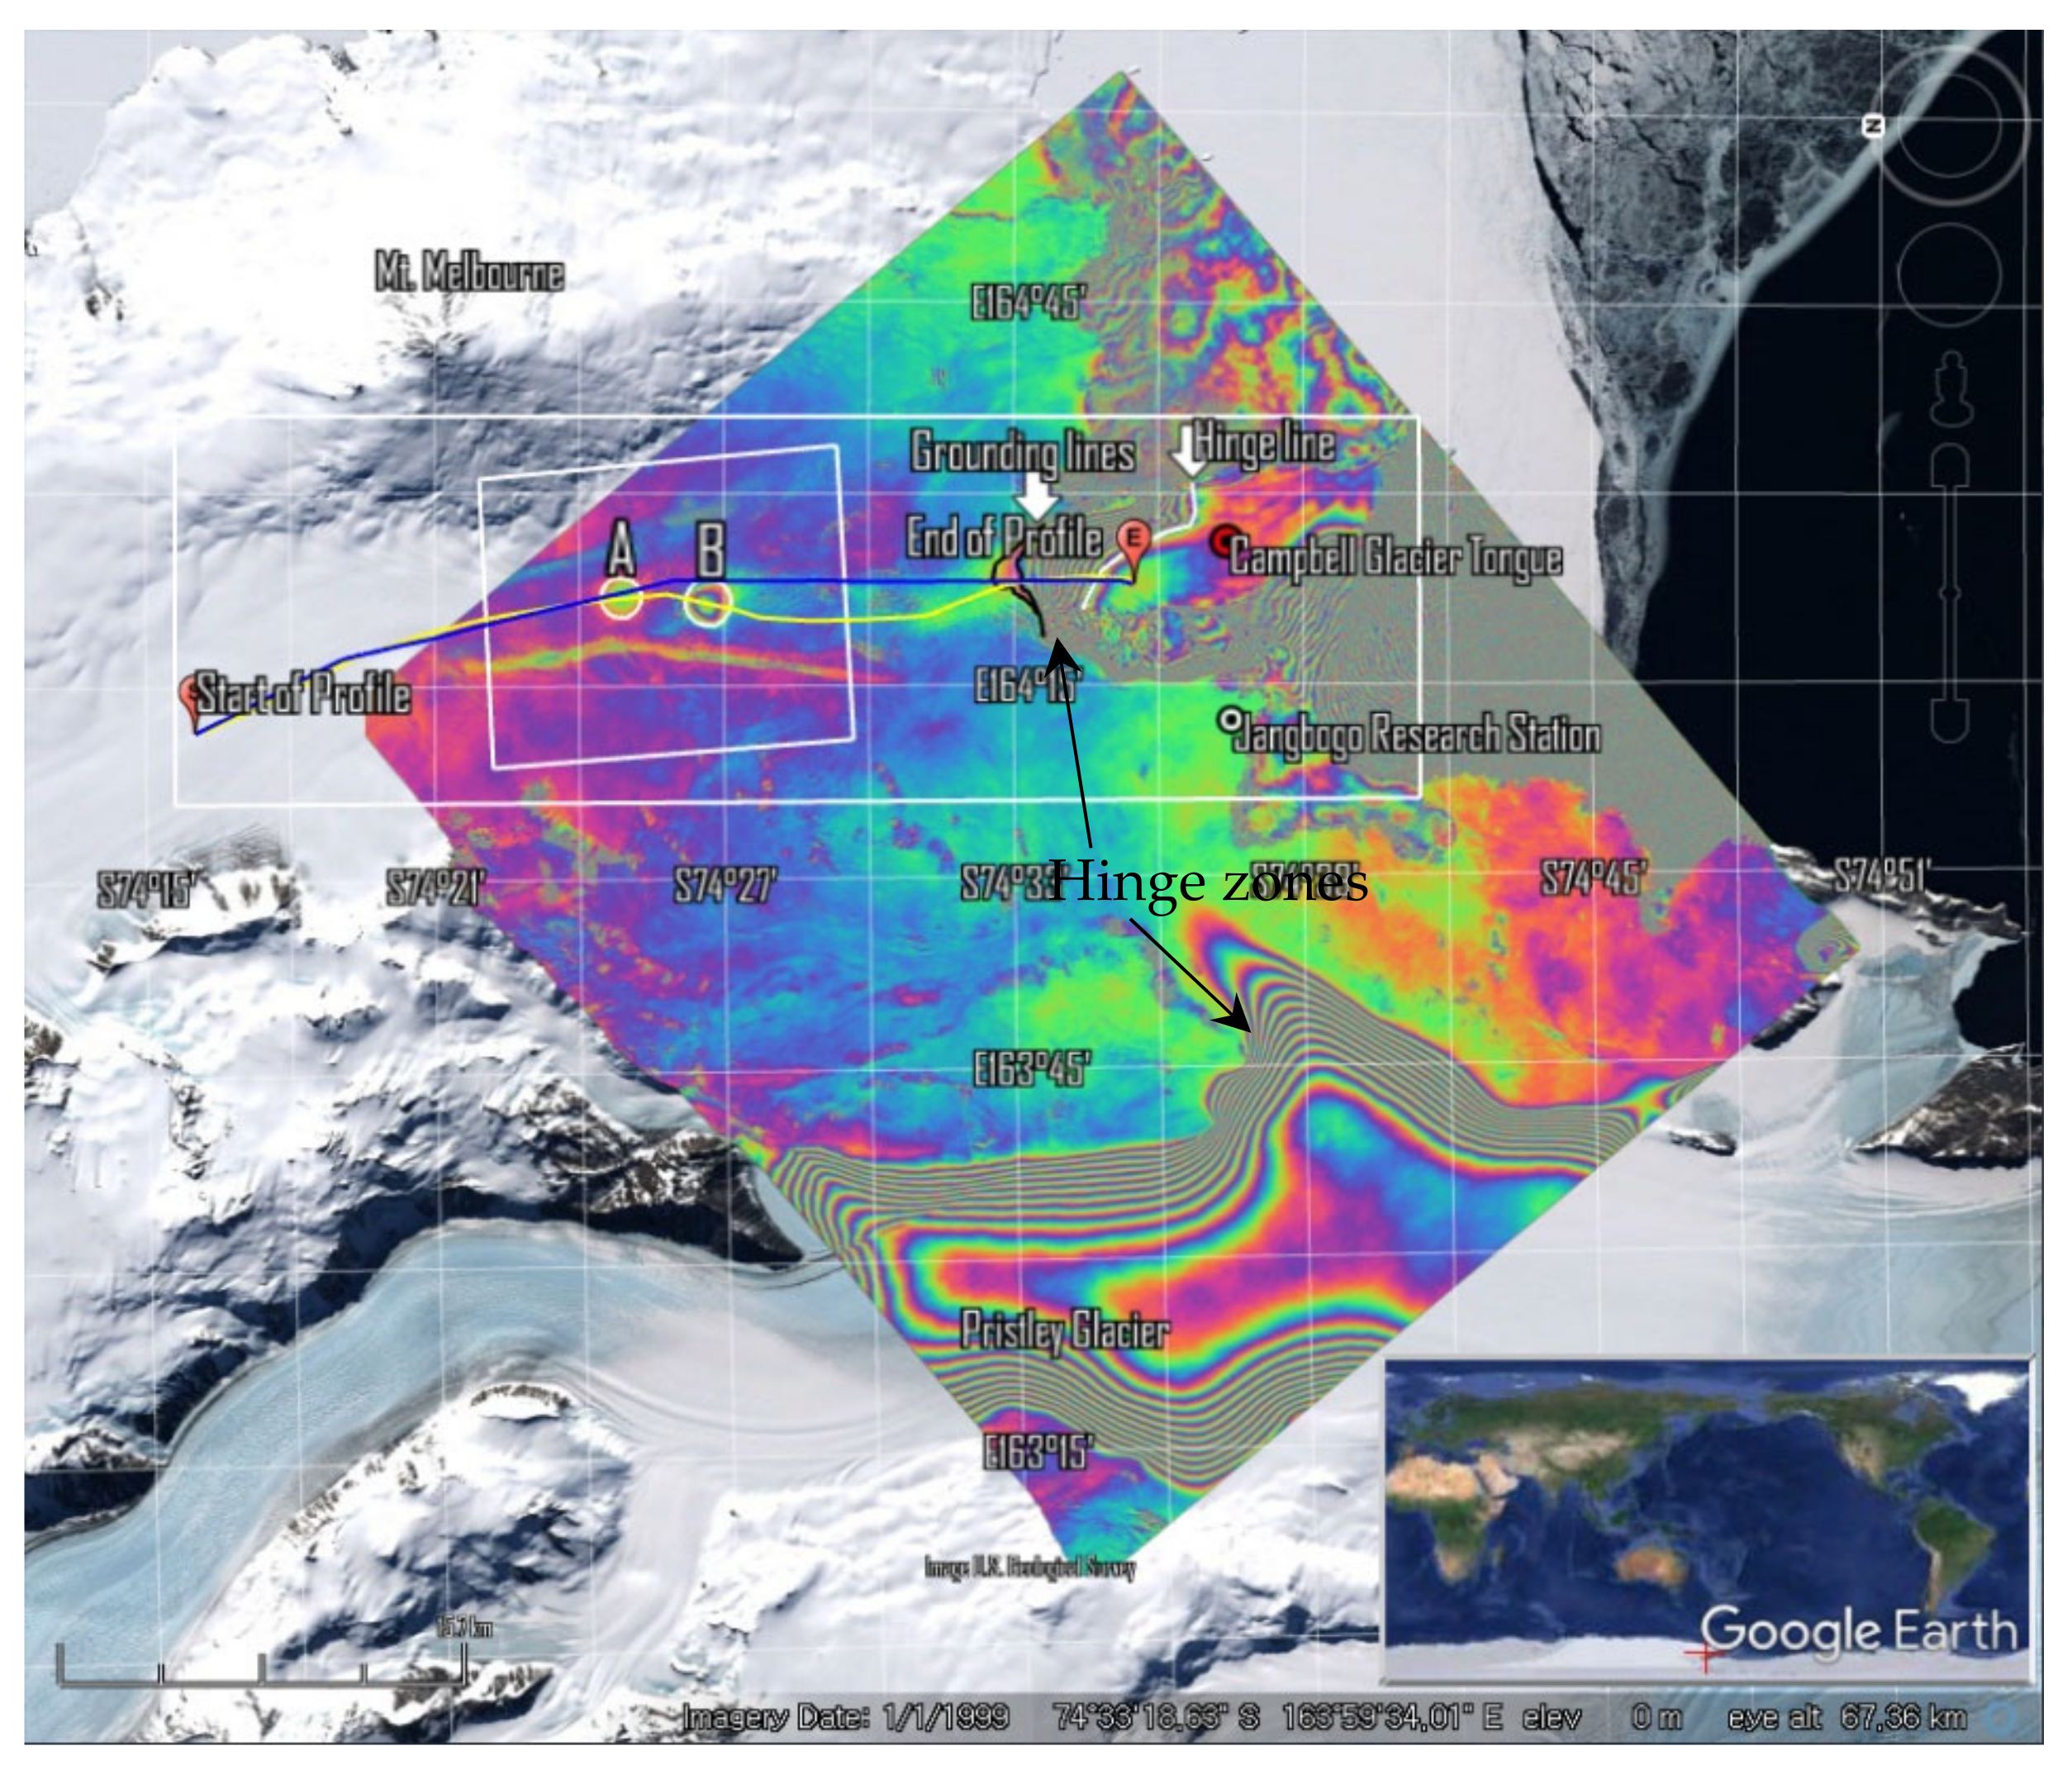
Figure 3 shows an example of DDInSAR image generated by subtracting the DInSAR pair [20100616,20100617] from the pair [20110502-20110503] (also shown in Figure 4e). Most of the constant glacial flow signal were deleted. Tidal deflection signal near the grounding line of Campbell Glacier and Priestley Glacier can be seen, of which tidal fringes over Campbell Glacier Tongue were analyzed by Han and Lee [19]. Fringes over landfast sea ice near Campbell Glacier Tongue have also been reported by Han and Lee [22] as a combination of tidal and glacial stress. Possible grounding lines and a hinge line were drawn in black and white lines near the Campbell Glacier Tongue. Apart from them, there are two velocity anomalies at 11–15 km inland from the grounding line of the Campbell Glacier, which is the main focus of this study. Denoted as A and B in Figure 3, the anomalies are in circular shapes with radii of ~800 m. The centers of the circles are located 14.7 km (A) and 11.3 km (B) upstream from the grounding line. Velocity anomalies are −0.9 cm/day for the anomaly A and 2.7 cm/day for the anomaly B, both in LOS direction in this image. The two anomalies are in the central valley of the glacier along the profile lines. The IPR survey line (blue) crosses the center of A only but only a part of B. The intended profile line in yellow is drawn to cross the two centers of A and B to investigate the ice surface and bottom topography.
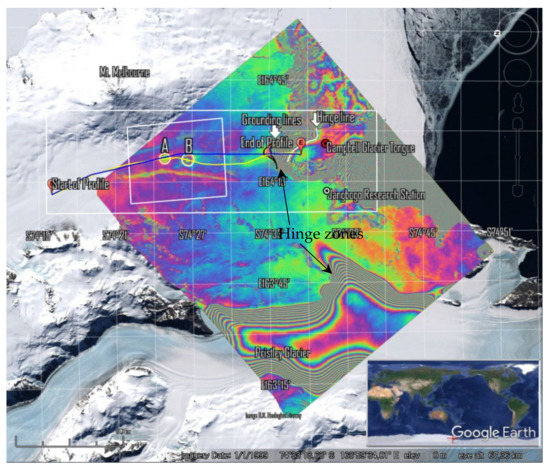
Figure 3.
An example of DDInSAR image by subtracting the DInSAR pair [20100616-20100617] from the pair [20110502-20110503], also shown in Figure 4e. A and B are the velocity anomalies found in the central valley along the profile lines. Note that dense fringes are tidal deflection at the hinge zones of Priestly Glacier (bottom) and Campbell Glacier (top). The possible grounding lines and hinge line were drawn in black and white lines near the Campbell Ice Tongue.
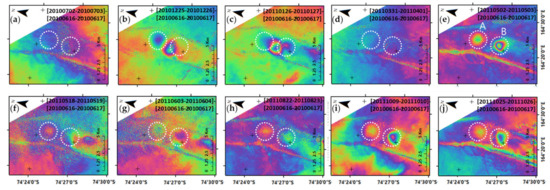
Figure 4.
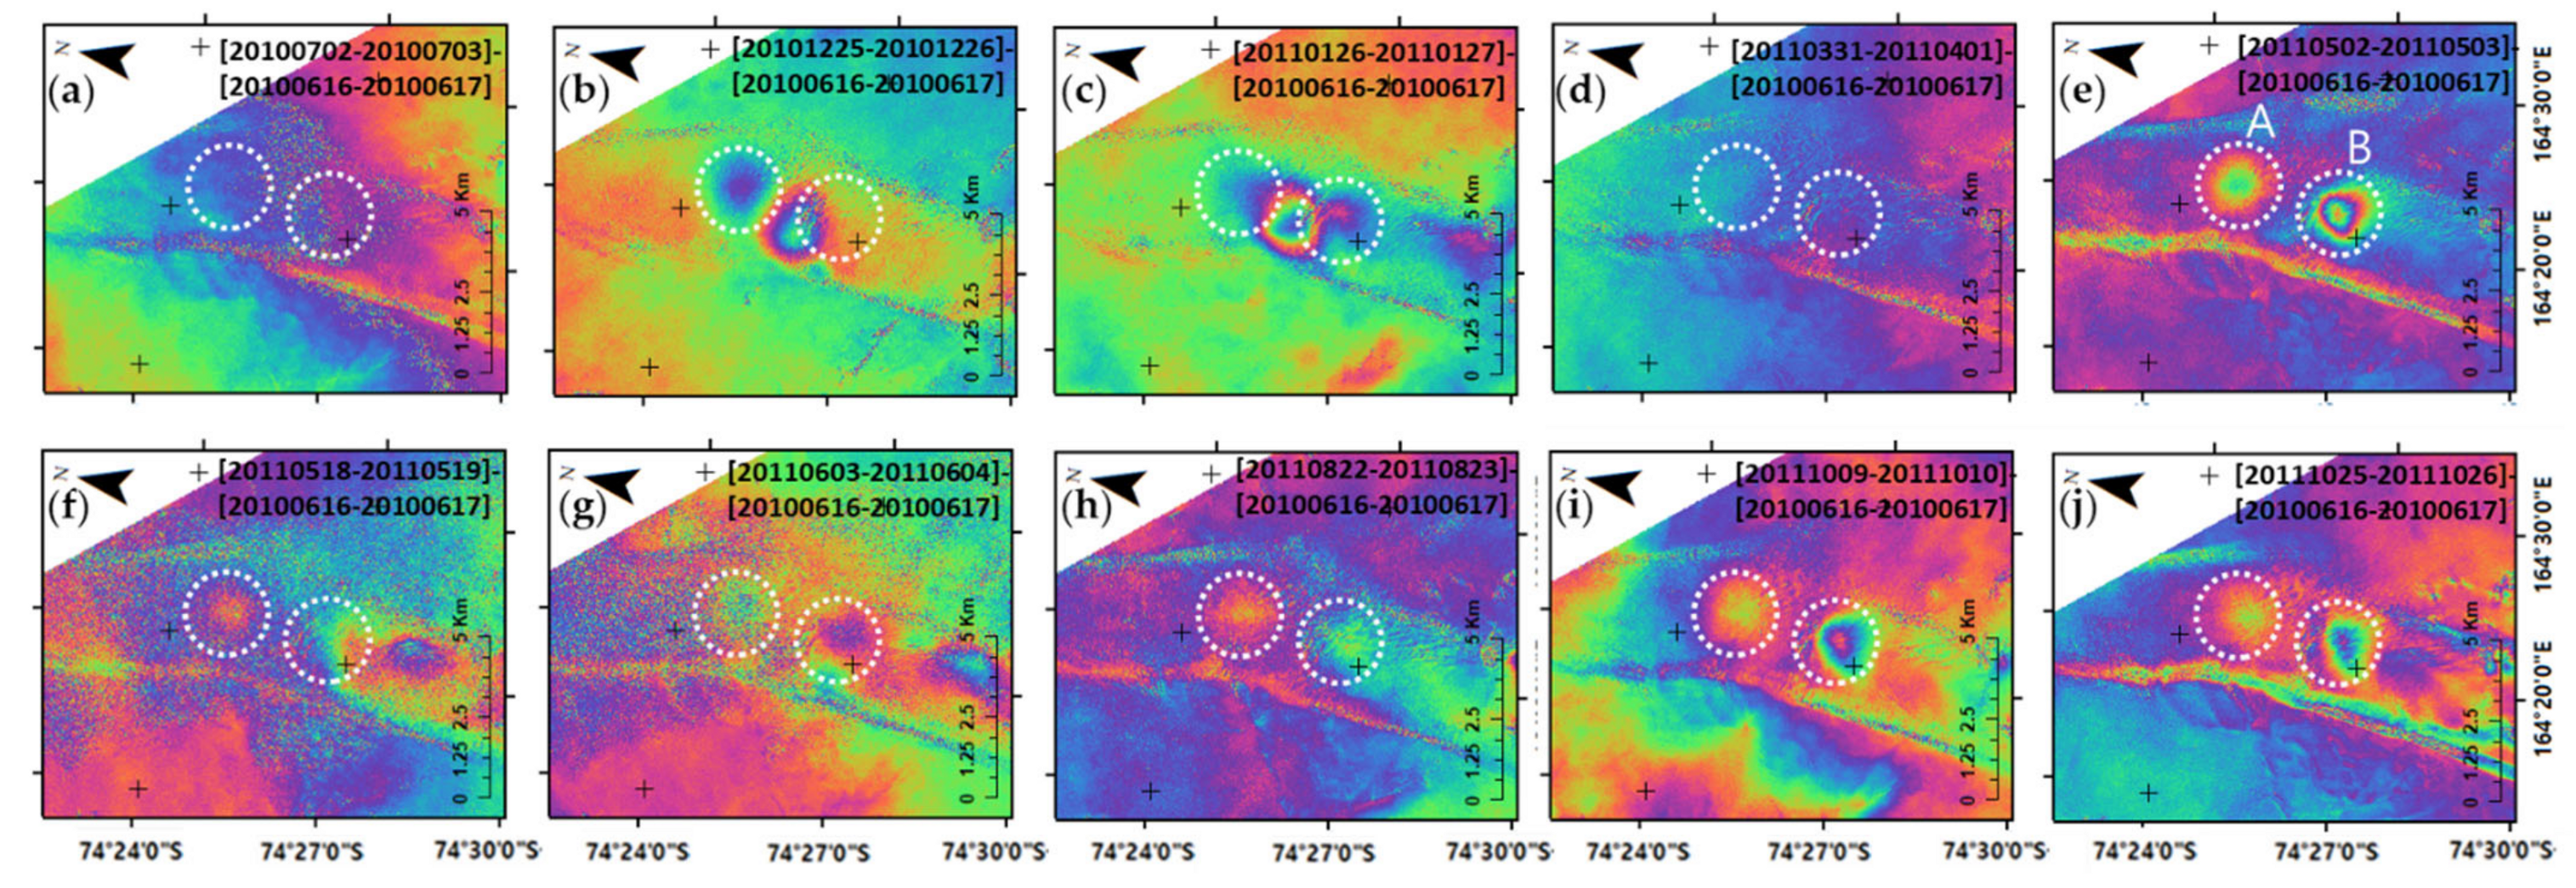
(a–j) A series of DDInSAR images of Campbell Glacier near the anomalies A and B. One color cycle represents 2 phase. The dotted circles A and B were drawn based on (e) and their locations are identical at each image for comparison.
A series of DDInSAR images in Figure 4 shows the change of anomalies in location, shape, and magnitude. Dotted circles are drawn based on Figure 4e and have the same location and size in all sub-images for comparison. The locations of two anomalies are almost identical even though the amplitude fluctuates. Exceptions are Figure 4b,c where there exists only one anomaly and the locations are between A and B. Particularly in Figure 4c, some a fluvial feature appears to be flowing out of the circular anomaly, implying the action of basal water.
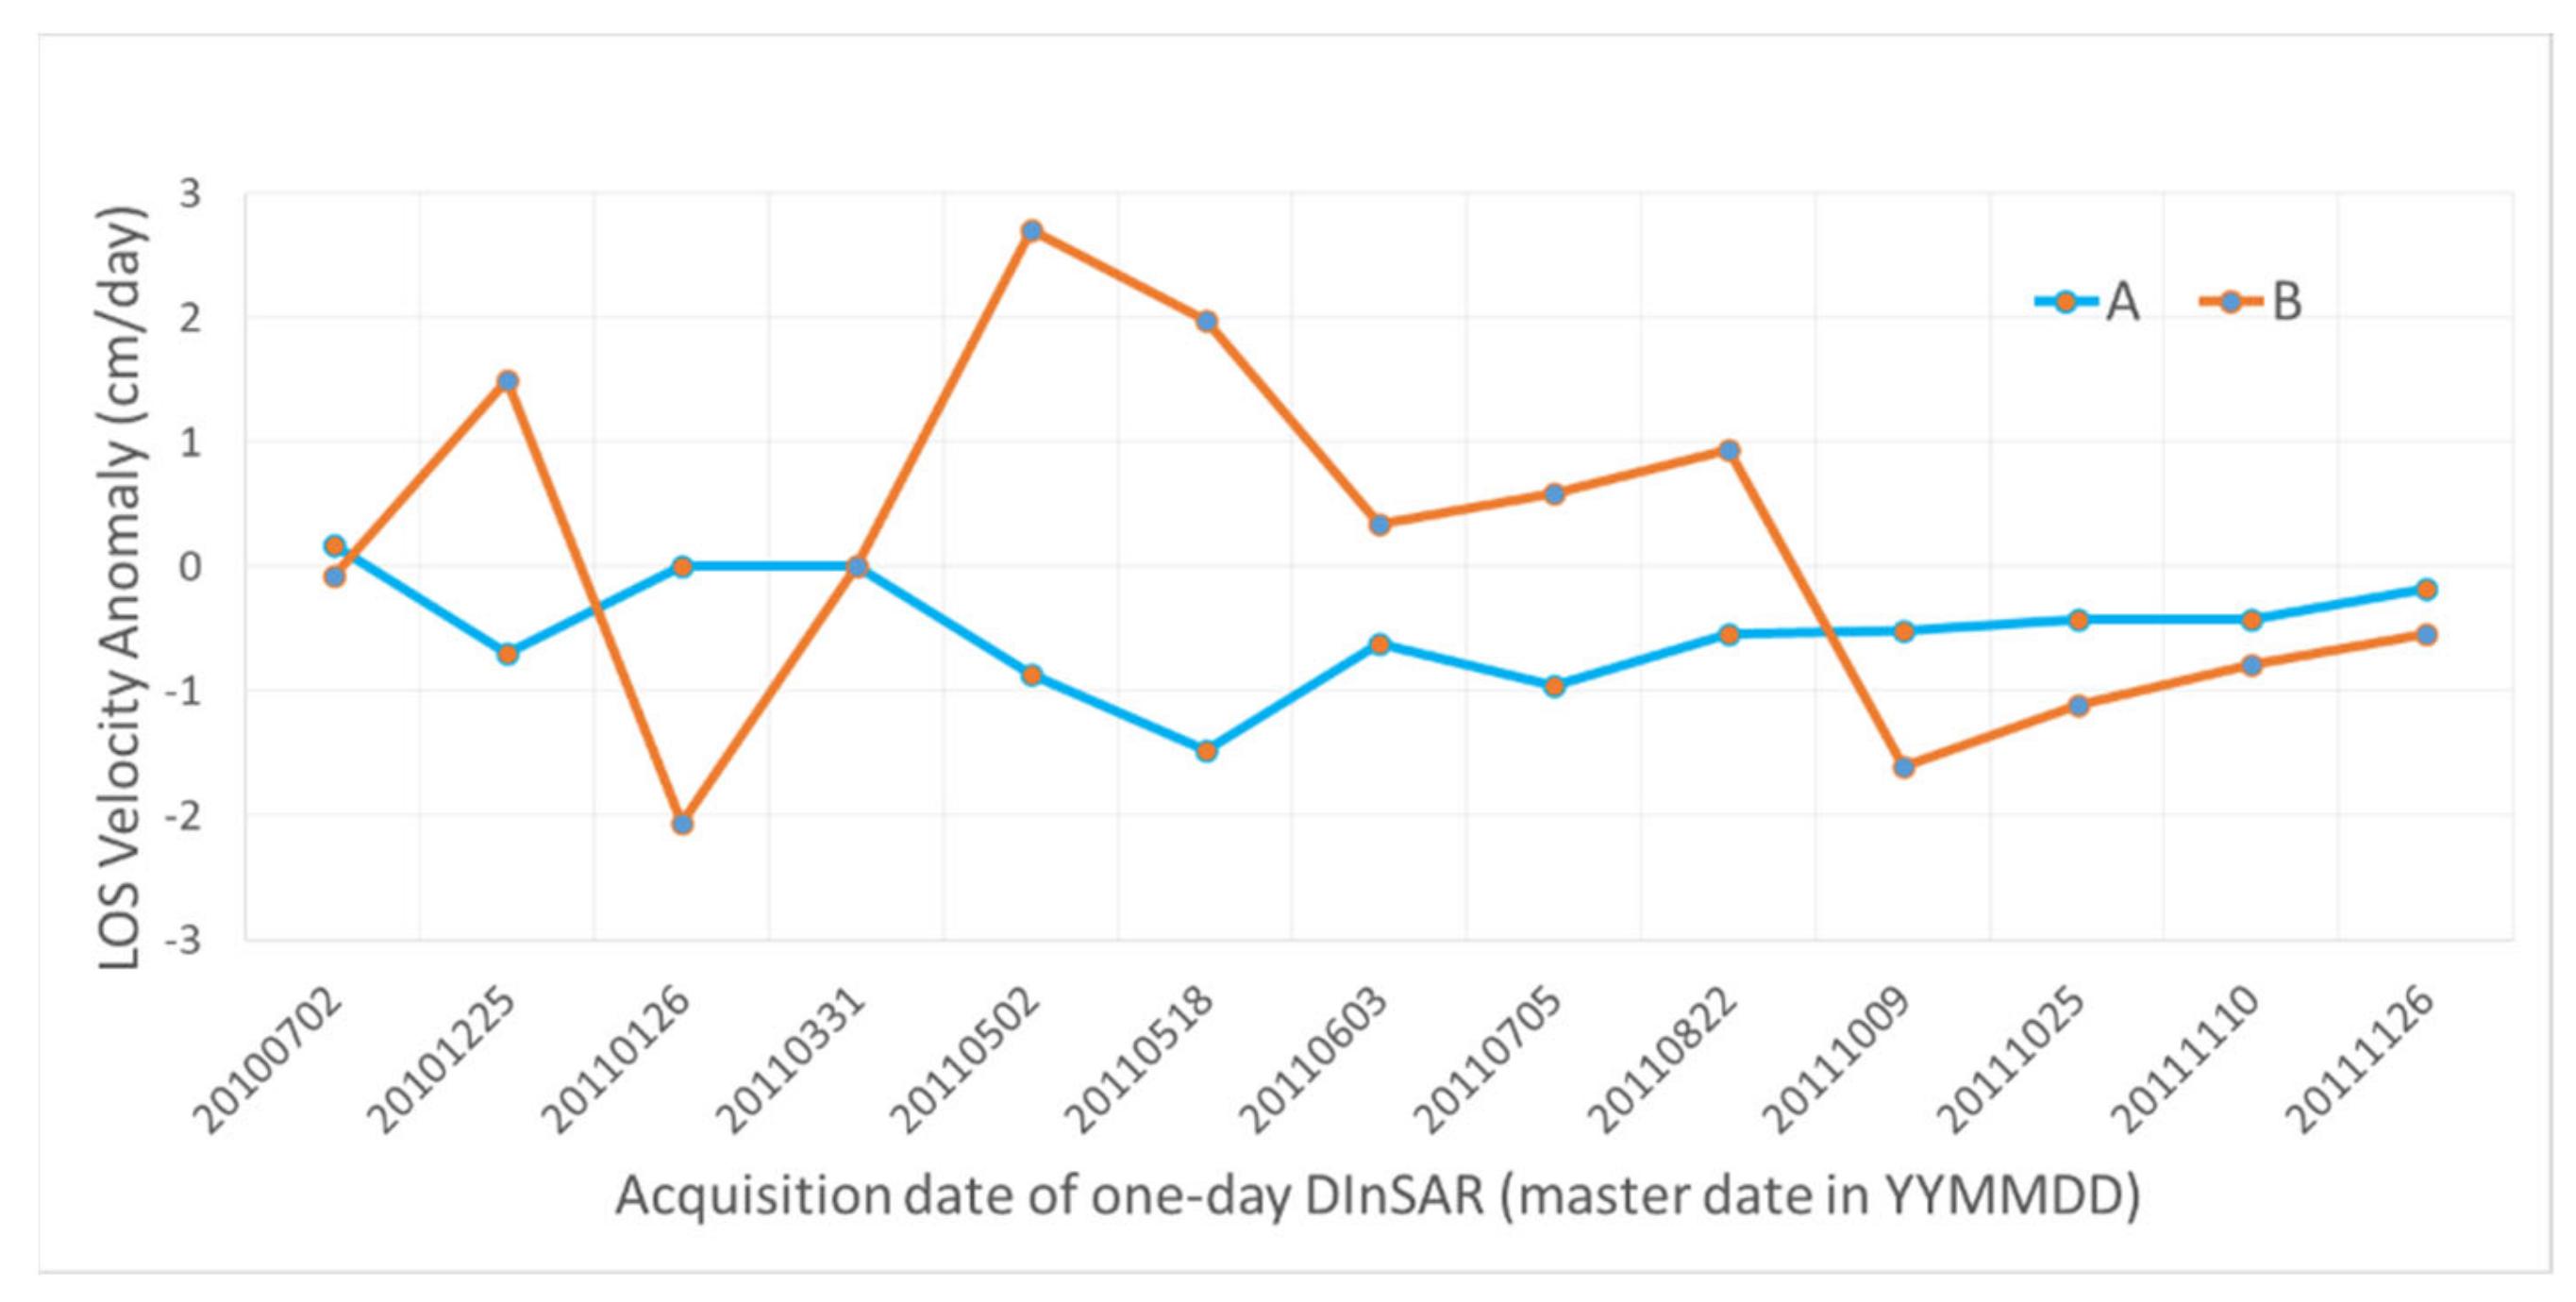
Figure 5 presents the temporal variation of the velocity anomaly in A and B at the centers of the dotted circles shown in the sub-images of Figure 4. The amplitude of velocity anomaly for A is ~1cm/day, which is smaller value than that of B with ~5 cm/day. Considering the range direction (from satellite to target) and the ice flow direction, a positive anomaly value means either acceleration of horizontal ice flow or inflation (uprising) of ice surface, or a mixture of both. Similarly, negative anomalies mean either slow-down in horizontal flow or vertical depression (subsidence) of ice surface, or a mixture of both. It is worth noting that the velocity anomalies are the ice velocity difference from the master DInSAR pair [20100616-20100617], and the negative values do not represent the reversal of directions of the actual horizontal flow or vertical motion, if any.
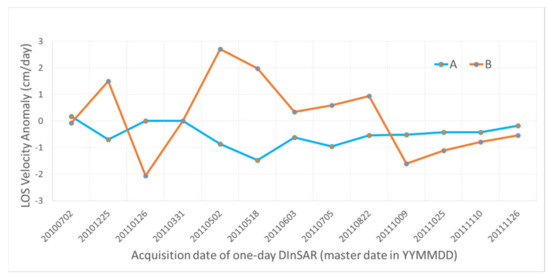
Figure 5.
LOS velocity anomaly in A and B of Campbell Glacier, relative to the DInSAR pair [20100616_20100617]. The anomaly A has higher variation of LOS velocity than B.
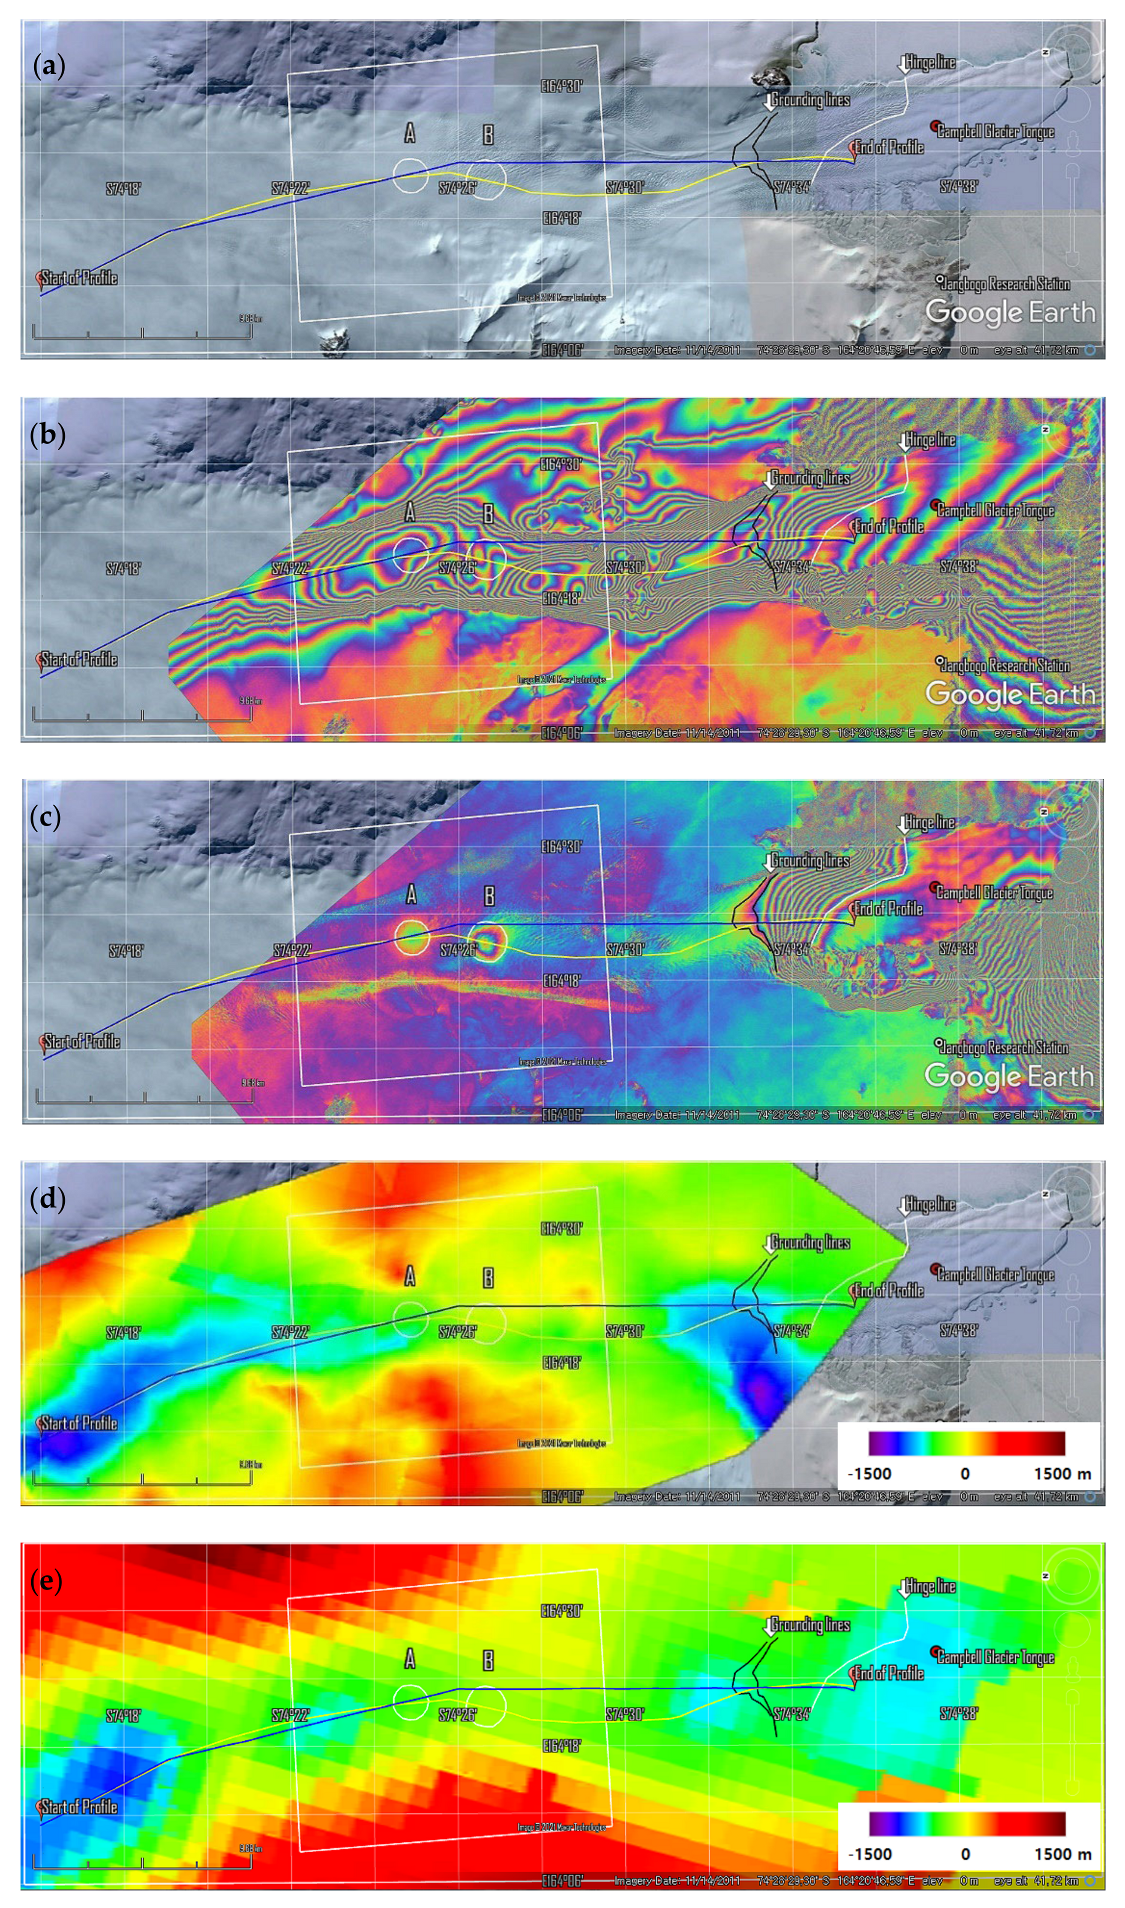
Figure 6 shows the enlarged surface features and bed topography of Campbell Glacier along the profile lines. Figure 6a is an optical image in Google Earth, showing that transverse crevasses begin to develop from anomaly B, while there are no crevasses in A or upstream. Figure 6b is the DInSAR image based on which the profile line along the valley is drawn alongside with a survey line. Figure 6c is an example of DDInSAR image showing two anomalies A and B, a hinge line, and two possible grounding lines to be determined later from a radargram. Figure 6d is the IPR-derived bed topography generated in this study, and (e) is the Bedmap2 bed topography for comparison. The IPR bed topography has a better resolution of ~88 m than that of Bedmap2 with 1 km pixel spacing.
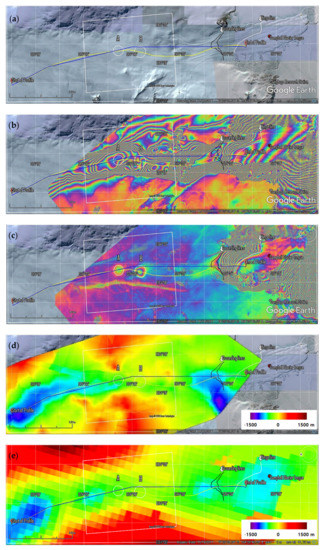
Figure 6.
Surface and bed images of Campbell Glacier: (a) Google Earth image; (b) DInSAR image; (c) DDInSAR image; (d) IRP-derived bed topography; and (e) Bedmap2-derived bed topography. The yellow profile line is along the fastest ice-velocity in the glacier valley, while the blue line is one of the IPR survey line that crosses the anomalies A and B depicted as circles. The white box is the extent of Figure 4.
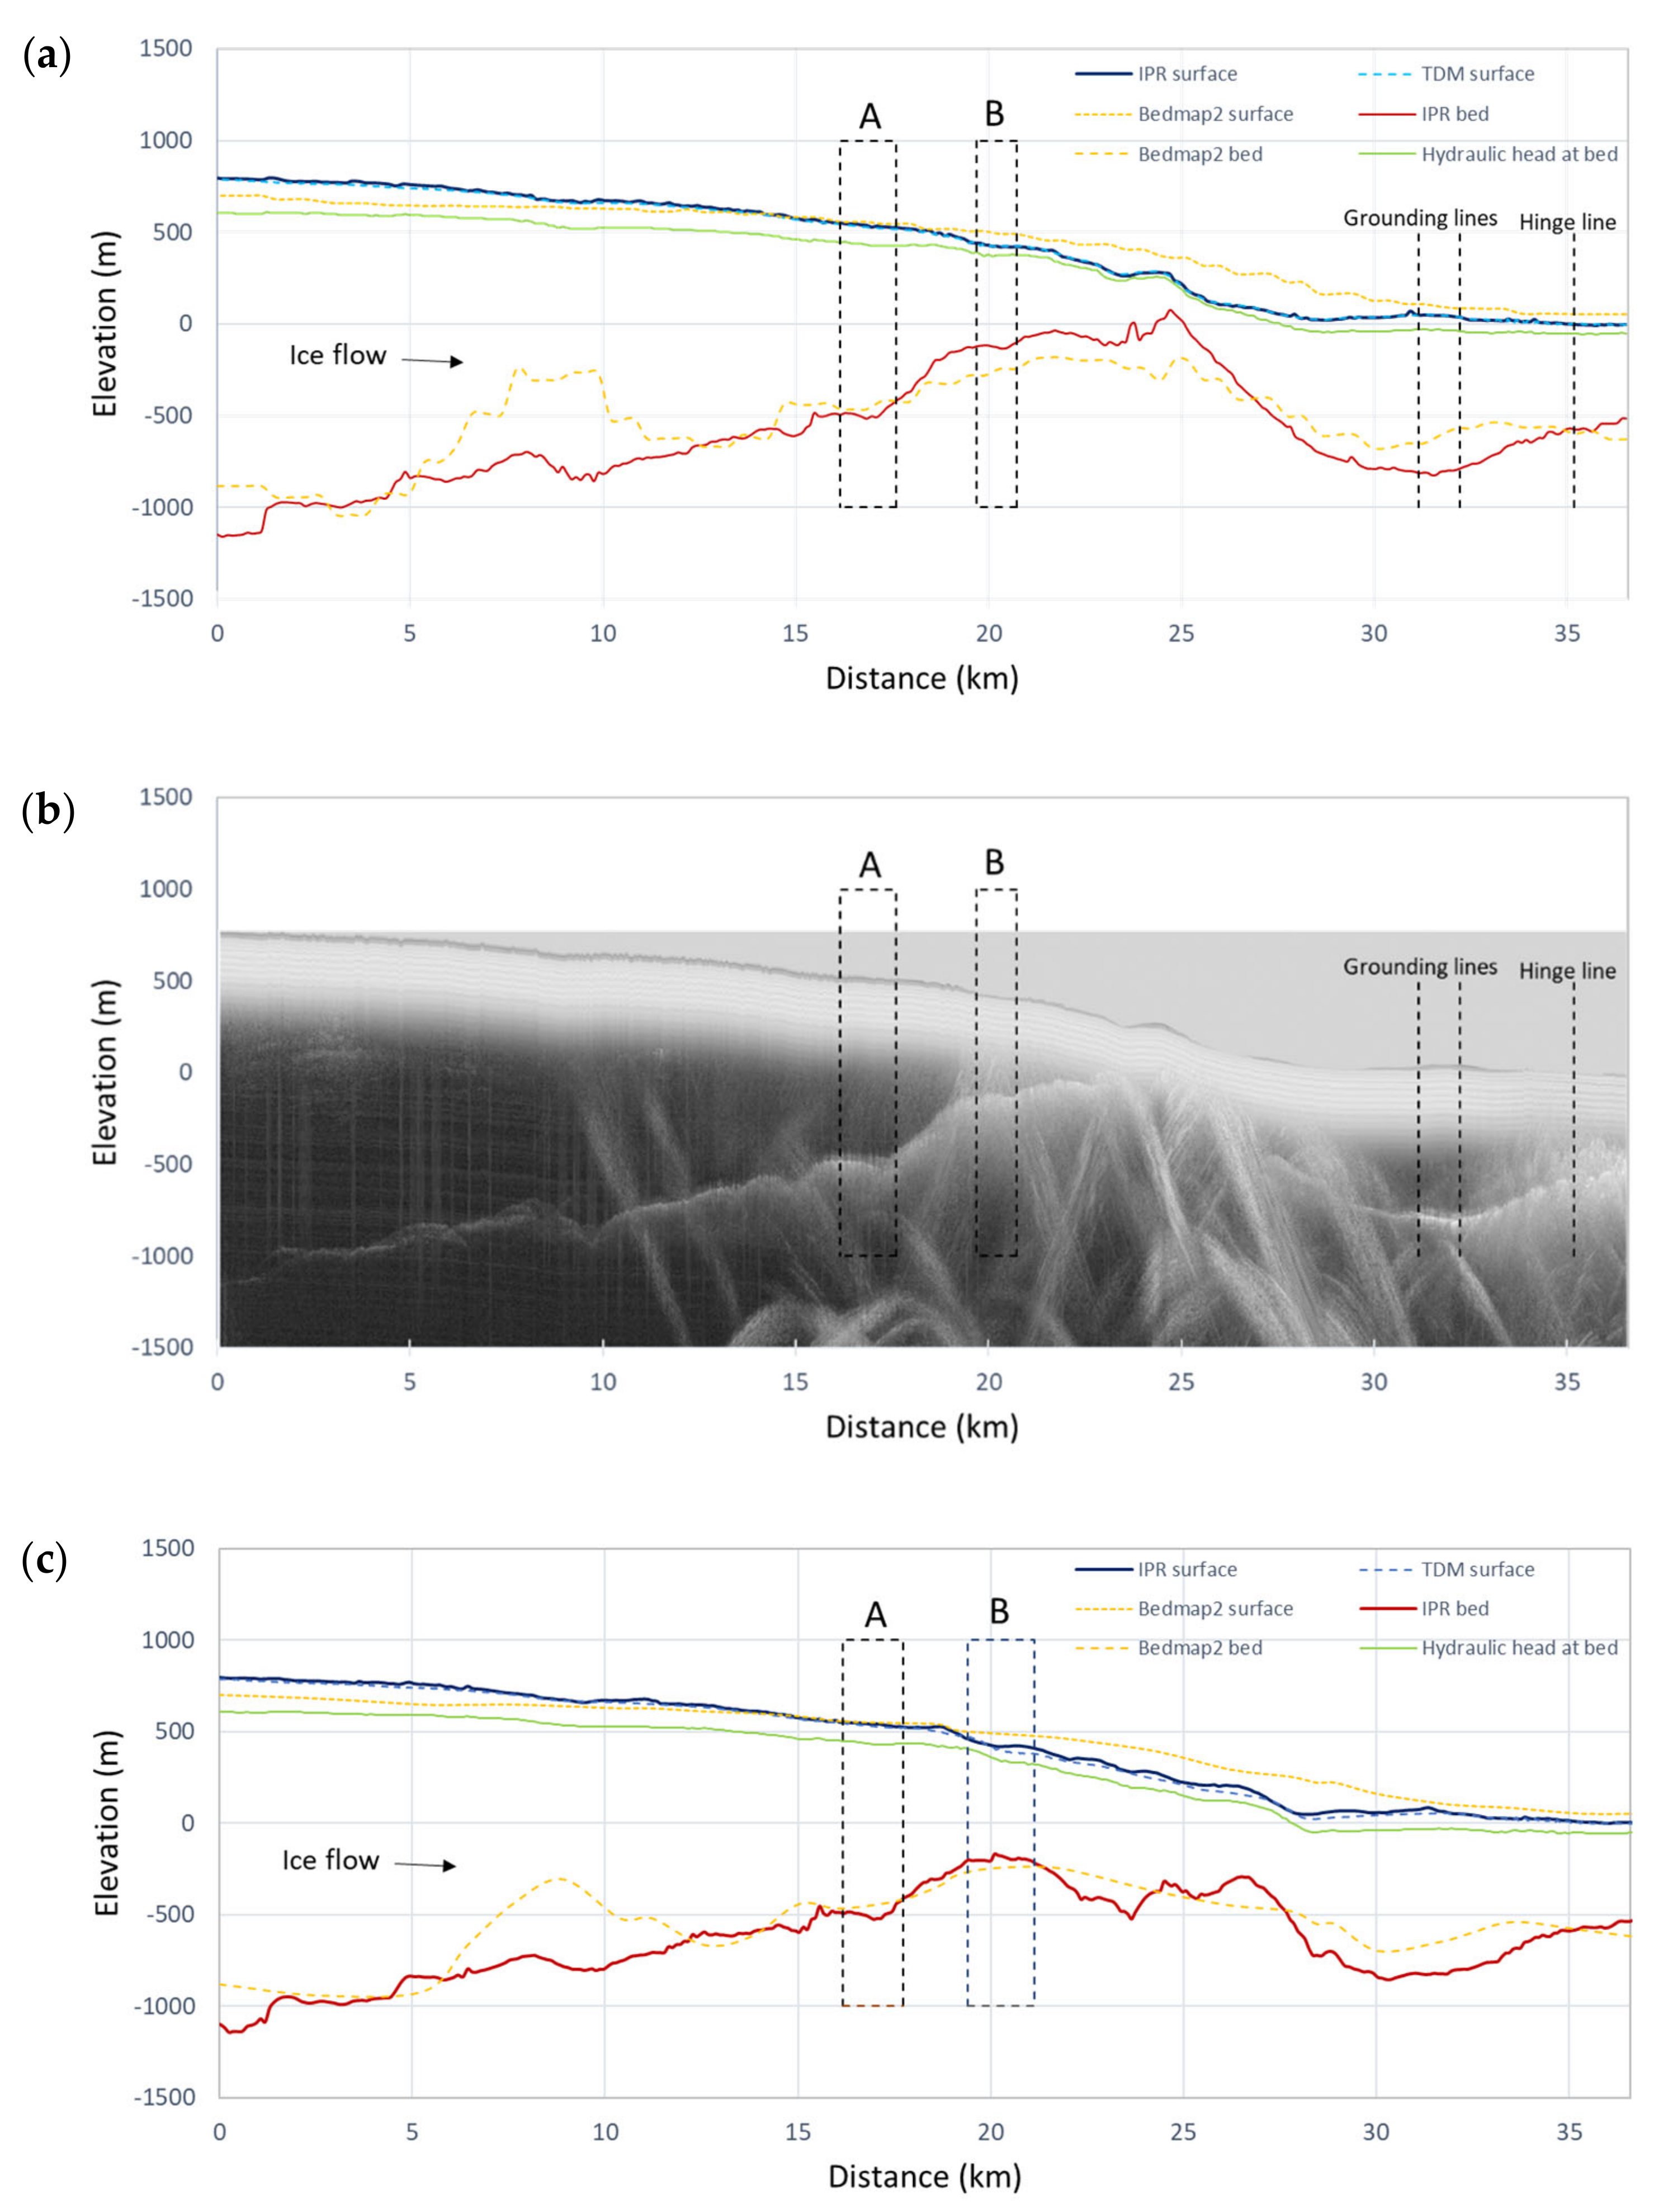
Figure 7 shows the profiles of the ice body along the IPR survey line. Figure 7a is along the survey line intersecting the center of anomaly A, but it slightly touches anomaly B. IPR surface profile matches almost exactly with TanDEM-X DEM, while there is a large discrepancy with Bedmap2 surface elevation of up to 200 m. IPR-derived surface elevation is about 100 m higher than Bedmap2 in the beginning of the profile, gradually crosses at a distance of 18 km, and lower than Bedmap2 by a maximum of 200 m. This is not a temporal change of ice elevation but is thought to be an error in Bedmap2, because IPR and TanDEM-X match very well even though they were obtained completely independently. The radargram in Figure 7b supports the credibility of IPR bed topography because a large bed hill observed in Bedmap2 at a distance of 6–12 km does not appear in the radargram. Moreover, the resolution along the IRP survey line is about 7 m, far better than Bedmap2 bed data with 1 km pixel spacing. The hydraulic head at the bed shows gradual ice flow, but it has a hill to prevent flow at a distance of 25 km, as shown Figure 7a. The flow should divert from the survey line to overcome the bed hill in Figure 7a.
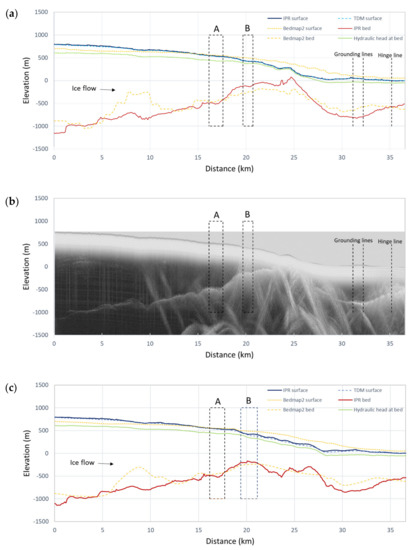
Figure 7.
Ice surface and bed profiles of Campbell Glacier: (a) along the survey line; (b) the corresponding radargram; (c) along the glacier valley line. Note the similarity of surface profiles between IPR and TanDEM-X DEM, and the better resolution of IPR-derived bed topography than Bedmap2. IRP-derived bed topography in (c) along the glacier valley indicates that A is relatively flat along the bed hill, while B is on top of the hill. A has high possibility of a subglacial water reservoir due to the bright radar signal in (b) and the flat hydraulic head both in (a,c). Note the two profiles overlap each other in A while they deviate in B.
A radargram in Figure 7b shows a very bright feature in anomaly A. This region has a flat bed and hydraulic head, suggesting a possible water reservoir at the ice bed in A. The bight radar reflection of A is very similar to the one in the hinge zone, defined from grounding line to hinge line, as shown in Figure 7b. There is an ambiguity of the grounding line in the DDInSAR image in Figure 6c because the slight phase transition between the two possible grounding lines might be of atmospheric signal or may deliver the surface moisture content, not the elastic motion of hinge dynamics. However, the bright radar return in the radargram in Figure 7b assures the existence of basal water in the upstream grounding line. Note that anomaly B has a flat hydraulic head and bed topography, but radar return is not as strong as that for A.
Figure 7c is the profile along the glacier valley where maximum local velocity occurs. In contrast to Figure 7a,b, the hydraulic head naturally flows downstream without blockage. Again, anomaly A is on a flat bed, as the profile line is similar to the survey line. However, B is on top of a bed hill. This is coincident with the fact that transverse crevasses begin to appear at B due to tensile stress from the bed hill.
4. Discussion
It was confirmed that the IRP-derived bed topography and radargram give information on detailed topography and the existence of water at ice bottom. The profile along the valley of the glacier confirmed that there is a large hill under anomalies A and B, where A is the uphill side and B is on top of it. Temporal change of velocity can be explained by the stick-slip mechanism at the interface of ice and bed. The existence of water at A is supported with high radar reflection comparable to that of the water in the hinge zone and the flat hydraulic head. Basal water in anomaly A might have lubricated the ice-bed interface, reducing the amplitude of stick-slip motion of ~1 cm/day. There is no such positive evidence of water in anomaly B lying at the top of the hill, having a relatively large amplitude of stick-slip motion of ~5 cm/day throughout the year. Crevasses were generated in B due to tensile stress caused by the underlying hill.
The source of basal water in anomaly A could be either external or internal. External water could be supplied from surface or interglacial melt water [7]. If the surface melt water infiltration is the source of basal water, then the amplitude of anomaly should be reduced in the Antarctic summer, with increased lubrication of basal water and thus a reduction of the amplitude of stick-slip phenomenon [39,40]. However, no seasonal tendency in velocity anomaly of A was observed as shown in Figure 5. Apart from the external sources of water, pressure melt can be an internal source of water, where water melts in the uphill and refreeze in the downhill side of the hill [41]. This may well explain the year-long low amplitude of the stick-slip mechanism in A, and relatively high amplitude in B. Other sources of water could be geothermal heat from the Mt. Melbourne volcano, which is located about 10 km from the study area. A study by Gambino et al. [42] detected a long-term slow surface change of the Mt. Melbourne volcano and suggested that the surface change was caused by a shallow depth of hot water. However, the small scale of circular anomalies isolated from the volcano weakens the possibility of geothermal heat being the source of water.
The observation period in this study was only a year and a half, due to the limited availability of the COSMO-SkyMED one-day tandem InSAR pair for the study area. Long term observation of SAR data with a short temporal baseline is necessary to analyze the seasonal trend of the anomalies, the feasibility of the stick-slip mechanism, and the effect of basal water on ice velocity in more detail. The radargram provides much more information on reflecting targets than the ice bed topography, which is a byproduct of radargrams. It is also suggested that the flight paths of IPR survey need to be adjusted to pass the area of interest, which remains as a topic for further study.
5. Conclusions
In this study, two circular-shaped ice-velocity anomalies were observed in Campbell Glacier, East Antarctica by using 13 DDInSAR images generated from COSMO-SkyMED one-day tandem pairs obtained in 2010–2011. Firstly, DInSAR was used to define the valley of the glacier with local maximum velocity across the ice flow. Ice bed topography was also obtained from the helicopter-borne IPR surveys in 2016–2017 operated by the Korean Polar Research Institute. The year-long amplitude of velocity anomalies were ~1cm/day for anomaly A, located 14.7 km from the grounding line of the glacier, and ~5 cm/day for anomaly B, located 11.3 km from the grounding line. Both anomalies are located on a bed hill along the glacial valley where stick-slip and pressure melting can occur resulting in temporal variation of ice velocity. Bright radar reflection and the flat hydraulic head at the ice bed of anomaly A observed from the IPR-derived radargram strongly suggest the existence of basal water in the form of a reservoir or film. Smaller friction and a reduced variation of stick-slip motion would have occurred in A than in B. Crevasses begin to appear at B due to tensile stress at the top of the hill and the fast-flowing downhill. Changes of locations in the anomalies suggest complex pressure melting and transportation of the basal water over the bed hill. The location of the grounding line that had remained ambiguously in the DDInSAR image was also confirmed by the bright radar return from the basal water. Long-term observation of SAR is necessary to understand the seasonal variability of velocity anomalies and its relationship with basal water and bed topography.
Author Contributions
Conceptualization, H.L. and H.H.; methodology, H.L. and H.H.; software, H.L. and H.J.; validation, H.L., H.S. and H.J.; formal analysis, H.L. and H.J.; investigation, H.S. and H.J.; resources, H.H. and J.L.; data curation, H.L.; writing—original draft preparation, H.L. and H.S.; writing—review and editing, H.H. and H.J.; visualization, H.L., H.J. and H.S.; supervision, H.L. and J.L.; project administration, H.L., H.H. and J.L.; funding acquisition, H.L., H.H. and J.L. All authors have read and agreed to the published version of the manuscript.
Funding
This research was funded by the National Research Foundation of Korea (NRF-2019R1F1A1041389, NRF-2021R1C1C1009621 and No. 2019R1A6A1A03033167) and also by Korea Polar Research Institute (No. PE21080 and PE21070).
Institutional Review Board Statement
Not applicable.
Informed Consent Statement
Not applicable.
Data Availability Statement
The data presented in this study are available on request from the corresponding author. TanDEM-X DEM data were provided by the German Aerospace Center (DLR) under the project DEM_GLAC1183.
Conflicts of Interest
The authors declare no conflict of interest.
References
- Allison, I.; Alley, R.B.; Fricker, H.A.; Thomas, R.H.; Warner, R.C. Ice sheet mass balance and sea level. Antarct. Sci. 2009, 21, 413–426. [Google Scholar] [CrossRef]
- Hanna, E.; Navarro, F.J.; Pattyn, F.; Domingues, C.M.; Fettweis, X.; Ivins, E.R.; Nicholls, R.J.; Ritz, C.; Smith, B.; Tulaczyk, S.; et al. Ice-sheet mass balance and climate change. Nature 2013, 498, 51–59. [Google Scholar] [CrossRef] [PubMed]
- DeConto, R.M.; Pollard, D. Contribution of Antarctica to past and future sea-level rise. Nature 2016, 531, 591–597. [Google Scholar] [CrossRef] [PubMed]
- Bennett, R.M.; Glasser, N.F. Glacial Geology: Ice Sheets and Landforms, 2nd ed.; John Wiley & Sons Ltd.: Chichester, UK, 2009; pp. 69–79. [Google Scholar]
- Rignot, E.; Vaughan, D.G.; Schmeltz, M.; Dupont, T.; MacAyeal, D. Acceleration of Pine Island and Thwaites Glaciers, West Antarctica. Ann. Glaciol. 2002, 34, 189–194. [Google Scholar] [CrossRef]
- Weertman, J.; Birchfield, G.E. Basal water film, basal water pressure, and velocity of traveling waves on glaciers. J. Glaciol. 1983, 29, 20–27. [Google Scholar] [CrossRef]
- Zwally, H.J.; Abdalati, W.; Herring, T.; Larson, K.; Saba, J.; Steffen, K. Surface melt-induced acceleration of Greenland Ice-Sheet flow. Science 2002, 297, 218–222. [Google Scholar] [CrossRef]
- Macgregor, K.R.; Riihimaki, C.A.; Anderson, R.S. Spatial and temporal evolution of rapid basal sliding on Bench Glacier, Alaska, USA. J. Glaciol. 2005, 51, 49–63. [Google Scholar] [CrossRef]
- Stearns, L.A.; Smith, B.E.; Hamilton, G.S. Increased flow speed on a large East Antarctic outlet glacier caused by subglacial floods. Nat. Geosci. 2008, 1, 827–831. [Google Scholar] [CrossRef]
- Thoma, M.; Grosfeld, K.; Mayer, C.; Pattyn, F. Interaction between ice sheet dynamics and subglacial lake circulation: A coupled modelling approach. Cryosphere 2010, 4, 1–12. [Google Scholar] [CrossRef]
- Bartholomew, I.; Nienow, P.; Sole, A.; Mair, D.; Cowton, T.; King, M.A. Short-term variability in Greenland Ice Sheet motion forced by time-varying meltwater drainage: Implications for the relationship between subglacial drainage system behavior and ice velocity. J. Geophy. Res. 2012, 117, F03002. [Google Scholar] [CrossRef]
- Bell, R.E.; Studinger, M.; Shuman, C.A.; Fahnestock, M.A.; Joughin, I. Large subglacial lakes in East Antarctica at the onset of fast-flowing ice streams. Nature 2007, 445, 904–907. [Google Scholar] [CrossRef]
- Han, H.; Lee, H. Tide-corrected flow velocity and mass balance of Campbell Glacier Tongue, East Antarctica, derived from interferometric SAR. Remote Sens. Environ. 2015, 160, 180–192. [Google Scholar] [CrossRef]
- Han, H.; Lee, H. Surface strain rates and crevassing of Campbell Glacier Tongue in East Antarctica analysed by tide-corrected DInSAR. Remote Sens. Lett. 2017, 8, 330–339. [Google Scholar] [CrossRef]
- Gray, L.; Joughin, I.; Tulaczyk, S.; Spikes, V.B.; Bindschadler, R.; Jezek, K. Evidence for subglacial water transport in the West Antarctic Ice Sheet through three-dimensional satellite radar interferometry. Geophy. Res. Lett. 2005, 32, L03501. [Google Scholar] [CrossRef]
- Palmer, S.; McMillan, M.; Morlighem, M. Subglacial lake drainage detected beneath the Greenland ice sheet. Nat. Commun. 2015, 6, 8408. [Google Scholar] [CrossRef]
- Rignot, E. Tidal motion, ice velocity and melt rate of Petermann Gletscher, Greenland, measured from radar interferometry. J. Glaciol. 1996, 42, 476–485. [Google Scholar] [CrossRef]
- Rignot, E.; Mouginot, J.; Scheuchl, B. Antarctic grounding line mapping from differential satellite radar interferometry. Geophy. Res. Lett. 2011, 38, L10504. [Google Scholar] [CrossRef]
- Han, H.; Lee, H. Tide deflection of Campbell Glacier Tongue, Antarctica, analyzed by double-differential SAR interferometry and finite element method. Remote Sens. Environ. 2014, 141, 201–213. [Google Scholar] [CrossRef]
- Han, S.; Han, H.; Lee, H. Grounding line change of Ronne Ice Shelf, West Antarctica, from 1996 to 2015 observed by using DDInSAR. Korean J. Remote Sens. 2018, 34, 17–24. [Google Scholar]
- Lyon, G.L. Stable isotope stratigraphy of ice cores and the age of the last eruption at Mount Melbourne, Antarctica. N. Z. J. Geol. Geophy. 1986, 29, 135–138. [Google Scholar] [CrossRef]
- Han, H.; Lee, H. Glacial and tidal strain of landfast sea ice in Terra Nova Bay, East Antarctica, observed by interferometric SAR techniques. Remote Sens. Environ. 2018, 209, 41–51. [Google Scholar] [CrossRef]
- Covello, F.; Battazza, F.; Coletta, A.; Lopinto, E.; Fiorentino, C.; Pietranera, L.; Valentini, G.; Zoffoli, S. COSMO-Skymed an existing opportunity for observing the Earth. J. Geodyn. 2010, 49, 171–180. [Google Scholar] [CrossRef]
- Chen, C.W.; Zebker, H.A. Two-dimensional phase unwrapping with use of statistical models for cost functions in nonlinear optimization. J. Opt. Soc. Am. A 2001, 18, 338–351. [Google Scholar] [CrossRef] [PubMed]
- Lindzey, L.E.; Beem, L.H.; Young, D.A.; Quartini, E.; Blankenship, D.D.; Lee, C.K.; Lee, W.S.; Lee, J.I.; Lee, J.H. Aerogeophysical characterization of an active subglacial lake system in the David Glacier catchment, Antarctica. Cryosphere 2020, 14, 2217–2233. [Google Scholar] [CrossRef]
- Young, D.A.; Schroeder, D.M.; Blankenship, D.D.; Kempf, S.D.; Quartini, E. The distribution of basal water between Antarctic subglacial lakes from radar sounding. Philos. Trans. R. Soc. A 2016, 374, 20140297. [Google Scholar] [CrossRef] [PubMed]
- Greenbaum, J.S.; Blankenship, D.D.; Young, D.A.; Richter, T.G.; Roberts, J.L.; Aitken, A.R.A.; Legresy, B.; Schroeder, D.M.; Warner, R.C.; van Ommen, T.D.; et al. Ocean access to a cavity beneath Totten Glacier in East Antarctica. Nat. Geosci. 2015, 8, 294–298. [Google Scholar] [CrossRef]
- Peters, M.E.; Blankenship, D.D.; Carter, S.P.; Kempf, S.D.; Young, D.A.; Holt, J.W. Along-track focusing of airborne radar sounding data from West Antarctica for improving basal reflection analysis and layer detection. IEEE Trans. Geosci. Remote Sens. 2007, 45, 2725–2736. [Google Scholar] [CrossRef]
- Peters, M.E.; Blankenship, D.D.; Morse, D.L. Analysis techniques for coherent airborne radar sounding: Application to West Antarctic ice streams. J. Geophys. Res. 2005, 110, B06303. [Google Scholar] [CrossRef]
- Peters, M.E.; Blankenship, D.D.; Smith, D.E.; Holt, J.W.; Kempf, S.D. The distribution and classification of bottom crevasses from radar sounding of a large tabular iceberg. IEEE Geosci. Remote Sens. Lett. 2007, 4, 142–146. [Google Scholar] [CrossRef]
- Borgorodsky, V.V.; Bentley, C.R.; Gudmandsen, P.E. Radioglaciology, D; Reidel Publishing Company: Dordrecht, The Netherlands, 1985. [Google Scholar]
- Reynolds, J.M. Dielectric behaviour of firn and ice from the Antarctic Peninsula, Antarctica. J. Glaciol. 1985, 31, 253–262. [Google Scholar] [CrossRef][Green Version]
- Matheron, G. Principles of geostatistics. Econ. Geol. 1963, 58, 1246–1266. [Google Scholar] [CrossRef]
- Vaughan, D.G.; Rivera, A.; Woodward, J.; Corr, H.F.J.; Wendt, J.; Zamora, R. Topographic and hydrological controls on Subglacial Lake Ellsworth, West Antarctica. Geophy. Res. Lett. 2007, 34, L18501. [Google Scholar] [CrossRef]
- Cuffey, K.M.; Paterson, W.S.B. The Physics of Glaciers, 4th ed.; Elsevier: Burlington, MA, USA, 2010. [Google Scholar]
- Carter, S.P.; Blankenship, D.D.; Peters, M.E.; Young, D.A.; Holt, J.W.; Morse, D.L. Radar-based subglacial lake classification in Antarctica. Geochem. Geophy. Geosy. 2007, 8, Q03016. [Google Scholar] [CrossRef]
- Rivera, A.; Uribe, J.; Zamora, R.; Oberreuter, J. Subglacial Lake CECs: Discovery and in situ survey of a privileged research site in West Antarctica. Geoph. Res. Lett. 2015, 42, 3944–3953. [Google Scholar] [CrossRef]
- Fretwell, P.; Pritchard, H.D.; Vaughan, D.G.; Bamber, J.L.; Barrand, N.E.; Bell, R.; Bianchi, C.; Bingham, R.G.; Blankenship, D.D.; Casassa, G.; et al. Bedmap2: Improved ice bed, surface and thickness datasets for Antarctica. Cryosphere 2013, 7, 375–393. [Google Scholar] [CrossRef]
- Bahr, D.B.; Rundle, J.B. Stick-slip statistical mechanics at the bed of a glacier. Geophy. Res. Lett. 1996, 23, 2073–2076. [Google Scholar] [CrossRef]
- Fischer, U.H.; Clarke, G.K. Stick–slip sliding behaviour at the base of a glacier. Ann. Glaciol. 1997, 24, 390–396. [Google Scholar] [CrossRef]
- Jordan, T.M.; Williams, C.N.; Schroeder, D.M.; Martos, Y.M.; Cooper, M.A.; Siegert, M.J.; Paden, J.D.; Huybrechts, P.; Bamber, J.L. A constraint upon the basal water distribution and thermal state of the Greenland Ice Sheet from radar bed echoes. Cryosphere 2018, 12, 2831–2854. [Google Scholar] [CrossRef]
- Gambino, S.; Aloisi, M.; Falzone, G.; Ferro, A. Tilt signals at Mount Melbourne, Antarctica: Evidence of a shallow volcanic source. Polar Res. 2016, 35, 28269. [Google Scholar] [CrossRef]
Publisher’s Note: MDPI stays neutral with regard to jurisdictional claims in published maps and institutional affiliations. |
© 2021 by the authors. Licensee MDPI, Basel, Switzerland. This article is an open access article distributed under the terms and conditions of the Creative Commons Attribution (CC BY) license (https://creativecommons.org/licenses/by/4.0/).

