Article

Effects of Beach Nourishment Project on Coastal Geomorphology and Mangrove Dynamics in Southern Louisiana, USA

1
Laboratory of Coastal Dynamics, Graduate Program of Geology and Geochemistry, Federal University of Pará, Brazil, Rua Augusto Corrêa, 01-Guamá, Belém CEP 66075-110, Brazil
2
Department of Oceanography and Coastal Sciences, Louisiana State University, Baton Rouge, LA 70803, USA
3
CENA/14C Laboratory, University of São Paulo, Av. Centenário 303, Piracicaba CEP 13400-000, Brazil
4
National Space Research Institute (INPE), Rua dos Astronautas 1758-CP 515, São José dos Campos CEP 12245-970, Brazil
*
Author to whom correspondence should be addressed.
Remote Sens. 2021, 13(14), 2688; https://doi.org/10.3390/rs13142688
Submission received: 7 May 2021 / Revised: 22 June 2021 / Accepted: 1 July 2021 / Published: 8 July 2021
(This article belongs to the Special Issue Human–Environment Interactions Research Using Remote Sensing)

Abstract

:
Relative sea-level (RSL) rise associated with decreased fluvial sediment discharge and increased hurricane activity have contributed to the high rate of shoreline retreat and threatened coastal ecosystems in Port Fourchon, Louisiana, USA. This study, based on QuickBird/drone images (2004–2019) and LIDAR data (1998–2013), analyzed the impacts of shoreline dynamics on mangroves (Avicennia germinans) and marshes before and after the initiation of a beach nourishment project in 2013. The coastal barrier and dune crest migrated landward between 1998 and 2013. Meanwhile, the dune crest height increased between 1998 and 2001, then decreased in 2013, probably due to hurricane impacts. The total sediment volume along this sandy coastal barrier presented an overall trend of decline in the 1998–2013 period, resulting in a wetlands loss of ~15.6 ha along 4 km of coastline. This has led to a landward sand migration onto muddy tidal flats occupied by Avicennia germinans (1.08 ha) and Spartina (14.52 ha). However, the beach nourishment project resulted in the advancement of the beach barrier from Nov/2012 to Jan/2015, followed by a relatively stable period between Jan/2015 and Mar/2019. Additionally, both the dune crest height and sediment volume increased between 2013 and 2019. This set of factors favored the establishment and expansion of mangroves (3.2 ha) and saltmarshes (25.4 ha) along the backbarrier environments after 2013, allowing the tidal flats to keep pace with the RSL rise. However, waves and currents caused shoreline erosion following the beach nourishment project between Oct/2017 and Nov/2019, threatening wetlands by resuming the long-term process of shoreline retreat.

Graphical Abstract

1. Introduction

The Mississippi River Delta has undergone significant geomorphological changes during the Holocene and Anthropocene, exerting impacts on the vegetation and economy of the Louisiana coastal zone [1,2,3,4,5,6]. Port Fourchon, located on the Caminada-Moreau headland at the lower Mississippi River Delta, is one of the most important logistical support centers for the offshore oil production industry in the U.S. This port is the only home-base for offshore oil terminals in the U.S., and serves as the intermodal support hub for ~90% of the Gulf of Mexico drilling and ~16% of the U.S. domestic oil and gas production [7]. However, the rapid acceleration of global sea-level rise (~3.4 mm/year at the present with an expected rise of 65 cm by 2100) has jeopardized the stability of many coastal areas around the world [8], particularly along the Mississippi River Delta, where reduced sediment supply, hurricane activity, and relative sea-level (RSL) rise have been causing shoreline retreat at an alarming rate of ~12–14 m/year [9,10,11,12,13,14,15]. Moreover, three-dimensional geospatial data indicate that the sand dunes at Caminada-Moreau Headlands were migrating inland at a pace of up to 4.4 m/year between 1998 and 2013 [12]—suggesting that both the shoreline and the beach barrier were migrating landward as a response to sea-level rise and reduced sediment supply.
Recent studies investigating the effects of marine hazards, such as storm surges, on coastal areas have been mostly focused on the safety and protection of humans and assets without considering the relevance of coastal ecosystems [16]. In this context, the Caminada-Moreau headland is the home-base and boreal limit of the North American mangroves [17]. Along with being recognized as the most productive ecosystem in the subtropics, mangroves can also mitigate shoreline retreat by attenuating waves, trapping sediments, and accumulating peat soil. These characteristics make mangroves an essential coastal geomorphological component in withstanding sea-level rise and hurricanes [18,19,20,21,22,23,24]. However, a recent study suggests that mangroves cannot withstand a RSL rise exceeding 6.1 mm/year, which is far below the current rate of RSL rise (~9.3 mm/year) in the Port Fourchon area [25]. Hence, both natural and economic functions at the Mississippi River Delta are being threatened by the sea-level rise.
As part of the Louisiana Coastal Protection and Restoration Authority’s coastal restoration effort to strengthen the beach barrier and mitigate the threats of shoreline retreat to the infrastructures and coastal wetlands at the lower Mississippi [26], a beach nourishment project was undertaken in 2013 to replenish 2.8 × 10⁶ m3 of sediments (dredged from offshore) along 9.5 km of coastlines near Port Fourchon [10]. In addition, sand fencing was installed in 2013 along the dunes to control the location and rate of aeolian erosion or sand deposition [27,28]. Dune vegetation (Panicum amarum and Uniola paniculata) was planted in some sectors of the supratidal zone in 2016 [29,30,31]. However, what are the ecological impacts of such abrupt coastal morphodynamic transformations? This concept is not well-understood. For example, the landward migration of beach barriers resulted in the burial of muddy tidal flats and degradation of mangrove vegetation in Brazil [20,23,32]. Mangrove ecotones on high intertidal flats or near the saltwater-freshwater interfaces may migrate landward to indirectly compensate for the loss of mangrove areas in lower intertidal flats, as the influence of saline waters increases during marine incursions [20,23,33,34,35]. Large data gaps exist in the literature regarding the recent coastal transformation at the Mississippi River Delta, and additional research incorporating high-resolution spatial-temporal analysis is needed to provide a robust baseline dataset for Louisiana’s coastal restoration projects. To fill these gaps, this study aims to investigate the interactions between the black mangrove (Avicennia germinans) dynamics and the shoreline retreat before and after the beach nourishment project in the Caminada-Moreau Headlands around Bay Champagne, Louisiana, USA (Figure 1). We provide high-resolution spatial-temporal analysis based on planialtimetric data acquired from satellite, drone, and Lidar data to study the dynamics between the migration of beach barrier and mangrove encroachment from 1998 to 2019 in the light of sea-level rise.

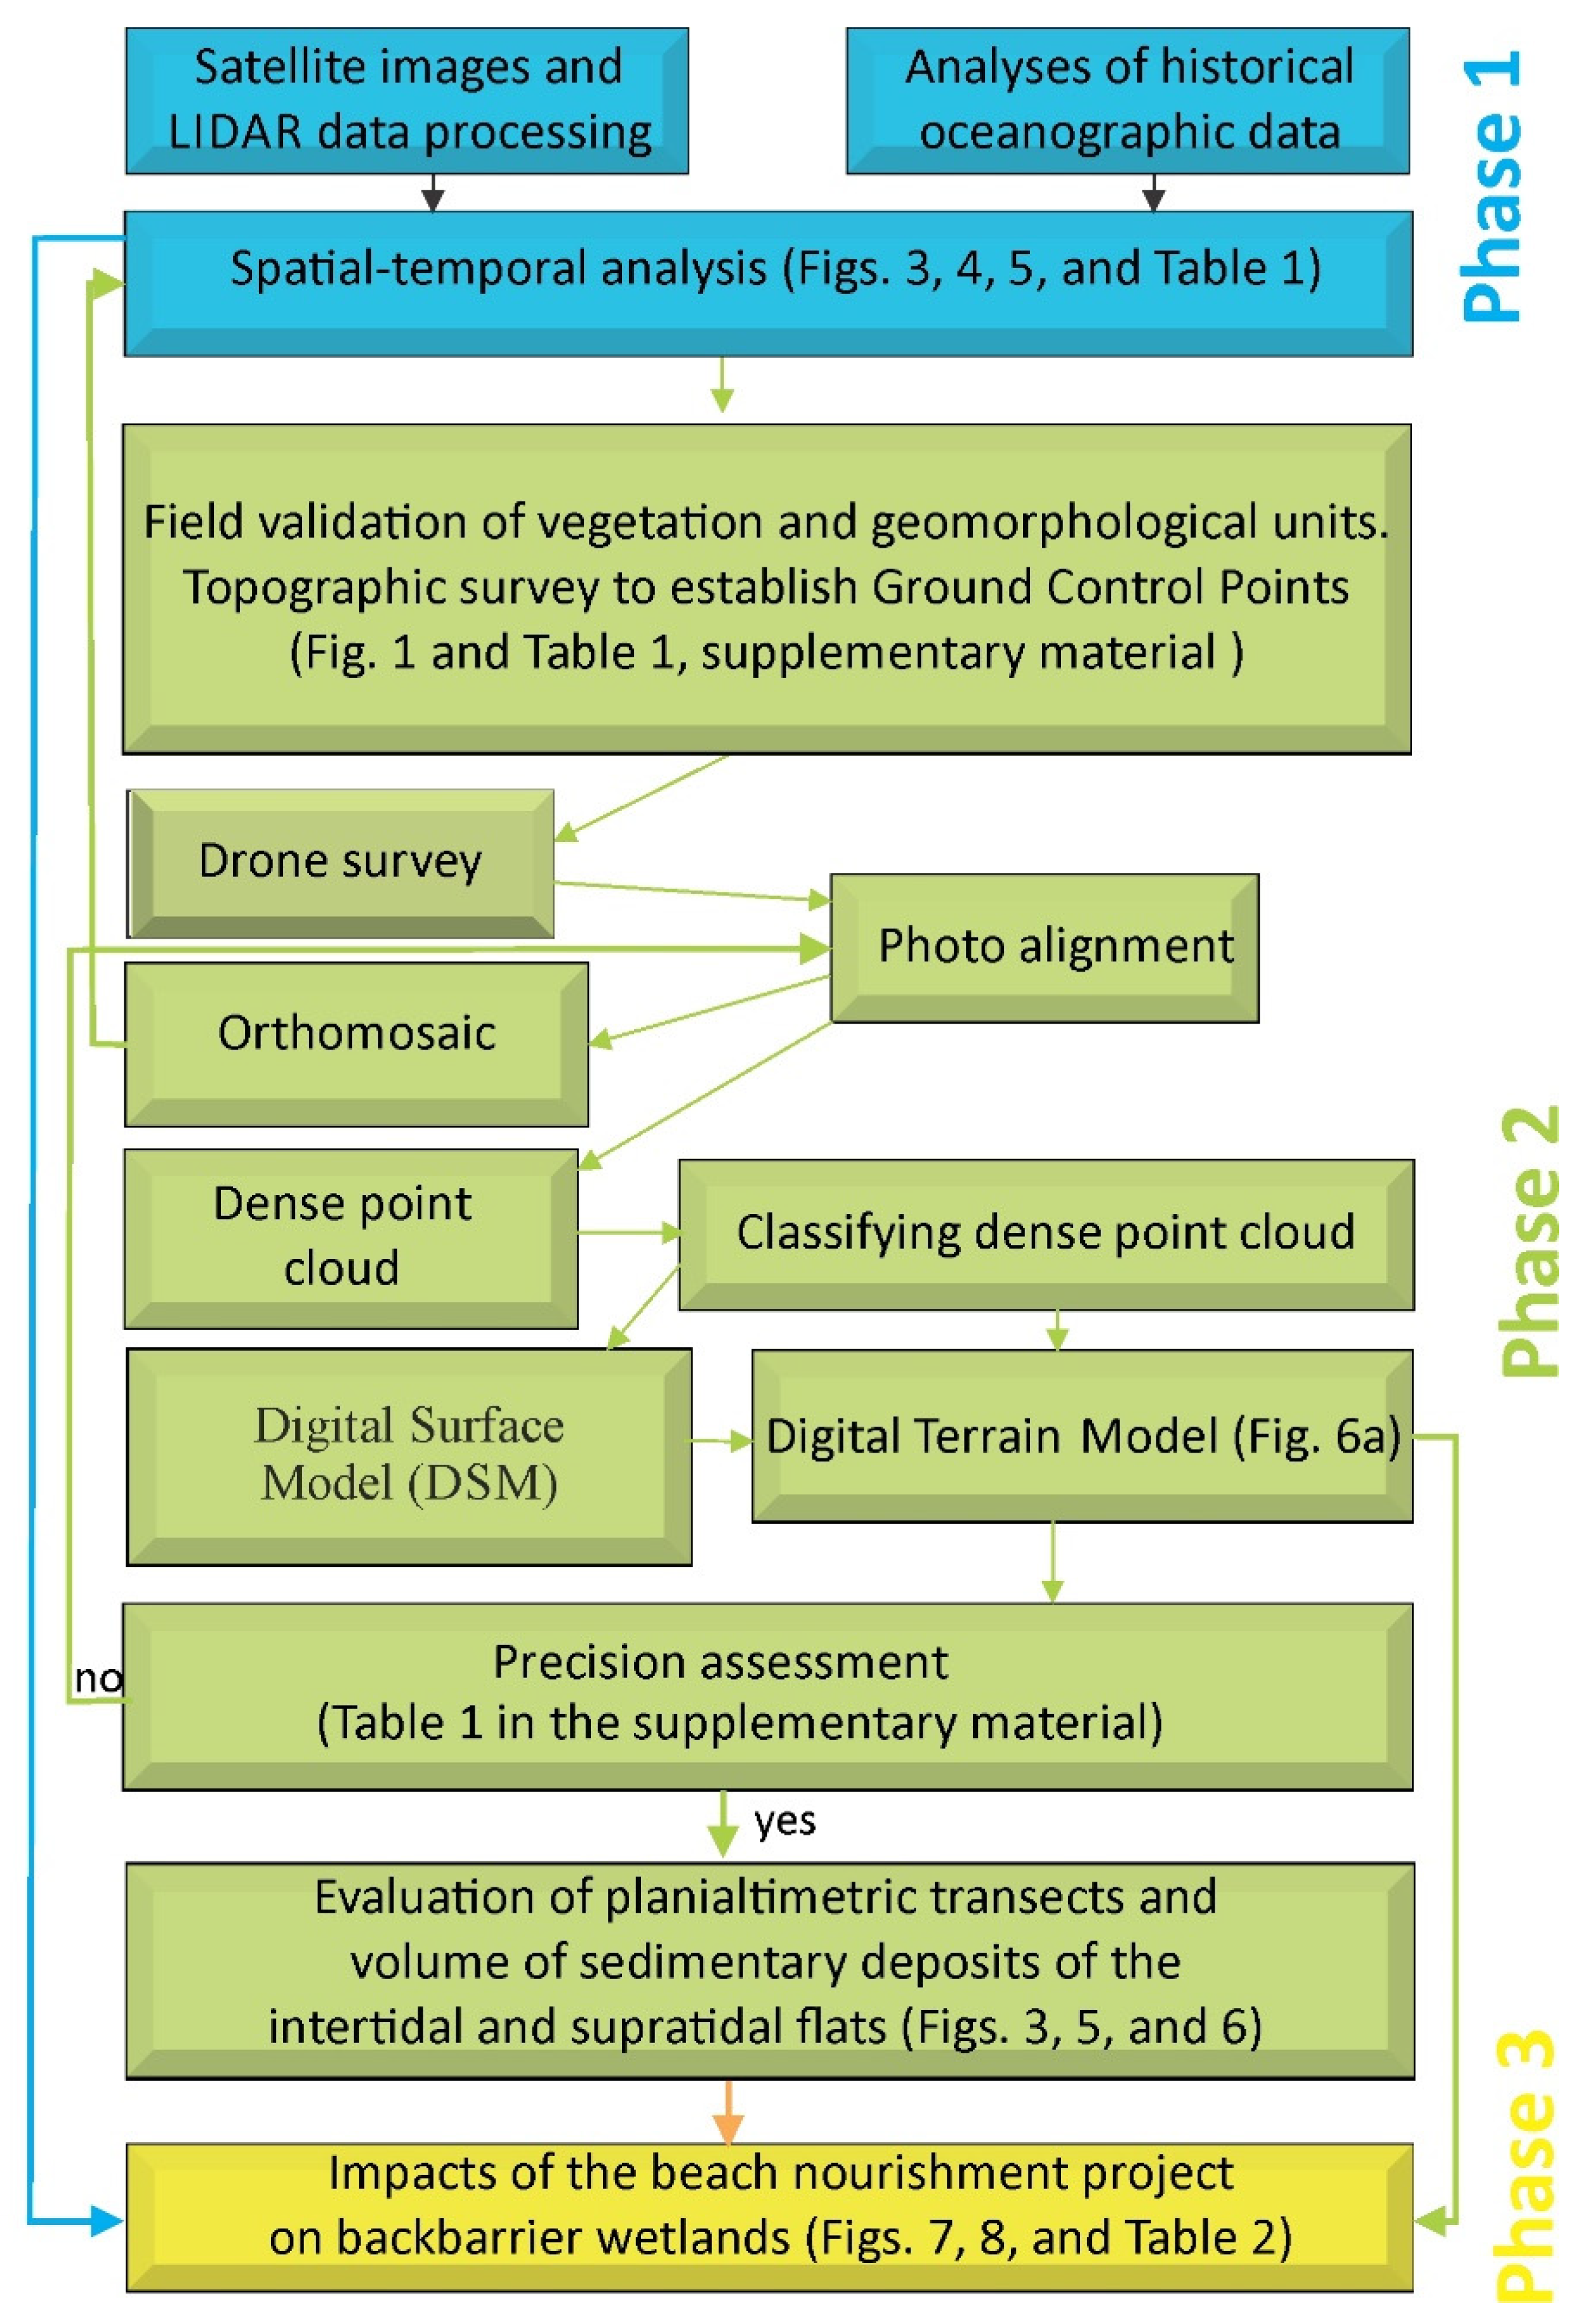
2. Methods and Materials
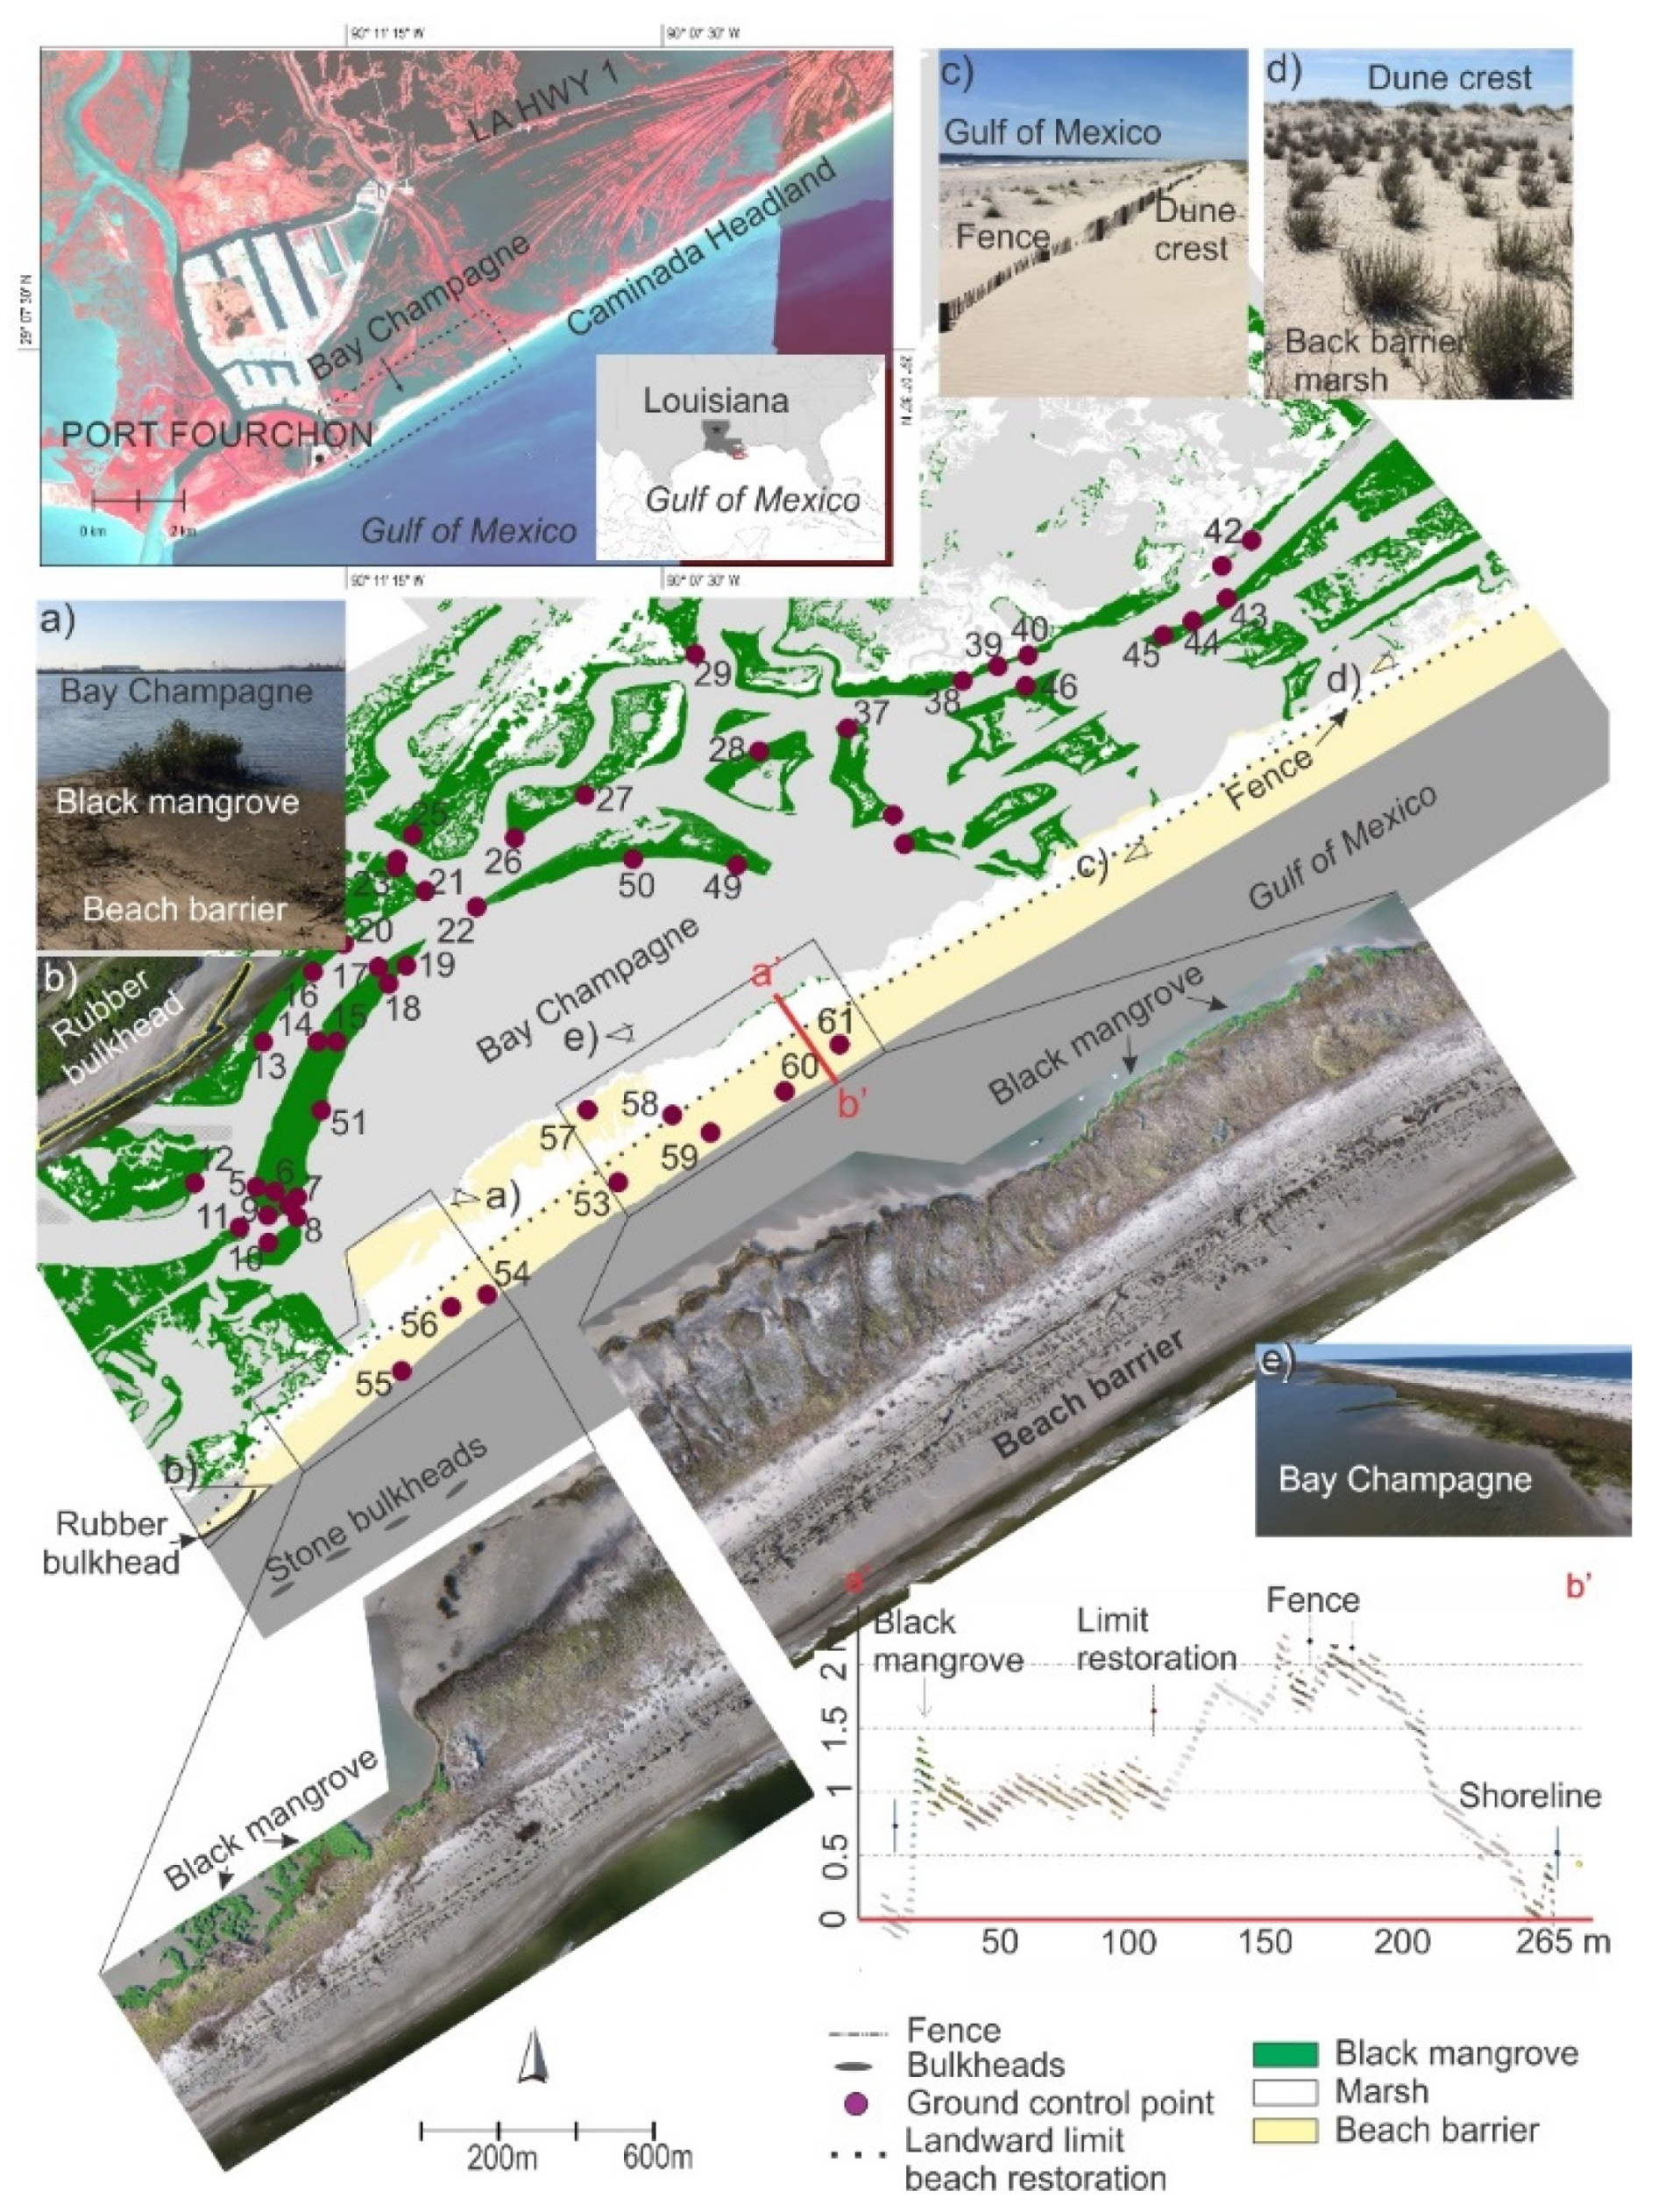
The high-resolution spatial-temporal analysis of a beach barrier in front of Bay Champagne lagoon was based on the examination of planialtimetric data and oceanographic time-series data, following a pre-designed methodology flow chart consisting of three phases (Figure 2): (1) spatial-temporal analysis based on satellite images and Lidar data; (2) development of digital elevation models based on photogrammetry of drone images with field validation; (3) data integration to evaluate the impacts of the beach nourishment project on backbarrier wetlands.

2.1. Study Area

The Bay Champagne lagoon (between 29°09′–29°06′N, 90°11′–90°08′W, Figure 1) is part of the Lafourche subdelta lobe and situated at the southeast side of Port Fourchon [2]. The lagoon-tidal flat system is hyper saline (45‰) and flushed by diurnal microtides at a range of ~0.3 m. The climate is humid subtropical, with annual monthly temperatures ranging between 6 °C and 30 °C, and an average annual accumulated precipitation at ~1600 mm/year [36]. The cyclic switching of the Mississippi River Delta lobe, coupled with human activities, have caused marine transgressions at the Bay Champagne coast for over several hundred years [37]. The shoreline retreated ~1550 m between 1887 and 2012, but the rate of shoreline erosion has fluctuated from ~14.8 m/year (1887–1930) to ~9.8 m/year (1956–1998) and ~12 m/year (1983–2018) [10,38,39].
Currently, a saltmarsh–mangrove ecotone consisting of Spartina alterniflora and stunted stands of Avicennia germinans exists on the landward side of Bay Champagne. Seaward of the lagoon, a narrow, sandy beach barrier (1–2 m high) blocks tides, waves, and longshore currents from entering the lagoon, but this barrier is regularly breached by storm surges generated by landfalling hurricanes [10,40]. For instance, in 2002, Hurricane Lili (category 2 in the Saffir-Simpson storm scale) produced a 3 m storm surge and introduced extensive overwash deposits to the east side of the Lagoon [41]. In addition, Hurricanes Katrina (2005), Rita (2005), Gustav (2008), and Ike (2008) also generated ~5 m to 1 m of storm surges that affected this area [42].

2.2. Historical Oceangrophic Data

RSL data from Grand Isle (1947–2018) and Eugene Island (1939–1974), located 26 km to the northeast and 120 km to the northwest of the study area, respectively, were accessed at the National Oceanic and Atmospheric Administration website [36]. Fluvial discharge data (1985–2017, monthly mean in ft3/s) for the Bayou Lafourche River at Thibodaux, LA (29°47′52′′N, 90°49′21′′W), 99 km upstream of Bay Champagne, were acquired from the United States Geological Survey [43].

2.3. Remote Sensing

The planialtimetric data were acquired from drone and satellite images, as well as LIDAR data. QuickBird satellite images, downloaded from Google Earth Engine with a ground pixel resolution of 2.44 m (multispectral) and three bands (blue, green, red) [44], were acquired on Nov/2004, Oct/2005, Oct/2007, Sep/2008, Dec/2010, Nov/2012, Jan/2015, and March/2019 (Figure 3, Figure 4 and Figure 5). Images were imported in GeoTIFF into the Agisoft Metashape Professional 1.6.2 software. Each satellite or drone image was accurately orthorectified based on the Lidar model. A total of 61 Ground Control Points (GCPs) helped to evaluate and improve the position of the images. For the spatial-temporal analysis, all images were imported in GeoTIFF format into the Global Mapper version 18 software. The LIDAR data used in this work were recorded in 1998 (NOAA/NASA/USGS), 2001 (USGS/NASA), 2002 (NOAA/NASA/USGS), 2010 (JALBTCX), and 2013 (USGS). These data, accessed at the Atlas website from Louisiana State University (https://atlas.ga.lsu.edu/) (accessed on 21 October 2017) and National Oceanic and Atmospheric Administration website (https://coast.noaa.gov/dataviewer/#/) (accessed on 21 October 2017), had a vertical and horizontal accuracy of 10–15 cm and 73–100 cm, respectively. LIDAR data provided planialtimetric data of the studied sandy coastal barrier and wetlands, classified as ground, water, and vegetation. The dates of the satellite images and LIDAR data were chosen according to the quality and availability of these data. The spatial-temporal analyses were carried out regarding the year 2013 (the year of the beach nourishment project implementation), but the analysis intervals of the satellite images (May/2004–Nov/2012; Nov/2012–Mar/2019) and LIDAR data (1998–2013) did not coincide due to issues with data availability. The planialtimetric analysis was completed with high-resolution images (2.6 cm/pixel) obtained in Oct/2017, March/2018, and Nov/2018 by Phantom 4 Advanced drone. Fieldwork was completed during the drone survey to validate the topographic data, as well as vegetation types/heights and shoreline dynamics between Oct/2017 and Nov/2019. Topographic surveys allowed determining the intertidal and supratidal zones limits during that time interval. The planialtimetric data were acquired by a Trimble Catalyst receiver, supported by a differential Global Navigation Satellite System with a decimeter correction (precision ± 10 cm) and an electronic Self Leveling Horizontal Rotary Laser. These data were used as Ground Control Points (GCPs, 61 points) to evaluate and calibrate the digital elevation model (DEM) acquired by photogrammetry (Table S1, Supplementary Material).

2.4. Image Classification

The vegetation and geomorphological features were manually classified by photointerpretation using various tools in the Global Mapper version 18 software. Drone images (resolution of 2.6 cm) permitted the identification of Avicennia trees in the marshes and the beach barrier. These images and fieldwork data provided a consistent indicator to support the classification derived from the Quickbird images (Table S1, Supplementary Material). Ground Control Points (GCPs, Figure 1 and Table S1, Supplementary Material) reinforced the identification of each land cover type (black mangrove, marsh, and beach barrier) according to the image features (multispectral digital numbers) related to the texture of drone orthoimages (spectral information between 380 and 710 nm). This cross-validated data produced a highly accurate classification of vegetation and geomorphological units. Drone panoramic aerial photos were also used to identify the vegetation and geomorphological units (Figure 1e). Details about drone image processing may be found in [23,24].

2.5. Analyses of Spatial Data
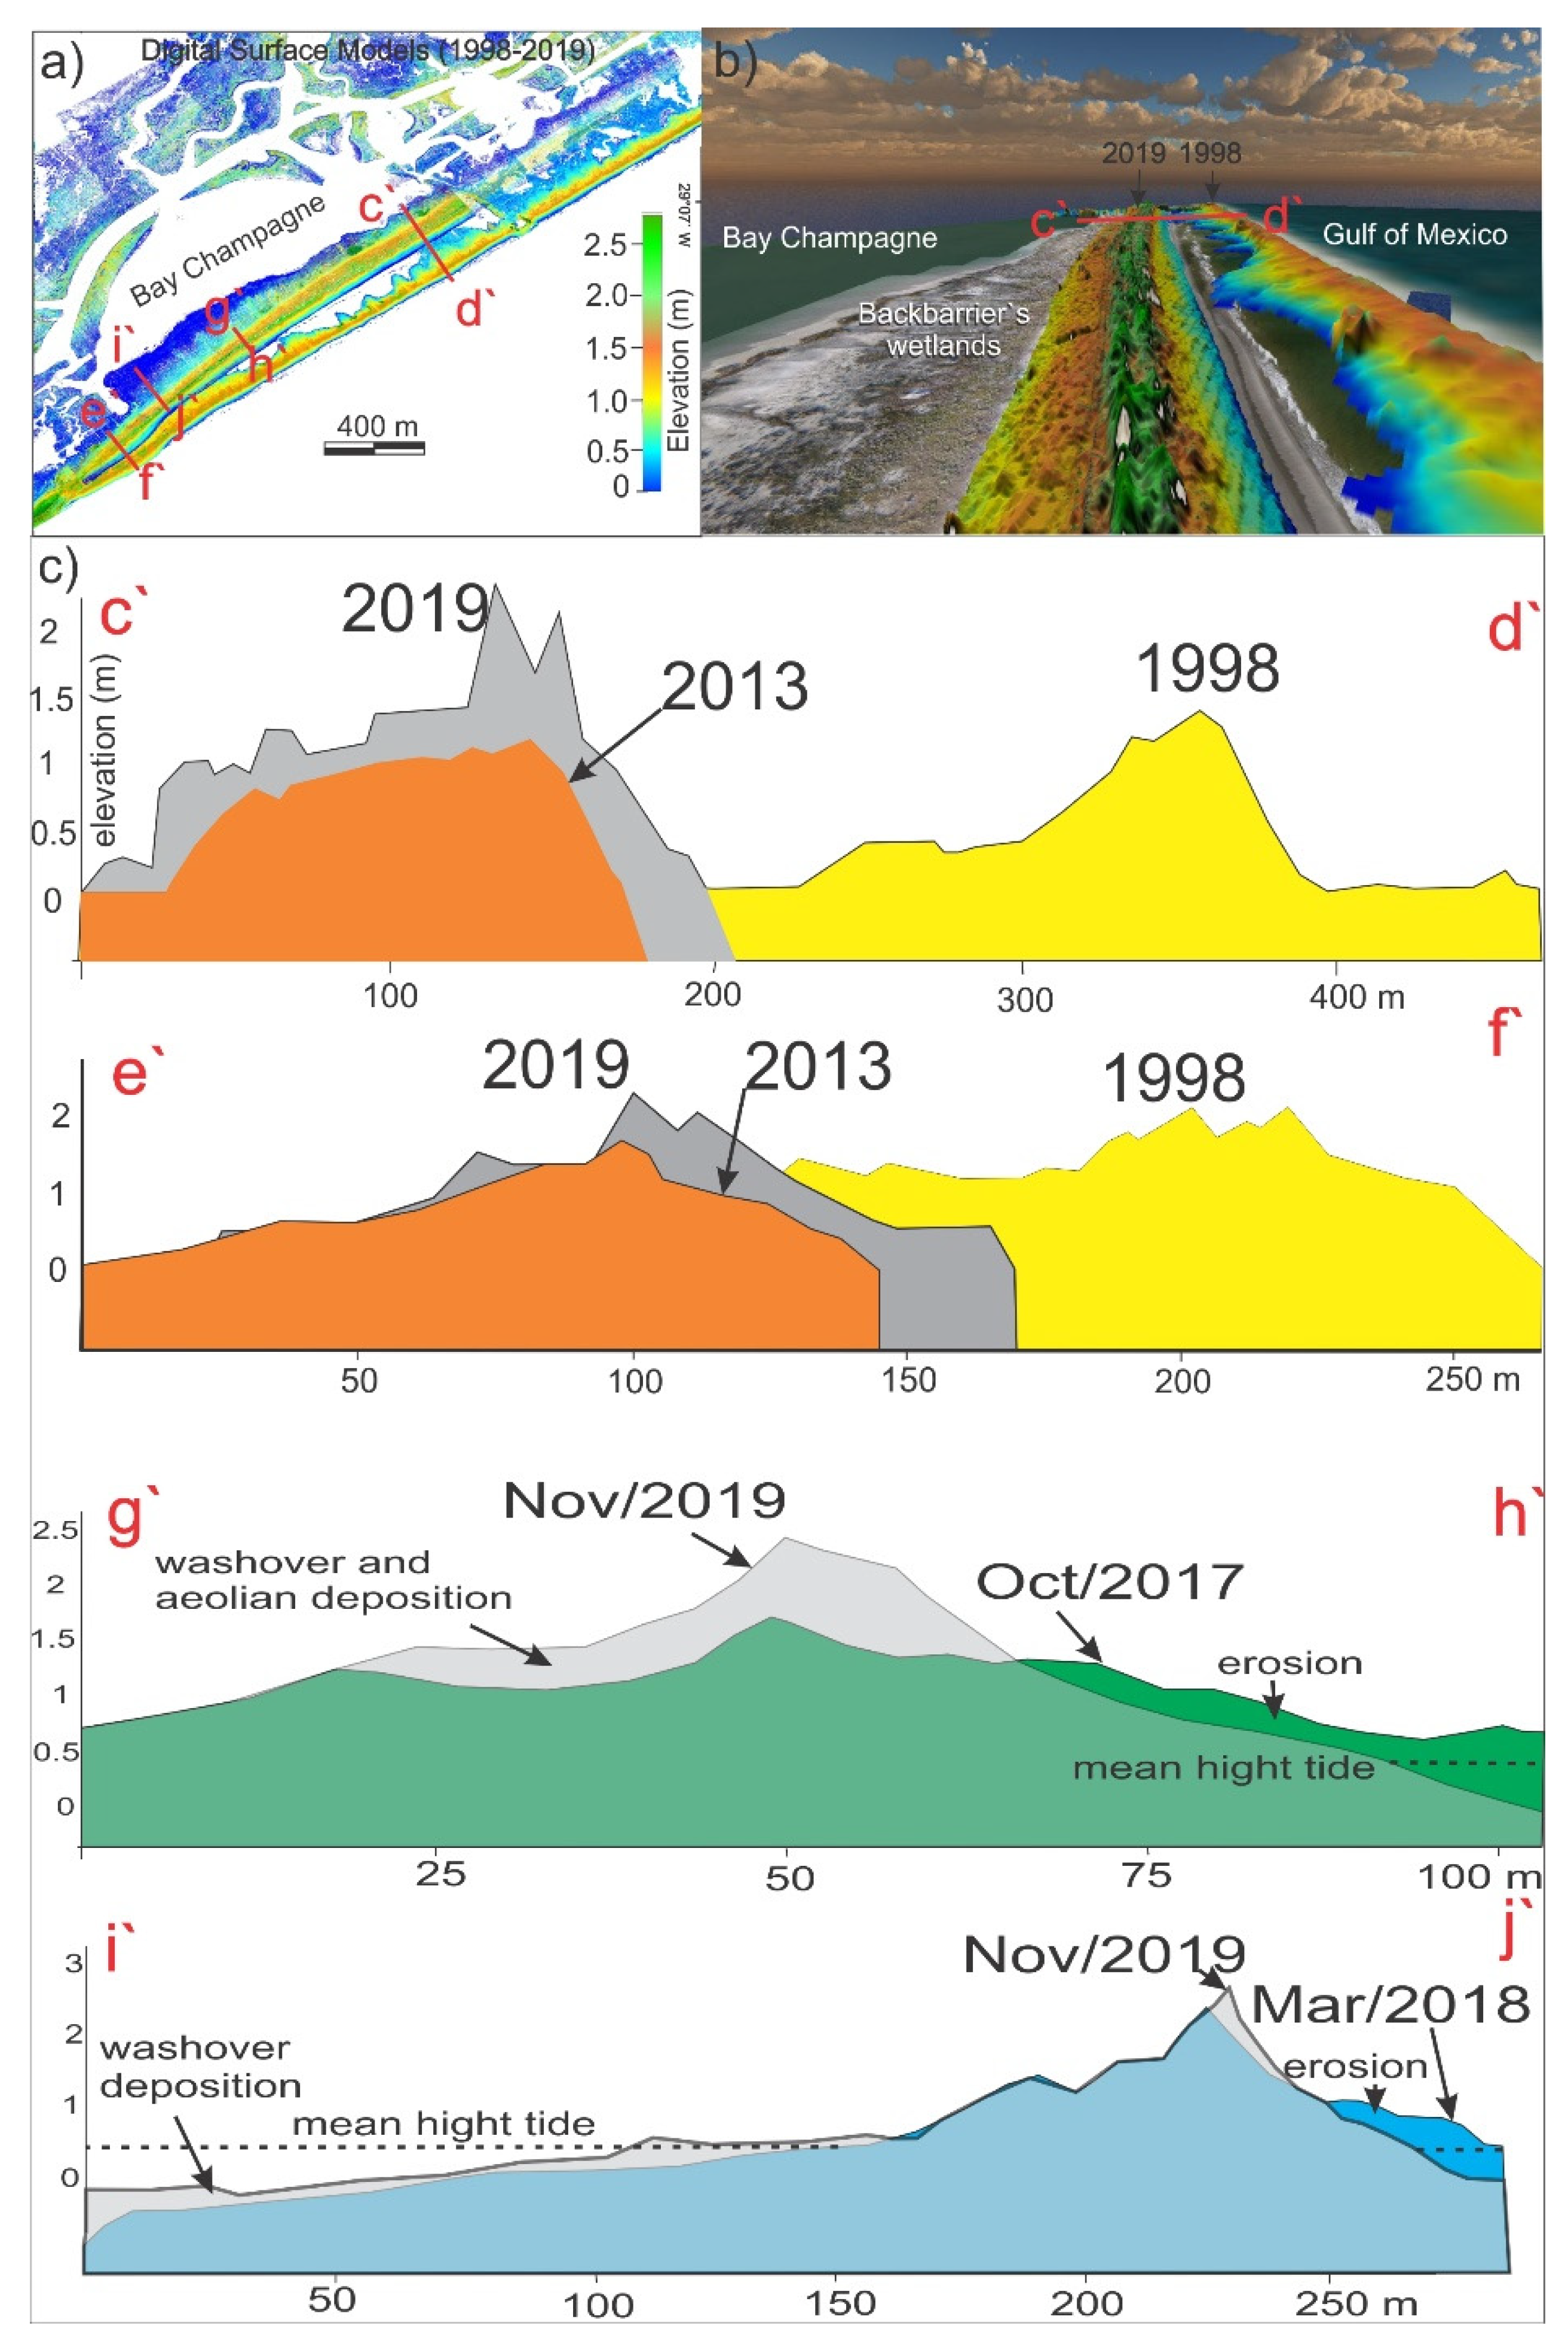
Coordinates of infrastructure, such as houses and boat ramps, were used as stable reference lines for spatial-temporal analysis. The upper limit of the intertidal zone, evidenced by a wet-dry line in the images, was used as a reference to evaluate the shoreline dynamics. Distance measurements were obtained by Global Mapper version 18 software on georeferenced satellite and drone images. Considering the ground pixel resolution of 2.44 m of the QuickBird images, a margin of error of 2.5 m was estimated for the planimetric data obtained from these images. Planimetric transects perpendicular to the stable reference lines were used to measure the dynamics of the sandy coastal barrier. Linear regression was calculated between the shoreline dynamics and (1) the relative sea-level rise (mm), and (2) the highest and lowest monthly average values of the fluvial discharge (ft3/s) during the period of retreat/advance of shoreline (Table 1). The linear regression was calculated between the retreat/advance of shoreline, using transects B, C, and D (m) as references, and the relative sea-level rise (mm). The long-term, linear RSL rise trend is relative to the most recent mean sea-level datum established by the Center for Operational Oceanographic Products and Services. The long-term linear trend is based on the monthly mean sea level, eliminating seasonal fluctuations related to coastal ocean temperatures, currents, winds, and atmospheric pressures. Global Mapper version 18 [45], Agisoft Metashape Professional version 1.6.2 [46], R programming language [47], and the R package ‘Performance Analytics” [48] were used to analyze the spatial-temporal dataset. Details regarding the materials and methods are described in the Supplementary Information.

2.6. D Models

The drone images, obtained by a digital 4 K/20 MP (RGB) camera, were treated using the Agisoft Metashape Professional 1.6.2. to generate 3D spatial data and orthomosaics with the support of planialtimetric GCPs (www.agisoft.com) (accessed on 7 May 2021). (Figure 1). Orthomosaic images of 2017, 2018, and 2019 were used for the time series analysis. The software constructed a set of points in 3D space from all matched pairs between aligned photos. Erroneous points in the sparse point cloud were removed to improve the model final geometry. This cleaned sparse point cloud was used as a reference to reconstruct a more detailed set of geometries known as the dense point cloud [49]. This dense and accurate 3D point cloud with point spacings between 3 and 5 cm was manually classified. The contrasts of colors and elevations of point clouds enabled identification of points representing the vegetation cover and the sandy barrier surface. The points representing the sandy barrier surface were used to obtain a digital terrain model (DTM), which represents the substrate surface without the vegetation cover. A mesh of the sandy flat surface was then developed based only on the points representing the topographic surface of the terrain. This model was adjusted to the GCPs obtained by the field topographic survey (Table S1, Supplementary Material). A digital surface model (DSM) representing the natural (trees and herbs) and built (houses and streets) features was also produced [46]. The vertical differences between GCP and the DTM allowed a quantitative analysis of that model, following Equation (1), as suggested by [23]:
Zdif = ZDEMZgrd
where Zdif = the vertical differences, ZDEM = the Z value of the 3D dense point cloud, and Zgrd = the Z value of the Ground Control Point. The vertical differences (Zdif) were lower than 15 cm, indicating a vertical margin of error of ± 15 cm for the 3D models. The horizontal differences (latitude and longitude) were <0.71 m (Table S1, Supplementary Material). The differences between the latitude/longitude data obtained by the Trimble Catalyst GNSS receiver in the GCPs and drone surveying have been attributed to a lower accuracy of the drone GPS than the Catalyst GNSS receiver [50,51]. In contrast, elevations based on aerial photogrammetry of drones present high vertical accuracy [52,53]. The final digital terrain model was adjusted using the GCPs planimetric values. Considering the Xdif, Ydif, and Zdif values, margins of error were estimated at ±0.076 m3 and ±0.15 m3 for the volume calculations based on drone and Lidar data (vertical and horizontal accuracy of 15 and 100 cm), respectively.
An elevation grid for the ground was obtained based on the mean dense point cloud to minimize the effects of vegetation and seasonality on the drone and Lidar surveys. Vertical features were referenced to NAVD88. The shoreline position and dune crest were defined as the mean high tide water elevation (higher level of the intertidal zone) and the maximum surface elevation, respectively, identified by cross-shore profiles. Sediment volumes were measured according to the elevation grid generated for each drone and Lidar survey, relative to a baseline, defined as mean sea-level (0 m). Cut-and-fill volumes were calculated within a selected area using Global Mapper software version 18. Volumetric calculations were performed by dividing the area of interest up in to small rectangular pieces following a uniform grid and then calculating the sum volume of the small 3D rectangles (Volume = Height * Pixel Size) between terrain models and the cut surface [45]. Two fences along the dunes were used as a common reference in the drone images to delimit the target zones (Figure 1c and Figure 6c): Zone 1-part of the supratidal and the sandy intertidal flat under the action of currents and waves; Zone 2-part of the supratidal area; and Zone 3-part of the supratidal and the intertidal flat behind the coastal barrier. In addition, Global Mapper generated a vertical profile along a specified path using loaded planialtimetric datasets [45]. A spatial and temporal sequence of these profiles shows the dune crest dynamics and the coastal morphology in three dimensions with the most pronounced vertical variations recorded along a beach barrier [54]. Eight planialtimetric profiles, identified by the red lines in the figures, were developed to record the coastal morphology changes in a temporal sequence. Seven profiles are cross-shore transects that start landward of the dune ridge and end at the shoreline (perpendicular to the shoreline). The locations chosen for each cross-shore transects have a wide spatial representation of the intertidal and supratidal zones of the studied coast (Figure 1, Figure 3c, Figure 6d and Figure 7d). One longshore profile follows the top of the dune ridge line (parallel to the shoreline) of the year of each digital terrain model (Figure 5a,b). Planialtimetric cross-shore profiles were used for sediment volume analysis, while planimetric cross-shore transects were used for measuring shoreline and habitat changes.

3. Results

3.1. Climatic and Oceanographic Data

Precipitation data from 1989 to 2018 revealed the highest values in July (range: 53–368 mm; mean: 213 mm) and August (range 44–488 mm; mean: 192 mm), and the lowest in October (range: 1–384 mm; mean: 104 mm) and November (range: 9–358 mm; mean: 98 mm). An increasing, but not significant (p ≤ 0.37, R2 = 0.03), trend in the annual rainfall rates occurred between 1989 (1020 mm) and 2018 (1799 mm). A significant (p ≤ 0.0057, R2 = 0.25) increasing trend was detected for the fluvial discharge between 1985 and 2017. The highest fluvial discharge occurred in April (range: 44–488 ft3/s; mean: 239 ft3/s) and May (range: 81–506 ft3/s; mean: 233 ft3/s), while this value was at the lowest in October (range: 61–396 ft3/s; mean: 185 ft3/s) and November (62–384 ft3/s; mean: 182 ft3/s). The rates of RSL rise in Grand Isle and Eugene Island, located 26 km northeast and 120 km northwest of the study area, were 9.08 ± 0.42 mm/year (1947–2018) and 9.65 ± 1.24 mm/year (1939–1974), respectively, as previously revealed by Sweet et al. (2018) (Table 1).

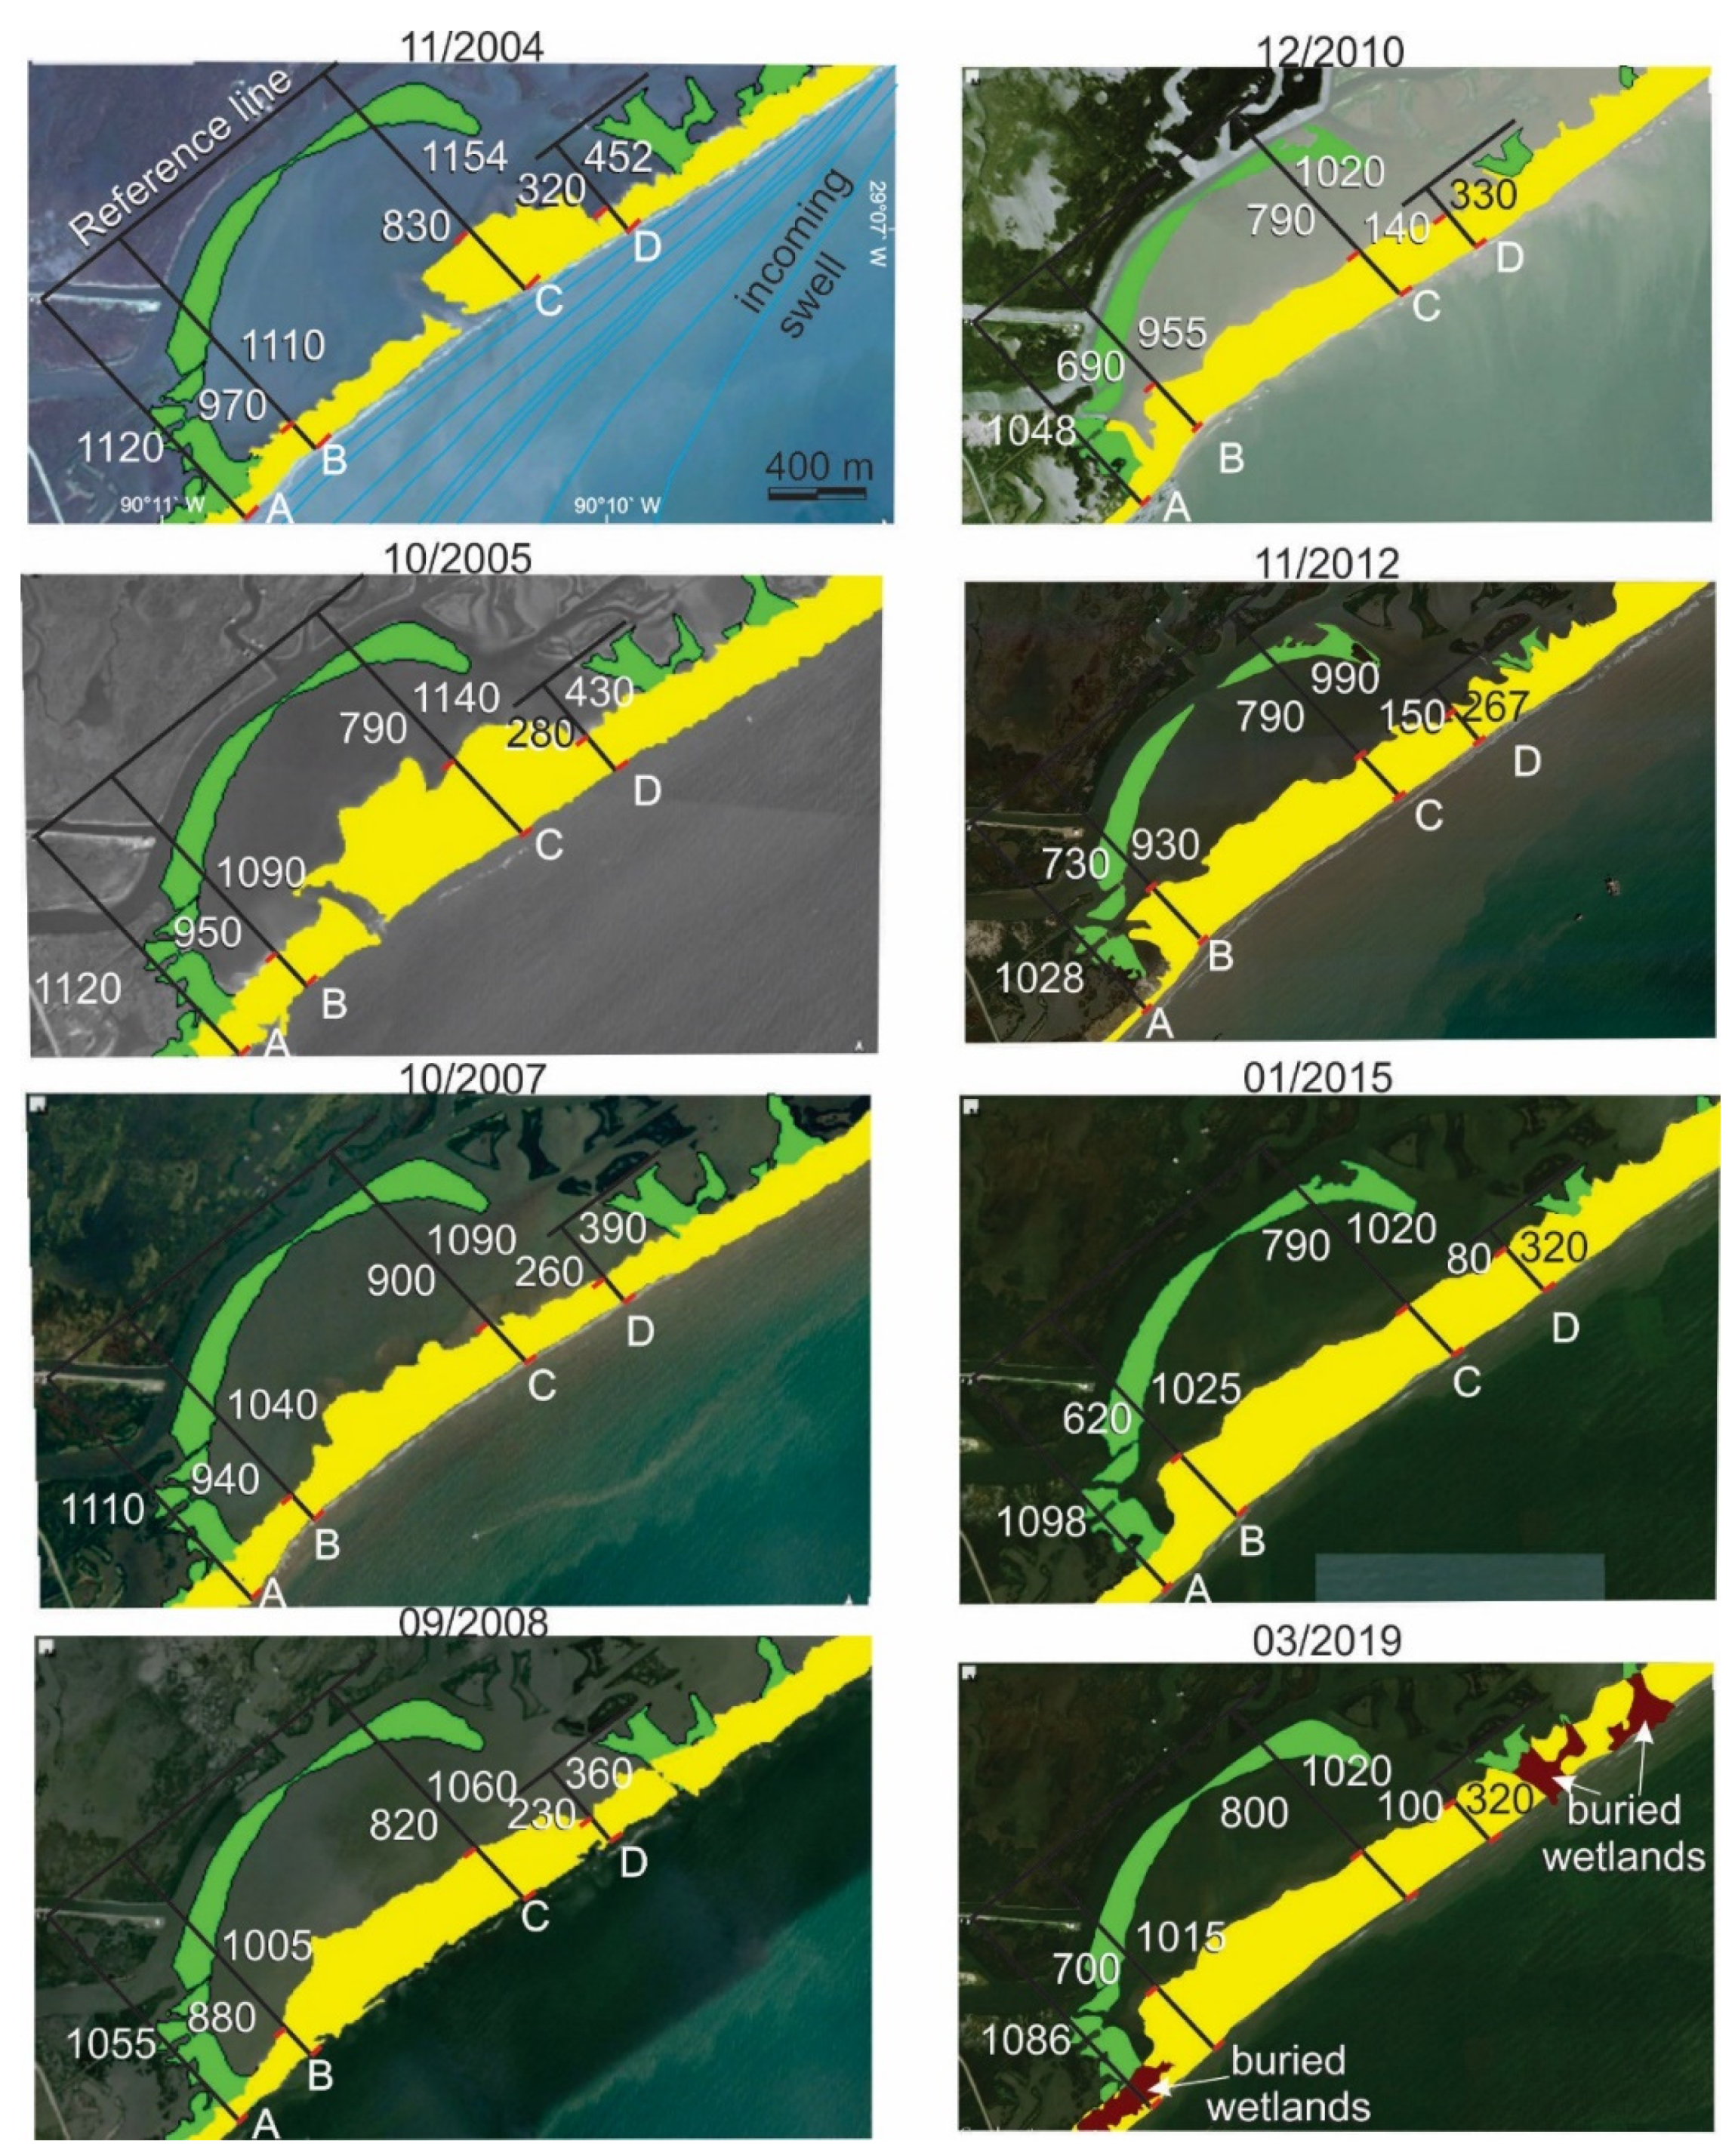
3.2. Dynamics of the Beach Barrier before the Nourishment Project

The overall sediment volume of the beach barrier in our study area oscillated between 1998 and 2013. In 1998, the overall volume and floor area of the studied barrier was 357,010 m3 and 51 ha, respectively. These numbers increased to 554,073 m3 and 62 ha in 2001. The volume decreased to 398,944 m3 (58 ha) in 2010 and increased to 493,197 m3 (63 ha) in 2013 (Figure 3). Between Nov/2004 and Nov/2012, the shoreline retreated continuously by 180, 164, and 185 m along the transects B, C, and D (Figure 4). These data indicate an average annual retreat rate of 22.7 m/year (Figure 4, transect B), 20.7 m/year (transect C), and 23.3 m/year (transect D) during that studied period. In particular, the section of transect A, along the backbarrier mangroves and under the influence of bulkheads, retreated ~92 m between 2004 and 2012 (Table 1). The interior lagoon boundaries also retreated 240 m (transects B), 40 m (transects C), and 170 m (transects D) during the same period at a rate of 30 m/year (transects B), 5 m/year (transects C), and 21.5 m/year (transects D). Based on the average rate of shoreline retreat along transect B, C, and D, the correlation between the beach barrier dynamics and the RSL rise was statistically significant (r  =  0.86, n  =  5, p  ≤ 0.06) for the 2004–2012 period. Lidar data obtained between 1998 and 2013 indicated a maximum inland dune crest migration of 55 and 220 m along the southwestern and northeastern shorelines, respectively. The dune crest height increased from 1.8–2 m to 2–2.5 m between 1998 and 2001 along 3 km of the studied beach barrier, but it decreased to 1.1–1.3 m in 2013 (Figure 5).

3.3. Dynamics of the Beach Barrier after the Nourishment Project

After the beach nourishment project in 2013, the sediment volume in the studied coastal barrier increased from 493,197 m3 (2013) to 892,459 m3 (2018). Between Nov/2012 and Jan/2015, the shoreline advanced for ~95, 30, and 53 m, at a rate of ~44 m/year, 13.9 m/year, and 24.5 m/year along transects B to D, respectively. In particular, the section of transect A, along the backbarrier mangroves and protected by bulkheads, advanced for ~70 m between 2012 and 2015, followed by a retreat of ~12 m between 2015 and 2019 (Table 1). Between Jan/2015 and Mar/2019, an overall retreat of ~10 m occurred along transect B, while the transects C and D were relatively stable (Figure 4). Planialtimetric data, obtained by laser between 2013 (LIDAR) and 2019 (drone), indicated no significant horizontal displacements for the dune crest (Figure 3). However, the dune height increased from 1.1–1.3 m in 2013 to 2.5–3.0 m in 2019 (Figure 5).
Planialtimetric data obtained by drone between Oct/2017 and Nov/2019 also indicated no significant shoreline migration (Figure 6). However, the volume of sediments along the intertidal zone, (i.e., between mean high tide and mean low tide), and supratidal zone (above high tide, flooded only at spring tide or during storms) changed during that period. The sandy intertidal flat in front of the coastal barrier was exposed to waves and currents and showed signs of erosion. By contrast, the backbarrier wetlands received sediment by aeolian and washover transport (Figure 3, vertical profiles g′-h′ and i′-j′). For instance, the intertidal to supratidal zone (Zone 1: 3.75 ha) showed a reduction in sediment volume of ~10,049 m3 between Oct/2017 (38,016 m3) and Nov/2019 (27,957 m3). However, the supratidal zone (Zone 2: 5.27 ha), exposed to aeolian processes and with fences along the dune crests, showed an increase in sediment volume of ~9116 m3. This trend also occurred in zone 3 (part of the supratidal and the intertidal flat behind the coastal barrier, 11.47 ha), with a sediment gain of 16,040 m3 (Figure 6), under the influence of mangroves and marshes (Figure 7).

3.4. Dynamics of the Backbarrier Wetlands

The muddy tidal flats exhibited topographic gradients between 0 and 47 cm above the mean sea-level (Figure 1 and Figure 7). Tidal flats occupied by monospecific colonies of Avicennia germinans (<2.3 m tall) were 13–47 cm higher than those occupied by Spartina alterniflora (0.2–12 cm), while the lowest elevations (~0 cm) had no vegetation cover. The sandy barriers (~1–3 m height) were occupied by herbaceous plants, primarily Panicum amarum and Spartina spartinae (Figure 1c,d). In the northeast and southwest ends of the Bay Champagne, the muddy tidal flats occupied by mangroves and saltmarshes had gradual sand accumulation during the coastal barrier retrogradation. This process (sand accumulation) was coincident with a loss of ~15.6 ha of wetlands (14.52 ha of saltmarsh and 1.08 ha of mangrove) along the 4-km coastline between 2004 and 2012 (Figure 8), situated behind protective sandy barriers. However, saltmarsh and mangrove expanded by 0.49 and 2.2 ha on muddy flats, open to direct wave attacks, during this period (Figure 8). In contrast, after the beach nourishment project, mangrove and saltmarsh expanded for 3.15 ha and 25.4 ha (2012–2019) along the backbarrier environments facing Bay Champagne, respectively (Figure 8, Table 2). Mangroves were established during this period and the height of Avicennia shrubs reached up to 1 m tall, preferentially occupying tidal flats with saltmarshes along the backbarrier environment (Figure 7).

4. Discussion

4.1. The Effect of the 2013 Beach Nourishment Project on Coastal Morphodynamics

Fluctuations in RSL and fluvial sediment supply to coastal systems can affect the dynamics of beach barriers. Several hydro-sedimentary processes interacting within spatial and temporal scales contribute to changes in beach barrier sediment volumes. The rate of shoreline advance or retreat is generally controlled by the equilibrium between sediment accommodation caused by relative sea-level change and sediment supply [55,56]. If the lower shoreface is shallower than that required for the coastal equilibrium, sand is relocated to the upper shoreface and shoreline would shift seaward. By contrast, the coast shifts landward when the lower shoreface is too deep. These transgressive and regressive shoreline movements may occur regardless of the eustatic sea-level [57,58,59,60,61,62].
In the Mississippi River, suspended sediment load has decreased by ~50% since the 1850s, primarily due to the construction of >50,000 dams along the Mississippi basin [9,63,64,65,66,67]. According to the Quickbird images, the most significant inland migration of the beach barrier (185–164 m) occurred during the period of 2004–2012 (Figure 4, Table 1), and, according to the LIDAR data, the maximum inland dune crest migration was ~220 m along the northeastern shoreline between 1998 and 2013 (Figure 3a, vertical profile c′–d′ and e′–f′). The volume of the studied barrier oscillated between 357,010 and 554,073 m3 from 1998 to 2013. However, construction of the stone and rubber bulkheads in front of the barrier prior to 1998 likely have attenuated the impact of waves and currents along the southwestern studied coast (Figure 1b), causing an increase in the sand sedimentation and a decrease in the rates of shoreline retreat in the transect A (Figure 4 and Figure 7a, Table 1). The effects of these artificial structures are evident along the studied beach barrier, since the largest inland dune crest and beach barrier migration occurred along the northeastern shoreline, farthest away from the bulkheads effects (Figure 1, Figure 3a, and Figure 7a). By contrast, an advance of the beach barrier was recorded after the beach nourishment project, mainly between Nov/2012 and Jan/2015 (Figure 4 and Table 1). In addition, the dune height and volume of the studied barrier increased from 1.1–1.3 m to 2.5–3.0 m (2013–2019) and from 493,197 m3 to 892,459 m3 (2013–2018), respectively. This advance and volume gain phase might be attributed to the artificial input of sand to the beach barrier, installation of fences along the dune crests, and establishment of backbarrier wetlands (see discussion in the next section).
Despite the beach nourishment project’s effort to stabilize the beach barrier, the Quickbird images, recorded between Jan/2015 and Mar/2019, revealed shoreline retreat in the transects A and B and stability in transects C and D (Figure 4 and Table 1). In addition, our planialtimetric data, obtained by drone between Oct/2017 and Nov/2019, revealed erosion of sandy intertidal flat and part of the supratidal deposits, under the action of waves (Figure 6). The most likely scenario is that these processes will be intensified as a result of future RSL rise to continue the erosion of supratidal and intertidal flats, increasing the rate of shoreline retreat. This indicates that the renourishment might have partially stabilized the beach barrier.
The magnitude of beach barrier retreat reported in the Bay Champagne is broadly comparable to Dietz et al. (2018), which documented a shoreline retreat of 292 m from 1983 to 2018, related to high energy events, such as hurricanes. Many intense hurricanes have affected this coast during the past decades, such as Katrina (Aug/2005, Category 3), Rita (Sep/2005, Category 3), Gustav (Sep/2008, Category 2) and Ike (Sep/2008, Category 2) [41,68,69,70,71,72,73,74]. The decrease in dune crest heights (from 2–2.5 m to 1.1–1.3 m) between 2001 and 2013 along a 3-km of the beach barrier (Figure 5), may have been caused by the removal of beach sediments during some of these events (see also [12]). This hypothesis is supported by the landward migration of overwash fans behind the beach barrier between 2004 and 2012 (Figure 1, Figure 4 and Figure 8), which is typical evidence for storm surge activities [14,41,75,76]. In addition, the near absence of the beach barriers in front of Bay Champagne and the intense erosion of inland mangrove islands after Hurricane Katrina and Rita (2005), as shown by satellite images, attest to the impact of these events on this coast (Figure 8).
Overall, the change from a retreating (1998–2013) to an advancing/stabilized coast (2013–2019) is likely attributed to the beach nourishment project. This project, initiated in early 2013, replenished ~3.5 × 10⁷ m3 of sand along ~10 km of coast and installed fences along the dune crests to restore and maintain the shoreline through the creation of artificial dune and beach [10,77,78]. Hence, it is reasonable to believe that the increase in dune height from 1.1–1.3 to 2.5–3.0 m between 2013 and 2019 (Figure 5) and the coastal advance between Nov/2012 and Jan/2015 (Figure 3 and Figure 4) are the result of this project.

4.2. Dynamics of the Coastal Barrier and Relationship to the Wetlands

The establishment and development of mangroves are mainly controlled by the interactions between fluvial discharge and tidal water elevations, as well as the local hydrodynamics of waves and tidal and/or littoral currents, coastal topography, and rates of availability and types of sediment [78,79,80]. The disturbance caused by RSL rise may trigger changes in sediment vertical accretion rates and salinity gradients, favoring or preventing the preservation of mangroves. They may also determine the reestablishment of mangroves in new areas of the same or higher topographic elevations [24,79,81,82,83,84,85]. Since mangrove forests can keep pace with a RSL rise up to ~6.1 mm/year [25,86], they mitigate the impacts of marine transgressions [22,86,87,88]. Mangroves may also attenuate the velocity of wind and waves to protect the shoreline from erosion [89].
In our study area, Avicennia roots should have caused topographic gradients in the study area occupied by saltmarshes (0.2–12 cm) and Avicennia shrubs (13–47 cm) (Figure 1 and Table S1 in the Supplementary Material), suggesting a higher sediment vertical accretion in areas occupied by Avicennia. Mangrove establishment causes positive feedback, because their structures dissipate wave and currents energy, triggering a micro-turbulence, which results in flocculation processes and fluvial mud trapping, and in turn, increases the substrate elevation [90]. This situation is ideal for mangrove regeneration [21,90,91]. Under high rates of RSL rise, deltaic mangrove substrates may still aggrade due to a combination of allochthonous and autochthonous sediment accumulation [24,80,92], even if the sediment input is low [93]. Hence, mangrove forests in our study area are expected to mitigate the effect of the high RSL rise, especially if adequate fluvial sediments are available to coastal systems, which would contribute to the stability of the beach barrier.
However, surface accretion rate can only keep pace with high RSL rise 10–20 mm/year scenario (RCP 8.5) up to year 2070 and 2055 in basin and fringe mangrove settings, respectively [94]. In particular, mangrove forests in areas of low sediment supply and low tidal range are more susceptible to degradation [92,95]. Considering these factors [86,92,96], the Port Fourchon mangrove is expected to be susceptible to degradation because: (1) they are under the influence of a microtidal regime (~0.3 m; whereas the RSL has risen by ~9 mm/year in the study area: [97]; (2) the fluvial sediment input has decreased during the past decades [9,66]; (3) a series of hurricanes have impacted this coast [10]; and (4) successive extreme freeze events have caused mangrove mortality in several areas along the Gulf of Mexico [97,98,99,100], mainly in the Louisiana coast [101,102,103,104,105]. However, despite these challenges, mangroves inhabiting the muddy flats (mainly between 13 and 47 cm above mean sea-level) at Port Fourchon, have encroached tidal flats previously occupied by Spartina located between 0.2 and 12 cm above the mean sea level. This process has increased the mangrove area from 23 to 124 ha between 2004 and 2018 (Cohen et al., unpublished data). Similar mangrove encroachment has also been recorded at many other areas along the Gulf of Mexico [100,105,106,107], which attests to the high resilience of this ecosystem.
In our study area, mangroves also occur behind the beach barriers, where they are protected from waves, currents, and the effects of shoreline retreat. The landward migration of the coastal barrier between 2004 and 2012 prevented the establishment and development of backbarrier wetlands. This process covered part of the muddy tidal flats and degraded ~15.6 ha of wetlands (Figure 8). The seaward advance or stabilization of the coastal barriers between 2013 and 2019, however, allowed the establishment of backbarrier mangroves (3.2 ha) and saltmarshes (25.4 ha), consisting mainly of Avicennia and Spartina (Figure 8). Therefore, it is likely that the 2013 beach nourishment project has contributed to a more stable coastal morphodynamic environment for mangrove development, at least temporarily. In turn, the expansion of mangrove and saltmarsh increased the sediment accumulation, decreased the landward dune migration, and retarded the process of shoreline retreat (Figure 3 and Figure 7). Hence, this positive feedback between strengthened beach barrier and backbarrier wetland has stabilized the shoreline in our study area under the present RSL rise. More importantly, such positive feedback between coastal ecosystem and restoration effort has been documented in other areas around the globe, where the coupling between engineered structures (e.g., seawalls, groynes, breakwaters, and beach nourishment) and planting Spartina and mangrove afforestation was most effective in reducing coastal erosion [107,108,109,110] and decreasing the costs of coastal defenses [111]. In this context, restored environments and healthy ecosystems are more productive and support a sustainable coastal and sea economy [112,113].
A project designed to create and nourish 385 acres of back barrier marsh between Bay Champagne and areas east of Bayou Moreau began June 2020 and is scheduled for completion by mid-2021 [29]. The main advantages of natural or artificial establishment of herbs and mangrove species in our study area are: (1) they dissipate the energy of wind, wave, and currents, contributing to the stability of dunes, muddy intertidal flats, and beaches; (2) roots and stems trap sediments, contributing to accretion in the intertidal zone to keep pace with sea-level rise; and (3) these ecosystems form an erosion-resistant surface once established [89,90,91,114,115,116]. Some disadvantages are related to (1) to their high vulnerability to hurricanes and powerful storm surges [117,118,119]; 2) several environmental stressors, including temperature [120,121,122,123,124], salinity [23,125,126,127,128], inundation [86,129,130], and sandy accumulation on muddy tidal flats [20,32], causing die-offs that can potentially lead to erosion and (3) invasive species potentially disturbing other ecosystems [131,132,133,134,135].
However, within a few years after the beach nourishment project, the action of waves and currents, intensified by continuing RSL rise, continued to erode the sea-facing coastal barriers, as recorded between Oct/2017 and Nov/2019. Hence, we believe that such positive feedback is temporary in the face of a RSL rise rate of ~9 mm/year in the study area [97], and predict that the shoreline retreat will likely resume, and the mangrove and saltmarshes will be degraded through sand accumulation on the backbarrier muddy tidal flats currently occupied by wetlands. In the event of another breaching of the beach barrier, especially in front of Bay Champagne, the wetlands substrate will be exposed to the direct action of waves and currents. Mangrove and saltmarsh substrates will be eroded, and wetland areas currently at the supratidal and intertidal zones will turn into open-water environments. Therefore, the resilience of the studied mangroves will be challenged by the long-term trends of rising RSL, diminishing sediment supply, and the impacts of future coastal barrier retreat. Overall, this positive feedback, triggered by the RSL rise, will lead to an increase in the vulnerability of this ecologically and economically important American coast.
As demonstrated by many previous studies, the coastal morphodynamics in Louisiana are closely related to the sediment supply from the Mississippi River [1,2,136,137,138]. One possible solution for combating the shoreline retreat at Port Fourchon will be to divert more sediments from the Atchafalaya River to the current Mississippi River Delta via the Old River Control Structure near Red River Landing, Louisiana [139,140]. However, this action will reduce the sediment supply to the Atchafalaya-Wax Lake delta complex [141]. The 2017 Coastal Master Plan by the State of Louisiana [26] proposed to divert sediments to the East Terrebonne Parish from the lower Atchafalaya. This coastal restoration plan could further reduce riverine sediment supply to the Chenier Plains situated in southwestern Louisiana, while the sediment load from the four nearby rivers is already declining (in total: 3.43 × 10⁵ tons per year) [142]. Hence, Louisiana’s coastal restoration efforts are facing a dilemma of either losing both sides of the delta or saving one side. In this context, the methodological flow used in this work could be expanded to other beach barriers along the Gulf of Mexico to broaden the assessment of the nourishment project effects on shoreline and coastal ecosystems for adequate decision-making to face coastal retrogradation.

5. Conclusions

RSL rise coupled with low fluvial discharge, and the action of waves, coastal currents, and hurricanes, caused the landward migration of coastal barriers (165–142 m) in front of Bay Champagne between 2004 and 2012. A maximum inland dune crest migration of ~220 m was recorded along the northeastern shoreline between 1998 and 2013. The dune crest height increased from 1.8–2 m to 2–2.5 m between 1998 and 2001, but it decreased to 1.1–1.3 m in 2013, probably due to hurricanes. A consequence was the loss of ~15.6 ha of wetlands along a 4-km coastline by the landward migration of sands from barriers and dunes onto the backbarrier muddy tidal flats occupied by Avicennia germinans (1.08 ha) and Spartina (14.52 ha). Between Nov/2012 and Jan/2015, a beach nourishment project caused the advancement of the beach barrier (30–95 m), followed by a relatively stable condition between Jan/2015 and Mar/2019. In addition, an increase in the dune height from 1.1–1.3 m to 2.5–3.0 m occurred between 2013 and 2019. The establishment of backbarrier mangroves (3.2 ha) and saltmarshes (25.4 ha) after 2013 has contributed to tidal flats keeping pace with RSL rise and increased stability of the beach barrier. However, even after the beach nourishment project, the action of waves and currents in front of the coastal barriers eroded part of the sandy intertidal flats between Oct/2017 and Nov/2019. This process will lead to the resumption of the shoreline retreat and future loss of wetlands area, increasing the vulnerability of this biologically and economically significant coast of the USA.
Coastal engineering projects have become increasingly important in the world’s coastal zones [143,144,145,146,147]. While in some cases the coastal morphodynamic impacts of these engineering projects may have been considered as part of these engineering plans, quite often the ecological impacts of these human activities are not adequately documented. This paper presents a study from a rapidly retreating part of the Louisiana and Gulf of Mexico coastline to evaluate the effectiveness of such coastal nourishment project and especially its ecological impacts on coastal wetland and mangrove ecosystems. This dataset and the assessments will be useful for decision-makers in developing sound policies and measures to combat land loss and coastal erosion.

Supplementary Materials

The following are available online at https://www.mdpi.com/article/10.3390/rs13142688/s1.

Author Contributions

Conceptualization, M.C.L.C. and A.V.d.S.; methodology, M.C.L.C. and A.V.d.S.; software, M.C.L.C.; A.V.d.S. and D.R.; validation, M.C.L.C.; A.V.d.S.; E.R.; Q.Y.; J.R. and M.D.; formal analysis, M.C.L.C.; A.V.d.S.; K.-B.L.; E.R.; Q.Y.; D.R.; L.C.R.P.; J.R. and M.D.; investigation, M.C.L.C.; A.V.d.S.; K.-B.L.; E.R.; Q.Y.; J.R. and M.D.; resources, M.C.L.C.; K.-B.L. and L.C.R.P.; data curation, M.C.L.C. and A.V.d.S.; writing—original draft preparation, M.C.L.C.; A.V.d.S.; writing—review and editing, M.C.L.C.; A.V.d.S.; K.-B.L.; E.R.; Q.Y.; L.C.R.P.; D.R.; J.R.; M.D.; visualization, M.C.L.C. and A.V.d.S.; supervision, M.C.L.C.; project administration, M.C.L.C.; K.-B.L. and L.C.R.P.; funding acquisition, M.C.L.C.; K.-B.L. and L.C.R.P. All authors have read and agreed to the published version of the manuscript.

Funding

This study was financed by the Brazilian National Council for Technology and Science-CNPq (Project # 307497/2018-6), the Research Funding Agency of the State of São Paulo-FAPESP (Project # 2020/13715-1), the United State National Science Foundation-NSF (Projects # BCS-1759715 and #1735723), and the Louisiana Sea Grant/NOAA (Project # 2013-39). PROPESP/UFPA covered the publication fees.

Institutional Review Board Statement

This study did not involve humans or animals.

Informed Consent Statement

This study did not involve humans.

Data Availability Statement

Datasets analyzed may be found in supplementary material.

Acknowledgments

The authors thank the Graduate Program in Geology and Geochemistry of the Federal University of Pará. We also acknowledge the logistic support provided by the College of the Coast and Environment of the Louisiana State University.

Conflicts of Interest

The authors declare no conflict of interest.

References

  1. Coleman, J.M. Dynamic changes and processes in the Mississippi River delta. Bull. Geol. Soc. Am. 1988, 100, 999–1015. [Google Scholar] [CrossRef]
  2. Coleman, J.M.; Roberts, H.H.; Stone, G.W. Mississippi River Delta: An Overview. J. Coast. Res. 1998, 14, 698–716. [Google Scholar]
  3. Kolb, C.R.; Van Lopik, J.R. Geology of the Mississippi River Deltaic Plain Southeastern Louisiana; U.S. Army Engineer Waterways Experiment Station: Vicksburg, MS, USA, 1958. [Google Scholar]
  4. Lam, N.; Xu, Y.; Liu, K.; Dismukes, D.; Reams, M.; Pace, R.; Qiang, Y.; Narra, S.; Li, K.; Bianchette, T.; et al. Understanding the Mississippi River Delta as a Coupled Natural-Human System: Research Methods, Challenges, and Prospects. Water 2018, 10, 1054. [Google Scholar] [CrossRef] [Green Version]
  5. Couvillion, B.R.; Beck, H.J.; Schoolmaster, D.R.; Fischer, M. Land Area Change in Coastal Louisiana (1932 to 2016)-Persistent Land Change Spatial Data; U.S. Geological Survey Data Release: Reston, VA, USA, 2018.
  6. Reed, D.J.; Wilson, L. Coast 2050: A new approach to restoration of Louisiana coastal wetlands. Phys. Geogr. 2004, 25, 4–21. [Google Scholar] [CrossRef]
  7. Jafari, N.H.; Harris, B.D.; Stark, T.D. Geotechnical investigations at the caminada headlands beach and dune in coastal Louisiana. Coast Eng. 2018, 142, 82–94. [Google Scholar] [CrossRef]
  8. Nerem, R.S.; Beckley, B.D.; Fasullo, J.T.; Hamlington, B.D.; Masters, D.; Mitchum, G.T. Climate-change-driven accelerated sea-level rise detected in the altimeter era. Proc. Natl. Acad. Sci. USA 2018, 115, 2022–2025. [Google Scholar] [CrossRef] [Green Version]
  9. Blum, M.D.; Roberts, H.H. Drowning of the Mississippi Delta due to insufficient sediment supply and global sea-levelrise. Nat. Geosci. 2009, 2, 488–491. [Google Scholar] [CrossRef]
  10. Dietz, M.; Liu, K.; Bianchette, T.; Dietz, M.E.; Liu, K.; Bianchette, T.A. Hurricanes as a Major Driver of Coastal Erosion in the Mississippi River Delta: A Multi-Decadal Analysis of Shoreline Retreat Rates at Bay Champagne, Louisiana (USA). Water 2018, 10, 1480. [Google Scholar] [CrossRef] [Green Version]
  11. Jankowski, K.L.; Törnqvist, T.E.; Fernandes, A.M. Vulnerability of Louisiana’s coastal wetlands to present-day rates of relative sea-level rise. Nat. Commun. 2017, 8, 14792. [Google Scholar] [CrossRef] [Green Version]
  12. Johnson, C.L.; Chen, Q.; Ozdemir, C.E. Lidar time-series analysis of a rapidly transgressing low-lying mainland barrier (Caminada Headlands, Louisiana, USA). Geomorphology 2020, 352, 106979. [Google Scholar] [CrossRef]
  13. Kulp, M.; Penland, S.; Williams, S.J.; Jenkins, C.; Flocks, J.; Kindinger, J. Geologic Framework, Evolution, and Sediment Resources for Restoration of the Louisiana Coastal Zone. J. Coast. Res. 2005, 21, 56–71. [Google Scholar]
  14. Yao, Q.; Liu, K.; Ryu, J. Multi-proxy Characterization of Hurricanes Rita and Ike Storm Deposits in the Rockefeller Wildlife Refuge, Southwestern Louisiana. J. Coast. Res. 2018, 85, 841–845. [Google Scholar] [CrossRef]
  15. Yao, Q.; Liu, K.; Aragón-Moreno, A.A.; Rodrigues, E.; Xu, Y.J.; Lam, N.S. A 5200-year paleoecological and geochemical record of coastal environmental changes and shoreline fluctuations in southwestern Louisiana: Implications for coastal sustainability. Geomorphology 2020, 365, 107284. [Google Scholar] [CrossRef]
  16. Maiolo, M.; Mel, R.A.; Sinopoli, S. A Stepwise Approach to Beach Restoration at Calabaia Beach. Water 2020, 12, 2677. [Google Scholar] [CrossRef]
  17. Osland, M.J.; Day, R.H.; Hall, C.T.; Brumfield, M.D.; Dugas, J.L.; Jones, W.R. Mangrove expansion and contraction at a poleward range limit: Climate extremes and land-ocean temperature gradients. Ecology 2017, 98, 125–137. [Google Scholar] [CrossRef]
  18. Stevens, P.W.; Fox, S.L.; Montague, C.L. The interplay between mangroves and saltmarshes at the transition between temperate and subtropical climate in Florida. Wetl. Ecol. Manag. 2006, 14, 435–444. [Google Scholar] [CrossRef]
  19. Woodroffe, C.D. Response of tide-dominated mangrove shorelines in Northern Australia to anticipated sea-level rise. Earth Surf. Process. Landf. 1995, 20, 65–85. [Google Scholar] [CrossRef]
  20. Cohen, M.C.L.; Lara, R.J. Temporal changes of mangrove vegetation boundaries in Amazonia: Application of GIS and remote sensing techniques. Wetl. Ecol. Manag. 2003, 11, 223–231. [Google Scholar] [CrossRef]
  21. Mclvor, A.; Möller, I.; Spencer, T.; Spalding, M. Reduction of Wind and Swell Waves by Mangroves; Natural Coastal Protection Series: Report 1; Cambridge Coastal Research Unit Working Paper 40; The Nature Conservancy and Wetlands International: Wageningen, The Netherlands, 2012; Volume 1, 27p. [Google Scholar]
  22. Krauss, K.W.; McKee, K.L.; Lovelock, C.E.; Cahoon, D.R.; Saintilan, N.; Reef, R.; Chen, L. How mangrove forests adjust to rising sea level. New Phytol. 2014, 202, 19–34. [Google Scholar] [CrossRef] [PubMed] [Green Version]
  23. Cohen, M.C.L.; de Souza, A.V.; Rossetti, D.F.; Pessenda, L.C.R.; França, M.C. Decadal-scale dynamics of an Amazonian mangrove caused by climate and sea level changes: Inferences from spatial-temporal analysis and Digital Elevation Models. Earth Surf. Process. Landf. 2018, 43, 2876–2888. [Google Scholar] [CrossRef]
  24. Cohen, M.C.L.; Figueiredo, B.L.; Oliveira, N.N.; Fontes, N.A.; França, M.C.; Pessenda, L.C.R.; de Souza, A.V.; Macario, K.; Giannini, P.C.F.; Bendassolli, J.A.; et al. Impacts of Holocene and modern sea-level changes on estuarine mangroves from northeastern Brazil. Earth Surf. Process. Landf. 2020, 45, 375–392. [Google Scholar] [CrossRef]
  25. Saintilan, N.; Khan, N.S.; Ashe, E.; Kelleway, J.J.; Rogers, K.; Woodroffe, C.D.; Horton, B.P. Thresholds of mangrove survival under rapid sea level rise. Science 2020, 368, 1118–1121. [Google Scholar] [CrossRef] [PubMed]
  26. CPRA. Coastal Master Plan; Coastal Protection and Restoration Authority: Baton Rouge, LA, USA, 2017.
  27. Coastal Engineering Consultants. Caminada Headland Beach and Dune Restoration (BA-45) Completion Report; Coastal Protection and Restoration Authority: Baton Rouge, LA, USA, 2015.
  28. Li, B.; Sherman, D.J. Aerodynamics and morphodynamics of sand fences: A review. Aeolian Res. 2015, 17, 33–48. [Google Scholar] [CrossRef]
  29. Louisiana Coastal Wetlands Conservation and Restoration Task Force Caminada Headlands Back Barrier Marsh Creation (BA-171). Available online: https://mississippiriverdelta.org//files/2017/03/CWPPRA-Caminada-headlands-back-barrier-marsh-restoration.pdf (accessed on 15 June 2021).
  30. Coastal Protection and Restoration Authority (CPRA). Barrier Island Status Report: Draft Fiscal Year 2022 Annual Plan; Coastal Protection and Restoration Authority of Louisiana (CPRA): Baton Rouge, LA, USA, 2021.
  31. Caminada Headland Beach and Dune Restoration. Available online: https://res.us/projects/caminada-headland-beach-and-dune-restoration/ (accessed on 15 June 2021).
  32. Cohen, M.C.L.; Behling, H.; Lara, R.J.; Smith, C.B.; Matos, H.R.S.; Vedel, V. Impact of sea-level and climatic changes on the Amazon coastal wetlands during the late Holocene. Veg. Hist. Archaeobot. 2009, 18, 425–439. [Google Scholar] [CrossRef]
  33. Doyle, T.W.; Krauss, K.W.; Conner, W.H.; From, A.S. Predicting the retreat and migration of tidal forests along the northern Gulf of Mexico under sea-level rise. For. Ecol. Manag. 2010, 259, 770–777. [Google Scholar] [CrossRef]
  34. Howard, R.J.; Day, R.H.; Krauss, K.W.; From, A.S.; Allain, L.; Cormier, N. Hydrologic restoration in a dynamic subtropical mangrove-to-marsh ecotone. Restor. Ecol. 2017, 25, 471–482. [Google Scholar] [CrossRef]
  35. Krauss, K.W.; From, A.S.; Doyle, T.W.; Doyle, T.J.; Barry, M.J. Sea-level rise and landscape change influence mangrove encroachment onto marsh in the Ten Thousand Islands region of Florida, USA. J. Coast. Conserv. 2011, 15, 629–638. [Google Scholar] [CrossRef]
  36. NOAA National Oceanic and Atmospheric Administration. Available online: www.ncdc.noaa.gov (accessed on 21 October 2017).
  37. Penland, S.; Suter, J.R. Barrier Island Erosion and Protection in Louisiana: A Coastal Geomorphological Perspective; Transactions Gulf Coast Association of Geological Societies: Austin, TX, USA, 1988; p. 38. [Google Scholar]
  38. Williams, S.J.; Penland, S.; Sallenger, A.H. Atlas of Shoreline Changes from 1853 to 1989: Louisiana Barrier Island Erosion Study; United States Geological Survey: Reston, VA, USA, 1992.
  39. Byrnes, M.R.; Britsch, L.D.; Berlinghoff, J.L.; Johnson, R.; Khalil, S. Recent subsidence rates for Barataria Basin, Louisiana. Geo-Marine Lett. 2019, 39, 265–278. [Google Scholar] [CrossRef]
  40. Henry, K.M.; Twilley, R.R. Soil Development in a Coastal Louisiana Wetland during a Climate-Induced Vegetation Shift from Salt Marsh to Mangrove. J. Coast. Res. 2013, 292, 1273–1283. [Google Scholar] [CrossRef]
  41. Liu, K.; Li, C.; Bianchette, T.; McCloskey, T. Storm Deposition in a Coastal Backbarrier Lake in Louisiana Caused by Hurricanes Gustav and Ike. J. Coast. Res. 2011, 64, 1866–1870. [Google Scholar]
  42. Berg, R. Tropical Cyclone Report Hurricane Ike; National Hurricane Center: Miami, FL, USA, 2009; pp. 1–55.
  43. USGS United States Geological Survey. Available online: https://www.usa.gov/federal-agencies/u-s-geological-survey (accessed on 21 October 2017).
  44. Gorelick, N.; Hancher, M.; Dixon, M.; Ilyushchenko, S.; Thau, D.; Moore, R. Google Earth Engine: Planetary-scale geospatial analysis for everyone. Remote Sens. Environ. 2017, 202, 18–27. [Google Scholar] [CrossRef]
  45. Global Mapper User’s Manual. Available online: http://www.globalmapper.it/helpv11/Help_Main.html (accessed on 1 April 2020).
  46. Agisoft PhotoScan AgiSoft PhotoScan Professional; Version 1.4.5; Agisoft LLC. St.: Petersburg, Russia, 2018; Available online: http://www.agisoft.com/downloads/installer/ (accessed on 21 October 2017).
  47. R Core Team. A Language and Environment for Statistical Computing; R Foundation for Statistical Computing: Vienna, Austria, 2019; Available online: https//www.R-project.org/ (accessed on 21 October 2017).
  48. Peterson, B.G.; Carl, P. PerformanceAnalytics: Econometric Tools for Performance and Risk Analysis, Rpackage version 1.5.3. 2019. Available online: https://CRAN.R-project.org/package=PerformanceAnalytics (accessed on 21 October 2017).
  49. Olson, B.R.; Placchetti, R.A.; Quartermaine, J.; Killebrew, A.E. The Tel Akko total archaeology project (Akko, Israel): Assessing the suitability of multi-scale 3d field recording in archaeology. J. Field Archaeol. 2013, 38, 244–262. [Google Scholar] [CrossRef]
  50. Kokić, P.; Tomaš, B. Enhanced Drone Swarm Localization Using GPS and Trilateration Based on RF Propagation Model. In Proceedings of the Central European Conference on Information and Intelligent Systems, 28th CECIIS, Varaždin, Croatia, 27–29 September 2017; pp. 259–264. [Google Scholar]
  51. Kalacska, M.; Lucanus, O.; Arroyo, P.; Laliberté, É.; Elmer, K.; Leblanc, G.E.; Groves, A. Accuracy of 3d landscape reconstruction without ground control points using different uas platforms. Drones 2020, 4, 13. [Google Scholar] [CrossRef] [Green Version]
  52. Guo, N.; Li, Y. The Accuracy of Low-Altitude Photogrammetry of Drones. Int. J. Pattern Recognit. Artif. Intell. 2020, 34. [Google Scholar] [CrossRef]
  53. Callow, J.N.; May, S.M.; Leopold, M. Drone photogrammetry and KMeans point cloud filtering to create high resolution topographic and inundation models of coastal sediment archives. Earth Surf. Process. Landf. 2018, 43, 2603–2615. [Google Scholar] [CrossRef]
  54. Pian, S.; Menier, D.; Régnauld, H.; Ramkumar, M.; Sedrati, M.; Mathew, M.J. Influences of Inherited Structures, and Longshore Hydrodynamics Over the Spatio-Temporal Coastal Dynamics Along the Gâvres-Penthièvre, South Brittany, France. In Coastal Zone Management: Global Perspectives, Regional Processes, Local Issues; Elsevier: Amsterdam, The Netherlands, 2018; pp. 181–205. ISBN 9780128143513. [Google Scholar]
  55. Blum, M.D.; Törnqvist, T.E. Fluvial responses to climate and sea-level change: A review and look forward. Sedimentology 2000, 47, 2–48. [Google Scholar] [CrossRef]
  56. Swift, D.J.P.; Thorne, J.A. Sedimentation on Continental Margins, I: A General Model for Shelf Sedimentation. In Shelf Sand and Sandstone Bodies; Blackwell Publishing Ltd.: Oxford, UK, 2009; pp. 1–31. [Google Scholar]
  57. Posamentier, H.W.; Allen, G.P.; James, D.P.; Tesson, M. Forced regressions in a sequence stratigraphic framework: Concepts, examples, and exploration significance. Am. Assoc. Pet. Geol. Bull. 1992, 76, 1687–1709. [Google Scholar]
  58. Posamentier, H.W.; Allen, G.P. Siliciclastic Sequence Stratigraphy: Concepts and Applications, SEPM Concepts in Sedimentology and Paleontology, 7th ed.; SEPM (Society for Sedimentary Geology): Tulsa, OK, USA, 1999. [Google Scholar]
  59. Cowell, P.J.; Stive, M.; Niedoroda, A.; Swift, D.J.P.; Vriend, H.; Buijsman, M.C.; Nicholls, R.J.; Roy, P.S.; Kaminsky, G.; Cleveringa, J.; et al. The coastal tract (Part 2): Applications of aggregated modeling of low-order coastal change. J. Coast. Res. 2003, 19, 828–848. [Google Scholar]
  60. Coe, A.L.; Bosence, D.W.J.; Church, K.D.; Flint, S.S.; Howell, J.A.; Wilson, R.C.L. The Sedimentary Record of Sea-Level Change; Cambridge University Press: Cambridge, UK, 2003. [Google Scholar]
  61. Jervey, M.T. Quantitative geological modeling of siliciclastic rock sequences and their seismic expression. In Sea-Level Changes: An Integrated Approach; Wilgus, C.K., Hasting, B.S., Kendall, C.G., Posamentier, H.W., Ross, C.A., Van Wagoner, J.C., Eds.; Society of Economic Paleontologists and Mineralogists, Special Publication: Tulsa, OK, USA, 1988; pp. 47–69. [Google Scholar]
  62. Catuneanu, O. Sequence stratigraphy of clastic systems: Concepts, merits, and pitfalls. J. Afr. Earth Sci. 2002, 35, 1–43. [Google Scholar] [CrossRef]
  63. Blum, M.D.; Roberts, H.H. The Mississippi Delta Region: Past, Present, and Future. Annu. Rev. Earth Planet. Sci. 2012, 40, 655–683. [Google Scholar] [CrossRef]
  64. Keown, M.P.; Dardeau, E.A.; Causey, E.M. Historic Trends in the Sediment Flow Regime of the Mississippi River. Water Resour. Res. 1986, 22, 1555–1564. [Google Scholar] [CrossRef]
  65. Kesel, R.H. The decline in the suspended load of the Lower Mississippi River and its influence on adjacent wetlands. Environ. Geol. Water Sci. 1988, 11, 271–281. [Google Scholar] [CrossRef]
  66. Maloney, J.M.; Bentley, S.J.; Xu, K.; Obelcz, J.; Georgiou, I.Y.; Miner, M.D. Mississippi River subaqueous delta is entering a stage of retrogradation. Mar. Geol. 2018, 400, 12–23. [Google Scholar] [CrossRef]
  67. Meade, R.H.; Moody, J.A. Causes for the decline of suspended-sediment discharge in the Mississippi River system, 1940–2007. Hydrol. Process. 2010, 24, 35–49. [Google Scholar] [CrossRef]
  68. Day, J.W.; Boesch, D.F.; Clairain, E.J.; Kemp, G.P.; Laska, S.D.; Mitsch, W.J.; Orth, K.; Mashriqui, H.; Reed, D.J.; Shabman, L.; et al. Restoration of the Mississippi Delta: Lessons from Hurricanes Katrina and Rita. Science 2007, 315, 1679–1684. [Google Scholar] [CrossRef] [Green Version]
  69. Keim, D.; Robert, A.M. Hurricanes of the Gulf of Mexico; Louisiana State University Press: Baton Rouge, LA, USA, 2009. [Google Scholar]
  70. Naquin, J.D.; Liu, K.; McCloskey, T.A.; Bianchette, T.A. Storm deposition induced by hurricanes in a rapidly subsiding coastal zone. J. Coast. Res. 2014, 70, 308–313. [Google Scholar] [CrossRef]
  71. Penland, S.; Connor, P.F., Jr.; Beall, A.; Fearnley, S.; Williams, S.J. Changes in Louisiana’s Shoreline: 1855–2002. J. Coast. Res. 2005, 21, 7–39. [Google Scholar]
  72. Penland, S.; Debusschere, K.; Westphal, K.A.; Suter, J.R.; McBride, R.A.; Reimer, P.D. The 1985 Hurricane Impacts on the Isles Dernieres, Louisiana: A Temporal and Spatial Analysis of the Coastal Geomorphic Changes. Gulf Coast Assoc. Geol. Soc. Trans. 1989, 39, 455–470. [Google Scholar]
  73. Stone, G.; Grymes, J.M., III; Dingler, J.R.; Pepper, D.A. Overview and Significance of Hurricanes on the Louisiana Coast. J. Coast. Res. 1997, 13, 656–669. [Google Scholar]
  74. Xu, K.; Mickey, R.C.; Chen, Q.; Harris, C.K.; Hetland, R.D.; Hu, K.; Wang, J. Shelf sediment transport during hurricanes Katrina and Rita. Comput. Geosci. 2016, 90, 24–39. [Google Scholar] [CrossRef]
  75. Bianchette, T.A.; Liu, K.B.; Qiang, Y.; Lam, N.S.N. Wetland accretion rates along coastal Louisiana: Spatial and temporal variability in light of hurricane Isaac’s impacts. Water 2016, 8, 1. [Google Scholar] [CrossRef] [Green Version]
  76. Liu, K.B.; McCloskey, T.A.; Bianchette, T.A.; Keller, G.; Lam, N.S.N.; Cable, J.E.; Arriola, J. Hurricane Isaac storm surge deposition in a coastal wetland along Lake Pontchartrain, southern Louisiana. J. Coast. Res. 2015, 70, 266–271. [Google Scholar] [CrossRef]
  77. Bradberry, J.; Harris, T.; Wilson, S.; Montoucet, J.; Brown, C.; Pierson, D.; Strain, M.; Dardenne, J.; Milling, K.; Waskom, J. Integrated Ecosystem Restoration & Hurricane Protection in Coastal Louisiana: Fiscal Year 2019 Annual Plan; Coastal Protection and Restoration Authority of Louisiana: Baton Rouge, LA, USA, 2019.
  78. Bhattacharya, J.P. Deltas. In Facies Models Revisited; SEPM (Society for Sedimentary Geology): McLean, VA, USA, 2011; pp. 237–292. [Google Scholar]
  79. Cohen, M.C.L.; França, M.C.; Rossetti, D.; Pessenda, L.C.R.; Giannini, P.C.F.; Lorente, F.L.; Junior, A.Á.B.; Castro, D.; Macario, K. Landscape evolution during the late Quaternary at the Doce River mouth, Espírito Santo State, Southeastern Brazil. Palaeogeogr. Palaeoclimatol. Palaeoecol. 2014, 415, 48–58. [Google Scholar] [CrossRef]
  80. Woodroffe, C.D.; Rogers, K.; McKee, K.L.; Lovelock, C.E.; Mendelssohn, I.A.; Saintilan, N. Mangrove Sedimentation and Response to Relative Sea-Level Rise. Ann. Rev. Mar. Sci. 2016, 8, 243–266. [Google Scholar] [CrossRef] [PubMed] [Green Version]
  81. Bruun, P. Sea level rise as a cause of shore erosion. J. Waterw. Harb. Div. Am. Soc. Civ. Eng. 1962, 88, 117–130. [Google Scholar]
  82. Schwartz, M.L. Laboratory study of sea-level rise as a cause of shore erosion. J. Geol. 1965, 73, 528–534. [Google Scholar] [CrossRef]
  83. Cohen, M.C.L.; Pessenda, L.C.R.; Behling, H.; de Fátima Rossetti, D.; França, M.C.; Guimarães, J.T.F.; Friaes, Y.; Smith, C.B. Holocene palaeoenvironmental history of the Amazonian mangrove belt. Quat. Sci. Rev. 2012, 55, 50–58. [Google Scholar] [CrossRef]
  84. Woodroffe, C.D.; Murray-Wallace, C.V. Sea-Level Rise and Coastal Change: The Past as a Guide to the Future. Quat. Sci. Rev. 2012, 54, 4–11. [Google Scholar] [CrossRef]
  85. Ellisson, J.C. Mangrove vulnerability assessment methodology and adaptation prioritisation. Malays. For. 2016, 79, 95–108. [Google Scholar]
  86. McKee, K.L.; Cahoon, D.R.; Feller, I.C. Caribbean mangroves adjust to rising sea level through biotic controls on change in soil elevation. Glob. Ecol. Biogeogr. 2007, 16, 545–556. [Google Scholar] [CrossRef]
  87. Kirwan, M.L.; Murray, A.B. A coupled geomorphic and ecological model of tidal marsh evolution. Proc. Natl. Acad. Sci. USA 2007, 104, 6118–6122. [Google Scholar] [CrossRef] [PubMed] [Green Version]
  88. Morris, J.T.; Sundareshwar, P.V.; Nietch, C.T.; Kjerfve, B.; Cahoon, D.R. Responses of coastal wetlands to rising sea level. Ecology 2002, 83, 2869–2877. [Google Scholar] [CrossRef]
  89. Das, S.; Crépin, A.S. Mangroves can provide protection against wind damage during storms. Estuar. Coast. Shelf Sci. 2013, 134, 98–107. [Google Scholar] [CrossRef]
  90. Furukawa, K.; Wolanski, E. Sedimentation in Mangrove Forests. Mangroves Salt Marshes 1996, 1, 3–10. [Google Scholar] [CrossRef]
  91. Furukawa, K.; Wolanski, E.; Mueller, H. Currents and sediment transport in mangrove forests. Estuar. Coast. Shelf Sci. 1997, 44, 301–310. [Google Scholar] [CrossRef]
  92. Lovelock, C.E.; Cahoon, D.R.; Friess, D.A.; Guntenspergen, G.R.; Krauss, K.W.; Reef, R.; Rogers, K.; Saunders, M.L.; Sidik, F.; Swales, A.; et al. The vulnerability of Indo-Pacific mangrove forests to sea-level rise. Nature 2015, 526, 559–563. [Google Scholar] [CrossRef] [Green Version]
  93. Breithaupt, J.L.; Smoak, J.M.; Rivera-Monroy, V.H.; Castañeda-Moya, E.; Moyer, R.P.; Simard, M.; Sanders, C.J. Partitioning the relative contributions of organic matter and mineral sediment to accretion rates in carbonate platform mangrove soils. Mar. Geol. 2017, 390, 170–180. [Google Scholar] [CrossRef]
  94. Sasmito, S.D.; Murdiyarso, D.; Friess, D.A.; Kurnianto, S. Can mangroves keep pace with contemporary sea level rise? A global data review. Wetl. Ecol. Manag. 2016, 24, 263–278. [Google Scholar] [CrossRef]
  95. Spencer, T.; Schuerch, M.; Nicholls, R.J.; Hinkel, J.; Lincke, D.; Vafeidis, A.T.; Reef, R.; McFadden, L.; Brown, S. Global coastal wetland change under sea-level rise and related stresses: The DIVA Wetland Change Model. Glob. Planet. Chang. 2016, 139, 15–30. [Google Scholar] [CrossRef] [Green Version]
  96. Doyle, T.W.; Chivoiu, B.; Enwright, N.M. Sea-Level Rise Modeling Handbook: Resource Guide for Coastal Land Managers, Engineers, and Scientists; United States Geological Survey: Reston, VA, USA, 2015.
  97. Sweet, W.; Dusek, G.; Obeysekera, J.; Marra, J.J. NOAA Technical Report NOS CO-OPS 086. Patterns and Projections of High Tide Flooding Along the U.S. Coastline Using a Common Impact Threshold; National Oceanic and Atmospheric Administration: Silver Spring, MD, USA, 2018.
  98. Sherrod, C.L.; McMillan, C. The distributional history and ecology of mangrove vegetation along the northern Gulf of Mexico coastal region. Contrib. Mar. Sci. 1985, 28, 129–140. [Google Scholar]
  99. Everitt, J.H.; Judd, F.W.; Escobar, D.E.; Davis, M.R. Integration of remote sensing and spatial information technologies for mapping black mangrove on the Texas gulf coast. J. Coast. Res. 1996, 12, 64–69. [Google Scholar]
  100. Osland, M.J.; Feher, L.C.; López-Portillo, J.; Day, R.H.; Suman, D.O.; Guzmán Menéndez, J.M.; Rivera-Monroy, V.H. Mangrove forests in a rapidly changing world: Global change impacts and conservation opportunities along the Gulf of Mexico coast. Estuar. Coast. Shelf Sci. 2018, 214, 120–140. [Google Scholar] [CrossRef]
  101. Chapman, V.J. Mangrove Vegetation. J. Cramer 1976, 447, 10006437215. [Google Scholar]
  102. Patterson, S.; McKee, K.L.; Mendelssohn, I.A. Effects of tidal inundation and predation on Avicennia germinans seedling establishment and survival in a sub-tropical mangal/salt marsh community. Mangroves Salt Marshes 1997, 1, 103–111. [Google Scholar] [CrossRef]
  103. Perry, C.L.; Mendelssohn, I.A. Ecosystem effects of expanding populations of Avicennia germinans in a Louisiana salt marsh. Wetlands 2009, 29, 396–406. [Google Scholar] [CrossRef]
  104. Giri, C.; Long, J.; Tieszen, L. Mapping and Monitoring Louisiana’s Mangroves in the Aftermath of the 2010 Gulf of Mexico Oil Spill. J. Coast. Res. 2011, 277, 1059–1064. [Google Scholar] [CrossRef]
  105. Osland, M.J.; Feher, L.C.; Griffith, K.T.; Cavanaugh, K.C.; Enwright, N.M.; Day, R.H.; Stagg, C.L.; Krauss, K.W.; Howard, R.J.; Grace, J.B.; et al. Climatic controls on the global distribution, abundance, and species richness of mangrove forests. Ecol. Monogr. 2017, 87, 341–359. [Google Scholar] [CrossRef] [Green Version]
  106. Cavanaugh, K.C.; Kellner, J.R.; Forde, A.J.; Gruner, D.S.; Parker, J.D.; Rodriguez, W.; Feller, I.C. Poleward expansion of mangroves is a threshold response to decreased frequency of extreme cold events. Proc. Natl. Acad. Sci. USA 2014, 111, 723–727. [Google Scholar] [CrossRef] [Green Version]
  107. Luo, S.; Cai, F.; Liu, H.; Lei, G.; Qi, H.; Su, X. Adaptive measures adopted for risk reduction of coastal erosion in the People’s Republic of China. Ocean Coast. Manag. 2015, 103, 134–145. [Google Scholar] [CrossRef]
  108. Berry, A.; Fahey, S.; Meyers, N. Changing of the guard: Adaptation options that maintain ecologically resilient sandy beach ecosystems. J. Coast. Res. 2013, 29, 899–908. [Google Scholar] [CrossRef]
  109. van Slobbe, E.; de Vriend, H.J.; Aarninkhof, S.; Lulofs, K.; de Vries, M.; Dircke, P. Building with Nature: In search of resilient storm surge protection strategies. Nat. Hazards 2013, 65, 947–966. [Google Scholar] [CrossRef]
  110. Borsje, B.W.; Wesenbeeck, B.K.; Dekker, F.; Paalvast, P.; Bouma, T.J.; Katwijk, M.M.; Vries, M.B. How ecological engineering can serve in coastal protection. Ecol. Eng. 2011, 37, 117–132. [Google Scholar] [CrossRef]
  111. Jonkman, S.N.; Hillen, M.M.; Nicholls, R.J.; Kanning, W.; Van Ledden, M. Costs of adapting coastal defences to sea-level rise-New estimates and their implications. J. Coast. Res. 2013, 29, 1212–1226. [Google Scholar] [CrossRef]
  112. Ostrom, E. A general framework for analyzing sustainability of social-ecological systems. Science 2009, 325, 419–422. [Google Scholar] [CrossRef] [PubMed]
  113. Post, J.C.; Lundin, C. Guidelines for Integrated Coastal Zone Management; The World Bank: Washington, DC, USA, 1996; Volume 9, ISBN 0821337351. [Google Scholar]
  114. Phan, L.K.; Van Thiel De Vries, J.S.M.; Stive, M.J.F. Coastal mangrove squeeze in the Mekong Delta. J. Coast. Res. 2015, 31, 233–243. [Google Scholar] [CrossRef]
  115. Anthony, E.J.; Gratiot, N. Coastal engineering and large-scale mangrove destruction in Guyana, South America: Averting an environmental catastrophe in the making. Ecol. Eng. 2012, 47, 268–273. [Google Scholar] [CrossRef]
  116. Barbier, E.B.; Koch, E.W.; Silliman, B.R.; Hacker, S.D.; Wolanski, E.; Primavera, J.; Granek, E.F.; Polasky, S.; Aswani, S.; Cramer, L.A.; et al. Coastal ecosystem-based management with nonlinear ecological functions and values. Science 2008, 319, 321–323. [Google Scholar] [CrossRef]
  117. Aung, T.T.; Mochida, Y.; Than, M.M. Prediction of recovery pathways of cyclone-disturbed mangroves in the mega delta of Myanmar. For. Ecol. Manag. 2013, 293, 103–113. [Google Scholar] [CrossRef]
  118. Koh, H.L.; Teh, S.Y.; Kh’Ng, X.Y.; Raja Barizan, R.S. Mangrove forests: Protection against and resilience to coastal disturbances. J. Trop. For. Sci. 2018, 30, 446–460. [Google Scholar] [CrossRef]
  119. Roth, L.C. Hurricanes and Mangrove Regeneration: Effects of Hurricane Joan, October 1988, on the Vegetation of Isla del Venado, Bluefields, Nicaragua. Biotropica 1992, 24, 375. [Google Scholar] [CrossRef] [Green Version]
  120. Cavanaugh, K.C.; Osland, M.J.; Bardou, R.; Hinojosa-Arango, G.; López-Vivas, J.M.; Parker, J.D.; Rovai, A.S. Sensitivity of mangrove range limits to climate variability. Glob. Ecol. Biogeogr. 2018, 27, 925–935. [Google Scholar] [CrossRef] [Green Version]
  121. Osland, M.J.; Day, R.H.; Hall, C.T.; Feher, L.C.; Armitage, A.R.; Cebrian, J.; Dunton, K.H.; Hughes, A.R.; Kaplan, D.A.; Langston, A.K.; et al. Temperature thresholds for black mangrove (Avicennia germinans) freeze damage, mortality and recovery in North America: Refining tipping points for range expansion in a warming climate. J. Ecol. 2020, 108, 654–665. [Google Scholar] [CrossRef]
  122. Osland, M.J.; Hartmann, A.M.; Day, R.H.; Ross, M.S.; Hall, C.T.; Feher, L.C.; Vervaeke, W.C. Microclimate Influences Mangrove Freeze Damage: Implications for Range Expansion in Response to Changing Macroclimate. Estuar. Coasts 2019, 42, 1084–1096. [Google Scholar] [CrossRef]
  123. Cohen, M.C.L.; Rodrigues, E.; Rocha, D.O.S.; Freitas, J.; Fontes, N.A.; Pessenda, L.C.R.; de Souza, A.V.; Gomes, V.L.P.; França, M.C.; Bonotto, D.M.; et al. Southward migration of the austral limit of mangroves in South America. Catena 2020, 195, 104775. [Google Scholar] [CrossRef]
  124. Rodrigues, E.; Cohen, M.C.L.; Liu, K.; Pessenda, L.C.R.; Yao, Q.; Ryu, J.; Rossetti, D.; de Souza, A.; Dietz, M. The effect of global warming on the establishment of mangroves in coastal Louisiana during the Holocene. Geomorphology 2021, 381, 107648. [Google Scholar] [CrossRef]
  125. Wang, H.; Gilbert, J.A.; Zhu, Y.; Yang, X. Salinity is a key factor driving the nitrogen cycling in the mangrove sediment. Sci. Total Environ. 2018, 631–632, 1342–1349. [Google Scholar] [CrossRef]
  126. Ball, M. Ecophysiology of mangroves. Trees 1988, 2, 129–142. [Google Scholar] [CrossRef]
  127. Scholander, P.F.; Hammel, H.T.; Hemmingsen, E.; Garey, W. Salt balance in mangroves. Plant Physiol. 1962, 37, 722–729. [Google Scholar] [CrossRef] [PubMed] [Green Version]
  128. Lara, R.J.; Cohen, M.C.L. Sediment porewater salinity, inundation frequency and mangrove vegetation height in Bragança, North Brazil: An ecohydrology-based empirical model. Wetl. Ecol. Manag. 2006, 14, 349–358. [Google Scholar] [CrossRef]
  129. Couvillion, B.R.; Beck, H. Marsh Collapse Thresholds for Coastal Louisiana Estimated Using Elevation and Vegetation Index Data. J. Coast. Res. 2013, 63, 58–67. [Google Scholar] [CrossRef]
  130. Glick, P.; Clough, J.; Polaczyk, A.; Couvillion, B.; Nunley, B. Potential Effects of Sea-Level Rise on Coastal Wetlands in Southeastern Louisiana. J. Coast. Res. 2013, 63, 211–233. [Google Scholar] [CrossRef]
  131. Zhang, Y.; Huang, G.; Wang, W.; Chen, L.; Lin, G. Interactions between mangroves and exotic Spartina in an anthropogenically disturbed estuary in southern China. Ecology 2012, 93, 588–597. [Google Scholar] [CrossRef] [PubMed] [Green Version]
  132. Feng, J.; Guo, J.; Huang, Q.; Jiang, J.; Huang, G.; Yang, Z.; Lin, G. Changes in the community structure and diet of benthic macrofauna in invasive Spartina alterniflora wetlands following restoration with native mangroves. Wetlands 2014, 34, 673–683. [Google Scholar] [CrossRef]
  133. Ren, H.; Lu, H.; Shen, W.; Huang, C.; Guo, Q.; Li, Z.; Jian, S. Sonneratia apetala Buch.Ham in the mangrove ecosystems of China: An invasive species or restoration species? Ecol. Eng. 2009, 35, 1243–1248. [Google Scholar] [CrossRef]
  134. An, S.Q.; Gu, B.H.; Zhou, C.F.; Wang, Z.S.; Deng, Z.F.; Zhi, Y.B.; Li, H.L.; Chen, L.; Yu, D.H.; Liu, Y.H. Spartina invasion in China: Implications for invasive species management and future research. Weed Res. 2007, 47, 183–191. [Google Scholar] [CrossRef]
  135. Chen, L.; Wang, W.; Zhang, Y.; Lin, G. Recent progresses in mangrove conservation, restoration and research in China. J. Plant Ecol. 2009, 2, 45–54. [Google Scholar] [CrossRef]
  136. Xu, Y.J.; Rosen, T. Are riverine sediment discharges sufficient to offset the sinking coast of Louisiana? In Proceedings of the Erosion and Sediments Yields in the Changing Environment, Chengdu, China, 11–15 October 2012; pp. 104–113. [Google Scholar]
  137. Rosen, T.; Xu, Y. A Hydrograph-Based Sediment Availability Assessment: Implications for Mississippi River Sediment Diversion. Water 2014, 6, 564–583. [Google Scholar] [CrossRef] [Green Version]
  138. Nittrouer, J.A.; Shaw, J.; Lamb, M.P.; Mohrig, D. Spatial and temporal trends for water-flow velocity and bed-material sediment transport in the lower Mississippi River. Bull. Geol. Soc. Am. 2012, 124, 400–414. [Google Scholar] [CrossRef]
  139. Rosen, T.; Xu, Y.J. Recent decadal growth of the Atchafalaya River Delta complex: Effects of variable riverine sediment input and vegetation succession. Geomorphology 2013, 194, 108–120. [Google Scholar] [CrossRef]
  140. Rosen, T.; Xu, Y.J. Estimation of sedimentation rates in the distributary basin of the Mississippi River, the Atchafalaya River Basin, USA. Hydrol. Res. 2015, 46, 244–257. [Google Scholar] [CrossRef] [Green Version]
  141. Wang, B.; Xu, Y.J. Decadal-Scale Riverbed Deformation and Sand Budget of the Last 500 km of the Mississippi River: Insights Into Natural and River Engineering Effects on a Large Alluvial River. J. Geophys. Res. Earth Surf. 2018, 123, 874–890. [Google Scholar] [CrossRef]
  142. Rosen, T.; Xu, Y.J. Riverine sediment inflow to Louisiana Chenier Plain in the Northern Gulf of Mexico. Estuar. Coast. Shelf Sci. 2011, 95, 279–288. [Google Scholar] [CrossRef]
  143. Pranzini, E. Coastal erosion and shore protection: A brief historical analysis. J. Coast. Conserv. 2018, 22, 827–830. [Google Scholar] [CrossRef]
  144. Williams, A.T.; Rangel-Buitrago, N.; Pranzini, E.; Anfuso, G. The management of coastal erosion. Ocean Coast. Manag. 2018, 156, 4–20. [Google Scholar] [CrossRef]
  145. Hanson, H.; Brampton, A.; Capobianco, M.; Dette, H.; Hamm, L.; Laustrup, C.; Lechuga, A.; Spanhoff, R. Beach nourishment projects, practices, and objectives—A European overview. Coast. Eng. 2002, 47, 81–111. [Google Scholar] [CrossRef]
  146. Stive, M.J.F.; De Schipper, M.A.; Luijendijk, A.P.; Aarninkhof, S.G.J.; Van Gelder-Maas, C.; Van Thiel De Vries, J.S.M.; De Vries, S.; Henriquez, M.; Marx, S.; Ranasinghe, R. A new alternative to saving our beaches from sea-level rise: The sand engine. J. Coast. Res. 2013, 29, 1001–1008. [Google Scholar] [CrossRef]
  147. Syvitski, J.P.M.; Vörösmarty, C.J.; Kettner, A.J.; Green, P. Impact of humans on the flux of terrestrial sediment to the global coastal ocean. Science 2005, 308, 376–380. [Google Scholar] [CrossRef]
Figure 1. Location of the study area in the Bay Champagne, Louisiana, with limits of black mangrove and marshes, ground control points indicated and a planialtimetric cross-shore profile (a′–b′). (a) Ground photo taken in Nov/2019 exhibiting establishment of Avicennia shrubs on backbarrier tidal flats; (b) aerial photo taken in Mar/2018 showing the rubber bulkheads; (c) ground photo taken in Nov/2019 showing the fence on beach barrier; (d) ground photo taken in Nov/2019 showing herbaceous vegetation on backbarrier sandy plain; (e) aerial photos obtained in Nov/2019 showing the beach barrier.
Remotesensing 13 02688 g001
Figure 2. Methodology flow chart.
Remotesensing 13 02688 g002
Figure 3. (a) Comparison between the digital surface models of 1998 and 2019, (b) perspective of the digital elevation models of the beach barrier between 1998 and 2019, and (c) planialtimetric cross-shore profiles, showing the dune crest positions based on Lidar and drone data in the time intervals: 1998—2019 (transects c′—d′ and e′—f′), Oct/2017—Nov/2019 (transect g′—h′), and Mar/2018—Nov/2019 (transect i′—j′).
Remotesensing 13 02688 g003
Figure 4. Spatial temporal analysis of the dynamics of the beach barrier, based on satellite images between 2004 and 2019. The numbers indicate the retreat and advance (m) of distal and proximal limits of the shoreline, based on the planimetric transects A, B, C, and D. For each transect (except A) there is a pair of numbers, the smaller number (e.g., 700 in transect B for 03/2019) refers to the proximal position of the shoreline, whereas the greater number (e.g., 1015 in transect B for 03/2019) refer to the distal position. There is only one number in transect A because it only has a distal shoreline position, and the proximal position ends in mangrove wetlands. Margin of error is ±2.5 m.
Remotesensing 13 02688 g004
Figure 5. (a) Digital surface models of 1998 and 2019, and (b) dune crest heights along the studied beach barrier between 1998 and 2019, based on Lidar and drone data. Margin of error is ±15 cm.
Remotesensing 13 02688 g005
Figure 6. (a) Digital terrain model of the study area (Nov/2019), (b) comparative analysis between the digital terrain models of Oct/2017 and Nov/2019, (c) Orthoimages of Oct/2017 and Nov/2019 with comparative analysis of the sedimentary volume of the zones 1 (part the supratidal and sandy intertidal flat under the action of currents and waves), 2 (part of the supratidal), and 3 (part of the supratidal and the intertidal flat behind the coastal barrier) along the beach barrier between 2017 and 2019, (d) and a planialtimetric cross-shore profile based on drone data. Margins of error are ±0.15 m (vertical) and ±0.076 m3 (volume).
Remotesensing 13 02688 g006
Figure 7. (a) Spatial-temporal analysis based on Lidar data (2002 and 2018), (b) ground photo of the wetlands in contact with the beach barrier, (c) mangrove expansion and coastal retreat evidenced by satellite (2004) and drone (2017) image, (d) planialtimetric cross-shore profile o′–p′ showing the landward dune migration, an increase of dune crest height, and the replacement of Spartina by black mangrove in 2002, 2013 and 2018. Margin of error is ±0.15 m (vertical) and 1 m (horizontal).
Remotesensing 13 02688 g007
Figure 8. Spatial-temporal analysis of backbarrier wetlands in the Bay Champagne, based on satellite and drone images (a) before (2004—2012) and (b) after (2012—2019) the beach nourishment project.
Remotesensing 13 02688 g008
Table 1. Retreat and advance of the distal and proximal limits of the shoreline (m) before and after the nourishment project with a margin of error of ±2.5 m. Data based on Quickbird images, using reference the transects A, B, C, and D (see location in Figure 4). Also included in this table are: the relative sea-level rises, data based on the relative sea-level trend of 9.08 ± 0.42 mm/year (1947–2018) recorded in Grand Isle, 26 km northeast of the study area; and the average highest and lowest monthly fluvial discharges.
ProfileBefore NourishmentAfter Nourishment
2004-05
11 Months
2005-07
24 Months
2007-08
11 Months
2008-10
26 Months
2010-12
23 Months
2004-12
95 Months
2012-15
26 Months
2015-19
50 Months
2012-19
76 Months
A–Mangrove0−10−55−7−20−9270−1258
B–distal−20−50−35−50−25−18095−1085
C–distal−14−50−30−40−30−16430030
D–distal−22−40−30−30−63−18553053
Mean−14−37.7−37.5−31.7−34.5−15562−5.556.5
B–proximal−20−10−60−19040−240−11080−30
C–proximal−40110−80−300−4001010
D–proximal−40−20−30−9010−170−7020−50
Mean−33.326.6−56.6−103.316.6−150−6036.6−23
Oceanograp. data
RSL (mm)8.318.168.319.6717.471,8319.6737.8357.5
Fluvial discharge (ft3/s)303 –201247 –100196 – 103235–145211–125303–100320–61511–296511–61
Table 2. Size of mangrove, saltmarsh, and sandy intertidal flat areas before and after the beach nourishment project. Margin of error is ±0.0006 ha.
Before NourishmentAfter Nourishment
Veget./Geomorphological UnitGain (ha)Loss (ha)Gain (ha)Loss (ha)
Mangrove2.21.13.20.07
Marsh0.514.526.91.4
Sandy intertidal flat031.514.34.1
Publisher’s Note: MDPI stays neutral with regard to jurisdictional claims in published maps and institutional affiliations.

