Article

GIS-Based Urban Flood Resilience Assessment Using Urban Flood Resilience Model: A Case Study of Peshawar City, Khyber Pakhtunkhwa, Pakistan

1
Institute of Natural Disaster Research, School of Environment, Northeast Normal University, Changchun 130024, China
2
Key Laboratory for Vegetation Ecology, Ministry of Education, Changchun 130024, China
3
State Environmental Protection Key Laboratory of Wetland Ecology and Vegetation Restoration, Northeast Normal University, Changchun 130024, China
4
Department of Atmospheric and Oceanic Sciences, Institute of Atmospheric Sciences, Fudan University, Shanghai 200438, China
5
Centre for Disaster Preparedness and Management, University of Peshawar, Peshawar 25120, Pakistan
6
A Key Laboratory for Mountain Hazard and Earth Surface Process, Institute of Mountain Hazards and Environment, Chinese Academy of Sciences, Chengdu 610041, China
7
National Engineering Research Center for Geographic Information System, School of Geography, China University of Geosciences, Wuhan 430074, China
*
Author to whom correspondence should be addressed.
Remote Sens. 2021, 13(10), 1864; https://doi.org/10.3390/rs13101864
Submission received: 3 March 2021 / Revised: 15 April 2021 / Accepted: 5 May 2021 / Published: 11 May 2021
(This article belongs to the Special Issue Human–Environment Interactions Research Using Remote Sensing)

Abstract

:
Urban flooding has been an alarming issue in the past around the globe, particularly in South Asia. Pakistan is no exception from this situation where urban floods with associated damages are frequently occurring phenomena. In Pakistan, rapid urbanization is the key factor for urban flooding, which is not taken into account. This study aims to identify flood sensitivity and coping capacity while assessing urban flood resilience and move a step toward the initialization of resilience, specifically for Peshawar city and generally for other cities of Pakistan. To achieve this aim, an attempt has been made to propose an integrated approach named the “urban flood resilience model (UFResi-M),” which is based on geographical information system(GIS), remote sensing (RS), and the theory of analytical hierarchy process (AHP). The UFResi-M incorporates four main factors—urban flood hazard, exposure, susceptibility, and coping capacity into two parts, i.e., sensitivity and coping capacity. The first part consists of three factors—IH, IE, and IS—that represent sensitivity, while the second part represents coping capacity (ICc). All four indicators were weighted through AHP to obtain product value for each indicator. The result showed that in the Westzone of the study area, the northwestern and central parts have very high resilience, whereas the southern and southwestern parts have very low resilience. Similarly, in the East zone of the study area, the northwest and southwest parts have very high resilience, while the northern and western parts have very low resilience. The likelihood of the proposed model was also determined using the receiver operating characteristic (ROC) curve method; the area under the curve acquired for the model was 0.904. The outcomes of these integrated assessments can help in tracking community performance and can provide a tool to decision makers to integrate the resilience aspect into urban flood management, urban development, and urban planning.

Graphical Abstract

1. Introduction

Climate change is altering the hydrological cycle around the world, leading to extreme weather conditions [1]. In the past few decades, the intensity and frequency of disasters have increased with significant human and socioeconomic losses all over the world [2]. Floods are the most frequently occurring and widespread disaster worldwide [3]. The main causes that trigger urban floods (except for rainfall intensity) are the unplanned urban sprawl, along with stream banks, the human interference in the main streams altering the hydraulic stream characteristics, and the failures of technical works (bridges, culverts, etc.,), in combination with the possible deforestation [4,5,6]. In the 21st century, flood disasters have affected more people globally [4,5,7], than any other disaster [8]. In Pakistan, climate change impacts are occurring at a very high rate, leading to extreme weather events [9]. In the global climate change risk index, Pakistan is placed in the eighth position in the countries affected by climate change [10]. From 1950 to 2011, the country has witnessed 21 major floods, killing 8887 people with approximately USD 19 billion loss to the economy [11]. The year 2010 brought severe floods in the history of Pakistan, leading to widespread damages and devastation across the country [12]. The 2010 floods alone resulted in the deaths of 1985 people with an estimated economic loss of USD 9.7 billion to the country’s economy and affected around 20 million people in 78 districts of Pakistan [13].
In today’s globalization, urban populations are extremely vulnerable to climatic extremes [14]. Since these urban centers are confronting the climatic extremes regularly, there is a lot of debate among researchers and policymakers about the need to strengthen cities’ resilience [15]. The term “resilience” was initially coined in the field of ecology and originates from the Latin word “Resilientem,” which means to recoil or rebound [14,15]. Though there is no uniform definition of resilience yet [12,16,17], in terms of urban areas, it has been defined as their ability to face the adverse impacts of extreme events and having the capacity to adapt and respond to all kinds of disturbances [18,19]. Likewise, Rey et al [20], have defined resilience as a system’s ability to resist, absorb, adapt, and recover from the adverse effects of a hazard in a timely manner through the preservation and restoration of its essential structures and functions. It is the potential of a community or a system to withstand external pressures while maintaining enough strength to be kept all social, economic, and environmental resources unharmed [20,21,22,23,24,25]. Though resilient assessment is one of the important steps of disaster risk management, there is no single set of established indicators or framework for quantifying disaster resilience [25,26], however, there is consensus within the research community that resilience is a multidimensional concept, which includes social, economic, institutional, infrastructural, natural, ecological, and community elements [27]. Each dimension is further based on multiple sub indicators, making the concept of resilience more holistic and dynamic [26]. It is worth mentioning that the selection and application of variables and sub indicators for assessing resilience vary from hazard to hazard, region to region, and time to time [1,14,28]. Therefore, it is essential to choose relevant and updated variables for analyzing flood resilience, which covers diverse aspects of the flood-prone community.
In recent years, the concept of resilience has gained a lot of attention from the scientific community. For instance, in the last two decades, resilience has been extensively used in urban water management [26,27]. Resilience has great potential to manage and capture general perspectives, bringing together many components to analyze an issue in a broader aspect. According to Lio et al. [26], urban flood plains are systems based on human–nature interactions, which are extensively affected by climate change, population density, built environment, and the riverine process. They further proposed that in flood management, ecological resilience plays an important role. According to Birkland et al. [29], community resilience involves the prevention of damages, quick recovery, and consistency in the community’s daily lives. Similarly, Meerow et al. [27], mentioned that the nature of resilience is dynamic and an area where a system’s internal adaptability should apply. This shows that urban systems as being complex and adaptable, which are comprised of socio ecological and socio technical designs. The concept of engineering resilience is more dominant and more persistent in the available definition of community resilience [26]. It is vital to mention that resilience is a broader and more complex term that is hard to be expressed in quantitative terms.
There have been a lot of efforts in designing tools for flood management with a focus on flood resilience. Miguez et al. [30], have developed an integrated flood resilience (FResI) tool that aims at the inclusion of resilience components in the decision-making process for flood control purposes. The FResI tool gives us mean values of resilience in a basin scale by comparing flood behavior of the future values with its current values. Thus far, very few models can measure flood resilience in a real mean. In this regard, Mugumeet al. [31], present a quantitative method to show the spatial distribution of flood resilience, using 24 flood-related indicators. This index-based approach measures the social, economic, ecological, and infrastructural components of three communities in the African region. Moreover, Mugume et al. [32], have also provided a resilience index to quantify the residual functionality of the community or system that transfers the analysis from hazard to community’s/system’s performance when subjected to any external or internal failures. Likewise, Veról et al. [33], provided an integrated resilience index for supporting decision makers to combat floods with alternatives. With the help of this index, it is possible to measures a city’s response to flood risk controls. Moreover, this approach was able to measure the overall response of the city to floods rather than to the individual components. A study conducted by Bertilsson et al. [1], has provided a multi-criteria index called specialized flood resilience index (S-FRESI) to map out flood resilience and has studied flood resilience by three main aspects, i.e., the drainage system capability, urban community’s capability to quick recovery from flood losses, and the urban system’s capability to remove flood water. The S-FRESI deals with the existing capabilities of a community resilience while predicting it with future scenarios. The S-FRESI in its current state needs further modification to measure the impact of floods with existing coping capacity. Following up the research of the S-FRESI can make it a valuable tool in urban planning for assessing urban flood resilience. It can be used to measure and visualize the changes in flood resilience obtained by different flood control alternatives.
Peshawar is disproportionately larger than any other town or city in the Province of Khyber Pakhtunkhwa (KP), Pakistan. The availability of different facilities and activities in Peshawar city are strong pull factors, bringing additional residents to the city and causing rapid urbanization and become even larger and more disproportional to smaller cities in the province [34]. Peshawar city is highly vulnerable to urban and flash floods. The city has been severely affected by the floods-2010 and onwards. In 2010, floods in River Kabul and Budni Nullah inundated a large part of the district and affected16union councils, destroyed 33,867 houses with a death toll of 46 persons and 68 injuries. Similarly, in the 2012 floods, 3 persons lost their lives, 7were injured, and a total of 217 houses collapsed. In the 2014 flood, over 13 people were drowned and 54 were injured. Almost the same situation occurred in the 2015 flood when 224 houses became partially damaged, 19 were fully damaged, and 7 persons lost their lives [35].
Looking into the vulnerability and exposure of Peshawar city to floods, there is an urgent need for improving the coping capacity and resilience of the region to urban and flash floods. In this regard, the present study is designed to assess urban flood resilience in Peshawar city of Pakistan. The study has proposed a new holistic model called “urban flood resilience model (UFResi-M)”that integrates geographical information system (GIS), remote sensing (RS), and the theory of analytical hierarchy process (AHP) for robust assessment of urban flood resilience in the study area. Specifically, this study aims to identify flood sensitivity and coping capacity while assessing the urban flood resilience in Peshawar city. Keeping in mind the previous research studies on urban floods resilience in different parts of the world [1,10,13,23,31,36,37]. We designed this study to assess the urban flood resilience in Peshawar city, using multiple indicators and different aspects of the local urban community. This study has covered all major sources of urban flooding and targets the factors that contribute to the resilience of the study area toward urban flood. For effective dealing with the issue of floods in urban areas, urban resilience plays a key role in reducing losses from floods. In the context of Pakistan, very few attempts have been made [38,39], to study the resilience of urban centers, despite their socioeconomic contribution. It is important to mention that this study is the first of its kind being conducted in Peshawar city of KP Province, Pakistan. This study will provide information and guidelines for the key stakeholders to invest in making the city resilient and will attempt to enable government and nongovernment organizations to take appropriate action before, during, and after flood situations. This study is also an attempt to provide basic knowledge for researchers to conduct further study.

2. Materials and Methods

2.1. The Study Area

Peshawar is the provincial capital of the Province of Khyber Pakhtunkhwa, located in the central part of the province. District Peshawar has Charsadda in the north, District Nowshera in the east, District Kohat in the south, and Districts Mohmand and Khyber in the northwest and west, respectively. The district is surrounded by hills on its western flank. In the southern part, sandstone, shale, and limestone deposits are exposed, while piedmont deposits are found in Peshawar Valley. The Kabul and Bara Rivers are the main streams that recharging sources of the local groundwater aquifers. Besides these two rivers, several non-perennial streams also pass through the district [34]. District Peshawar has both rural and urban areas; however, the proportion of the urban zone and its population is greater than the rural zone. Interestingly, the district is continuously experiencing a rise in urbanization due to rapid population expansion and industrialization. Here, we focus on the urban site of Peshawar city, where flood events occur frequently. The urban site is mainly located in the northwestern parts of District Peshawar. The geographical location of the urban area of district Peshawar is from 71°22′22.56″ to 71°37′9.38″ east longitude and from 3°56′49.16″ to 34°41′2.0″ north latitude. The total area of District Peshawar is around 1285 square km, out of which 239 square km, covered by the study area, and 18.59 percent area of the whole District Peshawar. The study area comprises 47 union councils (1–47, Figure 1), which are further divided into two zones (eastern zone and western zone). There are some major and minor streams located in the study area. The Kabul River is the main river in District Peshawar. Three canals, namely, Warsak Lift Canal, the Warsak Gravity Canal, and the Joisheikh Canal pass through the study area. The surface water is directly related to groundwater. The groundwater in District Peshawar ranges from 02 to 47 m, while in the study area, groundwater ranges from 03 to 46 m [40]. The northern part of Peshawar city has a network of rivers/streams, and hence, the water table is shallow in the northern part, whereas moving toward the south of the district, the water table becomes deeper and reaches 47 m.

2.2. Data Acquisition

In this study, both primary and secondary data were used (Table 1). Primary data about floods’ damages and coping capacity were collected from 47 union councils of the study area through a field survey. The secretary of each union council (local government representative) was interviewed for ease of analysis. For this purpose, a detailed questionnaire was designed and pretested. The questionnaire consists of questions related to past flood damages and coping capacity (economic capacity, institutional capacity, education level) of the respondents and local people. All the respondents were male because of the strong cultural values and norms [38]. In the first stage, data about flood damages (including infrastructure damages, death toll, and injuries), causes and responsible factors for floods, and experiences with floods were collected. Since the study area is highly vulnerable to floods, most of the communities have experienced floods in the past with severe impacts. Then, investigations were carried out on building material, population awareness level, dependent population, education level, community dependency, and external support for the coping capacity factor. These factors affect the coping capacity of the communities toward urban floods. Furthermore, the coping capacity was measured by investigating the early warning mechanism, level of preparedness, income status, employment type, social bonds, and availability and control on emergency equipment and services in the study area. For the analysis of primary data (questionnaires), Statistical Package for Social Sciences (SPSS v. 23) and MS Excel were used. All raw data values were transformed into comparable scales utilizing percentages, per capita, density functions, etc. [39]. These forms of standardization were essential to avoid problems inherent when mixing measurement units since our variables were delineated in a number of statistical units, ranges, and scales to develop and calculate indices for flood hazard and coping capacity (flood damages, institutional capacity, economic capacity, and education level). Finally, ArcGIS version 10.7.1 was used to develop maps showing flood damages, institutional capacity, economic capacity, and education level in the study area.
Secondary data were collected from various sources. To investigate flood hazards, remote sensing data for elevation, land use, land cover, curve number (CN) grid, precipitation, and slope were obtained.
The open source library of the Alaska Satellite Facility (ASF) of the United States Geological Survey (USGS) was accessed to download a digital elevation model (DEM) of ALOS PALSAR, having 12.5 m spatial resolution, and Sentinel-2 satellite image, having spatial resolution from 10 m (https://www.usgs.gov/centers/eros/science/usgs-eros-archive-sentinel-2 (accessed on 2 March 2021)). The data were accessed and downloaded on 28 May 2020. Similarly, the Tropical Rainfall Measuring Mission (TRMM) products of global precipitation were used, which are available at monthly, daily, and sub-daily scales (https://giovanni.gsfc.nasa.gov (accessed on 2 March 2021)). The near-real-time daily precipitation data from the TRMM-3B31 product V7 were used with a grid size resolution of 30° × 30° for the period 2000–2015, [41]. Several studies have reported that the TRMM products have shown better performance in the study region, as compared to other satellite precipitation products [42,43]. The data for investigating flood exposure (annual income, population density, health facilities, and educational facilities) were collected from “Pakistan Bureau of Statistics, Census Report 2017”. To investigate flood susceptibility, the data about commercial buildings, residential buildings, etc. were collected from the Planning and Development Department, Government of KP. The collected data were analyzed in SPSS (version 23) and visualized further in the GIS environment to generate thematic maps.

3. Urban Flood Resilience Model

The UFResi-M developed in this study is based on sensitivity and coping capacity toward urban floods (Figure 2). This model consists of four main factors, including flood hazard, exposure, susceptibility, and coping capacity. The UFResi-M has five significant steps; in the first step, parameters are generated in raster layers, taking the main parameters and their order into consideration. In the second step, weightage is assigned through AHP to each criterion separately. The third step focuses on the reclassification of all parameters and generated final maps of each criterion (hazard, exposure, susceptibility, and coping capacity). In the fourth step, the urban flood resilience index, Equation (3) is run in a raster calculator, using the overlay analysis tool. In the fifth and final step, the resultant urban flood resilience map is generated based on the urban flood resilience index (UFRI) through overlay analysis while validating the model through the operating characteristic (ROC) curve method.
The integration of UFRI in UFResi-M makes it possible to build a resilience map. It is based on the index presented as S-FResI in [1] but was modified for this study. In this study, the UFRI combined four indices into two parts (sensitivity and coping capacity). The first part consists of three factors of hazard, exposure, and susceptibility (IH, IE, IS), representing sensitivity, while the second part represents coping capacity (ICc). All the indicators are calculated by subtracting the indicators from unity “1” in order to have high numbers, representing low resilience, while numbers near zero represent high resilience. This choice implies that high resilience occurs when negative consequences are minimized. The calculation of UFRI uses Equation (3). The complete composition of the index is shown in Figure 2.
The interpretations for part one and two of the UFRI are discussed in Equations (1) and (2), respectively, before showing the final formulation as follows:
Part one = [1 − (IH. IE. IS )]
In the context of resilience, part one of the model Equation (1) aims to represent the degree of sensitivity toward urban floods. It combines hazard, exposure, and susceptibility (IH, IE, IS) dimensions to evaluate the flood’s impact in the study area, similar to the risk definition. If considered isolated, it is a measure of sensitivity, but if we take sensitivity in contrast with coping capacity, it indicates the resilience of a community. In other words, this part of the equation introduces a measure for sensitivity and the UFRI has to be used comparatively.
Part two = [1 − ICc]
Part two of the model Equation (2) aims to show the economic and institutional ability to recover from flood-related losses. The higher the income is, the better will be the recovery component of resilience. With little adaptation, the community may also consider external aids in monetary terms and the community’s education level to cope with upcoming floods. When combining the two parts, the UFRI is represented by Equation (3).
UFRI = [1 − (IH. IE. IS )]. m1 + [1 − ICc]. m2
According to Bertilsson et al. [1], equal weight was given to each part of S-FRESI, and then exponential weights were given to each indicator of part one to find the consequences. Here, in this study, each part can be weighted according to its importance or relevance to the case under analysis. However, this study focused on evaluating the adequacy of the indicators and the formulation as a whole; therefore, part two of the proposed equation was assigned equal weights, i.e., m1 = m2 = 0.5. All the four indicators, IH, IE, IS, and ICc were weighted through AHP to obtain product value for each indicator. The product values of IH (λmax = 6.62), IE (λmax = 3.06), IS (λmax = 3.06), and ICc (λmax = 3.01) were then put into Equation (3) in raster calculator and reclassified into five classes to generate the final resilience map of the study area. All the steps are discussed in Section 4 below.

4. Generation of Basic Parameters

4.1. Flood Hazard

Floods are among the most furious natural hazards, affecting the development of an area. Globally, floods causing a large number of deaths and damages to property [2]. The degree of hazard varies with the severity of flooding and is affected by flood behavior (extent, depth, velocity, isolation, rate of rising of floodwaters, and duration), topography, and emergency management [44]. In this study, we measure flood hazards with six sub-factors, which are discussed below.

4.1.1. Elevation

The elevation is one of the key elements that is directly associated with floods in a region [42]. Plain areas may be flooded earlier since water flows quickly from elevated areas to low-lying areas [43]. For the assessment of elevation and topographical characteristics of the study area, the ALOS PALSAR DEM was used. The study area DEM was extracted with the help of the Extraction by Mask tool in ArcGIS 10.7.1. The elevation profile of the study area shows that elevation ranges from 251 to 431 m. It is vital to mention that elevation rises from east to west, as shown in Figure 3a. This indicates that the eastern parts of the study area inundate more quickly than western parts.

4.1.2. Land Use and Land Cover (LULC)

The geographical information system and remote sensing technology provide cost-effective alternatives to understand the dynamics of the landscape with high accuracy. Digital image base detection of land use and landcover (LULC) based on multitemporal and multispectral remotely sensed data has depicted a great potential to understand the landscape dynamics for detection, map identification, and monitoring differences in LULC pattern over time. The LULC changes detection is an important step of landscape dynamics assessment for a specific period of time [45]. The LULC is also a vital factor in the assessment of flood hazards. It has been observed that areas with pavement and hard surfaces have a low infiltration rate and higher surface runoff. In contrast, areas with vegetation cover and less pavement or non-cemented areas relatively allow water to percolate [46].
To understand the natural color composite better, a layer was developed in this study in which sentinel-2 images were used. These imageries were combined in the ArcGIS software, and then a natural color composite band was obtained with the help of composing bands 4, 3, 2, [34]. In addition, simple points were drawn through the point sampling data method, in which almost 60 points were drawn as a sample for each class, as shown in Figure 3b. In this study, each LULC value is extracted in square kilometers for each union council [47]. In the study area, the LULC was classified into four major classes, which include barren land (105.9 sq. km), built-up area (63.4 sq. km), vegetation (54.9 sq. km), and water bodies (16.4 sq. km), as shown in Figure 3d.

4.1.3. Curve Number Grid

The CN grid is a spatial grid used to identify the surface runoff potential of a region. In this study, the CN grid was generated using the HEC Geo HMS tool in the ArcGIS environment. The CN grid can be developed by overlying soil, land use, and elevation grid of a particular area. The higher CN grid values reflect that such places have a high potential to convert rainwater into surface runoff. In comparison, the lower values of the CN grid show that the infiltration rate to absorb rainwater is relatively high, and less rainwater is converted into surface runoff [48]. The hydrological soil group layer was developed in the GIS environment to understand better the runoff potential of the study area. We find three Hydrological Soil Groups (B, C, D), as shown in Figure 3c, where group "B" has relatively moderate-low runoff potential, with 50–90% of sand and 10 to 20% of clay characteristics; group “C” consists of moderately high runoff potential, with <50% of sand and 20–40% clay. Similarly, group “D” includes high runoff potentials, with <50% of sand and >40% clay characteristics [49]. In this study, the CN grid values range from 30 to 100, indicating that the northwestern parts of the study area have very high surface runoff potential. Similarly, the central parts of the study area also have significant potential for surface runoff (Figure 4a).

4.1.4. Slope

In flood-related studies, slope plays a significant role because it manages surface water flow and has power over the surface runoff. The strength of water flow gives rise to attrition of soil and vertical filtration [50]. The region comprising of flat areas and with moderate slope is further exposed to flood, as compared to the area having high altitude and sharp slope [46]. Similar to elevation, the slope has a significant relation to the surface runoff of floodwater since it is directly proportional to the intensity of flood. The higher the slope is, the greater the surface runoff, leading to less water percolation. In contrast, the lower slope values represent areas that have less influence on surface runoff and more water percolation [51]. In this study, the slope map was developed and classified into five classes, using the Hydrological tool in ArcGIS 10.7.1. The study area’s slope was set in degrees; lower values represent a flat area/gentle slope, while higher values represent a steep slope (Figure 4b). In the whole study area, the slope ranges from 0 to 28.4 degrees.

4.1.5. Rainfall Grid

As a result of excessive rainfall, flooding phenomena usually occur [52]. It is reported that more than half of the world’s population is living in urban areas where urban flooding is becoming an increasing public concern [53]. In the last 50years, the trend and patterns of urban floods have been changed and became more intense, frequent, and uncertain [54], due to climate change and other human-induced factors affecting the global environment. The distribution of rainfall in the study area generally occurs during two different seasons, i.e., winter and summer seasons. The winter rainfall occurs from December to March as a result of western disturbance, while the summer rainfall occurs from June to September due to the monsoon weather system [55]. Normally, monsoons arrive in the first or second week of June, but major floods occur in late summer, i.e., July to September [56]. During recent years, it has commonly been observed that the distribution of rainfall is very disturbed due to climatic changes. The study area receives heavy rainfall in the form of erratic and cloud bursts during the monsoon season [52].
In this study, a pixel-wise (30° × 30°) adjustment ratio is calculated with a vertical layer for the swath overlap region for one month. The precipitation data were analyzed in the MATLAB environment. The coordinates were assigned to each union council of the study area. After analyzing the data, maximum precipitation in the whole study area was extracted and the grid was formulated in the GIS environment (Figure 4c). In the study area, the northeastern parts and northwestern parts resemble that these areas relatively receive heavy precipitation, ranging from 856 to 904 mm. The rainfall grid reflects the maximum annual precipitation ever recorded in the whole study area from the year 2000 to 2015, ranging from 660 to 904 mm (Figure 5).

4.1.6. Flood Damages

Urban flood is a well-known and regular phenomenon in Peshawar. The poor drainage systems of the study area almost completely clogged all the drainages during the rainy season, causing severe floods [35]. The District Peshawar was also one of the worst affected areas during the 2010 floods when the Kabul River and Budhni Nullah devastated most parts of the district [57,58]. To generate this parameter, the primary data were collected from the field through a structured questionnaire to determine flood damages in the area. The collected raw data were computed in SPSS and transformed into percentages while dividing the study area into two zones (West zone and East zone). Furthermore, the particular dataset was processed in a GIS environment to develop a thematic map of flood damages in the study area. Each zone was categorized into four parts (very low, low, moderate, and high) based on results in each zone (Figure 4d), where we obtained 26.30% very low, 21.10% low, 36.80% moderate, and 15.80% high in the West zone, while 21.40% very low, 32.10% low, 17.90% moderate, and 28.60% high in the East zone of flood damages.

4.2. Exposure

Exposure can be defined as the proximity or closeness of the people, property, systems, or other elements to the hazard zones that are thereby subject to potential losses in case of any disasters [51]. In other words, exposure is the extent to which the community is troubled with catastrophic environmental stress [59]. To measure the exposure, the following four parameters were used in this study.

4.2.1. Annual Income

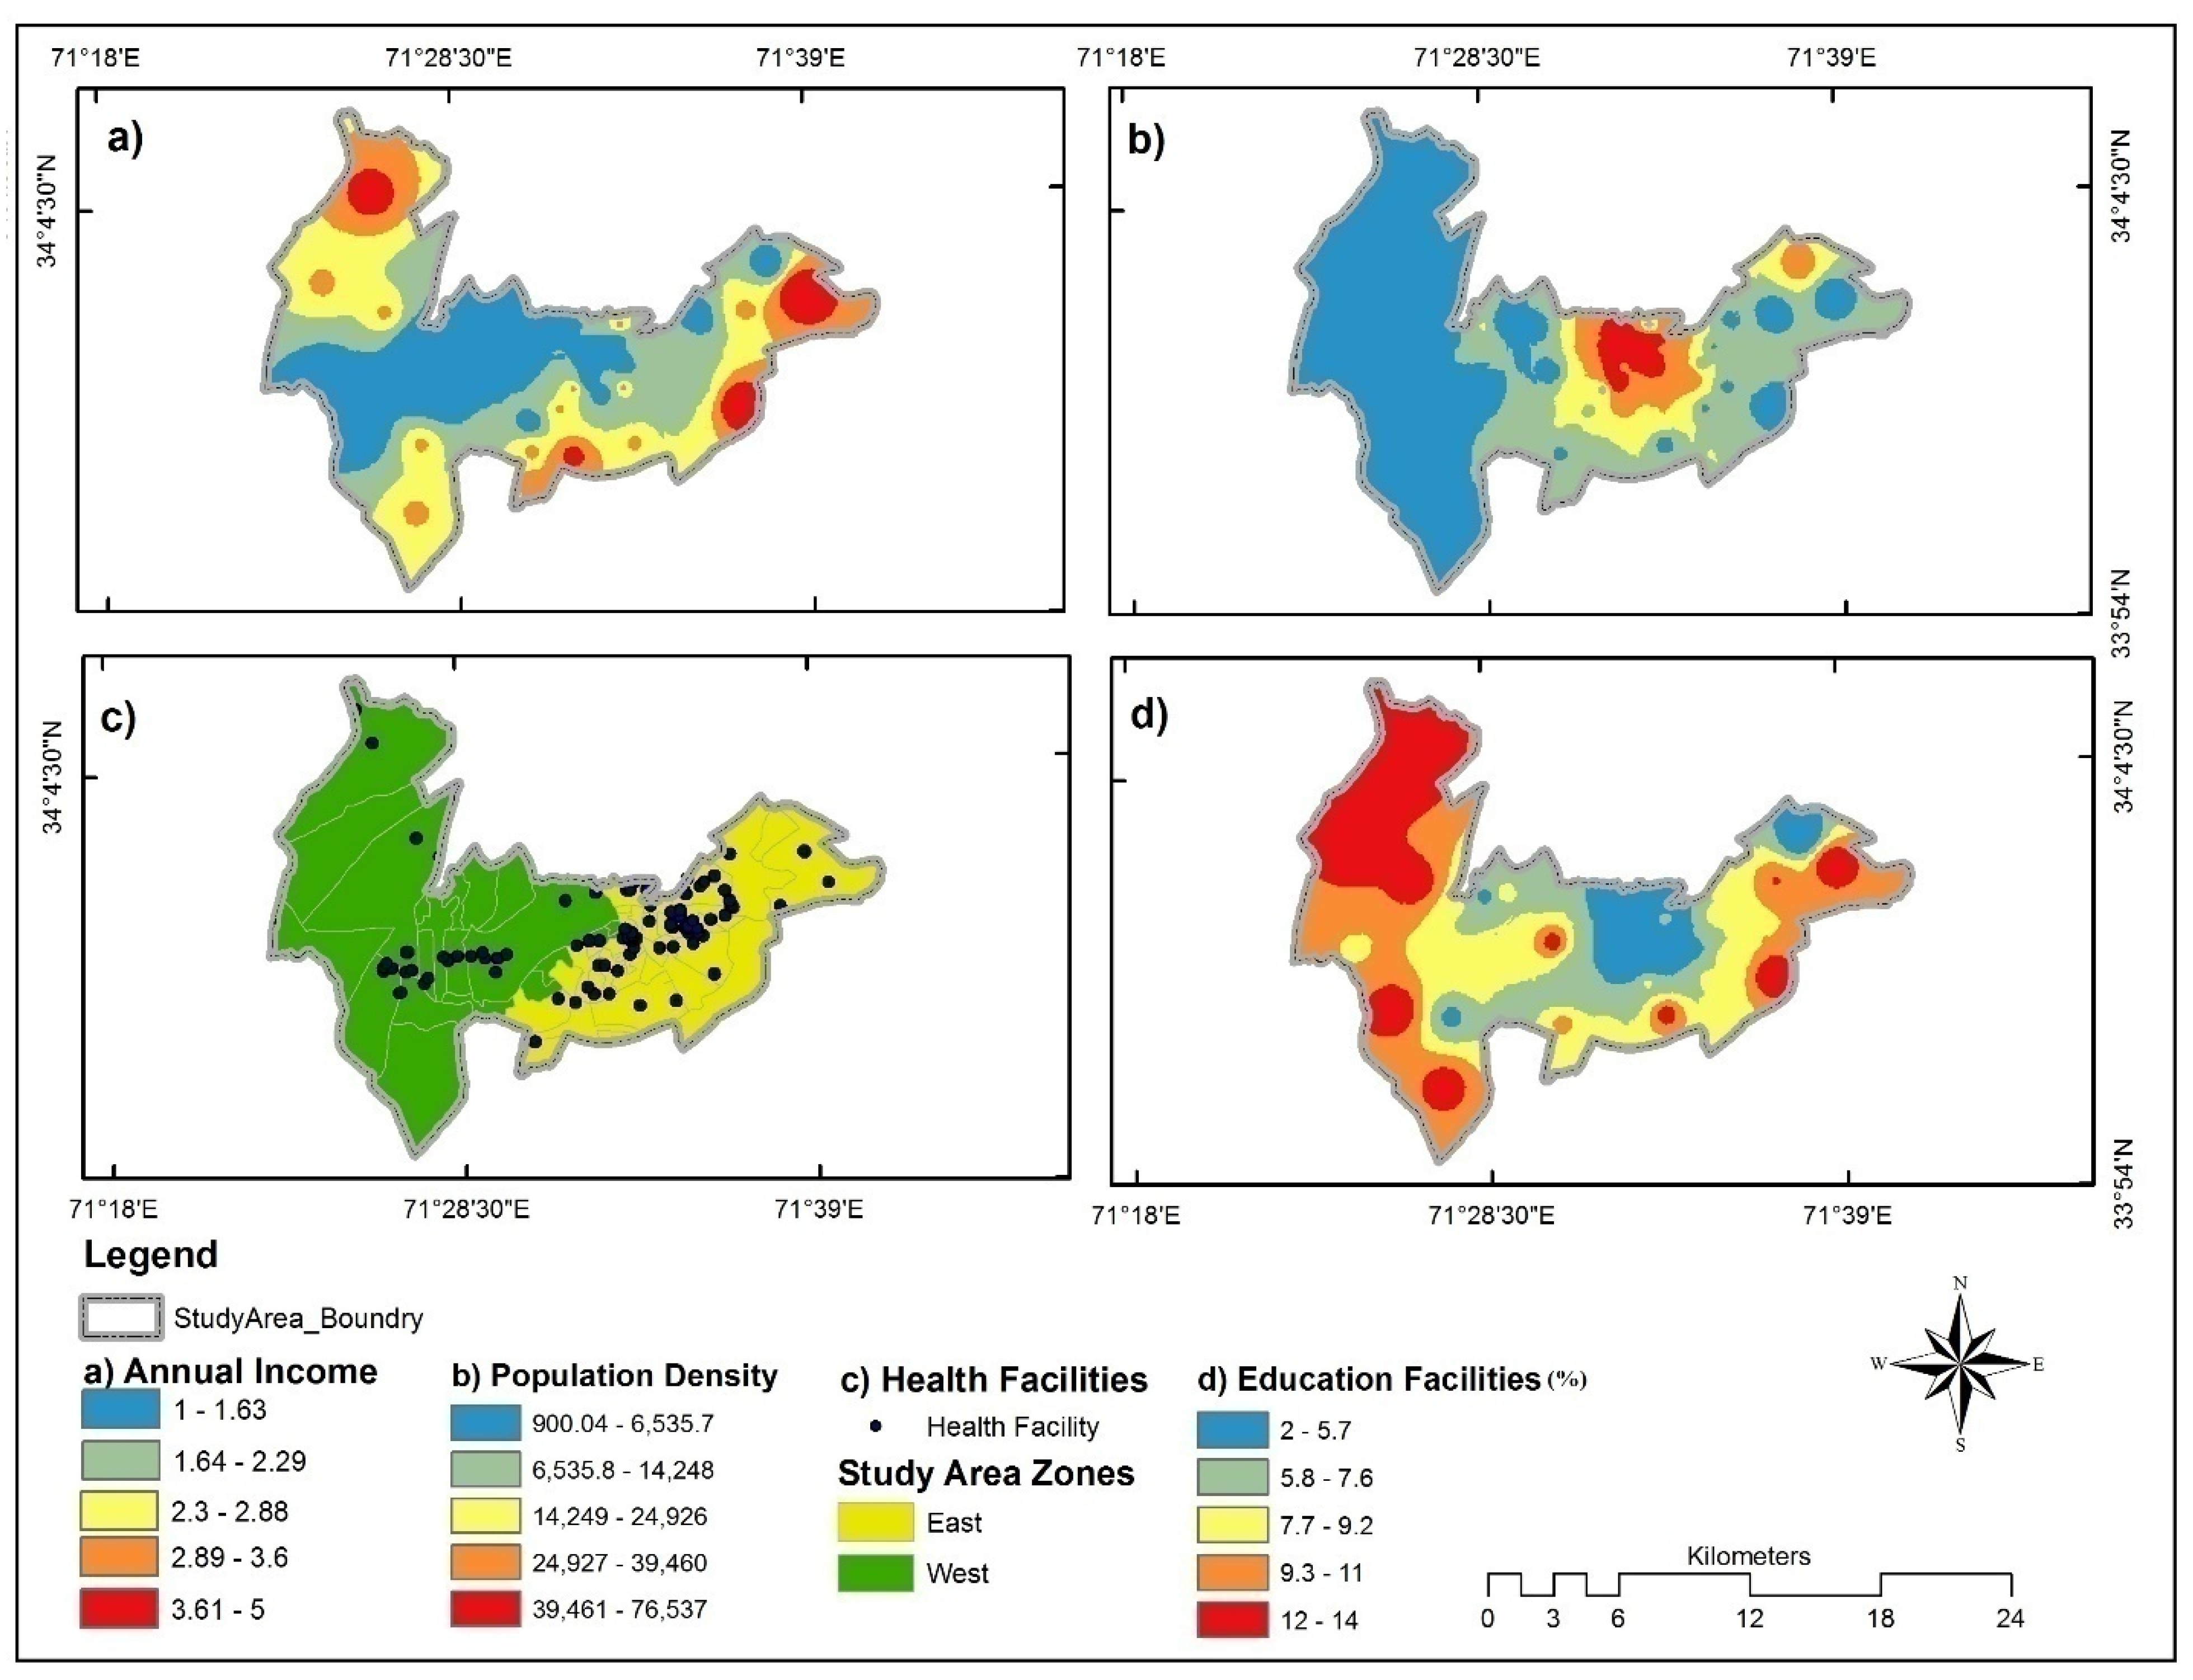
Annual income data for each union council were collected from the Pakistan Bureau of Statistics. While taking the average in percentage, the raw data were further computed in SPSS and recoded in ranks from 1 to 5. Rank 1shows the high annual income, and rank 5 shows low annual income. The thematic layer of the annual income was generated in the GIS environment based on recoded SPSS data. The blue color shows high annual income, while the red color indicates the people’s low annual income in the study area (Figure 6a).

4.2.2. Population Density

The population density of the study area is relatively high. The higher population reflects that cities have most areas with pavement surfaces, which reduces the infiltration rate of rainwater [28]. Thus, most of the rainwater drains through drainage lines but in a specific season such as the monsoon season, rainwater overwhelms the capacity of drainage lines, which sometimes causes urban flooding [60]. The thematic map for population density has been developed by classifying union council-wise data into five classes through the graduated symbol method with a natural break (Jenk) (Figure 6b). In this study, the population density ranges from 900.04 to 76537 people per square kilometer.

4.2.3. Health Facilities

Health facilities are critical factors that help in the investigation of a community’s exposure to disaster effects. Health facilities can reduce mortal losses due to adequate and timely treatment [42]. On the contrary, fewer health facilities in a community increase the exposure of a community to disasters. In this study, the health facilities point data were acquired from the Pakistan Bureau of Statistics to identify the health facilities in each union council of the study area. The data were visualized on the ArcGIS platform. As shown in Figure 6c, 69% of health facilities exist in the East zone, while 31% of health facilities exist in the West zone of the study area.

4.2.4. Educational Facilities

The existence of the educational facilities in a community can be used as a shelter or evacuation centers in case of disaster situations [42]. It is worth mentioning that similar practice has been carried out by the Provincial Disaster Management Authority (PDMA), KP, in recent disasters. Thus, more (fewer) educational facilities reflect maximum (minimum) shelter services in a community, determining the degree of community exposure. In this study, the data for educational facilities were obtained from the Pakistan Bureau of Statistics. The collected data were analyzed in Microsoft Excel and further processed in ArcGIS to visualize the distribution of schools’ facilities in the study area. The blue (red) color shows the minimum (maximum) number of schools in the study area (Figure 6d).

4.3. Flood Susceptibility

Commercial buildings, residential buildings, and other buildings (government infrastructure) are the elements that can be susceptible, revealing the urban flood susceptibility of the study area. This study identified commercial buildings, residential buildings, and other government infrastructure (bridges, roads, government office buildings, public libraries, and parks) to find flood susceptibility [28]. The data were collected from the Planning and Development Department of KP and analyzed in SPSS. The results show that the West zone of the study area has 36.6%, 44%, and 19.4% on an average of residential buildings, commercial buildings, and other buildings (government infrastructure), respectively. Similarly, in the East zone, 49%, 37.5%, and 17.3% in average of residential buildings, commercial buildings, and other buildings (government infrastructure), respectively. The analyzed data were further processed in the GIS environment to generate overall thematic maps, accordingly. The blue, light green, yellow, orange, and red colors show 19%, 30%, 45%, 60%, and 94% availability of commercial buildings, respectively, in each union council of the study area (Figure 7a). Similarly, the blue, light green, yellow, orange, and red colors indicate 25%, 36%, 48%, 60%, and 80% existenceofresidential buildings, respectively, in each union council (Figure 7b). Other buildings cover the infrastructure-related government property. The data further show that blue = 17%, light green = 27%, yellow = 39%, orange 57%, and red = 80% of government buildings in each union council of the study area (Figure 7c).

4.4. Coping Capacity

The coping capacity or adaptive mechanism/capacity is a vital element of vulnerability assessment [61]. The coping capacities refer to the measures/actions taken by the local people using resources before, during, or after floods to minimize adverse effects [57,58]. According to Kienberger et al. [62], adaptive capacity is a function of social capacity and resilience. Similarly, coping capacity refers to the ability of a society to respond to threats using available skills and resources [62]. The notion of coping could be seen as the immediate positive and effective response to floods. To measure the coping capacity, we used the following three parameters.

4.4.1. Economic Capacity

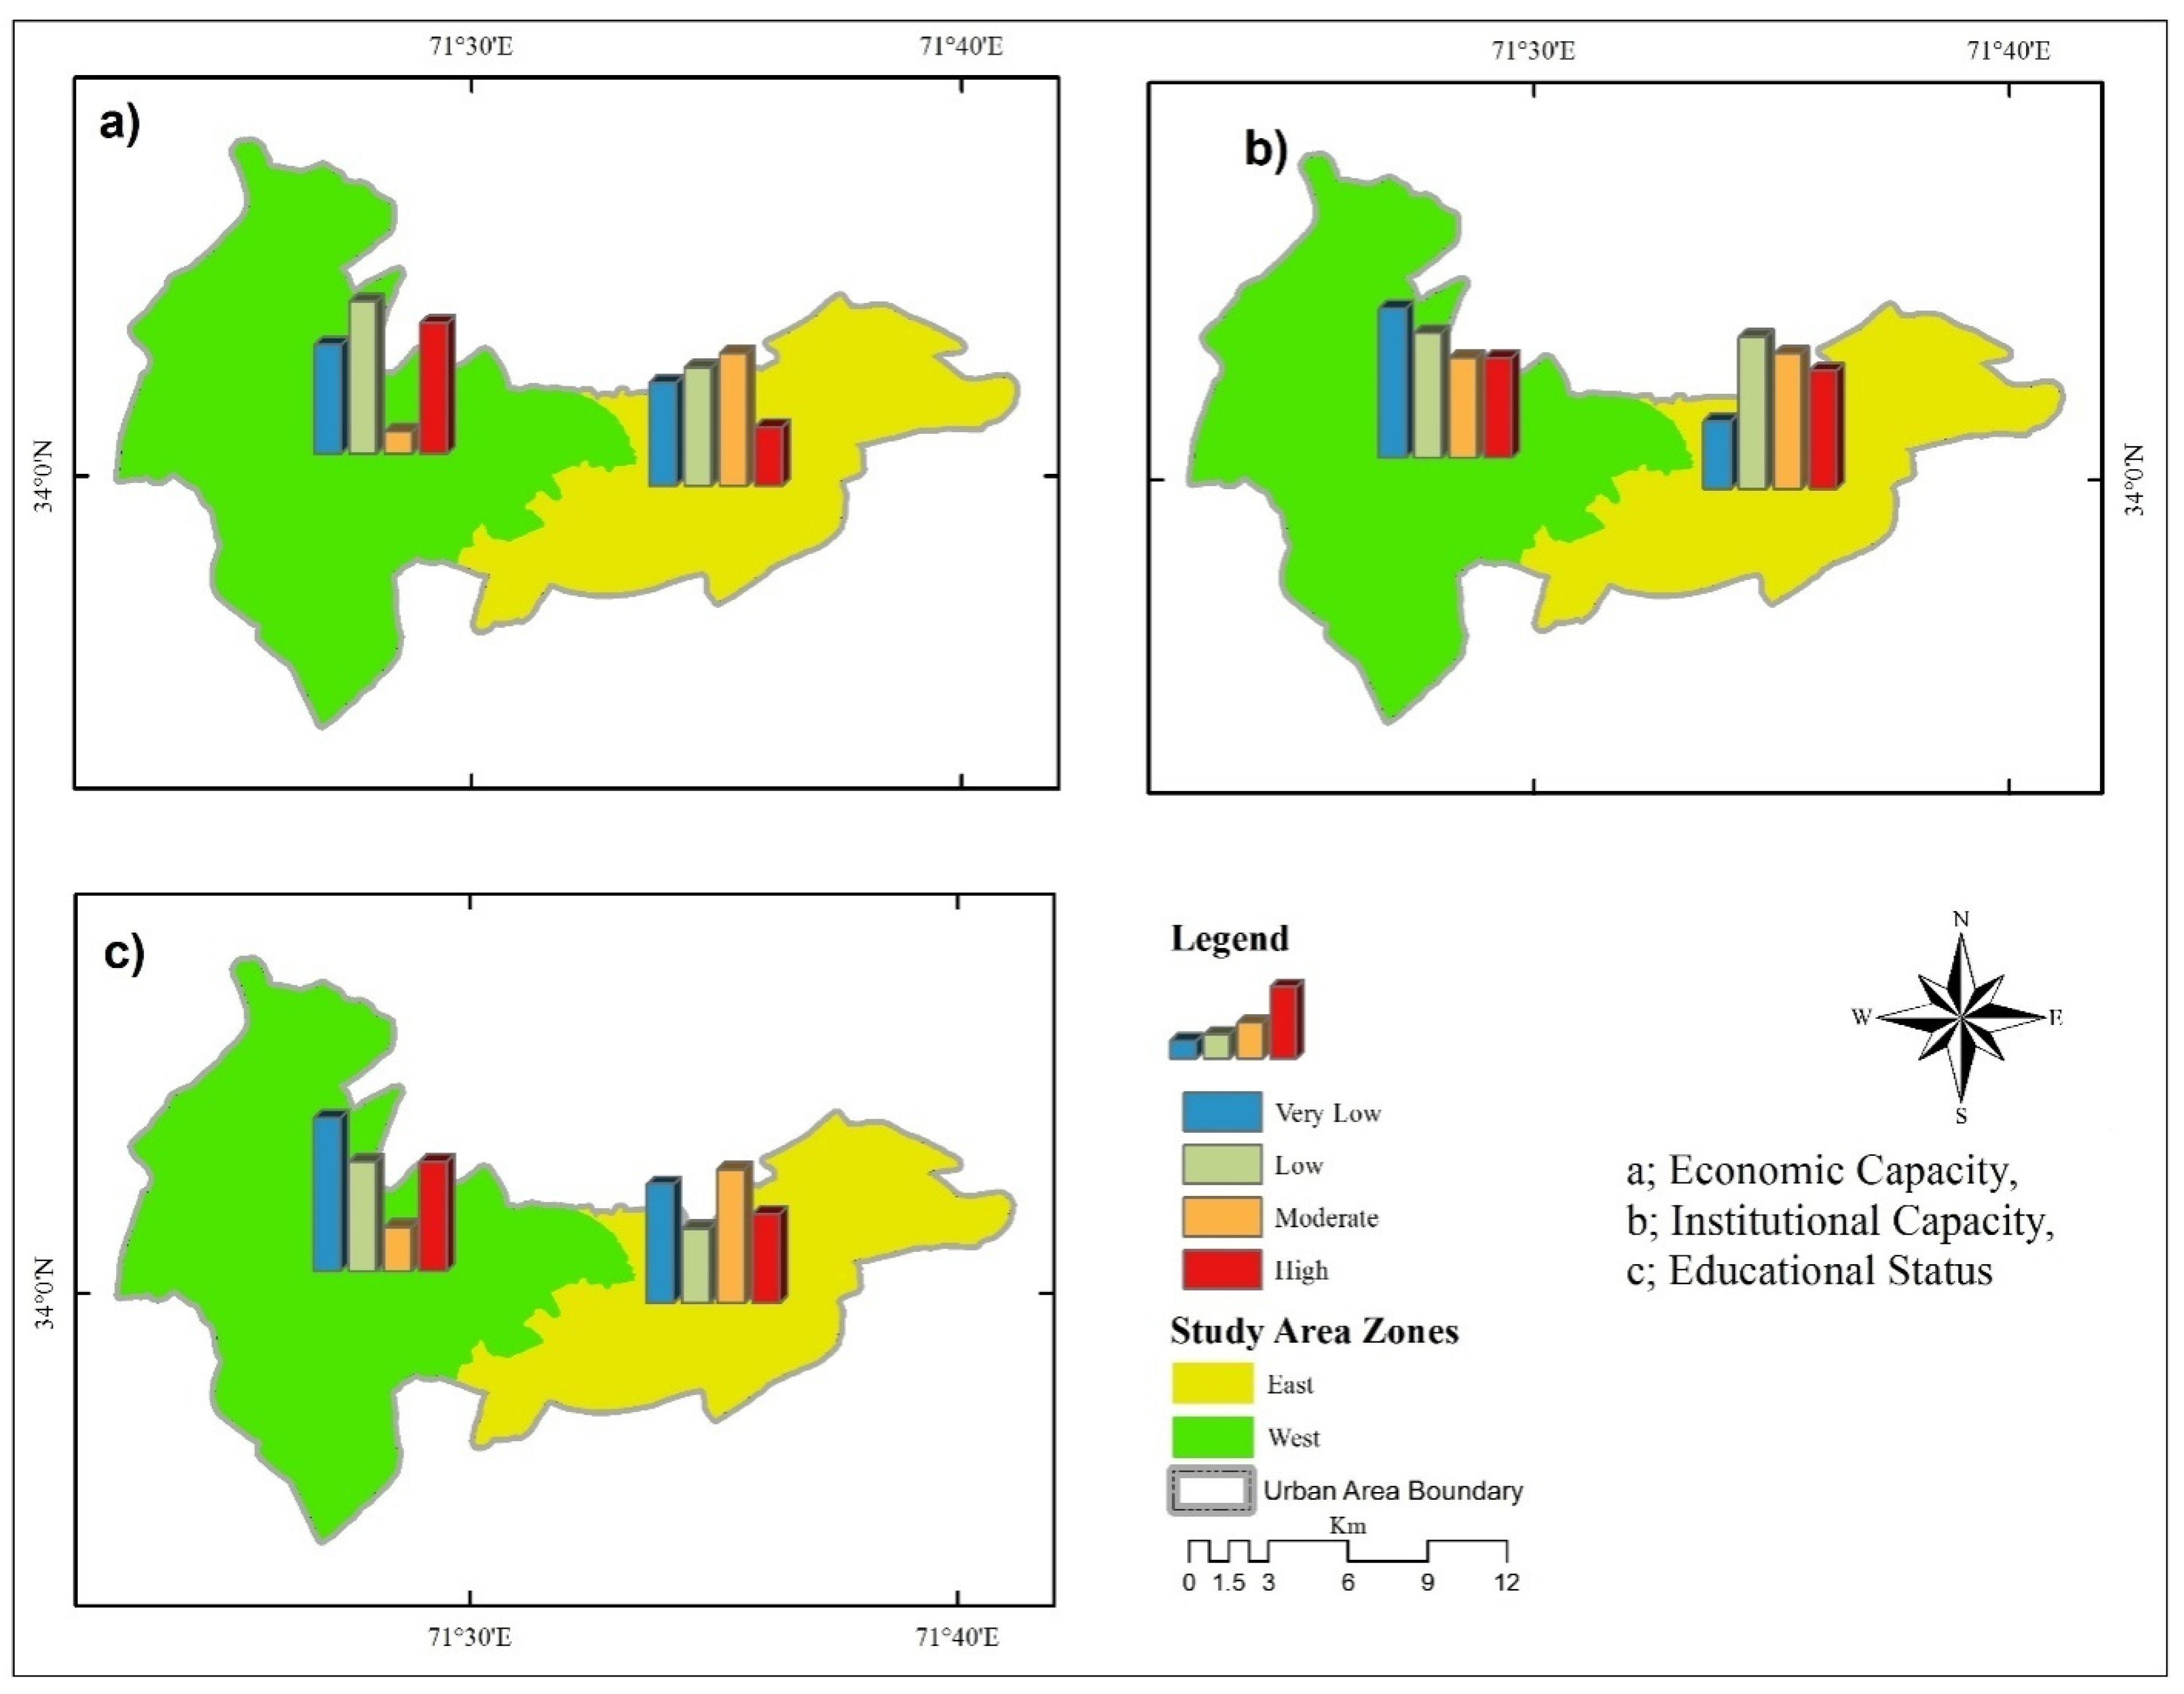
The economic capacity component deals with economic and financial indicators of capacity such as house size and ownership, type of employment, and different livelihood sources [28]. The high economic capacity is one factor that can enhance the coping capacity of a community against disaster effects. In this study, the data for economic capacity were collected through a structured questionnaire from the field. The collected data were further analyzed in SPSS. For generating thematic maps, the data were visualized in the GIS environment. The maps were classified into four classes (very low, low, moderate, and high), representing the community’s economic capacity. The results show that the West zone of the study has 26.30% (very low), 36.80% (low), 5.30% (moderate), and 31.60% (high) economic capacity. Similarly, in the East zone, the results show that very low economic capacity is 25%, low is 28.60%, moderate is 32.10%, and high is 14.30% (Figure 8a).

4.4.2. Institutional Capacity

The institutional capacity is associated with authorities and line agencies dealing with flood disasters [28]. How and to what extent are these authorities achieving their goals? The type of measures has been taken for better-quality services through awareness, recovery, and capacity-building training programs. For this study, hazard reduction programs, flood-warning information, hazard mitigation training, flood awareness and management, recovery assistance from the government or nongovernment organizations, first aid training, livelihood restoration, water sanitation, and hygiene maintenance activities were taken into account. The data for institutional capacity were collected through a structured questionnaire from the field. The collected data were further analyzed in SPSS. To generate thematic maps, the data were visualized in the GIS environment, where maps were classified into four classes (very low, low, moderate, and high), representing the institutional capacity of each zone. The results show that the West zone of the study area has 31.60%, 26.30%, 21.10%, and 21.10% of very low, low, moderate, and high institutional capacity, respectively. Similarly, in the East zone, 14.30%, 32.10%, 28.60%, and 25%of very low, low, moderate, and high institutional capacity, respectively (Figure 8b).

4.4.3. Education Status

The educational level indirectly enhances the coping capacity of a community toward disaster effects. Literature has revealed that literacy can develop knowledge, awareness, and flexibility against flood tragedy and help the folks to make the proper decision and engage in helpful mitigation processes, recovering from disaster outcomes [42,62]. Research studies demonstrate that educated individuals exhibit maximum coping ability with disaster effects, compared to uneducated people [63,64]. To find the educational level of the communities in the study area, the data were collected through a structured questionnaire from the field. The collected data were analyzed in SPSS. To generate thematic maps, the data were visualized in the GIS environment. The spatial stratum was shaped in the ArcGIS, where the maps were classified into four classes (very low, low, moderate, and high), representing the educational level of each community. In the West zone of the study area, the results show that very low, low, moderate, and high education status exist at the rate of 36.80%, 26.30%, 10.50%, and 20.60%, respectively. Similarly, in the East zone, 28.60%, 17.90%, 32.10%, and 21.40% of very low, low, moderate, and high education statuses exist, respectively (Figure 8c).

5. Analysis of Analytical Hierarchy Process (AHP)

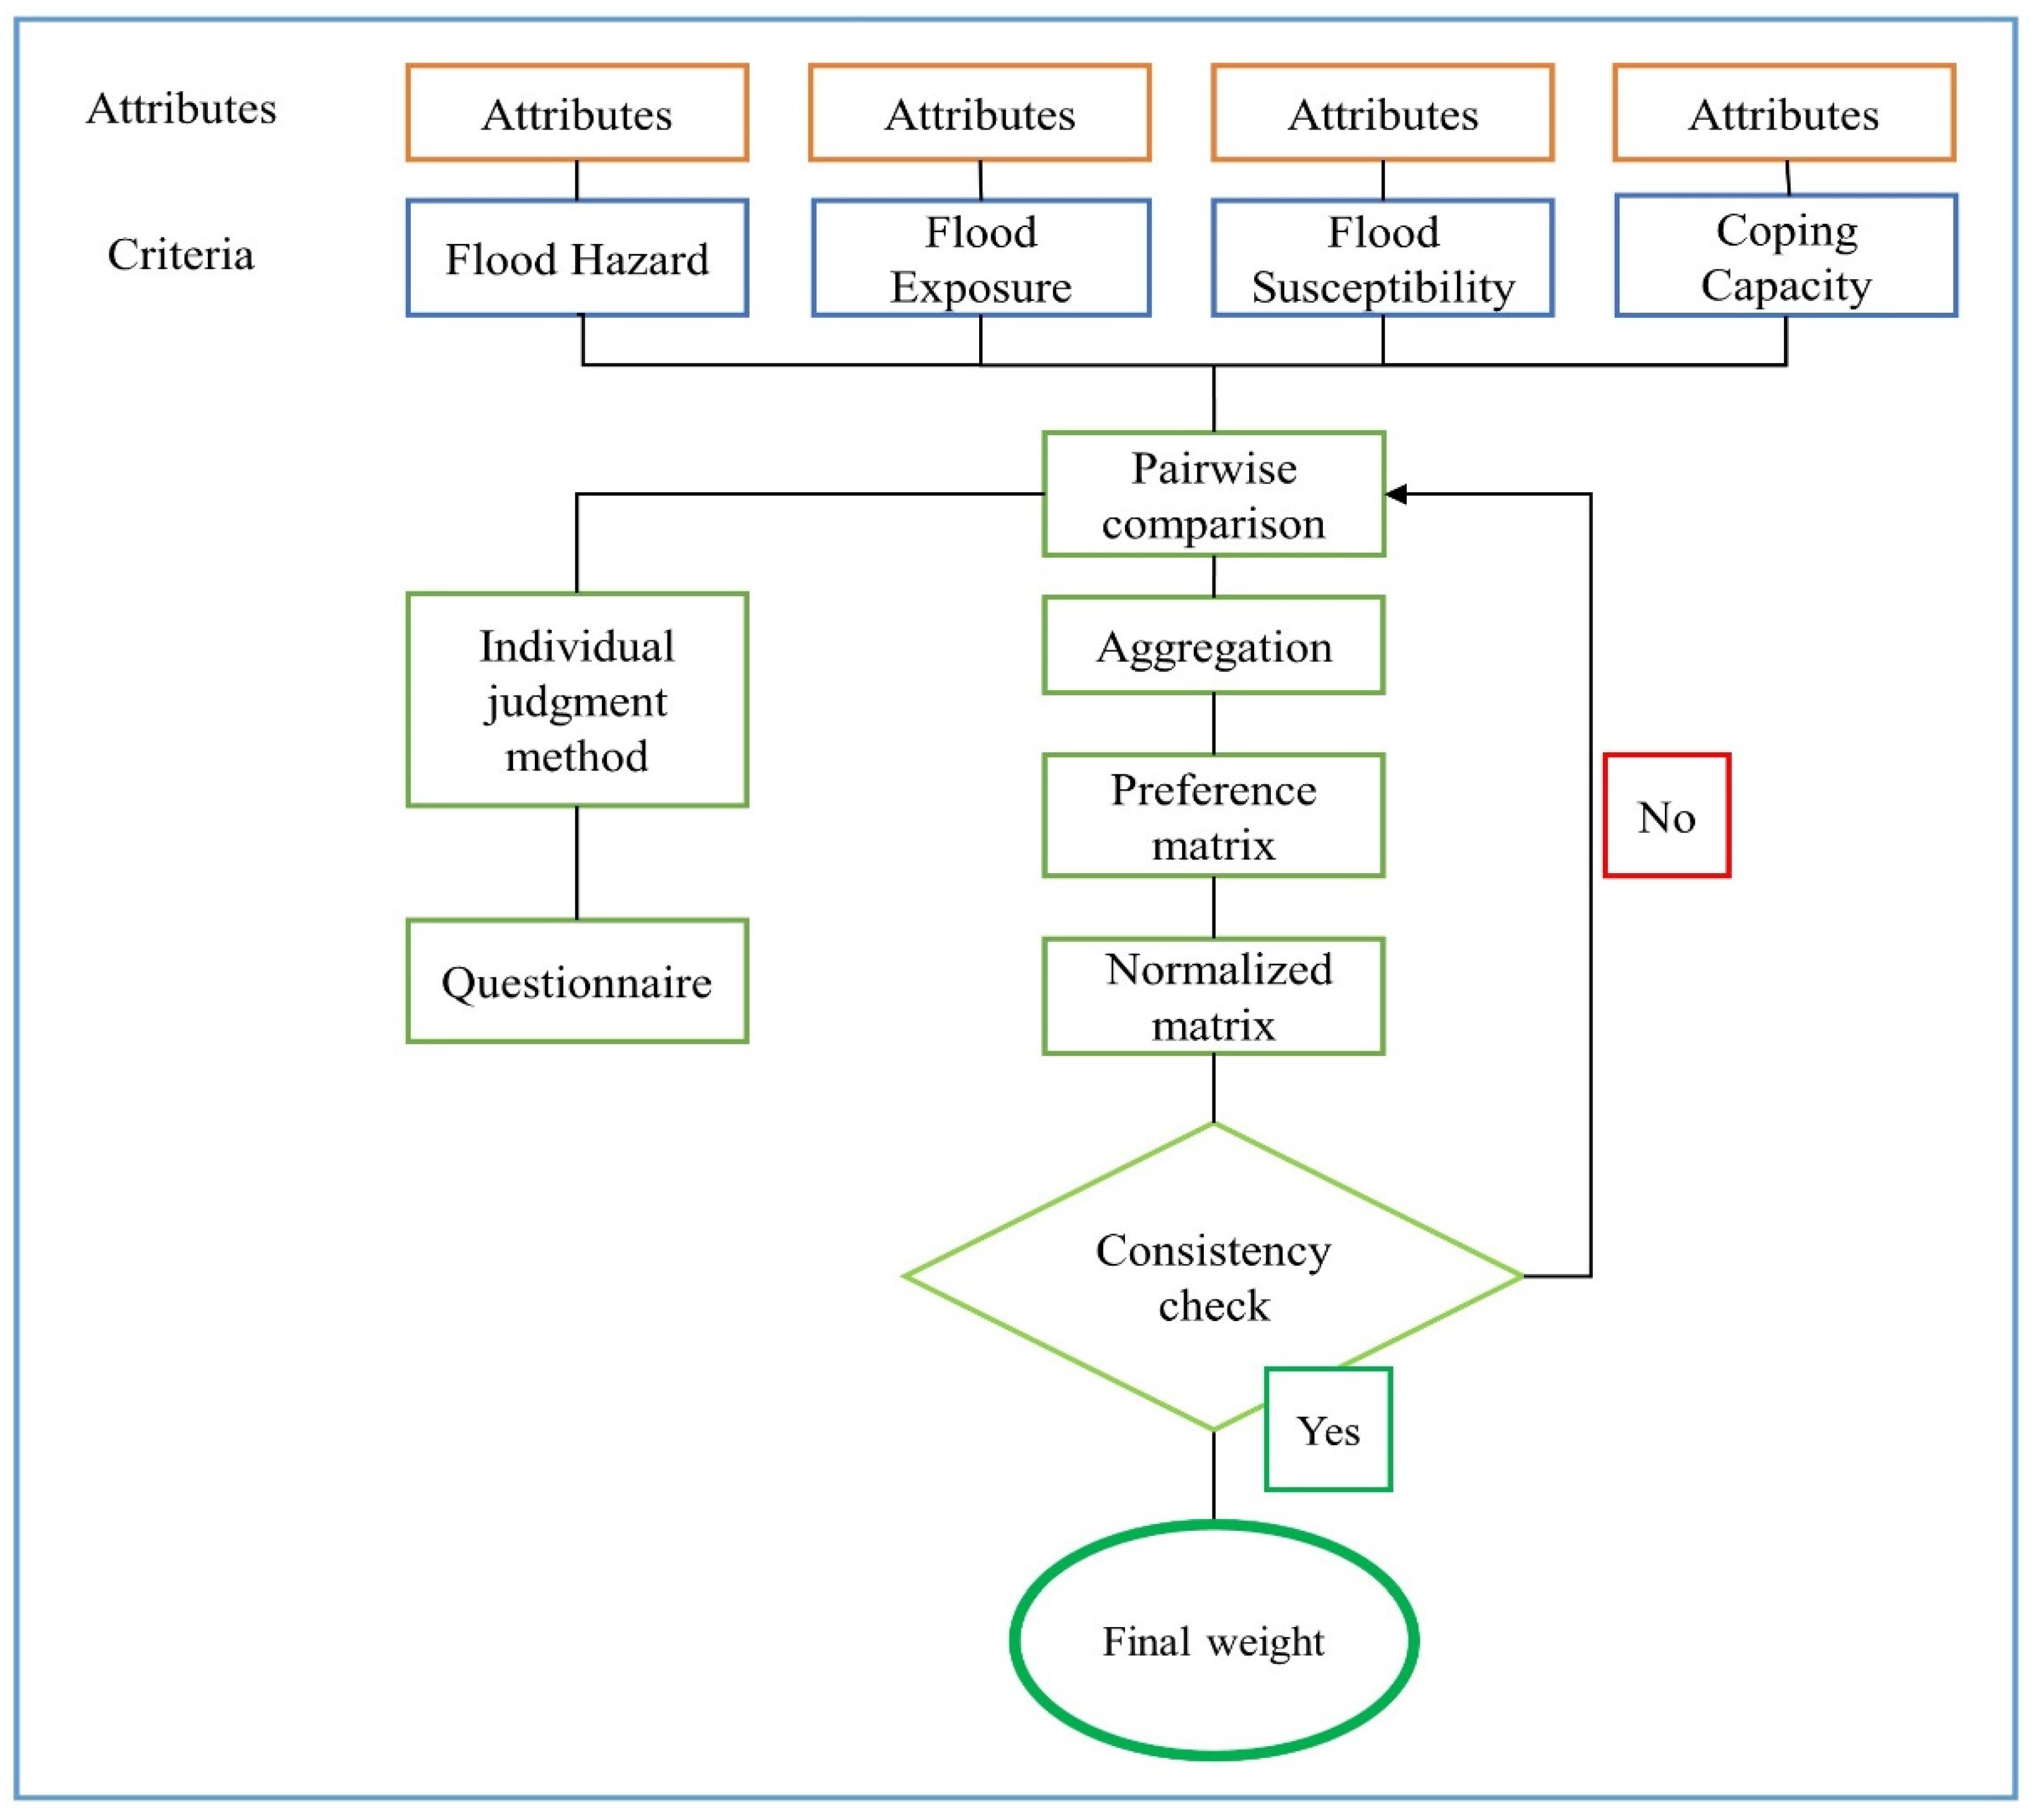
The analytical hierarchy process has been widely used as a weighting method for GIS-based criteria decision making for urban flood resilience assessment [1,14]. Therefore, we also used this method to assign weights to each criterion regarding urban flood resilience (Figure 9). According to the fundamental scale (Table 2), the pair-wise comparison is applied to determine each criterion’s weight [65]. The whole process is divided into five steps, namely, (i) a pair-wise comparison of criteria with expert opinions, (ii) aggregation of expert opinions, (iii) forming of the preference matrix (Table 3), (iv) finding a normalized matrix (Table 4) preference matrix, and (v) calculation of consistency ratio for each criterion.
All the steps are discussed below.
The pair-wise comparison of each criterion with the other is the most crucial step of this study. Therefore, the judgment of the appropriate values for each criterion is critical. In this regard, we considered some knowledge from the literature [14,66,67]. We interviewed relevant field (GIS specialists, disaster managers, and urban planners) experts individually to discuss the importance of each criterion over the other. For this purpose, eight experts were interviewed using the particular judgment method, two experts per field [68,69]. The numeric values used for judgments were taken from Table 2. A questionnaire was used to simplify the process, the same as the preference tables (Table 3). The geometric means are shown in Table 3, accordingly, and the final values are assigned to each criterion [70]. In this study, the weights were given to each criterion separately. The elevation factor obtained the highest importance to measure flood hazard, while the LULC and CN-Grid received moderate values. In addition, precipitation, slope, and flood damages acquired the lowest value. Similarly, to measure flood exposure, the annual income obtained the highest importance, whereas the population density and health facilities received moderate values. The educational facilities brought the lowest value. Flood susceptibility is measured with three sub-factors: residential buildings, commercial buildings, and other buildings (government infrastructure). The residential buildings obtained high importance, and commercial buildings received moderate importance, while government buildings have less contribution in flood susceptibility; therefore, the other buildings obtained the lowest value. The fourth factor of this study is coping capacity in which the institutional capacity obtained the highest value and economic capacity received the moderate value because these sub-factors have enough contribution in enhancing the coping capacity. On the contrary, the educational level has an indirect impact on coping capacity; therefore, it obtained the lowest value. Finally, the preference matrix (Table 3) is generated according to Table 2, with the literature and expert opinions. The scale values are used from equal importance to extreme importance (Table 2), having numerical values of 1 to 9.

Consistency Ratio

The validity of the calculated weights is given by evaluation, using a numerical index called the consistency ratio "CR" (Equation (4)). The CR is defined as the ratio between the consistency index (CI) and the random index (RI). The CI is given by Equation (2), where RI is the standard value (Table 5), according to the number of criteria used in various research activities [71,72,73].
CI is given.
CI = λmax – n/n − 1
Table 6 shows the product between the column-wise sum in the pair-wise comparison matrix and the average weights from the normalized matrix, and “n” is the number of criteria used in the AHP for each criterion. The resulting CR values for flood hazard, exposure, susceptibility, and coping capacity are 0.09, 0.07, 0.01, and 0.05, respectively, which are acceptable. The CR exceeding 0.1 is not reliable, and the entire exercise starts again unless the resulting value is less than 0.1. The CR proves that our measured matrix of preferences and the estimated weights are trustworthy.

6. Results

The UFResi-M introduced in this study is based on sensitivity and capacity toward urban floods as shown in Figure 2, which are the two main parts of this resilience model. Each part acts as a sub index. Part one of the study measures the sensitivity, while part two gives us the community’s coping ability toward urban floods. To measure the sensitivity, we have three main factors (hazard, exposure, and susceptibility) while coping capacity was used on the other hand. It was further extracted through sub-factors using ArcGIS, MS Excel, and SPSS while giving weights through AHP to obtain the resultant maps of each factor, accordingly.

6.1. Sensitivity

Flood disaster occurs because of potential flood hazard, elements at risk, and sensitivity of element at risk coupled with lack of coping capacity [71]. The sensitivity indicators can be overlaid with other indicators to describe the geo-morphological characteristics of floodplains. Flood sensitivity was determined through the hazard, exposure, and susceptibility indicators [72], while estimating the relative influence of each input variable in the model output by computing sensitivity components through Equation (2).

6.1.1. Hazard (IH)

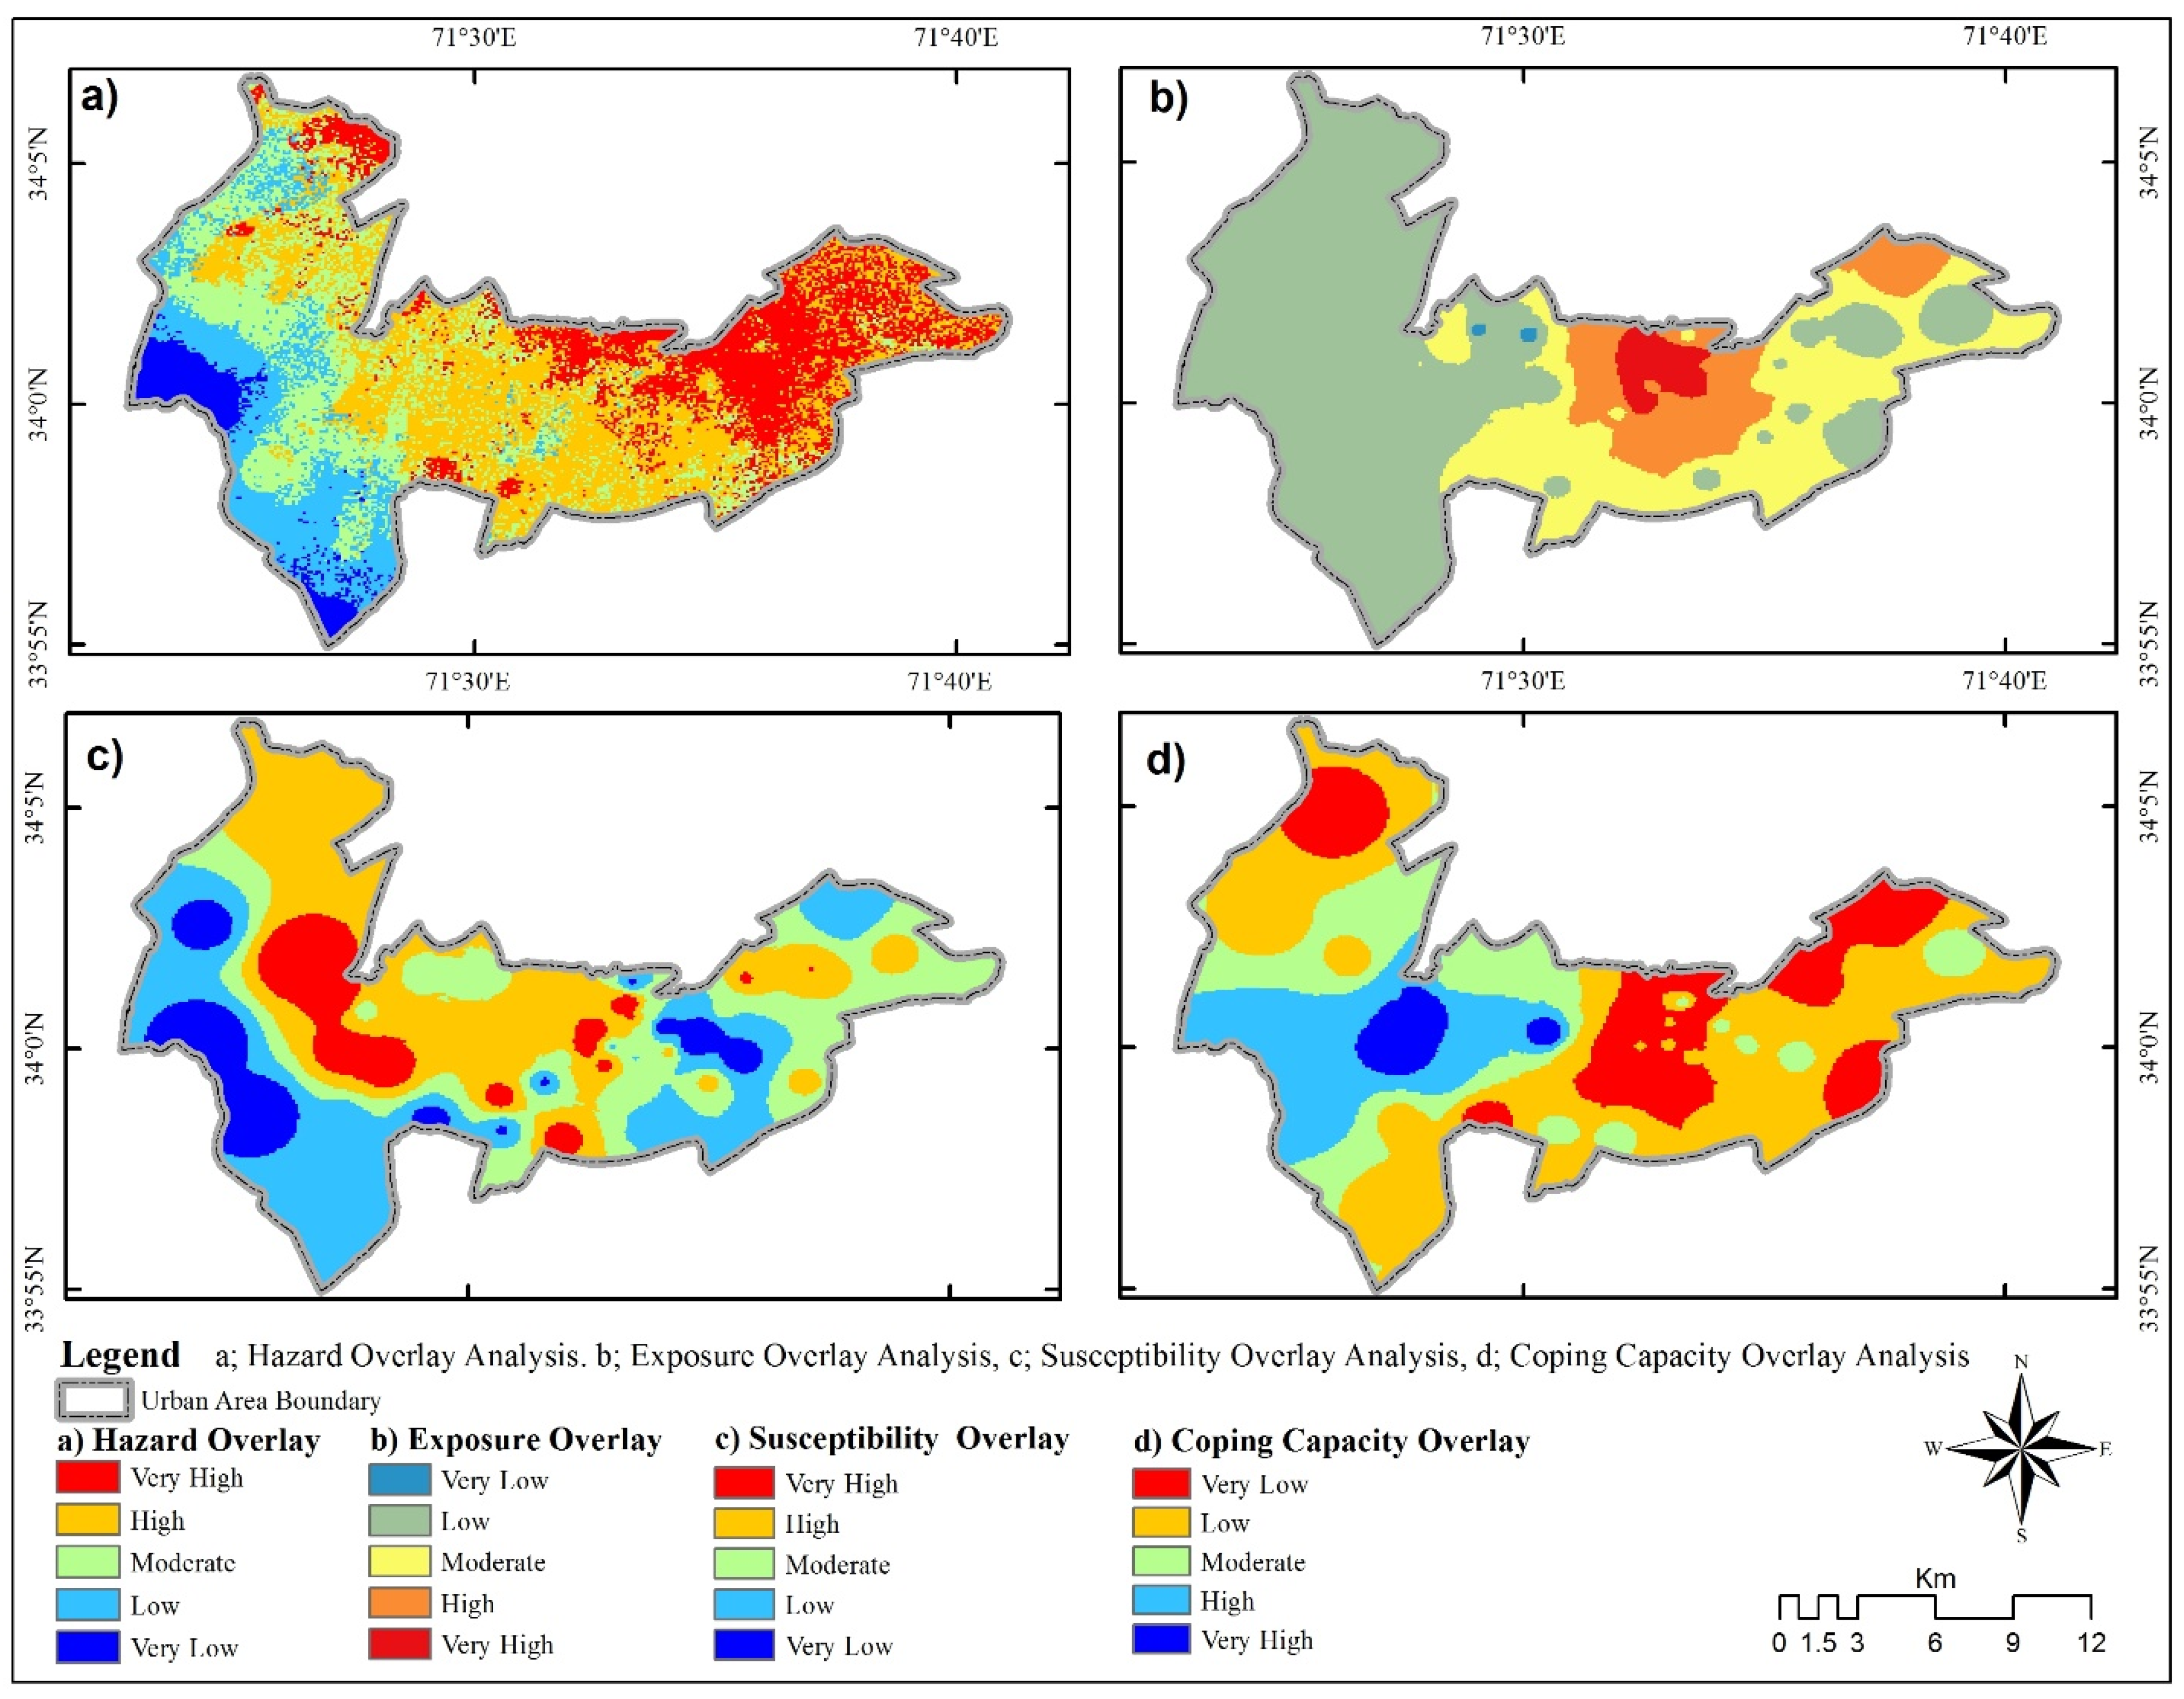
The urban flood is a hydrological hazard, which has the potential to cause damages in urban settlements. In this study, the hazard (IH) is measured with six sub-factors (i.e., elevation, LULC, CN grid, slope, precipitation, and flood damages). Each sub-factor has given weight by expert opinion and normalized through AHP, which provides us with the product value (λmax = 6.62). Flood hazard was further visualized in ArcGIS to generate a thematic map using a GIS-Based AHP tool based on the given weights. The hazard is reclassified into five classes, i.e., very high, high, moderate, low, and very low. The results show that the northeastern side of the study area has a very high potential for urban flood, while the southwestern side has a shallow potential for urban floods (Figure 10a). This can be explained by the elevation map, LULC map, CN grid, slope map, rainfall grid, and flood damages map. The elevation of the study area ranges from 251 to 431 m, which rises from east to west and can intensify the flood magnitude in the low-lying areas. The LULC pattern shows that the target area has pavement and hard surfaces, which reduce infiltration rate and increase surface runoff of rainwater. Moreover, the CN grid values range from 30 to 100, indicating that the northwestern parts of the study area have very high surface runoff potential, which often results in urban flooding. Similarly, the central parts of the study area also have significant potential for surface runoff. The study area’s slope ranges from 0 to 28.4 degrees. The lower values indicate the flat areas while the higher values represent steep slopes (Figure 4b). The slope distribution shows that the surrounding areas are comparatively steeper; therefore, during rainfall, a rapid overflow of water from nearby rivers and streams causes urban floods in the study area. The evaluation of the damages caused by past floods suggests that the west part of the study area received maximum damages, as compared to the east side. These results are in line with the previous studies [28,38], which concluded that the low-lying areas with pavement and a hard surface, having maximum rainfall are more likely to inundate by floodwater.

6.1.2. Exposure (IE)

The study area is likely to be affected directly or indirectly and is therefore exposed to flood events. Here, the term “exposure” aims to express the relative exposure of the population density, livelihood, and basic health/educational facilities as its indicators [72]. In this study, the exposure is measured with four sub-factors (annual income, population density, health facilities, and educational facilities). At the same time, each sub factor was weighted and normalized through AHP, which gives us the product value (λmax = 4.21). Flood exposure was further visualized in ArcGIS to generate a thematic map, using the GIS-Based AHP tool based on the given weights. The exposure map is reclassified into five classes (very low, low, moderate, high, and very high). The results show that the west, northwest, and southwest sides of the study area have low exposure to urban floods, while the north side of the study area has very high exposure to urban floods (Figure 10b). During the community visits and surveys, it was observed that most of the population was unaware about flood risk and had low income level. As a result, large number of illiterate population having low or lacking of knowledge, less education, and lack of basic health facilities are more exposed to the impacts of floods [73]. The results of the study are in support of previous researches [38,68], which also revealed that high population density, low flood risk awareness, a high proportion of the dependent population, and high rate of illiteracy are the major factors that intensify community’s exposure to floods.

6.1.3. Susceptibility (IS)

Susceptibility is the extent to which a system is likely to be affected by any hazard [24]. It is based on the assumption that the impact of floods occurs as damage to property when it has direct contact with floodwater. In this study, three indicators were taken (commercial buildings, residential buildings, and government infrastructure) to evaluate urban flood susceptibility. Weight was given to each indicator and normalized through AHP while obtaining the product value (λmax = 3.06). The obtained weights were further processed through the GIS-based AHP tool in ArcGIS to generate the resultant map of susceptibility. The final map of study area shows different zones, comprising very high, high, moderate, low, and very low susceptible areas. The results show that the north, northeast, and central parts of the study area are highly susceptible to urban floods, whereas the south and southwest sides show low susceptibility to urban floods (Figure 10c). It was further found that the majority of the commercial and residential buildings exist in the low-lying areas, receiving high annual precipitation (see Figure 7a,b). Similarly, poor government infrastructures are more susceptible to urban floods [34]. Thus, the location of the public facilities in exposed areas with poor structure can intensify the susceptibility of the target region to urban floods. The results of the study are in line with the findings of similar studies carried out by [28,38], which concluded that commercial areas, residential buildings, and poor infrastructures are the major factors contributing to flooding susceptibility.

6.2. Coping Capacity (ICc)

Coping capacity is the ability of a system, individual, or community to respond to the negative impacts of stress that can potentially damage the structure or function of a system [72]. This study measured coping capacity with three indicators (i.e., economic capacity, institutional capacity, and educational level). Weight was given to each indicator and normalized through AHP while getting the product value (λmax = 3.01). The obtained weights were further processed through the GIS-based AHP tool in ArcGIS to generate the coping capacity map. The map was classified into five classes, i.e., very high, high, moderate, low, and very low. The results show that the southeastern and northwestern sides of the study area have very low coping capacity toward urban floods. This indicates that the said regions have very poor economic condition, weak institutional system and low literacy/awareness level. In contrast, the western and central parts show moderate and high coping capacity toward urban floods, respectively (Figure 10d). The presence of enough coping capacity in the above-mentioned parts highlights the strong economic status, organized institutional setup and high literacy/awareness level. Similar findings were reported by various studies related to vulnerability assessment [38,39,44,68], which found that proper early warning system, high preparedness level, good income status, better employment, multiple sources of income, and social networks or participation of people in intra community activities play a significant role in enhancing capacities of the communities to cope effectively with floods.

7. Urban Flood Resilience

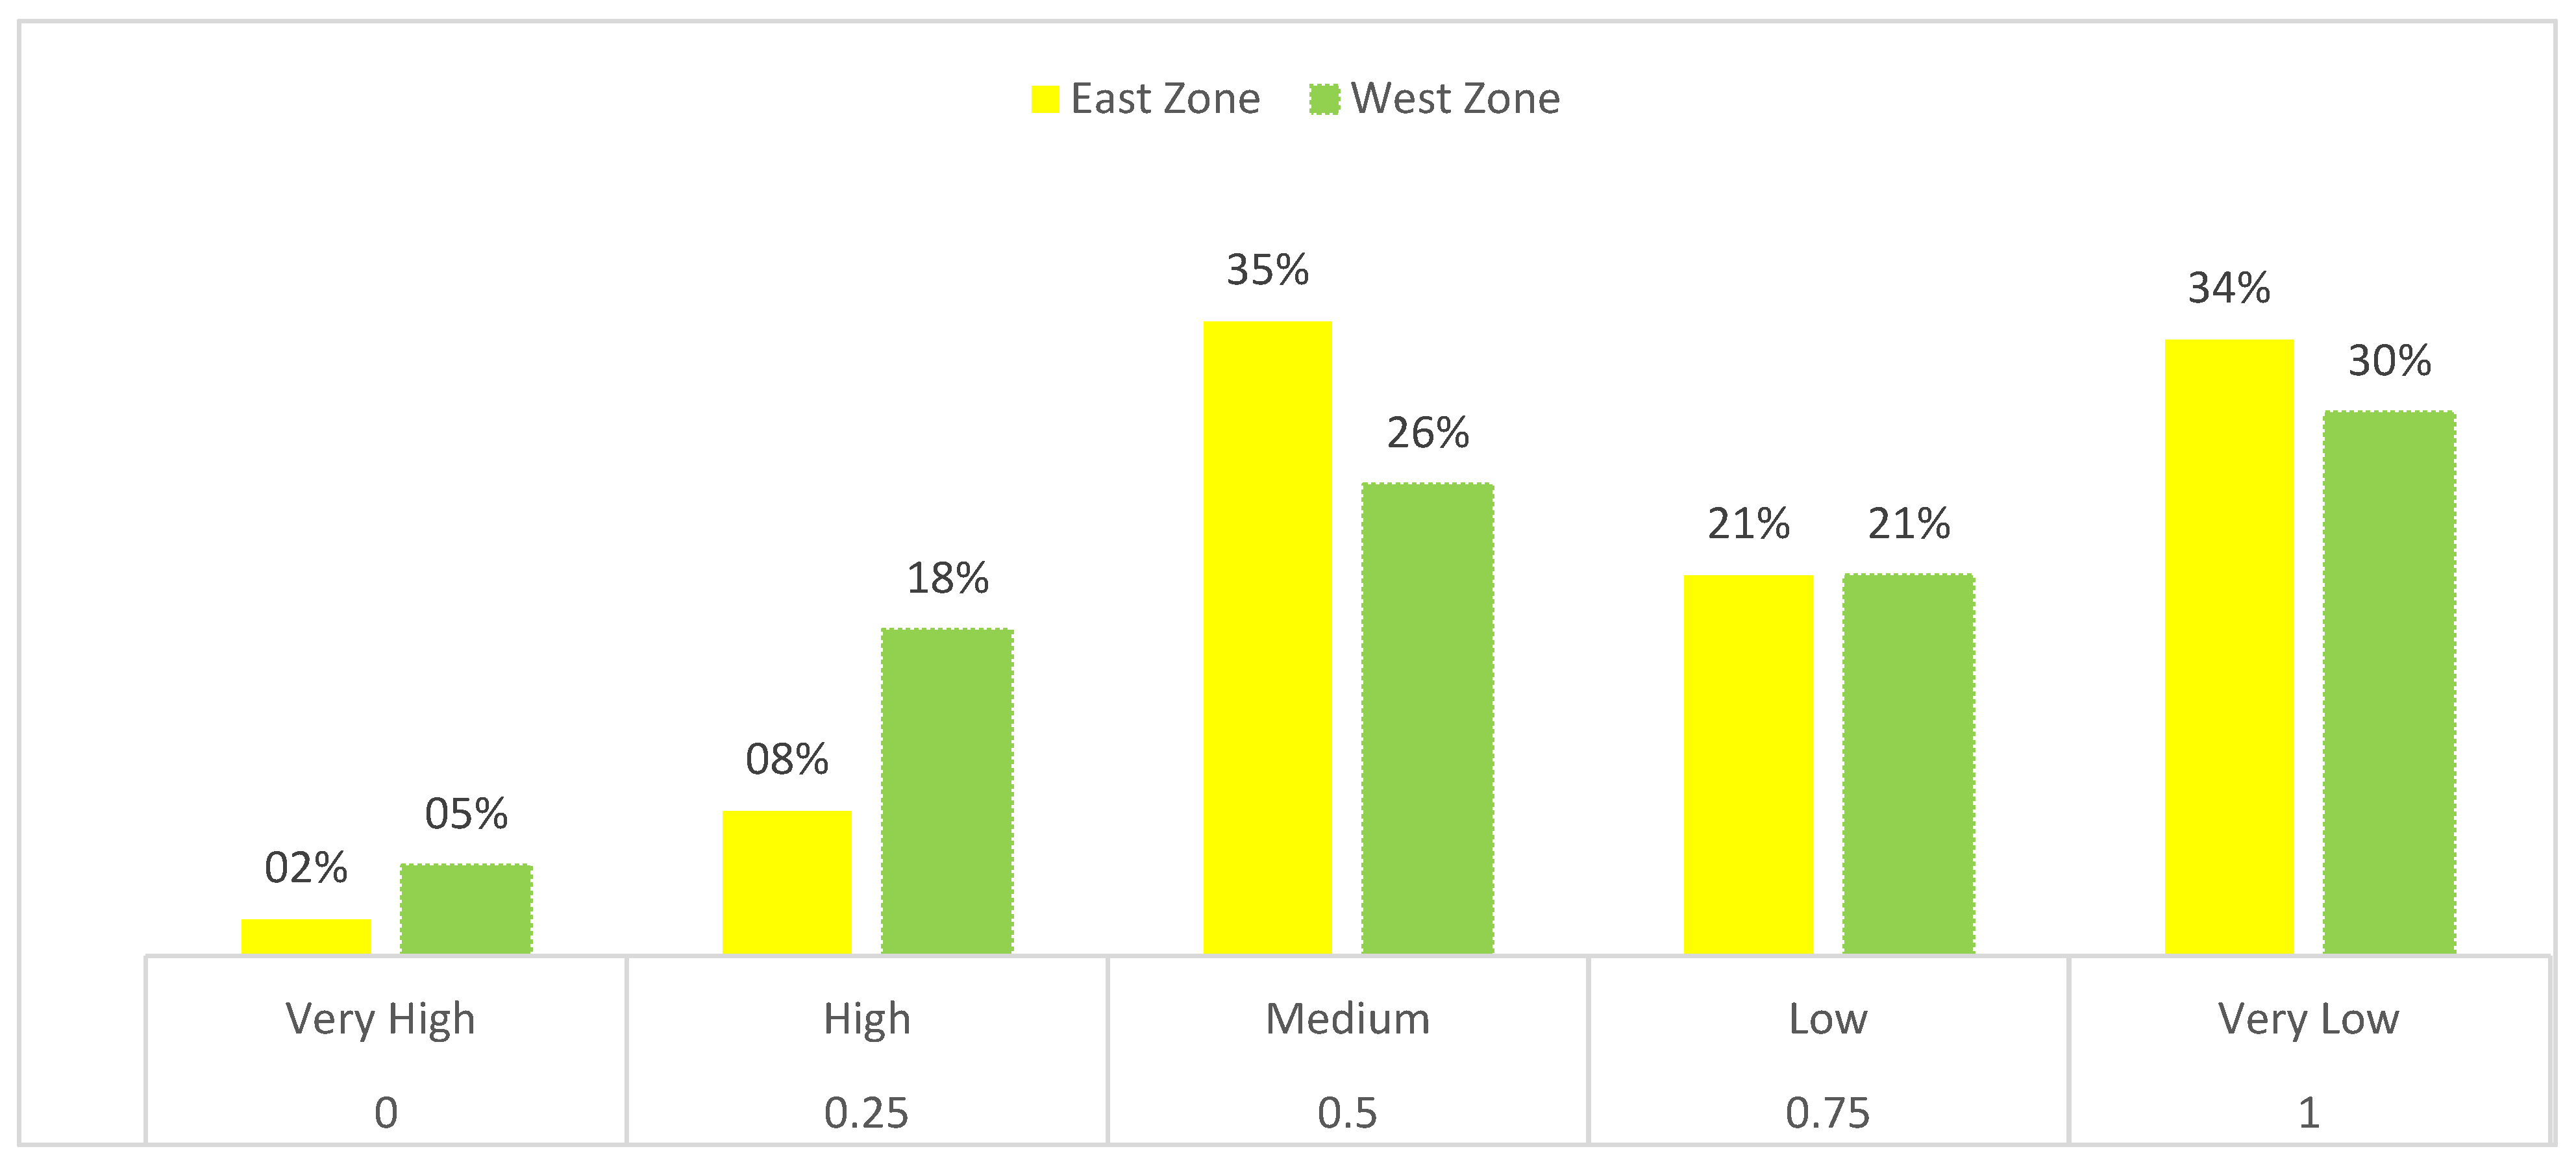
To extract the final resilience map, the raster overlay method was used. The hazard-, exposure-, and susceptibility-weighted maps were reclassified into five classes through “Reclass” in the Spatial Analyst tool, with the help of the natural breaks (Jenks) method. After reclassification, a raster calculator was used to obtain the final map, utilizing Equation (3). Resilience raster values ranged between 0 to 1, which were further reclassified into five classes for interpretation. The resilience raster value is inversely proportional to the resilience class. Resilience raster was reclassified into five classes, in which very high resilience areas were assigned to a very low value (0), high resilience class assigned to a lower value (0.25), medium resilience class assigned to middle value (0.50), low resilience class was assigned to a higher value (0.75), while very low resilience class was assigned to the highest value (1), as shown in Table 7. The result shows that in the West zone of the study area, the northwestern and the central parts have very high resilience (5%) and high resilience (18%), the western and eastern parts have medium resilience (26%) and low resilience (21%), while the southern and the southwestern parts of the West zone have very low resilience (30%). Similarly, in the East zone, the northwest and southwest parts have very high resilience (2%) and high resilience (8%), while the maximum area of the central part has medium resilience (35%) and low resilience (21%). The north and west parts of the East zone have very low resilience (34%) (Figure 11). Since resilience has a direct relationship with coping capacity and an indirect relationship with exposure and susceptibility, the degree of high resilience in some parts of the study area can be attributed to the availability of a strong coping capacity and low exposure and susceptibility against urban floods. On the other hand, the low level of resilience in some parts of the study area can be related to a high extent of exposure/susceptibility and low coping capacity toward urban floods.

8. Model Validation and Performance Evaluation

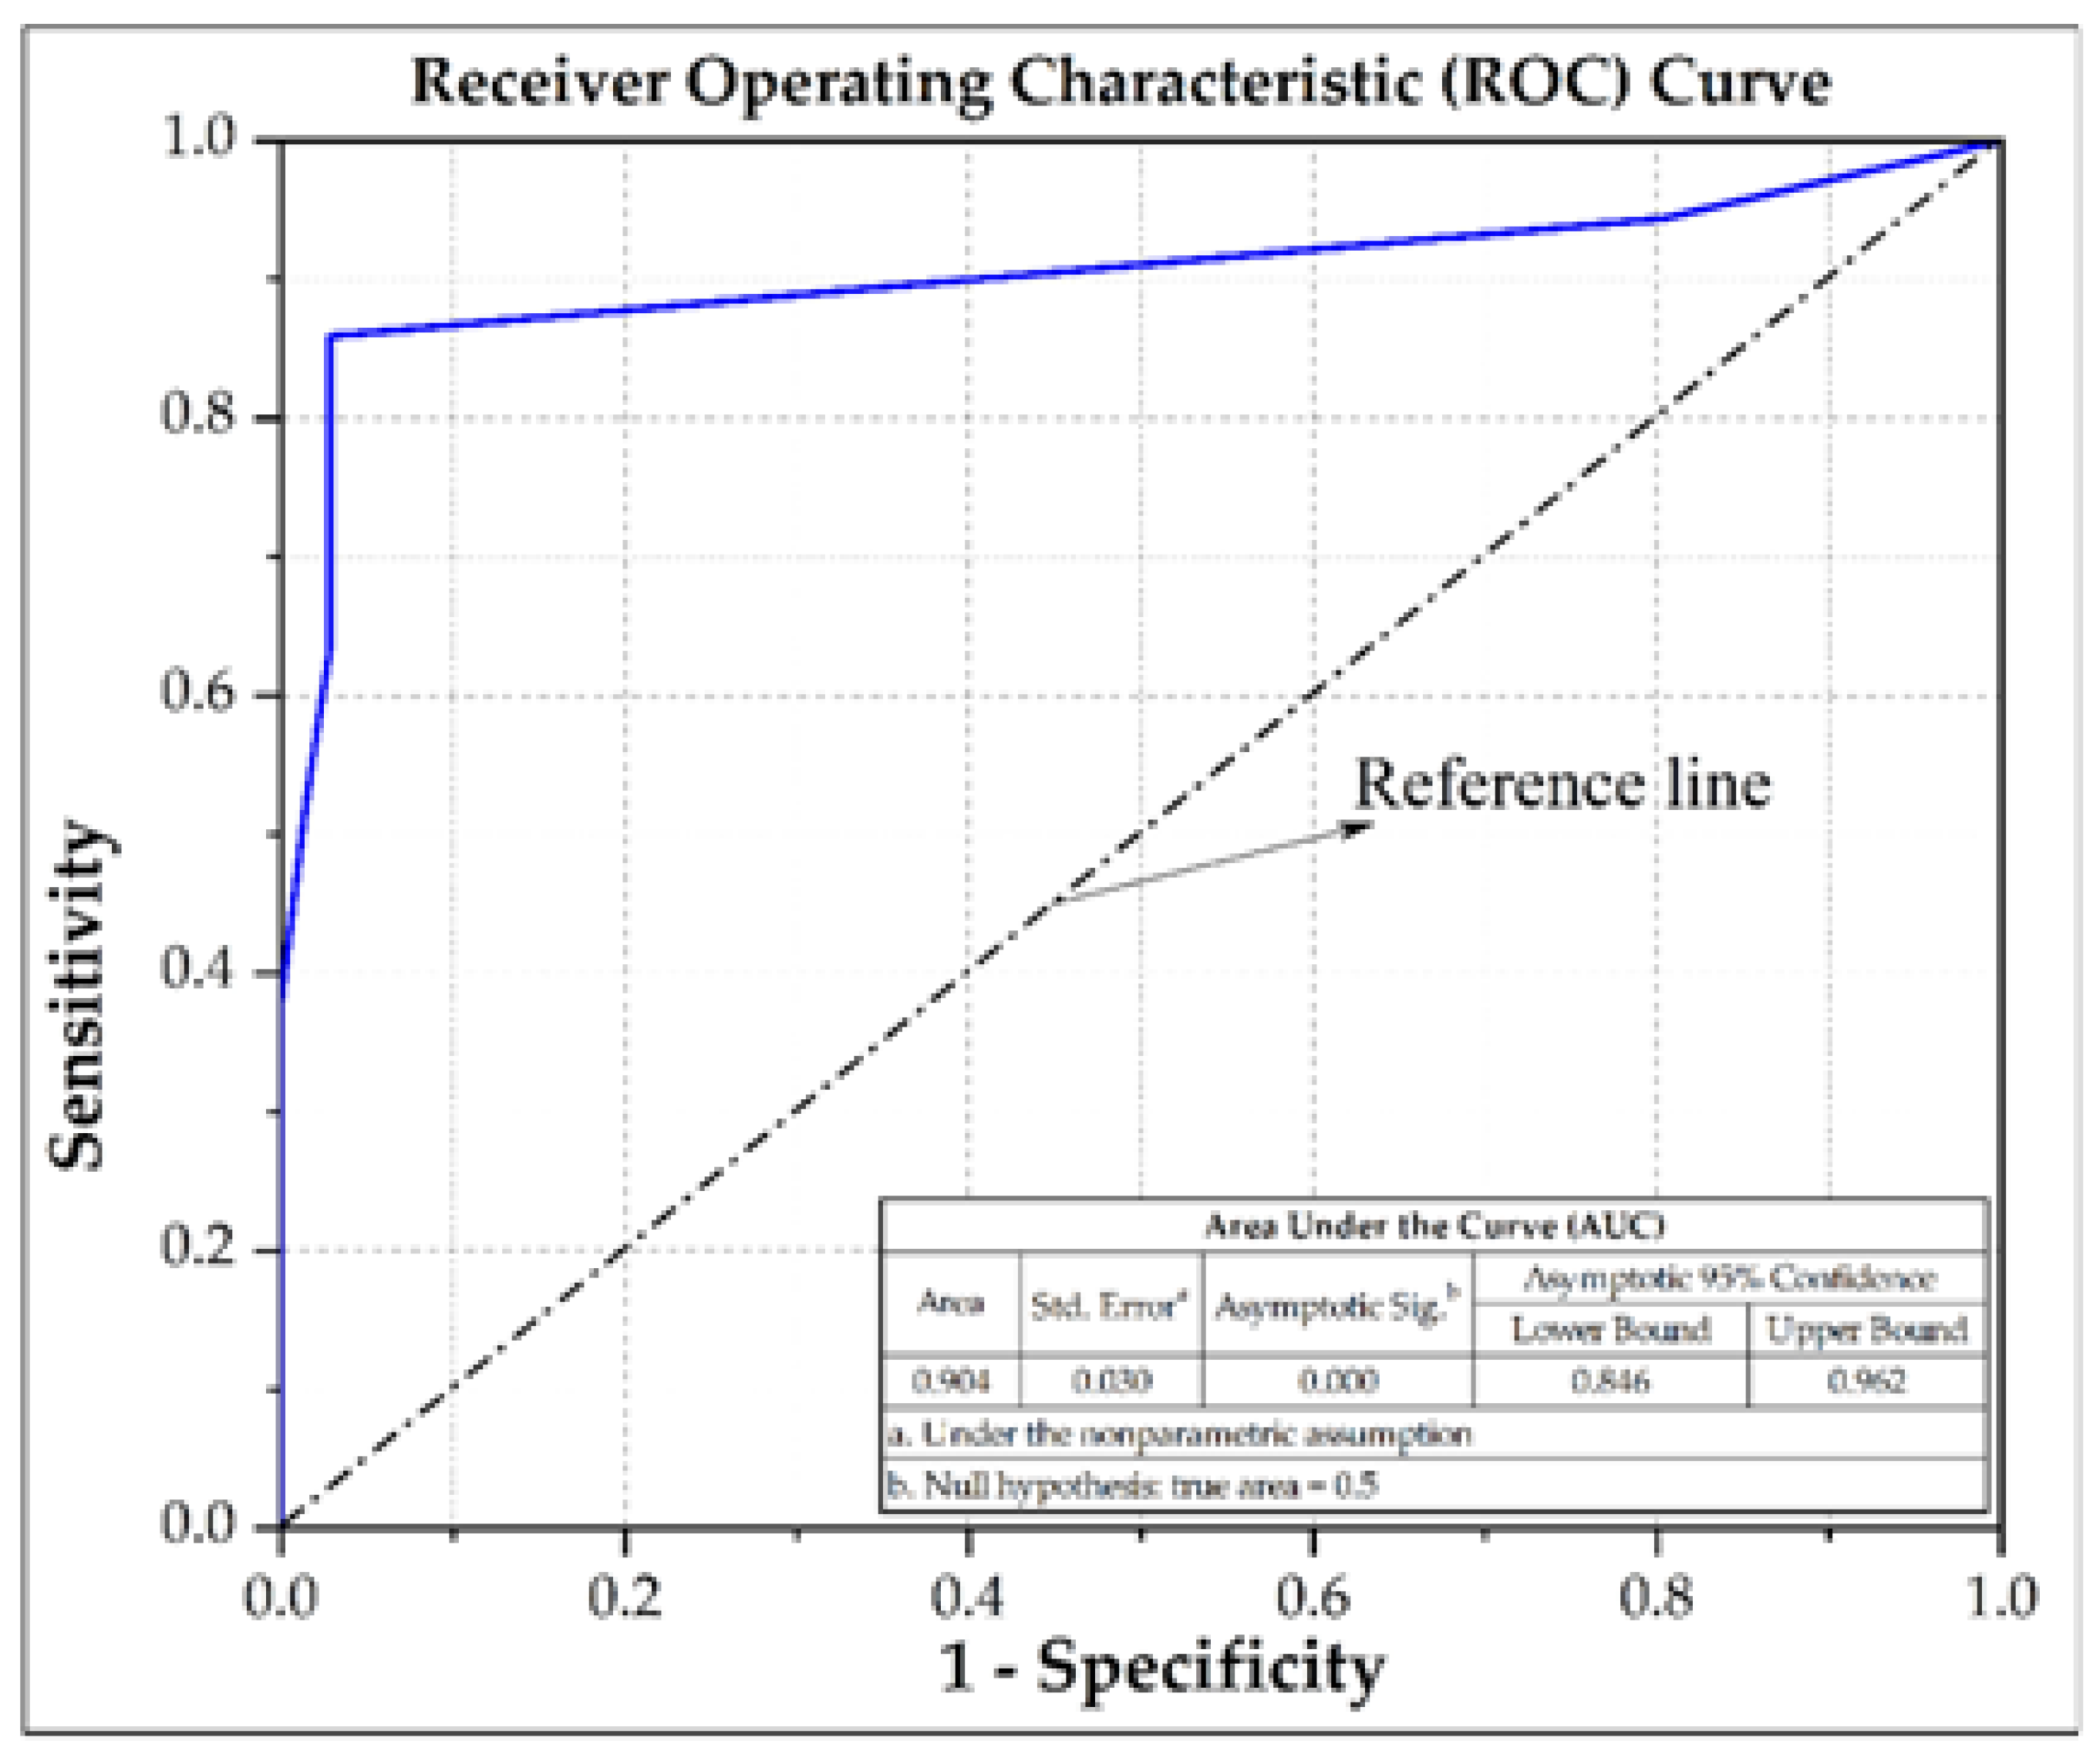
The validation and performance evaluation of the proposed model was carried out through the receiver operating characteristic (ROC) curve and area under the curve (AUC) using historical damage locations [66,74]. For validation, 142 sites (71 flood-damaged locations and 71 non-damaged locations) were considered from historical flood reports. The result shows that the AUC value for the proposed model was 0.904 (Figure 12), which is acceptable. Thus the model can reasonably be concluded to have excellent prediction capability for the construction of an urban flood resilience map [67,75].

9. Comparison of Resilience Level in the Two Zones

After data analysis, urban flood resilience in both zones of the study area was compared (i.e., west and east zones) (Table 7). For this purpose, we categorized the final resilience map into five preference values from 0 to 1, with 0 considered as very high resilience, 0.25 as a high-level resilience, 0.5 as a medium-level resilience, 0.75 as a low-level resilience, and 1 as a very low level of resilience. Figure 13 shows that in the West zone of the study area, 5% of the area has very high resilience, 18% has high resilience, 26% medium resilience, 21% low resilience, and 30% of the area has very low resilience to urban floods. The results suggest that only 23% portion of the West zone has a very high to high resilience level, whereas more than half of the West zone has low to very low resilience (51%). This indicates that the West zone of the study area has high exposure and moderate resilience to urban floods. Similarly, in the East zone of the target region, 2% of the area has very high resilience, 8% has high resilience, 35% has medium resilience, 21% has low resilience, and 34% of the area has very low resilience to urban floods. The analysis suggests that only 10% of the East zone has enough resilience to withstand urban floods, while 55% portion has low to very low resilience and cannot tackle the urban floods effectively. The overall results based on high hazard (6.62), high exposure (4.21), high susceptibility (3.06), and low coping capacity (3.01) values reveal that the West zone of the study area was comparatively more resilient to urban floods than the East zone. Moreover, the West zone has high resilience in terms of a spatial extent than the East zone of the study area. The results highlight the need for more urgent interventions and efforts from all relevant line agencies to work very closely with the local people and design low-cost and effective measures to prevent and mitigate urban floods in the less resilient and high exposed parts of the study area.

10. Discussion

Urban Floods are the most frequently occurring and widespread disasters worldwide [3]. The main causes that trigger urban floods (except for rainfall intensity) are the unplanned urban sprawl, along with stream banks, the human interference in the main streams altering the hydraulic stream characteristics, and the failures of technical works (bridges, culverts, etc.), in combination with the possible deforestation [4,5,6]. Urban flooding is triggered when surface runoff exceeds the capacity of drainage systems, which happens when heavy rainfall pours on sewers with a limited capacity or even medium rainfall falls on poorly planned or operated drainage systems [76].On the other hand, a rapid increase in urbanization and high population growth have brought a wide range of negative effects on the natural environment. In urban areas, human activities such as encroachments, illegal building construction, mismanagement of landuse, and lack of urban planning trigger urban floods [77]. Peshawar city is one of the highly prone areas to urban floods. The study region has a long and devastating history of urban floods. The city has been severely affected by the floods, from 2010 and onwards. In the 2010 floods, River Kabul and Budni Nullah inundated a large part of the district, affecting 16 union councils, destroying 33,867 houses with a death toll of 46 persons and 68 injuries. Similarly, in the 2012 floods, 3 persons were lost their lives, 7were injured, and a total of 217 houses collapsed. In another flood in 2014, over 13 people were drowned and54 were injured. Almost the same situation has occurred in the 2015 floods when 224 houses became partially damaged, 19 were fully damaged and 7 persons lost their lives [35]. According to Rezende et al. 2019 [78], unplanned development, high population density, rapid urbanization, and poor sewerage system are the triggering elements of urban flooding in the study area. It is projected that the frequency and intensity of urban floods in the study area would be exacerbated in the coming decades due to dynamic changes in climate, coupled with a high influx of human population, rapid urbanization, poor developmental interventions, and low adaptive capacity [14,37,52]. It is, therefore, critical to assess the resilience of the city to urban floods that would help in reducing the risk of future flooding events. In this regard, the present study assessed the urban flood resilience in Peshawar city, using an integrated approach of UFResi-M. The model is based on multidimensional indicators that help to assess urban flood resilience from multiple aspects.
Though there is no uniform definition of resilience yet [13,16,17,79], in terms of urban areas, it has been defined as their ability to face the adverse impacts of extreme events and having the capacity to adapt and respond to all kind of disturbances [18,19]. According to Rey et al. [20], resilience is the ability of a system to resist, absorb, adapt, and recover from the adverse effects of a hazard in a timely and effective manner through the preservation and restoration of its essential structures and functions.
Disaster resilience theoretical frameworks are frequently used across the world, including the operationalization of urban resilience in different hazard contexts and geographical scales [29,80,81]. There is no standard approach toward flood resilience measurement yet, the disaster resilience of place (DROP) model designed by Cutter et al. [82], is a model to be used to enhance the comparative analysis of flood resilience at local levels. There have been a lot of efforts in designing tools for flood management with a focus on resilience. Miguez et al. [30], have developed an integrated flood resilience (FResI) tool that aims at the inclusion of resilience components in the decision-making process for flood control purposes. The FResI tool gives us mean values of resilience in a basin scale, by comparing flood behavior of the future values with its current values. Though this approach was able to identify the best alternative to a combined approach, including sustainable urban drainage measures with river restoration techniques, this approach could not measure the social, economic, ecological, and infrastructural components of flood resilience. Thus far, very few models can measure flood resilience in a real mean. In this regard, Mugume et al. [31], present a quantitative method to show the spatial distribution of flood resilience, using 24 flood-related indicators. This index-based approach measures the social, economic, ecological, and infrastructural components of three communities in the African region. It is vital to mention that our model is in line with the method presented by Mugume et al. [31] because both the model and method are based on multiple indicators of resilience. It is believed that resilience is a multidimensional tool and needs multiple variables and indicators from diverse fields. Moreover, Mugume et al. [81], have also provided a resilience index to quantify the residual functionality of the community or system that transfers the analysis from hazard to community’s/system’s performance when subjected to any external or internal failures. Nevertheless, this approach is able to evaluate the performance of an urban drainage system by combining the flood magnitude and duration into a single unit. However, this model could have limitations since evaluating the performance of an urban drainage system and its functionality is not the only component to assess urban flood resilience. Likewise, Veról et al. [33], provided an integrated resilience index for supporting decision makers to combat floods with alternatives. With the help of this index, it is possible to measures a city’s response to flood risk controls. Moreover, this approach was able to measure the overall response of the city to floods rather than to the individual components.
A study conducted by Moghadas et al. [14], developed a hybrid multi-criteria decision-making methodology using composite indexing, consisting of six key aspects such as economic, social, infrastructural, institutional, environmental, and capital aspects of the community for flood resilience. The application of multiple variables from diverse aspects makes the model more effective and reliable in analyzing community resilience to floods. Another study conducted by Bertilsson et al. [1] has provided a multi-criteria index called specialized flood resilience index (S-FRESI) to map out flood resilience and has studied flood resilience by three main aspects, i.e., the drainage system capability, urban community’s capability to quick recovery from flood losses, and the urban system’s capability to remove floodwater. Though this model covers multiple aspects of the community, it mainly focuses on coping capacity, which could not be considered the only component of flood resilience.
The proposed UFResi-M is based on sensitivity and coping capacity toward urban flood, which are the two main parts of this model. The UFResi-M aims to assess urban flood resilience while measuring the impacts of floods with existing coping capacity. The sensitivity aspect was measured with three main factors (hazard, exposure, and susceptibility) while coping capacity was used on the other hand. The proposed model enables us to pinpoint some of the flood resilience-related aspects that are possible to express in quantitative terms in the unplanned urbanized areas. The urban flood resilience model allows working with variables having different characteristics, which can be normalized and operated, such as the impact of the urban flood and the existing coping capacity of a community toward urban floods. It is believed that there are often weaknesses in integrated models that try to assign values to complex concepts. However, the quantitative measurement of multiple variables offers the opportunity of acting effectively, and thus, an integrated model can still play an important role in ensuring urban city planning in the right direction. The present UFResi-M model produced the results of the urban flood resilience assessment as expected, considering the theoretical framework found in the literature review. High hazard (6.62), high exposure (4.21), high susceptibility (3.06), and low coping capacity (3.01) indicate that the study region is highly sensitive toward urban floods, especially the eastern zone. This indicates that the target region exhibits a high risk of urban flood with poor socioeconomic conditions. Moreover, the high risk of urban floods in Peshawar city could be attributed to rapid urbanization, high population growth, degraded environment, lack of advanced early warning mechanism, low public awareness, and lack of adaptive capacity. Similar findings were reported by previous studies related to vulnerability assessment [38,39,44], which found that proper early warning system, high preparedness level, good economic status, better employment, multiple sources of income, and social networks or participation of people in intra community activities play a significant role in enhancing capacities of the local communities to cope effectively with floods.

11. Conclusions

In the present study, we proposed a new integrated model of urban flood resilience, namely, UFResi-M by integrating the ArcGIS, remote sensing, AHP, and UFRI to assess urban flood resilience in Peshawar city of Pakistan. The model consists of several parameters; however, flood hazard, exposure, susceptibility, and coping capacity are the main parameters of this model. This study is the first of its kind in Pakistan and the study area, which provides a step forward for the initialization of resilience, specifically for Peshawar city and generally for other cities of Pakistan. The study region is highly vulnerable to urban flooding due to high population growth, rapid urbanization trend, degraded environment, lack of advanced early warning mechanism, low public awareness, and lack of flood risk assessment. The UFResi-M shows an accuracy of 90.4% toward the results of the urban flood resilience assessment, which indicates that the model is highly reliable and robust and can be used for the assessment of urban flood resilience. The results of this study reveal that the likelihood of urban floods is high in the northeastern side of the study area, while the southwestern part has a low potential for urban floods. Moreover, the west, northwest, and southwest sides of the study area have comparatively low exposure to urban floods than that of the northern side. In terms of susceptibility, the northern, northeastern, and central parts of the study area are relatively more susceptible to urban floods than that of the south and southwest sides. Interestingly, the highest number of commercial and residential buildings is founding the low-lying areas, receiving high annual precipitation and thus more susceptible to urban floods. Moreover, the observed condition of the government infrastructures is poor that may increase their susceptibility to urban floods. The analysis of the coping capacity suggests that the western and central parts exhibit moderate and high coping capacity toward urban floods, respectively, and thus less vulnerable. On the contrary, the southeastern and northwestern sides of the study area exhibit very low coping capacity toward urban floods. The study further reveals that the West zone of the study area is comparatively more resilient to urban floods because of the strong coping capacity, while that of the East zone is less resilient due to a high degree of sensitivity and low coping capacity. Though this study provides a comprehensive and robust assessment of the urban flood resilience in Peshawar city, future studies should use satellite imageries of high resolution and other advanced analytical tools such as artificial neural networks(ANNs), which will improve the efficiency, accuracy and reliability of the model outputs. Moreover, the findings of this study can be used as a reference for relevant agencies, including government and nongovernment organizations, United Nations(UN) agencies, and local community-based organizations (CBOs) to take effective structure and non-structure measures in order to make the local communities more resilient against urban floods. The sensitivity of urban flood disasters can be overcome by enhancing the literacy ratio, ensuring community-based awareness programs, and establishing community-based organizations. Furthermore, the resilience level of the local communities can be improved through the provision of alternatives in livelihoods, credit facilities, access to information of extreme weather, and greater efforts by all relevant agencies.

Author Contributions

All authors contributed significantly to the preparation of this manuscript. Conceptualization, M.T. and J.Z.; methodology, M.T., M.H., and J.Z.; software, M.T. and M.H.; validation, M.T., M.H., and S.U.; formal analysis, M.T. and M.H.; investigation, M.H. and M.T.; resources, J.Z. and M.T.; data curation, W.H., M.A.B., and B.A.-S.; writing—original draft preparation, M.T.; writing—review and editing, M.T., J.Z., S.N.K., and S.U.; visualization, M.T., J.Z., and X.L.; supervision, J.Z.; project administration, J.Z. and M.T.; funding acquisition, J.Z. All authors have read and agreed to the published version of the manuscript.

Funding

This research is supported by the national key research and development program of China(2018YFC1508804); the Key Scientific and Technology Research and Development Program of Jilin Province (20180201033SF), and the Key Research and Development Projects of Science and Technology Department of Jilin Province, Development of dynamic risk early warning technology and refined information sharing platform for urban rainstorm and water logging disaster (20200403074sf).

Acknowledgments

The authors would like to thank the Provincial Disaster Management Authority (PDMA), Government of KP, Pakistan Bureau of Statistics, Census Department, Soil Conservation Department, Government of KP, and Planning and Development (P&D) Department, and Government of KP, Pakistan, for providing us the relevant data. The authors acknowledge the United States Geological Survey (USGS) for Sentinel 2 and ASTER DEM images. The authors also would like to thank Mahfuzur Rahman and Farman Ullah for their technical input in the validation part.

Conflicts of Interest

All the authors declare to have no conflict of interest.

References

  1. Bertilsson, L.; Wiklund, K.; de Moura Tebaldi, I.; Rezende, O.M.; Veról, A.P.; Miguez, M.G. Urban flood resilience–A multi-criteria index to integrate flood resilience into urban planning. J. Hydrol. 2019, 573, 970–982. [Google Scholar] [CrossRef]
  2. Kellens, W.; Terpstra, T.; De Maeyer, P. Perception and communication of flood risks: A systematic review of empirical research. Risk Anal. 2013, 33, 24–49. [Google Scholar] [CrossRef] [Green Version]
  3. Jha, A.K.; Bloch, R.; Lamond, J. Cities and Flooding: A Guide to Integrated Urban Flood Risk Management for the 21st Century; The World Bank: Washington, DC, USA, 2012; ISBN 9780821388662. [Google Scholar]
  4. Kastridis, A.; Kirkenidis, C.; Sapountzis, M. An integrated approach of flash flood analysis in ungauged Mediterranean watersheds using post-flood surveys and unmanned aerial vehicles. Hydrol. Process. 2020, 34, 4920–4939. [Google Scholar] [CrossRef]
  5. Faccini, F.; Luino, F.; Paliaga, G.; Sacchini, A.; Turconi, L.; de Jong, C. Role of rainfall intensity and urban sprawl in the 2014 flash flood in Genoa City, Bisagno catchment (Liguria, Italy). Appl. Geogr. 2018, 98, 224–241. [Google Scholar] [CrossRef]
  6. Diakakis, M.; Pallikarakis, A.; Katsetsiadou, K. Using a Spatio-Temporal GIS Database to Monitor the Spatial Evolution of Urban Flooding Phenomena. The Case of Athens Metropolitan Area in Greece. ISPRS Int. J. Geo Inf. 2014, 3, 96–109. [Google Scholar] [CrossRef]
  7. Diakakis, M.; Deligiannakis, G.; Katsetsiadou, K.; Antoniadis, Z.; Melaki, M. Mapping and classification of direct flood impacts in the complex conditions of an urban environment. The case study of the 2014 flood in Athens, Greece. Urban Water J. 2017, 14, 1065–1074. [Google Scholar] [CrossRef]
  8. Ritchie, H.; Roser, M. Natural Disasters, Empirical View. Our World in Data (2018). Available online: https://ourworldindata.org/natural-disasters (accessed on 7 February 2021).
  9. Bhatti, A.S.; Wang, G.; Ullah, W.; Ullah, S.; Fiifi Tawia Hagan, D.; Kwesi Nooni, I.; Lou, D.; Ullah, I. Trend in Extreme Precipitation Indices Based on Long Term In Situ Precipitation Records over Pakistan. Water 2020, 12, 797. [Google Scholar] [CrossRef] [Green Version]
  10. Kreft, S.; Eckstein, D. Global Climate Risk Index Who Suffers Most from Extreme Weather Events? 2020. Available online: https://reliefweb.int/report/world/global-climate-risk-index-2014-who-suffers-most-extreme-weather-events-weather-related (accessed on 7 February 2021).
  11. Ali, A. Indus Basin Floods: Mechanisms, Impacts, and Management. Available online: http://hdl.handle.net/11540/810 (accessed on 11 March 2020).
  12. Saqib, S.E.; Ahmad, M.M.; Panezai, S.; Rana, I.A. An empirical assessment of farmers’ risk attitudes in flood-prone areas of Pakistan. Int. J. Disaster Risk Reduct. 2016, 18, 107–114. [Google Scholar] [CrossRef]
  13. Ullah, F.; Shah, S.A.A.; Saqib, S.E.; Yaseen, M.; Haider, M.S. Households’ flood vulnerability and adaptation: Empirical evidence from mountainous regions of Pakistan. Int. J. Disaster Risk Reduct. 2021, 52, 101967. [Google Scholar] [CrossRef]
  14. Moghadas, M.; Asadzadeh, A.; Vafeidis, A.; Fekete, A.; Kötter, T. A multi-criteria approach for assessing urban flood resilience in Tehran, Iran. Int. J. Disaster Risk Reduct. 2019. [Google Scholar] [CrossRef]
  15. Jha Abhas Kand Miner Todd, W.; Stanton-Geddes, Z. Building Urban Resilience: Principles, Tools, and Practice; World Bank Publications: Washington, DC, USA, 2013. [Google Scholar]
  16. Ahmed, A.K.; White, A. Concepts and practices of ‘resilience’: A compilation from various secondary sources. USA Agency Int. Dev. 2006. [Google Scholar] [CrossRef]
  17. Birkmann, J.; Wenzel, F.; Greiving, S.; Garschagen, M.; Rilling, B.; Fiedrich, F.; Fekete, A.; Cutter, S.L.; Novák, B.; Wieprecht, S.; et al. Extreme Events, Critical Infrastructures, Human Vulnerability and Strategic Planning: Emerging Research Issues. J. Extrem. Events 2016, 3, 1–25. [Google Scholar] [CrossRef] [Green Version]
  18. Brand, F.S.; Jax, K.; Brand, F.S.; Jax, K. Focusing the Meaning(s) of Resilience: Resilience as a Descriptive Concept and a Boundary Object. Ecol. Soc. 2007, 12, 23. [Google Scholar] [CrossRef] [Green Version]
  19. Cutter, S.L. The landscape of disaster resilience indicators in the USA. Nat. Hazards 2016, 80, 741–758. [Google Scholar] [CrossRef]
  20. Rey, W.; Martínez-Amador, M.; Salles, P.; Mendoza, E.T.; Trejo-Rangel, M.A.; Franklin, G.L.; Ruiz-Salcines, P.; Appendini, C.M.; Quintero-Ibáñez, J. Assessing Different Flood Risk and Damage Approaches: A Case of Study in Progreso, Yucatan, Mexico. J. Mar. Sci. Eng. 2020, 8, 137. [Google Scholar] [CrossRef] [Green Version]
  21. Silva, D.; Jo, B.M. City Resilience Framework. ARUP 2014, 13, 157–160. [Google Scholar]
  22. Meerow, S.; Newell, J.P. Urban resilience for whom, what, when, where, and why? Urban Geogr. 2019, 40, 309–329. [Google Scholar] [CrossRef]
  23. Wright, B. Reducing the complexity of the flood vulnerability index. Environmental Hazards. Environ. Hazards 2010, 9, 321–339. [Google Scholar] [CrossRef]
  24. Allopn, G.C. Linkages between vulnerability, resilience, and adaptive capacity. Glob. Environ. Chang. 2006, 16, 293–303. [Google Scholar]
  25. Johannessen, Å.; Wamsler, C. What does resilience mean for urban water services? Ecol. Soc 2017, 22, 1. [Google Scholar] [CrossRef] [Green Version]
  26. Liao, K.H. A theory on urban resilience to floods-A basis for alternative planning practices. Ecol. Soc. 2012. [Google Scholar] [CrossRef]
  27. Meerow, S.; Newell, J.P.; Stults, M. Defining urban resilience: A review. Landsc. Urban Plan. 2016, 147, 38–49. [Google Scholar] [CrossRef]
  28. Shah, A.A.; Ye, J.; Abid, M.; Khan, J.; Amir, S.M. Flood hazards: Household vulnerability and resilience in disaster-prone districts of Khyber Pakhtunkhwa province, Pakistan. Nat. Hazards 2018, 93, 147–165. [Google Scholar] [CrossRef]
  29. Birkland, T.A.; Waterman, S. The politics and policy challenges of disaster resilience. Resil. Eng. Perspect. 2009, 2, 15–38. [Google Scholar]
  30. Miguez, M.G.; Veról, A.P. A catchment scale Integrated Flood Resilience Index to support decision making in urban flood control design. Environ. Plan. B Urban Anal. City Sci. 2017, 44, 925–946. [Google Scholar] [CrossRef]
  31. Kotzee, I.; Reyers, B. Piloting a social-ecological index for measuring flood resilience: A composite index approach. Ecol. Indic. 2016, 60, 45–53. [Google Scholar] [CrossRef]
  32. Mugume, S.N.; Gomez, D.E.; Fu, G.; Farmani, R.; Butler, D. A global analysis approach for investigating structural resilience in urban drainage systems. Water Res. 2015, 81, 15–26. [Google Scholar] [CrossRef] [Green Version]
  33. Veról, A.P.; de Oliveira, A.K.B.; Amback, B.C. Aplicação do Índice de Requalificação Fluvial Urbana para Verificação de Intervenções de Controle de Inundações na Bacia dos Rios Pilar-Calombé, RJ. Rev. Nac. Gerenc. Cid. 2020, 8, 17. [Google Scholar] [CrossRef]
  34. Urban Policy and Planning Unit, K. Urban Policy and Planning Unit–Provincial Land Use Plan (PLUP) Planning and Development Department Government of Khyber Pakhtunkhwa Final Land Use Plan of District Peshawar. Available online: http://urbanpolicyunit.gkp.pk/wp-content/uploads/2020/07/PESHAWAR-LAND-USE-PLAN-final-final-final.pdf (accessed on 9 January 2021).
  35. PDMA-KP District Disaster Management Plan, Peshawar. Available online: http://kp.gov.pk/uploads/2018/08/DDM_Plan.pdf (accessed on 21 January 2021).
  36. Cutter, S.L.; Ash, K.D.; Emrich, C.T. The geographies of community disaster resilience. Glob. Environ. Chang. 2014, 29, 65–77. [Google Scholar] [CrossRef]
  37. Qasim, S.; Qasim, M.; Shrestha, R.P.; Khan, A.N.; Tun, K.; Ashraf, M. Community resilience to flood hazards in Khyber Pukhthunkhwa province of Pakistan. Int. J. Disaster Risk Reduct. 2018, 18, 100–106. [Google Scholar] [CrossRef]
  38. Ainuddin, S.; Routray, J.K. Earthquake hazards and community resilience in Baluchistan. Nat. Hazards 2012, 63, 909–937. [Google Scholar] [CrossRef]
  39. Cutter, S.L.; Burton, C.G.; Emrich, C.T. Disaster Resilience Indicators for Benchmarking Baseline Conditions. J. Homel. Secur. Emerg. Manag. 2010, 7. [Google Scholar] [CrossRef]
  40. Public Health and Engineering Department. Urban Environmental Problems in Pakistan (A Case Study for Urban Environment in Hayatabad, Peshawar); Public Health and Engineering Department: Peshawar, Pakistan, 2012.
  41. Arshad, M.; Ma, X.; Yin, J.; Ullah, W.; Ali, G.; Ullah, S.; Liu, M.; Shahzaman, M.; Ullah, I. Evaluation of GPM-IMERG and TRMM-3B42 precipitation products over Pakistan. Atmos. Res. 2021, 249, 105341. [Google Scholar] [CrossRef]
  42. Hoque, M.; Tasfia, S.; Ahmed, N.; Pradhan, B. Assessing Spatial Flood Vulnerability at Kalapara Upazila in Bangladesh Using an Analytic Hierarchy Process. Sensors 2019, 19, 1302. [Google Scholar] [CrossRef] [PubMed] [Green Version]
  43. Samanta, S.; Koloa, C.; Kumar Pal, D.; Palsamanta, B. Flood Risk Analysis in Lower Part of Markham River Based on Multi-Criteria Decision Approach (MCDA). Hydrology 2016, 3, 29. [Google Scholar] [CrossRef] [Green Version]
  44. Hadipour, V.; Vafaie, F.; Deilami, K. Coastal Flooding Risk Assessment Using a GIS-Based Spatial Multi-Criteria Decision Analysis Approach. Water 2020, 12, 2379. [Google Scholar] [CrossRef]
  45. Raziq, A.; Xu, A.; Li, Y. Monitoring of Land Use/Land Cover Changes and Urban Sprawl in Peshawar City in Khyber Pakhtunkhwa: An Application of Geo- Information Techniques Using of Multi-Temporal Satellite Data. J. Remote. Sens. GIS 2016, 5. [Google Scholar] [CrossRef]
  46. Ullah, K.; Zhang, J. GIS-based flood hazard mapping using relative frequency ratio method: A case study of Panjkora River Basin, eastern Hindu Kush, Pakistan. PLoS ONE 2020, 15, e0229153. [Google Scholar] [CrossRef] [Green Version]
  47. Shao, Z.; Jahangir, Z.; Muhammad Yasir, Q.; Atta-ur-Rahman; Mahmood, S. Identification of Potential Sites for a Multi-Purpose Dam Using a Dam Suitability Stream Model. Water 2020, 12, 3249. [Google Scholar] [CrossRef]
  48. Venkatesh Merwade Creating SCS Curve Number Grid using Land Cover and Soil Data. Available online: https://web.ics.purdue.edu/~vmerwade/education/cngrid.pdf (accessed on 27 December 2020).
  49. National Resources Conservation Service Hydrologic Soil Groups. Part 630 Hydrology National Engineering Handbook; United States Department of Agriculture: Washington, DC, USA, 2007; pp. 1–14.
  50. Vojtek, M.; Vojteková, J. Flood Susceptibility Mapping on a National Scale in Slovakia Using the Analytical Hierarchy Process. Water 2019, 11, 364. [Google Scholar] [CrossRef] [Green Version]
  51. Hamidi, A.R.; Wang, J.; Guo, S.; Zeng, Z. Flood vulnerability assessment using MOVE framework: A case study of the northern part of district Peshawar, Pakistan. Nat. Hazards 2020, 101, 385–408. [Google Scholar] [CrossRef]
  52. Contingency Plan Monsoon Contingency Plan. 2020. Available online: https://www.pdma.gov.pk/sub/uploads/Moonsoon Contigency Plan 2020.pdf (accessed on 3 February 2021).
  53. Fekete, A. Validation of a social vulnerability index in context to river-floods in Germany. Nat. Hazards Earth Syst. Sci. 2009, 9, 393–403. [Google Scholar] [CrossRef] [Green Version]
  54. Lemke, P.J.; Ren, R.B.; Alley, I.; Allison, J.; Carrasco, G.; Flato, Y.; Fujii, G.; Kaser, P.; Thomas, R.H.; Zhang, T. Synthesis Report. Contribution of Working Groups I, II & III to the Fourth Assessment Report of the Intergovernmental Panel on Climate Change. Gene. In Climate Change 2007 Mitigation of Climate Change; Cambridge University Press: Cambridge, UK, 2007; Volume 4, pp. 1–861. ISBN 9780511546013. [Google Scholar]
  55. Ullah, S.; You, Q.; Ullah, W.; Ali, A. Observed changes in precipitation in China-Pakistan economic corridor during 1980–2016. Atmos. Res. 2018, 210, 1–14. [Google Scholar] [CrossRef]
  56. Ullah, W.; Wang, G.; Ali, G.; Tawia Hagan, D.; Bhatti, A.; Lou, D. Comparing Multiple Precipitation Products against In-Situ Observations over Different Climate Regions of Pakistan. Remote. Sens. 2019, 11, 628. [Google Scholar] [CrossRef] [Green Version]
  57. Scheuer, S.; Haase, D. Exploring multicriteria flood vulnerability by integrating economic, social and ecological dimensions of flood risk and coping capacity: From a starting point view towards an end point view of vulnerability. Nat. Hazards 2011. [Google Scholar] [CrossRef]
  58. Hussain, M.; Tayyab, M.; Zhang, J.; Shah, A.A.; Ullah, K.; Mehmood, U.; Al-Shaibah, B. GIS-Based Multi-Criteria Approach for Flood Vulnerability Assessment and Mapping in District Shangla: Khyber Pakhtunkhwa, Pakistan. Sustainability 2021, 13, 3126. [Google Scholar] [CrossRef]
  59. Bosher, L.; Dainty, A.; Carrillo, P.; Glass, J.; Price, A. Attaining improved resilience to floods: A proactive multi-stakeholder approach. Disaster Prev. Manag. Int. J. 2009, 18, 9–22. [Google Scholar] [CrossRef] [Green Version]
  60. Zhao, L.; He, F.; Zhao, C. A Framework of Resilience Development for Poor Villages after the Wenchuan Earthquake Based on the Principle of “Build Back Better”. Sustainability 2020, 12, 4979. [Google Scholar] [CrossRef]
  61. McCarthy, J.J. Climate Change 2001: Impacts, Adaptation, and Vulnerability; Canziani, O.F., Dokken, D.J., White, K.S., Eds.; The Press Syndicate of the University of Cambridge: Cambridge, UK, 2001. [Google Scholar]
  62. Kienberger, D.S.; Contreras, S.L. Regions of Vulnerability: Spatial Modelling of Different Conceptual Approaches. Available online: http://giscience2010.org/pdfs/paper_241.pdf (accessed on 3 November 2020).
  63. Nazeer, M.; Bork, H.R. Flood vulnerability assessment through different methodological approaches in the context of North-West Khyber Pakhtunkhwa, Pakistan. Sustainability 2019, 11, 6695. [Google Scholar] [CrossRef] [Green Version]
  64. Saaty, T.L. Decision making with the analytic hierarchy process. Int. J. Serv. Sci. 2008, 1, 83–98. [Google Scholar] [CrossRef] [Green Version]
  65. Saaty, T.L. The Analytic Hierarchy Process: Planning, Priority Setting, Resource Allocation; McGraw-Hill International Book Co.: New York, NY, USA; London, UK, 1980. [Google Scholar]
  66. Pourghasemi, H.R.; Razavi-Termeh, S.V.; Kariminejad, N.; Hong, H.; Chen, W. An assessment of metaheuristic approaches for flood assessment. J. Hydrol. 2020, 582. [Google Scholar] [CrossRef]
  67. Yesilnacar, E.; Topal, T. Landslide susceptibility mapping: A comparison of logistic regression and neural networks methods in a medium scale study. Eng. Geol. 2005, 79, 251–266. [Google Scholar] [CrossRef]
  68. Pakistan Economic Survey Pakistan: Flood Impact Assessment. Available online: http://www.finance.gov.pk/survey/chapter_12/highlights.pdf (accessed on 11 February 2021).
  69. Murayama, Y. Analytic Hierarchy Process in Geospatial Analysis; Murayama, Y., Ed.; Springer: Tokyo, Japan, 2012; ISBN 978-4-431-53999-5. [Google Scholar]
  70. Saaty, T.L. Group Decision Making and the AHP. In The Analytic Hierarchy Process; Springer: Berlin/Heidelberg, Germany, 1989. [Google Scholar]
  71. Wannous, C.; Velasquez, G. United Nations Office for Disaster Risk Reduction (UNISDR)—UNISDR’s Contribution to Science and Technology for Disaster Risk Reduction and the Role of the International Consortium on Landslides (ICL). In Advancing Culture of Living with Landslides; Springer International Publishing: Cham, Switzerland, 2017; pp. 109–115. [Google Scholar]
  72. Rana, I.A.; Routray, J.K. Actual vis-à-vis perceived risk of flood prone urban communities in Pakistan. Int. J. Disaster Risk Reduct. 2016, 19, 366–378. [Google Scholar] [CrossRef]
  73. Mobini, S.; Becker, P.; Larsson, R.; Berndtsson, R. Systemic Inequity in Urban Flood Exposure and Damage Compensation. Water 2020, 12, 3152. [Google Scholar] [CrossRef]
  74. Rahman, M.; Chen, N.; Islam, M.; Dewan, A.; Reza, H.; Muhammad, R.; Washakh, A.; Tian, S.; Faiz, H.; Alam, M.; et al. Geoscience Frontiers Location-allocation modeling for emergency evacuation planning with GIS and remote sensing: A case study of Northeast Bangladesh. Geosci. Front. 2021, 12, 101095. [Google Scholar] [CrossRef]
  75. Rahman, M.; Ningsheng, C.; Iftekhar Mahmud, G.; Monirul Islam, M.; Reza Pourghasemi, H.; Ahmad, H.; Maurice Habumugisha, J.; Muhammad Ali Washakh, R.; Alam, M.; Liu, E.; et al. Flooding and its relationship with land cover change, population growth, and road density. Geosci. Front. 2021, 101224. [Google Scholar] [CrossRef]
  76. Mynett, A.E.; Vojinovic, Z. Hydroinformatics in multi-colours—Part red: Urban flood and disaster management. J. Hydroinformatics 2009, 11, 166–180. [Google Scholar] [CrossRef]
  77. Bathrellos, G.D.; Karymbalis, E.; Skilodimou, H.D.; Gaki-Papanastassiou, K.; Baltas, E.A. Urban flood hazard assessment in the basin of Athens Metropolitan city, Greece. Environ. Earth Sci. 2016, 75, 319. [Google Scholar] [CrossRef]
  78. Rezende, O.M.; Miranda, F.M.; Haddad, A.N.; Miguez, M.G. A framework to evaluate urban flood resilience of design alternatives for flood defence considering future adverse scenarios. Water 2019, 11, 1485. [Google Scholar] [CrossRef] [Green Version]
  79. Folke, C.; Jansson, Å.; Rockström, J.; Olsson, P.; Carpenter, S.R.; Chapin, F.S.; Crépin, A.-S.; Daily, G.; Danell, K.; Ebbesson, J.; et al. Reconnecting to the biosphere. Ambio 2011, 40, 719–738. [Google Scholar] [CrossRef] [Green Version]
  80. Andoh, R.Y.; Iwugo, K.O. Sustainable Urban Drainage Systems: A UK Perspective. In Proceedings of the Ninth International Conference on Urban Drainage (9ICUD), Portland, OR, USA, 8–13 September 2002; pp. 1–16. [Google Scholar]
  81. Brown, R.R.; Keath, N.; Wong, T.H.F. Urban water management in cities: Historical, current and future regimes. Water Sci. Technol. 2009, 59, 847–855. [Google Scholar] [CrossRef] [PubMed]
  82. Cutter, S.L.; Barnes, L.; Berry, M.; Burton, C.; Evans, E.; Tate, E.; Webb, J. A place-based model for understanding community resilience to natural disasters. Glob. Environ. Chang. 2008, 18, 598–606. [Google Scholar] [CrossRef]
Figure 1. Location map of the study area.
Remotesensing 13 01864 g001
Figure 2. Workflow of the study.
Remotesensing 13 01864 g002
Figure 3. Elevation (a), natural color composite (b), hydrological soil groups (c), and landuse and landcover (d).
Remotesensing 13 01864 g003
Figure 4. CN grid (a), slope (b), rainfall (c), and flood damages (d) in the study area.
Remotesensing 13 01864 g004
Figure 5. Average annual precipitation of Peshawar city from TRMM product.
Remotesensing 13 01864 g005
Figure 6. Annual income (a), population density (b), health facilities (c), and educational facilities (d) in the study area.
Remotesensing 13 01864 g006
Figure 7. Commercial buildings (a), residential buildings (b), and other buildings (c) in the study area.
Remotesensing 13 01864 g007
Figure 8. Economic capacity (a), institutional capacity (b), and education status (c) in the study area.
Remotesensing 13 01864 g008
Figure 9. Analytical hierarchy process (AHP) as a weighting method for the present study.
Remotesensing 13 01864 g009
Figure 10. GIS-based AHP maps; hazard (a), exposure (b), susceptibility (c), and coping capacity (d) of the study area.
Remotesensing 13 01864 g010
Figure 11. Urban flood resilience map of the study area.
Remotesensing 13 01864 g011
Figure 12. Receiver operating characteristic (ROC) curve and area under the curve (AUC) for flood resilience map.
Remotesensing 13 01864 g012
Figure 13. Comparison of urban flood resilience in East and West zones of the study area.
Remotesensing 13 01864 g013
Table 1. Specific characteristics of datasets (primary and secondary data) used in the current research.
S.NoData TypeSourcePeriodMapping Output
1Sentinel 2
(10 m)
United States Geological Survey (USGS) https://www.usgs.gov/centers/eros/science/usgs-eros-archive-sentinel-2 (accessed on 2 March 2021)2020LanduseLandcover (LULC)
2ALOS PALSAR
(DEM)
(12.5 m)
Alaska satellite facility
(ASF)
https://asf.alaska.edu (accessed on 2 March 2021)
2020Slope, Elevation.
3PrecipitationNational Aeronautics and Space Administration (NASA); https://power.larc.nasa.gov/data-access-viewer/ (accessed on 2 March 2021)
https://giovanni.gsfc.nasa.gov (accessed on 2 March 2021)
2020Precipitation intensity map
4Population (Point and statistics)Pakistan Bureau of Statistics
Census
2017Population density map
5Soil DataSoil Conservation Department, Government of Khyber Pakhtunkhwa, Pakistan.2016Curve Number (CN) grid map (soil type and Hydrological soil groups)
6Structured QuestionnaireField survey2–6 November 2020Flood damages mapping, Institutional capacity map, Economic capacity map, Education level
7Health and Educational facilities
(Point and statistics)
Pakistan Bureau of Statistics
and Field visits (District Health and Education Departments)
2017Education buildings and Health facilities
8Commercial buildings, Residential buildings, and other buildings (Government buildings)Filed visits to Planning and Development Department, Government of Khyber Pakhtunkhwa, Pakistan2020Maps for commercial, residential, and other buildings
Table 2. Saaty’s pair-wise comparison scale.
The Intensity of Importance/JudgmentsNumeric Value
Equal importance1
Equal to moderate importance2
Moderate importance3
Moderate to strong importance4
Strong importance5
Strong to very strong importance6
Very strong importance7
Very strong to extremely strong importance8
Extreme importance9
Table 3. Pair-wise comparison matrix of hazard, exposure, susceptibility, and coping capacity 1 (preference matrix).
Hazard (IH)
CriteriaElevationLULCCN GridPrecipitationSlopFlood Damages
Elevation122325
LULC½12336
CN Grid½1/21567
Precipitation1/31/31/5123
Slop½1/31/6½12
Flood Damages1/51/61/71/31/21
Total/Sum of all3.0334.3335.50912.83314.524
Exposure (IE)
CriteriaAnnual IncomePopulation DensityHealth FacilitiesEducational Facilities
Annual Income1396
Population Density1/3135
Health Facilities1/91/312
Educational Facilities1/61/5½1
Total/Sum of all1.6114.53313.514
Susceptibility (IS)
CriteriaResidential BuildingsCommercial BuildingsOther Buildings
Residential Buildings147
Commercial Buildings¼13
Other Buildings1/71/31
Total/Sum of all1.3935.3311
Coping Capacity (ICc)
CriteriaInstitutional CapacityInstitutional CapacityInstitutional Capacity
Institutional Capacity146
Economic Capacity¼12
Education Status1/6½1
Total/Sum of all1.4175.59
1 Each entity’s division by the total sum of their column in the preference matrix gave the normalized matrix (Table 4),where the weights calculated using formulas given as Average = (sum of each row)/6,4,3, and 3, accordingly. Weights used in overlay analysis = (average) × 100.
Table 4. Normalized matrix for hazard, exposure, susceptibility, and coping capacity in the present study.
Hazard (IH)
CriteriaElevationLULCCN GridPrecipitationSlopeFlood DamagesAverageWeights in %
Elevation0.3300.4610.3630.2340.1380.2080.2929
LULC0.1650.2310.3630.2340.2070.250.2424
CN Grid0.1650.1150.1810.3900.4140.2920.2626
Precipitation0.1100.0770.0360.0780.1380.1250.099
Slop0.1650.0770.0300.0310.0690.0830.088
Flood Damages0.0660.0380.0260.0260.0340.0420.044
Exposure (IE)
CriteriaAnnual IncomePopulation DensityHealth FacilitiesEducational FacilitiesWeightsWeights in %
Annual Income0.6210.6620.6610.4290.5959
Population Density0.2070.2200.2220.3570.2525
Health Facilities0.0690.0730.0740.1430.099
Educational Facilities0.1030.0440.0370.0710.066
Susceptibility (IS)
CriteriaResidential BuildingsCommercial BuildingsOther BuildingsAverageWeights in %
Residential Buildings0.7180.750.6360.7070
Commercial Buildings0.1790.1870.2730.2121
Other Buildings0.1030.0630.0910.099
Coping Capacity (ICc)
CriteriaInstitutional CapacityEconomic CapacityEducation StatusAverageWeights in %
Institutional Capacity0.7060.7270.6670.7070
Economic Capacity0.1760.1820.2220.1919
Education Status0.1180.0910.1110.1111
Table 5. Consistency indices for a randomly generated matrix.
Number of Criteria (n)2345678
RI00.520.91.121.241.321.41
Table 6. Calculation of consistency index (CI) for flood hazard, exposure, susceptibility, and coping capacity in the study area.
Hazard (IH)
Column Wise Sum of CriteriaCriteria AverageProduct of Both Columns
3.0330.290.88
4.3330.241.05
5.5190.261.43
12.8330.091.21
14.50.081.12
240.040.93
λmax = 6.62
Exposure (IE)
Column Wise Sum of CriteriaCriteria AverageProduct of Both Columns
1.6110.590.96
4.5330.251.14
13.50.091.21
140.060.90
λmax = 4.21
Susceptibility (IS)
Column Wise Sum of CriteriaCriteria AverageProduct of Both Columns
1.3930.700.98
5.3330.21 11.14
110.070.94
λmax = 3.06
Coping Capacity (ICc)
Column Wise Sum of CriteriaCriteria AverageProduct of Both Columns
1.4170.700.99
5.50.191.06
90.110.96
λmax = 3.01
Table 7. Reclassified layer and its preference value.
ZonesResilience LevelPreference ValueArea in sq.kmArea %Directions
East ZoneVery High0022North-west and West-south
High0.257.348
Medium0.529.2135Central
Low0.7518.321
Very Low13034North and West
Total 86.85100
West ZoneVery High08.2535North-west and Central
High0.252718
Medium0.53926West and East
Low0.7531.3921
Very Low144.3930South and South-west
Total 150.03100
Publisher’s Note: MDPI stays neutral with regard to jurisdictional claims in published maps and institutional affiliations.