Article

Exposure of Loggerhead Sea Turtle Nests to Waves in the Florida Panhandle

1
Marine Turtle Research, Ecology, and Conservation Group, Department of Earth, Ocean and Atmospheric Science, Florida State University, Tallahassee, FL 32306, USA
2
Fish and Wildlife Research Institute, Florida Fish and Wildlife Conservation Commission, Saint Petersburg, FL 33701, USA
3
Department of Earth and Ocean Sciences, University of North Carolina Wilmington, Wilmington, NC 28403, USA
*
Author to whom correspondence should be addressed.
Remote Sens. 2021, 13(14), 2654; https://doi.org/10.3390/rs13142654
Submission received: 6 May 2021 / Revised: 1 July 2021 / Accepted: 1 July 2021 / Published: 6 July 2021
(This article belongs to the Special Issue Remote Sensing Applications for Sea Turtle Conservation)

Abstract

:
Wave wash-over poses a significant threat to sea turtle nests, with sustained exposure to waves potentially resulting in embryonic mortality and altered hatchling locomotor function, size, and sex ratios. Identifying where and under what conditions wave exposure becomes a problem, and deciding what action(s) to take (if any), is a common issue for sea turtle managers. To determine the exposure of sea turtle nests to waves and identify potential impacts to hatchling productivity, we integrated a geographic information system with remote sensing and wave runup modeling across 40 nesting beaches used by the Northern Gulf of Mexico Loggerhead Recovery Unit. Our models indicate that, on average, approximately 50% of the available beach area and 34% of nesting locations per nesting beach face a significant risk of wave exposure, particularly during tropical storms. Field data from beaches in the Florida Panhandle show that 42.3% of all nest locations reported wave exposure, which resulted in a 45% and 46% decline in hatching and emergence success, respectively, relative to their undisturbed counterparts. Historical nesting frequency at each beach and modeled exposure to waves were considered to identify priority locations with high nesting density which either experience low risk of wave exposure, as these are good candidates for protection as refugia for sustained hatchling production, or which have high wave exposure where efforts to reduce impacts are most warranted. Nine beaches in the eastern Florida Panhandle were identified as priority sites for future efforts such as habitat protection or research and development of management strategies. This modeling exercise offers a flexible approach for a threat assessment integration into research and management questions relevant to sea turtle conservation, as well as for other beach species and human uses of the coastal environment.

1. Introduction

Sea turtle embryos require a narrow range of incubation conditions to properly develop [1,2,3,4]. Disrupted osmotic gradients coincident with reduced gas exchange due to inundation of clutches by tides, groundwater, wave exposure, or rainfall can affect hatchling production and fitness [3,5,6,7]. Wave and tide exposure, in addition to causing hypoxia, may alter temperature or salinity within the nest resulting in mortality, reduced locomotor performance, changes in hatchling size, altered hatchling sex ratios [1,3,4,5,8,9], and/or changes to the overlaying beach geomorphology resulting in nest erosion or accretion [10,11,12,13].
To reduce wave exposure and maximize sea turtle nest productivity, nesting females use several environmental cues such as beach slope, tide height, and distance from the water when selecting nesting sites [14,15,16,17,18]. Nesting females will also lay several nests throughout the nesting season in order to minimize the risk of complete reproductive failure [19,20,21]. Despite these environmental cues, wave exposure is a common occurrence, particularly during the hurricane season [22,23,24,25,26]. This exposure may become more frequent over the next several decades as sea level rises and hurricanes became more intense and frequent, threatening hatchling production [9,26,27,28,29,30,31]. Synergistically with implications from climate change, coastal modifications such as back-beach construction and armoring can exacerbate the risk of wave exposure by ultimately reducing the extent of available nesting beach [32,33,34,35,36].
Nest loss and reduction of nesting habitat is of particular concern for small, genetically distinct populations of sea turtles such as the Northern Gulf of Mexico Loggerhead (Caretta caretta) Recovery Unit [37,38,39]. This recovery unit is among the smallest in the United States with several hundred adults, with each individual offspring holding a great conservation value to the population [40,41]. Wave exposure is currently a significant cause of embryonic mortality for this Recovery Unit. From 2002 to 2012, approximately 35% of loggerhead turtle nests from Panama City and Saint George Island, two beaches jointly representing ~20% of the nesting effort for this recovery unit, were estimated to have been lost due to wave erosion [39]. Saint George Island, in particular, is a major nesting beach for this recovery unit [42,43,44]; therefore, losing a significant percentage of nests to wave exposure at this nesting beach may lead to a significant reduction in population-level hatchling production.
While the exact number of nests laid across the recovery unit [41] and the proportion affected by wave exposure vary from year to year [45], mitigating losses at sites with high nesting density and high exposure to waves could lead to significant gains in hatchling production [39,45]. Similarly, preserving nesting beaches with high nesting density and low wave exposure could ensure sustained hatchling production in the face of climatic changes and stressors from coastal development [26,37,43,46]. In either case, nesting sites with high relative nesting density and either high or low relative wave exposure are priority candidates for future conservation initiatives (e.g., preservation of nesting habitat) and research to examine the pros and cons of intervention (such as nest relocation) prior to promoting it as a management strategy.
The identification of nesting beaches that will benefit most from conservation efforts can be aided by geographic information systems coupled with remote sensing data (e.g., LiDAR, aerial imagery, nighttime lighting). This approach has increasingly been used to identify threats to sea turtle nesting beaches and prioritize locations for conservation [26,27,43,47,48,49,50,51,52]. For example, using historical data on wave height and wave period coupled with beach slope and sea turtle nest distribution, a wave runup model can be used to map wave exposure at the nesting beach in an effort to better inform sea turtle nest management [52,53,54,55]. In fact, such approaches may become increasingly relevant as nesting beaches face mounting pressures from sea level rise and coastal development [29,37,43,46,56,57].
Sea turtle managers are often faced with queries on how to assess the risk of wave exposure, to identify nesting beaches with various levels of exposure to this risk, and to determine what management actions to take (if any) to mitigate or prevent it. To inform management of the Florida portion of the Northern Gulf of Mexico Loggerhead Recovery Unit, we investigated the reduction in nest productivity (i.e., hatching and emergence success) associated with reported wave exposure from 2016 to 2019. We then incorporated remote sensing data with wave runup models to quantify the proportion of available nesting habitat and nest GPS locations at risk of wave exposure to identify priority nesting beaches for conservation initiatives. Priority beaches were defined as those beaches that would benefit the population most from preservation or further research to evaluate potential interventions or mitigations strategies in light of impacts from wave exposure.

2. Materials and Methods

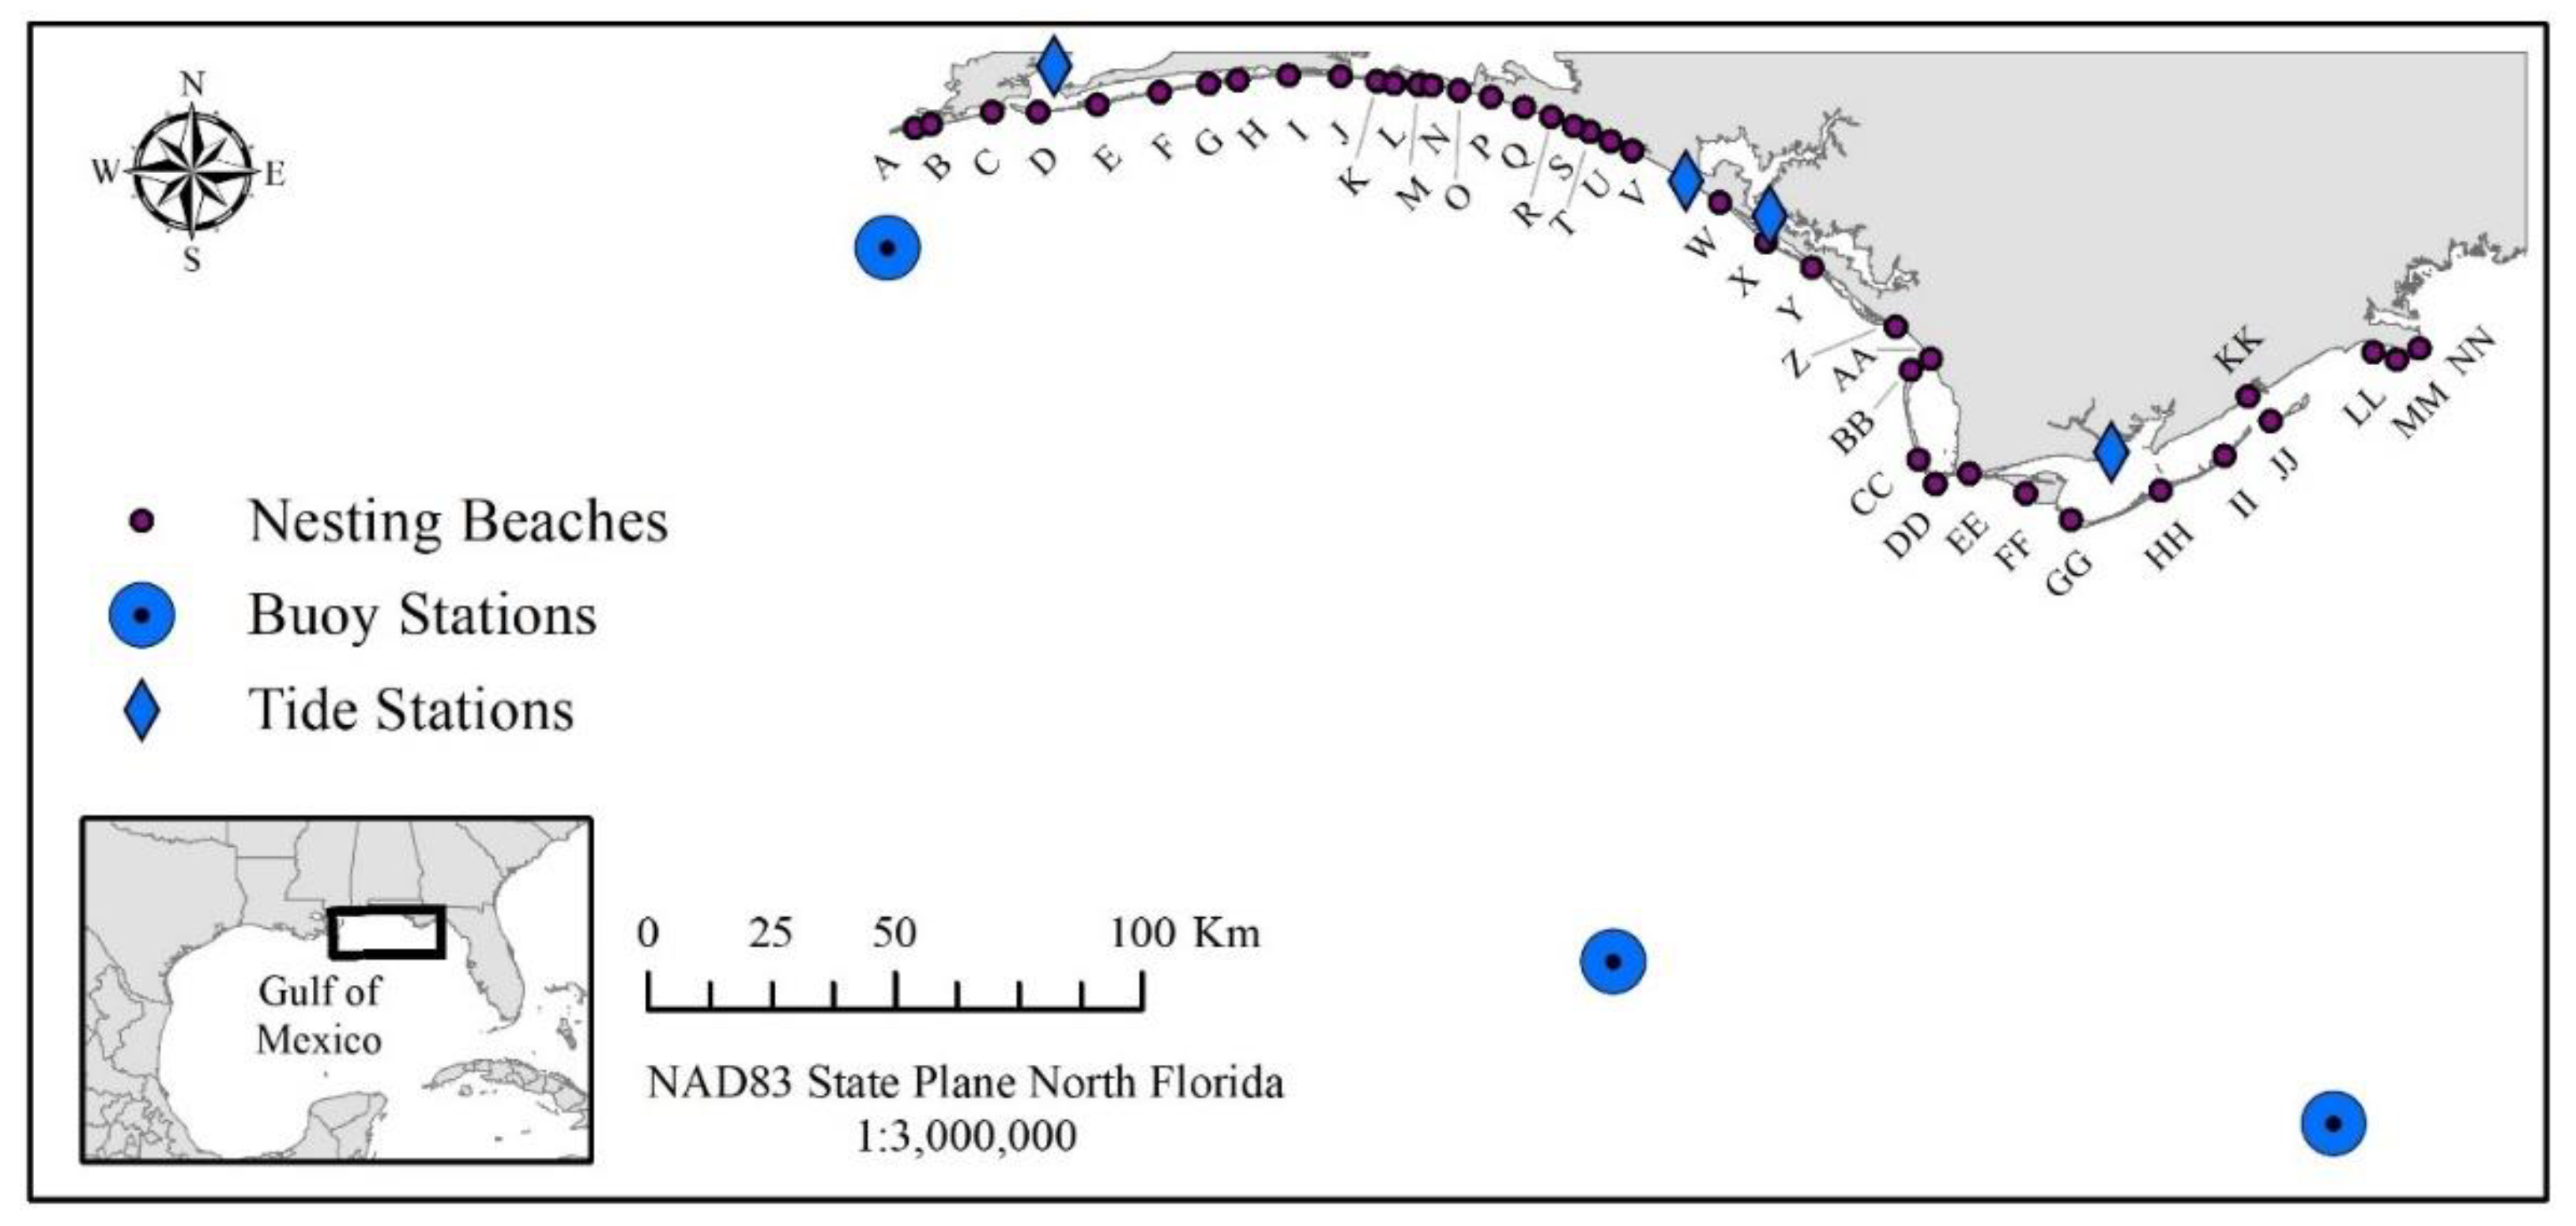
2.1. Study Site, Nest Monitoring, and the Effects of In Situ Wave Exposure

This study was conducted across 40 loggerhead nesting beaches (Table 1) within the Florida portion of the northern Gulf of Mexico, which stretches from the Alabama–Florida state line east to Alligator Point, providing approximately 375 km of nesting beach primarily for loggerhead turtles (Figure 1) but also for green turtles (Chelonia mydas), Kemp’s Ridley turtles (Lepidochelys kempii), and leatherback turtles (Dermochelys coriacea) [43,58]. Our analysis focused on loggerhead nests as they are the dominant nesting species in this region [38]. Loggerhead sea turtles nesting in the Florida Panhandle are part of the Northern Gulf of Mexico Loggerhead Recovery Unit [40,41]. Though this recovery unit stretches west to the U.S.–Mexico border, the majority of loggerhead nesting for this unit is concentrated in the eastern Florida Panhandle [38].
Each nesting beach was patrolled daily from 2016 to 2019 by citizen-science volunteer or professional crews permitted under the Florida Fish and Wildlife Conservation Commission (FWC) during the sea turtle nesting season (1 May through 31 October). The data described below was obtained from the Fish and Wildlife Research Institute (FWRI) of the FWC based on data recorded by the monitoring crews. These patrols record new nesting activity, mark new nests for protection, record disturbances to existing nests (e.g., predation, wave exposure, inundation), and conduct nest productivity assessments (i.e., hatching and emergence success) following procedures detailed by FWC [59,60]. For this study, information for each nest included GPS location, dates laid and hatched, disturbance history, and productivity. GPS locations were typically taken with hand-held units with horizontal accuracies of approximately 5 m, thus we expect our data to fall within this accuracy.
“Wave exposure”, as determined by the monitoring crews, is inclusive of wave wash-over and partial or complete wash-out and constitutes the exposure of the nest’s beach surface to the uprush and rundown of foreshore swash zone motions. A partial wash-out is where erosion of the beach surface causes a fraction of the clutch to be lost whereas a complete wash-out is the total loss of the clutch. These levels of wave exposure can be reported based on (1) the observation of a wet sand line (i.e., previous high tide line) located landward of the nest, (2) deposition or removal of sand or other material (e.g., wrack) from the nest’s surface up to, and including, subaerial exposure of the clutch (i.e., erosion, wash-out), or (3) direct observation of waves, tide, or storm surge interacting with the nest.
“Inundation”—the sustained immersion of the clutch by elevated groundwater, tides, wave setup, or storm surge—was documented at the time of post-hatching nest evaluation (i.e., a clutch is considered inundated if standing water is found at the time of nest evaluation); therefore, the frequency or duration of inundation during incubation is not known. Nests which reported inundation, regardless of previous wave exposure, were not included in the subsequent productivity assessments in order to remove any covariance effects with otherwise undisturbed nests.
Hatching success (i.e., the number of hatched eggs divided by the total number of eggs in the clutch) and emergence success (i.e., the number of unaided emerged hatchlings divided by the total number of eggs, [59,60]) derived from the nest productivity assessments were compared between undisturbed in situ loggerhead nests and those with reported wave wash-over using binomial generalized linear models (GLM). Nests which were relocated, left in situ but disturbed (i.e., predated, invaded by roots, disturbed by another turtle, poached, inundated), or were lacking productivity assessment data were removed from these GLMs to avoid covarying effects. In addition, nests which experienced partial or complete wash-out were not included in these GLMs, regardless of previously reported wash-over, as it was impossible to determine the number of eggs lost.

2.2. Digital Elevation Model and Wave Runup Modeling

Historical LiDAR surveys were used to create a mean digital elevation model (DEM) for each of the study sites, as well as calculate minimum, maximum, and standard deviation DEMs to describe intra- and inter-annual beach variability. An averaged DEM based on historical data was developed to ensure that the tool would be broadly applicable, given that updated DEMs of all nesting beaches may not always be available. Twenty-three surveys covering part or all of the study area were conducted between 1998 and 2018 by the U.S. Geological Survey (USGS), U.S. Army Corps of Engineers (USACE), U.S. National Oceanic and Atmospheric Administration (NOAA), U.S. National Aeronautics and Space Administration (NASA), Florida Department of Emergency Management (FDEM), and Northwest Florida Water Management District (NWFWMD) and made available in the NOAA Data Access Viewer (https://coast.noaa.gov/dataviewer/#/, accessed 28 April 2020, Table S1). Each survey was downloaded with a 3 m grid cell and referenced to the State Plane 1983 Florida North (horizontal) and NAVD88 (vertical) datums. Using R version 4.0.2, these layers were temporally- and spatially-averaged as in [53].
These DEMs were brought into ArcMap 10.6 to identify the available nesting area at each study site. A polygon bounding the individual nesting beaches was defined seaward by the mean lower-low water datum derived from the closest tide gauge (Figure 1) and landward by the dune crest or back-beach construction based on aerial imagery. To calculate beach slope, cross-shore transects between mean high water and the dune base were drawn every 200 m along the study area similar to [61].
To calculate the proportion of the beach area exposed to waves, we compared the available nesting area polygon with an exposure polygon. The exposure polygon was calculated by modeling daily total water level elevations (TWL) along the study region during the 2016 to 2019 nesting seasons. TWL is the sum of tide height, storm surge, and wave runup [55]. Stockdon et al. [55] described a generalized formulation for wave runup which requires beach slope (βf), deep-water wave height (H0), and deep-water wavelength (L0):
R 2 = 1.1 ( 0.35 β f ( H 0 L 0 ) 1 2 + [ H 0 L 0 ( 0.563 β f 2 + 0.004 ) ] 1 2 2 )  
where the first parenthetical term represents wave setup, the time-averaged elevation of the water level at the shoreline due to wave accumulation, and the second term represents swash, the time-varying uprush and rundown of the water level caused by individual waves. Wavelength can be calculated from wave period using linear wave theory [62,63].
Beaches in the Florida Panhandle are south-facing, microtidal dissipative-to-intermediate, and range from densely populated (e.g., Pensacola) to residential (e.g., Saint George Island) to protected (e.g., Saint Joseph Peninsula State Park) [43]. The average cross-shore beach slope is 2.49° (±1.55° SD, 0.043 ± 0.027 radians SD, Table S2). Hourly deep-water wave height and wave period during the nesting season (1 May through 31 October) from 2016 to 2019 along the study area, corresponding to the years of available nesting data, were obtained from the National Data Buoy Center (NDBC) stations #42012 Orange Beach, #42039 Pensacola, and #42036 West Tampa (Figure 1). Median hourly wave height and wave period reported from the three offshore buoys range from 0.70–0.83 m and 5.27–5.65 s, respectively (File S1). This beach slope, wave height, and wave period combination results in a mean Iribarren number ξ0 of 0.337 (±0.247 SD, median = 0.286). Tides in the study area are typically diurnal with an average tidal range between 0.38–0.52 m (File S2); however, Apalachicola exhibits a mixed tide.
Given the dissipative nature of beaches in the Florida Panhandle, wave runup (R2) was calculated following the dissipative-specific formulation of Stockdon et al. [55]:
R 2 = 0.043 ( H 0 L 0 ) 1 2  
with waves observed at the buoys reverse-shoaled to deep water as necessary as in [53].
To evaluate the model’s ability to identify nesting locations exposed to waves, hourly TWL at each nest GPS location during its incubation were calculated using wave and tidal data from the nearest NOAA/NDBC stations (File S3). If the TWL exceeded the DEM elevation at the nest coordinates at any point in time, the nest was marked as washed over. The modeled wave exposure was then compared to reported in situ observations of the nest obtained by monitoring crew (as per Section 2.1) using Chi-squared analyses.

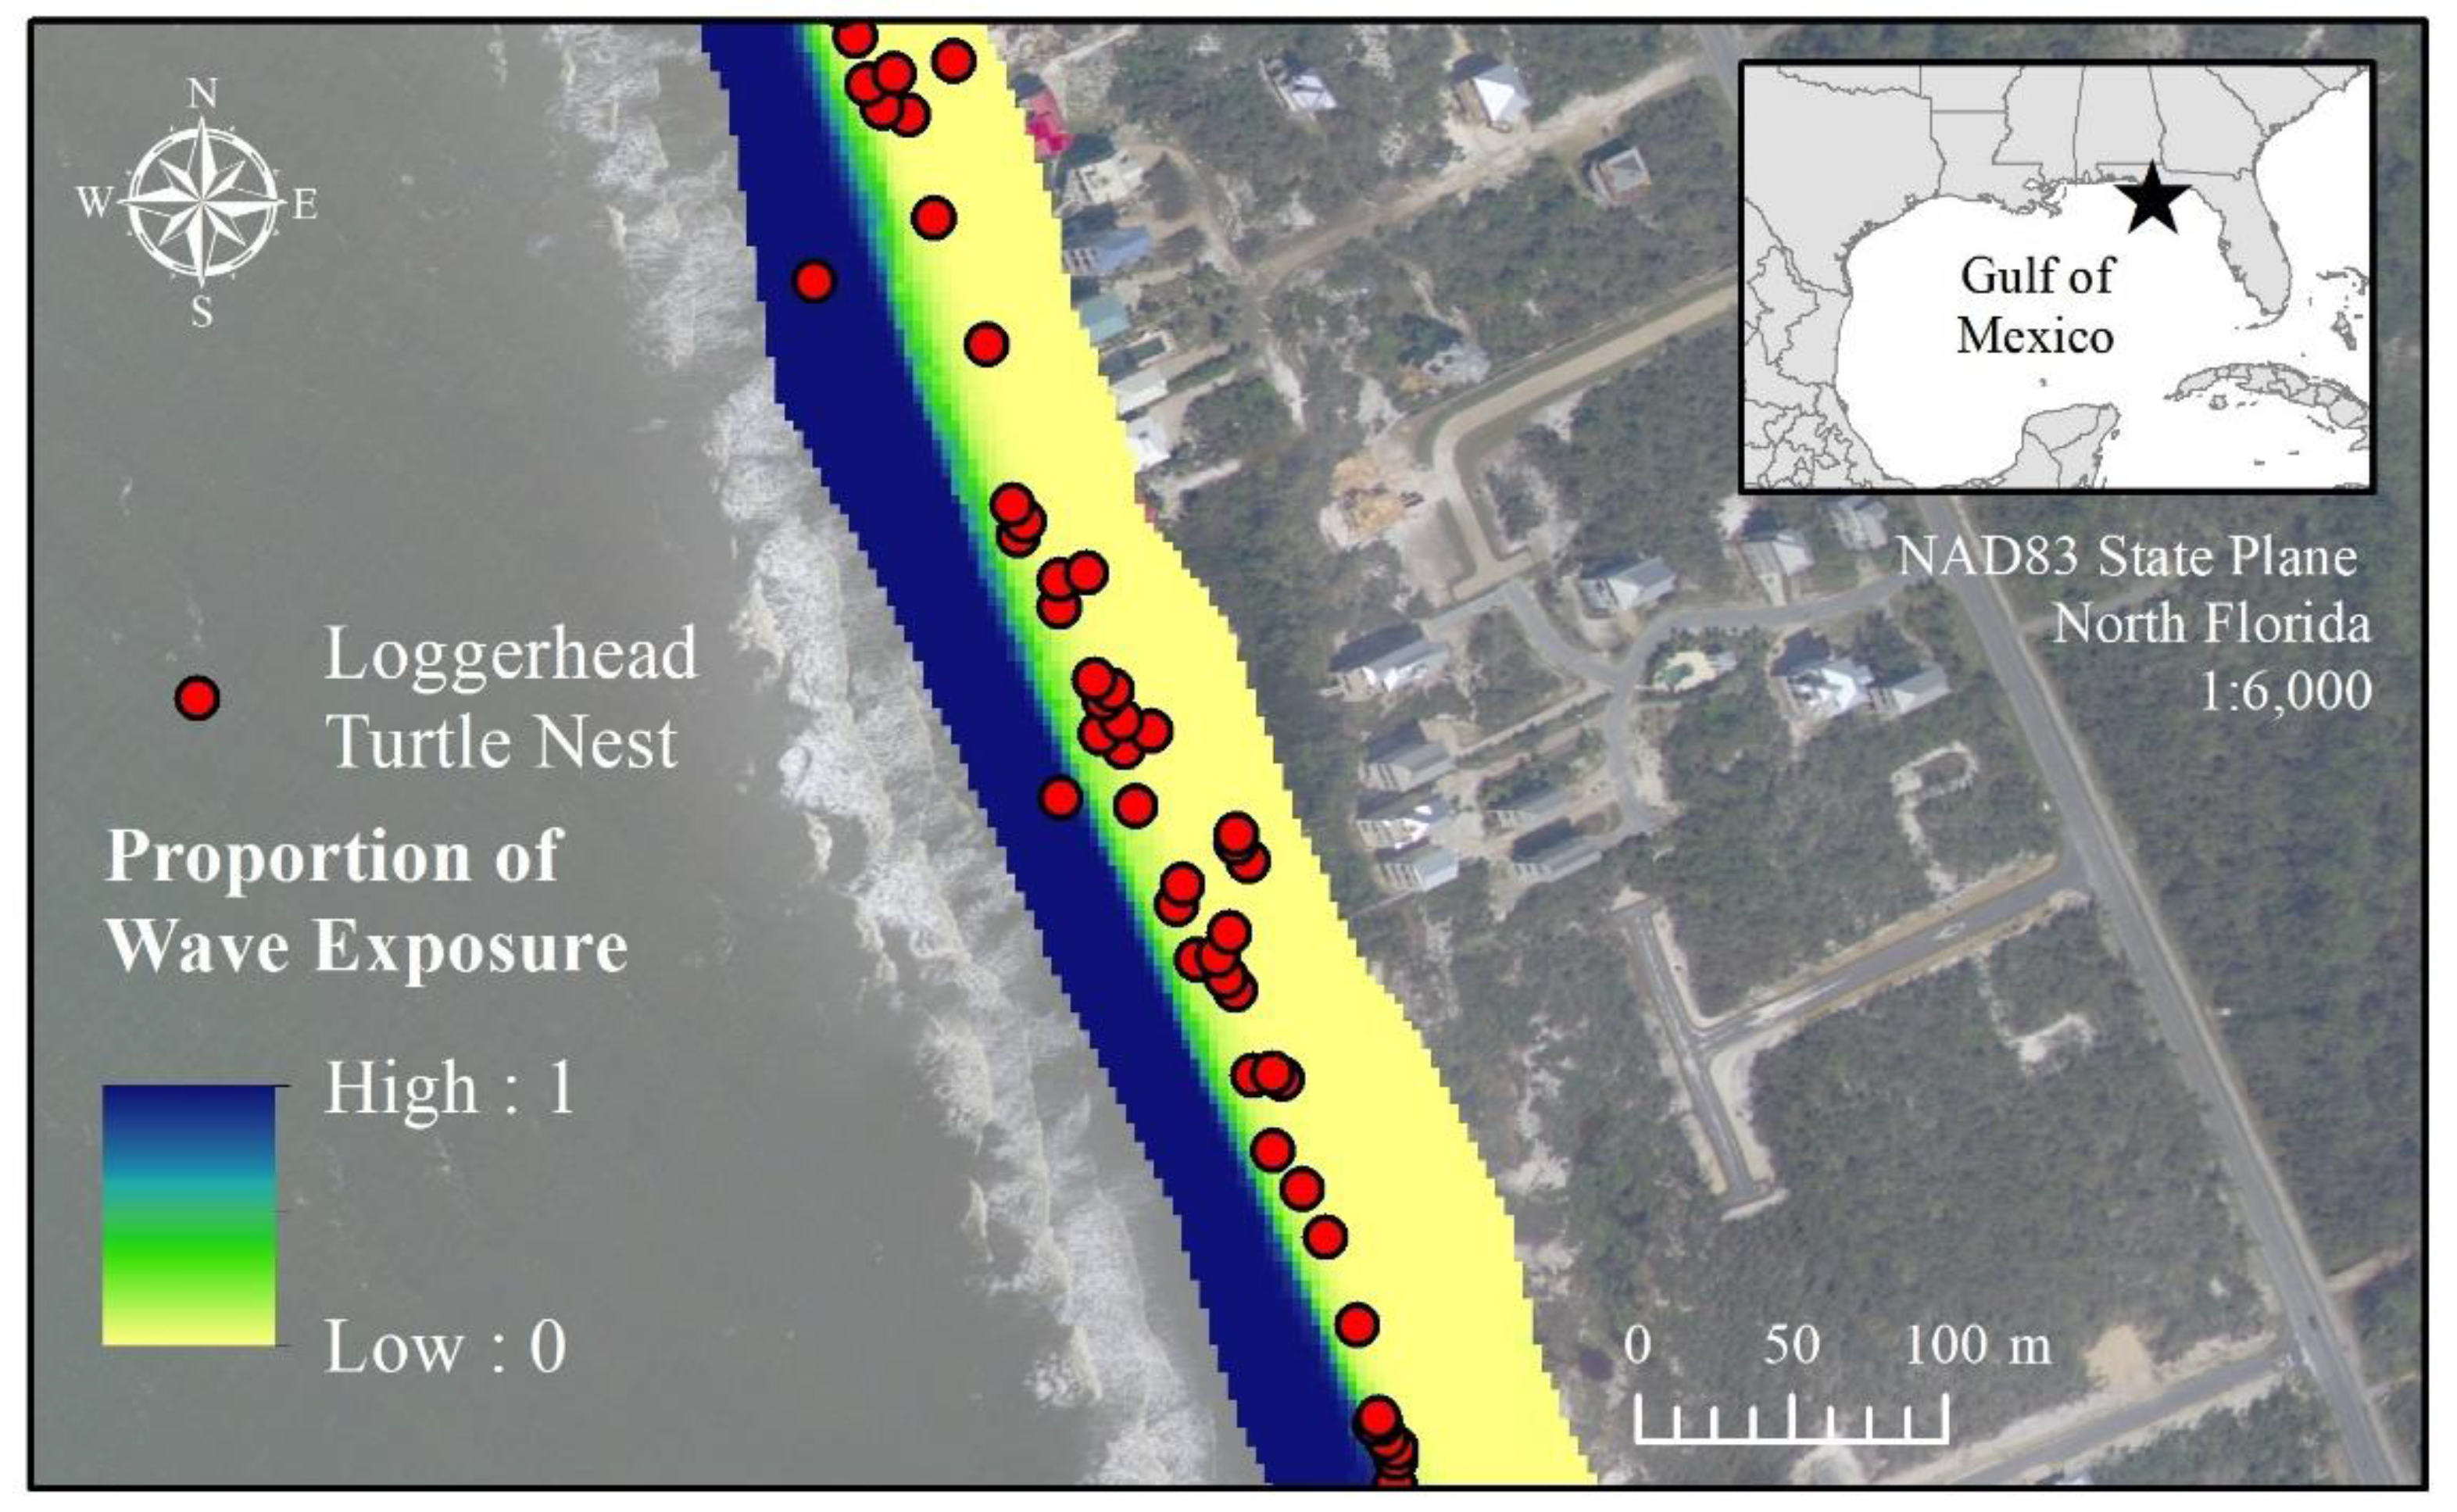
2.3. Extent of Wave Exposure

The spatial extent of wave exposure along each of the nesting beaches was determined by subtracting the elevation at each cell in the averaged DEM from the time series of TWL at that location. If, at any point in time, the TWL at a given cell was greater than the morphological elevation, that cell was considered washed over. To reduce computational demands, hourly wave data were condensed to daily maximum wave height and coincident wave period to calculate daily total water levels. The total wash-over exposure per DEM cell across our study period was determined by summing the modeled daily wash-over events and converting the count to proportions by dividing the wash-over count by the total number of TWL estimates (n = 732 daily TWL estimates from the 2016–2019 nesting seasons, File S3). The exposed cells within each beach were converted to a polygon in ArcMap 10.6. This exposure polygon was then compared to the available nesting area polygon to calculate the proportion of the beach area impacted by wave exposure per nesting beach.

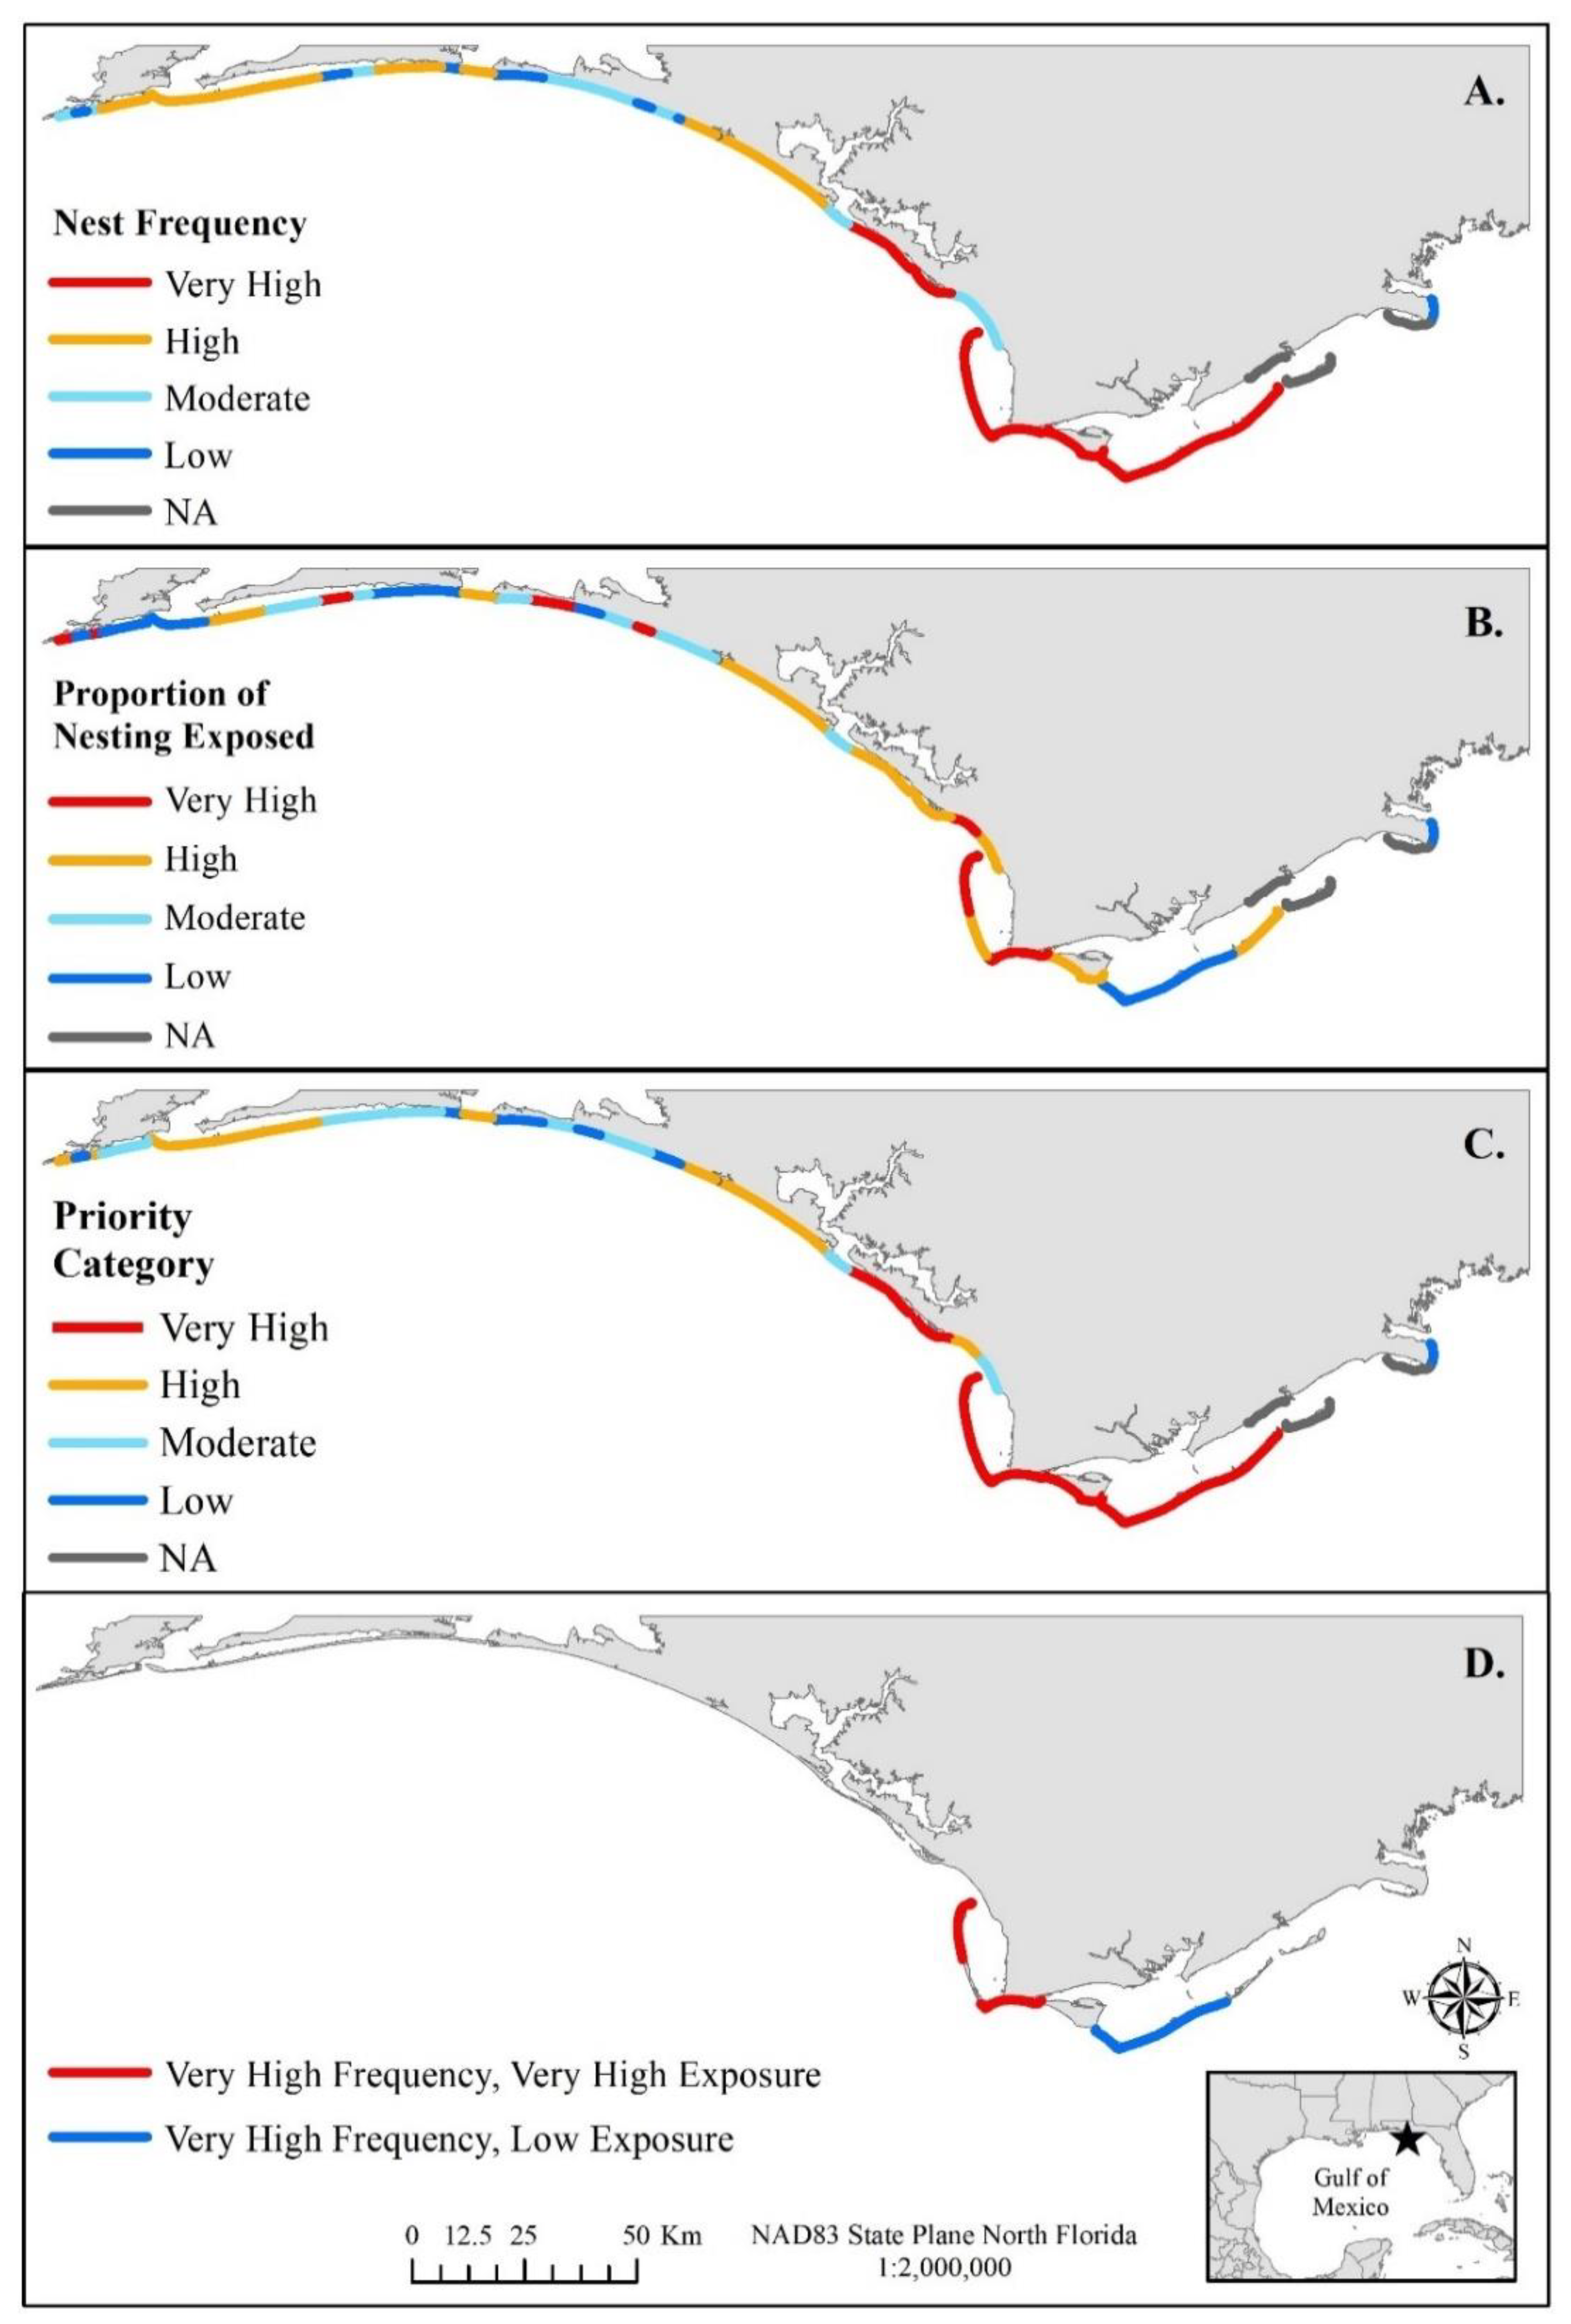
2.4. Identification of Priority Nesting Beaches for Future Efforts Regarding Wave Exposure Impacts

To identify priority nesting beaches for future efforts, both the number of nests laid per nesting beach and the proportion of nesting exposed to wave activity were considered. The proportion of nests within the wave exposure polygon created in Section 2.3 were compared to the total nests laid per nesting beach to calculate the proportion of at-risk nesting locations. Each nesting beach was then ranked by their mean number of nests per year (i.e., nesting frequency) as well as the modeled proportion of exposed nests, similar to [26]. Nest frequencies per beach were categorized by quartiles with beaches in the highest quartile denoted as “very high nesting” and progressing to “high nesting”, “medium nesting”, and “low nesting” with subsequent quartiles. Similarly, the proportion of nests exposed to modeled waves per nesting beach were classified according to quartiles (“very high wave exposure”, “high wave exposure”, “medium wave exposure”, and “low wave exposure”).
The mean number of potentially at-risk nests from wash-over per nesting beach per year was calculated as the product of the nesting frequency and the modeled proportion of exposed nests. Nesting beaches in the 75th percentile or greater for number of potentially at-risk nests were considered “very high priority” and represent locations where future efforts are most warranted to address wave exposure impacts. Beaches in the 50th to 75th percentiles were considered “high priority” while those between the 25th and 50th percentiles were designated “moderate priority”. The remainder were deemed “low priority”. By multiplying nesting frequency and wave exposure to calculate the mean number of potential at-risk nests per year, nesting beach contributions to possible population-level nest productivity impacts could be ranked from largest to smallest.

3. Results

3.1. Loggerhead Turtle Nesting, Nest Productivity, and the Effects of In Situ Wave Wash-Over

Based on the temporally- and spatially averaged DEM, the Florida Panhandle provides a total of 32.6 km2 of nesting area for loggerhead turtles. Available nesting area per nesting beach was highly variable across the study area, ranging from 0.05 km2 at Deer Lake and Camp Helen State Parks up to 3.46 km2 at Tyndall Air Force Base (Table 1). Average nesting frequencies during the 2016 to 2019 nesting seasons were highest in the eastern Florida Panhandle (Figure 2A), with Saint George Island having the highest mean nesting frequency at 372.75 nests yr−1 while Deer Lake State Park had the lowest (1.33 nests yr−1) (Table 1).
From 2016 to 2019, data on 6773 loggerhead turtle nests with GPS coordinates were provided by FWC. Of these nests, 42.3% reported in situ wave exposure. This includes 1665 nests (24.6%) which were washed over but remained in place, 1121 nests (16.6%) which were completed washed out, and 79 nests (1.2%) which experienced only partial wash-out (Table S3, File S4).
After isolating nests which were reportedly either undisturbed or only experienced wave wash-over, 2947 nests were considered to evaluate the effects of wave wash-over on nest productivity. Nests with reported in situ wash-over had a 45.4% lower hatching success and 45.8% lower emergence success relative to undisturbed nests (Table 2, binomial GLM p < 0.001 for both analyses). By comparison, (1) predated nests (n = 721) experienced a 28.2% and 27.5% reduction in hatching and emergence success compared to undisturbed nests, and (2) nests with reported inundation at the time excavation (n = 48) had reductions of 61% in both productivity metrics. Complete wash-outs resulted in no hatchling production while the productivity from partially washed-out nests was impossible to determine without a known clutch size prior to erosion, which was not available for our dataset.

3.2. Modeled Spatial Extent of Wave Exposure

The wave runup model correctly identified the presence or absence of wave wash-over at any point during a given nest’s incubation 89.2% of the time. Chi-squared analyses indicated a statistically significant relationship between modeled and reported in situ wave wash-over (p < 0.001). False positives (i.e., modeled wave wash-over when no wash-over was reported in situ) were common (33.0%), indicating that the model tended to over-identify affected nesting locations.
The majority of wave exposure was concentrated around the narrow beach face and onto the berm crest (i.e., the shore-parallel ridge where the sloped beach face transitions to the flat berm above the swash zone, Figure 3). Nests from 2016 to 2019 exhibited a low average risk of exposure (12.2 ± 24.3% SD, meaning only ~12% of daily TWL estimates from 2016–2019 reached nest GPS locations on average). Nests with reported in situ wave wash-over had significantly higher modeled risk of wave exposure (13.6 ± 25.0%, n = 1665) than non-washed over nests (9.9 ± 21.9%, n = 3908, ANOVA p < 0.001). Nests reported as either partially or completely washed out exhibited still higher modeled risk of wave exposure (25.1 ± 34.4%, n = 79, and 17.3 ± 29.0%, n = 1121, respectively). Despite the low overall risk across the four-year period, storm conditions present during the 2016 to 2019 nesting seasons resulted in modeled wave exposure which impacted a significant percentage of the available nesting area at each nesting beach in the Florida Panhandle (50.4 ± 7.5% SD, range: 36.4–65.9%, Table 3: Proportion Area Exposed). This area encompassed, on average, 34.2% of the nest GPS locations (±17.9% SD, range: 0–77.3%, Figure 2B, Table 3: Proportion Nesting Exposed).

3.3. Identification of Priority Nesting Beaches Based on Exposure to Waves

Nine beaches ranked as “very high” priority for future consideration when considering mean annual nesting frequency and the proportion of nesting locations exposed to modeled wave activity (Table 3: Priority Category, Figure 2C). Each of these nesting beaches were located in the eastern half of the Florida Panhandle and represent 79% of loggerhead nesting in the Florida Panhandle (Table 3: Nest Frequency Category, Figure 2A). The percent of nesting locations during our study exposed to modeled waves was highly variable within these priority beaches—ranging from 14.1% to 77.3%. Three beaches (Saint Joseph Peninsula State Park, Cape San Blas, and Cape San Blas Air Force Base) ranked as “very high” for wave exposure while four beaches ranked “high” and two ranked “low” (Saint George Island and Cape Saint George Island; Table 3: Wave Exposure Category, Figure 2B,D).

4. Discussion

Wave exposure is a significant threat to incubating loggerhead turtle nests in the Florida Panhandle, with approximately 17% of nests laid during our study being completely lost to wave wash-out while another 25% reported in situ wave wash-over at least once during the nest’s incubation resulting in reductions in hatching and emergence successes of 45% and 46%, respectively, compared to their undisturbed counterparts. Such reductions in nest productivity are consistent with values reported from other sea turtle species and nesting locations during wave exposure, inundation, protracted rainfall, or storm activity [4,5,9,39,54,64,65,66,67]. For example, nests exposed to inundation or partial wave wash-out from 2002 to 2009 were reported by Brost et al. [39] to have declines in hatching and emergence success ranging from 28% to 50% for loggerhead turtle nests—and 28% to 43% for green turtle nests—in South Brevard County Beach on Florida’s Atlantic seaboard.
Given the potential impacts from wave exposure, identifying where and under what conditions nests are at increased risk can be a powerful tool for sea turtle conservation [27,53,64]. For example, Osorio et al. [52] created flood maps based on the nearshore hydrodynamic environment to identify safe sea turtle nesting areas on Gorgona Island, Colombia and Ware et al. [53] modeled wave exposure on nesting beaches along the Fort Morgan Peninsula of Alabama, USA. Information from the wave runup modeling conducted here together with nesting frequency data allowed us to identify nine nesting beaches concentrated in the eastern Florida Panhandle where future efforts (e.g., research, habitat preservation, management strategies) may be most effective at addressing wave exposure. From 2016 to 2019, these nine beaches represented 79% of the total loggerhead sea turtle nesting numbers in the region and within these beaches, 430 nest locations (i.e., 25% of total loggerhead nesting in the Panhandle) were potentially at-risk from wave exposure.
Studies such as this one that use remote sensing and modeling approaches within a geographic information system can be used to identify priority locations or conditions which may warrant management actions when considering wave exposure at sea turtle nesting grounds. The wave runup modeling approach used here is customizable to satisfy a range of other research or management questions including risk assessments under current or future environmental conditions [68,69,70,71,72]. Using past nest distributions, projected changes in wave exposure can be mapped to account for projected changes in beach slope (e.g., beach renourishment, coastal armoring), tide height (e.g., sea level rise), and wave energy (e.g., climate change-induced alterations to wave climatology or cyclonic storm intensity) [73,74,75]. The maps can be modified to show wave exposure for a given year, average monthly conditions (using mean values from buoy and tidal station climatologies), or specific storms [76,77,78]. Such ‘snapshots’ can be useful for modeling changes in wave exposure through time, linking the spatiotemporal frequency of sea turtle nests throughout the nesting season to temporal changes in wave climatology or storm frequency, to assess alterations to habitat use patterns in response to wave exposure changes, or studying the effects of a given event on beach geomorphology and ecology [57,79,80,81,82].
However, as presently calculated, the maps are not predictive of future wave exposure but may describe the likelihood of future exposure. Nests falling within current high-exposure areas will likely face a greater risk of wash-over, wash-out, or inundation, assuming future conditions are similar to those of the present. To better inform future risks of wave exposure, historical shoreline change rates should be incorporated into the wave modeling exercise to predict changes in nesting beach availability and potential wave exposure. Importantly, the current wave exposure maps can only identify areas of potential exposure to waves and not the direct result or impact of the exposure.
This leaves several knowledge gaps which need to be addressed before any management action or intervention takes place. These questions include [4,7,9,64,83,84,85,86,87,88,89]:
  • At what frequency or duration of exposure does wave wash-over cause significant harm to a developing sea turtle embryo?
  • Do these exposure thresholds vary with the developmental stage of the embryo?
  • How does this tolerance, or lack thereof, vary across species and populations?
  • What are the benefits on non-lethal levels of wave exposure (e.g., reduced incubating temperature, increased male production, larger body size, faster crawling speeds)?
  • Would relocating the nest introduce other threats which may cause as much or greater impacts than wave exposure in the nest’s current location (e.g., warmer incubating temperature leading to feminization or hyperthermia, reduced sand moisture leading to desiccation, increased predation or disorientation, movement-related mortality)?
Answering these questions was beyond the scope of this study since nests were only reported (1) in a binary washed over/not washed over rather than the number and dates of wash-over events throughout a nest’s incubation, (2) there was no hatchling sex ratio assessment as part of the nest inventory, and (3) nest-to-surf mortality of the emergent hatchlings was not determined.
Any management action taken to address wave exposure would have to be based on the ecological costs and benefits of the considered action, as well as its logistical, regulatory, and/or economic requirements and any additional data requirements necessary to make an informed decision [4,84,85,90]. For example, nest relocation is a commonly suggested management intervention which has shown promise in reducing nest productivity losses due to wave exposure in certain circumstances [91,92,93,94,95,96,97]. However, this intervention may require a significant investment in manpower and equipment which may not be available or reasonable given the nesting beach location, distance to a “safer” incubation site, and number of nests deposited on the original nesting beach [4,84,85,98]. Nest relocation may also cause embryonic mortality during the egg transfer, reduce hatching and emergence success, increase rates of predation, and increase incubation temperatures leading to a highly female-biased hatchling sex ratios or even lethality [85,99,100,101,102]. Determining when nest relocation or any other management action is necessary and closing key knowledge gaps enumerated earlier will be critical to improving sea turtle population resistance and resilience to a myriad of threats including wave exposure [4,45,53,84,85,103].
Different conservation actions might be required depending on the wave exposure conditions and nesting frequency at each beach. Three priority beaches (i.e., Saint Joseph Peninsula State Park, Cape San Blas, and Cape San Blas Air Force Base) fall in the top quartile of both nesting frequency and proportion of nest GPS locations exposed to wave runup. These beaches are prime locations to investigate the previously discussed knowledge gaps related to the need for, and the consequences of, nest management strategies. Similarly, in-depth studies are required to assess relative threats at the particular beach and the ethical and practical implications of an active, interventionist approach to nest management. At the opposite end of the spectrum, two priority beaches (i.e., Saint George Island and Cape Saint George Island) are in the top quartile for nest frequency but the bottom quartile for wave exposure. These beaches may represent refugia for sustained hatchling production, assuming they are otherwise suitable and productive nesting habitat [45,84]. Preserving such beaches should be of importance because it would allow incubating nests to proceed without human interference or unintended consequences resulting from management interventions implemented to reduce negative impact of wave exposure. Considering projected rise in sea level and increase in hurricane frequency and/or intensity over the next several decades, beaches with extensive nesting and low wave exposure may provide resilience to the Northern Gulf of Mexico Loggerhead Recovery Unit as a whole through sustained hatchling production [37,46,86].

5. Conclusions

Through the use of a geographic information system coupled with remote sensing and wave runup modeling, this study outlined the significant threat posed by wave exposure to loggerhead sea turtles nesting in the Florida Panhandle. Nine beaches in the eastern Florida Panhandle were identified as priority sites for future efforts to investigate research, habitat preservation, and management strategies to address wave exposure-related reductions in nest productivity. Few other studies have integrated wave exposure into species management or habitat suitability models, despite the data being widely accessible in some cases. This flexible approach for threat assessment can be readily applied to other sea turtle species or nesting beaches to direct basic biological and ecological questions needed for endangered species management, especially given the potential for model improvements. In addition, wave runup modeling can be used to inform multi-species management including shorebirds, beach mice, and human uses of the coastal system.

Supplementary Materials

The following materials are available online at https://www.mdpi.com/article/10.3390/rs13142654/s1, Table S1: metadata for the 23 LiDAR surveys used to create a temporally- and spatially-averaged digital elevation model of nesting beach in the Florida Panhandle, Table S2: additional data describing the 40 nesting beaches comprising the Florida portion of the Northern Gulf of Mexico Loggerhead Recovery Unit, Table S3: reported wave exposure and nest productivity by nesting beach from 2016 to 2019, File S1: offshore wave height and wave period data summary RMarkdown, File S2: tidal height data summary RMarkdown, File S3: wave runup modeling summary RMarkdown, File S4: turtle data summary RMarkdown. Additional data and analyses could be found at: https://figshare.com/projects/Exposure_of_loggerhead_sea_turtle_nests_to_waves_in_the_Florida_Panhandle/101318.

Author Contributions

Conceptualization, M.W. and M.M.P.B.F.; methodology, M.W., S.A.C. and J.W.L.; data curation, S.A.C. and M.W.; formal analysis, M.W.; writing—original draft preparation, M.W. and M.M.P.B.F.; writing—review and editing, M.W., S.A.C., J.W.L. and M.M.P.B.F., visualization: M.W.; supervision, M.M.P.B.F.; funding acquisition, M.W., S.A.C., J.W.L. and M.M.P.B.F. All authors have read and agreed to the published version of the manuscript.

Funding

This project was funded in whole by a grant awarded from the Sea Turtle Grants Program, Grant Number 20-015R. The Sea Turtle Grants Program is funded from proceeds from the sale of the Florida Sea Turtle License Plate. Learn more at www.helpingseaturtles.org.

Data Availability Statement

Data summaries and methodologies are provided in the Supplemental Material and Appendices. Additional data can be provided upon reasonable request to the corresponding author, notwithstanding applicable permit restrictions.

Acknowledgments

The authors thank all of the dedicated sea turtle beach monitoring volunteers for their hours of hard work in difficult conditions to collect the data used in this project. In addition, gratitude is necessary to the Florida Fish and Wildlife Conservation Commission Fish and Wildlife Research Institute staff, in particular B. Brost, who collated this data.

Conflicts of Interest

The authors declare no conflict of interest. The funders had no role in the design of the study, in the collection, analyses, or interpretation of data, in the writing of the manuscript, or in the decision to publish the results.

References

  1. Bustard, H.R.; Greenham, P. Physical and chemical factors affecting hatching in the green sea turtle, Chelonia mydas (L.). Ecology 1968, 49, 269–276. [Google Scholar] [CrossRef]
  2. Mrosovsky, N.; Yntema, C.L. Temperature dependece of sexual differentiation in sea turtles: Implications for conservation practices. Biol. Conserv. 1980, 18, 271–280. [Google Scholar] [CrossRef]
  3. McGehee, M.A. Effects of moisture on eggs and hatchlings of loggerhead sea turtles (Caretta caretta). Herpetologica 1990, 46, 251–258. [Google Scholar]
  4. Limpus, C.J.; Miller, J.D.; Pfaller, J.B. Flooding-induced mortality of loggerhead sea turtle eggs. Wildl. Res. 2020, 48, 142–151. [Google Scholar] [CrossRef]
  5. Foley, A.M.; Peck, S.A.; Harman, G.R. Effects of sand characteristics and inundation on the hatching success of loggerhead sea turtle (Caretta caretta) clutches on low-relief mangrove islands in southwest Florida. Chelonian Conserv. Biol. 2006, 5, 32–41. [Google Scholar] [CrossRef]
  6. Lolavar, A.; Wyneken, J. Effect of rainfall on loggerhead turtle nest temperatures, sand temperatures and hatchling sex. Endanger. Species Res. 2015, 28, 235–247. [Google Scholar] [CrossRef] [Green Version]
  7. Erb, V.; Lolavar, A.; Wyneken, J. The role of sand moisture in shaping loggerhead sea turtle (Caretta caretta) neonate growth in southeast Florida. Chelonian Conserv. Biol. 2018, 17, 245–251. [Google Scholar] [CrossRef]
  8. Houghton, J.D.R.; Myers, A.E.; Lloyd, C.; King, R.S.; Isaacs, C.; Hays, G.C. Protracted rainfall decreases temperature within leatherback turtle (Dermochelys coriacea) clutches in Grenada, West Indies: Ecological implications for a species displaying temperature dependent sex determination. J. Exp. Mar. Bio. Ecol. 2007, 345, 71–77. [Google Scholar] [CrossRef]
  9. Pike, D.A.; Roznik, E.A.; Bell, I.P. Nest inundation from sea-level rise threatens sea turtle population viability. R. Soc. Open Sci. 2015, 2, 150127. [Google Scholar] [CrossRef] [Green Version]
  10. Darsan, J.; Jehu, A.; Asmath, H.; Singh, A.; Wilson, M. The influence of fluvial dynamics and North Atlantic swells on the beach habitat of leatherback turtles at Grande Riviere Trinidad. J. Environ. Manag. 2016, 180, 111–122. [Google Scholar] [CrossRef]
  11. Sherwood, C.R.; Long, J.W.; Dickhudt, P.J.; Dalyander, P.S.; Thompson, D.M.; Plant, N.G. Inundation of a barrier island (Chandeleur Islands, Louisiana, USA) during a hurricane: Observed water-level gradients and modeled seaward sand transport. J. Geophys. Res. Earth Surf. 2014, 119, 1498–1515. [Google Scholar] [CrossRef] [Green Version]
  12. Yamamoto, K.H.; Anderson, S.J.; Sutton, P.C. Measuring the effects of morphological changes to sea turtle nesting beaches over time with LiDAR data. J. Sea Res. 2015, 104, 9–15. [Google Scholar] [CrossRef]
  13. Rivas, M.L.; Tomillo, P.S.; Diéguez-Uribeondo, J.; Marco, A. Potential effects of dune scarps caused by beach erosion on the nesting behavior of leatherback turtles. Mar. Ecol. Prog. Ser. 2016, 551, 239–248. [Google Scholar] [CrossRef] [Green Version]
  14. Wood, D.W.; Bjorndal, K.A. Relation of temperature, moisture, salinity, and slope to nest site selection in loggerhead sea turtles. Copeia 2000, 1, 119–128. [Google Scholar] [CrossRef] [Green Version]
  15. Ávila-Aguilar, A. Nest site selection of Lepidochelys olivacea (Testudines: Cheloniidae) in the South Pacific region of Costa Rica. Rev. Biol. Trop. 2015, 63, 375–381. [Google Scholar] [CrossRef]
  16. Whitmore, C.P.; Dutton, P.H. Infertility, embryonic mortality and nest-site selection in leatherback and green sea turtles in Suriname. Biol. Conserv. 1985, 34, 251–272. [Google Scholar] [CrossRef]
  17. Horrocks, J.A.; Scott, N.M. Nest site location and nest success in the hawksbill turtle Eretmochelys imbricata in Barbados West Indies. Mar. Ecol. Prog. Ser. 1991, 69, 1–8. [Google Scholar] [CrossRef]
  18. Lamont, M.M.; Houser, C. Spatial distribution of loggerhead turtle (Caretta caretta) emergences along a highly dynamic beach in the northern Gulf of Mexico. J. Exp. Mar. Bio. Ecol. 2014, 453, 98–107. [Google Scholar] [CrossRef]
  19. Pike, D.A.; Stiner, J.C. Fluctuating reproductive output and environmental stochasticity: Do years with more reproducing females result in more offspring? Can. J. Zool. 2007, 85, 737–742. [Google Scholar] [CrossRef]
  20. Kamel, S.J.; Mrosovsky, N. Repeatability of nesting preferences in the hawksbill sea turtle, Eretmochelys imbricata, and their fitness consequences. Anim. Behav. 2005, 70, 819–828. [Google Scholar] [CrossRef]
  21. Eckert, K.L. Environmental unpredictability and leatherback sea turtle (Dermochelys coriacea) nest loss. Herpetologica 1987, 43, 315–323. [Google Scholar]
  22. Lindborg, R.; Neidhardt, E.; Witherington, B.E.; Smith, J.R.; Savage, A. Factors influencing loggerhead (Caretta caretta) and green turtle (Chelonia mydas) reproductive success on a mixed use beach in Florida. Chelonian Conserv. Biol. 2016, 15, 238–248. [Google Scholar] [CrossRef]
  23. Milton, S.L.; Leone-Kabler, S.L.; Schulman, A.A.; Lutz, P.L. Effects of Hurricane Andrew on the sea turtle nesting beaches of south Florida. Bull. Mar. Sci. 1994, 54, 974–981. [Google Scholar]
  24. Fuentes, M.M.P.B.; Bateman, B.L.; Hamann, M. Relationship between tropical cyclones and the distribution of sea turtle nesting grounds. J. Biogeogr. 2011, 38, 1886–1896. [Google Scholar] [CrossRef]
  25. Van Houtan, K.S.; Bass, O.L. Stormy oceans are associated with sea turtle hatching declines. Curr. Biol. 2007, 17, 590–591. [Google Scholar] [CrossRef] [Green Version]
  26. Fuentes, M.M.P.B.; Godfrey, M.H.; Shaver, D.; Ceriani, S.A.; Gredzens, C.; Boettcher, R.; Ingram, D.; Ware, M.; Wildermann, N. Exposure of marine turtle nesting grounds to named storms along the continental USA. Remote Sens. 2019, 11, 2996. [Google Scholar] [CrossRef] [Green Version]
  27. Varela, M.R.; Patrício, A.R.; Anderson, K.; Broderick, A.C.; DeBell, L.; Hawkes, L.A.; Tilley, D.; Snape, R.T.E.; Westoby, M.J.; Godley, B.J. Assessing climate change associated sea level rise impacts on sea turtle nesting beaches using drones, photogrammetry and a novel GPS system. Glob. Chang. Biol. 2018, 25, 753–762. [Google Scholar] [CrossRef] [PubMed]
  28. Fish, M.R.; Côté, I.M.; Gill, J.A.; Jones, A.P.; Renshoff, S.; Watkinson, A.R. Predicting the impact of sea-level rise on Caribbean sea turtle nesting habitat. Conserv. Biol. 2005, 19, 482–491. [Google Scholar] [CrossRef]
  29. Ranasinghe, R. Assessing climate change impacts on open sandy coasts: A review. Earth-Science Rev. 2016, 160, 320–332. [Google Scholar] [CrossRef] [Green Version]
  30. Bacmeister, J.T.; Reed, K.A.; Hannay, C.; Lawrence, P.; Bates, S.; Truesdale, J.E.; Rosenbloom, N.; Levy, M. Projected changes in tropical cyclone activity under future warming scenarios using a high-resolution climate model. Clim. Chang. 2018, 146, 547–560. [Google Scholar] [CrossRef]
  31. Fuentes, M.M.P.B.; Abbs, D. Effects of projected changes in tropical cyclone frequency on sea turtles. Mar. Ecol. Prog. Ser. 2010, 412, 283–292. [Google Scholar] [CrossRef]
  32. Dugan, J.E.; Hubbard, D.M.; Rodil, I.F.; Revell, D.L.; Schroeter, S. Ecological effects of coastal armoring on sandy beaches. Mar. Ecol. 2008, 29, 160–170. [Google Scholar] [CrossRef]
  33. Defeo, O.; McLachlan, A.; Schoeman, D.S.; Schlacher, T.A.; Dugan, J.E.; Jones, A.R.; Lastra, M.; Scapini, F. Threats to sandy beach ecosystems: A review. Estuar. Coast. Shelf Sci. 2009, 81, 1–12. [Google Scholar] [CrossRef]
  34. Nelson Sella, K.A.; Fuentes, M.M.P.B. Exposure of marine turtle nesting grounds to coastal modifications: Implications for management. Ocean Coast. Manag. 2019, 169, 182–190. [Google Scholar] [CrossRef]
  35. Mazaris, A.D.; Matsinos, Y.G.; Pantis, J.D. Evaluating the impacts of coastal squeeze on sea turtle nesting. Ocean Coast. Manag. 2009, 52, 139–145. [Google Scholar] [CrossRef]
  36. Rizkalla, C.E.; Savage, A. Impact of seawalls on loggerhead sea turtle (Caretta caretta) nesting and hatching success. J. Coast. Res. 2011, 27, 166–173. [Google Scholar] [CrossRef]
  37. Fuentes, M.M.P.B.; Allstadt, A.J.; Ceriani, S.A.; Godfrey, M.H.; Gredzens, C.; Helmers, D.; Ingram, D.; Pate, M.; Radeloff, V.C.; Shaver, D.J.; et al. Potential adaptability of marine turtles to climate change may be hindered by coastal development in the USA. Reg. Environ. Chang. 2020, 20, 104. [Google Scholar] [CrossRef]
  38. National Marine Fisheries Service; U. S. Fish and Wildlife Service. Recovery Plan for the Northwest Atlantic Population of the Loggerhead Sea Turtle (Caretta Caretta), 2nd revision; Silver Spring: Montgomery, MD, USA, 2008. [Google Scholar]
  39. Brost, B.; Witherington, B.E.; Meylan, A.B.; Leone, E.; Ehrhart, L.M.; Bagley, D.A. Sea turtle hatchling production from Florida (USA) beaches, 2002–2012, with recommendations for analyzing hatching success. Endanger. Species Res. 2015, 27, 53–68. [Google Scholar] [CrossRef] [Green Version]
  40. Richards, P.M.; Epperly, S.P.; Heppell, S.S.; King, R.T.; Sasso, C.R.; Moncada, F.; Nodarse, G.; Shaver, D.J.; Medina, Y.; Zurita, J.C. Sea turtle population estimates incorporating uncertainty: A new approach applied to western North Atlantic loggerheads Caretta caretta. Endanger. Species Res. 2011, 15, 151–158. [Google Scholar] [CrossRef]
  41. Ceriani, S.A.; Casale, P.; Brost, M.; Leone, E.H.; Witherington, B.E. Conservation implications of sea turtle nesting trends: Elusive recovery of a globally important loggerhead population. Ecosphere 2019, 10, e02936. [Google Scholar] [CrossRef] [Green Version]
  42. Drobes, E.M.; Ware, M.; Beckwith, V.K.; Fuentes, M.M.P.B. Beach Crabbing as a Possible Hindrance to Loggerhead Marine Turtle Nesting Success. Mar. Turt. Newsl. 2019, 159, 1–4. [Google Scholar]
  43. Fuentes, M.M.P.B.; Gredzens, C.; Bateman, B.L.; Boettcher, R.; Ceriani, S.A.; Godfrey, M.H.; Helmers, D.; Ingram, D.K.; Kamrowski, R.L.; Pate, M.; et al. Conservation hotspots for marine turtle nesting in the United States based on coastal development. Ecol. Appl. 2016, 26, 2706–2717. [Google Scholar] [CrossRef]
  44. Garrison, S.R.; Fuentes, M.M.P.B. Marine debris at nesting grounds used by the Northern Gulf of Mexico loggerhead recovery unit. Mar. Pollut. Bull. 2019, 139, 59–64. [Google Scholar] [CrossRef]
  45. Silver-Gorges, I.; Ceriani, S.A.; Ware, M.; Lamb, M.; Lamont, M.M.; Becker, J.; Carthy, R.R.; Matechik, C.; Mitchell, J.; Pruner, R.; et al. Using systems thinking to inform management of imperiled species: A case study with sea turtles. Biol. Conserv. 2021, 260, 109201. [Google Scholar] [CrossRef]
  46. Katselidis, K.A.; Schofield, G.; Stamou, G.; Dimopoulos, P.; Pantis, J.D. Employing sea-level rise scenarios to strategically select sea turtle nesting habitat important for long-term management at a temperate breeding area. J. Exp. Mar. Bio. Ecol. 2014, 450, 47–54. [Google Scholar] [CrossRef]
  47. Weishampel, Z.A.; Cheng, W.-H.; Weishampel, J.F. Sea turtle nesting patterns in Florida vis-à-vis satellite-derived measures of artificial lighting. Remote Sens. Ecol. Conserv. 2016, 2, 59–72. [Google Scholar] [CrossRef]
  48. Yamamoto, K.H.; Powell, R.L.; Anderson, S.; Sutton, P.C. Using LiDAR to quantify topographic and bathymetric details for sea turtle nesting beaches in Florida. Remote Sens. Environ. 2012, 125, 125–133. [Google Scholar] [CrossRef]
  49. Casale, P.; Ceriani, S.A. Satellite surveys: A novel approach for assessing sea turtle nesting activity and distribution. Mar. Biol. 2019, 166, 47. [Google Scholar] [CrossRef]
  50. Gonçalves, J.A.; Henriques, R. UAV photogrammetry for topographic monitoring of coastal areas. ISPRS J. Photogramm. Remote Sens. 2015, 104, 101–111. [Google Scholar] [CrossRef]
  51. Calvillo García, Y.; Ramírez-Herrera, M.T.; Delgado-Trejo, C.; Legorreta-Paulin, G.; Corona, N. Modeling sea-level change, inundation scenarios, and their effect on the Colola Beach Reserve—A nesting-habitat of the black sea turtle, Michoacán, Mexico. Geofis. Int. 2015, 54, 179–190. [Google Scholar]
  52. Osorio, A.F.A.; Peláez-Zapata, D.S.; Guerrero-Gallego, J.; Álvarez-Silva, O.; Osorio-Cano, J.D.; Toro, F.M.; Giraldo, A. Hydrodynamics applied to the management and conservation of marine and coastal ecosystems: Gorgona Island, Colombian Pacific Ocean. Rev. Biol. Trop. 2014, 62, 133–147. [Google Scholar]
  53. Ware, M.; Long, J.W.; Fuentes, M.M.P.B. Using wave runup modeling to inform coastal species management: An example application for sea turtle nest relocation. Ocean Coast. Manag. 2019, 173, 17–25. [Google Scholar] [CrossRef]
  54. Ware, M.; Fuentes, M.M.P.B. Assessment of Inundation Threat to Sea Turtle Nests to Improve Management Practices in Alabama; Florida State University: Tallahassee, FL, USA, 2018. [Google Scholar]
  55. Stockdon, H.F.; Holman, R.A.; Howd, P.A.; Sallenger, A.H. Empirical parameterization of setup, swash, and runup. Coast. Eng. 2006, 53, 573–588. [Google Scholar] [CrossRef]
  56. Nelson Sella, K.A.; Sicius, L.; Fuentes, M.M.P.B. Using expert elicitation to determine the relative impact of coastal modifications on marine turtle nesting grounds. Coast. Manag. 2019, 47, 492–506. [Google Scholar] [CrossRef]
  57. Passeri, D.L.; Dalyander, P.S.; Long, J.W.; Mickey, R.C.; Jenkins, R.L.; Thompson, D.M.; Plant, N.G.; Godsey, E.S.; Gonzalez, V.M. The roles of storminess and sea level rise in decadal barrier island evolution. Geophys. Res. Lett. 2020, 47, e2020GL089370. [Google Scholar] [CrossRef]
  58. National Marine Fisheries Service; U.S. Fish and Wildlife Service; Mexican Secretariat of Environmental and Natural Resources. Bi-National Recovery Plan for the KEMP’S Ridley Sea Turtle (Lepidochelys kempii); 2nd revision; Silver Spring: Montgomery, MD, USA, 2011. [Google Scholar]
  59. Florida Fish and Wildlife Conservation Commission Marine Turtle Conservation Handbook; Florida Fish and Wildlife Conservation Commission: Tallahassee, FL, USA, 2016.
  60. Ceriani, S.A.; Brost, B.; Meylan, A.B.; Meylan, P.A.; Casale, P. Bias in sea turtle productivity estimates: Error and factors involved. Mar. Biol. 2021, 168, 41. [Google Scholar] [CrossRef]
  61. Doran, K.S.; Long, J.W.; Overbeck, J.R. A Method for Determining Average Beach Slope and Beach Slope Variability for U.S. Sandy Coastlines; U.S. Geological Survey: Reston, VA, USA, 2015. [Google Scholar]
  62. Colling, A.; Park, D.; Wright, J. Waves, Tides, and Shallow-Water Processes; Butterworth Heinemann: Oxford, UK, 1999. [Google Scholar]
  63. Sorensen, R.M. Two-dimensional wave equations and wave Characteristics. In Basic Coastal Engineering; Springer: Boston, MA, USA, 2006; pp. 9–52. ISBN 9780387233338. [Google Scholar]
  64. Caut, S.; Guirlet, E.; Girondot, M. Effect of tidal overwash on the embryonic development of leatherback turtles in French Guiana. Mar. Environ. Res. 2010, 69, 254–261. [Google Scholar] [CrossRef] [PubMed] [Green Version]
  65. Ware, M.; Fuentes, M.M.P.B. A comparison of methods used to monitor groundwater inundation of sea turtle nests. J. Exp. Mar. Bio. Ecol. 2018, 503, 1–7. [Google Scholar] [CrossRef]
  66. Kraemer, J.E.; Bell, R. Rain-induced mortality of eggs and hatchlings of loggerhead sea turtles (Caretta caretta) on the Georgia coast. Herpetologica 1980, 36, 72–77. [Google Scholar]
  67. Matsuzawa, Y.; Sato, K.; Sakamoto, W.; Bjorndal, K.A. Seasonal fluctuations in sand temperature: Effects on the incubation period and mortality of loggerhead sea turtle (Caretta caretta) pre-emergent hatchlings in Minabe, Japan. Mar. Biol. 2002, 140, 639–646. [Google Scholar]
  68. Rangel-Buitrago, N.; Neal, W.J.; de Jonge, V.N. Risk assessment as tool for coastal erosion management. Ocean Coast. Manag. 2020, 186, 105099. [Google Scholar] [CrossRef]
  69. Fernández-Montblanc, T.; Duo, E.; Ciavola, P. Dune reconstruction and revegetation as a potential measure to decrease coastal erosion and flooding under extreme storm conditions. Ocean Coast. Manag. 2020, 188, 105075. [Google Scholar] [CrossRef]
  70. Sahin, O.; Stewart, R.A.; Faivre, G.; Ware, D.; Tomlinson, R.; Mackey, B. Spatial Bayesian network for predicting sea level rise induced coastal erosion in a small Pacific Island. J. Environ. Manag. 2019, 238, 341–351. [Google Scholar] [CrossRef]
  71. Wahl, T.; Plant, N.G.; Long, J.W. Probabilistic assessment of erosion and flooding risk in the northern Gulf of Mexico. J. Geophys. Res. Ocean. 2016, 121, 3029–3043. [Google Scholar] [CrossRef] [Green Version]
  72. Aretxabaleta, A.L.; Doran, K.S.; Long, J.W.; Erikson, L.H.; Storlazzi, C.D. Toward a national coastal hazard forecast of total water levels. In Proceedings of the Coastal Sediments 2019: Proceedings of the 9th International Conference, Tampa/St. Petersburg, FL, USA, 27–31 May 2019; Wang, P., Rosati, J.D., Vallee, M., Eds.; World Scientific: Tampa/St. Petersburg, FL, USA, 2019; pp. 1373–1384. [Google Scholar]
  73. Mickey, R.; Long, J.; Dalyander, P.S.; Plant, N.; Thompson, D. A framework for modeling scenario-based barrier island storm impacts. Coast. Eng. 2018, 138, 98–112. [Google Scholar] [CrossRef]
  74. Splinter, K.D.; Kearney, E.T.; Turner, I.L. Drivers of alongshore variable dune erosion during a storm event: Observations and modelling. Coast. Eng. 2018, 131, 31–41. [Google Scholar] [CrossRef]
  75. Gallien, T.W.; Sanders, B.F.; Flick, R.E. Urban coastal flood prediction: Integrating wave overtopping, flood defenses and drainage. Coast. Eng. 2014, 91, 18–28. [Google Scholar] [CrossRef]
  76. Dissanayake, P.; Brown, J.; Wisse, P.; Karunarathna, H. Comparison of storm cluster vs isolated event impacts on beach/dune morphodynamics. Estuar. Coast. Shelf Sci. 2015, 164, 301–312. [Google Scholar] [CrossRef] [Green Version]
  77. Cohn, N.; Ruggiero, P. The influence of seasonal to interannual nearshore profile variability on extreme water levels: Modeling wave runup on dissipative beaches. Coast. Eng. 2015, 115, 79–92. [Google Scholar] [CrossRef]
  78. Gieder, K.D.; Karpanty, S.M.; Fraser, J.D.; Catlin, D.H.; Gutierrez, B.T.; Plant, N.G.; Turecek, A.M.; Robert Thieler, E. A Bayesian network approach to predicting nest presence of the federally-threatened piping plover (Charadrius melodus) using barrier island features. Ecol. Modell. 2014, 276, 38–50. [Google Scholar] [CrossRef] [Green Version]
  79. Plant, N.G.; Stockdon, H.F. Probabilistic prediction of barrier-island response to hurricanes. J. Geophys. Res. Earth Surf. 2012, 117, 1–17. [Google Scholar] [CrossRef]
  80. Murdukhayeva, A.; August, P.; Bradley, M.; LaBash, C.; Shaw, N. Assessment of inundation risk from sea level rise and storm surge in northeastern coastal national parks. J. Coast. Res. 2013, 29, 1–16. [Google Scholar] [CrossRef]
  81. Bacino, G.L.; Dragani, W.C.; Codignotto, J.O. Changes in wave climate and its impact on the coastal erosion in Samborombon Bay, Rio de la Plata estuary, Argentina. Estuar. Coast. Shelf Sci. 2019, 219, 71–80. [Google Scholar] [CrossRef]
  82. Khoury, A.; Jarno, A.; Marin, F. Experimental study of runup for sandy beaches under waves and tide. Coast. Eng. 2019, 144, 33–46. [Google Scholar] [CrossRef]
  83. Pike, D.A. The benefits of nest relocation extend far beyond recruitment: A rejoinder to Mrosovsky. Environ. Manag. 2008, 41, 461–464. [Google Scholar] [CrossRef]
  84. Patrício, A.R.; Hawkes, L.A.; Monsinjon, J.; Godley, B.J.; Fuentes, M.M.P.B. Climate change and marine turtles: Recent advances and future directions. Endanger. Species Res. 2021, in press. [Google Scholar] [CrossRef]
  85. Ware, M.; Fuentes, M.M.P.B. Potential for relocation to alter the incubation environment and productivity of sea turtle nests in the northern Gulf of Mexico. Chelonian Conserv. Biol. 2018, 17, 252–262. [Google Scholar] [CrossRef]
  86. Patrício, A.R.; Varela, M.R.; Barbosa, C.; Broderick, A.C.; Catry, P.; Hawkes, L.A.; Regalla, A.; Godley, B.J. Climate change resilience of a globally important sea turtle nesting population. Glob. Chang. Biol. 2019, 25, 522–535. [Google Scholar] [CrossRef] [PubMed]
  87. Sonmez, B.; Ozdilek, S.Y. Conservation technique of the green turtle (Chelonia mydas L. 1758) nests under the risk of tidal inundation with hatcheries, on Samandag Beach, Turkey. Russ. J. Herpetol. 2013, 20, 19–26. [Google Scholar]
  88. Mrosovsky, N. Distorting gene pools by conservation: Assessing the case of doomed turtle eggs. Environ. Manag. 2006, 38, 523–531. [Google Scholar] [CrossRef]
  89. Mrosovsky, N. Against oversimplifying the issues on relocating turtle eggs. Environ. Manag. 2008, 41, 465–467. [Google Scholar] [CrossRef]
  90. Fuentes, M.M.P.B.; Fish, M.R.; Maynard, J.A. Management strategies to mitigate the impacts of climate change on sea turtle’s terrestrial reproductive phase. Mitig. Adapt. Strateg. Glob. Chang. 2012, 17, 51–63. [Google Scholar] [CrossRef]
  91. Boulon, R.H. Reducing threats to eggs and hatchlings: In situ protection. In Research and Management Techniques for the Conservation of Sea Turtles; Eckert, K.L., Bjorndal, K.A., Abreu-Grobois, F.A., Donnelly, M., Eds.; IUCN/SSC Marine Turtle Specialist Group Publication 4: Washington, DC, USA, 1999; pp. 169–174. [Google Scholar]
  92. Abella, E.; Marco, A.; Lopez-Jurado, L.F. Success of delayed translocation of loggerhead turtle nests. J. Wildl. Manag. 2007, 71, 2290. [Google Scholar] [CrossRef] [Green Version]
  93. McElroy, M.L.; Dodd, M.G.; Castleberry, S.B. Effects of common loggerhead sea turtle nest management methods on hatching and emergence success at Sapelo Island, Georgia, USA. Chelonian Conserv. Biol. 2015, 14, 49–55. [Google Scholar] [CrossRef]
  94. Ahles, N.M.; Milton, S.L. Mid-incubation relocation and embryonic survival in loggerhead sea turtle eggs. J. Wildl. Manag. 2016, 80, 430–437. [Google Scholar] [CrossRef]
  95. Tuttle, J.; Rostal, D.C. Effects of nest relocation on nest temperature and embryonic development of loggerhead sea turtles (Caretta caretta). Chelonian Conserv. Biol. 2010, 9, 1–7. [Google Scholar] [CrossRef]
  96. Hopkins-Murphy, S.R.; Seithel, J.S. Documenting the value of volunteer effort for sea turtle conservation in South Carolina. Chelonian Conserv. Biol. 2005, 4, 930–934. [Google Scholar]
  97. Eckert, K.L.; Eckert, S.A. Embryo mortality and hatch success in in situ and translocated leatherback sea turtle Dermochelys coriacea eggs. Biol. Conserv. 1990, 53, 37–46. [Google Scholar] [CrossRef]
  98. Pfaller, J.B.; Limpus, C.J.; Bjorndal, K.A. Nest-site selection in individual loggerhead turtles and consequences for doomed-egg relocation. Conserv. Biol. 2009, 23, 72–80. [Google Scholar] [CrossRef] [PubMed]
  99. Limpus, C.J.; Baker, V.; Miller, J.D. Movement induced mortality of loggerhead eggs. Herpetologica 1979, 35, 335–338. [Google Scholar]
  100. Parmenter, C.J. Incubation of the eggs of the green sea turtle, Chelonia mydas, in Torres Straight, Australia: The effect of movement on hatchability. Aust. Wildl. Res. 1980, 7, 487–491. [Google Scholar] [CrossRef]
  101. Grand, J.; Beissinger, S.R. When relocation of loggerhead sea turtle (Caretta caretta) nests becomes a useful strategy. J. Herpetol. 1997, 31, 428–434. [Google Scholar] [CrossRef]
  102. Fowler, L.E. Hatching success and nest predation in the green sea turtle, Chelonia mydas, at Tortuguero, Costa Rica. Ecology 1979, 60, 946–955. [Google Scholar] [CrossRef]
  103. Abella-Perez, E.; Marco, A.; Martins, S.; Hawkes, L.A. Is this what a climate change-resilient population of marine turtles looks like? Biol. Conserv. 2016, 193, 124–132. [Google Scholar] [CrossRef]
Figure 1. The Florida portion of the Northern Gulf of Mexico Loggerhead Recovery Unit, showing our study sites (A–NN). Data sourced from the Florida Fish and Wildlife Conservation Commission Statewide Atlas of Sea Turtle Nesting Occurrence and Density. From west to east: A: Perdido Key, B: Perdido Key State Park, C: Gulf Islands National Seashore (GINS)—Perdido Key, D: GINS—Fort Pickens, E: Pensacola Beach, F: GINS—Santa Rosa, G: Navarre Beach, H: Eglin Air Force Base (AFB), I: Eglin AFB West, J: Okaloosa West, K: Eglin AFB East, L: Okaloosa Mid, M: Henderson Beach State Park (SP), N: Okaloosa East, O: Miramar Beach, P: Topsail Hill State Park, Q: Walton West, R: Grayton Beach SP, S: Walton Mid, T: Deer Lake SP, U: Walton East, V: Camp Helen SP, W: Panama City Beach, X: St Andrews SP, Y: Tyndall AFB, Z: Mexico Beach, AA: St Joe Beach, BB: St Joseph Peninsula SP, CC: St Joseph Peninsula, DD: Cape San Blas AFB, EE: Cape San Blas, FF: St Vincent National Wildlife Refuge, GG: Cape St George Island, HH: St George Island, II: St George Island SP, JJ: Dog Island, KK: Carabelle, LL: Phipps Preserve Beach, MM: Alligator Point, NN: Bald Point SP. Three buoys are present offshore of the study area. From west to east: #42012 Orange Beach, 25.9 m depth; #42039 Pensacola, 270 m depth; and #42036 West Tampa, 49.7 m depth. Four tide stations are present within the study area. From west to east: #8729840 Pensacola; #8729210 Panama City Beach; #8729108 Panama City; and #8728690 Apalachicola.
Remotesensing 13 02654 g001
Figure 2. Nesting beach priority category (C) based on loggerhead sea turtle nesting frequency (A) and the proportion of nest GPS locations exposed to modeled wave wash-over (B). Any future consideration for addressing wave exposure impacts would vary with the proportion of nesting exposed to waves. For example, within the nine “very high priority” beaches, three have a “very high” nesting frequency and “very high” wave exposure and two have a “very high” nesting frequency and “low” wave exposure (D).
Remotesensing 13 02654 g002
Figure 3. Proportion of wave exposure along a stretch of the Saint Joseph Peninsula shoreline from 2016 to 2019. Loggerhead sea turtle nests laid during this time were typically above the most frequently exposed portions of the beach.
Remotesensing 13 02654 g003
Table 1. Nesting beaches comprising the Florida portion of the Northern Gulf of Mexico Loggerhead Recovery Unit ordered from west to east. Beach slope was taken along cross-shore transects from the shoreline to the base of the dune or back-beach construction every 200 m along the beach digital elevation model. For beach slope and number of nests per year, values are presented as mean ± 1 standard deviation. n indicates number of available transects. Nesting data (2016–2019) was provided by the Florida Fish and Wildlife Conservation Commission Fish and Wildlife Research Institute. Latitude and longitude represent the centroids of the nesting beach. AFB: Air Force Base, GINS: Gulf Islands National Seashore, NWR: National Wildlife Refuge, NA: data was not provided. Additional data is provided in Table S2.
Beach NameFigure 1 CodeLat (°)Long (°)Beach Length (km)Nesting Area (km2)Beach Slope (°)Nests y−1Nearest Wave BuoyNearest Tide Station
Perdido KeyA30.2836−87.50027.080.472.56 (±0.39, n = 36)12.67 (±6.35)Orange BeachPensacola
Perdido Key State ParkB30.2902−87.46652.650.182.62 (±0.28, n = 13)7 (±3.46)Orange BeachPensacola
GINS—Perdido KeyC30.3154−87.338811.781.251.69 (±0.66, n = 60)33.5 (±28.76)Orange BeachPensacola
GINS—Fort PickensD30.3180−87.241812.571.081.37 (±0.62, n = 64)25.25 (±3.3)Orange BeachPensacola
Pensacola BeachE30.3350−87.117112.580.872.18 (±0.25, n = 63)28.75 (±6.95)Orange BeachPensacola
GINS—Santa RosaF30.3592−86.988013.190.992.31 (±0.81, n = 66)21 (±5.6)Orange BeachPensacola
Navarre BeachG30.3763−86.88436.730.412.12 (±0.87, n = 34)9 (±5.83)Orange BeachPensacola
Eglin Air Force BaseH30.3845−86.82354.870.332.11 (±0.4, n = 24)24.25 (±31.4)Orange BeachPensacola
Eglin AFB WestI30.3946−86.716416.041.192.4 (±1.16, n = 80)27.33 (±6.66)Orange BeachPensacola
Okaloosa WestJ30.3954−86.60804.860.333.02 (±0.78, n = 25)4.67 (±1.15)Orange BeachPensacola
Eglin AFB EastK30.3883−86.53137.330.592.66 (±2.03, n = 37)19 (±5.2)Orange BeachPensacola
Okaloosa MidL30.3831−86.49395.750.343.96 (±1.99, n = 29)6.5 (±1.73)PensacolaPanama City Beach
Henderson Beach State ParkM30.3830−86.44362.030.123.67 (±1.37, n = 10)3 (±1.73)PensacolaPanama City Beach
Okaloosa EastN30.3807−86.41503.410.185.26 (±2.82, n = 17)4 (±1.63)PensacolaPanama City Beach
Miramar BeachO30.3736−86.35737.820.454.17 (±1.96, n = 40)10.33 (±5.03)PensacolaPanama City Beach
Topsail Hill State ParkP30.3616−86.29085.220.334.58 (±3.1, n = 26)10.5 (±2.65)PensacolaPanama City Beach
Walton WestQ30.3433−86.22088.550.484.5 (±2.38, n = 43)16 (±10.03)PensacolaPanama City Beach
Grayton Beach State ParkR30.3268−86.16313.440.253.16 (±1.74, n = 17)7 (±2.94)PensacolaPanama City Beach
Walton MidS30.3115−86.11436.280.383.66 (±1.2, n = 31)13.25 (±5.44)PensacolaPanama City Beach
Deer Lake State ParkT30.3009−86.08120.790.052.25 (±0.95, n = 4)1.25 (±0.5)PensacolaPanama City Beach
Walton EastU30.2847−86.03668.500.493.21 (±0.85, n = 43)28.75 (±11.9)PensacolaPanama City Beach
Camp Helen State ParkV30.2678−85.99200.550.050.86 (±0.58, n = 3)2.5 (±0.71)PensacolaPanama City Beach
Panama City BeachW30.1755−85.806828.001.972.56 (±0.53, n = 140)47.25 (±6.55)PensacolaPanama City Beach/Panama City
Saint Andrews State ParkX30.1045−85.70848.560.692.22 (±1.23, n = 44)15.75 (±5.91)PensacolaPanama City
Tyndall Air Force BaseY30.0589−85.611628.673.461.17 (±0.67, n = 145)89.75 (±7.8)PensacolaPanama City
Mexico BeachZ29.9508−85.43426.840.572.47 (±1.77, n = 34)20 (±3.56)PensacolaPanama City
Saint Joseph Peninsula State ParkAA29.8721−85.400815.291.842.18 (±0.93, n = 77)178.75 (±24.9)PensacolaPanama City
Saint Joseph PeninsulaBB29.7099−85.383910.520.773.29 (±1.01, n = 53)200.75 (±54.91)PensacolaPanama City
Saint Joe BeachCC29.8928−85.359610.660.822.94 (±1.01, n = 54)19.75 (±6.4)PensacolaPanama City
Cape San Blas AFBDD29.6656−85.34853.950.720.79 (±0.58, n = 20)71.25 (±37.56)PensacolaPanama City/Apalachicola
Cape San BlasEE29.6838−85.277911.571.361.67 (±1.23, n = 58)65.5 (±18.3)PensacolaApalachicola
Saint Vincent NWRFF29.6491−85.158816.262.241.87 (±1.6, n = 82)92.75 (±44.01)PensacolaApalachicola
Cape Saint George IslandGG29.6011−85.063817.511.861.81 (±0.68, n = 88)251.25 (±96.11)Pensacola/ West TampaApalachicola
Saint George IslandHH29.6553−84.877917.781.362.81 (±0.47, n = 89)389.5 (±115.83)West TampaApalachicola
Saint George Island State ParkII29.7187−84.743815.221.341.95 (±0.49, n = 77)84 (±42.37)West TampaApalachicola
CarrabelleKK29.8272−84.696310.410.424.03 (±2.04, n = 52)NAWest TampaApalachicola
Dog IslandJJ29.7828−84.648814.561.402.25 (±1.74, n = 74)NAWest TampaApalachicola
Phipps Preserve BeachLL29.9087−84.43312.510.231.24 (±0.67, n = 13)NAWest TampaApalachicola
Alligator PointMM29.8949−84.38398.180.473.73 (±2.7, n = 40)NAWest TampaApalachicola
Bald Point State ParkNN29.9145−84.33615.880.303.59 (±2.06, n = 30)3.25 (±1.5)West TampaApalachicola
Table 2. Hatching and emergence success for undisturbed and wave-exposed loggerhead turtle nests in the Florida Panhandle from 2016 to 2019. Number of nests and complete and partial wash-outs are derived from the full available dataset (n = 6773). Hatching and emergence success from undisturbed and washed over nests were evaluated from a subset of the available data (n = 2947) to remove potential covariance effects. NA: productivity from partially washed-out nests is impossible to determine without a known clutch size prior to erosion.
Number of NestsHatching Success (%, Mean ± SD)Emergence Success (%, Mean ± SD)
Undisturbed210478.1 ± 29.776.3 ± 30.2
Washed Over166527.3 ± 36.825.0 ± 35.4
Partial Wash-Out79NANA
Complete Wash-Out112100
Table 3. Nesting beach prioritization for future consideration of wave exposure impacts based on the mean nesting frequency and the proportion of nest GPS locations exposed to modeled wave activity during the 2016 to 2019 nesting seasons. Nesting beaches are presented according to the mean number of at-risk nests (i.e., nest frequency multiplied by the proportion of nesting exposed). * Denotes nesting beaches in the highest quartile of nesting frequency and highest quartile of wave exposure. † Denotes nesting beaches in the highest quartile of nesting frequency and lowest quartile of wave exposure.
Beach NameFigure 1 CodeMean Nest Frequency (n yr−1)Nest Frequency CategoryProportion Area ExposedProportion Nesting ExposedWave Exposure CategoryMean Nests at Risk (n yr−1)Priority Category
* Saint Joseph Peninsula State ParkBB158.5Very High0.5270.541Very High85.75Very High
Saint Joseph PeninsulaCC194.25Very High0.5320.404High78.48Very High
† Saint George IslandHH372.75Very High0.390.141Low52.56Very High
* Cape San BlasEE64Very High0.5880.773Very High49.47Very High
† Cape Saint George IslandGG248Very High0.4520.146Low36.21Very High
Tyndall Air Force BaseY80.75Very High0.6560.443High35.77Very High
* Cape San Blas AFBDD67.75Very High0.6110.517Very High35.03Very High
Saint Vincent NWRFF91.75Very High0.5620.351High32.20Very High
Saint George Island State ParkII81.75Very High0.50.306High25.02Very High
Panama City BeachW46.75High0.4260.497High23.23High
Pensacola BeachE27.25High0.4830.358High9.76High
Mexico BeachZ16Moderate0.4740.547Very High8.75High
Eglin AFB EastK19High0.4240.421High8.00High
Perdido KeyA11.67Moderate0.4260.657Very High7.67High
GINS—Fort PickensD24.75High0.5460.222Low5.49High
GINS—Santa RosaF21High0.4240.25Moderate5.25High
Walton EastU23.5High0.5710.223Moderate5.24High
Saint Joe BeachAA14.25Moderate0.4630.333High4.75Moderate
Miramar BeachO8.33Moderate0.5560.52Very High4.33Moderate
GINS - Perdido KeyC33High0.4560.129Low4.26Moderate
Eglin AFB WestI25.67High0.420.156Low4.00Moderate
Navarre BeachG5Low0.6590.667Very High3.34Moderate
Saint Andrews State ParkX13.5Moderate0.5510.241Moderate3.25Moderate
Walton WestQ10.75Moderate0.5630.302Moderate3.25Moderate
Eglin Air Force BaseH11Moderate0.5150.273Moderate3.00Moderate
Grayton Beach State ParkR4.75Low0.480.526Very High2.50Moderate
Walton MidS9Moderate0.5530.25Moderate2.25Low
Okaloosa MidL5.75Low0.4410.261Moderate1.50Low
Okaloosa EastN3Low0.5560.5Very High1.50Low
Topsail Hill State ParkP10Moderate0.5150.133Low1.33Low
Perdido Key State ParkB5Low0.3890.2Low1.00Low
Okaloosa WestJ4Low0.3640.167Low0.67Low
Henderson Beach State ParkM2.67Low0.50.25Moderate0.67Low
Deer Lake State ParkT1.33Low0.60.25Moderate0.33Low
Bald Point State ParkNN1.5Low0.4670Low0.00Low
Publisher’s Note: MDPI stays neutral with regard to jurisdictional claims in published maps and institutional affiliations.

