Article

Using Hybrid Artificial Intelligence and Evolutionary Optimization Algorithms for Estimating Soybean Yield and Fresh Biomass Using Hyperspectral Vegetation Indices

by
Mohsen Yoosefzadeh-Najafabadi
1,
Dan Tulpan
2 and
Milad Eskandari
1,*
1
Department of Plant Agriculture, University of Guelph, Guelph, ON N1G 2W1, Canada
2
Department of Animal Biosciences, University of Guelph, Guelph, ON N1G 2W1, Canada
*
Author to whom correspondence should be addressed.
Remote Sens. 2021, 13(13), 2555; https://doi.org/10.3390/rs13132555
Submission received: 25 April 2021 / Revised: 28 May 2021 / Accepted: 25 June 2021 / Published: 30 June 2021
(This article belongs to the Special Issue Deep Learning Methods for Crop Monitoring and Crop Yield Prediction)

Abstract

:
Recent advanced high-throughput field phenotyping combined with sophisticated big data analysis methods have provided plant breeders with unprecedented tools for a better prediction of important agronomic traits, such as yield and fresh biomass (FBIO), at early growth stages. This study aimed to demonstrate the potential use of 35 selected hyperspectral vegetation indices (HVI), collected at the R5 growth stage, for predicting soybean seed yield and FBIO. Two artificial intelligence algorithms, ensemble-bagging (EB) and deep neural network (DNN), were used to predict soybean seed yield and FBIO using HVI. Considering HVI as input variables, the coefficients of determination (R2) of 0.76 and 0.77 for yield and 0.91 and 0.89 for FBIO were obtained using DNN and EB, respectively. In this study, we also used hybrid DNN-SPEA2 to estimate the optimum HVI values in soybeans with maximized yield and FBIO productions. In addition, to identify the most informative HVI in predicting yield and FBIO, the feature recursive elimination wrapper method was used and the top ranking HVI were determined to be associated with red, 670 nm and near-infrared, 800 nm, regions. Overall, this study introduced hybrid DNN-SPEA2 as a robust mathematical tool for optimizing and using informative HVI for estimating soybean seed yield and FBIO at early growth stages, which can be employed by soybean breeders for discriminating superior genotypes in large breeding populations.

Graphical Abstract

1. Introduction

Soybean (Glycine max (L.) Merr.) is one of the most economically important crops in the world that is used for food, feed and industrial products [1]. Increasing soybean yield has always been the main priority in breeding programs in order to keep pace with the needs of a fast-growing global population [2]. In addition, great attention has been paid to increase soybean fresh biomass (FBIO) due to its biorefinery properties [3]. It would be a significant investment for farmers to make a profit not only from yield but also from FBIO. Therefore, the simultaneous improvement in both yield and FBIO production in soybean seems to be necessary to meet the various demands in the near future. Improving yield and biomass that are considered as complex quantitative traits controlled by several genetic and environmental factors [4] requires significant time and financial investment in breeding programs. Pre-harvest prediction of soybean yield and FBIO will enabled plant breeders to accurately select promising genotypes in large breeding populations at early growth stage while reducing the cost and time in their cultivar development programs [5].
Due to recent advances in the high throughput, non-destructive phenotyping tools such as hyperspectral reflectance, the prediction of complex traits is now available at low cost in early growth stages [6]. Pre-harvest soybean yield and FBIO prediction are not only important for global food security and industrial policy making but also for field management practices [7,8]. Different approaches have been applied for crop yield and FBIO prediction, such as crop modeling and hyperspectral reflectance [7,9].
Proximal and remote sensing of spectral reflectance are known as non-destructive, non-invasive phenotyping approaches for measuring the spectral properties of plants at low cost in large breeding populations [5,10,11,12]. These methods are considered proximal when the spectral properties are collected in crops’ proximities [11]. The use of proximal/remote sensing for discriminating among genotypes with different potential is well documented in different crops such as wheat [12], alfalfa [13], rice [14], sorghum [15] and soybean [16]. The use of spectral properties of crops for predicting complex traits is genotype-specific and depends on the nature of the complex trait [17,18]. Therefore, it is necessary to evaluate and specify the possibilities of using spectral properties to predict complex traits for each plant species [16].
Several vegetation indices are generated from the spectral reflectance and commonly used for estimating important agronomic traits such as plant height, biomass, resistance to different diseases and yield in different plant species, including wheat [19], barley [20], cotton [21] and sorghum [22]. The normalized difference vegetation index (NDVI), for example, is known as an important spectral vegetation index, which is broadly used for monitoring seasonal growth developments in plants and estimating canopy biomass, photosynthesis rate, leaf area index and even yield formation [23,24]. Depending on specific bands used for calculating NDVI, different types of NDVI have been established [13]. The spectral vegetation indices are generally species-specific and, therefore, one of the major obstacles in their applications is their low prediction powers on morphological and physiological processes if they are not calibrated for the target plant species [6]. In addition, analyzing large hyperspectral reflectance data sets requires intensive computational and statistical analyses, which is still challenging in many plant breeding programs [25]. To address the latest issue, machine learning (ML) algorithms are considered as reliable and efficient computational approaches for predicting complex traits [13,26,27].
The functionality of ML algorithms is based upon developing empirical relationships between the target and input variables [13,28]. Therefore, several ML algorithms were implemented for predicting yield in many crops, including artificial neural networks [29], support vector regression [30] and random forests [16]. The successful use of ML algorithms has been documented in several plant species such as chrysanthemum [26], alfalfa [13], wheat [31], soybean [16,32] and maize [33].
As one of the important subsets of ML, deep learning (DL) can automatically learn from a large hierarchical representation of the data by using complex non-linear functions that are trained from the outputs of the previous layers [7,34]. Convolutional neural networks (CNN), deep neural networks (DNN) and long-short term memory (LSTM) are the three most commonly used DL methods that are broadly used in remote sensing [35], medical applications [36] and human activity recognition [37]. Although few studies have exploited DL for crop yield prediction [7,38], the implication of hyperspectral vegetation indices (HVI) for predicting soybean yield and FBIO has not been exploited.
Using only one ML algorithm, especially when the training dataset is small and limited, may result in some level of overfitting in the ultimate prediction [13,39]. In order to address this problem and improve the prediction performance of individual ML algorithms, different methods have been proposed [40]. One of these effective methods is the ensemble method, in which the prediction performance of different ML algorithms is combined to estimate the final prediction [41]. The principle of ensemble methods is built upon the divide-and-conquer paradigm [40]. This idea is usually implemented to find an optimal solution to the proposed problem [42]. The success application of ensemble methods to predict complex traits using related traits is well documented in maize [33], alfalfa [13] and sugarcane [43]. The three most commonly used ensemble algorithms are boosting, bagging and stacking [13,41]. Bagging was first introduced by Breiman [44] as a variance reduction method for several ML algorithms such as radial basis function and random forest [45]. The bagging method is based on the parallel ensemble algorithm, while boosting was introduced by Schapire [46] as a sequential ensemble model of base algorithms by using the dependencies of each ML algorithm [13,41]. Although boosting and bagging methods are commonly used for the combined homogeneous ML algorithms, stacking methods are mostly exploited for heterogeneous ML algorithms and adjust the difference between algorithms to increase the ultimate prediction accuracy [13,41,47].
In addition to the use of ensemble and DL methods for predicting yield and FBIO at early growth stages using HVI, it would be valuable to determine the optimum values of the HVI in genotypes with maximized yield and FBIO production. Therefore, the implementation of optimization algorithms can be beneficial to cultivar development programs. The successful use of optimization algorithms was explored in some areas of plant science such as plant tissue cultures [48,49] but not yet in the field of plant breeding. In order to concurrently maximize two or more traits, multi-objective evolutionary optimization algorithms can be employed for finding the optimal level of inputs for different objective functions [50]. One of the most commonly used multi-objective optimization algorithms is the improved version of the strength Pareto evolutionary algorithm 2 (SPEA2) [51]. To the best of our knowledge, this study is the first report of using the SPEA2 algorithm for optimizing HVI that can be used for selecting soybean genotypes with high yield and FBIO production potential within a breeding program. The main objectives of this study were: (1) investigating the potential benefit of using HVI for predicting soybean yield and FBIO; (2) the comparative analysis of the EB strategy and DNN algorithm to improve yield and FBIO prediction accuracies; and (3) introducing DNN-SPEA2 algorithms as a reliable tool for optimizing the HVI values associated with soybean genotypes with maximized yield and FBIO production. The outcome of this study can provide soybean breeders with new effective methods for selecting genotypes with high yield potential and FBIO production at early growth stages in large breeding populations.

2. Materials and Methods

2.1. Plant Material

In this study, phenotypic data were collected using 250 soybean genotypes, which are the core germplasms of the soybean breeding program at the University of Guelph, Ridgetown and are used for sustainable cultivar development and genetic studies.

2.2. Test Sites and Experimental Designs

The soybean genotypes were cultivated under the field condition at Ridgetown (42°27′14.8′′N 81°52′48.0′′W, 200 m above sea level) and Palmyra (42°25′50.1′′N 81°45′06.9′′W, 195 m above sea level) in 2018 and 2019 in Ontario, Canada (Figure 1). The experiments were conducted using randomized complete block designs (RCBD) with two replications in four environments (two locations and two years), consisting of 2000 research plots in total. Each plot consisted of five rows, 4.2 m long each and 40 cm spacing between each row and the seedling rate was 50–57 seeds per m2. All phenotypic data were adjusted using nearest neighbor analysis (NNA) to remove the possible spatial variation in the field [52,53,54].

2.3. Data Acquisition

2.3.1. Field Data Collection

Seed yield (kg ha−1) for each plot was measured by harvesting three middle rows and adjusted to 13% moisture. The above-ground biomass samples (g m−2) for each plot were collected at the beginning seed (R5) growth stage [55] in 1.0 m sections per row that were randomly selected among designated sections. The best linear unbiased prediction (BLUP) was implemented in order to estimate the average phenotyping plots for each soybean genotype [56].

2.3.2. Hyperspectral Reflectance Data Collection

In each plot, the hyperspectral reflectance properties were acquired at the R5 growth stage using UniSpec-DC Spectral Analysis System (PP Systems International, Inc. 110 Haverhill Road, Suite 301, Amesbury, MA, USA). The device covers 250 reflectance bands ranging between 350–1100 nm with a bandwidth of 3 nm. The sensors were able to cover a sample area of 0.25 m2 due to their 25° field-of-view properties. The “proximal sensing” method was used for measuring hyperspectral reflectance due to the proximity of the sensor to the canopy. For calibrating and reducing the incoming solar radiation, the dark reference and the Spectralon panels were used for the dual and basal channels, respectively. In addition, all hyperspectral reflectance data were collected as close to solar noon as possible for minimizing the signal noise associated with the environment.

2.4. Data Pre-Processing and Statistical Analyses

Several random noises occurring across the whole spectra can lead to misinterpretation of the results. This is mainly caused by electronic and sensor fluctuations [57]. Therefore, three hyperspectral reflectance measurements were conducted for each plot and the BLUP values were calculated for hyperspectral reflectance bands. In addition, hyperspectral reflectance data at the upper (1005–1100 nm) and lower (350–395 nm) edges of the spectra were eliminated from the original data. Data centering, scaling and a Savitzky–Golay filter were applied for improving spectral properties and signal-to-noise ratio [58,59]. All the pre-processing procedures were conducted using the R software, version 3.6.1.

2.5. Hyperspectral Vegetation Index (HVI) Extraction

In order to reduce the hyperspectral data dependency, the vegetation indices were used to predict the soybean yield and FBIO instead of using the original reflectance bands. Therefore, 34 vegetation indices were selected based on the published papers (Table 1), each characterizing two spectral bands. The used vegetation indices were categorized into the two most well-known indices, the normalized difference vegetation index (NDVI) and the simple ratio index (SRI). In this study, the 34 vegetation indices were considered as the input variables and yield or FBIO was tagged as the target variable. The Pearson correlation coefficients among input and output variables was evaluated in order to estimate the relevancy of each HVI to the soybean yield and FBIO.

2.6. Variable Selection

One of the important approaches to determine the relationship between input and output variables is sensitivity analysis [60]. Several methods were developed and used for sensitivity analysis in different fields of studies such as predicting crash frequency [60], crash injury severity prediction [61], computer science [62] and plant science [16]. Recently developed sensitivity analysis methods for variable or feature selection techniques are usually used to determine important input variables in predicting given target traits. In this study, recursive feature elimination (RFE), as one of the most common wrapper methods, was applied for estimating the importance of selected HVI for predicting yield and FBIO. Due to its easy to configure property [63], RFE has the ability to effectively extract important variables in a short time. More detail about the RFE can be found in Yoosefzadeh-Najafabadi, et al. [16]. All the RFE analyses were carried out through the caret package [64] in R software, version 3.6.1.

2.7. Yield and FBIO Prediction Model Calibration and Validation

2.7.1. Ensemble Method (Ensemble-Bagging Algorithm)

Three of the most common used ML algorithms, i.e., the radial basis function (RBF), support vector regression (SVR) and random forest (RF), were selected as the base learners for the ensemble method. RBF is a neural network algorithm, which applies approximate multivariate functions to predict the output variable using multi-dimensional input variables [87,88]. SVR is a regression version of the support vector machine algorithm that uses hyperplanes to discover the optimal separation of values in output variables [89]. In SVR, the input and output variables are transformed based on kernel functions from the original space to a support vectors space and the linear function is used to eliminate errors between the insensitive loss function and the training data [13,90]. The third ML algorithm used in this study was RF, which is based on generating a series of trees representing a subset of independent observations [91] and estimates the final prediction by averaging the production of all determined trees [48]. We implemented an EB based on the bagging strategy to improve the prediction performance of individual algorithms as described by Ye, et al. [90]. For this aim, we combined all the prediction performance of the tested ML algorithms and selected the one with the highest performance as the MetaClassifier for the EB. Each parameter in the tested ML algorithms was tuned and adjusted based on the input/output variables. All ML and EB analyses were conducted using the workbench for machine learning (Weka) software version 3.9.4 [92].

2.7.2. Deep Neural Network (DNN)

Thanks to recent advances in the performance of complex computational procedures, several DNN approaches have been introduced with multiple processing hidden layers [93]. The DNN algorithm has the ability to learn the multivariate mapping function between the output and input variables. The scheme of the used DNN algorithm is illustrated in Figure 2. In this study, the multilayer perceptron (MLP) as one of the feed-forward neural networks was used to predict the soybean yield and FBIO at an early growth stage using HVI. The structure and function of MLP were explained in detail by Pal and Mitra [94]. In brief, MLP contains input, output and hidden layers of M interconnected neurons. Each layer in the MLP algorithm has full connections to the next layer, so the output of layer M would be the input of the M +1 layer [95]. In this study, optimizing MLP parameters was conducted using GUI editors in Weka software version 3.9.4. In general, there were four hidden layers with 17 nodes in each layer, a learning rate of 0.3 and a momentum of 0.2 (Figure 2).

2.8. Optimization Process (SPEA2 Algorithm)

Multi-objective optimization algorithms are usually implemented for two or more than two outputs that sometimes are in conflict with each other. SPEA2 is a sophisticated optimization algorithm that can be successfully implemented for finding the optimum Pareto front solutions (Figure 3). In this study, based on the best algorithms for soybean yield and FBIO predictions, we used SPEA2 to find the optimum levels of HVI for maximizing yield and FBIO as objective functions. The main steps of SPEA2 were summarized in Figure 3. To achieve the best results, population size along with three of the most important parametric mechanisms in the SPEA2 algorithm (i.e., crossover, selection and mutation operations) were determined [96]. The overall population size, generation number, uniform crossover and mutation rate were respectively set to 400, 1000, 0.8 and 0.6. The two-point crossover method was used to select elite populations for crossover and obtain the appropriate fitness. More details about the SPEA2 environmental selection methods and fitness assignment can be found in [97].

2.9. Quantification of Model Performance and Error Estimations

In order to quantify the performance of EB and DNN for predicting soybean yield and FBIO using HVI, the 250 soybean genotypes were randomly split into testing and training sets by using five k-fold cross-validations (80–20% splits) with ten repetitions (Figure 4) and root mean square error (RMSE, Equation (1)), mean absolute errors (MAE, Equation (2)) and coefficient of determination (R2, Equation (3)) were measured as follows:
R M S E = ( Y Y ) 2 n
M A E = i = 1 n | Y i Y i | n
R 2 = S S T S S E S S T
where, Y′ and Y are the predicted and measured values, respectively, n is the number of observations, SST stands for the sum of squares for total and SSE stands for the sum of the squares for error.

3. Results

3.1. Yield, FBIO and HVI Properties

In this study, the average FBIO of the 250 soybean genotypes grown in four environments had the range of 1366.9 to 2548.5 g m−2 with a mean and standard deviation of 1948.9 and 336.36 g m−2, respectively. The average yield of the 250 soybean genotypes ranged from 2.38 to 5.71 ton ha−1 with a mean of 4.19 ton ha−1 and a standard deviation of 0.58 ton ha−1. The distributions of soybean yield and FBIO production for each genotype across the four environments are shown in Figure 5. In general, the variation in the yield was larger than for the FBIO among soybean genotypes across the environments.

3.2. Correlation Analysis of HVI vs. Soybean Yield and FBIO

The linear associations of HVI with yield and FBIO was measured using Pearson correlation coefficients (Figure 6 and Table S1). All HVI showed significant correlations with both soybean yield and fresh biomass. Among all the tested HVI, three of them had positive correlations and 31 HVI showed negative correlations with both soybean yield and FBIO. While S14 showed the highest positive correlation (0.71) with yield, the highest negative correlation was found to be between N5 and yield (−0.84). S1 showed the lowest positive correlation with the soybean yield (0.60) and the lowest negative correlation was with N1 (−0.15). Regarding the correlation of HVI with soybean FBIO, S9 had the highest positive correlation (0.75) and N5 had the highest negative correlation (−0.90). The lowest positive and negative correlations with FBIO were found with S1 (0.62) and N1 (−0.18). Since all the tested HVI were significantly correlated with soybean yield and FBIO, all HVI was used as the input variables in EB and DNN algorithms (Table S1).

3.3. Comparative Analysis of the EB and DNN Algorithms

One of the objectives of this study was to compare the efficacy of EB and DNN algorithms for predicting soybean yield and FBIO from HVI data collected at the R5 growth stage. Among all the tested ML algorithms used for establishing the EB method, the SVR algorithm outperformed the other algorithms (Tables S2 and S3) and, therefore, was selected as the MetaClassifier for the EB strategy. The results of this study showed that the EB method had a slightly, but not significantly, higher R2 values (0.77) over DNN (0.76) in predicting yield from HVI (Figure 7A), with the lowest RMSE and MAE values of 224.97 and 149.28 kg ha−1, respectively (Figure 7B,C). Regarding the FBIO prediction results, the highest R2 was obtained using DNN with the value of 0.91 (Figure 7D). The DNN algorithm also had the lowest RMSE and MAE values of 102.66 and 80.09 g m−2, respectively (Figure 7E,F).

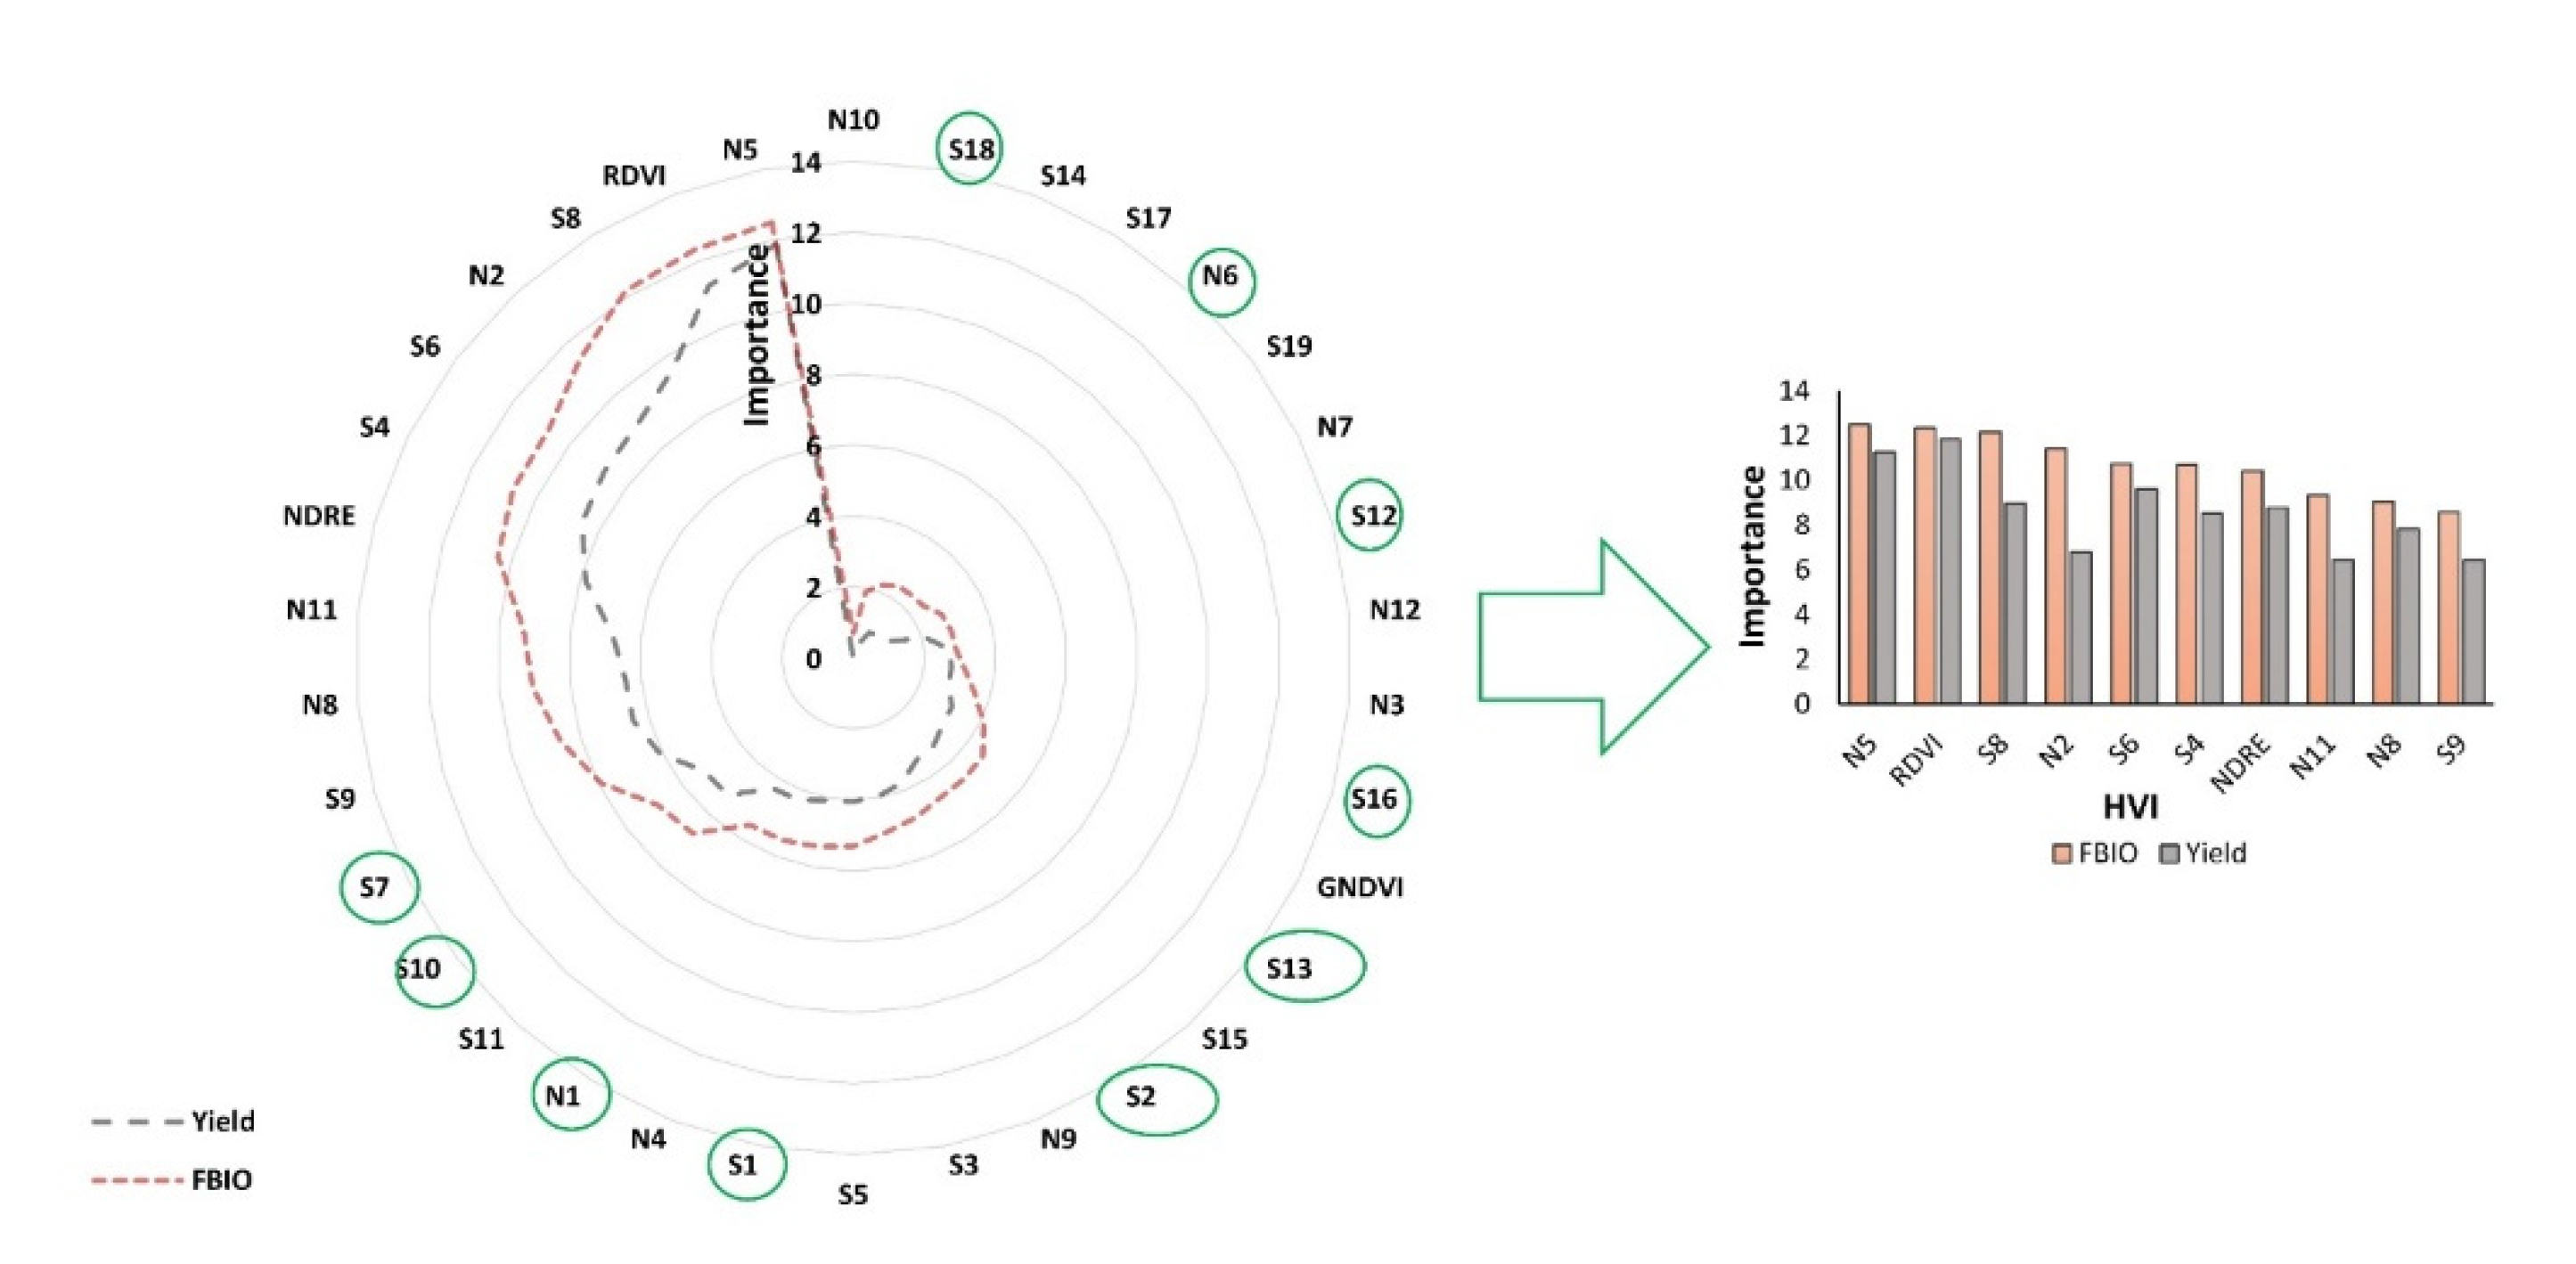
3.4. Variable Selection

In this study, RFE as one of the common variable selection methods was used in order to select the top 10 important HVI in predicting the yield and FBIO. The results (Figure 8) showed that N5 had the highest importance value in predicting both yield (11.24) and FBIO (12.49), followed by the RNDVI, S8, N2 and S6 indices as the most important HVI in explaining soybean yield and FBIO. While the least important HVI for predicting yield was found to be S1 (0.014), N10 (0.70) was the least important HVI for predicting FBIO. The prediction accuracy of both EB and DNN for predicting the soybean seed yield and FBIO using the selected 10 HVI was found not to be significantly lower than what were obtained using all the 35 HVI (data were not shown).

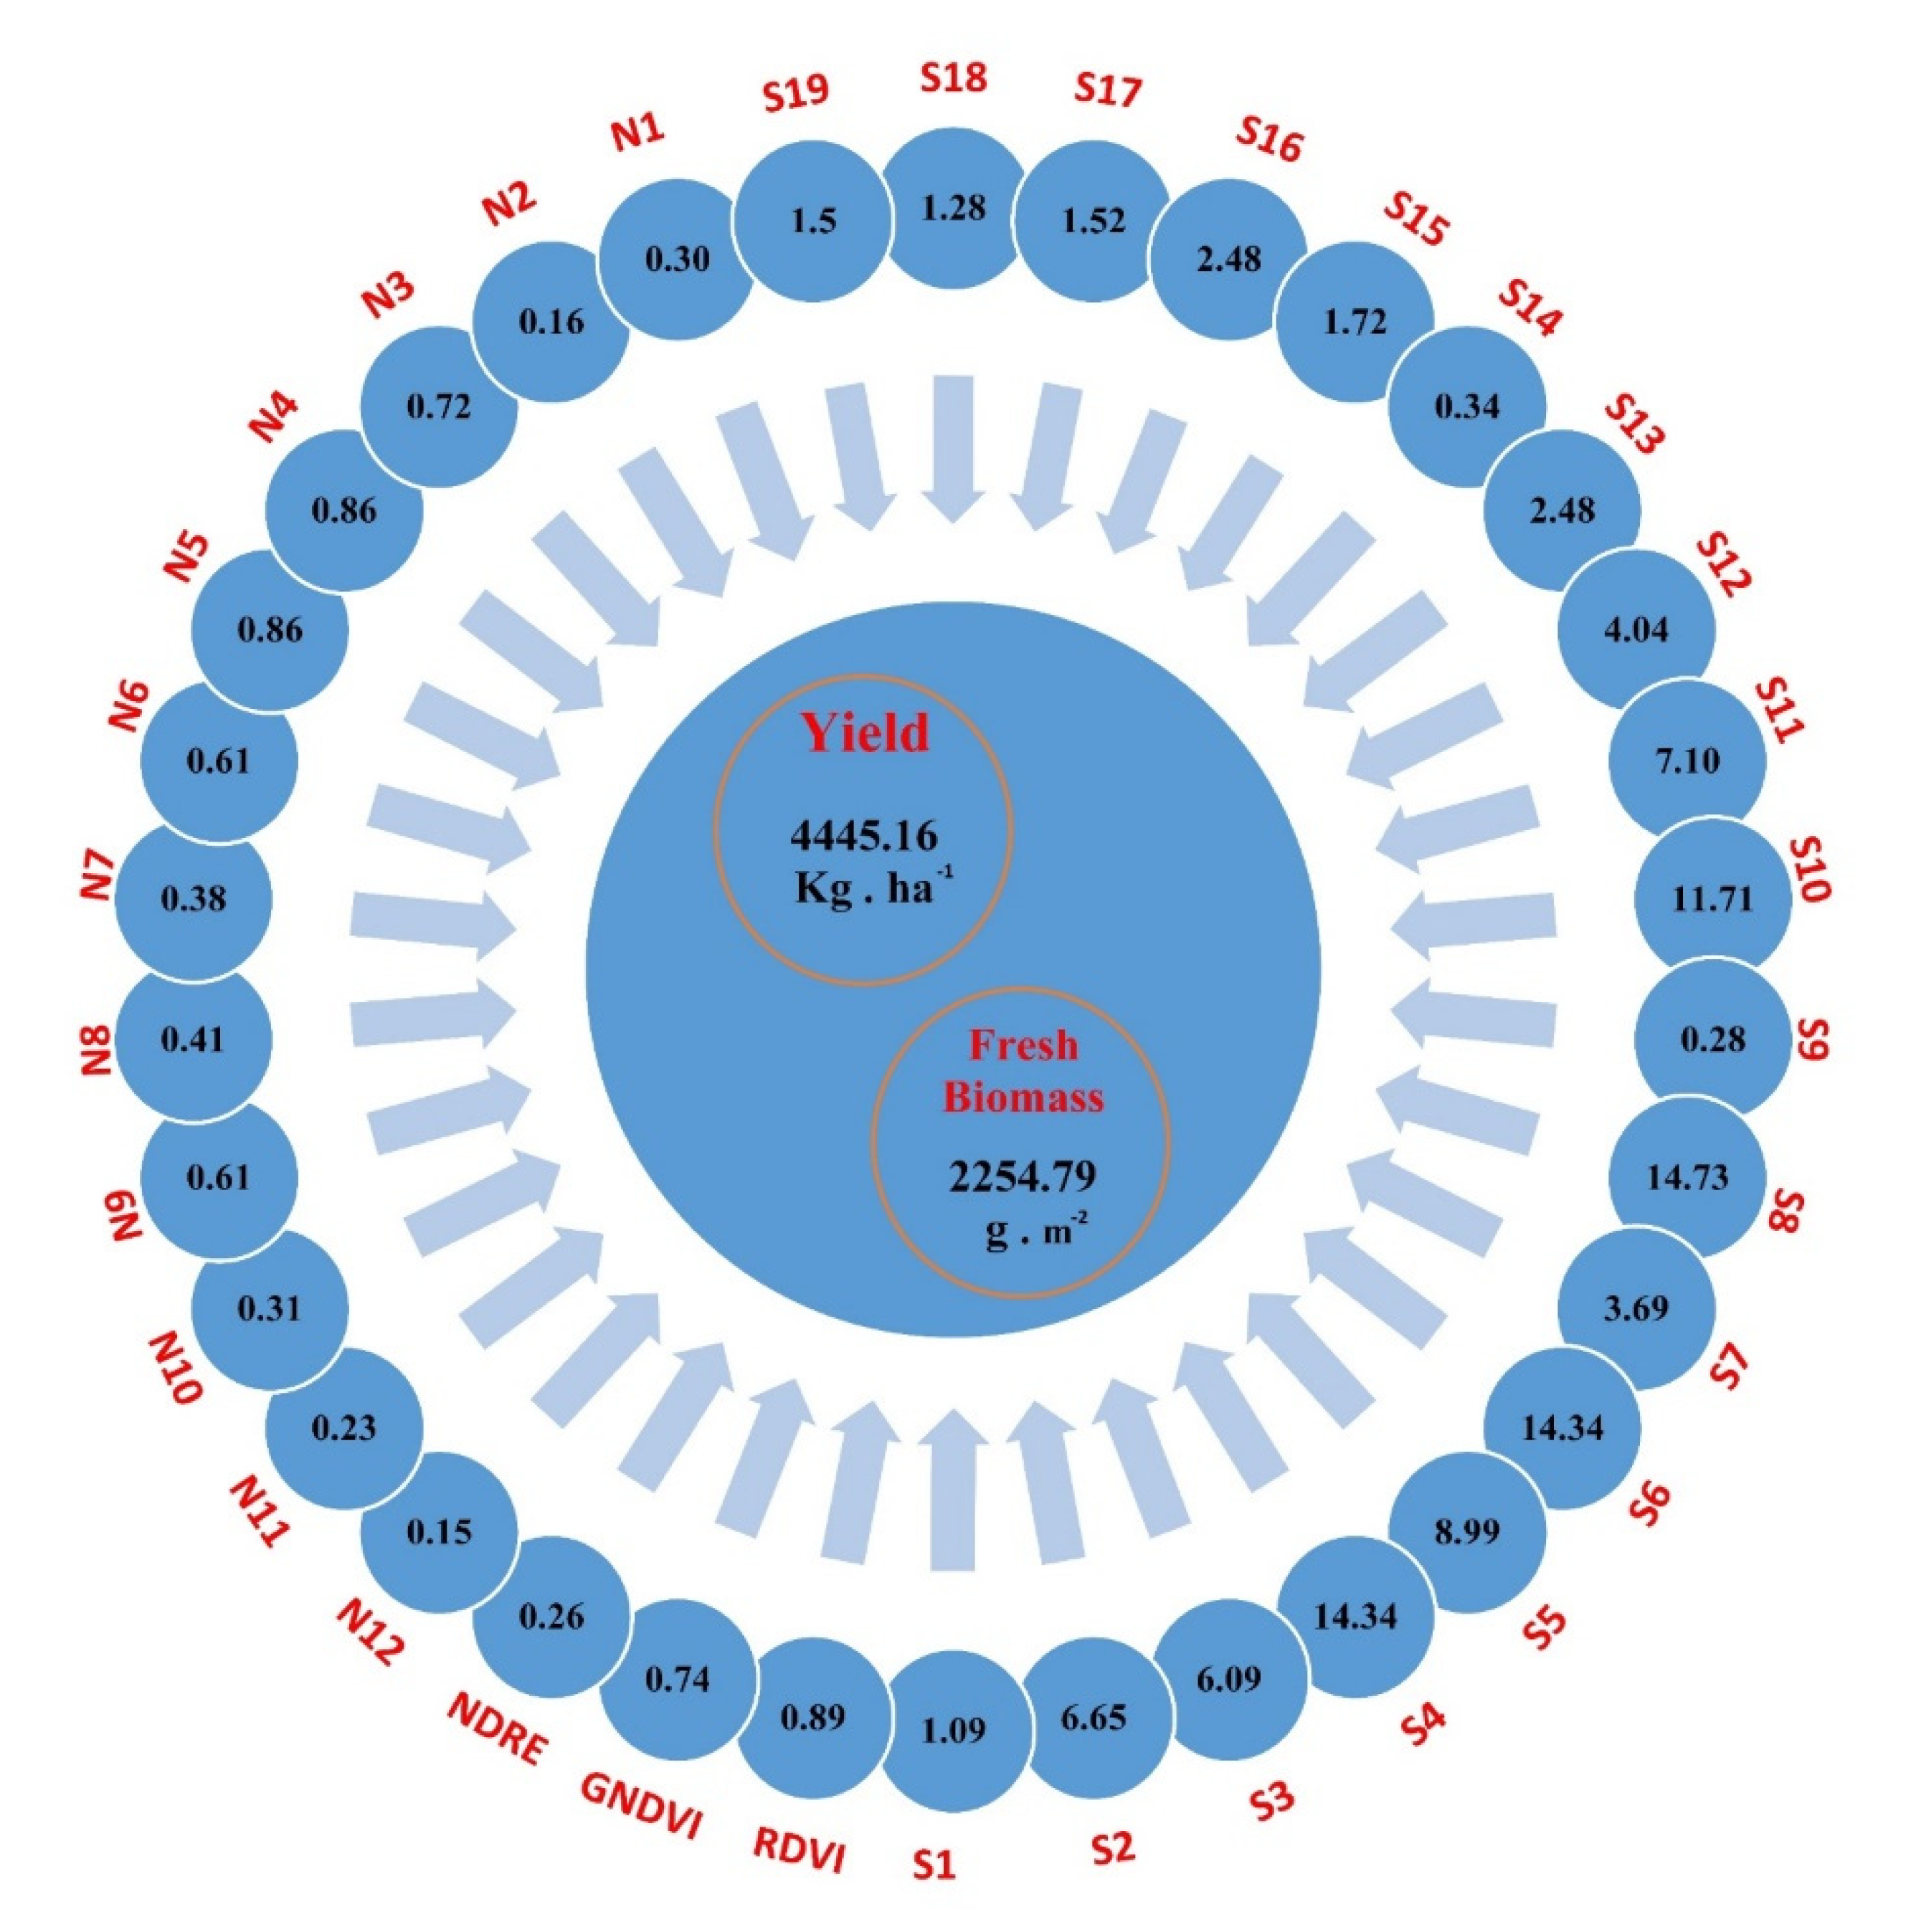
3.5. The DNN-SPEA2 Optimization Algorithm

The DNN algorithm, with the highest prediction accuracies for predicting both soybean yield and FBIO from HVI, was selected and linked to the SPEA2 optimization algorithm for estimating the optimized values of HVI in soybean genotypes with maximized yield, 4445.2 kg·ha−1 and FBIO, 2254.8 g·m−2 (Figure 9).

4. Discussion

Several studies have reported significant associations between HVI and the two important agronomic traits of yield and FBIO production in several crop species, such as sorghum [98], corn [99], rice [100], potato [101] and wheat [102]. In this study, we also confirmed significant correlations between HVI and both yield and FBIO by evaluating 250 soybean genotypes across four environments. All the tested HVI were extracted based on the previous studies and their correlations with the tested variables (yield and FBIO). Similarly, the tested HVI were selected from different spectral regions (e.g., blue, green, red, red-edge and near-infrared regions) to investigate the potential use of different spectral regions in predicting soybean seed yield and FBIO. The visible region of the spectra (blue, green and red) region is absorbed by the epidermis and palisade mesophyll due to the presence of chloroplast and plant pigments that use the light to drive photosynthesis [103,104]. Chlorophyll a, chlorophyll b and plant pigments absorb light to drive photosynthesis [105]. The near-infrared (700–1300 nm) region is mainly absorbed by spongy mesophyll in the plant, which is known as a good stress indicator [104]. One of the most vital portions of the reflectance spectra is the red edge because, in this region, plant pigments stopped absorbing light and began to reflect it [106]. Generally, with these measurements of the light that is reflected by the plant canopy, chlorophyll content, biomass, yield, abiotic stress and disease can be estimated [107,108,109].
Among all the tested HVI, N5 had the highest negative correlation with both yield and FBIO. The N5 index consists of two specific wavelengths, 800 nm and 670 nm [68]. The 670 nm band located in the red region of the spectral was previously introduced as one of the most important reflectance bands in agricultural studies [110,111,112,113]. This reflectance band has shown strong correlation with the chlorophyll contents in plants, which is considered as one of the most pivotal components in determining the ultimate yield and FBIO production [114]. The 800 nm band is placed within the near-infrared region of the spectrum [110,115] and has been previously reported to be involved in characterizing the structure of the leaves in plants. More specifically, this band is associated with different levels of liquid water in the inter-cellular spaces of leaves [116]. Changes in the balance of water and air in the inter-cellular space in leaves have significant impact on ultimate yield and FBIO production [117]. Based on our previous report [16], the red region, which is ranged mostly from 655 to 675 nm, had the highest association with the soybean yield formation. In this study, we found the importance of red wavelength in predicting FBIO as well. Therefore, N5 can be considered as one of the most informative indices for predicting the final yield and FBIO production in soybean and, therefore, for discriminating genotypes with different genetic potential for the two traits.
Among all the tested HVI, the S14 and S9 indices had the highest positive correlations with yield and FBIO, respectively. The S14 index, introduced by Mutanga and Skidmore [72], has consisted of only red-edge reflectance bands. The S9 index, which was proposed by Chappelle, et al. [83], is built upon both red and red-edge reflectance regions. The red-edge reflectance bands have been reported to have strong correlations with the chlorophyll contents and used as an explanatory indicator for senescence and stress in plants [110,118]. Several studies reported the efficiency of using red and red-edge regions in discriminating plant characteristics such as yield [119], biomass [120] and disease [121]. The potential yield and FBIO production of a given genotype can be estimated by the level of chlorophyll and the senescence rate, especially at the later development stages [122]. In this study, the hyperspectral reflectance data were collected at the R5 growth and development stage, in which pods and seeds are developing, and plants have initiated the senescence from the lower leaves. These special properties of the two indices can explain their high positive correlations with yield and FBIO. In addition, RFE analysis indicated the high importance score for N5 in predicting soybean yield and FBIO. N5 consisted of two reflectance bands, 670 and 800 nm, which were placed in red and near-infrared regions, respectively. Our previous study also obtained the high importance score for the near-infrared regions and red regions in predicting soybean yield classes, specifically the high yielding class [16]. Here, the efficiency of using these two reflectance bands in predicting soybean yield and FBIO was verified as single hyperspectral vegetation indices.
In general, qualitative traits can be analyzed using conventional statistical methods [123,124]; however, estimating complex quantitative traits such as yield and FBIO from HVI data sets in large breeding populations require more sophisticated statistical methods such as machine or deep learning algorithms [89]. Recently, the use of ML algorithms was successfully reported in many crop species such as soybean [16], wheat [12], chrysanthemum [49], alfalfa [13] and rice [30]. However, in some cases, the potential issue of overfitting through using individual ML algorithms is inevitable [125]. To overcome this shortage, different ensemble algorithms have been introduced, in which the outcomes of different ML algorithms are combined for better predictive performance [126]. In this study, the RBF, SVR and RF algorithms were used as individual ML algorithms to construct the ensemble strategy based on the bagging principles and SVR with the highest accuracy was selected as the MetaClassifier.
The superior accuracy performance of SVR, compared to other ML algorithms tested in this study, can be due to the use of structural than empirical risk minimization inductive principles [26,127]. In addition to EB, the DNN algorithm was also used to predict soybean yield and FBIO production using HVI. Recently, DNN algorithms have attracted the attention from several researchers in different areas such as object detection [128], image processing [129], disease detection [130] and various engineering areas [131]. The DNN algorithms are commonly used in non-linear problems because they are easy to implement and can overcome the adverse effect of data dimensionality [132]. Although there are some ambiguities around considering MLP as a type of DNN, several studies reported MLP as a subset of DNN [95,133,134]. In this study, the DNN algorithm outperformed the EB algorithm since DNN has the ability to learn the weights between nodes through unsupervised learning instead of generating weights randomly in the initialization stage [135]. After that, DNN tries to adjust weights during the learning process. This property can improve the prediction accuracy of DNN in compared to other ML algorithms.
One of the most important objectives for plant breeders is to improve the discrimination ability among plant genotypes with different yield and FBIO potentials in large breeding populations, directly or indirectly [136]. Direct selection methods are focused on selecting the superior genotypes based on the average performance of the target trait across many locations and over several years, while indirect selections are based upon selecting for high heritable secondary traits that are strongly associated with the target trait [137]. Therefore, efficient plant breeding programs are established based on combined direct and indirect selection strategies to maximize the accuracy of the selections [12,137,138]. In order to move toward efficient breeding, it is important to have an estimation of the optimized level of each secondary trait in superior genotypes. This goal can be accomplished by using optimization algorithms such as the improved strength Pareto evolutionary algorithm (SPEA2). SPEA2 is used for multi-objective optimization problems to figure out the Pareto-optimal set [97]. In this study, the DNN as the superior algorithm in predicting the soybean yield and FBIO production was linked to SPEA2 to optimize the HVI for maximizing yield and FBIO production (Figure 9). The successful use of SPEA2 was reported in different areas such as engineering [139], material science [140] and economics [141], but not in plant science. To the best of our knowledge, this is the first report of using SPEA2 in the plant science area. The advantages of SPEA2, over other multi-objective optimization algorithms, is built upon its improved fitness assignment scheme that results in understanding of the number of individuals that dominant or are dominated by others in the data sets [97]. This technique empowers SPEA2 to optimize all HVI, precisely, in soybean genotypes with maximized yield and FBIO production. By having this information, soybean breeders could be able to design the “ideotype” genotypes with optimum values for hyperspectral vegetation indices, which are potentially high seed yield and FBIO genotypes in large breeding populations and set up their selection strategies based on these criteria.

5. Conclusions

Having reliable estimations of the optimum values for highly heritable secondary traits such as HVI that are strongly associated with yield and FBIO can guide breeders to construct efficient breeding programs focused on designing and selecting “ideotype” genotypes for their target traits. In this study, we demonstrate the significant correlations of several HVI, including the red region, especially the 670 nm and 800 nm wavelengths in the near-infrared region, with soybean seed yield and FBIO production. We also developed EB and DNN algorithms as reliable tools for predicting the soybean seed yield and FBIO from HVI data collected at early growth stages. Furthermore, for the first time, we linked DNN to the SPEA2 to estimate the optimum values of HVI in soybean genotypes with maximized yield and FBIO. These optimum values of HVI are suggested to be validated in new and independent breeding populations before being used by soybean breeders in their cultivar development programs for selecting high-yielding genotypes with high FBIO potential.

Supplementary Materials

The following are available online at https://www.mdpi.com/article/10.3390/rs13132555/s1, Table S1: Tabular format of Pearson correlation analyses of hyperspectral vegetation indices (HVI), soybean seed yield and fresh biomass (FBIO), Table S2: Analysis performance of random forest (RF), radial basis function (RBF) and support vector regression (SVR) algorithms for soybean yield prediction using yield component traits, Table S3: Analysis performance of random forest (RF), radial basis function (RBF) and support vector regression (SVR) algorithms for soybean fresh biomass (FBIO) prediction using yield component traits.

Author Contributions

Conceptualization, M.E.; methodology, M.E.; software, M.Y.-N.; validation, M.Y.-N., D.T. and M.E.; formal analysis, M.Y.-N.; investigation, M.Y.-N.; resources, M.E.; data curation, M.Y.-N., D.T.; writing—original draft preparation, M.Y.-N. and M.E.; writing—review and editing, M.Y.-N., D.T. and M.E.; visualization, M.Y.-N.; supervision, M.E.; project administration, M.E.; funding acquisition, M.E. All authors have read and agreed to the published version of the manuscript.

Funding

This project was funded in part by Grain Farmers of Ontario (GFO) and SeCan. The funding bodies did not play any role in the design of the study and collection, analysis and interpretation of data and in writing the manuscript.

Institutional Review Board Statement

Not applicable.

Informed Consent Statement

Not applicable.

Data Availability Statement

All datasets will be freely available upon request.

Acknowledgments

The authors are grateful to the past and current members of Eskandari laboratory at the University of Guelph, Ridgetown Campus, including Sepideh Torabi, Bryan Stirling, John Kobler and Robert Brandt for their technical support. We would also like to thank Maryam Vazin for her assistance with the field data collection.

Conflicts of Interest

The authors declare no conflict of interest. The funders had no role in the design of the study; in the collection, analyses, or interpretation of data; in the writing of the manuscript, or in the decision to publish the results.

References

  1. Colletti, A.; Attrovio, A.; Boffa, L.; Mantegna, S.; Cravotto, G. Valorisation of By-Products from Soybean (Glycine max (L.) Merr.) Processing. Molecules 2020, 25, 2129. [Google Scholar] [CrossRef] [PubMed]
  2. Dubey, A.; Kumar, A.; Abd_Allah, E.F.; Hashem, A.; Khan, M.L. Growing more with less: Breeding and developing drought resilient soybean to improve food security. Ecol. Indic. 2019, 105, 425–437. [Google Scholar] [CrossRef]
  3. De Pretto, C.; Giordano, R.d.L.C.; Tardioli, P.W.; Costa, C.B.B. Possibilities for producing energy, fuels, and chemicals from soybean: A biorefinery concept. Waste Biomass Valorization 2018, 9, 1703–1730. [Google Scholar] [CrossRef]
  4. Collins, N.C.; Tardieu, F.; Tuberosa, R. Quantitative trait loci and crop performance under abiotic stress: Where do we stand? Plant Physiol. 2008, 147, 469–486. [Google Scholar] [CrossRef] [PubMed] [Green Version]
  5. Rutkoski, J.; Poland, J.; Mondal, S.; Autrique, E.; Pérez, L.G.; Crossa, J.; Reynolds, M.; Singh, R. Canopy temperature and vegetation indices from high-throughput phenotyping improve accuracy of pedigree and genomic selection for grain yield in wheat. G3 Genes Genomes Genet. 2016, 6, 2799–2808. [Google Scholar] [CrossRef] [Green Version]
  6. Araus, J.L.; Kefauver, S.C.; Zaman-Allah, M.; Olsen, M.S.; Cairns, J.E. Translating high-throughput phenotyping into genetic gain. Trends Plant Sci. 2018, 23, 451–466. [Google Scholar] [CrossRef] [Green Version]
  7. Maimaitijiang, M.; Sagan, V.; Sidike, P.; Hartling, S.; Esposito, F.; Fritschi, F.B. Soybean yield prediction from UAV using multimodal data fusion and deep learning. Remote Sens. Environ. 2020, 237, 111599. [Google Scholar] [CrossRef]
  8. Pantazi, X.E.; Moshou, D.; Alexandridis, T.; Whetton, R.L.; Mouazen, A.M. Wheat yield prediction using machine learning and advanced sensing techniques. Comput. Electron. Agric. 2016, 121, 57–65. [Google Scholar] [CrossRef]
  9. Schut, A.G.; Traore, P.C.S.; Blaes, X.; Rolf, A. Assessing yield and fertilizer response in heterogeneous smallholder fields with UAVs and satellites. Field Crop. Res. 2018, 221, 98–107. [Google Scholar] [CrossRef]
  10. Tardieu, F.; Cabrera-Bosquet, L.; Pridmore, T.; Bennett, M. Plant phenomics, from sensors to knowledge. Curr. Biol. 2017, 27, R770–R783. [Google Scholar] [CrossRef]
  11. Araus, J.L.; Cairns, J.E. Field high-throughput phenotyping: The new crop breeding frontier. Trends Plant Sci. 2014, 19, 52–61. [Google Scholar] [CrossRef] [PubMed]
  12. Montesinos-López, O.A.; Montesinos-López, A.; Crossa, J.; de los Campos, G.; Alvarado, G.; Suchismita, M.; Rutkoski, J.; González-Pérez, L.; Burgueño, J. Predicting grain yield using canopy hyperspectral reflectance in wheat breeding data. Plant Methods 2017, 13, 4. [Google Scholar] [CrossRef] [PubMed] [Green Version]
  13. Feng, L.; Zhang, Z.; Ma, Y.; Du, Q.; Williams, P.; Drewry, J.; Luck, B. Alfalfa Yield Prediction Using UAV-Based Hyperspectral Imagery and Ensemble Learning. Remote Sens. 2020, 12, 2028. [Google Scholar] [CrossRef]
  14. Zha, H.; Miao, Y.; Wang, T.; Li, Y.; Zhang, J.; Sun, W.; Feng, Z.; Kusnierek, K. Improving unmanned aerial vehicle remote sensing-based rice nitrogen nutrition index prediction with machine learning. Remote Sens. 2020, 12, 215. [Google Scholar] [CrossRef] [Green Version]
  15. Lobell, D.B.; Di Tommaso, S.; You, C.; Yacoubou Djima, I.; Burke, M.; Kilic, T. Sight for sorghums: Comparisons of Satellite-and ground-based sorghum yield estimates in mali. Remote Sens. 2020, 12, 100. [Google Scholar] [CrossRef] [Green Version]
  16. Yoosefzadeh-Najafabadi, M.; Earl, H.J.; Tulpan, D.; Sulik, J.; Eskandari, M. Application of Machine Learning Algorithms in Plant Breeding: Predicting Yield From Hyperspectral Reflectance in Soybean. Front. Plant Sci. 2021, 11. [Google Scholar] [CrossRef]
  17. Kycko, M.; Zagajewski, B.; Lavender, S.; Romanowska, E.; Zwijacz-Kozica, M. The Impact of Tourist Traffic on the Condition and Cell Structures of Alpine Swards. Remote Sens. 2018, 10, 220. [Google Scholar] [CrossRef] [Green Version]
  18. Schweiger, A.K.; Cavender-Bares, J.; Townsend, P.A.; Hobbie, S.E.; Madritch, M.D.; Wang, R.; Tilman, D.; Gamon, J.A. Plant spectral diversity integrates functional and phylogenetic components of biodiversity and predicts ecosystem function. Nat. Ecol. Evol. 2018, 2, 976–982. [Google Scholar] [CrossRef]
  19. Hassan, M.A.; Yang, M.; Rasheed, A.; Jin, X.; Xia, X.; Xiao, Y.; He, Z. Time-Series Multispectral Indices from Unmanned Aerial Vehicle Imagery Reveal Senescence Rate in Bread Wheat. Remote Sens. 2018, 10, 809. [Google Scholar] [CrossRef] [Green Version]
  20. Bendig, J.; Bolten, A.; Bennertz, S.; Broscheit, J.; Eichfuss, S.; Bareth, G. Estimating biomass of barley using crop surface models (CSMs) derived from UAV-based RGB imaging. Remote Sens. 2014, 6, 10395–10412. [Google Scholar] [CrossRef] [Green Version]
  21. Duan, T.; Zheng, B.; Guo, W.; Ninomiya, S.; Guo, Y.; Chapman, S.C. Comparison of ground cover estimates from experiment plots in cotton, sorghum and sugarcane based on images and ortho-mosaics captured by UAV. Funct. Plant Biol. 2017, 44, 169–183. [Google Scholar] [CrossRef]
  22. Watanabe, K.; Guo, W.; Arai, K.; Takanashi, H.; Kajiya-Kanegae, H.; Kobayashi, M.; Yano, K.; Tokunaga, T.; Fujiwara, T.; Tsutsumi, N. High-throughput phenotyping of sorghum plant height using an unmanned aerial vehicle and its application to genomic prediction modeling. Front. Plant Sci. 2017, 8, 421. [Google Scholar] [CrossRef] [Green Version]
  23. Filippa, G.; Cremonese, E.; Migliavacca, M.; Galvagno, M.; Sonnentag, O.; Humphreys, E.; Hufkens, K.; Ryu, Y.; Verfaillie, J.; Morra di Cella, U.; et al. NDVI derived from near-infrared-enabled digital cameras: Applicability across different plant functional types. Agric. For. Meteorol. 2018, 249, 275–285. [Google Scholar] [CrossRef]
  24. Jolly, W.M.; Nemani, R.; Running, S.W. A generalized, bioclimatic index to predict foliar phenology in response to climate. Glob. Chang. Biol. 2005, 11, 619–632. [Google Scholar] [CrossRef]
  25. Lopez-Cruz, M.; Olson, E.; Rovere, G.; Crossa, J.; Dreisigacker, S.; Mondal, S.; Singh, R.; de los Campos, G. Regularized selection indices for breeding value prediction using hyper-spectral image data. Sci. Rep. 2020, 10, 1–12. [Google Scholar] [CrossRef]
  26. Hesami, M.; Naderi, R.; Tohidfar, M.; Yoosefzadeh-Najafabadi, M. Development of support vector machine-based model and comparative analysis with artificial neural network for modeling the plant tissue culture procedures: Effect of plant growth regulators on somatic embryogenesis of chrysanthemum, as a case study. Plant Methods 2020, 16, 1–15. [Google Scholar] [CrossRef]
  27. Nezami-Alanagh, E.; Garoosi, G.-A.; Landín, M.; Gallego, P.P. Combining DOE with neurofuzzy logic for healthy mineral nutrition of pistachio rootstocks in vitro culture. Front. Plant Sci. 2018, 9, 1474. [Google Scholar] [CrossRef]
  28. Zhang, Z.; Jin, Y.; Chen, B.; Brown, P. California almond yield prediction at the orchard level with a machine learning approach. Front. Plant Sci. 2019, 10, 809. [Google Scholar] [CrossRef] [PubMed] [Green Version]
  29. Rodriguez-Galiano, V.; Sanchez-Castillo, M.; Chica-Olmo, M.; Chica-Rivas, M. Machine learning predictive models for mineral prospectivity: An evaluation of neural networks, random forest, regression trees and support vector machines. Ore Geol. Rev. 2015, 71, 804–818. [Google Scholar] [CrossRef]
  30. Gandhi, N.; Armstrong, L.J.; Petkar, O.; Tripathy, A.K. Rice crop yield prediction in India using support vector machines. In Proceedings of the 2016 13th International Joint Conference on Computer Science and Software Engineering (JCSSE), Kaen, Thailand, 13–15 July 2016; pp. 1–5. [Google Scholar]
  31. Bhojani, S.H.; Bhatt, N. Wheat crop yield prediction using new activation functions in neural network. Neural Comput. Appl. 2020, 32, 13941–13951. [Google Scholar] [CrossRef]
  32. Yoosefzadeh-Najafabadi, M.; Tulpan, D.; Eskandari, M. Application of machine learning and genetic optimization algorithms for modeling and optimizing soybean yield using its component traits. PLoS ONE 2021, 16, e0250665. [Google Scholar] [CrossRef]
  33. Jin, Z.; Zhuang, Q.; Tan, Z.; Dukes, J.S.; Zheng, B.; Melillo, J.M. Do maize models capture the impacts of heat and drought stresses on yield? Using algorithm ensembles to identify successful approaches. Glob. Chang. Biol. 2016, 22, 3112–3126. [Google Scholar] [CrossRef] [PubMed]
  34. You, J.; Li, X.; Low, M.; Lobell, D.; Ermon, S. Deep gaussian process for crop yield prediction based on remote sensing data. In Proceedings of the Thirty-First AAAI conference on artificial intelligence, San Francisco, CA, USA, 4–9 February 2017. [Google Scholar]
  35. Benedetti, P.; Ienco, D.; Gaetano, R.; Ose, K.; Pensa, R.G.; Dupuy, S. M3Fusion: A Deep Learning Architecture for Multiscale Multimodal Multitemporal Satellite Data Fusion. IEEE J. Sel. Top. Appl. Earth Obs. Remote Sens. 2018, 11, 4939–4949. [Google Scholar] [CrossRef] [Green Version]
  36. Shen, D.; Wu, G.; Suk, H.-I. Deep learning in medical image analysis. Annu. Rev. Biomed. Eng. 2017, 19, 221–248. [Google Scholar] [CrossRef] [PubMed] [Green Version]
  37. Ravi, D.; Wong, C.; Lo, B.; Yang, G.-Z. Deep learning for human activity recognition: A resource efficient implementation on low-power devices. In Proceedings of the 2016 IEEE 13th international conference on wearable and implantable body sensor networks (BSN), San Francisco, CA, USA, 14–17 June 2016; pp. 71–76. [Google Scholar]
  38. Yu, N.; Li, L.; Schmitz, N.; Tian, L.F.; Greenberg, J.A.; Diers, B.W. Development of methods to improve soybean yield estimation and predict plant maturity with an unmanned aerial vehicle based platform. Remote Sens. Environ. 2016, 187, 91–101. [Google Scholar] [CrossRef]
  39. Ali, I.; Cawkwell, F.; Green, S.; Dwyer, N. Application of statistical and machine learning models for grassland yield estimation based on a hypertemporal satellite remote sensing time series. In Proceedings of the 2014 IEEE Geoscience and Remote Sensing Symposium, Quebec City, QC, Canada, 13–18 July 2014; pp. 5060–5063. [Google Scholar]
  40. Ribeiro, M.H.D.M.; dos Santos Coelho, L. Ensemble approach based on bagging, boosting and stacking for short-term prediction in agribusiness time series. Appl. Soft Comput. 2020, 86, 105837. [Google Scholar] [CrossRef]
  41. Dietterich, T.G. Ensemble methods in machine learning. In International workshop on multiple classifier systems; Springer: Berlin/Heidelberg, Germany, 2000; pp. 1–15. [Google Scholar]
  42. Divina, F.; Gilson, A.; Goméz-Vela, F.; García Torres, M.; Torres, J.F. Stacking ensemble learning for short-term electricity consumption forecasting. Energies 2018, 11, 949. [Google Scholar] [CrossRef] [Green Version]
  43. Fernandes, J.L.; Ebecken, N.F.F.; Esquerdo, J.C.D.M. Sugarcane yield prediction in Brazil using NDVI time series and neural networks ensemble. Int. J. Remote Sens. 2017, 38, 4631–4644. [Google Scholar] [CrossRef]
  44. Breiman, L. Bagging predictors. Mach. Learn. 1996, 24, 123–140. [Google Scholar] [CrossRef] [Green Version]
  45. Galar, M.; Fernandez, A.; Barrenechea, E.; Bustince, H.; Herrera, F. A review on ensembles for the class imbalance problem: Bagging-, boosting-, and hybrid-based approaches. IEEE Trans. Syst. Manand Cybern. Part C (Appl. Rev.) 2011, 42, 463–484. [Google Scholar] [CrossRef]
  46. Schapire, R.E. A brief introduction to boosting. In Proceedings of the Ijcai, New York, NY, USA, 9–15 July 2016; pp. 1401–1406. [Google Scholar]
  47. Zhou, Z.-H. Ensemble Methods: Foundations and Algorithms; CRC Press: Boca Raton, FL, USA, 2012. [Google Scholar]
  48. Hesami, M.; Jones, A.M.P. Application of artificial intelligence models and optimization algorithms in plant cell and tissue culture. Appl. Microbiol. Biotechnol. 2020, 104, 1–37. [Google Scholar] [CrossRef]
  49. Hesami, M.; Naderi, R.; Tohidfar, M.; Yoosefzadeh-Najafabadi, M. Application of adaptive neuro-fuzzy inference system-non-dominated sorting genetic Algorithm-II (ANFIS-NSGAII) for modeling and optimizing somatic embryogenesis of Chrysanthemum. Front. Plant Sci. 2019, 10, 869. [Google Scholar] [CrossRef]
  50. Dao, D.-N.; Guo, L.-X. New hybrid SPEA/R-deep learning to predict optimization parameters of cascade FOPID controller according engine speed in powertrain mount system control of half-car dynamic model. J. Intell. Fuzzy Syst. 2020, 39, 53–68. [Google Scholar] [CrossRef]
  51. Zhao, F.; Lei, W.; Ma, W.; Liu, Y.; Zhang, C. An improved SPEA2 algorithm with adaptive selection of evolutionary operators scheme for multiobjective optimization problems. Math. Probl. Eng. 2016, 2016. [Google Scholar] [CrossRef] [Green Version]
  52. Stroup, W.; Mulitze, D. Nearest neighbor adjusted best linear unbiased prediction. Am. Stat. 1991, 45, 194–200. [Google Scholar]
  53. Katsileros, A.; Drosou, K.; Koukouvinos, C. Evaluation of nearest neighbor methods in wheat genotype experiments. Commun. Biometry Crop Sci. 2015, 10, 115–123. [Google Scholar]
  54. Bowley, S. A Hitchhiker’s Guide to Statistics in Plant Biology; Any Old Subject Books: Guelph, ON, Canada, 1999. [Google Scholar]
  55. Fehr, W.; Caviness, C.; Burmood, D.; Pennington, J. Stage of development descriptions for soybeans, Glycine max (L.) Merrill 1. Crop Sci. 1971, 11, 929–931. [Google Scholar] [CrossRef]
  56. Goldberger, A.S. Best linear unbiased prediction in the generalized linear regression model. J. Am. Stat. Assoc. 1962, 57, 369–375. [Google Scholar] [CrossRef]
  57. Ozaki, Y.; McClure, W.F.; Christy, A.A. Near-Infrared Spectroscopy in Food Science and Technology; John Wiley & Sons: Hoboken, NJ, USA, 2006. [Google Scholar]
  58. Rossel, R.A.V. ParLeS: Software for chemometric analysis of spectroscopic data. Chemom. Intell. Lab. Syst. 2008, 90, 72–83. [Google Scholar] [CrossRef]
  59. Savitzky, A.; Golay, M.J. Smoothing and differentiation of data by simplified least squares procedures. Anal. Chem. 1964, 36, 1627–1639. [Google Scholar] [CrossRef]
  60. Huang, H.; Zeng, Q.; Pei, X.; Wong, S.; Xu, P. Predicting crash frequency using an optimised radial basis function neural network model. Transp. A: Transp. Sci. 2016, 12, 330–345. [Google Scholar] [CrossRef] [Green Version]
  61. Zeng, Q.; Huang, H. A stable and optimized neural network model for crash injury severity prediction. Accid. Anal. Prev. 2014, 73, 351–358. [Google Scholar] [CrossRef] [PubMed]
  62. Gal, T.; Greenberg, H.J. Advances in Sensitivity Analysis and Parametric Programming; Springer Science & Business Media: New York, NY, USA, 2012; Volume 6. [Google Scholar]
  63. Chen, X.-w.; Jeong, J.C. Enhanced recursive feature elimination. In Proceedings of the Sixth International Conference on Machine Learning and Applications (ICMLA 2007), Cincinnati, OH, USA, 13–15 December 2007; pp. 429–435. [Google Scholar]
  64. Kuhn, M. Building predictive models in R using the caret package. J. Stat. Softw. 2008, 28, 1–26. [Google Scholar] [CrossRef] [Green Version]
  65. Van Der Meij, B.; Kooistra, L.; Suomalainen, J.; Barel, J.M.; De Deyn, G.B. Remote sensing of plant trait responses to field-based plant-soil feedback using UAV-based optical sensors. Biogeosciences 2017, 14, 733. [Google Scholar] [CrossRef] [Green Version]
  66. Zhao, B.; Ma, B.L.; Hu, Y.; Liu, J. Characterization of nitrogen and water status in oat leaves using optical sensing approach. J. Sci. Food Agric. 2015, 95, 367–378. [Google Scholar] [CrossRef]
  67. Yu, K.; Gnyp, M.; Gao, J.; Miao, Y.; Chen, X.; Bareth, G. Using Partial Least Squares (PLS) to Estimate Canopy Nitrogen and Biomass of Paddy Rice in China’s Sanjiang Plain. In Proceedings of the Workshop on UAV-based Remote Sensing Methods for Monitoring Vegetation, Cologne, Germany, 9–10 September 2013; Bendig, J., Bareth, G., Eds.; Kölner Geographische Arbeiten: Cologne, Germany; pp. 99–103. [Google Scholar]
  68. Tucker, C.J. Red and photographic infrared linear combinations for monitoring vegetation. Remote Sens. Environ. 1979, 8, 127–150. [Google Scholar] [CrossRef] [Green Version]
  69. Gitelson, A.; Merzlyak, M.N. Quantitative estimation of chlorophyll-ausing reflectance spectra: Experiments with autumn chestnut and maple leaves. J. Photochem. Photobiol. B Biol. 1994, 22, 247–252. [Google Scholar] [CrossRef]
  70. Wu, C.; Niu, Z.; Tang, Q.; Huang, W.; Rivard, B.; Feng, J. Remote estimation of gross primary production in wheat using chlorophyll-related vegetation indices. Agric. For. Meteorol. 2009, 149, 1015–1021. [Google Scholar] [CrossRef]
  71. Kooistra, L.; Suomalainen, J.; Iqbal, S.; Franke, J.; Wenting, P.; Bartholomeus, H.; Mücher, S.; Becker, R. Crop monitoring using a light-weight hyperspectral mapping system for unmanned aerial vehicles: First results for the 2013 season. In Proceedings of the 2013 Workshop on UAV-based Remote Sensing Methods for Monitoring Vegetation, Cologne, Germany, 9–10 September 2013; p. 5158. [Google Scholar]
  72. Mutanga, O.; Skidmore, A.K. Narrow band vegetation indices overcome the saturation problem in biomass estimation. Int. J. Remote Sens. 2004, 25, 3999–4014. [Google Scholar] [CrossRef]
  73. Thenkabail, P.S.; Smith, R.B.; De Pauw, E. Hyperspectral vegetation indices and their relationships with agricultural crop characteristics. Remote Sens. Environ. 2000, 71, 158–182. [Google Scholar] [CrossRef]
  74. Rodriguez, D.; Fitzgerald, G.; Belford, R.; Christensen, L. Detection of nitrogen deficiency in wheat from spectral reflectance indices and basic crop eco-physiological concepts. Aust. J. Agric. Res. 2006, 57, 781–789. [Google Scholar] [CrossRef] [Green Version]
  75. Gitelson, A.A.; Kaufman, Y.J.; Merzlyak, M.N. Use of a green channel in remote sensing of global vegetation from EOS-MODIS. Remote Sens. Environ. 1996, 58, 289–298. [Google Scholar] [CrossRef]
  76. Roujean, J.-L.; Breon, F.-M. Estimating PAR absorbed by vegetation from bidirectional reflectance measurements. Remote Sens. Environ. 1995, 51, 375–384. [Google Scholar] [CrossRef]
  77. Tian, Y.; Yao, X.; Yang, J.; Cao, W.; Hannaway, D.; Zhu, Y. Assessing newly developed and published vegetation indices for estimating rice leaf nitrogen concentration with ground-and space-based hyperspectral reflectance. Field Crop. Res. 2011, 120, 299–310. [Google Scholar] [CrossRef]
  78. Datt, B. A new reflectance index for remote sensing of chlorophyll content in higher plants: Tests using Eucalyptus leaves. J. Plant Physiol. 1999, 154, 30–36. [Google Scholar] [CrossRef]
  79. Xue, L.; Cao, W.; Luo, W.; Dai, T.; Zhu, Y. Monitoring leaf nitrogen status in rice with canopy spectral reflectance. Agron. J. 2004, 96, 135–142. [Google Scholar] [CrossRef]
  80. Zhu, Y.; Yao, X.; Tian, Y.; Liu, X.; Cao, W. Analysis of common canopy vegetation indices for indicating leaf nitrogen accumulations in wheat and rice. Int. J. Appl. Earth Obs. Geoinf. 2008, 10, 1–10. [Google Scholar] [CrossRef]
  81. McMurtrey Iii, J.; Chappelle, E.; Kim, M.; Meisinger, J.; Corp, L. Distinguishing nitrogen fertilization levels in field corn (Zea mays L.) with actively induced fluorescence and passive reflectance measurements. Remote Sens. Environ. 1994, 47, 36–44. [Google Scholar] [CrossRef]
  82. Chen, P.; Haboudane, D.; Tremblay, N.; Wang, J.; Vigneault, P.; Li, B. New spectral indicator assessing the efficiency of crop nitrogen treatment in corn and wheat. Remote Sens. Environ. 2010, 114, 1987–1997. [Google Scholar] [CrossRef]
  83. Chappelle, E.W.; Kim, M.S.; McMurtrey III, J.E. Ratio analysis of reflectance spectra (RARS): An algorithm for the remote estimation of the concentrations of chlorophyll a, chlorophyll b, and carotenoids in soybean leaves. Remote Sens. Environ. 1992, 39, 239–247. [Google Scholar] [CrossRef]
  84. Sims, D.A.; Gamon, J.A. Relationships between leaf pigment content and spectral reflectance across a wide range of species, leaf structures and developmental stages. Remote Sens. Environ. 2002, 81, 337–354. [Google Scholar] [CrossRef]
  85. Gupta, R.; Vijayan, D.; Prasad, T. Comparative analysis of red-edge hyperspectral indices. Adv. Space Res. 2003, 32, 2217–2222. [Google Scholar] [CrossRef]
  86. Zarco-Tejada, P.J.; Miller, J.R. Land cover mapping at BOREAS using red edge spectral parameters from CASI imagery. J. Geophys. Res. Atmos. 1999, 104, 27921–27933. [Google Scholar] [CrossRef]
  87. Orr, M.J. Introduction to Radial Basis Function Networks; Technical Report; Center for Cognitive Science, University of Edinburgh: Edinburgh, UK, 1996. [Google Scholar]
  88. Wilamowski, B.M.; Jaeger, R.C. Implementation of RBF type networks by MLP networks. In Proceedings of the International Conference on Neural Networks (ICNN’96), Washington, DC, USA, 3–6 June 1996; pp. 1670–1675. [Google Scholar]
  89. Vapnik, V. The Nature of Statistical Learning Theory; Springer: New York, NY, USA, 2000. [Google Scholar]
  90. Ye, Y.; Chen, L.; Wang, D.; Li, T.; Jiang, Q.; Zhao, M. SBMDS: An interpretable string based malware detection system using SVM ensemble with bagging. J. Comput. Virol. 2009, 5, 283. [Google Scholar] [CrossRef] [Green Version]
  91. Liaw, A.; Wiener, M. Classification and regression by randomForest. R News 2002, 2, 18–22. [Google Scholar]
  92. Hall, M.; Frank, E.; Holmes, G.; Pfahringer, B.; Reutemann, P.; Witten, I.H. The WEKA data mining software: An update. Acm Sigkdd Explor. Newsl. 2009, 11, 10–18. [Google Scholar] [CrossRef]
  93. Du, J.; Xu, Y. Hierarchical deep neural network for multivariate regression. Pattern Recognit. 2017, 63, 149–157. [Google Scholar] [CrossRef]
  94. Pal, S.K.; Mitra, S. Multilayer perceptron, fuzzy sets, classifiaction. IEEE Trans. Neural Netw. 1992, 3, 683–697. [Google Scholar] [CrossRef]
  95. Dao, D.-N.; Guo, L.-X. New hybrid between SPEA/R with deep neural network: Application to predicting the multi-objective optimization of the stiffness parameter for powertrain mount systems. J. Low Freq. Noisevibration Act. Control 2020, 39, 53–68. [Google Scholar] [CrossRef] [Green Version]
  96. Maheta, H.H.; Dabhi, V.K. An improved SPEA2 Multi objective algorithm with non dominated elitism and Generational Crossover. In Proceedings of the 2014 International Conference on Issues and Challenges in Intelligent Computing Techniques (ICICT), Ghaziabad, India, 7–8 February 2014; pp. 75–82. [Google Scholar]
  97. Zitzler, E.; Laumanns, M.; Thiele, L. SPEA2: Improving the strength Pareto evolutionary algorithm. TIK-Report 2001, 103. [Google Scholar] [CrossRef]
  98. Galli, G.; Horne, D.W.; Collins, S.D.; Jung, J.; Chang, A.; Fritsche-Neto, R.; Rooney, W.L. Optimization of UAS-based high-throughput phenotyping to estimate plant health and grain yield in sorghum. Plant Phenome J. 2020, 3, e20010. [Google Scholar] [CrossRef]
  99. Mladenova, I.E.; Bolten, J.D.; Crow, W.T.; Anderson, M.C.; Hain, C.R.; Johnson, D.M.; Mueller, R. Intercomparison of soil moisture, evaporative stress, and vegetation indices for estimating corn and soybean yields over the US. IEEE J. Sel. Top. Appl. Earth Obs. Remote Sens. 2017, 10, 1328–1343. [Google Scholar] [CrossRef]
  100. Zhou, X.; Zheng, H.; Xu, X.; He, J.; Ge, X.; Yao, X.; Cheng, T.; Zhu, Y.; Cao, W.; Tian, Y. Predicting grain yield in rice using multi-temporal vegetation indices from UAV-based multispectral and digital imagery. Isprs J. Photogramm. Remote Sens. 2017, 130, 246–255. [Google Scholar] [CrossRef]
  101. Bala, S.; Islam, A. Correlation between potato yield and MODIS-derived vegetation indices. Int. J. Remote Sens. 2009, 30, 2491–2507. [Google Scholar] [CrossRef]
  102. Aparicio, N.; Villegas, D.; Casadesus, J.; Araus, J.L.; Royo, C. Spectral vegetation indices as nondestructive tools for determining durum wheat yield. Agron. J. 2000, 92, 83–91. [Google Scholar] [CrossRef]
  103. Kumar, R.; Silva, L. Light ray tracing through a leaf cross section. Appl. Opt. 1973, 12, 2950–2954. [Google Scholar] [CrossRef]
  104. Woolley, J.T. Reflectance and transmittance of light by leaves. Plant Physiol. 1971, 47, 656–662. [Google Scholar] [CrossRef] [Green Version]
  105. Ji, J.; Scott, M.; Bhattacharyya, M. Light is Essential for Degradation of Ribulose-1, 5-Bisphosphate Carboxylase-Oxygenase Large Subunit During Sudden Death Syndrome Development in Soybean. Plant Biol. 2006, 8, 597–605. [Google Scholar] [CrossRef] [Green Version]
  106. Cabrera-Bosquet, L.; Crossa, J.; von Zitzewitz, J.; Serret, M.D.; Luis Araus, J. High-throughput phenotyping and genomic selection: The frontiers of crop breeding converge. J. Integr. Plant Biol. 2012, 54, 312–320. [Google Scholar] [CrossRef] [Green Version]
  107. Kandel, Y.R.; Wise, K.A.; Bradley, C.A.; Tenuta, A.U.; Mueller, D.S. Effect of planting date, seed treatment, and cultivar on plant population, sudden death syndrome, and yield of soybean. Plant Dis. 2016, 100, 1735–1743. [Google Scholar] [CrossRef] [Green Version]
  108. Ford, D.M.; Shibles, R.; Green, D. Growth and Yield of Soybean Lines Selected for Divergent Leaf Photosynthetic Ability1. Crop Sci. 1983, 23, 517–520. [Google Scholar] [CrossRef]
  109. Karmakar, P.; Bhatnagar, P. Genetic improvement of soybean varieties released in India from 1969 to 1993. Euphytica 1996, 90, 95–103. [Google Scholar]
  110. Hennessy, A.; Clarke, K.; Lewis, M. Hyperspectral Classification of Plants: A Review of Waveband Selection Generalisability. Remote Sens. 2020, 12, 113. [Google Scholar] [CrossRef] [Green Version]
  111. Mariotto, I.; Thenkabail, P.S.; Huete, A.; Slonecker, E.T.; Platonov, A. Hyperspectral versus multispectral crop-productivity modeling and type discrimination for the HyspIRI mission. Remote Sens. Environ. 2013, 139, 291–305. [Google Scholar] [CrossRef]
  112. Thenkabail, P.S.; Mariotto, I.; Gumma, M.K.; Middleton, E.M.; Landis, D.R.; Huemmrich, K.F. Selection of hyperspectral narrowbands (HNBs) and composition of hyperspectral twoband vegetation indices (HVIs) for biophysical characterization and discrimination of crop types using field reflectance and Hyperion/EO-1 data. IEEE J. Sel. Top. Appl. Earth Obs. Remote Sens. 2013, 6, 427–439. [Google Scholar] [CrossRef] [Green Version]
  113. Ollinger, S.V. Sources of variability in canopy reflectance and the convergent properties of plants. New Phytol. 2011, 189, 375–394. [Google Scholar] [CrossRef]
  114. Blackburn, G.A. Hyperspectral remote sensing of plant pigments. J. Exp. Bot. 2007, 58, 855–867. [Google Scholar] [CrossRef] [PubMed] [Green Version]
  115. G. Jones, T.; Coops, N.C.; Sharma, T. Employing ground-based spectroscopy for tree-species differentiation in the Gulf Islands National Park Reserve. Int. J. Remote Sens. 2010, 31, 1121–1127. [Google Scholar] [CrossRef]
  116. Knipling, E.B. Physical and physiological basis for the reflectance of visible and near-infrared radiation from vegetation. Remote Sens. Environ. 1970, 1, 155–159. [Google Scholar] [CrossRef]
  117. CABRERA-BOSQUET, L.; Albrizio, R.; Nogues, S.; Araus, J.L. Dual Δ13C/δ18O response to water and nitrogen availability and its relationship with yield in field-grown durum wheat. Plantcell Environ. 2011, 34, 418–433. [Google Scholar] [CrossRef]
  118. Gholizadeh, A.; Mišurec, J.; Kopačková, V.; Mielke, C.; Rogass, C. Assessment of red-edge position extraction techniques: A case study for norway spruce forests using hymap and simulated sentinel-2 data. Forests 2016, 7, 226. [Google Scholar] [CrossRef] [Green Version]
  119. Mehdaoui, R.; Anane, M. Exploitation of the red-edge bands of Sentinel 2 to improve the estimation of durum wheat yield in Grombalia region (Northeastern Tunisia). Int. J. Remote Sens. 2020, 41, 8986–9008. [Google Scholar] [CrossRef]
  120. Guerini Filho, M.; Kuplich, T.M.; Quadros, F.L.D. Estimating natural grassland biomass by vegetation indices using Sentinel 2 remote sensing data. Int. J. Remote Sens. 2020, 41, 2861–2876. [Google Scholar] [CrossRef]
  121. Fernández, C.I.; Leblon, B.; Haddadi, A.; Wang, K.; Wang, J. Potato late blight detection at the leaf and canopy levels based in the red and red-edge spectral regions. Remote Sens. 2020, 12, 1292. [Google Scholar] [CrossRef] [Green Version]
  122. Babar, M.; Reynolds, M.; Van Ginkel, M.; Klatt, A.; Raun, W.; Stone, M. Spectral reflectance to estimate genetic variation for in-season biomass, leaf chlorophyll, and canopy temperature in wheat. Crop Sci. 2006, 46, 1046–1057. [Google Scholar] [CrossRef]
  123. Rutherford, A. Introducing ANOVA and ANCOVA: A GLM Approach; Sage: London, UK, 2001. [Google Scholar]
  124. Homack, S.R. Understanding What ANOVA Post Hoc Tests Are, Really. In Proceedings of the Annual Meeting of the Southwest Educational Research Association, New Orleans, LA, USA, 1–3 February 2001. [Google Scholar]
  125. Yeom, S.; Giacomelli, I.; Menaged, A.; Fredrikson, M.; Jha, S. Overfitting, robustness, and malicious algorithms: A study of potential causes of privacy risk in machine learning. J. Comput. Secur. 2020, 28, 35–70. [Google Scholar] [CrossRef] [Green Version]
  126. Yang, P.; Hwa Yang, Y.; B Zhou, B.; Y Zomaya, A. A review of ensemble methods in bioinformatics. Curr. Bioinform. 2010, 5, 296–308. [Google Scholar] [CrossRef] [Green Version]
  127. Belayneh, A.; Adamowski, J.; Khalil, B.; Ozga-Zielinski, B. Long-term SPI drought forecasting in the Awash River Basin in Ethiopia using wavelet neural network and wavelet support vector regression models. J. Hydrol. 2014, 508, 418–429. [Google Scholar] [CrossRef]
  128. Mahalingam, T.; Subramoniam, M. ACO–MKFCM: An Optimized Object Detection and Tracking Using DNN and Gravitational Search Algorithm. Wirel. Pers. Commun. 2020, 110, 1567–1604. [Google Scholar] [CrossRef]
  129. Nigam, A.; Tiwari, A.K.; Pandey, A. Paddy leaf diseases recognition and classification using PCA and BFO-DNN algorithm by image processing. Mater. Today Proc. 2020, 33, 4856–4862. [Google Scholar] [CrossRef]
  130. Kukana, P. Hybrid Machine Learning Algorithm-Based Paddy Leave Disease Detection System. In Proceedings of the 2020 International Conference on Smart Electronics and Communication (ICOSEC), Trichy, India, 10–12 September 2020; pp. 512–519. [Google Scholar]
  131. Alam, M.; Mukhopadhyay, D. How secure are deep learning algorithms from side-channel based reverse engineering? In Proceedings of the 56th Annual Design Automation Conference 2019, Las Vegas, NV, USA, 2–6 June 2019; pp. 1–2. [Google Scholar]
  132. Goodfellow, I.; Bengio, Y.; Courville, A.; Bengio, Y. Deep Learning; MIT Press: Cambridge, MA, USA, 2016; Volume 1. [Google Scholar]
  133. Bisong, E. The Multilayer Perceptron (MLP). In Building Machine Learning and Deep Learning Models on Google Cloud Platform; Springer: Berkeley, CA, USA, 2019; pp. 401–405. [Google Scholar]
  134. Ge, Y.; Wang, Q.; Wang, L.; Wu, H.; Peng, C.; Wang, J.; Xu, Y.; Xiong, G.; Zhang, Y.; Yi, Y. Predicting post-stroke pneumonia using deep neural network approaches. Int. J. Med Inform. 2019, 132, 103986. [Google Scholar] [CrossRef] [PubMed]
  135. Makantasis, K.; Karantzalos, K.; Doulamis, A.; Doulamis, N. Deep supervised learning for hyperspectral data classification through convolutional neural networks. In Proceedings of the 2015 IEEE International Geoscience and Remote Sensing Symposium (IGARSS), Milan, Italy, 26–31 July 2015; pp. 4959–4962. [Google Scholar]
  136. Slinkard, A.; Solh, M.; Vandenberg, A. Breeding for yield: The direct approach. In Linking Research and Marketing Opportunities for Pulses in the 21st Century; Springer: Dordrecht, The Netherlands, 2000; pp. 183–190. [Google Scholar]
  137. Jin, J.; Liu, X.; Wang, G.; Mi, L.; Shen, Z.; Chen, X.; Herbert, S.J. Agronomic and physiological contributions to the yield improvement of soybean cultivars released from 1950 to 2006 in Northeast China. Field Crop. Res. 2010, 115, 116–123. [Google Scholar] [CrossRef]
  138. Ma, B.; Dwyer, L.M.; Costa, C.; Cober, E.R.; Morrison, M.J. Early prediction of soybean yield from canopy reflectance measurements. Agron. J. 2001, 93, 1227–1234. [Google Scholar] [CrossRef] [Green Version]
  139. Shigang, F.; Qian, A. Multi-objective reactive power optimization using SPEA2. High Volt. Eng. 2007, 33, 115–119. [Google Scholar]
  140. Zaloga, A.; Burakov, S.; Yakimov, I.; Gusev, K.; Dubinin, P. Multi-population evolutionary algorithm SPEA2 for crystal structure determination from X-ray powder diffraction data. In Proceedings of the IOP Conference Series: Materials Science and Engineering, Krasnoyarsk, Russia, 18–21 November 2019; p. 012102. [Google Scholar]
  141. King, R.A.; Deb, K.; Rughooputh, H. Comparison of NSGA-II and SPEA2 on the multiobjective environmental/economic dispatch problem. Univ. Maurit. Res. J. 2010, 16, 485–511. [Google Scholar]
Figure 1. Test site location in 2018 and 2019.
Remotesensing 13 02555 g001
Figure 2. The schematic view of the Deep Neural Network (DNN) algorithm.
Remotesensing 13 02555 g002
Figure 3. The schematic diagram of the Improved version of the strength Pareto evolutionary algorithms-2 (SPEA2) as multi-objective optimization algorithm.
Remotesensing 13 02555 g003
Figure 4. The experimental workflow of algorithm selection and validation to predict the soybean fresh biomass (FBIO) and seed yield using hyperspectral vegetation indices (HVI). DNN; deep neural network, EB; ensemble bagging.
Remotesensing 13 02555 g004
Figure 5. The variation of (A) yield and (B) fresh biomass (FBIO) across four environments.
Remotesensing 13 02555 g005
Figure 6. Pearson correlation analysis of hyperspectral vegetation indices (HVI), soybean seed yield and fresh biomass (FBIO).
Remotesensing 13 02555 g006
Figure 7. Violin plots representing the coefficient of determination (R2), mean absolute errors (MAE), root mean square error (RMSE) of yield (AC) and fresh biomass (DF) performance of the deep neural network (DNN) algorithm and ensemble-bagging (EB) strategy for soybean yield and fresh biomass prediction using hyperspectral vegetation indices (HVI).
Remotesensing 13 02555 g007
Figure 8. The importance of the tested hyperspectral vegetation indices (HVI) based on the recursive feature elimination (RFE) strategy for predicting soybean seed yield and fresh biomass (FBIO).
Remotesensing 13 02555 g008
Figure 9. Optimized hyperspectral vegetation indices (HVI) values in soybeans with maximized seed yield and fresh biomass (FBIO).
Remotesensing 13 02555 g009
Table 1. Summary of the selected hyperspectral vegetation indices (HVI) used in this study.
Index CategoryAbbreviationFormulaReference
Normalized difference vegetation index
(NDVI)
N1[584 nm − 471 nm]/[584 nm + 471 nm][65]
N2[689 nm − 521 nm]/[689 nm + 521 nm][65]
N3[760 nm − 550 nm]/[760 nm + 550 nm][66]
N4[740 nm − 667 nm]/[740 nm + 667 nm][67]
N5[800 nm − 670 nm]/[800 nm + 670 nm][68]
N6[750 nm − 705 nm]/[750 nm + 705 nm][69]
N7[750 nm − 710 nm]/[750 nm + 710 nm][70]
N8[780 nm − 710 nm]/[780 nm + 710 nm][71]
N9[750 nm − 710 nm]/[750 nm + 710 nm][72]
N10[732 nm − 717 nm]/[732 nm + 717 nm][72]
N11[820 nm − 720 nm]/[820 nm + 720 nm][73]
N12[750 nm − 735 nm]/[750 nm + 734 nm][72]
Normalized difference red edge (NDRE)NDRE[790 nm − 720 nm]/[790 nm + 720 nm][74]
Green normalized difference vegetation index (GNDVI)GNDVI[750 nm − 550 nm]/[750 nm + 550 nm][75]
Renormalized difference vegetation index (RDVI)RDVI[800 nm − 670 nm]/[800 nm + 670 nm][76]
Simple ratio index
(SRI)
S1[565 nm/533 nm][77]
S2[750 nm/550 nm][78]
S3[760 nm/550 nm][66]
S4[810 nm/560 nm][79]
S5[734 nm/629 nm][67]
S6[810 nm/660 nm][80]
S7[700 nm/670 nm][81]
S8[800 nm/670 nm][82]
S9[675 nm/700 nm][83]
S10[800 nm/680 nm][84]
S11[752 nm/690 nm][78]
S12[750 nm/700 nm][78]
S13[750 nm/705 nm][69]
S14[706 nm/755 nm][72]
S15[747 nm/708 nm][85]
S16[750 nm/710 nm][86]
S17[741 nm/717 nm][85]
S18[735 nm/720 nm][85]
S19[738 nm/720 nm][85]
Publisher’s Note: MDPI stays neutral with regard to jurisdictional claims in published maps and institutional affiliations.

