Abstract
The Tibetan Plateau (TP), known as “The Roof of World”, has expansive alpine grasslands and is a hotspot for climate change studies. However, cropland expansion and increasing anthropogenic activities have been poorly documented, let alone the effects of agricultural activities on food security and environmental change in the TP. The existing cropland mapping products do not depict the spatiotemporal characteristics of the TP due to low accuracies and inconsistent cropland distribution, which is affected by complicated topography and impedes our understanding of cropland expansion and its associated environmental impacts. One of the biggest challenges of cropland mapping in the TP is the diverse crop phenology across a wide range of elevations. To decrease the classification errors due to elevational differences in crop phenology, we developed two pixel- and phenology-based algorithms to map croplands using Landsat imagery and the Google Earth Engine platform along the Brahmaputra River and its two tributaries (BRTT) in the Tibet Autonomous Region, also known as the granary of TP, in 2015–2019. Our first phenology-based cropland mapping algorithm (PCM1) used different thresholds of land surface water index (LSWI) by considering varied crop phenology along different elevations. The second algorithm (PCM2) further offsets the phenological discrepancy along elevational gradients by considering the length and peak of the growing season. We found that PCM2 had a higher accuracy with fewer images compared with PCM1. The number of images for PCM2 was 279 less than PCM1, and the Matthews correlation coefficient for PCM2 was 0.036 higher than PCM1. We also found that the cropland area in BRTT was estimated to be 1979 ± 52 km2 in the late 2010s. Croplands were mainly distributed in the BRTT basins with elevations of 3800–4000 m asl. Our phenology-based methods were effective for mapping croplands in mountainous areas. The spatially explicit information on cropland area and distribution in the TP aid future research into the effects of cropland expansion on food security and environmental change in the TP.
1. Introduction
Although agricultural activities in the Tibetan Plateau (TP) are uncommon and only comprise less than 1% of the land cover, they play an important role in regional food security given the strong dependence of people’s livelihoods on local grains. Over 55% of Tibet’s cereal is produced along the Brahmaputra River and its two tributaries (BRTT), the Lhasa River and Nyang Qu River, despite its small area (5.5% of Tibet) [1]. The Tibetan Plateau has experienced significant warming in the past few decades, affecting cultivation suitability at higher elevations through temperature stress, water availability, and other environmental conditions [1,2]. With rapid population growth and climate warming, agriculture has expanded significantly both horizontally and vertically in the past few decades [3]. This expansion has come with ecological consequences due to Tibet’s fragile environment, including desertification, degradation, and water supply loss [1,4,5,6,7,8]. Cropland maps are essential for understanding the spatiotemporal pattern of cropland changes and their environmental effects [9]. However, croplands in the TP have been overlooked and their spatial distributions are unclear in the existing land cover and land use products due to the complicated topography and fragmented landscape on the plateau [10].
Satellite remote sensing is the main approach for mapping croplands at large scales, but it is challenging to use in the TP considering the complicated topography, heterogeneous landscape, and insufficient satellite observations due to frequent clouds in the summer formed by warm and humid airflow raised by topography [10,11,12,13]. Until now, cropland mapping products on the plateau have been mainly produced by visual interpretation, which is time consuming, labor intensive, and difficult to apply on large spatial scales [1,2,3,14]. Spatially explicit reconstruction models (e.g., spatial production allocation model (SPAM)) have also been used to estimate historical cropland change by using statistical data and remote sensing variables to reconstruct cropland distribution [15,16,17]. However, the accuracy and spatial resolution of the spatially explicit reconstruction models are usually inferior to remote sensing approaches. Moderate resolution imaging spectroradiometer (MODIS) data have been used for crop monitoring in the TP because of their high temporal resolution [18,19,20], but their application is limited in the TP due to their coarse spatial resolution (500 m) [21].
Long-term, moderate spatial resolution Landsat data are currently the optimal data source for cropland mapping. The release of Landsat data from USGS has provided an unparalleled opportunity to map croplands at a 30-m resolution and monitor land cover dynamic changes since the first Landsat launch in 1972 [22,23]. Many previous studies have used Landsat data and phenology-based methods to map cropland extent or major crops [24,25,26,27,28,29,30]. In the TP, the cropping system has a single cropping pattern and relatively concentrated planting and harvesting periods, which allow us to detect croplands because of their distinct phenology [31]. Specifically, the crop growing seasons are mainly from April to October due to cold temperatures on the plateau during winter and early spring (monthly mean temperature below 5 °C [32]) and human management. However, the growing season of the steppe is from June to October because of the relatively colder and semiarid climate [33]. The phenological difference between cropland and natural vegetation can be easily captured by time series of vegetation indices (VIs), such as the normalized difference vegetation index (NDVI), enhanced vegetation index (EVI), and land surface water index (LSWI) [34,35,36,37]. However, the phenology of vegetation is elevation dependent due to temperature gradients [38]. As elevation increases, crop planting and harvesting both occur later [32]; thus, it is necessary to develop different thresholds according to different elevation gradients for a more robust approach.
A previous study found that annual land cover mapping and retrospective analysis of land cover change is impossible in the TP due to insufficient satellite observations in the TP [11]. Thus, all available Landsat data should be used in multiple-year time frames to reduce uncertainties in image quality. A similar strategy was used for tracking rice paddy dynamics in Northeast China [25,39], historical encroachment of red cedar in the U.S. Southern Great Plains [35], and forest cover dynamics for the Carpathian ecoregion in Eastern Europe [40].
Here, we develop two efficient phenology-based algorithms to map the croplands in the granary of the TP, the BRTT region, by using all the available Landsat images and the Google Earth Engine (GEE) cloud-computing platform. Specifically, our objectives were to (1) develop robust and transferable pixel- and phenology-based algorithms to detect croplands in the BRTT region and (2) quantify the area and spatial distribution of croplands in 2015–2019.
2. Materials and Methods
2.1. Study Area
The study area (28°20′ ~ 31°20′N, 89°00′ ~ 92°35′E) was the Brahmaputra River and its two tributaries in the Tibet Autonomous Region (BRTT) of China, which covers 18 counties (6.65 × 10⁴ km2) in the Lhasa, Lhoka, and Shigatse Prefectures (Figure 1). The climate on the plateau is characterized by low temperatures, with average annual temperature varying between 4.7 °C and 8.3 °C. The average annual precipitation varies between 252 to 580 mm and falls mainly between May and September [41]. There is a precipitation gradient that decreases from southeast to northwest and is strongly controlled by topography [42]. The average elevation ranges from 3500 to 4200 m and decreases from west to east. Solar radiation is high with annual total solar radiation from 7600 to 8000 MJ/m2 and average annual sunshine time from 2800 to 3300 h [1]. The dominant vegetation is grassland, which occupies about 77% of the land area [32].
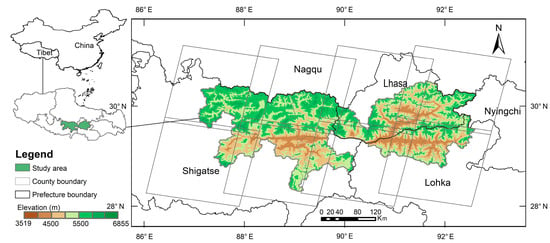
Figure 1.
The location and topography of study area, including 18 counties and eight Landsat scenes that cover the study area.
The croplands are mainly distributed in the BRTT due to hydrothermal conditions, where it is suitable for agriculture and is designated as the “crop-dominated zone” of Tibet [43,44]. Woodlands only exist in the southeast or where they are planted around some croplands for wind shelters. The main crop types are highland barley, spring wheat, rapeseed, and pea. Wheat and barley are the staple crops that account for up to 60% of crops sown [45]. The growing season of staple crops is mainly concentrated with sowing in April and maturing in September. Planting and harvest would be delayed accordingly at higher elevations where temperatures are cooler.
2.2. Data
2.2.1. Landsat Data and Pre-Processing
We used all of the Landsat 7 Enhanced Thematic Mapper (ETM+) and Landsat 8 Operational Land Imager (OLI) Surface Reflectance images from 2015 to 2019, which were collected and atmospherically corrected in the GEE platform. There are small but significant differences between Landsat ETM+ and OLI due to different acquisition conditions, sensors, and other factors. The improved OLI calibration resulted in narrower wavebands than ETM+. Specifically, the OLI-based NDVI is greater than the ETM+-based NDVI. Thus, we applied coefficients to harmonize the two Landsat datasets [46]. The study area is covered by 8 Landsat scenes (path/rows of 140/39, 139/39, 138/39, 137/39, 137/40, 140/40, 139/40, 138/40) (Figure 1). We counted the number of observations annually for all the available Landsat 7/8 surface reflectance data by path/row (Figure 2a) and by month (Figure 2b) during the main growing season (April–October) from 2015 to 2019. We assessed the pixel quality of individual pixels according to the pixel_qa band. The cloud, cloud shadows, and snow/ice were identified as bad observations according to the Fmask [47] and metadata. Fmask has good performance to screen cloudy, cloud shadows, and snow gridcells with an overall accuracy of 96.41% for Landsat 7 [48] and 89% for Landsat 8 [47]. Bins of the number of good observations as a percentage of all observations are illustrated for each year in Figure 2c, and the total number of good observations are in Figure S1.
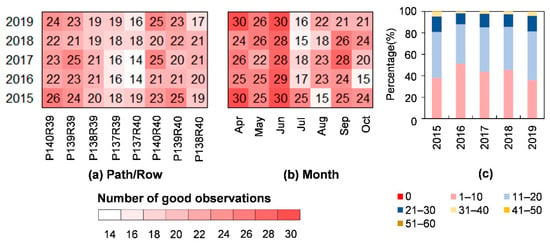
Figure 2.
The annual number of Landsat images in the study area during the growing season (April–October) from 2015 to 2019. Statistics were conducted by (a) path/row and (b) month. (c) Bins of the number of good observations as a percentage of all observations for each year.
We used the surface reflectance data filtered for good observations to calculate three VIs, including NDVI [49], EVI [50], and LSWI [51]. NDVI and EVI can reflect the greenness of vegetation, and the latter considers the impact of residual atmospheric contamination and soil background [50]. LSWI is sensitive to equivalent water thickness attributed to the SWIR band, which is sensitive to leaf water and soil moisture [52]. The time series of three VIs were used to analyze vegetation phenology and identify the unique characteristic of croplands. The following equations were used to calculate three VIs:
where , , , and are the surface reflectance values of the blue (450–520 nm, 452–512 nm), red (630–690 nm, 636–673 nm), near-infrared (770–900 nm, 851–879 nm), and shortwave-infrared bands (1550–1750 nm, 1556–1651 nm) from TM/ETM+ or OLI sensor, respectively.
We fitted phenology curves of cloud-free composite images at a 16-day interval to the LSWI temporal profile based on all Landsat 7/8 data over 2017–2019 on the GEE platform using the following steps. First, we composited three years of data into one year by taking the median values of LSWI at 16-day intervals from March to October. We started a month in advance to reconstruct the LSWI temporal curves in case there was a data gap in April which needed to interpolate the first 16-day LSWI value due to the snow or cloud contamination in early spring. Second, sometimes good observations cannot be obtained even after compositing three years of data in some regions, so we filled the data gaps using linear interpolation of the good observations before and after the gap [53]. Finally, we smoothed the curve using the Savitzky–Golay (S–G) filter to reconstruct the LSWI dataset. The S–G filter can effectively remove the noise that deviated from the normal growth trajectory and can better match the vegetation growth trajectory during the data reconstruction [54]. In this study, we defined the filtering window size of the S–G filter as 7, the number of time steps from right/left to the middle point as 3, the degree of the smoothing polynomial as 3, and the iteration times as 3. This process was completed using the GEE platform and is represented at a selected cropland site in Figure 3.

Figure 3.
The process to fit the land surface water index (LSWI) seasonal curve of an individual pixel using all available Landsat 7/8 data from 2017 to 2019. (a) Composite of three years of images to one year at a 16-day interval. (b) Linear interpolation. (c) Savitzky–Golay (S–G) filter. (d) The false-color composite of Landsat imagery at a cropland site.
2.2.2. Ground Truth Data
Ground truth data were collected randomly through visual interpretation of Google Earth’s high-resolution imagery and assisted by Landsat false-color composite imagery, which was composited during the growing season in the GEE platform. The imagery was used to distinguish the five-land use and land cover types (cropland, grassland, woodland, built-up, and water) through visual interpretation. As shown in the false-color composite (R: near-infrared, G: red, B: green) of Figure S2, croplands show a unique bright red color in July which is different from that of grasslands, because of the strong absorption of green leaves in the red band and high reflectance in the green and near-infrared bands (Figure S2). In total, we collected 2208 training points of interest (POIs) including 1204 cropland samples, 678 grassland samples, 219 woodland samples, 56 water samples, and 51 built-up samples. The distributions of the training POIs and Google Earth high-resolution images are shown in Figure S3.
2.2.3. Other Data
Shuttle Radar Topography Mission (SRTM) DEM data were used in this study, which have a 3-arc-second resolution in 2000 [55]. The SRTM DEM data are available in GEE, and we calculated elevation and slopes in GEE, which was used to divide training POIs into different elevation gradients.
China’s Land-Use/Cover Datasets (CLUDs) and three global land-use and land-cover datasets, including GlobeLand30, From-GLC, and MCD12Q1, were compared to the resultant map in this study (Table 1). CLUDs was created mainly using a human–computer interactive interpretation method based on Landsat TM\ETM+ images [56]. GlobeLand30 was produced using the pixel-object-knowledge classification methodology from Landsat/TM and China’s environmental satellite (HJ) [57]. From-GLC datasets utilized support vector machine, maximum likelihood classifier, and multi-source data, including MODIS time-series images, DEM, and soil water data [58]. MCD12Q1 used the random forests classification based on MC43A2 and MC43A4 products with ancillary information from a variety of sources [59].

Table 1.
Overview of the four cropland datasets used in this study.
2.3. Methods
Here, we developed two phenology-based methods to extract croplands in BRTT. The workflow is shown in Figure 4. First, training and validation POIs were generated using Google Earth’s high-resolution imagery, which were divided into four gradients using DEM data. Second, two phenology-based cropland mapping algorithms were used to produce cropland maps. Finally, the better cropland map was compared with four existent cropland datasets.
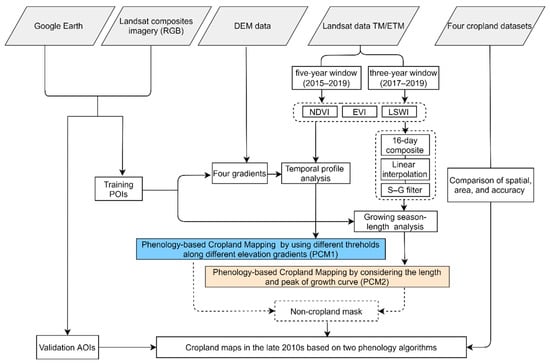
Figure 4.
Workflow for the phenology-based cropland mapping in this study.
2.3.1. The First Phenology-Based Cropland Mapping (PCM1)
From the temporal profile of NDVI, EVI, and LSWI at three randomly selected sites with different vegetation types in the study area, we found that croplands had a different phenology profile than the other vegetation types. More specifically, croplands had rapid growth in the summer and a rapid decline in autumn due to harvest, while natural vegetation did not exhibit this dramatic variation in phenology during the growing season (Figure 5). The orange shaded bar of Figure 5 showed a discrepancy between croplands and grasslands in July or August. The grassland cover was rather low in the arid and semiarid regions with low VIs values [60], while crop growth and cropland VIs peaked. The blue shaded bar showed a discrepancy between croplands and woodlands in September or October. Croplands were in lower greenness and water content with low VIs values during the harvest phase while woodlands were still in higher greenness and water content [9,41].
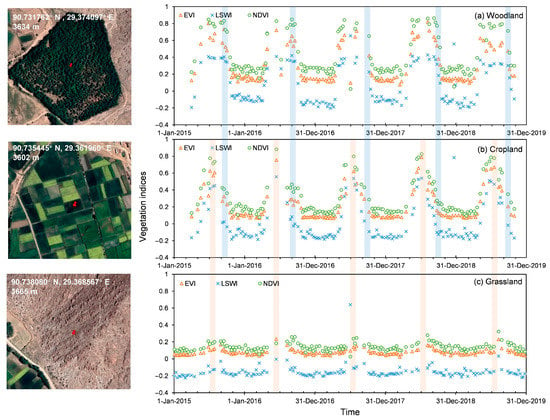
Figure 5.
Temporal profile analysis of the Landsat (ETM+/OLI)-based normalized difference vegetation index (NDVI), enhanced vegetation index (EVI), and land surface water index (LSWI) of (a) woodland, (b) cropland, and (c) grassland at selected sites during 2015–2019. The Google Earth high-resolution images were shown on the left. The orange and blue shaded bars showed the optimal time windows (July–August and September–October) to separate croplands from other vegetation types.
With increased elevation and decreased accumulated temperature, crop planting and harvesting time are delayed compared to the crops at lower elevations. According to our analyses of the seasonal variation of vegetation at four different elevation gradients, croplands are identifiable in certain phenological phases. For instance, croplands have higher planting density and water content around the peak of the growing season and exhibit bright red on the false-color composite of Landsat imagery, while other vegetation types exhibit dark red. At higher elevations, the peak of the growing season occurs later than at lower elevations, reflected by the later appearance of the brightest red on the monthly composited false-color imagery (Figure S4).
We quantified the difference in crop phenology at different elevations by calculating monthly mean and standard deviation (SD) of VIs based on the training POIs (1204 cropland pixels, 678 grassland pixels, and 219 woodland pixels) over 2015–2019. Cropland monthly mean VIs peaked later with increased elevation (Figure 6).
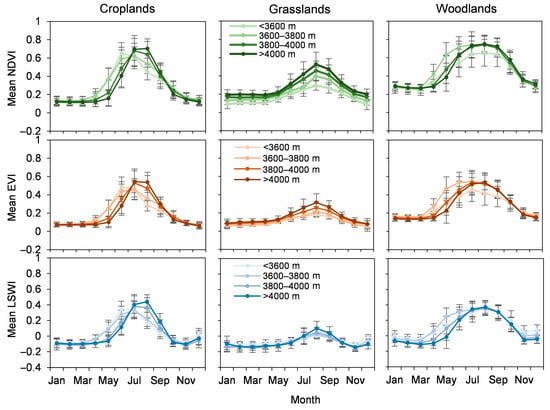
Figure 6.
Monthly mean and standard deviation (SD) of the Landsat (ETM+/OLI)-based normalized difference vegetation index (NDVI), enhanced vegetation index (EVI), land surface water index (LSWI) for croplands, grasslands, and woodlands at four different elevation gradients. The values were calculated based on the training POIs over the years of 2015–2019.
The first phenology-based cropland mapping algorithm (PCM1) was generated by using different thresholds along different elevation gradients in the months according to the phenological differences of different vegetation types. We chose five consecutive years, 2015–2019, of Landsat 7/8 images to ensure sufficient observations, as the TP has insufficient observations for annual land cover monitoring [11]. Cropland area was extracted using the following rules. First, the vegetation area was masked by using the mean NDVI over 0.3 in summer from June to August (NDVIsummer) (Figure S5). Second, we excluded woodlands by using the mean NDVI in October (NDVIOct) of less than 0.4 when the crops have matured with a low NDVI value (Figure 7). Third, we excluded the disturbance of grasslands by using the different thresholds at different elevation gradients. We used mean LSWI in July (LSWIJul) over 0.15 in areas with elevation ≤ 4000 m and mean LSWI in August (LSWIAug) over 0.25 in areas with elevation > 4000 m (Figure 7). We also used the thresholds of elevation < 5000 m and slope < 30° to reduce the commission error, as croplands rarely exist under this condition [19,32]. The PCM1 approach is conducted using the following formulas:
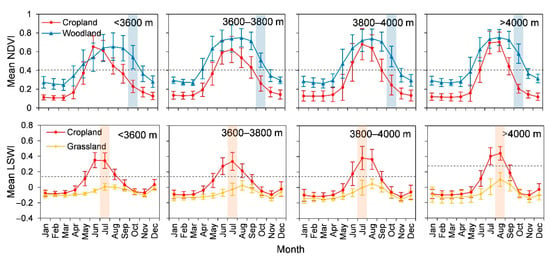
Figure 7.
The monthly mean and standard deviation (SD) of normalized difference vegetation index (NDVI) and land surface water index (LSWI) for croplands, grasslands, and woodlands at four elevation gradients based on training POIs over the years 2015–2019. The orange and blue shadows represent the optimal month to extract cropland from other vegetation types.
2.3.2. The Second Phenology-Based Cropland Mapping (PCM2)
The thresholds used in the PCM1 may be difficult to transfer to other periods due to interannual variations in image quality, crop growth, climate, and cloud cover [24]. In particular, thresholds selected in July and August with the above method were restricted by a lack of good observation in cloud-cover regions formed by warm and humid airflow raised by topography [12] (Figure S6 and S7). Therefore, we further improved the PCM1 algorithm based on the unique growing season length of croplands as well as the relatively higher greenness and water content at the peak of the growing season. The LSWI time series data showed larger differences in the growing season pattern of vegetation (Figure S8). We preprocessed the LSWI temporal profile according to the steps introduced in Section 2.2.1 and selected four groups of grassland, cropland, and woodland POIs at four elevation gradients for the LSWI time series analysis. Figure 8 indicated that the frequency of LSWI observations over 0.2 (FreqLSWI>0.2) can be used to separate croplands from grasslands as grassland LSWI values tended to be lower than 0.2 during the growing season.

Figure 8.
The seasonal dynamics of land surface water index (LSWI) for four groups of POIs with grassland, cropland, and woodland at four elevation gradients (a–d). Google Earth images corresponding to the POIs are shown under the curves.
Here, we improved the PCM1 algorithm by replacing Equation (5) with the frequency of LSWI observations over 0.2 from May to September and the maximum LSWI values during summer (June–August), as croplands have a longer growth period and higher water content than grasslands. We used FreqLSWI>0.2 around 3 to 8 times and the maximum LSWI (LSWImax) over 0.25 to exclude the disturbance of grasslands (Figure 9). Additionally, we used elevation < 5000 m and slope < 30°. We chose three consecutive years, 2017–2019, of Landsat 7/8 images to apply the second algorithm (PCM2) to extract the cropland area. The PCM2 approach is conducted using the following formulas:
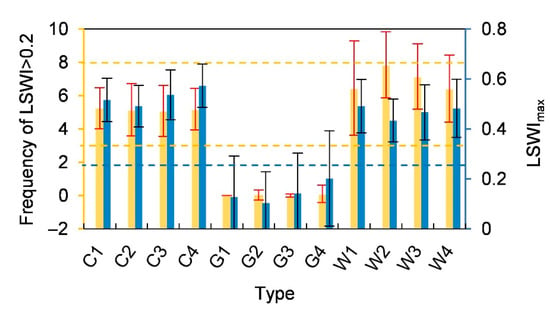
Figure 9.
Frequency of land surface water index (LSWI) over 0.2 and its standard deviation (SD) from May to September (yellow), and the max LSWI and its SD from June to August (blue) of three vegetation types within the training POIs at four elevation gradients. C, G, and W represent croplands, grasslands, and woodlands, respectively. 1, 2, 3, and 4 represent four elevation gradients (<3600 m, 3600–3800 m, 3800–4000 m, and >4000 m).
2.3.3. Accuracy Assessment of Cropland Maps and Comparison with Existing Maps
We used a stratified random sampling design to assign areas of interest (AOIs) to assess the accuracy of our resultant maps and the other four cropland maps. First, cropland and noncropland were stratified based on the CLUDs map in 2015. Second, random POIs were generated separately in each stratum, and we made AOIs as circle buffers of the POIs (diameter of 100 m). Good practices indicated the standard errors of producers, and overall accuracies are smaller for proportional allocation (the sample size should be proportional to the area of each stratum). In the meantime, the compromise between the user’s versus producer’s and overall accuracies can be achieved through shifting the proportional allocation by increasing the sample size in the rare classes [61]. Noncropland dominates the study area, therefore we generated more noncropland POIs than cropland POIs and increased the POIs proportion of croplands for good practice (the rare class here). Third, we verified the AOIs in each stratum through visual interpretation of Google Earth’s high-resolution imagery to correct obvious errors (e.g., wrong samples generated due to the data quality of CLUDs and cropland samples lying on the field boundary). Finally, 1100/10,944 validation AOIs/pixels were generated, which included 76/750 cropland AOIs/pixels and 1024/10,194 noncropland AOIs/pixels. The distribution of the validation AOIs was shown in Figure 10. The accuracy assessment was evaluated using the overall accuracy (OA), producer’s accuracy (PA), user’s accuracy (UA), and Matthews correlation coefficient (MCC) (Equation (11)). MCC produces a more informative and reliable score in evaluating binary classifications than F1 score and Kappa coefficient [62]. A confusion matrix of cropland maps was calculated to evaluate the accuracy of the results based on two phenological algorithms. Additionally, we adjusted the accuracy and estimated the area with 95% confidence intervals using the methods proposed by Olofsson et al. [63]:
where tp (true positives) represents actual positives that are correctly predicted positives; fn (false negatives) represents actual positives that are wrongly predicted negatives; tn (true negatives) represents actual negatives that are correctly predicted negatives; and fp (false positives) represents actual negatives that are wrongly predicted positives.
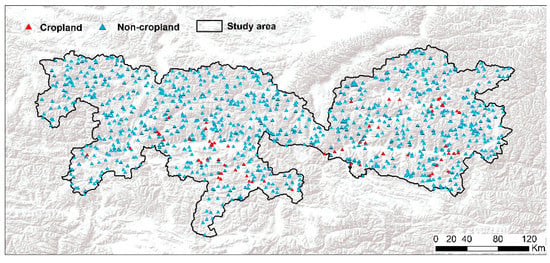
Figure 10.
Spatial distributions of the validation areas of interests (AOIs) of two stratums (cropland and noncropland). The background is the world terrain base map.
We also compared the resultant map with the other four cropland datasets (CLUDs in 2015, GlobeLand30 in 2020, FROM-GLC in 2017, and MCD12Q1 in 2019) based on different classification methods. Although these four products range from 2015 to 2020, we assumed they are comparable to our results because of the relatively stable land use on the TP within a few years. We reclassified the datasets into a cropland/noncropland map and resampled it into 30 m to match our results. The accuracy of these cropland maps was obtained by overall accuracy, MCC, commission error, and omission error using the same validation AOIs as in Figure 10.
3. Results
3.1. Accuracy Assessment
We conducted accuracy assessments of the two cropland maps using PCM1 over 2015–2019 and PCM2 over 2017–2019 as described in Section 2.3.3. We also adjusted the accuracies according to the mapped areas to obtain more reasonable results [61]. We found that the second cropland map, which used less data, had a slightly higher accuracy than the first one (Table 2). The MCCs were 0.875 in PCM1 and 0.911 in PCM2. The cropland category using PCM1 and PCM2 had adjusted OAs of 98.4% and 99.2%, adjusted PAs of 62.2% and 81.8%, and adjusted UAs of 92.6% and 90.8%, respectively (Table 2). The significant decline of adjusted PA was related to the extremely small proportion of cropland strata. The estimated areas with 95% confidence intervals increased from 1724 km2 to 2565 ± 94 km2 in PCM1 and from 1782 km2 to 1979 ± 52 km2 in PCM2, which fixed the potential omission error in the unadjusted results. Table S1 provided the confusion matrix of the cropland map. The total pixels in the confusion matrix were different because of missing pixels located in high mountains with elevation above 5000 m (3098 pixels of PCM1 and 122 pixels of PCM2), where we had no data for the study period, but this missing data did not affect our results considering there were no crops grown at such high elevations.

Table 2.
Nonadjusted/adjusted producer’s, user’s, and overall accuracies for the cropland maps produced using the first and second phenology-based cropland mapping algorithm (PCM1 and PCM2). The mapped areas/estimated areas with 95% confidence intervals were also shown in the table. PA, UA, and OA mean producer’s accuracy, user’s accuracy, and overall accuracy, respectively.
3.2. Cropland Map of BRTT in 2017–2019
Resultant maps based on PCM1 and PCM2 algorithms had a high spatial agreement, while the zoom-in views of four regions showed that the result from PCM2 was more continuous than that of PCM1 (Figure S9). Since PCM2 had a higher accuracy with less image processing compared with PCM1, the following results were analyzed based on PCM2. The spatial distribution of PCM2-based croplands during the study period (2017–2019) is shown in Figure 11. The croplands were mainly distributed in the basins of BRTT and presented a unique three-dimensional multilevel agricultural layout due to the different temperatures along the elevation gradient. Large and contiguous croplands were mainly concentrated in wide valleys with flat terrain and where irrigation was accessible, and small cropland fields were in the upper end of the tributaries with a higher elevation. Thus, croplands in BRTT had a dendritic distribution along rivers (Figure 11). The total cropland area for BRTT was estimated at 1979 ± 52 km2, which accounted for 3% of the total land area.
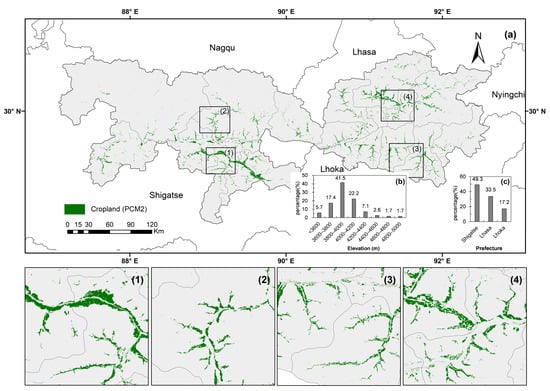
Figure 11.
(a) The spatial distributions of croplands in 2017–2019 based on the second phenology-based cropland mapping (PCM2) algorithm. (1–4) are the zoom-in views of four regions labeled in (a), respectively. (b) The proportion of cropland area in different elevation gradients. (c) The proportion of cropland area in three prefectures (Shigatse, Lhasa, and Lhoka Prefecture).
In terms of the distribution of the croplands along the different elevation gradients and prefectures, most of the croplands (81.2%) were distributed between elevations of 3600 m to 4200 m, while 41.5% of the croplands were concentrated between 3800 and 4000 m (Figure 11b). Croplands were mainly distributed in eastern Shigatse Prefecture and southern Lhasa Prefecture. Shigatse and Lhasa Prefectures accounted for 49.3% and 33.5% of the total cropland area, respectively, and contained over 80% of the croplands. Lhoka Prefecture only accounted for 17.2% of croplands (Figure 11c). Croplands in Shigatse were more concentrated than in the other two prefectures (Figure 11a).
3.3. Comparison of Penology-Based Map with Other Four Cropland Datasets
We compared the PCM2 cropland map for 2017–2019 with the other four cropland datasets ranging from 2015 to 2020 (Figure 12). The spatial pattern of croplands from PCM2 was visually consistent with that of the CLUDs and GlobeLand30-based cropland layers, while it was inconsistent with that of the FROM-GLC and MCD12Q1 cropland layers, especially in the western part of the study area (Figure 12a–e). Then, we selected a zoom-in view of five datasets as well as their false-color imagery in July composited from 2015 to 2019 and found PCM2 could exhibit the detailed spatial distribution of croplands at higher elevations, followed by results from CLUDs, GlobeLand30, FROM-GLC, and MCD12Q1. CLUDs and GlobeLand30 wrongly classified noncroplands near croplands as croplands, while From-GLC and MCD12Q1 ignored croplands. The cropland areas from these five datasets showed different results, with larger cropland areas in CLUDs and GlobeLand30 and much smaller cropland areas in From-GLC and MCD12Q1 (Figure 12f).
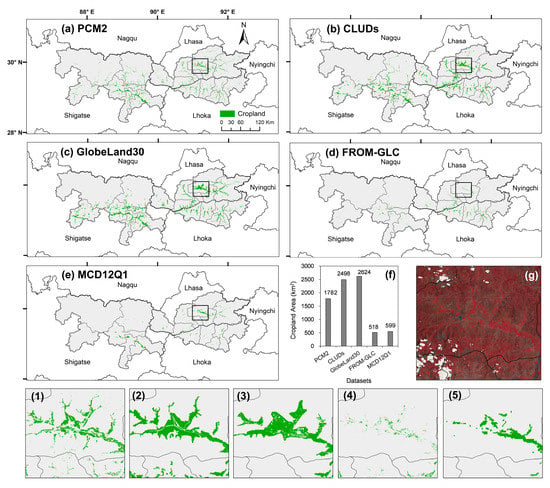
Figure 12.
Spatial distributions of croplands in the study area, as derived from the (a) PCM2 in this study, (b) China’s Land-Use/Cover Datasets (CLUDs), (c) GlobeLand30, (d) FROM-GLC, and (e) MCD12Q1. (f) shows the comparison of cropland areas from this study with the other four datasets. (g) exhibits false-color imagery in July in the case region marked in (a–e). (1–5) are the detailed spatial distributions of croplands according to the five maps.
The accuracies of these five cropland datasets were obtained by an error matrix using the same validation AOIs introduced in Section 2.3.3 and were adjusted. According to Table 3, PCM2 achieved the highest accuracy, with an adjusted OA of 98.8% and MCC of 0.911. The adjusted OA and MCC of CLUDs reached 98.8% and 0.898, and those of GlobeLand30 reached 97.4% and 0.798, respectively. Comparatively, the accuracies obtained with FROM-GLC and MCD12Q1 were relatively lower. The adjusted OA and MCC were 95.1% and 0.505 of FROM-GLC, and 94.5% and 0.413 of MCD12Q1. Furthermore, GlobeLand30 had a large adjusted commission error of 20.1%, which evidently overestimated cropland area. Moreover, FROM-GLC and MCD12Q1 had large adjusted omission errors of 86.6% and 85.9% due to the obviously underestimated cropland area.

Table 3.
Adjusted accuracies of the second phenology-based cropland map and the other four cropland datasets. MCC means Matthews correlation coefficient.
To show more spatial details of our results with other cropland datasets, we compared the PCM2-based cropland of 2017–2019 with the CLUDs-based cropland in 2015 (Figure S10). The cropland area of CLUDs was larger than our mapped cropland area (Figure S10d). According to three zoom-in views (Figure S10a–c), CLUDs overestimated cropland by wrongly classifying some grasslands near croplands or fallow lands as croplands (Figure S10e–i).
4. Discussion
4.1. Phenology-Based Approaches for Mapping Croplands in the Mountainous Area
We developed two phenology-based approaches for cropland mapping in a five-year (PCM1) and three-year (PCM2) window in BRTT, the granary of the Tibetan Plateau, by using all the available Landsat images and GEE. The first algorithm extracted croplands by selecting monthly thresholds based on the phenology of croplands while considering the phenological discrepancy of croplands at different elevations. The second algorithm performed better in the mountainous regions by considering the unique growing season length and peak of croplands. The phenological differences between croplands and other vegetation types in the study area were captured by VIs (NDVI, EVI, and LSWI). A relatively concentrated planting time (April–May), peak growing season (June–August), and harvesting time (September–October) of croplands are the critical windows in which croplands can be distinguished from natural vegetation. Therefore, our pixel- and phenology-based algorithm was successfully used to map croplands in BRTT. Such phenology-based algorithms have been widely used in land cover and crop mapping [25,35,64] and can be applied to other areas with similar climates and ecosystems [24,39].
Compared to the visual interpretation method and spatially explicit reconstruction models, the phenology-based method using Landsat images can extract cropland extent accurately and efficiently. The spatial location of existent cropland datasets was in high disagreement in alpine regions with multimountain topography and fragmented landscapes (Figure 12). Large commission errors (2.3–20%) and omission errors (20.6–86.6%) of the existent four cropland datasets obviously overestimated or underestimated cropland area in this region. Our phenology-based method with an adjusted overall accuracy of 98.8%, MCC with 0.911, and adjusted commission and omission error of 9.2% and 18.2% can provide accurate cropland information, especially cropland expansion at higher elevations in the alpine regions.
Our study indicated that the mapping of croplands using Landsat data with 30 m resolution and the phenology-based approach in the alpine regions with complicated landscapes and fragmentized topography is feasible and accurate. The PCM2 algorithm assessed the phenological differences in the growing season length and peak between croplands and natural vegetation, which was less affected by the image quality and cloud cover during the critical period of growing season and interannual variations in crop growth, climate, and other factors. Thus, it was more reliable and transferable to long-term cropland mapping. The GEE platform also provided the massive storage capacity and efficient computing capability necessary to analyze huge datasets such as the 30-m Landsat data. Our method has the potential to be utilized for tracking historical cropland changes in this region and could be applied to other regions with similar mountainous characteristics.
4.2. Uncertainty and Implications
The major challenge for our study stemmed from the extreme infrequency of observations and relatively poor image quality during the vegetation growing period in the TP. Therefore, we combined all the observations within a 5-year timeframe to generate the phenology profile in the PCM1 algorithm (Figure S11). The second phenology algorithm alleviated the problem of image quality by compositing 16-day observations and interpolating gaps of LSWI using a combination of 3-year data. LSWI is sensitive to the onset of the monsoon and has a strong relationship with cumulative rainfall, and this should be considered in further studies when filling the LSWI gaps [65]. Additionally, the fusion of high temporal resolution imagery (e.g., MODIS) with Landsat imagery can result in a dense time series remote sensing dataset with moderately fine spatial resolution, which could be useful for obtaining images during critical periods of the growing season to delineate small-scale farming systems and generate annual cropland maps in future studies [66,67,68,69].
The accuracy of our cropland maps was also affected by mixed vegetation types. Mixed pixels with different land-use types are difficult to identify in remote sensing [70]. Particularly since 1978, the Tibet autonomous government launched a well-known program known as the “shelter forest system” or “windbreaks” by planting arbors and shrubs around the croplands to conserve water and soil and prevent ecoenvironmental deterioration, such as desertification [7,71]. The forest belt consisted of several rows of trees planted around the croplands and other mixed vegetation types, which are difficult to detect with moderate resolution imagery. The fusion of Landsat and other moderate resolution sensors, such as Sentinel-2 and Gaofen-6, is expected to detect windbreaks in croplands.
The relatively lower adjusted PA revealed that the resultant cropland maps were conservative, which was mainly because of the sample variation and universal mixed pixels. It is difficult to distinguish crop types and fallow and abandoned land using visual interpretation of satellite imagery without field trips, and it cannot guarantee that land use has not changed during a multiyear timeframe. The sample variation could lead to a large error affecting the thresholds in the algorithm. More ground truth samples need to be collected, from both expert and citizen-science reference data [72] to better deal with mixed pixels and land use and land cover change to improve the algorithm. Moreover, the object-based approach might be utilized to further decrease the uncertainties of the pixel-based approach and overcome the mixed pixels in heterogeneous regions [73,74].
5. Conclusions
Despite croplands being a relatively small fraction of the land surface, croplands in the TP play an important role in regional food security and have undergone significant changes in the past few decades. The lack of accurate cropland maps at the regional scale limits our understanding of the current spatial distribution and historical changes of croplands in the TP. We used 1445 Landsat 7/8 images obtained in 2015–2019 and two pixel and phenology-based algorithms to extract croplands in the BRTT, the granary of the TP. The unique spectral characteristics and growth curve of croplands facilitated the cropland mapping in our study. With an adjusted overall accuracy of 98.8% and MCC of 0.911, the results indicated that the phenology-based algorithm could successfully extract croplands in the BRTT at a 3-year timeframe using all the available Landsat images and GEE. Our resultant maps showed that croplands were mainly distributed in the basins of the BRTT and had a dendritic distribution that mimicked their adjacent river systems. Crops were mainly grown at elevations between 3600 and 4200 m, and the Shigatse and Lhasa Prefectures were the main regions where croplands were concentrated. The uncertainties of our resultant map are related to the mixed pixel issues and insufficient observations in the region. The fusion of Landsat and other moderate resolution sensors, such as Sentinel-2 and Gaofen-6, is expected to enable the generation of annual cropland maps in the TP.
Supplementary Materials
The following are available online at https://www.mdpi.com/article/10.3390/rs13122289/s1, Figure S1: Number of good observations at the pixel level during the growing season (April–October) from 2015 to 2019 in the study area, Figure S2: Field photo, Google Earth high-resolution imagery, and Landsat false-color composite imagery of five land-use types, Figure S3: Spatial distributions of the training points of interests (POIs) of five land-use types, Figure S4: Landsat false-color composite imagery (R: near-infrared, G: red, B: green) of croplands from April to October at four elevation gradients, Figure S5: Monthly mean and standard deviation (SD) of Normalized Difference Vegetation Index (NDVI) for five land-use types based on the training POIs over years of 2015–2019, Figure S6: Number of good observations at the pixel level in July from 2015 to 2019 and total good observations over 2015–2019 in the study area, Figure S7: Number of good observations at the pixel level in August from 2015 to 2019 and total good observations over 2015–2019 in the study area, Figure S8: Monthly mean and standard deviation (SD) of Normalized Difference Vegetation Index (NDVI), Enhanced Vegetation Index (EVI), and Land Surface Water Index (LSWI) of cropland, grassland, and woodland based on the training POIs over years 2015–2019, Figure S9: The spatial distribution of croplands in the late 2010s derived from the PCM1 (2015–2019) and PCM2 (2017–2019) in the study area, Figure S10: Comparison of the cropland maps produced using the second Phenology-based Cropland Mapping (PCM2) algorithm in this study and China’s Land-Use/cover Datasets (CLUDs) in 2015, Figure S11: Cropland maps based on the first phenology-based cropland mapping (PCM1) algorithm composited imagery from one to five years, Table S1: Confusion matrix of cropland map based on the validation AOIs from high-resolution images from Google Earth and China’s Land-Use/cover Datasets (CLUDs) in 2015.
Author Contributions
Y.D. and G.Z. designed the research; Y.D., N.Y. and G.Z. analyzed data; Y.D. and G.Z. designed figures; all authors contributed to the results interpretation and discussion; Y.D. and G.Z. led the writing of the manuscript with input from N.Y., T.Y., Q.Z., R.L., R.B.D. and Y.Z. All authors have read and agreed to the published version of the manuscript.
Funding
This work was supported by the Second Tibetan Plateau Scientific Expedition and Research Program (2019QZKK0608) and the 2115 Talent Development Program of China Agricultural University.
Data Availability Statement
The cropland maps in this study can be accessible from the corresponding author upon request.
Conflicts of Interest
The authors declare no conflict of interest.
References
- Zhang, G.; Dong, J.; Zhou, C.; Xu, X.; Wang, M.; Ouyang, H.; Xiao, X. Increasing cropping intensity in response to climate warming in Tibetan Plateau, China. Field Crop. Res. 2013, 142, 36–46. [Google Scholar] [CrossRef]
- Gong, J.; Li, J.; Yang, J.; Li, S.; Tang, W. Land Use and Land Cover Change in the Qinghai Lake Region of the Tibetan Plateau and Its Impact on Ecosystem Services. Int. J. Environ. Res. Public Health 2017, 14, 818. [Google Scholar] [CrossRef] [PubMed]
- Bai, W.; Yao, L.; Zhang, Y.; Wang, C. Spatial-temporal Dynamics of Cultivated Land in Recent 35 Years in the Lhasa River Basin of Tibet. J. Nat. Resour. 2014, 29, 623–632. [Google Scholar]
- Liu, X.D.; Chen, B.D. Climatic warming in the Tibetan Plateau during recent decades. Int. J. Climatol. 2000, 20, 1729–1742. [Google Scholar] [CrossRef]
- Cui, X.; Graf, H.-F.; Langmann, B.; Chen, W.; Huang, R. Climate impacts of anthropogenic land use changes on the Tibetan Plateau. Glob. Planet. Chang. 2006, 54, 33–56. [Google Scholar] [CrossRef]
- Li, S.; Yang, P.; Gao, S.; Chen, H.; Yao, F. Dynamic Changes and Developmental Trends of the Land Desertification in Tibetan Plateau over the Past 10 Years. Adv. Earth Sci. 2004, 19, 63–70. [Google Scholar]
- Zhao, Y.-Z.; Zou, X.-Y.; Cheng, H.; Jia, H.-K.; Wu, Y.-Q.; Wang, G.-Y.; Zhang, C.-L.; Gao, S.-Y. Assessing the ecological security of the Tibetan plateau: Methodology and a case study for Lhaze County. J. Environ. Manag. 2006, 80, 120–131. [Google Scholar] [CrossRef] [PubMed]
- Wang, X.; He, K.; Dong, Z. Effects of climate change and human activities on runoff in the Beichuan River Basin in the northeastern Tibetan Plateau, China. Catena 2019, 176, 81–93. [Google Scholar] [CrossRef]
- Galford, G.L.; Mustard, J.F.; Melillo, J.; Gendrin, A.; Cerri, C.C. Wavelet analysis of MODIS time series to detect expansion and intensification of row-crop agriculture in Brazil. Remote Sens. Environ. 2008, 112, 576–587. [Google Scholar] [CrossRef]
- Lu, M.; Wu, W.; Zhang, L.; Liao, A.; Peng, S.; Tang, H. A comparative analysis of five global cropland datasets in China. Sci. China Earth Sci. 2016, 59, 2307–2317. [Google Scholar] [CrossRef]
- Zhou, Y.; Dong, J.; Liu, J.; Metternicht, G.; Shen, W.; You, N.; Zhao, G.; Xiao, X. Are There Sufficient Landsat Observations for Retrospective and Continuous Monitoring of Land Cover Changes in China? Remote Sens. 2019, 11, 1808. [Google Scholar] [CrossRef]
- Zhang, M.; Chen, F.; Tian, B.; Liang, D.; Yang, A. High-Frequency Glacial Lake Mapping Using Time Series of Sentinel-1A/1B SAR Imagery: An Assessment for the Southeastern Tibetan Plateau. Int. J. Environ. Res. Public Health 2020, 17, 1072. [Google Scholar] [CrossRef] [PubMed]
- Ma, Q.; You, Q.; Ma, Y.; Cao, Y.; Zhang, J.; Niu, M.; Zhang, Y. Changes in cloud amount over the Tibetan Plateau and impacts of large-scale circulation. Atmospheric Res. 2021, 249. [Google Scholar] [CrossRef]
- Wang, X.; Zheng, D.; Shen, Y. Land use change and its driving forces on the Tibetan Plateau during 1990–2000. Catena 2008, 72, 56–66. [Google Scholar] [CrossRef]
- Li, S.; Zhang, Y.; He, F. Reconstruction of cropland distribution in Qinghai and Tibet for the past one hundred years and its spatiotemporal changes. Prog. Geogr. 2015, 34, 197–206. [Google Scholar]
- Li, S.; Wang, Z.; Zhang, Y. Crop cover reconstruction and its effects on sediment retention in the Tibetan Plateau for 1900–2000. J. Geogr. Sci. 2017, 27, 786–800. [Google Scholar] [CrossRef]
- Luo, J.; Chen, Q.; Liu, F.; Zhang, Y.; Zhou, Q. Methods for reconstructing historical cropland spatial distribution of the Yellow River-Huangshui River valley in Tibetan Plateau. Prog. Geogr. 2015, 34, 207–216. [Google Scholar]
- Jia, K.; Liang, S.; Wei, X.; Yao, Y.; Su, Y.; Jiang, B.; Wang, X. Land Cover Classification of Landsat Data with Phenological Features Extracted from Time Series MODIS NDVI Data. Remote Sens. 2014, 6, 11518–11532. [Google Scholar] [CrossRef]
- Dan, L. Study on Spatio-Temporal Variations of Crop Planting Areas in the Valley of Brahmaputra and Lhasa River and Nian-Chu River, Tibet, China. Master’s Thesis, Southwest University, Chongqing, China, 2017. [Google Scholar]
- Chu, D.; Shrestha, B.; Wang, W.; Zhang, Y.; Liu, L.; Pradhan, S. Land Cover Mapping in the Tibet Plateau Using MODIS Imagery. Resour. Sci. 2010, 32, 2152–2159. [Google Scholar]
- Leroux, L.; Jolivot, A.; Bégué, A.; Seen, D.L.; Zoungrana, B. How Reliable is the MODIS Land Cover Product for Crop Mapping Sub-Saharan Agricultural Landscapes? Remote Sens. 2014, 6, 8541–8564. [Google Scholar] [CrossRef]
- Wulder, M.A.; Masek, J.G.; Cohen, W.B.; Loveland, T.R.; Woodcock, C.E. Opening the archive: How free data has enabled the science and monitoring promise of Landsat. Remote Sens. Environ. 2012, 122, 2–10. [Google Scholar] [CrossRef]
- Roy, D.P.; Wulder, M.; Loveland, T.R.; Woodcock, C.; Allen, R.; Anderson, M.; Helder, D.; Irons, J.; Johnson, D.; Kennedy, R.; et al. Landsat-8: Science and product vision for terrestrial global change research. Remote Sens. Environ. 2014, 145, 154–172. [Google Scholar] [CrossRef]
- Zhong, L.; Gong, P.; Biging, G.S. Efficient corn and soybean mapping with temporal extendability: A multi-year experiment using Landsat imagery. Remote Sens. Environ. 2014, 140, 1–13. [Google Scholar] [CrossRef]
- Dong, J.; Xiao, X.; Menarguez, M.A.; Zhang, G.; Qin, Y.; Thau, D.; Biradar, C.; Moore, B. Mapping paddy rice planting area in northeastern Asia with Landsat 8 images, phenology-based algorithm and Google Earth Engine. Remote Sens. Environ. 2016, 185, 142–154. [Google Scholar] [CrossRef] [PubMed]
- Gao, F.; Anderson, M.C.; Zhang, X.; Yang, Z.; Alfieri, J.G.; Kustas, W.P.; Mueller, R.; Johnson, D.M.; Prueger, J.H. Toward mapping crop progress at field scales through fusion of Landsat and MODIS imagery. Remote Sens. Environ. 2017, 188, 9–25. [Google Scholar] [CrossRef]
- Wang, J.; Xiao, X.; Liu, L.; Wu, X.; Qin, Y.; Steiner, J.L.; Dong, J. Mapping sugarcane plantation dynamics in Guangxi, China, by time series Sentinel-1, Sentinel-2 and Landsat images. Remote Sens. Environ. 2020, 247, 16. [Google Scholar] [CrossRef]
- Xiao, X.; Boles, S.; Frolking, S.; Li, C.; Babu, J.Y.; Salas, W.; Moore, B. Mapping paddy rice agriculture in South and Southeast Asia using multi-temporal MODIS images. Remote Sens. Environ. 2006, 100, 95–113. [Google Scholar] [CrossRef]
- Griffiths, P.; Nendel, C.; Hostert, P. Intra-annual reflectance composites from Sentinel-2 and Landsat for national-scale crop and land cover mapping. Remote Sens. Environ. 2019, 220, 135–151. [Google Scholar] [CrossRef]
- Song, X.-P.; Potapov, P.V.; Krylov, A.; King, L.; Di Bella, C.M.; Hudson, A.; Khan, A.; Adusei, B.; Stehman, S.V.; Hansen, M.C. National-scale soybean mapping and area estimation in the United States using medium resolution satellite imagery and field survey. Remote Sens. Environ. 2017, 190, 383–395. [Google Scholar] [CrossRef]
- Ding, M.; Chen, Q.; Xin, L.; Li, L.; Li, X. Spatial and temporal variations of multiple cropping index in China based on SPOT-NDVI during 1999-2013. Acta Geogr. Sinica 2015, 70, 1080–1090. [Google Scholar]
- Zhang, G.L. Response and Adaption of Agro-Ecosystem to Climate Warming in the Region Of Brahmaputra River and Its Two Tributaries in Tibet. Ph.D. Thesis, Institute of Geographic Sciences and Natural Resources Research, Chinese Academy of Sciences, Beijing, China, 2011. [Google Scholar]
- Cheng, M.; Jin, J.; Zhang, J.; Jiang, H.; Wang, R. Effect of climate change on vegetation phenology of different land-cover types on the Tibetan Plateau. Int. J. Remote Sens. 2018, 39, 470–487. [Google Scholar] [CrossRef]
- Diao, C.; Wang, L. Incorporating plant phenological trajectory in exotic saltcedar detection with monthly time series of Landsat imagery. Remote Sens. Environ. 2016, 182, 60–71. [Google Scholar] [CrossRef]
- Wang, J.; Xiao, X.; Qin, Y.; Dong, J.; Geissler, G.; Zhang, G.; Cejda, N.; Alikhani, B.; Doughty, R.B. Mapping the dynamics of eastern redcedar encroachment into grasslands during 1984–2010 through PALSAR and time series Landsat images. Remote Sens. Environ. 2017, 190, 233–246. [Google Scholar] [CrossRef]
- Zhang, G.; Biradar, C.; Xiao, X.; Dong, J.; Zhou, Y.; Qin, Y.; Zhang, Y.; Liu, F.; Ding, M.; Thomas, R.J. Exacerbated grassland degradation and desertification in Central Asia during 2000–2014. Ecol. Appl. 2018, 28, 442–456. [Google Scholar] [CrossRef]
- Zhang, G.; Xiao, X.; Dong, J.; Kou, W.; Jin, C.; Qin, Y.; Zhou, Y.; Wang, J.; Menarguez, M.A.; Biradar, C. Mapping paddy rice planting areas through time series analysis of MODIS land surface temperature and vegetation index data. ISPRS J. Photogramm. Remote Sens. 2015, 106, 157–171. [Google Scholar] [CrossRef]
- Piao, S.; Friedlingstein, P.; Ciais, P.; Viovy, N.; Demarty, J. Growing season extension and its impact on terrestrial carbon cycle in the Northern Hemisphere over the past 2 decades. Glob. Biogeochem. Cycles 2007, 21, 11. [Google Scholar] [CrossRef]
- Dong, J.; Xiao, X.; Kou, W.; Qin, Y.; Zhang, G.; Li, L.; Jin, C.; Zhou, Y.; Wang, J.; Biradar, C.; et al. Tracking the dynamics of paddy rice planting area in 1986–2010 through time series Landsat images and phenology-based algorithms. Remote Sens. Environ. 2015, 160, 99–113. [Google Scholar] [CrossRef]
- Griffiths, P.; Kuemmerle, T.; Baumann, M.; Radeloff, V.C.; Abrudan, I.V.; Lieskovsky, J.; Munteanu, C.; Ostapowicz, K.; Hostert, P. Forest disturbances, forest recovery, and changes in forest types across the Carpathian ecoregion from 1985 to 2010 based on Landsat image composites. Remote Sens. Environ. 2014, 151, 72–88. [Google Scholar] [CrossRef]
- Paltridge, N.; Tao, J.; Unkovich, M.; Bonamano, A.; Gason, A.; Grover, S.; Wilkins, J.; Tashi, N.; Coventry, D. Agriculture in central Tibet: An assessment of climate, farming systems, and strategies to boost production. Crop. Pasture Sci. 2009, 60, 627–639. [Google Scholar] [CrossRef]
- Anders, A.M.; Roe, G.H.; Hallet, B.; Montgomery, D.R.; Finnegan, N.J.; Putkonen, J. Spatial patterns of precipitation and topography in the Himalaya. In Tectonics, Climate, and Landscape Evolution; Geological Society of America: Boulder, CO, USA, 2006; Volume 398, pp. 39–53. [Google Scholar]
- Tashi, N.; Yanhua, L.; Partap, T. Making Tibet Food Secure: Assessment of Scenarios; International Centre for Integrated Mountain Development: Kathmandu, Nepal, 2002; p. 171. [Google Scholar]
- Wei, X.; Yang, P.; Dong, G. Agricultural Development and Farmland Desertification in Middle “One River and Its Two Branches” River Basin of Tibet. J. Desert Res. 2004, 24, 196–200. [Google Scholar]
- Ping, L.I.; Gaihe, Y.; Yongzhong, F. Analysis of the structure of compound agriculture-herding ecological system in the YLN Region of Tibet. Agric. Res. Arid Areas 2007, 25, 180–184. [Google Scholar]
- Roy, D.; Kovalskyy, V.; Zhang, H.; Vermote, E.; Yan, L.; Kumar, S.; Egorov, A. Characterization of Landsat-7 to Landsat-8 reflective wavelength and normalized difference vegetation index continuity. Remote Sens. Environ. 2016, 185, 57–70. [Google Scholar] [CrossRef]
- Zhu, Z.; Wang, S.; Woodcock, C.E. Improvement and expansion of the Fmask algorithm: Cloud, cloud shadow, and snow detection for Landsats 4–7, 8, and Sentinel 2 images. Remote Sens. Environ. 2015, 159, 269–277. [Google Scholar] [CrossRef]
- Zhu, Z.; Woodcock, C.E. Object-based cloud and cloud shadow detection in Landsat imagery. Remote Sens. Environ. 2012, 118, 83–94. [Google Scholar] [CrossRef]
- Tucker, C.J. Red and photographic infrared linear combinations for monitoring vegetation. Remote Sens. Environ. 1979, 8, 127–150. [Google Scholar] [CrossRef]
- Huete, A.; Didan, K.; Miura, T.; Rodriguez, E.P.; Gao, X.; Ferreira, L.G. Overview of the radiometric and biophysical performance of the MODIS vegetation indices. Remote Sens. Environ. 2002, 83, 195–213. [Google Scholar] [CrossRef]
- Xiao, X.; Boles, S.; Liu, J.; Zhuang, D.; Frolking, S.; Li, C.; Salas, W.; Moore, B. Mapping paddy rice agriculture in southern China using multi-temporal MODIS images. Remote Sens. Environ. 2005, 95, 480–492. [Google Scholar] [CrossRef]
- Xiao, X.; Hagen, S.; Zhang, Q.; Keller, M.; Moore, B. Detecting leaf phenology of seasonally moist tropical forests in South America with multi-temporal MODIS images. Remote Sens. Environ. 2006, 103, 465–473. [Google Scholar] [CrossRef]
- Kandasamy, S.; Baret, F.; Verger, A.; Neveux, P.; Weiss, M. A comparison of methods for smoothing and gap filling time series of remote sensing observations—Application to MODIS LAI products. Biogeosciences 2013, 10, 4055–4071. [Google Scholar] [CrossRef]
- Ma, X.; Chen, S.; Deng, J.; Feng, Q.; Huang, X. Vegetation phenology dynamics and its response to climate change on the Tibetan Plateau. Acta Pratacult. Sin. 2016, 25, 13–21. [Google Scholar]
- Lehner, B.; Verdin, K.; Jarvis, A. New Global Hydrography Derived From Spaceborne Elevation Data. Eos Trans. Am. Geophys. Union 2008, 89, 93–94. [Google Scholar] [CrossRef]
- Liu, J.; Kuang, W.; Zhang, Z.; Xu, X.; Qin, Y.; Ning, J.; Zhou, W.; Zhang, S.; Li, R.; Yan, C.; et al. Spatiotemporal characteristics, patterns, and causes of land-use changes in China since the late 1980s. J. Geogr. Sci. 2014, 24, 195–210. [Google Scholar] [CrossRef]
- Chen, J.; Chen, J.; Liao, A.P.; Cao, X.; Chen, L.J.; Chen, X.H.; He, C.Y.; Han, G.; Peng, S.; Lu, M.; et al. Global land cover mapping at 30m resolution: A POK-based operational approach. ISPRS J. Photogramm. Remote Sens. 2015, 103, 7–27. [Google Scholar] [CrossRef]
- Yu, L.; Wang, J.; Gong, P. Improving 30 m global land-cover map FROM-GLC with time series MODIS and auxiliary data sets: A segmentation-based approach. Int. J. Remote Sens. 2013, 34, 5851–5867. [Google Scholar] [CrossRef]
- Sulla-Menashe, D.; Gray, J.; Abercrombie, S.P.; Friedl, M.A. Hierarchical mapping of annual global land cover 2001 to present: The MODIS Collection 6 Land Cover product. Remote Sens. Environ. 2019, 222, 183–194. [Google Scholar] [CrossRef]
- Xue-Yong, Z.; Sen, L.; Chun-Lai, Z.; Guang-Rong, D.; Yu-Xiang, D.; Ping, Y. Desertification and control plan in the Tibet Autonomous Region of China. J. Arid. Environ. 2002, 51, 183–198. [Google Scholar] [CrossRef]
- Olofsson, P.; Foody, G.; Herold, M.; Stehman, S.V.; Woodcock, C.E.; Wulder, M.A. Good practices for estimating area and assessing accuracy of land change. Remote Sens. Environ. 2014, 148, 42–57. [Google Scholar] [CrossRef]
- Chicco, D.; Jurman, G. The advantages of the Matthews correlation coefficient (MCC) over F1 score and accuracy in binary classification evaluation. BMC Genom. 2020, 21, 13. [Google Scholar] [CrossRef]
- Olofsson, P.; Foody, G.; Stehman, S.V.; Woodcock, C.E. Making better use of accuracy data in land change studies: Estimating accuracy and area and quantifying uncertainty using stratified estimation. Remote Sens. Environ. 2013, 129, 122–131. [Google Scholar] [CrossRef]
- Zhang, R.; Ouyang, Z.-T.; Xie, X.; Guo, H.-Q.; Tan, D.-Y.; Xiao, X.-M.; Qi, J.-G.; Zhao, B. Impact of Climate Change on Vegetation Growth in Arid Northwest of China from 1982 to 2011. Remote Sens. 2016, 8, 364. [Google Scholar] [CrossRef]
- Chandrasekar, K.; Sai, M.V.R.S.; Roy, P.S.; Dwevedi, R.S. Land Surface Water Index (LSWI) response to rainfall and NDVI using the MODIS Vegetation Index product. Int. J. Remote Sens. 2010, 31, 3987–4005. [Google Scholar] [CrossRef]
- Gao, F.; Masek, J.; Schwaller, M.; Hall, F. On the blending of the Landsat and MODIS surface reflectance: Predicting daily Landsat surface reflectance. IEEE Trans. Geosci. Remote Sens. 2006, 44, 2207–2218. [Google Scholar] [CrossRef]
- Niu, Z.; Wu, M.; Wang, C. Use of MODIS and Landsat time series data to generate high-resolution temporal synthetic Landsat data using a spatial and temporal reflectance fusion model. J. Appl. Remote Sens. 2012, 6, 13. [Google Scholar] [CrossRef]
- Knauer, K.; Gessner, U.; Fensholt, R.; Forkuor, G.; Kuenzer, C. Monitoring Agricultural Expansion in Burkina Faso over 14 Years with 30 m Resolution Time Series: The Role of Population Growth and Implications for the Environment. Remote Sens. 2017, 9, 132. [Google Scholar] [CrossRef]
- Gao, F.; Hilker, T.; Zhu, X.; Anderson, M.; Masek, J.; Wang, P.; Yang, Y. Fusing Landsat and MODIS Data for Vegetation Monitoring. IEEE Geosci. Remote Sens. Mag. 2015, 3, 47–60. [Google Scholar] [CrossRef]
- Gong, P.; Wang, J.; Yu, L.; Zhao, Y.; Zhao, Y.; Liang, L.; Niu, Z.; Huang, X.; Fu, H.; Liu, S.; et al. Finer resolution observation and monitoring of global land cover: First mapping results with Landsat TM and ETM+ data. Int. J. Remote Sens. 2013, 34, 2607–2654. [Google Scholar] [CrossRef]
- Ding, M.; Zhang, Y.; Sun, X.; Liu, L.; Wang, Z.; Bai, W. Spatiotemporal variation in alpine grassland phenology in the Qinghai-Tibetan Plateau from 1999 to 2009. Chin. Sci. Bull. 2013, 58, 396–405. [Google Scholar] [CrossRef]
- Waldner, F.; Schucknecht, A.; Lesiv, M.; Gallego, J.; See, L.; Pérez-Hoyos, A.; D’Andrimont, R.; de Maet, T.; Bayas, J.C.L.; Fritz, S.; et al. Conflation of expert and crowd reference data to validate global binary thematic maps. Remote Sens. Environ. 2019, 221, 235–246. [Google Scholar] [CrossRef]
- Peña-Barragán, J.M.; Ngugi, M.K.; Plant, R.E.; Six, J. Object-based crop identification using multiple vegetation indices, textural features and crop phenology. Remote Sens. Environ. 2011, 115, 1301–1316. [Google Scholar] [CrossRef]
- Yin, H.; Prishchepov, A.V.; Kuemmerle, T.; Bleyhl, B.; Buchner, J.; Radeloff, V.C. Mapping agricultural land abandonment from spatial and temporal segmentation of Landsat time series. Remote Sens. Environ. 2018, 210, 12–24. [Google Scholar] [CrossRef]
Publisher’s Note: MDPI stays neutral with regard to jurisdictional claims in published maps and institutional affiliations. |
© 2021 by the authors. Licensee MDPI, Basel, Switzerland. This article is an open access article distributed under the terms and conditions of the Creative Commons Attribution (CC BY) license (https://creativecommons.org/licenses/by/4.0/).