Article

Quantitative Assessment of Changes in Topography of Town Caused by Human Impact, Krakow City Centre, Southern Poland

1
Institute of Geography, Faculty of Exact and Natural Sciences, Pedagogical University of Krakow, Podchorążych 2, 30-084 Kraków, Poland
2
Institute of Geography and Environmental Sciences, Faculty of Natural Sciences, Jan Kochanowski University in Kielce, Uniwersytecka 7, 25-406 Kielce, Poland
*
Author to whom correspondence should be addressed.
Remote Sens. 2021, 13(12), 2286; https://doi.org/10.3390/rs13122286
Submission received: 7 May 2021 / Revised: 5 June 2021 / Accepted: 7 June 2021 / Published: 10 June 2021
(This article belongs to the Special Issue Laser Scanning and Point Cloud Processing in Urban Environments)

Abstract

:
For the area of historic centre of Krakow (area 9.29 km2), southern Poland, base maps were prepared showing hypsometry and distribution of landforms in historical variant (ca. 1000 AD) and current variant, based on published data mainly from archaeological and geoengineering research carried out for the last 60 years, and including geographic information system (GIS) tools. The aim of the work is to establish changes in undulation of the area studied within the landforms (Vistula riverbed, Holocene alluvial plain, Pleistocene terrace, limestone hills) over the last millennium. Topographic parameters calculated on the basis of the base maps (local relative height, mean slope, limit of areas without aspect and with N, E, S and W aspects) were considered. These changes were linked with dominating trends of the altitude increase due to the development of large area embankments and of convex landforms. The assessment of changes of land undulation includes four authorial methods of quantitative determination of topography changes. Until the beginning of the 19th century land flattening occurred in most of the area of the town centre. Then the increase of local relative heights started to predominate which resulted in changes of other topographic parameters. Differentiated changes, both positive and negative, in the area undulation with altitude increase were determined.

Graphical Abstract

1. Introduction

Recently, more and more attention has been given to anthropogenic changes of towns topography, especially in the case of centrally located districts with long development history. These changes are associated with wetland drainage, river regulation, spatially uneven distribution of cultural deposits, earthwork, mining, development of convex landforms [1,2,3,4,5,6,7,8,9,10,11,12,13]. Camouflage of the initial land surface by the overlayer of cultural deposits may lead to fossilisation of natural landforms and, in some cases, to partial or total ’submergence’ of historical buildings [3,4,5,6,12]. Town topography transformed by human impact is the subject of research of various disciplines of Earth sciences, mainly geomorphology, geology, hydrology and geoengineering [1,2,7,10,11,12,13,14]. The most reliable results are obtained from the research carried out at the interface between Earth sciences and archaeology [3,4,5,6,15,16,17,18,19,20], because it facilitates the study of changes in town topography in time. The research on topography changes of large cities based on i.e., satellite images are limited to current situation [21,22].
Changes in town topography are defined as: (a) overbuilding and flattening of land surface as a result of the increase in cultural deposits, in some cases with contribution of natural sediments. This analysis includes spatial differentiation of the thickness of cultural deposits, mainly in the area of the Old Town districts [1,2,7,10,12]; (b) lowering of land surface as a result of earthworks or mining. In this case, human impact leads to the increase in local differences in some parts of towns, which is the result of: (c) mining which generates development of most differentiated relief in the areas where flat bottoms of excavations are adjacent to waste-tips and working escarpments—rocky walls represent a specific example. Such landforms are visible at present in town centres [11,13]; (d) river regulation (channel deepening, levees, river embankments) [23,24]; (e) development of other convex landforms (bridge frontons located high by the river, railway embankments, road embankments, overlook hillocks) [24]. As a result of human impact, areas of flat surface in towns are located higher or lower in relation to the initial surface. Such areas are accompanied by parts of towns of increased height differences in local scale.
The above mentioned topographic situations in towns are indicated in the cited papers, however, they do not consider more detailed range of topographic parameters which would make it possible to carry out a more detailed quantitative assessment of topography changes caused by human impact. The attempt to apply topographic parameters (altitude, local height differences, mean slope, limit of areas without aspect and with different aspects) in quantitative evaluation of town topography changes between the historical and contemporary situations was taken up by Łajczak et al. [24] concerning the historic centre of Krakow, southern Poland (study area 9.29 km2). In the work cited above, the topographic parameters concerning both time variants were calculated in a square grid with a side of 150 m.
The aim of this work is to carry out the quantitative assessment of topography changes of the historic centre of Krakow between the situation from about a millennium ago and the contemporary one with the application of a different methodical approach than it was shown in the paper [24]. Only these topographic parameters were taken into account which make it possible to determine changes in land surface undulation (local height differences, mean slope, limit of areas without aspect and with different aspects). Four authorial methods of quantitative determination of topography changes were applied. The calculations assume basic areas in form of land fragments between selected contour lines and areas covered by main landforms and lower rank landforms in both time variants. The Authors assumed such an approach to be innovative, which enabled them to look at other aspects of topography changes which have not been included in the hitherto papers concerning towns. The results of the research explain more precisely the issues of topography changes of the historic centre of Krakow than those shown in few papers written since the end of the 19th century [24,25,26,27,28,29,30,31].

2. Study Area

Krakow, one of the oldest and largest cities in Poland, is located in the southern part of the country on the River Vistula. The city is situated at the border of the Polish Uplands, the Carpathians and the Subcarpathian Basins at the altitude of 187–383 m a.s.l. (Figure 1I,II) [32,33]. The Polish Uplands in the Krakow territory are built of homoclinally arranged and faulted Jurassic limestones, which are locally overlain by Cretaceous marls and loess sediments. The outer zone of the Carpathians (part of the Alpine orogeny) is built of flysch sediments and Miocene deposits. The Subcarpathian Basins (Oświęcim Basin and Sandomierz Basin) are filled with Miocene deposits which are overlain by Pleistocene and Holocene sediments. In the area of the Polish Uplands, there are many tectonic horsts and grabens partly filled with Miocene deposits. The Vistula river makes use of some of these grabens and creates gorge called Krakow Gate, where exhumated upper parts of limestone horsts make high, locally up to 180 m hills of rocky slopes [30,34,35,36].
The study area (9.29 km2) includes the city centre (2.84% of the area of Krakow, Figure 1III) where following landforms occur: the Holocene alluvial plain, the Vistula riverbed, the Pleistocene terrace, and limestone hills, which occupy 77%, 3%, 15%, and 5% respectively of the study area (Figure 1IV). The Holocene alluvial plain, which occupies a wide zone along the Vistula river and its small tributaries refers to the course of the tectonic grabens. The central place in the study area is occupied by the Wawel Hill, whereas marginal places are occupied by Skałka Hill, fragments of Saint Bronisława Hill, Krzemionki Hills and Lasota Hill and also two non-existing now low hills or tors. In some places limestone bedrock is covered by a thin layer of Pleistocene and/or Holocene deposits. The altitude of the Wawel Hill is 228.0 m a.s.l., and Lasota Hill 234.7 m a.s.l. The banks of the Vistula river near Lasota Hill are located at 198.9 m a.s.l., and its bed at 190.5 m a.s.l. The study area includes also a narrow part of the Pleistocene terrace which joins the Wawel Hill.
The Wawel Hill and Krzemionki Hills had already been settled in Neolithic Age but the topography of the study area started to be transformed by settlement impact since the 9th century and especially in the 11th–12th centuries when the capital city of the Kingdom of Poland was moved from Gniezno to Krakow [16,31,39] (Figure 2I). The Wawel Hill became the seat of Royal Castle and the Cathedral. In the 13th c. spatial structure of Krakow became reorganised under the Magdeburg Law. In the 14th c. the neighbouring towns Kazimierz and Kleparz were founded whereas Podgórze in the 18th century (Figure 2II). Development of towns and their surroundings caused creation of embankments, especially in marshy areas. Since the beginning of the 19th c. the surrounding towns were joined to Krakow, and in the 20th c. the area of Krakow enlarged several times. At present the area of the city is 327 km2 with the population of 771,000. The city consists of 18 council districts. The study area includes the Old Town district (medieval Krakow, Kazimierz, Kleparz and their former suburbs) and fragments of five other districts of Krakow including Podgórze.
The study area is represented by all types of landforms which occur within the city borders. It includes historical buildings of the Old Town (10th–18th c.), areas with buildings from the 19th to 21st century, recreational areas (parks, promenades along the Vistula river), non built-up limestone hills (Figure 2II,III). In the study area there are sites where spectacular changes in land topography have occurred including (Figure 2IV) [11,13,23,41,42,43]: (a) excavations of limestone quarries (Middle Ages and later), (b) the Vistula meanders cut off in the 13th c. and filled with sediments, (c) one of the Vistula channel buried in the 1870s, (d) levees which serve as promenades (19th–20th c.), (e) bridge frontons (19th–21st c.), (f) the Vistula channel deepened due to regulation works (19th–20th c.), (g) raised water table of the Vistula upstream of the water drop in the city centre (20th c.), (h) road embankments (some from the 13th c.), (i) railway embankment (19th c.), (j) overlook hillock (21st c.). The selected part of Krakow is the most interesting area in the city as it concerns research on changes in land topography influenced by human impact over approximately the last millennium.

3. Materials and Methods

The materials included the information from scientific papers concerning archaeology, geoengineering, geology and morphology of Krakow. Historical and contemporary information concerning Krakow development as well as maps and remote sensing materials (orthophotomaps, ALS data—airborne laser scanning) of the area studied were analysed. Taking into account a wide range of information and using geographic information system (GIS) tools, four base maps of the area studied were prepared (Figure 3A–D), which became the base for the analytical part of the research. This is a hypsometric map showing a possible situation before the 13th c. (Figure 3A), a map showing the limit of landforms before the 13th c. (Figure 3C), a hypsometric map showing contemporary situation (Figure 3B), a map showing contemporary limit of landforms (Figure 3D). On the basis of these maps, mathematical calculations related to the aim of this paper were carried out. The methodology of calculations of topographic parameters used in the study is partly based on the publications of the authors [12,24].
The map shown in Figure 3A was prepared on the basis of the data showing the altitude of the roof of sediments underlying the cultural layer obtained from archaeological investigations [16,29,44,45,46,47] and geoengineering research; the latter only within the alluvial plain [14]. The results of archaeological investigations come from a dense network of archaeological sites e.g., in the boundaries of the Old Town the number of such sites is 20 per ha [16]. The results of geoengineering investigations come from about 1000 sites [14]. Taking into account remarks concerning correct studies on palaeotopography [15,16,48] it was possible to eliminate artificial depressions (e.g., fossil cesspits, moats) in the morphology of the area studied during interpolation procedure. As a result, a contour map was prepared which shows the hypsometry of the area studied before the 13th century. Next it was digitalised using QGIS 3.10 software. The source altitude points were the base to generate digital elevation model (DEM) using regularised spline with tension (RST)—interpolation algorithm which gives good results with representation of complex landforms and with the use of heterogenic input data [49]. The interpolation was carried out using v.surf.rst command available in GRASS GIS 7.8 tool package, which was implemented in QGIS 3.10. Spatial distribution of the obtained altitude data was spatially inhomogeneous with a privileged position of the Pleistocene terrace and the Wawel Hill in the boundaries of the Old Town. Therefore, in order to prevent overshoots of the created area, an additional preliminary processing of altitude input data was carried out according to the suggestion of Cebecauner et al. [50]. It required to include additional altitude data representing convex landforms and lines of discontinuity at their foots. Finally, 8634 altitude points were used in RST interpolation which made it possible to create DEM with 5 m spatial resolution. In RST interpolation technique two main parameters influence the shape of the interpolated area, e.g., smoothing and tension. In this research, their optimal values accounted to 1 and 40 respectively. The prepared basic hypsometric map of the area studied in a time version ca. 1000 AD (Figure 3A) includes 5 m contour interval. On the basis of this map, the first group of topographic parameters was calculated.
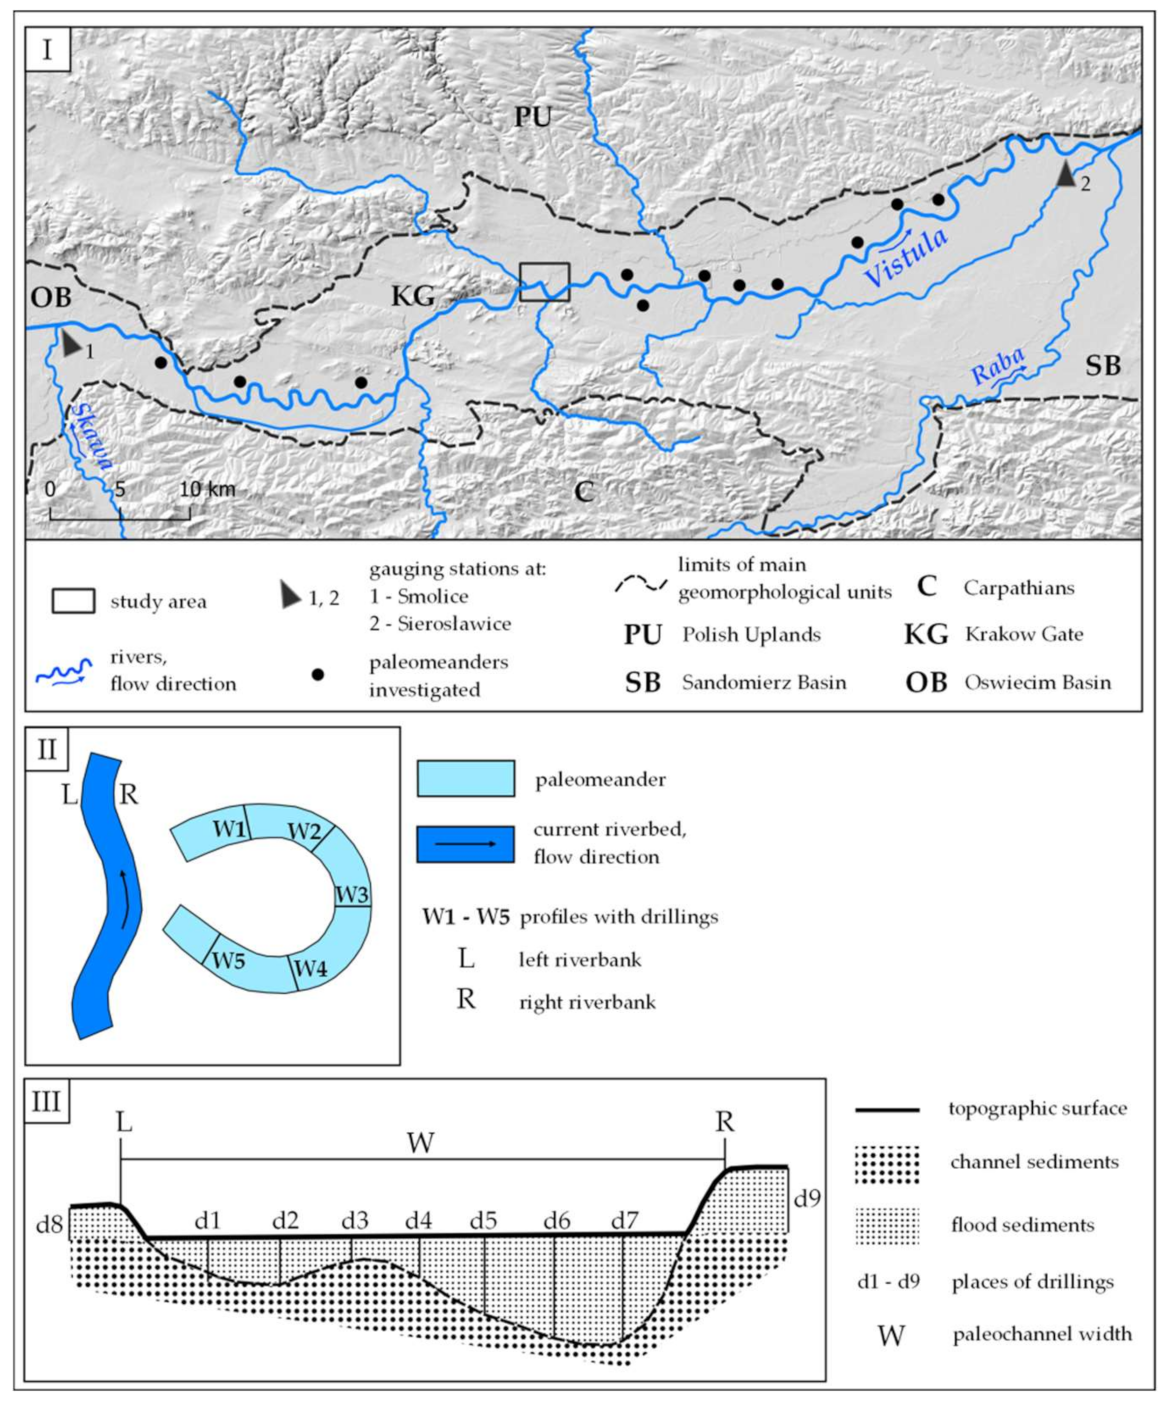
The distribution, limit and approximate vertical size of the landforms in the study area shown in Figure 3C was prepared on the basis of Figure 3A. The map considers information from the papers concerning the location of fossil landforms which developed in the analysed historical period [14,16,29,30,47,51]. The assumed course of the Vistula before the 13th c. follows the predominated views on this issue [12,16,39,47,51]. The determination of the parameters of the Vistula channel in the historical variant (mean width, mean depth, mean max depth) required, however, to carry out comparable investigations in the meanders which were cut off at the latest at the beginning of the 19th c. upstream and downstream of the area studied. These meanders, filled at present with flood sediments, represent the geometry of the Vistula channel before the start of regulation works, which may be assumed as similar to that from before the 13th c. 11 cut-off meanders selected for investigations are located between the confluences of large Carpathians rivers: the Skawa (upstream of Krakow) and the Raba (downstream of Krakow) (Figure 4I). In this 110 km long section of the Vistula river, mean discharge increases only by 23% [12]. This makes it possible to assume, on the basis of the criteria [52], that hydrological conditions of the development of the investigated fossil meanders were similar and corresponded to the development conditions of fossil meanders in the centre of Krakow. The age of the cut-off process of the investigated meanders of the Vistula was determined on the basis of the maps from the turn of the 18th and 19th centuries [53,54,55,56]. The width and depth of the investigated fossil meanders were determined on the basis of drillings down to the roof of channel facies (gravels) along five profile lines in each meander, in seven regularly distributed sites in each profile line (385 sites in total) (Figure 4II,III). Location of sites. was determined using GPS. Mean depth d ¯ of the channel in each profile line was calculated from the following formula:
d ¯ = 1 7 d 1 + d 2 + d 3 + d 4 + d 5 + d 6 + d 7 + 1 2 d 8 + d 9 ,
where d1, …, d7 represents the depth in individual drillings in a profile line down to the roof of channel facies; d8, d9 stands for the thickness of flood facies on the left and right river banks (Figure 4III). On the basis of the largest value d from individual profile lines, d ¯ max of river channel was estimated. Values d ¯ , d ¯ max,   w ¯ (channel width) of 55 profile lines were assumed as representative for the river channel in the city centre in the analysed historical variant.
The map showing contemporary hypsometry of the area studied (Figure 3B) was prepared on the basis of a source 1-m DEM prepared in 2011 relying on a point cloud from airborne laser scanning (ALS). This ALS DEM required preliminary processing: some large and deep hollows (short-existing landforms visible during the aerial laser scanning) in the centre of Krakow where large buildings were built, were taken away from the image by masking and spline interpolation. Next, in order to compare the both DEMs, the ALS DEM became resampled to 5 m spatial resolution with the use of Resampling Filter in SAGA GIS 7.8. In the first step, DEM was resampled by scaling up to 20 m, which caused that cell values were aggregated as weighted average of cell areas, and in the second step by scaling down to 5 m using spline interpolation. This operation facilitated the elimination of information overload from considerably detailed ALS DEM. The generated basic hypsometric map in the contemporary version includes contour interval of 1 m and represents a base for calculations of the second group of topographic parameters of the area studied. The version of this map shown in Figure 3B includes contour interval of 5 m.
Contemporary limit of landforms shown in Figure 3D was preliminarily determined on the basis of Figure 3B and then clarified during fieldworks carried out in the period 2020–2021 and with the use of the orthophotomap from 2019 and a current map of Krakow of the scale 1:20,000 [58]. Comparison of Figure 3C,D made it possible to evaluate changes in the relief of the study area which have occurred during the last millennium.
Slope and aspect of landforms were calculated using SAGA-GIS 7.8 software and procedure suggested by Zevenbergen and Thorne [59]. Further analysis of the derived topographic parameters concerning altitude intervals, every 5 m and landforms were carried out using Map Algebra [60] and zonal statistics [61].

4. Hypsometry and Landforms

The analysed hypsometry and the limit of the landforms in the area studied concerns two time situations, namely before the 13th century and the current period (Figure 3). The comparison of the maps B and D with maps A and C in Figure 3 is the base for a quantitative assessment of topography changes in the area studied caused by human impact. The methods of dealing with this problem are shown in Chapter 5. The results of investigations on topography changes in the area studied in the last millennium are shown in Chapter 6 (Results).

4.1. Situation before the 13th Century

The hypsometric situation of the area studied shown in Figure 3A is considered typical of the period from 9th to 12th century, i.e., for the early stage of Krakow development, before the start of its fast territorial enlargement since the half of the 13th century The analysed stage of town development was assumed as ca. 1000 AD. The Holocene alluvial plain was then located at the altitude from 198 a.s.l. to almost 203 m a.s.l., on average 200 m a.s.l. [12,24]. In many places, fragments of the plain reached in small area the relative height of over 3 m [14]. The channel of the meandering Vistula was 7 km long in the area studied, its mean width was estimated to ca. 130 m, mean depth to ca. 4.0 m and maximum depth to ca. 5 m. The Vistula banks near the Wawel Hill and Lasota Hill were elevated at the altitude of ca. 198 m a.s.l., and the river channel reached in the deepest sites 193 m a.s.l. The river sinuosity was 2.1. In the distance of 2.5 km, two river channels occurred. The Pleistocene terrace occurred at the altitude from 203 to over 213 m a.s.l. (mean 208 m a.s.l.). Relative height of limestone hills in the area studied ranged from a few meters to 32 m; the highest hill reached almost 235 m a.s.l.
The Holocene alluvial plain showed differentiated relief (Figure 3C), which included sandbars, flattened areas with low levees, depressions filled with water, overflow channels, peatbog plains within backswamps [12]. The predominated landform within the alluvial plain was meandering channel of the Vistula and channels of its two small tributaries. The plateau of the Pleistocene terrace was surrounded by steep escarpment. In the boundaries of the area studied, the terrace got narrow towards the south and in form of a narrow neck it joined the Wawel Hill. Under the neck of the Pleistocene terrace, the tops of limestone horsts occurred. In the analysed period, the outcrops of limestone or marls were locally visible on the land surface or occurred very shallowly. Only the Wawel Hill and Lasota Hill had (and still have) flat plateau surrounded by steep rocky slopes. In the relief of other hills, steep slops predominated.

4.2. Current Situation

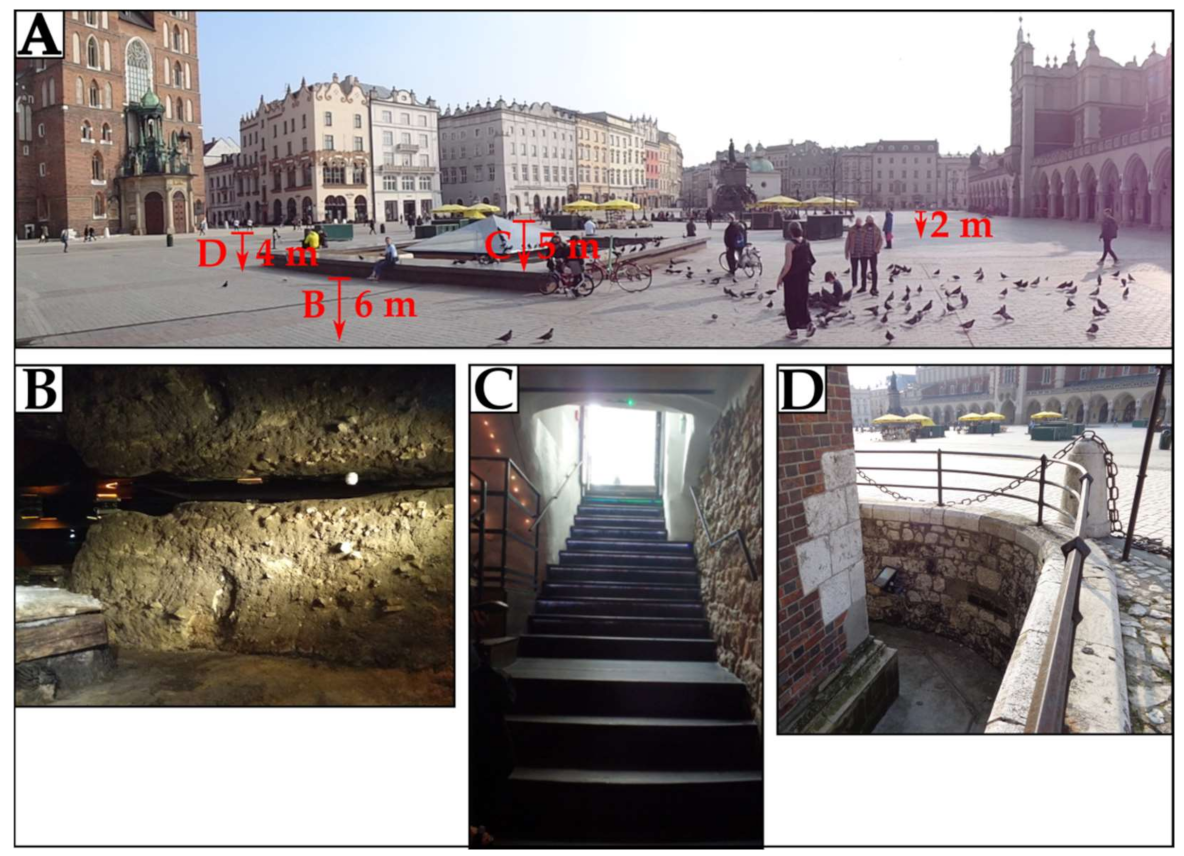
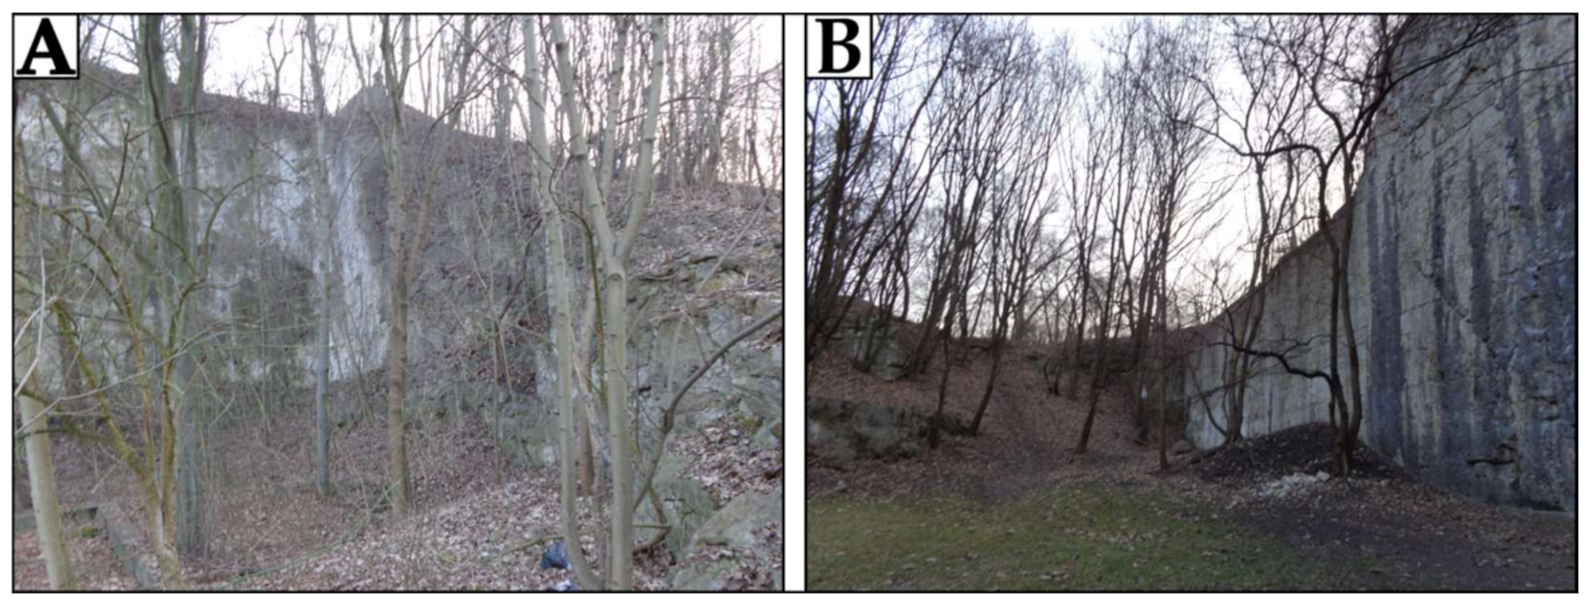
Current pattern of contour-lines and the Vistula course in the area studied is shown in Figure 3B. At present the Holocene alluvial plain, as a result of multi-century development of town, is situated on average 3 m higher as related to the historical situation, e.g., from 199 m a.s.l. to 208 m a.s.l., on average 203 m a.s.l. Former convex or concave landforms within the alluvial plain became fossil landforms overbuilt by urban embankments. In general, the alluvial plain flattened out, however, in local scale denivelations increased by over 5 m as a result of the development of anthropogenic landforms (Figure 3D) such as levees on both banks of the Vistula and its tributaries, bridge frontons, railway embankments and overlook hillock. The Vistula channel became shortened by 3 km, mainly due to the cut-off the river meanders located upstream of the Wawel Hill since the 13th century [12]. The river sinuosity decreased to 1.2. In the 1870s a secondary river channel was buried downstream of the Wawel Hill [16,51]. As a result of regulation works carried out in the 19th and 20th century, the river channel became deepened by ca. 3.5 m [23,62], and its width decreased to 65 m. At present, the banks of the river channel downstream of the Wawel Hill and Lasota Hill occur at 199 m a.s.l., and the riverbed locally at 191 m a.s.l. After the construction of Dąbie water drop (1.7 km downstream of the area studied) in the 1960s, the Vistula raised by 3.5 m, which caused that the width of water surface increased to 110 m. The Pleistocene terrace is situated at present at the altitude from 208 to over 216 m a.s.l. (mean at 211 m a.s.l.), which is 3 m higher as related to the situation from 1000 years ago. As a result of overbuilding of the whole area, the profile of the escarpment in this terrace became gently sloping and only a narrow neck has preserved its steep slope. The former outcrops of limestone and marls within the necks of the Pleistocene terrace became covered by cultural deposits, e.g., within the Main Square in the Old Town they occur now at the depth from 2 to 6 m. The lowest limestone hills disappeared, and a bit higher Skałka Hill became built up by a sacred building, Saint Stanislaw Church. The slopes of the Wawel Hill became overbuilt by thick earth embankments, and its plateau became flattened. Large changes in relief were caused by limestone extracting on the northern slopes of Krzemionki Hills, Lasota Hill and Saint Bronisława Hill (Figure 2IV), where vast niches of quarries are bordered by over 20 m high rocky walls. The altitude of limestone hills, except for smaller ones which were removed, did not change. However, their relative height decreased by at least 3 m because of considerable increase of the altitude of alluvial plain, especially in the area of promenades (Figure 3A,B).

4.3. Dominating Changes in Relief of the Study Area between Historical and Current Situation

Comparing segments A, B, C, and D in Figure 3, the most significant change in the relief of the area studied between the historical variant and the current one is visible. It is the change from a differentiated morphology of the Holocene alluvial plain with concave, flat and convex landforms into a flat, higher located surface. On this surface, there are convex anthropogenic landforms, mainly linear with steep slopes. The cut-off Vistula meanders and also one of the channels of the river became joined to the Holocene alluvial plain after being filled up with fluvial and anthropogenic sediments. The limit of other main landforms, i.e., the Pleistocene terrace and limestone hills was only slightly changed. Only the area covered by the Vistula riverbed decreased significantly.

5. Methods How to Quantitatively Assess the Changes in Topography of the Study Area

The work includes four methods of the quantitative assessment of topography changes in the study area proposed by the authors on the basis of the analysis of hypsometric maps (contour interval 1 m, Figure 3A,B) and maps showing distribution of landforms (Figure 3C,D), all in historic (A) and modern (B) variants.
The first method: In variants (A) and (B) the hypsography of areas marked by the successive contour lines (every 5 m) from 195–200 to 230–235 m a.s.l. was analysed. The limit of these areas in variant (B) differs from variant (A) due to different course of contour lines caused by anthropogenic changes of relief. In both variants the following parameters were calculated for each area between the contour lines: area [km2], mean slope α [%], percentage of areas [% of area] without aspect and with N, E, S and W aspect. The areas represented by without aspect category are those areas where slope is <2%. These parameters were also calculated for the whole area studied, both in (A) and (B) variants.
The second method: Topographic parameters of the areas from variant (A) were calculated using the first method and also an additional parameter was included, i.e., local differences in height Δh [m] which also referred to variant (A). Simultaneously the topographic parameters of the same areas were calculated, however, the hypsometry in each area was considered according to variant (B).
The third method: Areas covered by main landforms were taken into account: Holocene alluvial plain, Vistula riverbed, Pleistocene terrace, and limestone hills, separately in variant (A) and variant (B) (Figure 3C,D). In both variants, the same topographic parameters were calculated within each landform, which were considered in the second method.
The fourth method: The limit of lower rank landforms was determined in variant (A) in the area of: the Holocene alluvial plain (separately the sandbars and concave or convex landforms), the Pleistocene terrace (separately the escarpment and the plateau), limestone hills (separately the slopes and the plateau) (Figure 3C). The limit of landforms occurrence from variant (A) was compared with the basic hypsometric map of variant (A) and all the above-mentioned topographic parameters were calculated for the areas of their occurrence. The limit of landforms occurrence in variant (A) was compared with the limit of landforms occurrence in variant (B), and changes which occurred in the relief of the area studied were determined (Figure 3D). This situation was referred to the basic hypsographic map in variant (B) and the above-mentioned topographic parameters were calculated for the analysed areas.
The comparison of topographic parameters from variant (B) with parameters from variant (A) shows differences which have occurred in the last millennium in topography (undulation) of the area studied and were caused by human impact. Depending on the adopted method of the assessment of topography changes, the obtained results refer to: (1) analysed altitude intervals or to the whole area, (2) areas of constant limit which are determined on the basis of selected contour lines from variant (A), (3) areas in the limits of the main landforms from variant (A), (4) areas in limits of lower rank landforms from variant (A).

6. Results

6.1. Changes in Topography Based on the First Method

Changes of topographic parameters were referred to 5 m altitude intervals, the limit of which significantly changed between the variants (A) and (B) up to the altitude of 215 m a.s.l., especially in the altitude intervals 195–200 m a.s.l. (-4.28 km2) and 200–205 m a.s.l. (+3.47 km2) (Table 1).
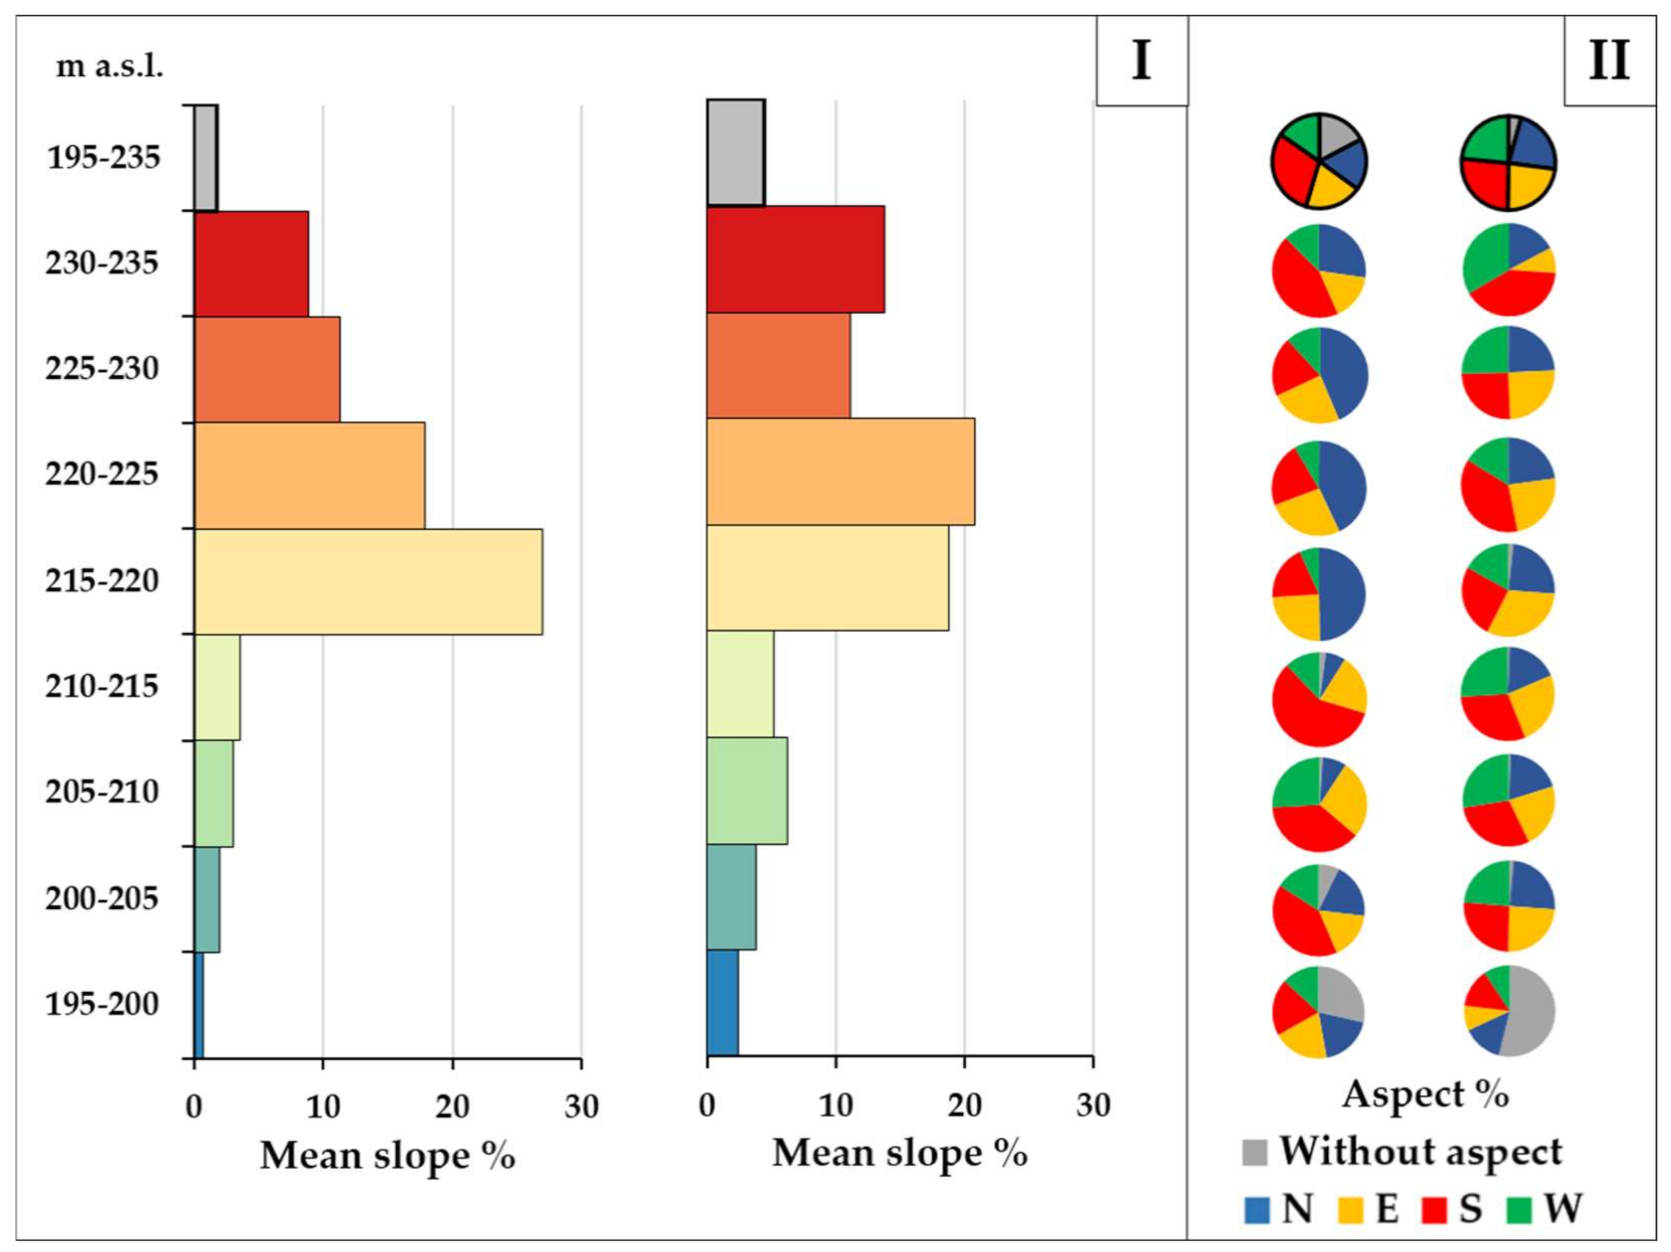
Mean slope in variant (A) was 2.3% in the area studied (Figure 5I) and increased from 0.8% at the altitude 195–200 m a.s.l. to 27.0% at the altitude 215–220 m a.s.l. Then, at higher altitudes, it decreased from 18.0% at the altitude 220–225 m a.s.l. to 8.8% at the altitude 230–235 m a.s.l. Currently (B) mean slope of the whole area is 4.9%, and larger values as compared to variant (A) are reached in six, out of eight analysed altitude intervals: it increases from 2.4% at the altitude 195–200 m a.s.l. to 20.8% at the altitude 220–225 m a.s.l., whereas at the altitude 230–235 it is only 13.8%. Mean slope increased between the situations (A) and (B) at the altitude 205–210 m a.s.l. by 3.3%, and at the altitude 230–235 m a.s.l. by 4.9% whereas at the altitude 215–220 m a.s.l. it decreased by 8.2% (Table 1).
In variant (A), 17% of the area studied was classified as category without aspect, and 19%, 19%, 30% and 15% were classified as areas with aspect N, E, S and W respectively (Figure 5II). The area without aspect included 28% of the area located at the altitude 195–200 m a.s.l. Areas with N aspect included from 7% to 50% of the areas in 5 m altitude intervals, with E aspect from 19% to 30%, with S aspect from 20% to 61% and with W aspect from 5% to 27%. Currently (B) only 4% of the area studied was classified as category without aspect, and 22%, 24%, 26% and 24% were classified as areas with aspect N, E, S and W respectively. Areas with N aspect show less differentiated limit than in variant (A): from 14% to 26% of the area in 5 m altitude intervals, similarly areas with S aspect (from 13% to 35%), but the areas with E aspect from 9% to 29%, and the areas with W aspect from 10% to 38%. The largest changes between variant (B) and (A) in the areas covered by different aspects concern the areas without aspect in the lowest altitude interval as well as areas with N, S and W aspect (Table 1).

6.2. Changes in Topography Based on the Second Method

Table 2 contains values of topographic parameters: (1) referring to areas between succeeding contour lines every 5 m in variant (A), (2) referring to areas between succeeding contour lines every 5 m from variant (A) but including hypsography from variant (B). In situations (1) and (2) the whole area studied was additionally included.
The value of Δh in the altitude interval 195–200 m a.s.l. (above the banks of the Vistula channel) is currently (B) larger by 6.0 m than in variant (A), however, including altitude values of the riverbed and their changes due to regulation works, Δh increased by 7.5 m (Table 2). In the succeeding 5 m altitude intervals changes of Δh are similar, but in 5 m intervals above 215 m a.s.l. the Δh increase exceeds 17 m. This increase results from creation of rocky walls in former quarries in limestone hills (see Figure 2IV). In the whole area studied, except from the Vistula channel, Δh decreased by 1.3 m, however, taking into account altitude values of the Vistula riverbed and their changes due to regulation works, Δh increased by 7.2 m.
Mean slope in the analysed fragments of the area studied increased between variant (1) and (2), and only in the altitude interval 215–220 m a.s.l. it decreased (Table 2). The increase of mean slope to the altitude of 210 m a.s.l. shows lowering trend (from 3.2% to 1.8%), and higher (except for the interval 215–220 m a.s.l.) growing trend (from 2.6 to 14.8%). The increase of mean slope at the altitude 195–215 m a.s.l. results from creation of convex anthropogenic landforms. On the other hand, the decrease in mean slope at the altitude 215–220 m a.s.l. resulted from development of flat bottoms in quarry excavations. The increase in mean slope above 220 m a.s.l., especially above 230 m a.s.l. results from creation of rocky walls in former quarries; mining did not include the Wawel Hill with the monumental buildings (see Figure 2IV). In the scale of the whole area studied, mean slope increased from 2.3% to 4.9%.
In the area studied, the area with the category without aspect has decreased in the last millennium from 17% to 4% (Table 2). The share of areas with N, E and W aspect increased by 3–9%, but with S aspect decreased by 4%. In the analysed fragments of the area studied, changes in aspect between variants (1) and (2) are more differentiated. In the area which originally belonged to the altitude interval 195–200 m a.s.l., the share of the area without aspect increased from 28% to 55%, whereas at the altitude 200–205 m a.s.l. it decreased from 7% to 2%, and above 215 m a.s.l., areas without aspect were not found. The share of areas with N aspect increased up to the altitude of 215 m a.s.l. by 5–16%, but higher it decreased by 3–5%. Similar trend of changes was found in the case of the areas with E aspect, however, these changes did not exceed 8% of the area studied. The share of the areas with S aspect increased only by 4% to the altitude of 200 m a.s.l., and higher it decreased by 1–32%. The share of the areas with W aspect increased in the whole altitude profile (except for the interval 205–210 m a.s.l.) by 6–18%. At present, similarly to historical version, the areas with N aspect predominate at the altitude 215–230 m a.s.l. (38–45% of the whole area) and areas with S aspect at the altitude 230–235 m a.s.l. (36% of the area studied).

6.3. Changes in Topography Based on the Third Method

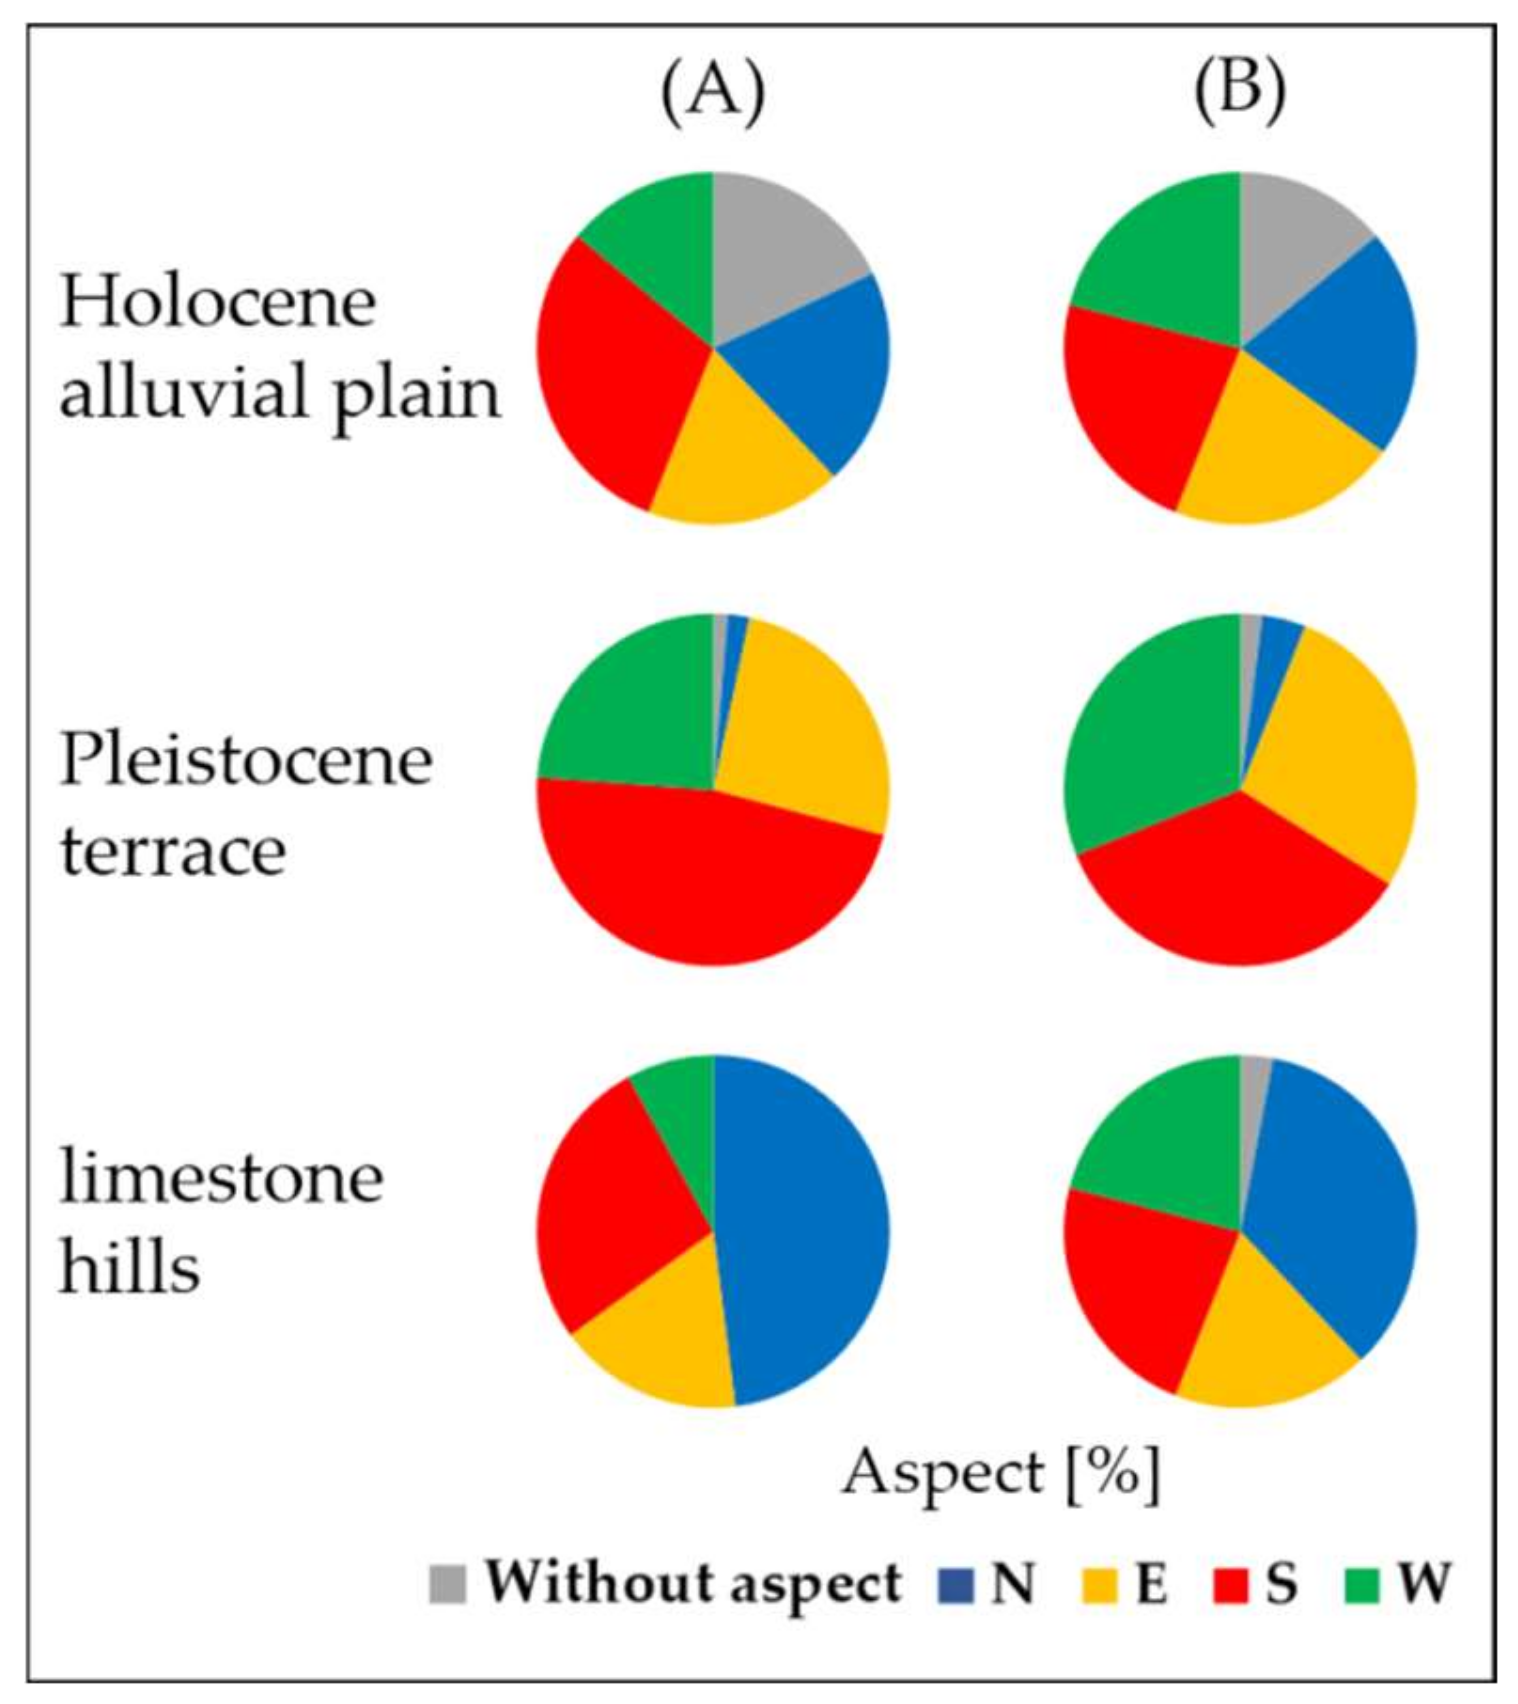
Topographic parameters (area, Δh, mean slope, % of area without aspect and with N, E, S and W aspect) referring to main landforms (Holocene alluvial plain, Pleistocene terrace, limestone hills) and determined for variant (A) and (B) are shown in Table 3. The Table contains also parameters: area and Δh concerning the Vistula riverbed. In addition, the parameters: % of area without aspect and with N, E, S and W aspect concerning the main landforms and related to variants (A) and (B) are graphically illustrated in Figure 6.
In the analysed time period between variant (A) and (B) the limit of the Holocene alluvial plain increased by 0.72 km2, at the expense of the Vistula riverbed (Table 3), the cut-off meanders of which and one of the channels were filled with fluvial and anthropogenic deposits. The liquidation or camouflage of the lowest limestone hills or tors by anthropogenic deposits was insignificant in this process. The increase of local relative height Δh within the Holocene alluvial plain between variant (A) and (B) by 3.7 m resulted from the creation of anthropogenic landforms. In the area of the Pleistocene terrace Δh decreased from 10.9 m to 8.9 m which results from the increase of altitude (a.s.l.) — Holocene alluvial plain, which is larger than on the plateau of the Pleistocene terrace. The parameter Δh of limestone hills also decreased by 3 m as a result of altitude increase at the foot of these landforms. The depth range of the Vistula riverbed increased from 5 m to 9.5 m. Changes of mean slope and changes in % of the area without aspect are derivatives of Δh changes. In the case of the Holocene alluvial plain, mean slope increased three times which resulted from the development of convex anthropogenic, usually long landforms of steep slopes, but the area of category without aspect decreased only slightly (Figure 6). On the other hand, the overbuilding and flattening of the Pleistocene terrace resulted in the decrease in mean slope within this landform from 4.3% to 3.2% and twofold increase in the limit of area without aspect. A small decrease in height differences within limestone hills resulted also in a small decrease in mean slope in this area, but areas belonging to category without aspect increased their limit from 0% to 3% of their area. Changes of area limits with N, E, S and W aspect which occurred between variants (A) and (B) varied among the analysed landforms. In the case of the Holocene alluvial plain and the Pleistocene terrace, a small increase in areas with N, E and W aspect occurred, whereas the areas with S aspect decreased. In the case of limestone hills, there was a large increase in the areas with W aspect (Figure 6).

6.4. Changes in Topography Based on the Fourth Method

Table 4 contains topographic parameters (Δh, mean slope, % of area without aspect and with N, E, S and W aspect) of lower rank landforms which are located within the main landforms (sandbars, flat or concave landforms within the Holocene alluvial plain; escarpment and plateau within the Pleistocene terrace; slopes and plateau within the limestone hills). In addition, the parameters: % of area without aspect and with N, E, S and W aspect concerning the lower rank landforms and related to variants (A) and (B) are graphically illustrated in Figure 7. Topographic parameters of the lower rank landforms are different in time variants (A) and (B) from parameters of the adequate main landforms (Table 3 and Table 4).
Within the Holocene alluvial plain in the area covered by sandbars (a1) according variant (A) local relative height Δh increased until present times (B) from 5.4 m to 7.1 m, which resulted in the increase in mean slope from 1.4% to 2.8%, and the decrease in the area without aspect from 17% to 13%. Larger changes of topographic parameters concern flat areas and concave landforms (a2) where Δh increased three times, mean slope increased four times, and the share of the area without aspect decreased from 20% to 14%. Changes in topography of landforms (a1) and (a2) were caused by development of anthropogenic landforms, which were about 5–10 m high, with steep slopes, and which in general were put on flat surface as large-area embankments. Within the Pleistocene terrace, as a result of spatially differentiated thickness of anthropogenic embankments, in the area of the initial limit (A) within the escarpment (b1), Δh decreased by 2 m, and within the plateau (b2) it increased by about 1 m. In the area of landform (b1) mean slope decreased over two times and in the area of landform (b2) it slightly increased. Only within the landform (b2) of the Pleistocene terrace, the area without aspect increased, but only from 2% to 4%. Within the limestone hills, Δh value of landform (c1) decreased from 32 m to 29 m as a result of altitude increase in the slope foots due to urban embankments, and within landform (c2) it decreased by over 6 m as a result of piling up of lower located fragments of the plateau. Mean slope in the area of landforms (c1) and (c2) decreased by 2% and 4% respectively, and the area without aspect increased from 0% to 2% and from 0% to 6% respectively. Changes in limits of the areas with N, E, S and W aspect within all the lower rank landforms are analogous to the area of main landforms, i.e., the limit of areas within the landforms (a1), (a2), (b1) and (b2) increased with N, E and W aspect and the limit of areas with S aspect decreased. In the case of landforms (c1) and (c2) the largest increase occurred in the case of the areas with W aspect (even tenfold) (Figure 6 and Figure 7).

7. Dominating Trends of Changes in the Area Undulation Based on the Adopted Procedures

Changes in topography of the area studied in the centre Krakow caused by human impact over the last millennium reconstructed with the application of four independent and innovative calculation procedures concern various aspects of this issue and jointly indicate considerable modifications in the undulation of the area surface in relation to the reconstructed initial situation. These calculation procedures give consistent conclusions which cumulatively make it possible to describe in the quantitative way two issues: (a) predominant flat areas in the area of the city centre resulted from large-area embankments, especially in lower located wet areas, which predominated until the beginning of the 19th century, (b) increase in local relative heights resulted from creation of anthropogenic convex landforms, mainly linear ones, which have predominated to date.
Changes in topography of the area studied concerning the undulation show differentiation in height pattern and result from: (a) regulation of the Vistula, (b) creation of anthropogenic landforms in lower located areas, (c) development of flat-bottom excavations in former quarries, (d) development of rocky walls in these quarries, (e) uneven overbuilding of land surface by cultural deposits.
First method (Table 1, Figure 5):
(1)
mean slope: increase in value at the altitude 195–215 m a.s.l.—result of (b); decrease in value at the altitude 215–220 m a.s.l.—result of (c); differentiated increase in value at the altitude 220–235 m a.s.l.—result of (d) including slopes of constant slope,
(2)
areas without aspect: increase in limit at the altitude 195–200 m a.s.l.; decrease in limit at the altitude 200–215 m a.s.l.—result of (b); increase in limit at the altitude 215–220 m a.s.l.—result of (c); above 220 m a.s.l. this category does not exist,
(3)
areas of different aspect: increase or decrease in limits of the areas with N, E, S and W aspect is less visible below 210 m a.s.l.—result of (b); above this altitude the changes are larger—result of (c) and (d).
Second method (Table 2):
(1)
local relative height Δh: increase in value in the Vistula riverbed – result of (a), and at the altitude 200–215 m a.s.l.—result of (b), and even larger increase (fivefold increase in Δh) in higher located areas—result of (c) and (d),
(2)
mean slope: increase in value at the altitude 195–215 m a.s.l., locally even fourfold—result of (a) and (b); decrease in values at the altitude 215–220 m a.s.l.—result of (c); increase in value above 220 m a.s.l.—result of (d),
(3)
areas without aspect: increase in limit at the altitude 195–200 m a.s.l.; decrease in limit at the altitude 200–215 m a.s.l.—result (b); increase in limit at the altitude 215–220 m a.s.l.—result of (c); above 220 m a.s.l. this category does not exist,
(4)
areas of different aspect: the largest increase in the limit of the areas with N aspect occurred at the altitude 205–215 m a.s.l., the largest decrease in the limit of the areas with S aspect occurred at the altitude 200–205 and 210–215 m a.s.l., the largest increase in the limit of the areas with W aspect occurred at the altitude 195–200, 210–225, 230–235 m a.s.l.–result of (a), (b), (c), (d). Areas with E aspect showed the most stabile limit.
Third method (Table 3, Figure 6):
(1)
local relative height Δh: in the case of the Holocene alluvial plain and the Vistula riverbed parameter Δh increased by 3.7 m and 4.5 m, respectively—result of (a) and (b), but in the case of the Pleistocene terrace it decreased by 2 m, and in the case of limestone hills it decreased by 3 m—result of (e),
(2)
mean slope: increase in value in the case of the Holocene alluvial plain—result of (b), decrease in value in the case of the Pleistocene terrace and limestone hills—result of (c) and (e),
(3)
areas without aspect: opposite trends of changes in main landforms than mentioned above,
(4)
areas of different aspect: considerable change (>ǀ10%ǀ) of the limit of areas with S aspect in the case of the Pleistocene terrace and areas of N and W aspect in the case of limestone hills.
Fourth method (Table 4, Figure 7):
(1)
local relative height Δh, mean slope, areas without aspect: larger changes concern the following landforms of lower rank: flat or concave landforms within the Holocene alluvial plain—result of (b), escarpment of the Pleistocene terrace—result of (b) and (e), plateau of limestone hills—result of (d),
(2)
areas of different aspect: considerable change (>ǀ10%ǀ) of limit of the areas with N aspect in the case of slopes and plateaux of limestone hills, the areas with S aspect in the case of escarpment and plateau of the Pleistocene terrace, the areas with W aspect in the case of escarpment of the Pleistocene terrace and plateaux of limestone hills.
It was assumed that in the analysis of dominating trends of changes in the undulation of the area studied between variants (A) and (B), the results of the third and the fourth methods are the easiest in perception. Common evaluation of the results of these calculations with the results of the first and the second methods makes it necessary to indicate the altitude of current occurrence of main landforms and lower rank landforms (5 m altitude intervals were applied):
(a)
Vistula riverbed, currently from below 195 m a.s.l. to 200 m a.s.l., former river meanders and one of the channels were buried between the 13th and 19th century and incorporated to the Holocene alluvial plain. Within the active channel, the undulation increased (situation illustrated in Figure 8): increase in Δh by 3.5 m since the beginning of the 19th century Changes of mean slope and parameters determining the aspect are not known,
(b)
Holocene alluvial plain (200–210 m a.s.l.), two-directional trends of changes in area undulation: (1) as a result of large-area earth embankments the altitude increased on average by 3 m, and the place of former buried Vistula meanders and one of its channel by 7–8 m (former concave, flat and convex landforms of lower rank became fossil landforms). The whole area became flattened (situation illustrated in Figure 9); (2) as a result of the development of convex landforms (19th–21st century) on the flat area its undulation increased (situation illustrated in Figure 10). As a result of these opposed trends in undulation, the total course of changes is as fallow: increase in local relative height and mean slope, decrease in the limit of the area without aspect, small changes of limit (+,−) of the areas of N, E, S and W aspect. These changes concern rather flat or concave landforms than the former convex ones (sandbars).
(c)
Pleistocene terrace (210–215 m a.s.l.), two-directional trends of changes in the area undulation: (1) as a result of large-area earth embankments the altitude increased on average by 3 m and further flattening of plateau occurred (situation illustrated in Figure 11), but much smaller in the case of the escarpment; (2) as a result of development of convex landforms (13th–20th century) superimposed on the escarpment, undulation of the area increased (situation illustrated in Figure 12) which results in the increase in local relative height and mean slope, and the decrease in the limit of area without aspect. There were considerable changes (+/−) in the limits of N, S and W aspect (slopes of anthropogenic convex landforms),
(d)
Limestone hills (200–235 m a.s.l.). Three altitude zones may be distinguished within the slopes of these landforms: (d1) lower parts of slopes and their foots overbuilt by large-area embankments and flood embankments with promenades (200–215 m a.s.l., most of this area was discussed in the part—the Holocene alluvial plain); (d2) altitude zone 215–220 m a.s.l. partly occupied by flat bottoms of closed quarries, increase in area undulation (situation illustrated in Figure 13) (increase in local relative height, decrease in mean slope, increase in the limit of areas without aspect, large changes (+/−) of limit of areas of different aspect; (d3) altitude zone 220–235 m a.s.l. partly with rocky walls of closed quarries, increase in land undulation (situation illustrated in Figure 13) (increase in local relative height and mean slope, there are not any areas without aspect, large changes (+/−) of the limit of areas of N and W aspect). At the altitude 220–235 m a.s.l. the plateaux of two limestone hills occur where process of land flattening takes place (situation illustrated in Figure 14) (embankments on karst landforms, decrease in local height differences and mean slope, changes (+/−) in the limit of areas of N and W aspect).

8. Discussion and Conclusions

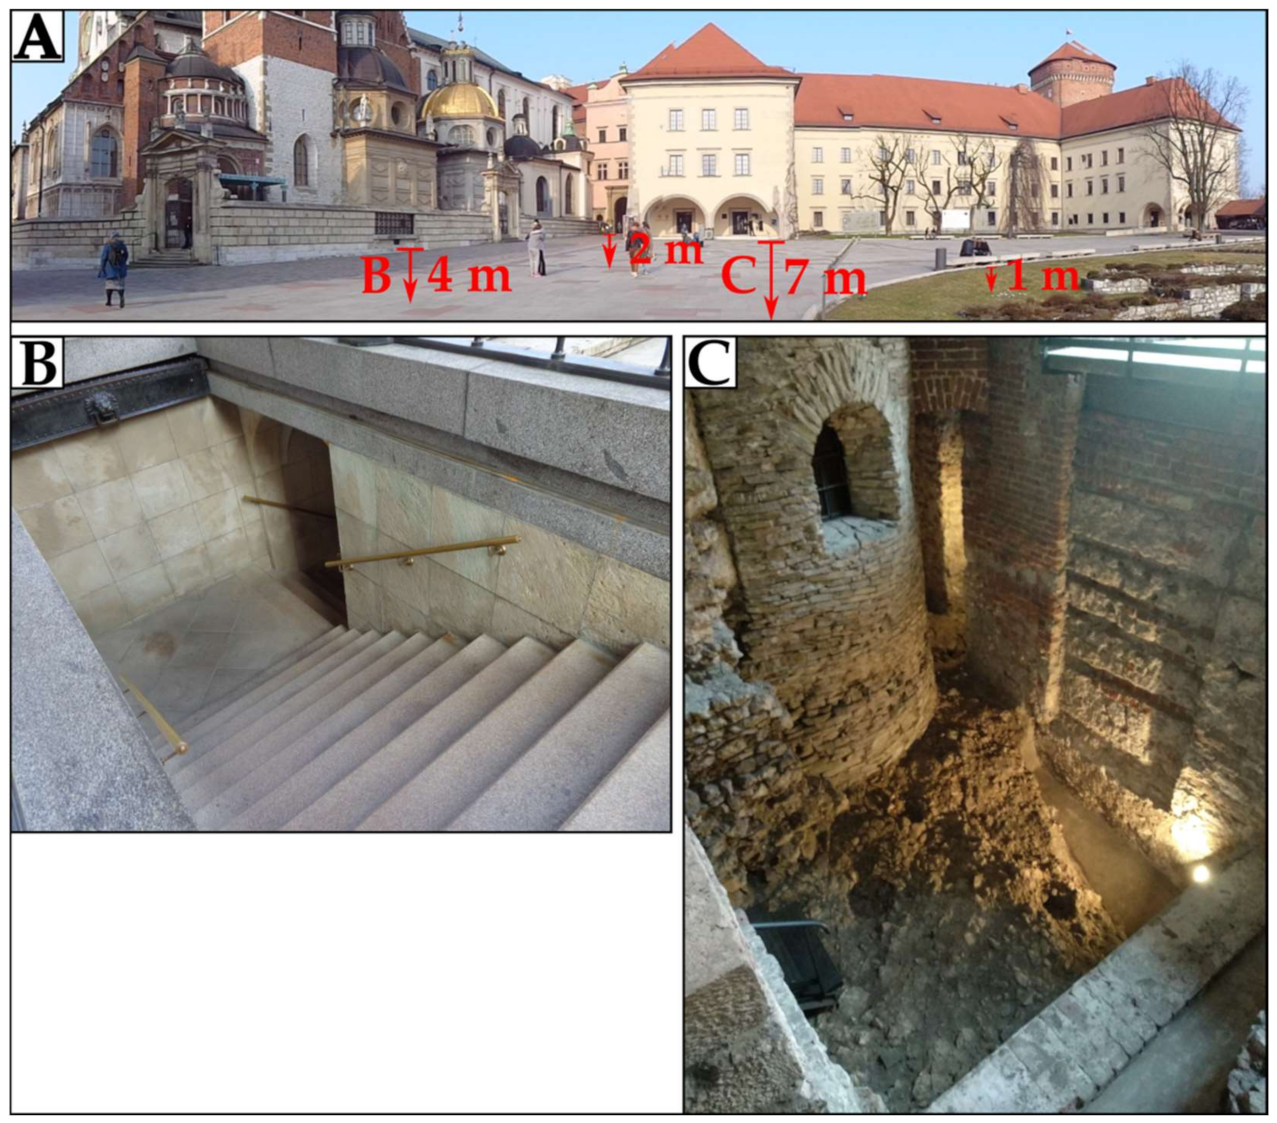
To answer the question whether the changes in town topography lead to the increase or to the decrease in land undulation it is necessary to consider: duration of the process, limit of the area studied, its location within town boundaries, original morphology of the area, and methods applied in calculation of topographic parameters. It was revealed that in Krakow during several centuries until the beginning of the 19th century, process of flattening occurred due to large-area embankments, especially within the lower located marshy areas, in most of the area in the town centre (Holocene alluvial plain, most of Pleistocene terrace, plateau of the Wawel Hill). Later, until modern times the increase in local relative height started to dominate as a result of development of anthropogenic convex landforms. At that time local relative height within the Vistula riverbed and riverbanks occurred as a result of channel deepening and creation of flood control embankments. The trend of increase in local relative height dominated in large areas of slopes of limestone hills since the beginning of quarrying activity, i.e., since the Middle Ages or later. The revealed changes in the undulation of the area studied are consistent with the results obtained by the authors for the same area in the centre of Krakow which were calculated exclusively on the basis of local relative heights Δh (m) in a square grid with a side of 150 m [24]. The revealed trends of changes in land undulation of Krakow centre confirm also the results of other research on anthropogenic modification of relief in this area [9,11,12,13,23] and the results of investigations in other towns [1,2,3,4,5,6,7,8,10,19,20,21,22]. The increase in local relative height due to intentional uncovering of old buildings or fragments of antient towns [3,4,5,6] should be also mentioned. However, the currently visible former land surface uncovered in the underground museums in the Main Square of the Old Town and on the Wawel Hill (Figure 11B and Figure 14C) can not be included in this category of changes of urban area.
The analysis of changes in the undulation of the studied area in the centre of Krakow is multifaceted as it was carried out with the application of several topographic parameters which made it possible to evaluate relations between changes of local relative height, changes of mean slope, changes of limit of the areas without aspect and with N, E, S and W aspect. These changes were related to dominated increase in altitude due to large-area embankments and also to creation of convex, usually linear landforms, as well as to local decrease in altitude (in the case of closed quarries). In some papers concerning changes of town topography the main aim is the evaluation of spatial differentiation of thickness of cultural deposits [1,2,3,4,5,6,7,8,10]. However, the results of this process in form of changes in land undulation were marginalised or omitted.
The authors assume that methods applied in this paper are particularly noteworthy. In the evaluation of changes of undulation in the study area in the centre of Krakow, four authorial methods of quantitative determination of topography changes were devised. It was assumed, that despite the fact that the results of the third and the fourth methods are the easiest for perception, it is necessary to evaluate jointly the results of these calculations with the results of the first and the second method. The authors regard such an approach to the evaluation of undulation of urban area in towns of long history development influenced by human activity as innovative. So far such an approach has not been considered in papers concerning town topography. It reveals differentiated character of changes of land undulation both in negative or positive directions (i.e., flattening or increase in undulation) along with the increase in altitude, i.e., from the Vistula riverbed to the plateaux of limestone hills. Therefore the authors find this result a novelty as far as town topography is concerned.
As a result of application of four analytical methods, coincidental conclusions were obtained concerning changes in undulation of the area studied which occurred over the last millennium within the distinguished altitude zones occupied by different landforms:
(a)
Vistula riverbed: increase in local relative height—effect of river regulation (third and fourth methods),
(b)
Holocene alluvial plain: decrease in limits of the areas without aspect, increase in mean slope and local relative height—effect of overbuilding of the area studied by anthropogenic deposits, especially creation of anthropogenic convex landforms (all methods),
(c)
Pleistocene terrace: decrease in limits of the areas without aspect, decrease in mean slope and local relative height—effect of overbuilding of the area studied by anthropogenic deposits (all methods),
(d)
Limestone hills:
(d1)
lower parts of slopes and their foots: decrease in local relative height, decrease in mean slope—effect of overbuilding of the area studied by anthropogenic deposits (first and second methods),
(d2)
slopes in altitude interval 215–220 m a.s.l. (flat-bottomed excavations of former quarries): increase in limits of the areas without aspect, decrease in local relative height, decrease in mean slope (first and second methods),
(d3)
slopes above 220 m a.s.l. (rocky walls of quarries, plateaux): increase in mean slope and relative height (all methods).
General remarks concerning the analytical methods used in the research are included in Table 5.
Changes of land undulation within the area studied were caused by human impact. The influence of natural factors should be totally, and in some places partly excluded because of the following reasons: (a) the structure of the layer of sediments deposited over the last millennium outside the former riverbeds suggests their anthropogenic origin [16]; (b) as a result of floods, former river meanders and one of its arms were partly filled with deposits. Further total fill of these landforms with sediments occurred as a result of intentional human activities [16,51]; (c) on the slopes of limestone hills there are not any landslides which could have caused changes in the relief of the area studied [41].
The method applied to solve the research problem is almost cost-free as the investigation did not require any valuable measurement equipment in order to obtain spatial data. ALS data was obtained free of charge. Only drilling by the authors in the cut and sediment-filled meanders of the Vistula near Krakow required travel to the study area. The applied methods of investigation are universal and may be used in topography studies in other areas, even in non-urban ones, which became transformed by human impact. The results of the research should be taken into consideration both in historical tourism of Krakow and geotourism.

Author Contributions

Conceptualization, A.Ł. and R.Z.; methodology, A.Ł, R.Z., G.W.; software, R.Z. and G.W.; validation, A.Ł., R.Z. and G.W.; formal analysis, A.Ł., R.Z. and G.W.; investigation, A.Ł., R.Z. and G.W.; resources, A.Ł., R.Z. and G.W.; data curation, A.Ł., R.Z. and G.W.; writing—original draft preparation, A.Ł., R.Z. and G.W.; writing—review and editing, A.Ł., R.Z., G.W.; visualization, A.Ł., R.Z. and G.W.; supervision, A.Ł. and R.Z.; project administration, A.Ł. and R.Z. All authors have read and agreed to the published version of the manuscript.

Funding

This research received no external funding.

Institutional Review Board Statement

Not applicable.

Informed Consent Statement

Not applicable.

Data Availability Statement

Not applicable.

Acknowledgments

We would like to thank the anonymous reviewers for their valuable comments and suggestions. We would also like to thank the anonymous English native speaker who reviewed our manuscript.

Conflicts of Interest

The authors declare no conflict of interest.

References

  1. Kaniecki, A. Environmental changes in the Warta valley within the Poznań area connected with antropopressure. Landf. Anal. 2013, 24, 23–34. [Google Scholar] [CrossRef]
  2. Molewski, P.; Juśkiewicz, W. An attempt to reconstruct the primary relief of the Old Town of Toruń and its close suburbs on the basis of the geological and historical geoinformation. Landf. Anal. 2014, 25, 115–124. [Google Scholar] [CrossRef]
  3. Brandolini, P.; Faccini, F.; Paliaga, G.; Piana, P. Urban Geomorphology in Coastal Environment: Man-Made Morphological Changes in a Seaside Tourist Resort (Rapallo, Eastern Liguria, Italy). Quaest. Geogr. 2017, 36, 97–110. [Google Scholar] [CrossRef] [Green Version]
  4. Dall’Aglio, P.L.; de Donatis, M.; Franceschelli, C.; Guerra, C.; Guerra, V.; Nesci, O.; Piacentini, D.; Savelli, D. Geomorphological and Anthropic Control of the Development of Some Adriatic Historical Towns (Italy) Since the Roman Age. Quaest. Geogr. 2017, 36, 111–123. [Google Scholar] [CrossRef] [Green Version]
  5. Pica, A.; Luberti, G.M.; Vergari, F.; Fredi, P.; Del Monte, M. Contribution for an Urban Geomorphoheritage Assessment Method: Proposal from Three Geomorphosites in Rome (Italy). Quaest. Geogr. 2017, 36, 21–36. [Google Scholar] [CrossRef] [Green Version]
  6. Reynard, E.; Pica, A.; Coratza, P. Urban Geomorphological Heritage. An Overview. Quaest. Geogr. 2017, 36, 7–20. [Google Scholar] [CrossRef] [Green Version]
  7. Zwoliński, Z.; Hildebrandt-Radke, I.; Mazurek, M.; Makohonienko, M. Existing and Proposed Urban Geosites Values Resulting from Geodiversity of Poznań City. Quaest. Geogr. 2017, 36, 125–149. [Google Scholar] [CrossRef] [Green Version]
  8. Luberti, G.M. Computation of modern anthropogenic-deposit thicknesses in urban areas: A case study in Rome, Italy. Anthr. Rev. 2018, 5, 2–27. [Google Scholar] [CrossRef]
  9. Zarychta, R.; Łajczak, A.; Struś, P. Reconstruction of topography changes in Krakow centre during the last 1000 years with application of advanced geoinformations tools and historical information on town development and changes in hydrographic network. In Genesis, Lithology and Stratigraphy of Quaternary Sediments, T. VII; Kostrzewski, A., Stach, A., Majewski, M., Eds.; Instytut Geoekologii i Geoinformacji Uniwersytet im. Adama Mickiewicza w Poznaniu: Poznań, Poland, 2018; pp. 217–220. ISBN 978-83-936793-0-0. [Google Scholar]
  10. Pröschel, B.; Lehmkuhl, F. Paleotopography and anthropogenic deposition thickness of the city of Aachen, Germany. J. Maps 2019, 15, 269–277. [Google Scholar] [CrossRef] [Green Version]
  11. Zarychta, R. The post-mining landscape of the Liban quarry in Cracow. Pol. Geol. Rev. 2019, 67, 1002–1011. [Google Scholar] [CrossRef]
  12. Łajczak, A.; Zarychta, R. Reconstruction of the morphology and hydrography of the centre of Kraków before the mid-13th century. Geogr. Pol. 2020, 93, 25–50. [Google Scholar] [CrossRef]
  13. Zarychta, R.; Zarychta, A.; Bzdęga, K. Progress in the Reconstruction of Terrain Relief Before Extraction of Rock Materials—The Case of Liban Quarry, Poland. Remote. Sens. 2020, 12, 1548. [Google Scholar] [CrossRef]
  14. Setmajer, J. Main features of geological structure and primary topography of the Cracow area and the neighbouring Subcarpathian region. Acta Archaeol. Carpathica 1973, 13, 139–151. [Google Scholar]
  15. Radwański, K. Water relations of early medieval Okoł in Krakow, their influence on settlement, attempts to relate these issues with climate changes. Mater. Archeol. 1972, 13, 5–37. [Google Scholar]
  16. Radwański, K. Pre-Location Krakow—Spatial Development; Polskie Towarzystwo Archeologiczne i Numizmatyczne Oddział w Nowej Hucie, Muzeum Archeologiczne w Krakowie: Krakow, Poland, 1975. [Google Scholar]
  17. Carver, M.O.H. Forty french towns: An essay on archaeological site evaluation site evaluation and historical aims. Oxford J. Archaeol. 1983, 2, 339–378. [Google Scholar] [CrossRef]
  18. Vogel, S.; Märker, M.; Seiler, F. Revised modelling of the post-AD 79 volcanic deposits of Somma-Vesuvius to reconstruct the pre-AD 79 topography of the Sarno River plain (Italy). Geol. Carpathica 2011, 62, 5–16. [Google Scholar] [CrossRef] [Green Version]
  19. Campagna, L.; Scardozzi, G. The Archaeological Map for the Reconstruction of the Ancient Topography of the Greek and Roman City of Taormina. LAC2014 Proc. 2016, 1–10. [Google Scholar] [CrossRef]
  20. Mozzi, P.; Ferrarese, F.; Zangrando, D.; Gamba, M.; Vigoni, A.; Sainati, C.; Fontana, A.; Ninfo, A.; Piovan, S.; Rossato, S.; et al. The modeling of archaeological and geomorphic surfaces in a multistratified urban site in Padua, Italy. Geoarchaeology 2018, 33, 67–84. [Google Scholar] [CrossRef]
  21. Van, T.T.; Phuong, D.T.K.; Van, P.Y.; Bao, H.D.X. Mapping Changes of Surface Topography under Urbanization Process in Ho Chi Minh City, Vietnam, Using Satellite Imagery. In Proceedings of the 1st International Electronic Conference on Remote Sensing, 22 June–5 July 2015; pp. 1–7. [Google Scholar]
  22. Qiao, W.; Gao, J.; Guo, Y.; Ji, Q.; Wu, J.; Cao, M. Multi-dimensional expansion of urban space through the lens of land use: The case study of Nanjing City, China. J. Geogr. Sci. 2019, 29, 749–761. [Google Scholar] [CrossRef] [Green Version]
  23. Łajczak, A. The Impact of River Regulation, 1850–1990, on the Channel and Floodplain of the Upper Vistula River, Southern Poland. In River Geomorphology; Hickin, E.J., Ed.; Wiley: Chichester, UK, 1995; pp. 209–233. [Google Scholar]
  24. Łajczak, A.; Zarychta, R.; Wałek, G. Changes in the topography of Krakow city centre, Poland, during the last millennium. J. Maps 2020, 1–8. [Google Scholar] [CrossRef]
  25. Łuszczkiewicz, W. The oldest Krakow basing on the research of former topography. Rocz. Krak. 1899, 2, 1–28. [Google Scholar]
  26. Bąkowski, K. Krakow before the Location in 1257; Towarzystwo Miłośników Historyi i Zabytków Krakowa: Krakow, Poland, 1935; Volume 88. [Google Scholar]
  27. Dobrzycki, J. Research issues from the history of the oldest Krakow. Stud. Wczesnośredniowieczne 1953, 2, 65–81. [Google Scholar]
  28. Kmietowicz-Drathowa, J. Review of previous reconstructions of the topography of Krakow in the light of geology. Mater. Archeol. 1972, 13, 41–56. [Google Scholar]
  29. Kmietowicz-Drathowa, I. Preliminary reconstruction of natural topography of Krakow centre. Mater. Archeol. 1974, 15, 151–159. [Google Scholar]
  30. Grabowski, A. Topography of Former Krakow; Wydawnictwo Jagiellonia: Krakow, Poland, 2008. [Google Scholar]
  31. Sokołowski, T. Topographic background of settlement in Krakow. Geologia 2009, 35, 67–76. [Google Scholar]
  32. Kondracki, J. Regional Geography of Poland; Państwowe Wydawnictwo Naukowe: Warsaw, Poland, 2000. [Google Scholar]
  33. Solon, J.; Borzyszkowski, J.; Bidłasik, M.; Richling, A.; Badora, K.; Balon, J.; Brzezińska-Wójcik, T.; Chabudziński, Ł.; Dobrowolski, R.; Grzegorczyk, I.; et al. Physico-geographical mesoregions of Poland: Verification and adjustment of boundaries on the basis of contemporary spatial data. Geogr. Pol. 2018, 91, 143–170. [Google Scholar] [CrossRef]
  34. Gradziński, R. Geological Guide of Krakow and Surrounding Areas; Wydawnictwa Geologiczne: Warsaw, Poland, 1972. [Google Scholar]
  35. Rutkowski, J. Geology of Krakow region. Przegląd Geol. 1989, 37, 302–308. [Google Scholar]
  36. Bogacz, A.; Bojakowska, I.; Kawulak, M.; Lis, J.; Nieć, M.; Pasieczna, A.; Poręba, E.; Romanek, A.; Salamon, E.; Woliński, W.; et al. Explanations to Geo-Environmental Map of Poland 1:50,000, Sheet Krakow (973); Państwowy Instytut Geologiczny, Ministerstwo Środowiska: Warsaw, Poland, 2004. [Google Scholar]
  37. Europe. Countries 2016, [Data file: CNTR_BN_01M_2016_4326.shp]. EUROSTAT. 2016. Available online: https://gisco-services.ec.europa.eu/distribution/v1/countries-2016.html (accessed on 10 March 2021).
  38. Orthophotomap. 2019. Available online: https://mapy.geoportal.gov.pl/imap/Imgp_2.html?locale=pl&gui=new&sessionID=5651426 (accessed on 10 March 2021).
  39. Rutkowski, H. Historical Atlas of Poland. Krakow Province in the Second Half of the 16c. Part I. Maps, Plans; Institute of History PAN, Neriton: Warsaw, Poland, 2008. [Google Scholar]
  40. Orthophotomap. 2019. Available online: https://mapy.geoportal.gov.pl/imap/Imgp_2.html?locale=pl&gui=new&sessionID=5645672 (accessed on 10 March 2021).
  41. Tyczyńska, M.; Chmielowiec, S. Geomorphological map of Krakow (9). In Atlas of Krakow Town; Trafas, K., Ed.; Państwowe Przedsiębiorstwo Wydawnictw Kartograficznych: Warsaw/Wrocław, Poland, 1988. [Google Scholar]
  42. Rutkowski, J. Detailed Geological Map of Poland, 1:50,000, Sheet Krakow (973); Wydawnictwa Geologiczne: Warsaw, Poland, 1992. [Google Scholar]
  43. Rutkowski, J. Explanations for Detailed Geological Map of Poland, 1:50,000, Sheet Krakow (973); Państwowy Instytut Geologiczny: Warsaw, Poland, 1993. [Google Scholar]
  44. Żaki, A. On Former Relief of the Area of Wawel Hill; Report on PAN Committee Meetings; Polska Akademia Nauk: Krakow, Poland, 1962. [Google Scholar]
  45. Żaki, A. Beginning of Krakow; Wydawnictwo Literackie: Krakow, Poland, 1965. [Google Scholar]
  46. Jamka, R. Krakow in Prehistory T. 1; Zakład Narodowy im. Ossolińskich: Wrocław, Poland, 1963. [Google Scholar]
  47. Humnicki, J. Maps of pre-location castle-towns 1:300,000. Krakow in the 11th-12th centuries. In Historical Atlas of Poland; Adamaszek, J., Ed.; Polskie Przedsiębiorstwo Wydawnictw Kartograficznych: Warsaw, Poland, 1979; p. 6. [Google Scholar]
  48. Rapp, G.; Hill, C.L. Geoarchaeology: The Earth-Science Approach to Archaeological Interpretation; Yale University Press: New Haven, CT, USA, 1999; ISBN 0-300-07076-4. [Google Scholar]
  49. Mitášová, H.; Mitáš, L. Interpolation by Regularized Spline with Tension: I. Theory and Implementation. Math. Geol. 1993, 25, 641–655. [Google Scholar] [CrossRef]
  50. Cebecauer, T.; Hofierka, J.; Šúri, M. Processing digital terrain models by regularized spline with tension: Tuning interpolation parameters for different input datasets. In Proceedings of the Open Source GIS—GRASS Users Conference 2002, Trento, Italy, 11–13 September 2002; pp. 1–12. [Google Scholar]
  51. Tobiasz, M. Historical Transformations of Water Network and Land Use in Krakow; Zakład Narodowy im. Ossolińskich, PAN: Wrocław/Krakow, Poland, 1977. [Google Scholar]
  52. Gregory, K.J. River channels. In Human Activity and Environmental Process; Gregory, K.J., Walling, D.E., Eds.; Wiley: Chichester, UK, 1987; pp. 207–235. [Google Scholar]
  53. Mieg, F. Karte de Königreiches Galizien und Lodomerien, 1:28,800; Instytut Archeologii i Etnologi: Wien, Austria, 1779–1782.
  54. Gross, J. Topographische Karte von Galizien und Lodomerien. 1:144,000; Instytut Archeologii i Etnologi: Wien, Austria, 1824. [Google Scholar]
  55. Liesganig, J. Regna Galiciae et Lodomeriae. 1:288,000; Instytut Archeologii i Etnologi: Wien, Austria, 1824. [Google Scholar]
  56. Ritter, K.; von Kummersberg, C. Administrative-Karte von den Königreichen Galizien und Lodomerien. 1:115,000; Instytut Archeologii i Etnologi: Wien, Austria, 1855. [Google Scholar]
  57. Shaded Relief Map. 2017. Available online: https://mapy.geoportal.gov.pl/imap/Imgp_2.html?locale=pl&gui=new&sessionID=5646054 (accessed on 10 March 2021).
  58. Krakow. City Map, 1:20 000; Compass: Krakow, Poland, 2019.
  59. Zevenbergen, L.W.; Thorne, C.R. Quantitative analysis of land surface topography. Earth Surf. Process. Landforms 1987, 12, 47–56. [Google Scholar] [CrossRef]
  60. Cerveira Cordeiro, J.P.; Câmara, G.; Moura de Freitas, U.; Almeida, F. Yet Another Map Algebra. Geoinformatica 2009, 13, 183–202. [Google Scholar] [CrossRef]
  61. Soysal, Ö.M.; Schneider, H.; Shrestha, A.; Guempel, C.D.; Li, P.; Kondoju, N.K.; Sekeroglu, K. Zonal statistics to identify hot-regions of traffic accidents. In Proceedings of the International Conference on Modeling, Simulation and Visualization Methods (MSV), Las Vegas, NV, USA, 12–15 July 2012. [Google Scholar]
  62. Punzet, J. Changes in the course of water stages within the Upper Vistula River catchment over the 100 years (1871–1970). Folia Geogr. Ser. Geogr. 1981, 14, 5–28. [Google Scholar]
  63. Archival Photo. Available online: https://lifeinkrakow.pl/cache/images/widen_1200//uploads/media/artyku%C5%82y/wis%C5%82a%20rzeka%20archiwa/7.jpg (accessed on 10 March 2021).
  64. Archival Photo. Available online: https://fotopolska.eu/foto/860/860716.jpg (accessed on 10 March 2021).
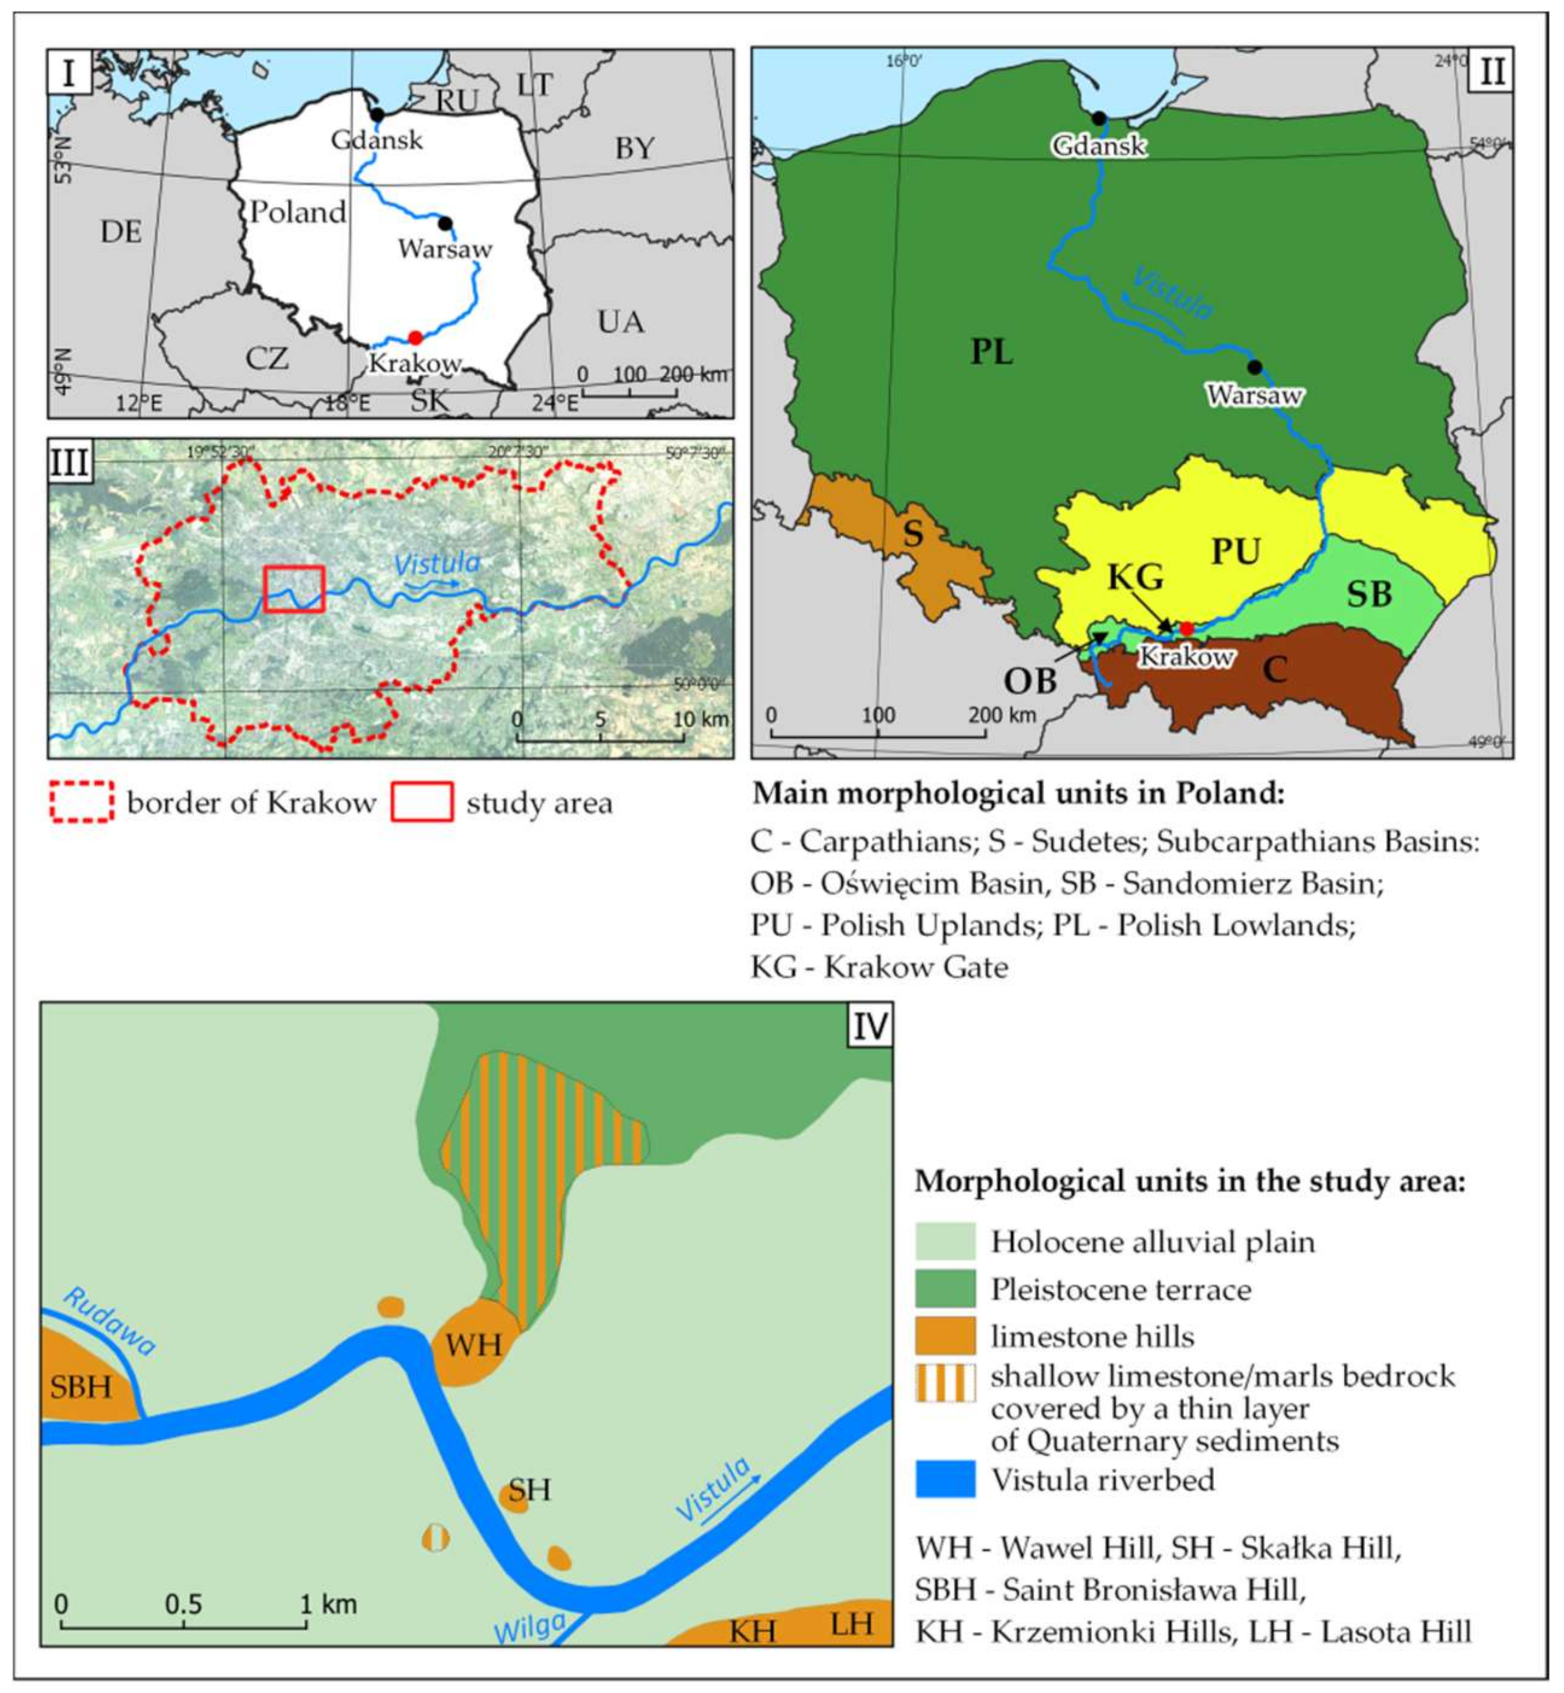
Figure 1. Location of Krakow in Europe (I) and in Poland (II) on the background of limit of morphological units. Location of the study area within borders of Krakow territory (III). Limit of morphological units within the study area (IV) [33,37,38].
Remotesensing 13 02286 g001
Figure 2. Areas inhabited in contemporary Krakow centre before the 13th century (I) and later (II). Current built-up areas and areas of recreational use without high housing development (III). Areas where spectacular changes in land topography occurred (IV) [40].
Remotesensing 13 02286 g002
Figure 3. The topography of the area studied expressed by hypsometry in historical variant (A) and current variant (B) and by distribution of landforms in historical variant (C) and current variant (D) [12,24]. Explanations in the text.
Remotesensing 13 02286 g003
Figure 4. Location of the investigated paleomeanders of the Vistula river near Krakow (I) and distribution of sites (II,III) where drillings were carried out in order to determine parameters of the paleochannel [33,57]. Explanations in the text.
Remotesensing 13 02286 g004
Figure 5. Topographic parameters of the areas in 5 m intervals in time variants (I,II): mean slope and % of the area without aspect and with N, E, S and W aspect.
Remotesensing 13 02286 g005
Figure 6. Percent of area without aspect and with N, E, S and W aspect concerning the Holocene alluvial plain, Pleistocene terrace and limestone hills in time variants (A,B), based on the third method.
Remotesensing 13 02286 g006
Figure 7. Percent of area without aspect and with N, E, S and W aspect concerning the lower rank landforms within the Holocene alluvial plain, Pleistocene terrace and limestone hills in time variants (A,B), based on the fourth method.
Remotesensing 13 02286 g007
Figure 8. (A)—the view of the Vistula upstream of the Wawel Hill, beginning of the 20th century. The narrowed and deepened river channel due to regulation works is well visible; the depth changed from 4.0 to 7.5 m. On the river banks there are low flood protecting levees [63]; (B)—the same view in March 2021. Visible increase in the width of water table as a result of its raise by 3.5 m since the 1960s. On the river banks there are 3 to 4 m high flood protecting levees used as urban promenades. Photo by R. Zarychta.
Remotesensing 13 02286 g008
Figure 9. (A)—One of the two Vistula channels in the centre of Krakow which used to be named the Old Vistula, shallowed with flood deposits; 3 m depth in 1870. The railway bridge is visible [64]; (B)—the channel after intentional burning at the end of the 1870s. Because one of the city paths was created there, the surface raised by over 3 m. The former railway bridge has been operating as a railway viaduct for over 140 years. March 2021. Photo by R. Zarychta.
Remotesensing 13 02286 g009
Figure 10. Convex landforms on Holocene alluvial plain: (A)—fronton of Marshal Józef Piłsudski Bridge (5 m high); (B)—overlook hillock in Jordan Park (10 m high). March 2021. Photos by R. Zarychta.
Remotesensing 13 02286 g010
Figure 11. Differentiated thickness of cultural deposits within the Main Market in the Old Town, the creation of which resulted in area flattening. (A)—view of the eastern part of the Main Market. Location of the selected objects and thickness of cultural deposits in their surroundings: (B)—Underground Museum, well-visible structure of deposits, (C)—underground restaurant, former the first floor; (D)—uncovered fragment of the initial surface at the wall of The Saint Mary’s Church. 2 m thick cultural deposits are marked next to Adam Mickiewicz Monument. March 2021. Photos by R. Zarychta.
Remotesensing 13 02286 g011
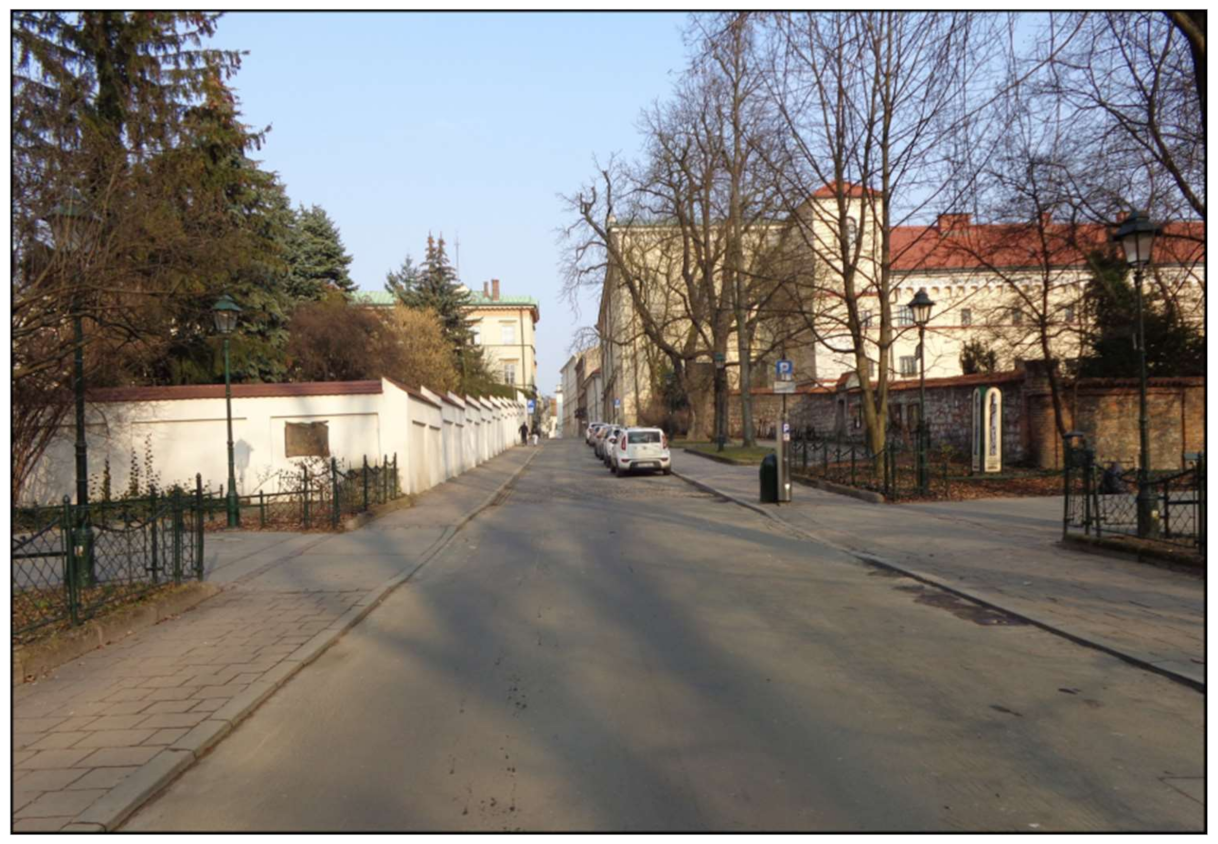
Figure 12. One of the roads leading to the Old Town (Poselska Str.), the height difference of which used to be 7 m between the Holocene alluvial plain and the Pleistocene terrace. At present it is 5 m. The road in front of the escarpment of high terrace has run along the intentionally created earth embankment (ramp) the slopes of which are beyond the visible walls. March 2021. Photo by R. Zarychta.
Remotesensing 13 02286 g012
Figure 13. Morphology of the slopes of Lasota Hill transformed as a result of limestone quarrying. (A)—vertical rocky walls adjacent to slopes of initial morphology; (B)—excavation floor in the closed quarry adjacent to rocky walls. March 2021. Photos by R. Zarychta.
Remotesensing 13 02286 g013
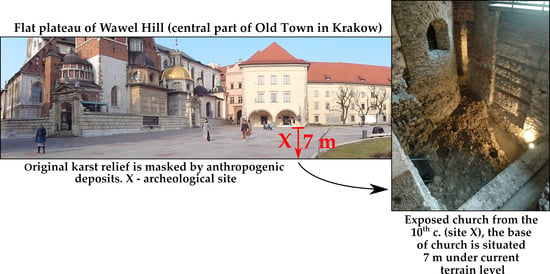
Figure 14. Differentiated thickness of cultural deposits within the plateau of the Wawell Hill, which caused surface flattening. (A)—eastern part of the plateau, the Cathedral and the part of the Royal Castle. Location of the selected objects and thickness of cultural deposits in their surrounding: (B)—stairs leading to the initial level “0” of the Cathedral; (C)—part of the Underground Museum “Wawel Zaginiony” (Lost Wawel), a rotunda from the 10th century uncovered from cultural deposits. Places are marked where thickness of cultural deposits is only 1 m or 2 m. March 2021. Photos by R. Zarychta.
Remotesensing 13 02286 g014
Table 1. Difference between values of topographic parameters from variant (B) and (A) based on the first method.
Altitude
[m a.s.l.]
Area
[km2]
Mean Slope
[%]
Without Aspect
[% of Area]
N Aspect
[% of Area]
E Aspect
[% of Area]
S Aspect
[% of Area]
W Aspect
[% of Area]
195–235-2.6−1335−49
230–2350.004.90−6−10−1026
225–2300.02−0.20−172510
220–225−0.012.90−18−2128
215–2200.02−8.22−246313
210–2150.471.6−2164−3214
205–2100.313.3013−8−61
200–2053.471.9−574−115
195–200−4.281.725−4−10−8-3
Negative values show the decrease of parameter values.
Table 2. Values of topographic parameters: (1)—left and (2)—right, based on the second method. Explanations in the text.
Altitude
[m a.s.l.]
∆h
[m]
Mean Slope
[%]
Without Aspect
[% of Area]
N Aspect
[% of Area]
E Aspect
[% of Area]
S Aspect
[% of Area]
W Aspect
[% of Area]
195–23537.035.72.34.91741922192430261524
42.044.2 1
230–2354.7026.608.823.6002622191243361230
225–2305.0023.3011.315.8004238232220191521
220–2255.0022.6018.020.9004138261823241020
215–2205.0023.9027.023.900504523212218516
210–2155.0015.503.66.221521202661291223
205–2105.0012.003.04.811719302435312725
200–2055.0010.002.04.0721823192337271925
195–2002.008.000.84.028551823202321251322
7.09.5 1
1 including altitude of the Vistula riverbed (area located below 195 m a.s.l.).
Table 3. Topographic parameters of main landforms (a–d), in time variant (A),(B), based on the third method.
LandformArea [km2]
[% of Area]
∆h
[m]
Mean Slope
[%]
Without Aspect
[% of Area]
N Aspect
[% of Area]
E Aspect
[% of Area]
S Aspect
[% of Area]
W Aspect
[% of Area]
(A) a6.4670%5.41.11820183014
(B) a7.1877%9.12.91421212321
(A) b1.3915%10.94.312264724
(B) b1.3915%8.93.224283531
(A) c0.495%32.015.504817278
(B) c0.485%29.011.9335182321
(A) d0.9510%5.0------
(B) d0.263%9.5------
a Holocene alluvial plain, b Pleistocene terrace, c limestone hills, d Vistula riverbed.
Table 4. Topographic parameters of lower rank landforms (a1, a2), (b1, b2), (c1, c2) in time variant (A) and (B) based on the fourth method.
Landform∆h
[m]
Mean Slope
[%]
Without Aspect
[% of Area]
N Aspect
[% of Area]
E Aspect
[% of Area]
S Aspect
[% of Area]
W Aspect
[% of Area]
(A) a15.41.41720183114
(B) a17.12.81322212222
(A) a23.00.72020182814
(B) a29.12.91421212321
(A) b110.95.201254826
(B) b19.12.303243637
(A) b28.93.522284622
(B) b29.74.146323424
(A) c132.017.2046162513
(B) c129.015.0233232220
(A) c217.012.305018302
(B) c210.68.7636132520
a Holocene alluvial plain: a1 sandbars, a2 flat or concave landforms; b Pleistocene. terrace: b1 escarpment, b2 plateau; c limestone hills: c1 slopes, c2 plateau. For distribution of the landforms see Figure 3C,D.
Table 5. Comparison of analytical methods used in the research.
First MethodSecond MethodThird MethodFourth Method
Advantageeasy to use (areas between selected contour lines are considered).the same limit of the analysed areas in variants (A) and (B).as opposed to the first and second methods, only main landforms are analysed (advantage in geomorphological analysis).as opposed to the third method, lower rank landforms are analysed (advantage in geomorphological analysis).
Disadvantagedifferent limit of the analysed areas in variants (A) and (B).as compared to the first method, this method is more labour-consuming.the boundary of landforms runs at different altitude (a.s.l.), which makes calculations more difficult.remarks the same as in the third method.
Necessary parameterslimit of the areas in variants (A) and (B).
[km2]
limit of the areas only in variant (A) or variant (B).
[km2]
limit of the landforms.
[km2]
limit of the landforms.
[km2]
(A) historical situation, (B) contemporary situation.
Publisher’s Note: MDPI stays neutral with regard to jurisdictional claims in published maps and institutional affiliations.