Article

Evaluation of Orbital Drift Effect on Proba-V Surface Reflectances Time Series

Serco for European Space Agency (ESA), European Space Research Institute (ESRIN), 00044 Frascati, Italy
Remote Sens. 2021, 13(12), 2250; https://doi.org/10.3390/rs13122250
Submission received: 7 May 2021 / Revised: 28 May 2021 / Accepted: 3 June 2021 / Published: 9 June 2021
(This article belongs to the Special Issue Land Surface Global Monitoring from PROBA-V to Sentinel-3)

Abstract

:
Multi-temporal consistency of space-borne observations is an essential requirement for studying inter-annual changes and trends of satellite-derived biophysical products. The Proba-V mission, launched in 2013, was designed to ensure the continuity of the SPOT-VEGETATION long-term data record of global daily observations for land applications. The suitability of Proba-V to provide a temporally consistent data record is, however, potentially jeopardized by the orbital drift effect, which is known to induce spurious trends in time series. The aim of this paper is therefore to evaluate, for the first time, the orbital drift effect on Proba-V surface reflectance time series at 1 km resolution. In order to reliably identify such an effect, a two-fold approach is adopted. A simulation study is first defined to predict the temporal anomalies induced by the drifting illumination conditions. The numerical simulations are used as a benchmark to predict the impact of the drift for a range of sun-viewing angles. Real observations are then analyzed over a large set of land sites, globally spread and spanning a wide range of surface and environmental conditions. The surface anisotropy is characterized using the Ross-Thick Li-Sparse Reciprocal (RTLSR) Bidirectional Reflectance Distribution Function (BRDF) model. Both the simulation and the analysis of real observations consistently show that the orbital drift induces distinct and opposite trends in the two sides of the sensor across-track swath. Particularly, a positive drift is estimated in backward and a negative one in the forward scattering direction. When observations from all angular conditions are retained, these opposite trends largely compensate, with no remaining statistically significant drifts in time series of surface reflectances or Normalized Difference Vegetation Index (NDVI). As such, the Proba-V archive at 1 km resolution can be reliably used for inter-annual vegetation studies.

Graphical Abstract

1. Introduction

Multi-temporal consistency of satellite-based Earth Observation (EO) time series is a necessary condition to investigate inter-annual changes and trends of bio-geophysical parameters. Consistency in this context means stability of the estimated geophysical products’ uncertainties and this requirement is notably paramount for climate-related applications [1]. Several sources of uncertainties, of both random and systematic nature, may impact such stability requirements, ranging from uncorrected sensor ageing effects, issues in calibration and processing methodologies, or harmonization inconsistencies when merging multi-source satellite data for building long-term time series.
One of the potential sources of uncertainties is the instability of the orbital parameters during the satellite lifetime, such as orbit attitude, altitude or inclination. This instability can cause temporal variations of the space-based observation conditions, with resulting spurious trends in the considered time series. A typical example is the precession of the orbital plane, which, if not properly compensated with periodic in-orbit maneuvers, causes a natural drift of the equatorial overpass time, meaning that the same target on-ground is observed under varying illumination conditions throughout the mission.
The drift of the overpass time is known to impact the multi-temporal consistency of satellite-based EO products, as demonstrated for the Advanced Very High-Resolution Radiometer (AVHRR), aboard the National Oceanic and Atmospheric Administration (NOAA) series of polar-orbiting satellites [2,3,4,5,6,7,8,9]. Within these studies, it has been shown that the orbital decay poses serious challenges in the harmonization of at-sensor radiances [3] and introduces statistically significant trends in the inter-annual analysis of vegetation indices [4,5,6,7], Land and Sea Surface Temperature [4,8] and active fires [9].
Yet, the cited AVHRR studies mostly focused on investigating the relationship between the temporal changes of the considered geophysical variable and the inter-annual drift (increase) of the sun zenith angle, while less attention was paid to the potential impact of the temporally-varying sun-viewing relative azimuth angle. This parameter is, however, critical in regulating the signal received at the satellite, most notably for polar-orbiting large field-of-view sensors. For those sensors, the azimuthal conditions can strongly vary while moving across-track along the swath. In particular, two azimuthal regions will be sensed: one looking away from the sun, in the backscattering direction, the other looking towards the sun, in the forward scattering direction. Considering the highly anisotropic nature of terrestrial surfaces, such as the strong retro-reflectance peak (hot-spot) in the backscattering direction, time series observed in the two azimuthal conditions might show very different temporal behaviors.
The importance of carefully taking into account sun-viewing azimuthal conditions when dealing with time series of satellite-based geophysical products was pointed out in phenological studies over forest sites [10,11,12] based on the use of Moderate Resolution Imaging Spectroradiometer (MODIS) data. In particular, in [10] it was stressed that a potential imbalance in backward and forward scattering observations in composite products can eventually induce non-biophysical trends in the time series of vegetation indices, notably when considering the Enhanced Vegetation Index (EVI).
The purpose of this paper is to quantitatively evaluate, for the first time, the impact of the orbital drift on the time series of Proba-V [13,14] surface reflectances at 1 km resolution. The land surface anisotropy is characterized, within this study, using the semi-empirical Ross-Thick Li-Sparse Reciprocal (RTLSR) Bidirectional Reflectance Distribution Function (BRDF) model [15]. The predicted temporal changes along the mission are firstly evaluated using simulated data over a sample vegetated site. The multi-temporal consistency of observed and BRDF-normalized surface reflectances and Normalized Difference Vegetation Index (NDVI) is then assessed at global scale over a large set of sites, spanning a wide range of biomes and environmental conditions. The statistical analysis is aggregated per land cover class and angular configuration (near-nadir, forward and backward scattering) to characterize the orbital drift effect for different surface types and sun-viewing geometries.
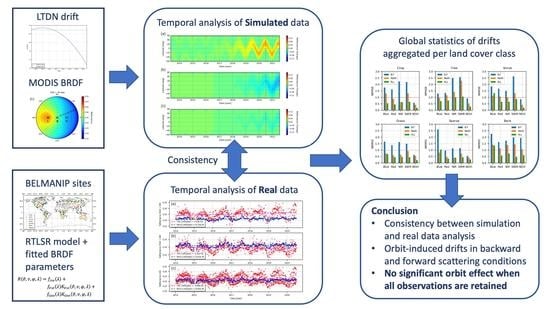
The paper is structured as follows. In Section 2, the background and the rationale of the study are illustrated, with emphasis on the motivations for the chosen twofold approach. Section 3 describes the used methods and input data and Section 4 presents the results, which are then discussed in Section 5. Conclusion are presented in Section 6.

2. Background and Rationale

2.1. Proba-V Mission

The Proba-V mission [13,14], launched by the European Space Agency (ESA) in May 2013, was designed to ensure the continuity of the SPOT-VEGETATION (SPOT-VGT) 15-year archive [16] of global daily observations over land and coastal zones. The Vegetation sensor on board Proba-V is a pushbroom multi-spectral radiometer acquiring measurements in four spectral bands: Blue, Red, Near-Infrared (NIR) and Short-Wave Infrared (SWIR) over an across-track swath of approximately 2250 km. This wide swath is obtained thanks to three overlapping cameras with an optical field of view of 34° each (see Figure 1). The Ground Sampling Distance (GSD) across-track ranges from 100 m at nadir to 350 m at the edges of the swath for the visible and NIR focal plane, while in the SWIR, GSD ranges from 200 m to 700 m [13]. Proba-V platform lacks an on-board calibration device; therefore, the sensor radiometric calibration was entirely based on vicarious approaches [17].
Proba-V products are released to the users as segments per camera (L2A) Top-Of-Atmosphere (TOA) product, as well as temporal composites S1 (daily) TOA and S1/S10 (daily and 10 days) atmospherically corrected Top-Of-Canopy (TOC), i.e., surface reflectance products [18]. The data are projected onto the Plate Carrée grid, and provided at 1 km, 333 m and 100 m spatial resolution. The cloud detection is based on a dynamic threshold method [18]. The cloud shadow pixels are flagged using a hybrid radiometric and geometric approach, while the snow/ice detection is based on a decision tree algorithm [18]. The atmospheric correction is performed using the Simplified Method for Atmospheric Correction (SMAC) approach [19]. The aerosol optical depth (AOD) at 550 nm is estimated using an optimization algorithm applied to the Blue channel over vegetated surfaces [20]; over desert sites and bare soils, a latitude-dependent AOD climatology is used instead.

2.2. Orbital Drift

Proba-V platform is lacking for an on-board propulsion system to maintain the orbit within a stable overpass time. As a result, the orbital plane was naturally drifting since launch, and the Local Time at Descending Node (LTDN) crossing the Equator was steadily varying during mission lifetime. The orbit’s injection was made as to delay the start of the orbital decay and to maintain the LTDN within an acceptable range of 10:45 a.m. +/−15 min during the first 4 years of mission. This late morning overpass time was set in continuity to SPOT-VGT and it is typically adopted for land-focused missions to minimize cloud coverage, as defined for Sentinel-2 [21] mission.
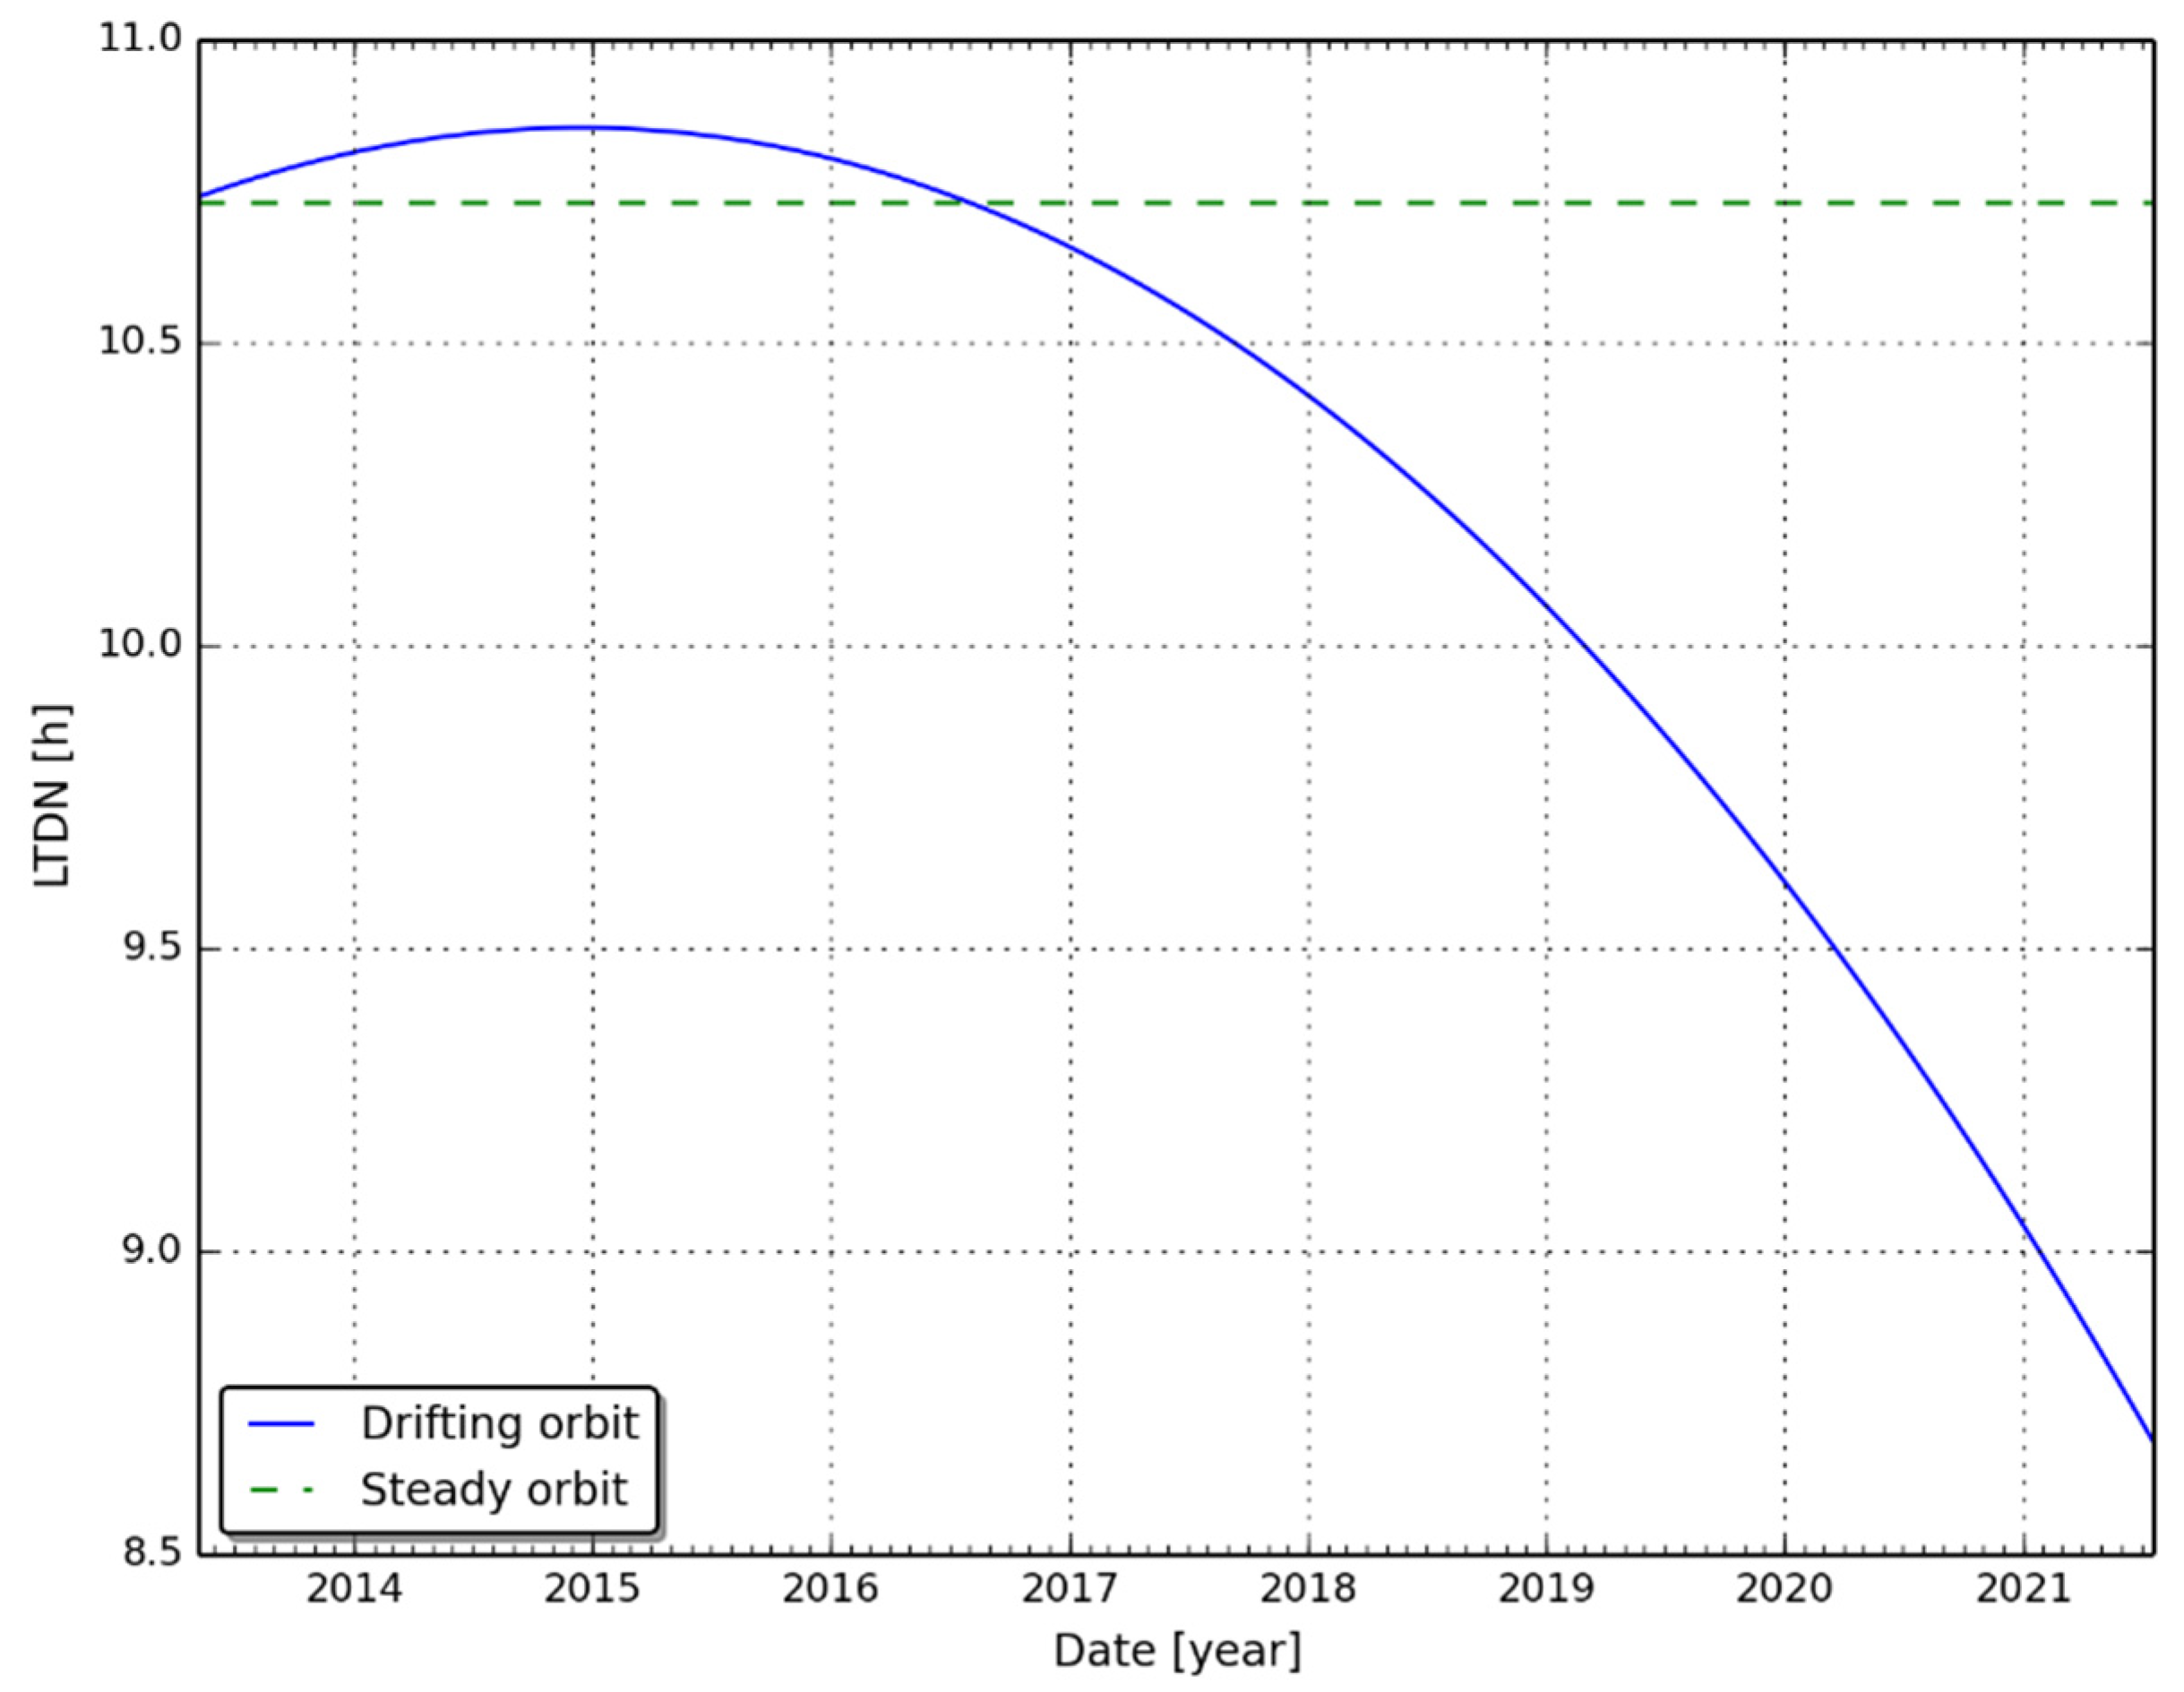
The evolution of the LTDN (see Figure 2) was estimated using flight model simulations, which predict the precession of the orbital plane along the mission, driven by the sun and moon gravitational pulls. These predictions were verified and routinely fine-tuned during the mission operations. The LTDN increased during the first 1.5 years of the mission, reaching approximately 10:50 a.m. in December 2014, before starting a constant decline towards early morning overpasses, reaching 10:30 a.m. in October 2017, 10:00 a.m. in April 2019 and 9:23 a.m. during June 2020.
In order to limit the impact of the degraded illumination conditions, the Proba-V Operational Phase was terminated on 1 July 2020 and an Experimental Phase started, with geographical coverage limited to Europe and Africa, but with the perspective to prepare for future exploitation in combination with Cubesat companion satellites [22].

2.3. Rationale of the Study

The objective of the paper is to quantitatively assess the impact of the orbital drift on the temporal consistency of Proba-V TOC directional reflectances, which are provided by ESA as part of standard user products [18]. There are a number of difficulties in addressing this objective, since the temporal stability of satellite-based surface reflectances is impacted by a range of concomitant factors, such as calibration drifts, directional effects, as well as natural variability of surface anisotropy and atmospheric conditions [23]. In order to disentangle sensor-related effects from the underlying natural variability, the problem is addressed from two complementary viewpoints.
At first, the impact of the drift is characterized using a prognostic approach, namely, the temporal evolution of LTDN is used as input to estimate the changes of surface reflectances over a sample vegetated site and for a range of sun and viewing angles. The results of the simulation allow to investigate the impact of the drift in a controlled experiment with known input data, and therefore it is used as a benchmark to verify the temporal patterns observed in real observations.
Secondly, the temporal drifts in operational TOC products are estimated over a large ensemble of terrestrial sites, spanning a wide range of land cover classes and climatic conditions. The orbital effect on real data is quantified as statistical difference between the drift estimated for TOC products and BRDF-normalized surface reflectances. The assumption is that BRDF-corrected data, normalized to a fixed sun-viewing geometry, are free of spurious trends induced by the drifting orbit.

3. Data and Methods

3.1. Proba-V Data

The data considered in the frame of this study are Proba-V TOC products of Collection 1 [24] at 1 km resolution, covering the full operational mission period, i.e., from January 2014 to June 2020. The quality flags available within the products—snow/ice, cloud and cloud shadow flags—were used to select clear pixels. The per-pixel geometry was used as input for the analysis, and includes the Viewing Zenith Angle (VZA), the sun zenith angle (SZA) and the viewing and sun azimuth angles (VAA and SAA, respectively). The products were accessed within the Proba-V Mission Exploitation Platform (MEP) [25] where all analyses have been made.

3.2. Method Used for the Simulation Study

The LTDN predicted variation, presented in Figure 2, was used as input to simulate the evolution of synthetic surface reflectances for a sample vegetated site as a function of the temporally varying sun-viewing conditions.

3.2.1. Modeled Solar Zenith Angle Variation

The simulation started by deriving the evolution of the Solar Zenith Angle (SZA) as a function of LTDN temporal changes, using the following formula [26]:
cos ϑ = sin δ sin ϕ + cos δ cos ϕ   cos ω ,
in which ϑ is the SZA, δ is the declination of the sun, ϕ is the latitude (defined positive at the northern hemisphere) and ω is the hour angle, which is derived from the LTDN (in hours) using the following expression:
ω = | L T D N 12 | · ( 360 ° 24 ) · π 180 °
The hour angle is a measure of the local time; it is defined as the angle through which the Earth must turn to bring the meridian of the location of observation directly under the sun. The following empirical expression for the solar declination δ was used, which is a function of the day of the year [26]:
δ = ( 0.006918 0.399912 cos γ + 0.070257 sin γ 0.008758 cos 2 γ + 0.000907 sin 2 γ 0.002697 cos 3 γ + 0.00148 sin 3 γ ) ( 180 ° π ) ,
where γ = 2 π ( i 1 ) / 365 and i is the day of the year. The evolution of SZA as a function of LTDN was used as input to a BRDF semi-empirical model in order to forecast the variation of surface reflectances in the four Proba-V spectral bands and for the three cameras.

3.2.2. Adopted BRDF Model

The kernel-driven RTLSR BRDF model, adopted for MODIS albedo products [27], was used in the frame of this study. This semi-empirical model, based on the formulation elaborated by Roujean et al. [28], consists of expressing the BRDF as a sum of three kernels representing basic scattering types: isotropic scattering, volumetric scattering and geometric-optical surface scattering. In this formalism, the BRDF is expressed as [28]:
R ( ϑ ,   v ,   φ ,   λ ) = f I s o ( λ ) + f V o l ( λ ) K V o l ( ϑ ,   v ,   φ ,   λ ) + f G e o ( λ ) K G e o ( ϑ ,   v ,   φ ,   λ ) ,
where ϑ ,   v ,   φ are the solar zenith, view zenith and relative azimuth angles, respectively. The terms [ K V o l ( ϑ ,   v ,   φ ,   λ ) , K G e o ( ϑ ,   v ,   φ ,   λ ) ] are the model kernels and the terms [ f I s o ( λ ) , f V o l ( λ ) , f G e o i ( λ ) ] are the spectrally dependent BRDF kernel weights, which are referred to as BRDF parameters in the remainder of the paper. The model kernels are computed following the assumptions and equations used for MODIS Albedo product [27]. In particular, the volumetric kernel, K V o l ( ϑ ,   v ,   φ ,   λ ) , is the so-called Ross-Thick, which assumes a dense canopy layer of small leaves with a uniform leaf angle distribution, a Lambertian background and equal values of transmittance and reflectance based on a single-scattering approximation of the radiative transfer theory [29]. The geometric kernel, K G e o ( ϑ ,   v ,   φ ,   λ ) , is the Li-Sparse kernel, assuming sparse three-dimensional objects casting shadows on a Lambertian background [30,31].

3.2.3. Evolution of Synthetic Surface Reflectances

The evolution of synthetic surface reflectances is simulated over a sample vegetated site, whose BRDF parameters are assumed invariant with time. The rationale was to simulate temporal anomalies induced solely by variations of sun-viewing conditions, driven by the orbital drift. Yet, in order to approximate realistic temporal evolution of surface reflectances, a homogeneous, densely vegetated evergreen forest site was chosen as the region of interest. This site, located in the Amazon rainforest at −8.52° latitude and −53.25° longitude, shows spatial homogeneity at kilometric scale, stable phenology with minor seasonal fluctuations of the BRDF parameters and lack of major land cover changes in recent years. Both the spatial homogeneity, in a radius of 5 km around the site and the temporal stability for the considered time frame, were qualitatively verified via Google Earth, using the time slider and image browser provided as part of the tool.
The BRDF parameters used for the simulation were derived from MODIS BRDF Albedo daily product Version 6 at 500 m resolution (MCD43A1.006) [32]. The product was accessed through the Google Earth Engine (GEE) platform [33]. The MODIS Albedo parameters for Bands 3, 1, 2 and 6 were used to simulate the BRDF in the overlapping Proba-V spectral bands, particularly for bands Blue, Red, NIR and SWIR. A 5-year average (2015–2020) of MODIS BRDF parameters in a region of 5 × 5 km centered on the region of interest was used to derive the parameters for the simulation, which are reported in Table 1. The rationale of the multi-annual and spatial averaging was to smooth out residual random uncertainties in the retrieval of the BRDF parameters in the original MODIS daily products at 500 m spatial resolution.
The simulation considers the viewing angles at the center of each camera and focuses only in the principal plane, i.e., the plane containing the sun, the surface normal and the observer, where we have strongest BRDF variations. This condition provides a worst-case scenario to magnify the impact of the orbital drift. The evolution of surface reflectances for a given spectral band and a given camera is computed using Equation (4) and the BRDF parameters of Table 1.

3.3. Method for Real Observations Analysis

3.3.1. Evaluation Sites

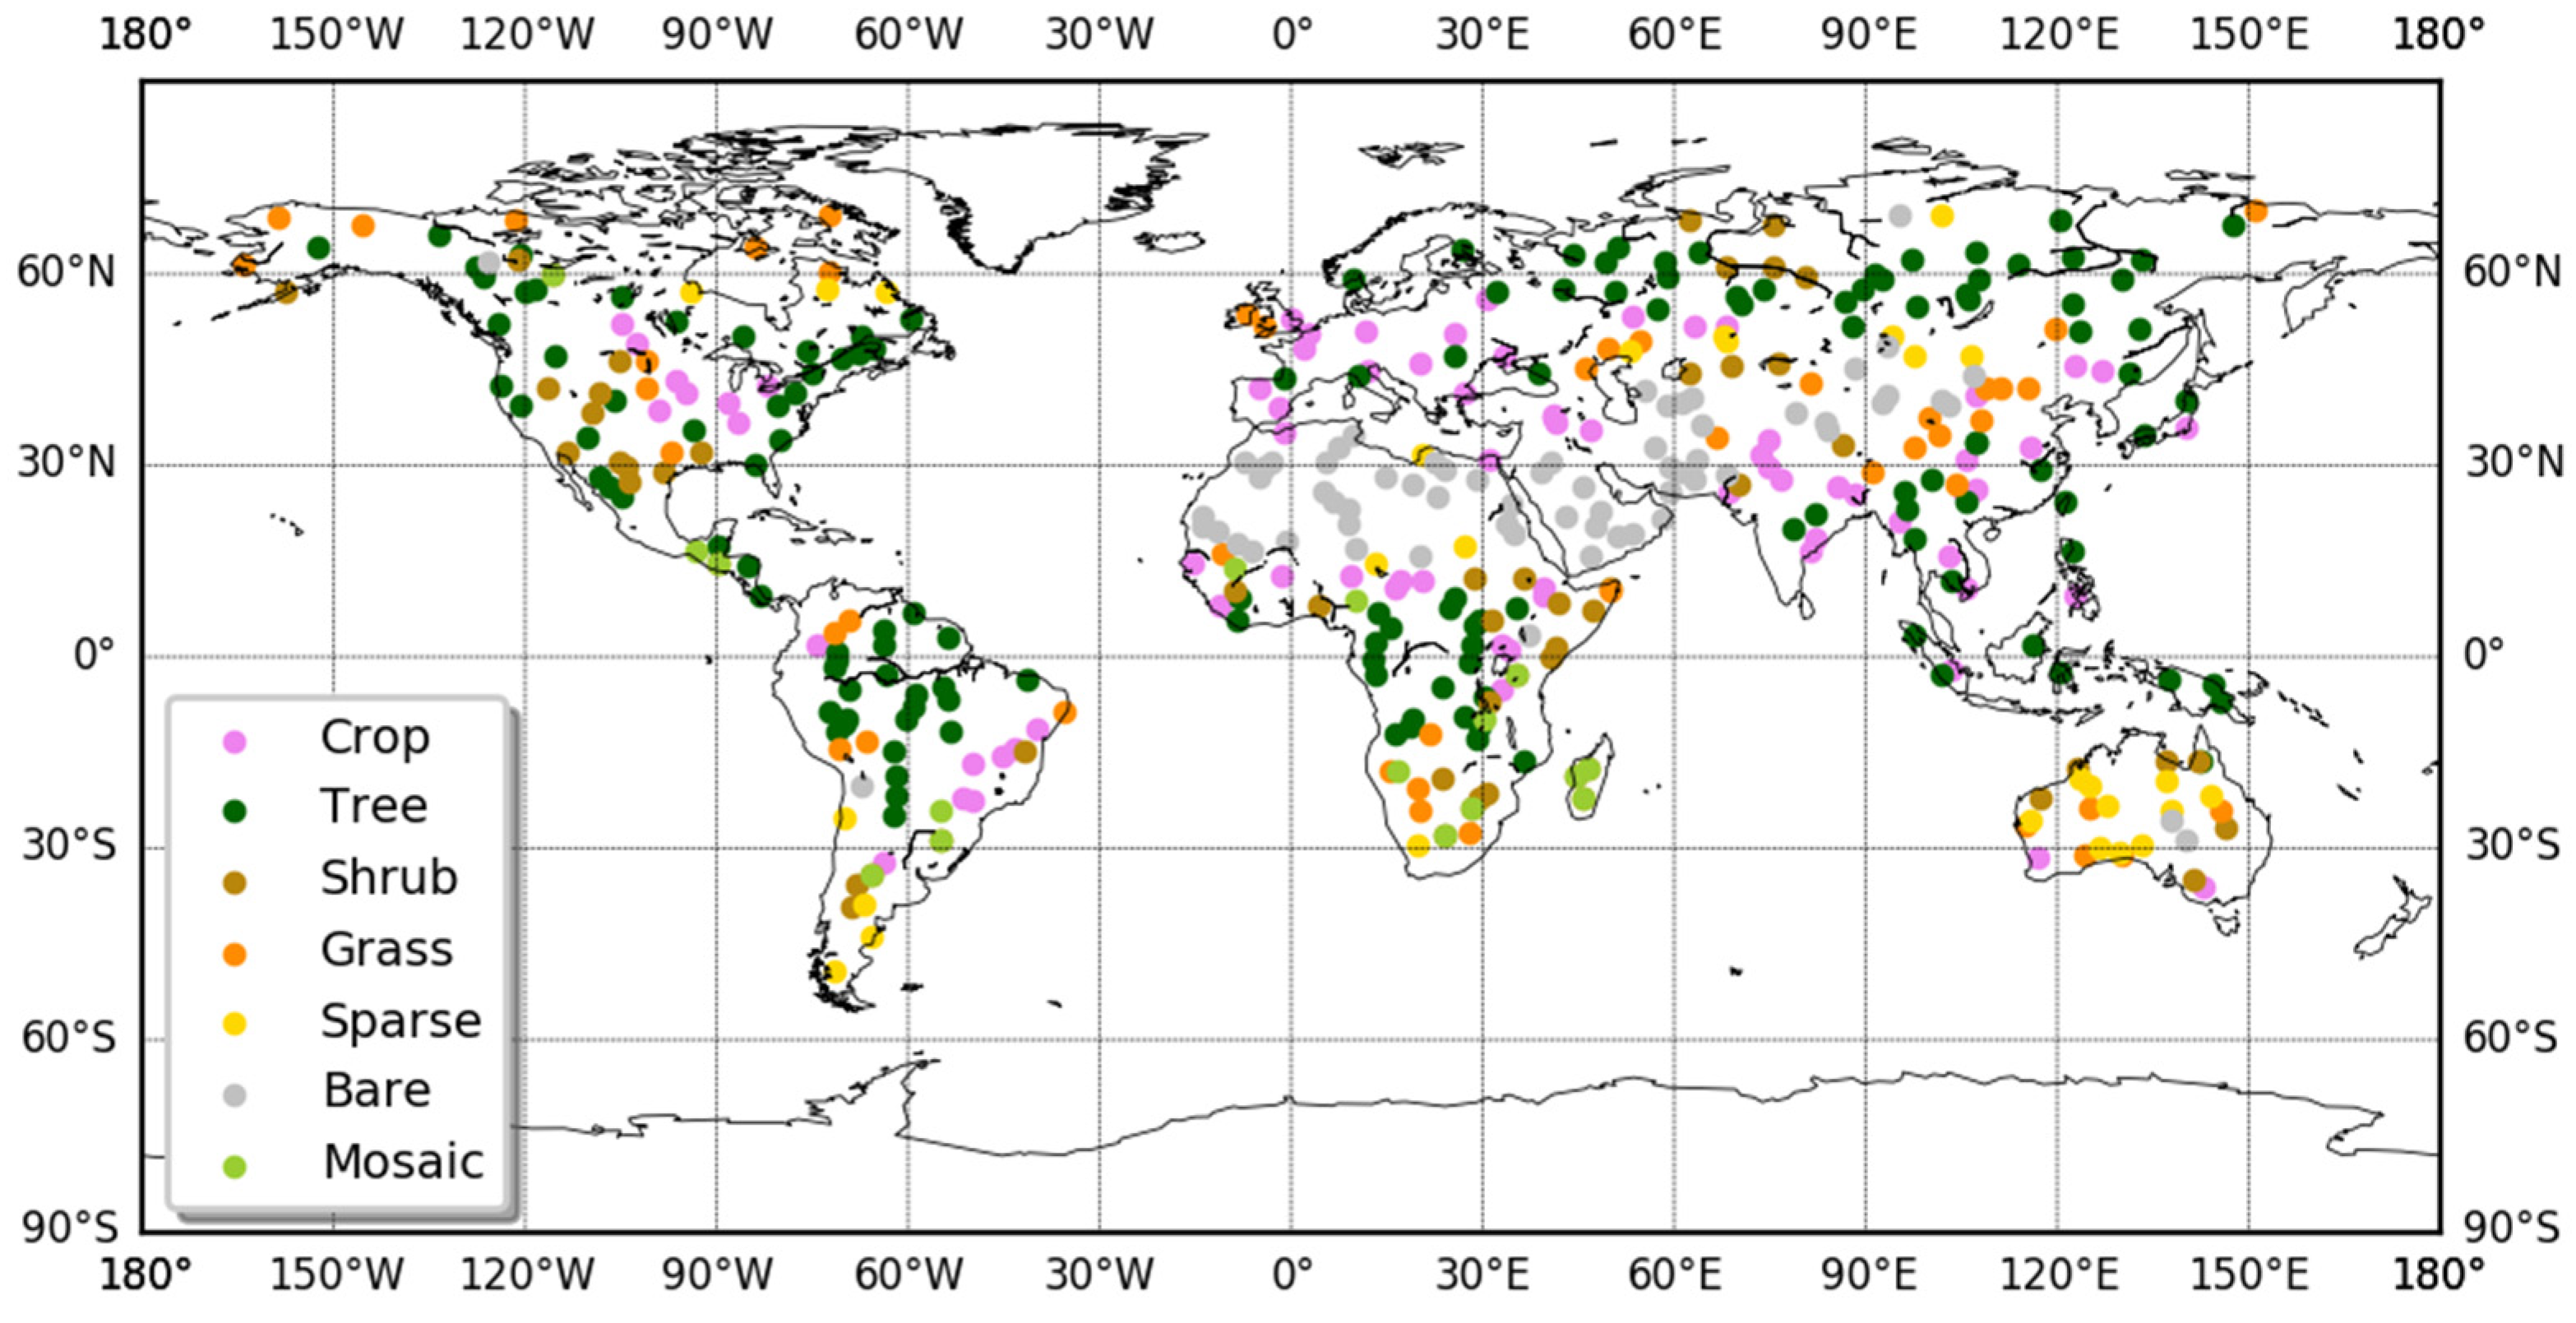
The temporal consistency of TOC products was evaluated over a large set of globally distributed and spatially homogeneous land sites. To this purpose, the BELMANIP-2 (BEnchmark Land Multisite ANalysis and Intercomparison of Products) list of sites was considered [34]. These sites were originally proposed as benchmark for intercomparison of satellite-derived coarse resolution biophysical products [34]; to this end, the sites were selected to be homogeneous at kilometric scale, almost flat and with a minimum proportion of urban area or permanent water bodies. This site selection is well suited for the purpose of the present study, since it allows verifying the presence of orbit-induced drifts and their correlation with latitude, biome type or environmental conditions. The location of the considered BELMANIP-2 sites is displayed in Figure 3 together with the corresponding global land cover class, derived from the ESA Climate Change Initiative (CCI) Land Cover Version 2.0 product [35].

3.3.2. BRDF Normalization Procedure

For each Proba-V spectral band and each BELMANIP-2 site, the BRDF parameters of the RTLSR model, provided in Equation (4), were fitted to the cloud-free TOC observations available within a moving window of +/−10 days centered on the considered day. The procedure is repeated for each day of observation. The cloud-free TOC observations are averaged within a box of 5 × 5 km around the considered location. The averaging in the spatial domain, which is justified by the homogeneity of the considered sites [34], allows for consolidating the time series, minimizing impact of isolated cloud patches within or nearby the central pixel and smoothing out residual atmospheric contamination in the TOC products at 1 km.
The gathering of TOC observations during a period of N d a y s is generally adopted for retrieving the parameters of the BRDF semi-empirical model, under the assumption that surface properties do not change during the gathering period. The choice of the length of this period is ultimately a trade-off between the need of extending the temporal interval, to ensure enough cloud-free observations, and the potential impact of surface variability during the chosen interval. The period considered within this study ( N d a y s = 20 ) is slightly larger than the one used for MODIS Albedo product (16 days) and the assumption of surface stability may fail over dynamic land cover class, notably over cropland.
The BRDF fitting procedure works as a standard least-square error minimization procedure. The state vector, to be retrieved for each considered spectral band, consists of the triplets of BRDF parameters [ f I s o ( λ ) , f V o l ( λ ) , f G e o i ( λ ) ]. The measurement vector y j has dimension m, which corresponds to the available cloud-free observations retained in the gathering period of N d a y s . The forward model operator, representing our physical understanding of the measurements, is the RTLSR semi-empirical model of Equation (4). This yields, for a given spectral band λ , to the forward model vector: R j , which is function of the angular configuration ( ϑ j ,   v j ,   φ j ) for the considered cloud-free observation, with j = 1, …, m. The inversion process in its linear form consists of minimizing the following cost function, using vector notation: J = ( y R ) T ( y R ) . A standard least square fit procedure was adopted, using a bounding box of [0, 1] for constraining the inversion of BRDF parameters to physically meaningful values. The retrieval is performed only when at least 5 clear observations are available within the gathering period.
The BRDF-normalized surface reflectances for a given band were estimated using Equation (4) with input the three retrieved parameters and considering a standard observation geometry, defined as nadir-viewing with sun zenith angle at 45°, and a relative azimuth angle of 0°, particularly:
R N o r m ( 45 ° ,   0 ° ,   0 ° ,   λ ) = f i s o f i t ( λ ) + f V o l f i t ( λ ) K V o l ( 45 ° ,   0 ° ,   0 ° ,   λ ) + f G e o f i t ( λ ) K G e o ( 45 ° ,   0 ° ,   0 ° ,   λ ) ,

3.3.3. Drift Estimation Procedure

The drifts are estimated with a linear fit of the considered surface reflectance temporal series for each land site and spectral band. In order to minimize the impact of residual atmospheric contamination, outliers were detected and removed from the temporal series, based on the 3-sigma rule; particularly, only values within 3 times the standard deviation of the ensemble of reflectances were retained in the fit. More specifically, each considered temporal series y i , with i = 1, …, n spanning the n number of retained reflectances, was fitted with a linear curve: Y = a + b X , with the vector of time X , having dimension n and expressed in days since launch. The estimated drift corresponds to the slope b of the fitted linear curve, expressed in unit of reflectance (or no unit for NDVI drift) divided by time in days. For the sake of simplicity in notation, the drifts are expressed within the paper in terms of unit of reflectance (or no unit for NDVI) divided by year.

4. Results

4.1. Analysis of Predicted SZA Drift

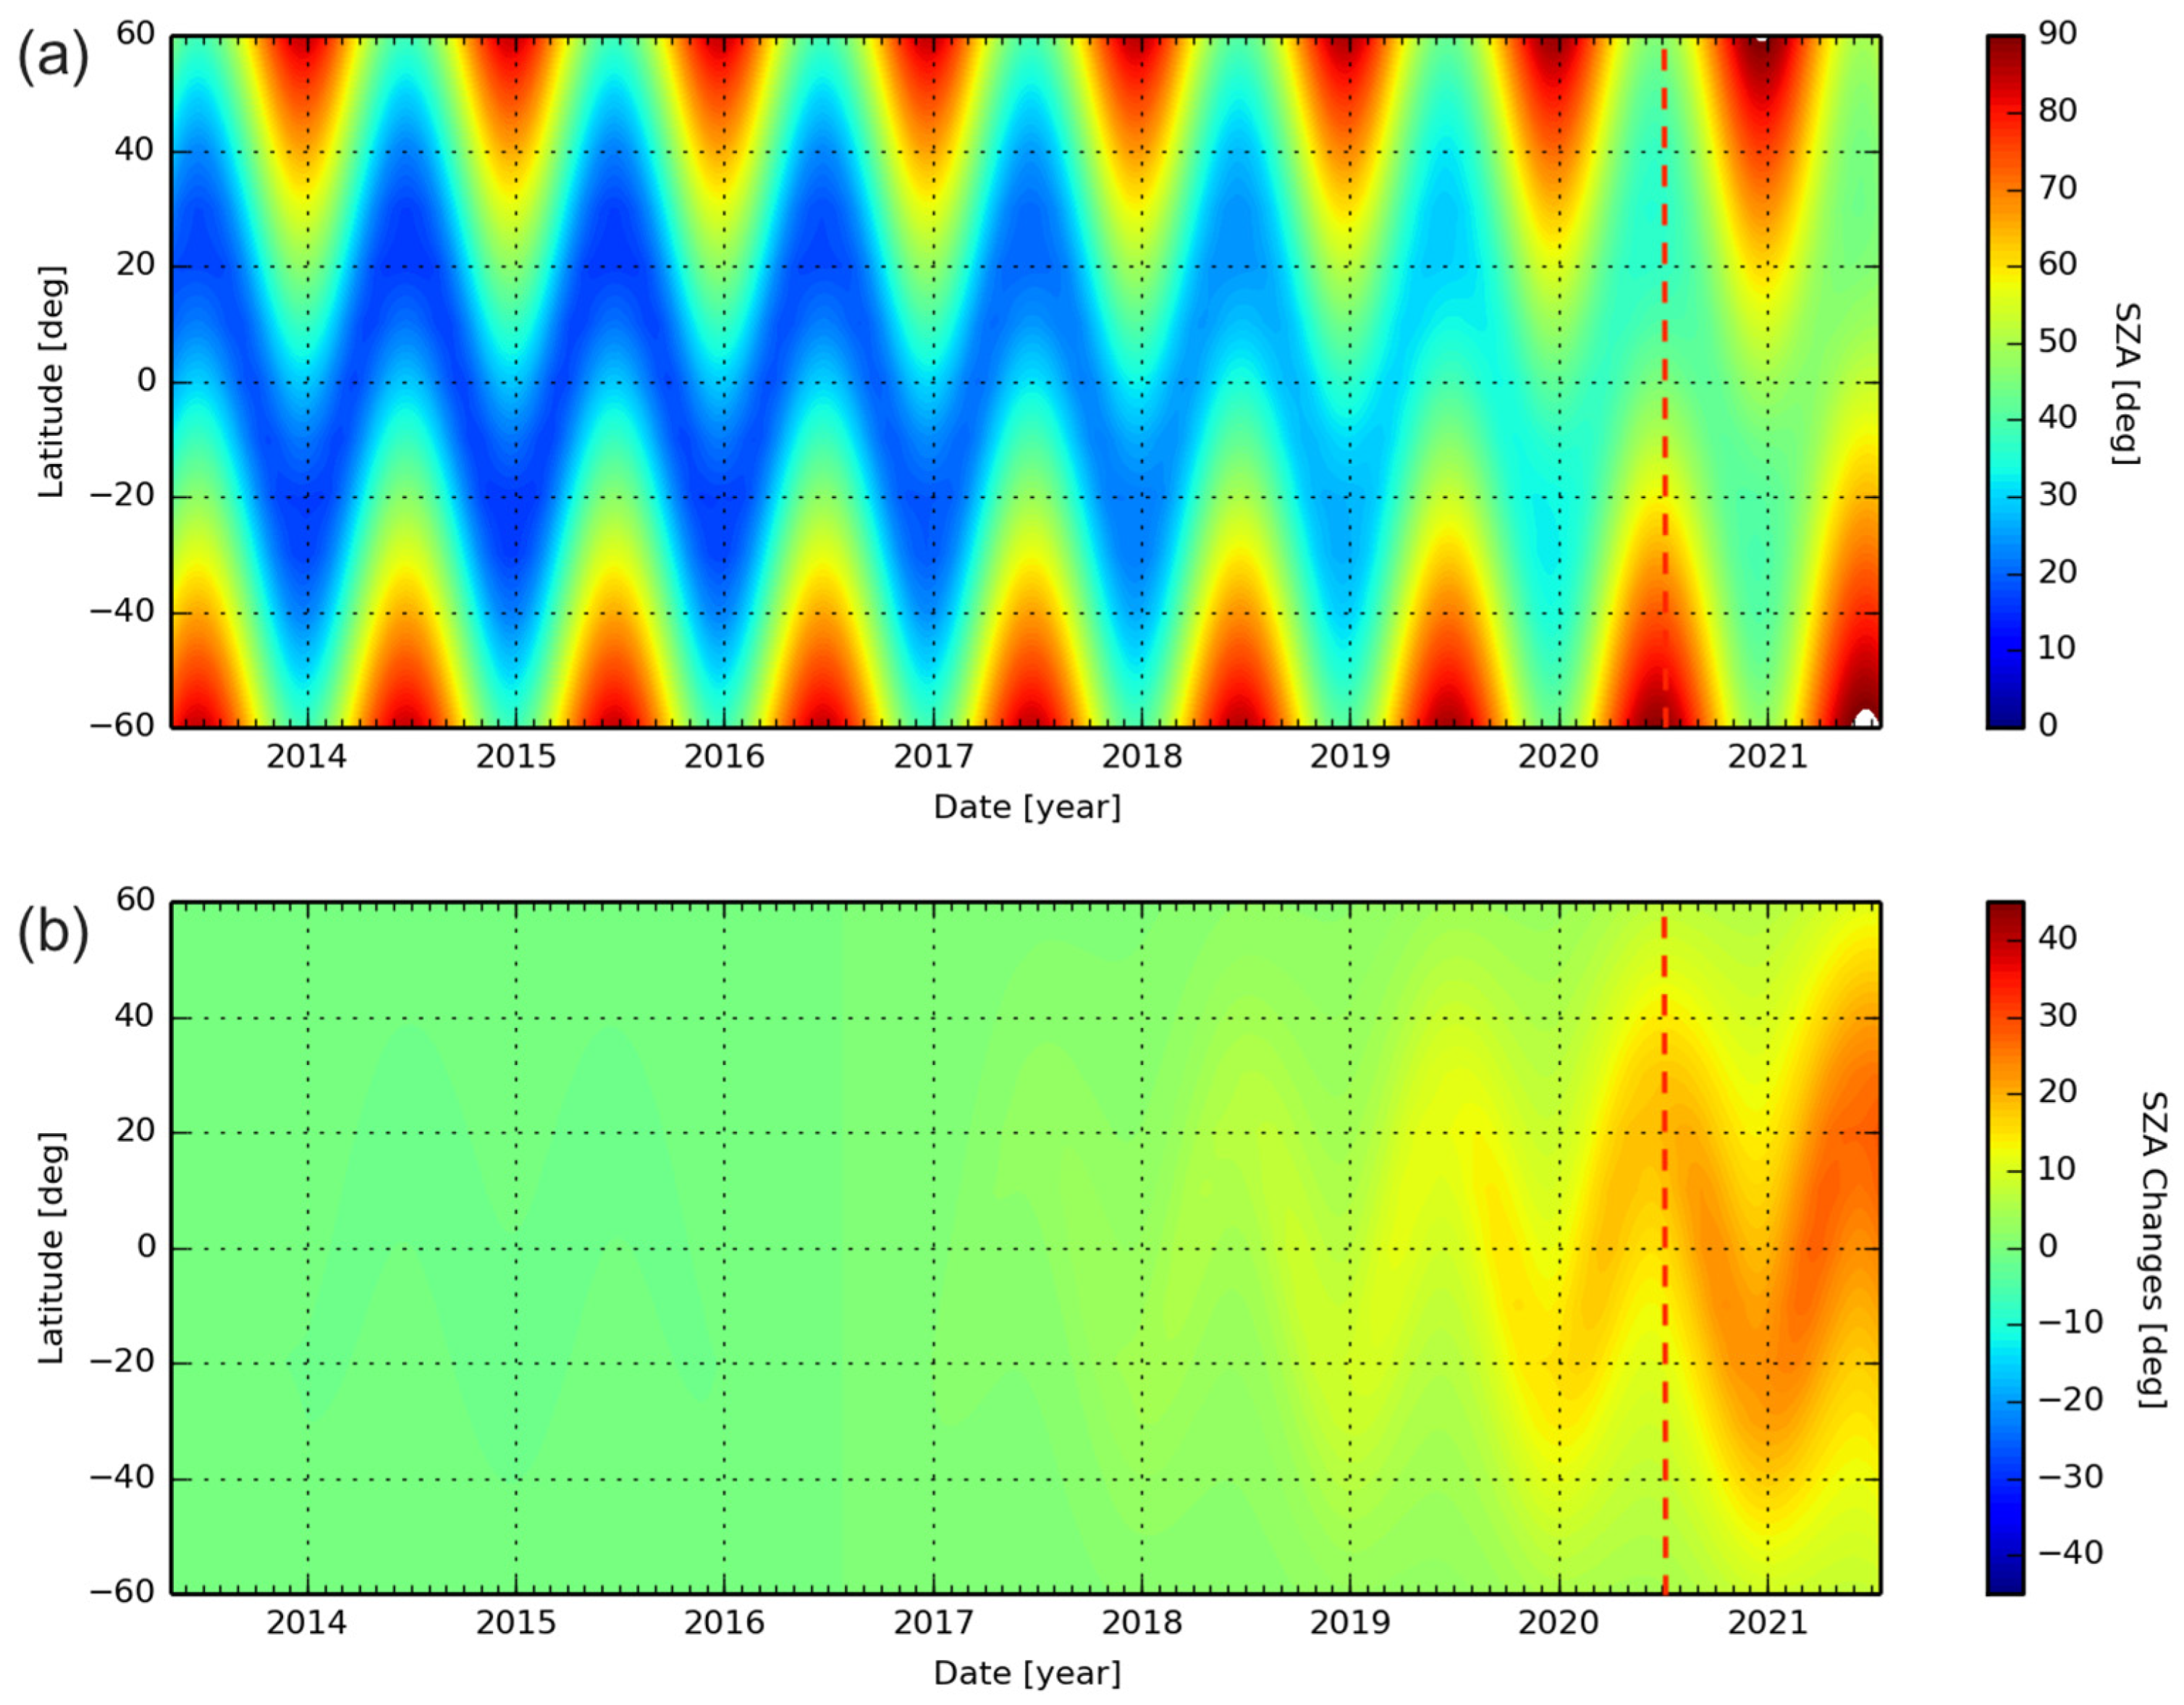
The predicted evolution of SZA was computed following Equation (1) and it is presented in Figure 4 as a function of date and latitude since start of Proba-V mission. In this figure, the absolute SZA changes with respect to a sun-synchronous orbit are also presented, where the overpass time of the stable orbit corresponds to the one reached after launch (10:45 a.m.). The SZA evolution shows periodic oscillations, following the seasonal cycle, super-imposed to a latitude-dependent positive drift induced by the orbital decay. The observed drift in SZA is higher around the tropical and sub-tropical regions during hemispherical summer time and lower at higher latitudes and for wintertime conditions. This behavior is expected and was verified also for AVHRR-NOAA drifting orbits [4]. The deviations from a stable sun-synchronous orbit start to exceed 10 degrees during 2018, as a result of the stronger decay of LTDN after the first 4 years of the mission. Illumination conditions continue to degrade during the last 2 years of operations, with predicted SZA increasing up to 20 degrees in July 2020, when Proba-V Operational Phase was terminated. The predicted changes of SZA throughout the mission were verified against real observations (see Supplementary Materials, Section S.1). Despite a slight over-estimation of the simulated orbital drift effect (up to 3° in SZA), the adopted empirical formula (Equation (1)) provides a sufficiently accurate prediction of the intra and inter-annual changes of illumination conditions along the mission lifetime.

4.2. Analysis of Simulated Changes in Synthetic Surface Reflectances

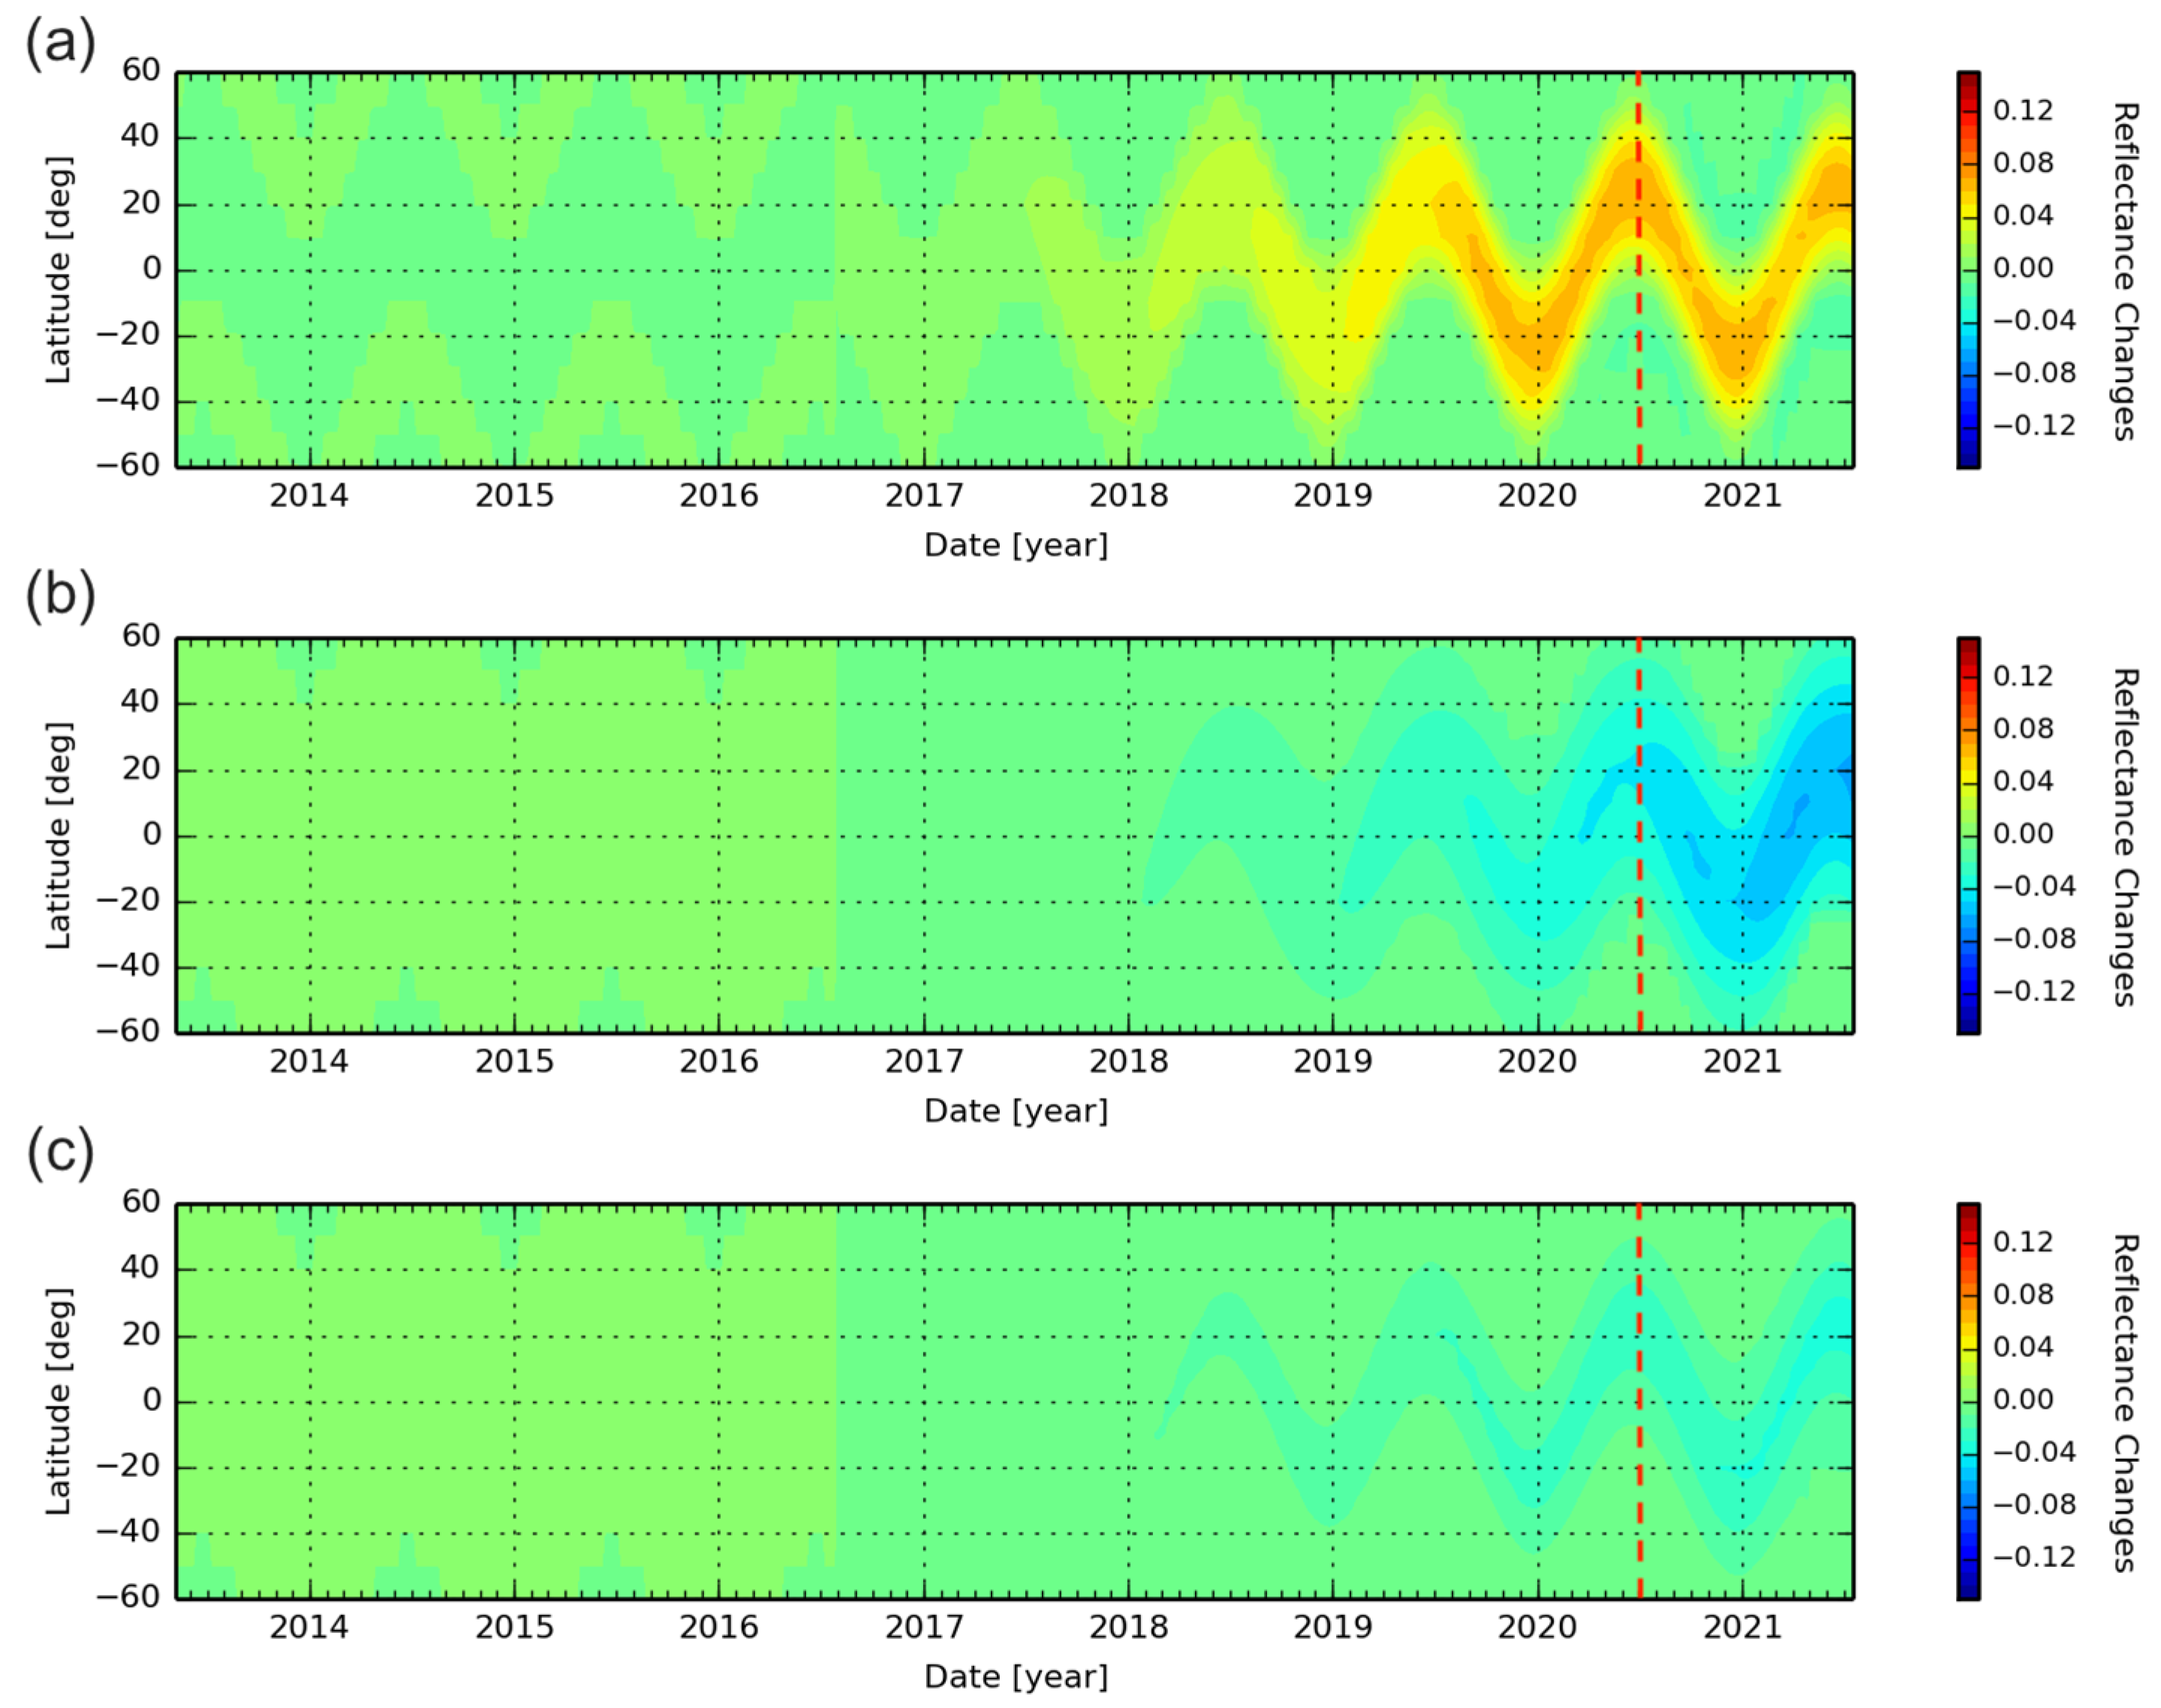
The simulated surface reflectances changes over the considered rainforest site are presented in Figure 5 for Proba-V equivalent NIR band as a function of date and latitude. The results for the other bands are provided in the Supplementary Materials, Section S.2. Three plots are presented in Figure 5, corresponding to the viewing directions at the center of each Proba-V camera (left, nadir and right), corresponding to VZA = −34°, 0° and 34°, respectively. The simulation was run over the principal plane to identify the maximum potential impact of the directional effects. Although Proba-V cross-track geometry does not sense the principal plane exactly, its measurement geometries are symmetrically distributed in the forward and backward scattering directions (see Figure 1). Specifically, the left camera senses in the westward direction (away from the sun), while the right camera points to the eastward direction (towards the sun).
The results of Figure 5 show that the evolution of synthetic surface reflectances follows SZA seasonal and inter-annual changes. A step-wise decrease is observed during mid-2016; this is the time when the LTDN starts to deviate from a steady orbit moving towards early morning overpasses (see Figure 2). Reflectance changes remain within a range of [−0.01, 0.01] until mid-2017, when larger deviations start to appear for all cameras. This is the time when LTDN reaches 10:30 a.m. and the rate of decay starts to grow. Overall, the reflectances absolute changes are stronger in the latitude range [−40°, 40°] during hemispherical summertime conditions, in correspondence to the larger SZA variations (see Figure 4).
The impact of the orbital drift is not homogeneous along the across-track swath, but it strongly depends on the considered camera, with distinct and opposite temporal patterns in the left camera as compared to the nadir and right cameras. In the left camera and over tropical and sub-tropical regions, the simulated reflectances are predicted to increase during summertime by up to 0.08 in reflectance units at the end of the simulation period. Conversely, in the nadir and left camera, the reflectances are predicted to drift progressively towards lower values. Similar temporal patterns are observed in the SWIR and visible bands, although in the Blue and Red bands the magnitude of the changes is one order of magnitude lower than infrared bands, owing to the lower surface reflectance at these wavelengths.
The observed dependence on the camera is related to the changes in the sun viewing azimuthal geometry induced by the orbital decay. This dependence is better explained in the polar plots in Figure 6, showing the BRDF angular distribution for different SZA with superimposed VZA of the three cameras. As the SZA increases, the BRDF angular distribution becomes strongly asymmetric, with enhancement of the retro-reflectance peak (hot-spot) in the backscattering direction, while reflectances decrease in the opposite, forward scattering direction. The different cameras are sensing different portions of the BRDF, meaning that their response to the orbital drift is different. In the left camera, there is a prevalence of observations lying close to the hot-spot; this yields to an increase in reflectances at increases in SZA. The opposite occurs in the nadir and right cameras, causing the reflectances to progressively decrease when SZA increases.

4.3. Analysis of Estimated Drifts in TOC Products

4.3.1. Analysis of Temporal Series over Four Representative Sites

The analysis of temporal series over four sample BELMANIP-2 sites is presented in Figure 7, Figure 8, Figure 9 and Figure 10. This initial set of sites allows evaluating the orbital drift impact over four representative land cover classes, forest, cropland, shrubland and bare soils, in a range of latitudes [−40°, 40°], where larger reflectances variations were predicted in the simulation study. Results are reported only for the NIR band for the sake of conciseness; similar temporal patterns are also observed for the other bands and NDVI (see Supplementary Materials, Section S.3).
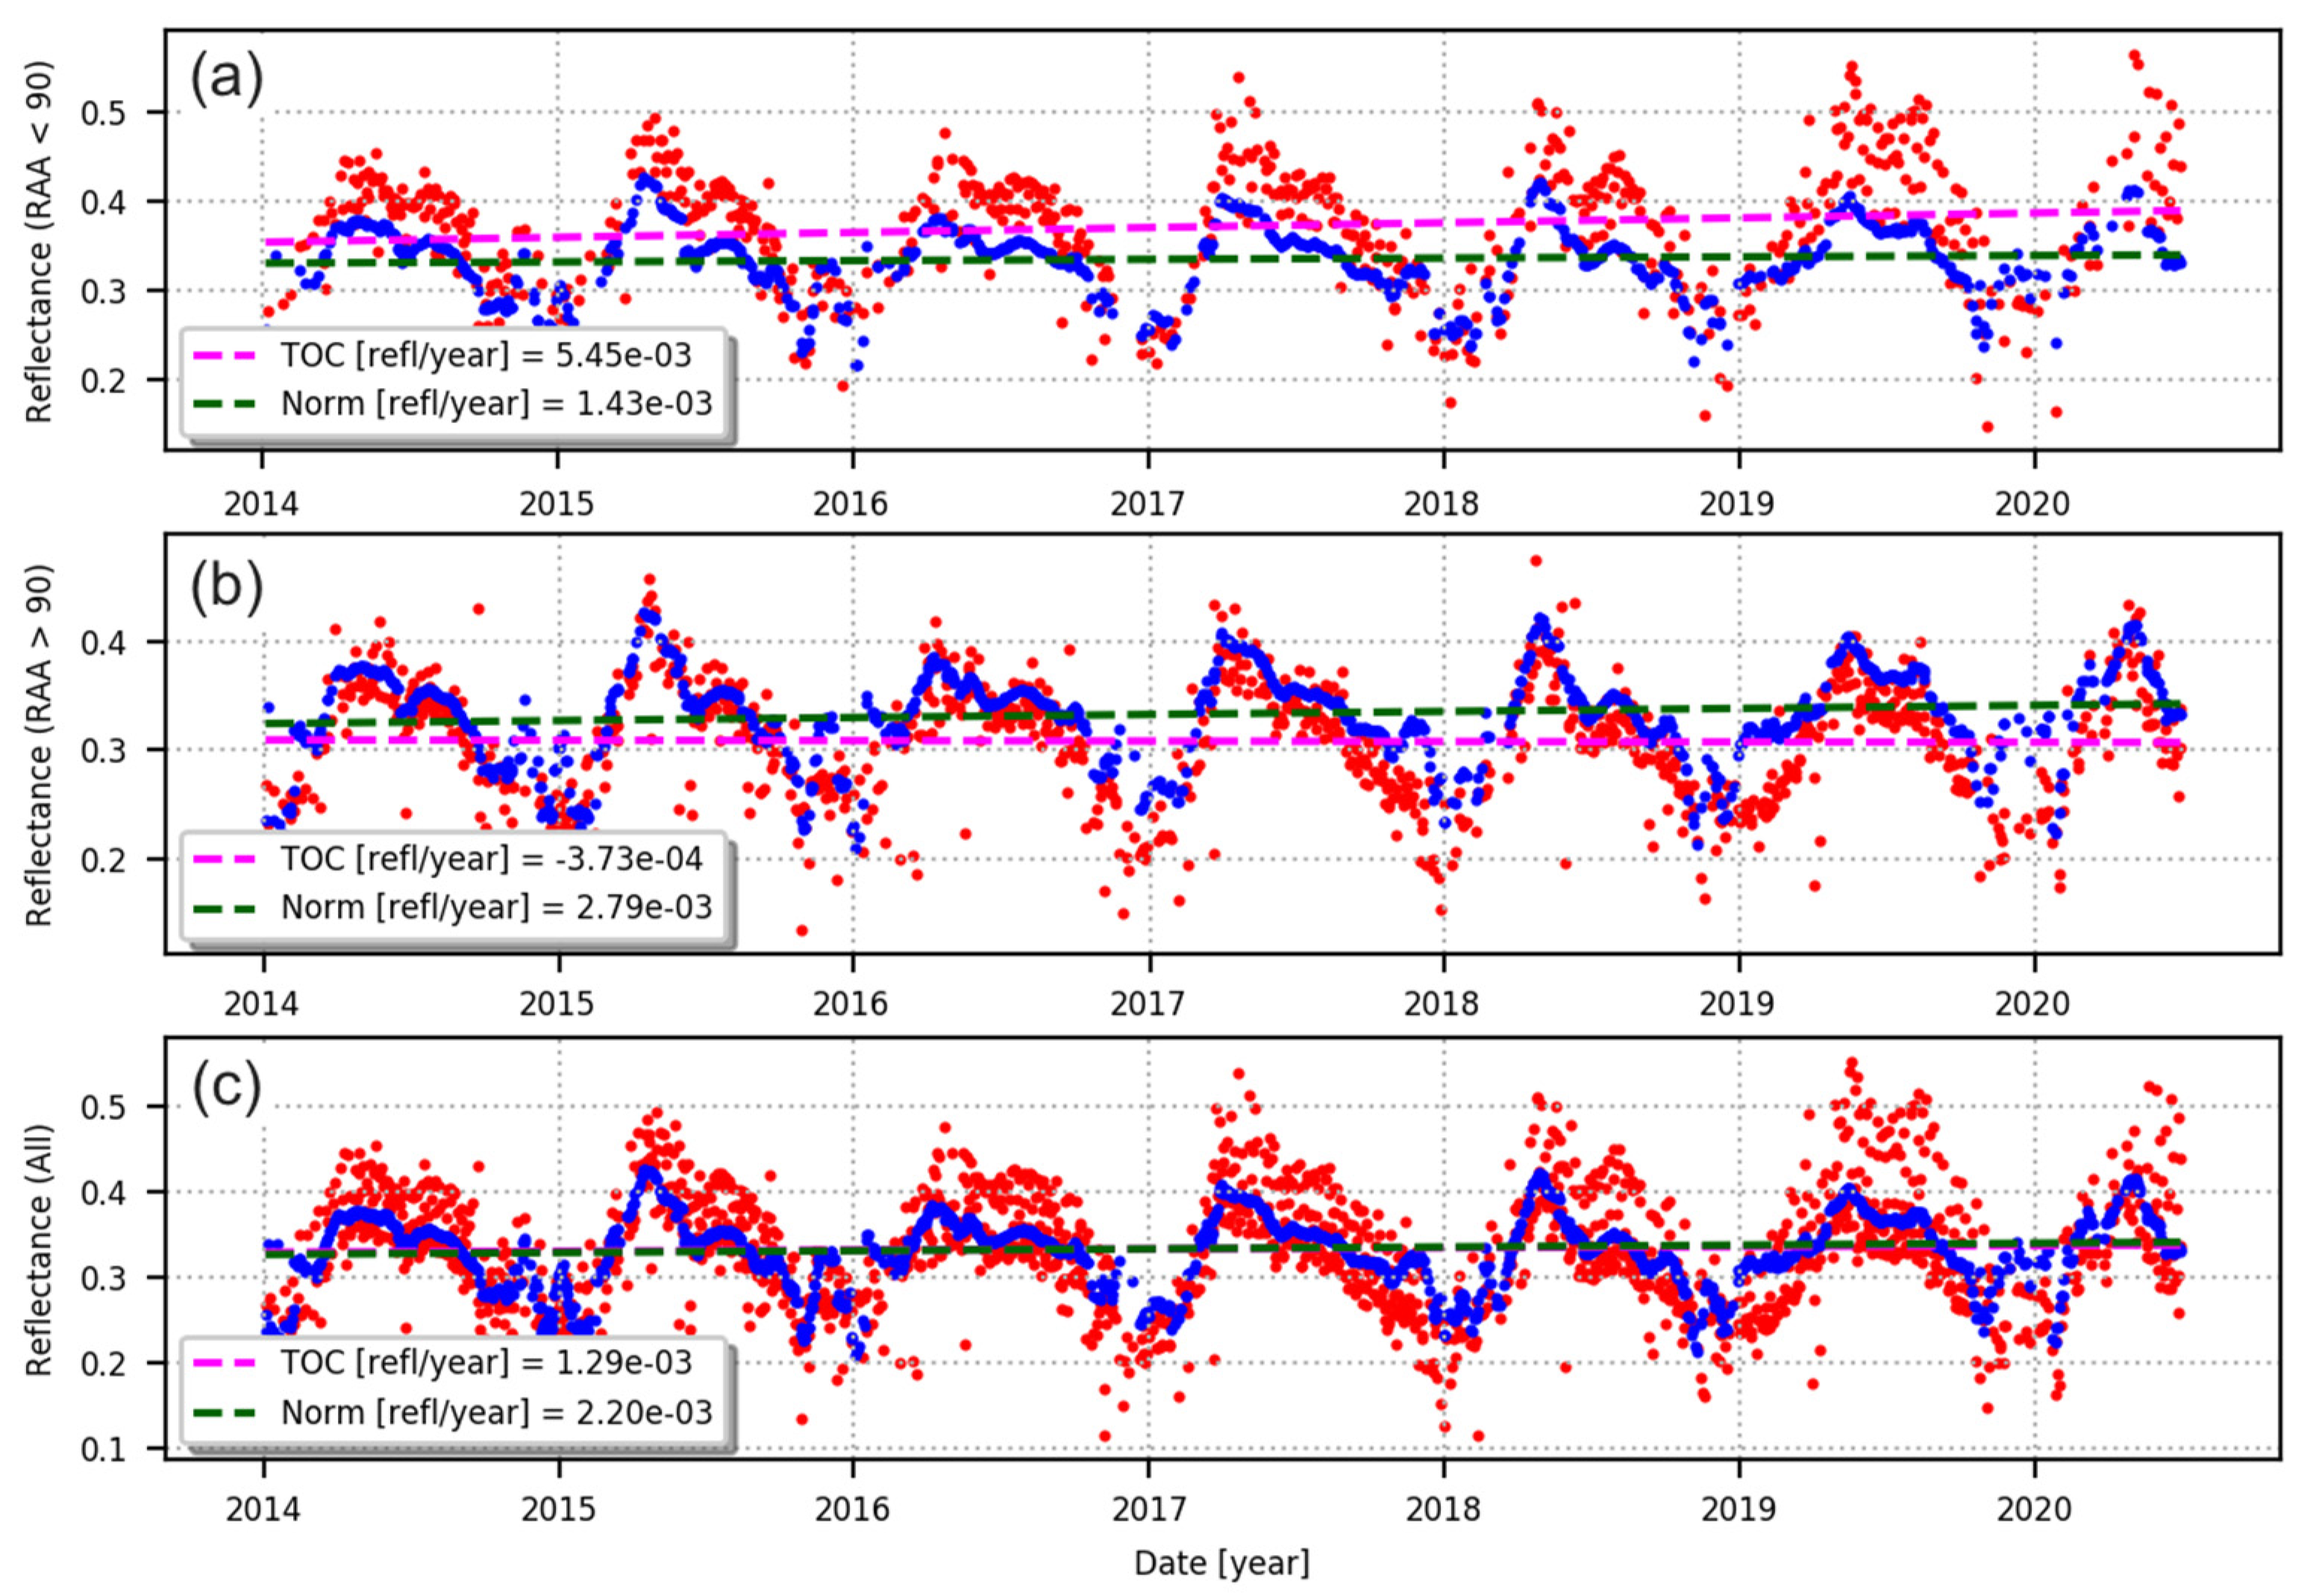
The results for a rainforest site in a tropical region (lat/lon = −9.75°/−60.33°) are shown in Figure 7. The temporal series of TOC reflectances in the three angular conditions show periodic fluctuations, driven by the SZA seasonal variations, with super-imposed clear long-term drifts. More specifically, in the backscattering direction (RAA < 90°), there is an increase in TOC NIR reflectances, which is more pronounced during the summer periods, with an estimated positive drift of 0.0039 reflectance/year. Contrarily, in the opposite, forward scattering direction (RAA > 90°), we observe a decrease in TOC NIR reflectances, with an estimated drift of −0.0025 reflectances/year. This initial finding confirms the results of the simulation study for the same land cover class. When the temporal series of “all” observations is considered (Figure 7c), the opposite trends in the forward and backward scattering directions largely cancel out, with remaining small residual drift (−0.00048 reflectance/year). The analysis of BRDF-normalized reflectances shows, as expected, a drastic reduction in the day-to-day and seasonal fluctuations, owing to the removal of directional effects in the temporal series, while retaining the annual phenological cycle over this site. More importantly, after BRDF normalization, the estimated drifts appear consistent for the three angular configurations, showing the same sign and comparable magnitudes.
The temporal series over a cropland site, Barrax in Spain (lat/lon = 39.06°/−2.07°), is presented in Figure 8. The evolution of TOC NIR reflectances is more complex over this agricultural site, showing sharp increases during the growing seasons and a slow decrease moving towards the wintertime. Despite the more complex intra-annual changes, the analysis of estimated drifts shows similar patterns as observed for the rainforest site. Notably, in the backscattering direction we observe an increase in TOC NIR reflectances throughout the mission, mostly driven by the maxima at the end of the growing seasons, while a decrease is observed in the forward scattering direction. The linear fit indicates a spurious positive drift (0.0055 reflectance/year) for RAA < 90°, while a negative one is observed for RAA > 90° (−0.00037). When observations for all angular conditions are merged, the drift observed in the two scattering directions is strongly reduced, owing to compensation effects (0.0013 reflectance/year). The BRDF normalization procedure allows reducing the day-to-day and seasonal variations, while maintaining the phenological cycle at the site. Furthermore, the estimated drifts in the different angular conditions show consistent values in terms of both sign and magnitude, as already pointed out over the forest site. For this agricultural site, the adopted BRDF procedure proves robust in resolving the short-term variations in directional reflectances and the azimuthal asymmetry in the drifts, despite the limitations of the adopted assumptions, in particular the use of a 20-day gathering period.
The temporal series of NIR reflectances over a dry shrubland site, located in the north of Mexico (lat/lon = 27.57°/−103.61°) (see Figure 9) confirms the previously observed asymmetry in the estimated drift for backward and forward scattering conditions. The spurious positive drift in the backscattering is particularly evident over this site, with maxima of NIR reflectances increasing by up to 15% in mid-2020 as compared to the values at the beginning of the mission. In the opposite direction, the decrease is also evident. When all observations are merged, the opposite drifts in the two angular conditions—0.0042 and −0.0018 reflectance/year, respectively—largely cancel out, with a resulting drift of 0.000049 reflectance/year. The BRDF normalization procedure dramatically reduces the day-to-day and seasonal changes and resolves the azimuthal asymmetry of the estimated drifts, since the drifts in the three angular conditions have now the same sign and comparable values. The BRDF normalization is particularly efficient over this temporally stable dry shrubland site, since the fluctuations in NIR reflectances induced by SZA seasonal and inter-annual changes are largely smoothed out. Yet, some localized anomalies are observed in the BRDF-normalized time series, such as a minimum during winter 2015 and a maximum during summer 2017. These localized anomalies do not impact the drift estimation, as confirmed by the plotted fitted line, following the slowly varying temporal changes of reflectances along the mission lifetime.
Finally, an example of temporal series for a bare soil class is shown in Figure 10, corresponding to a bright desert site in Egypt (lat/lon = 27.87°/28.87°). This site was chosen to investigate the effect of the drift for a spatially and temporally invariant site. The evolution of TOC NIR reflectances clearly shows, as expected, the absence of any seasonal or phenological changes. Yet, obvious drifts can be observed in the two scattering directions. The compensation effect is very clear over this site, since the estimated drifts in the backward and forward scattering directions—0.0039 and −0.0014, respectively—reduce to 0.0000013 reflectance/year, when observations from all angles are merged. As observed for the other vegetated sites, the BRDF normalization allows removing completely the azimuthal asymmetry in the estimated drifts; in fact, the drifts in the different angular conditions now have the same sign and comparable magnitude. The BRDF normalization performs extremely well over this site by strongly reducing the scattering of the data, although some unexpected variations are observed during the winter periods for all spectral bands, particularly in 2019. However, as discussed for the shrubland site, these localized anomalies do not appear to impact the estimation of the drift over the considered seven-year time frame.

4.3.2. Geographical Distribution of Azimuthal Asymmetry

In order to verify the results obtained over the four sample sites, the analysis is here extended at a global scale over the full set of 420 BELMANIP-2 sites. The first step consists of a qualitative assessment of the geographical distribution of the estimated drifts. The rationale is to investigate potential latitudinal or regional patterns.
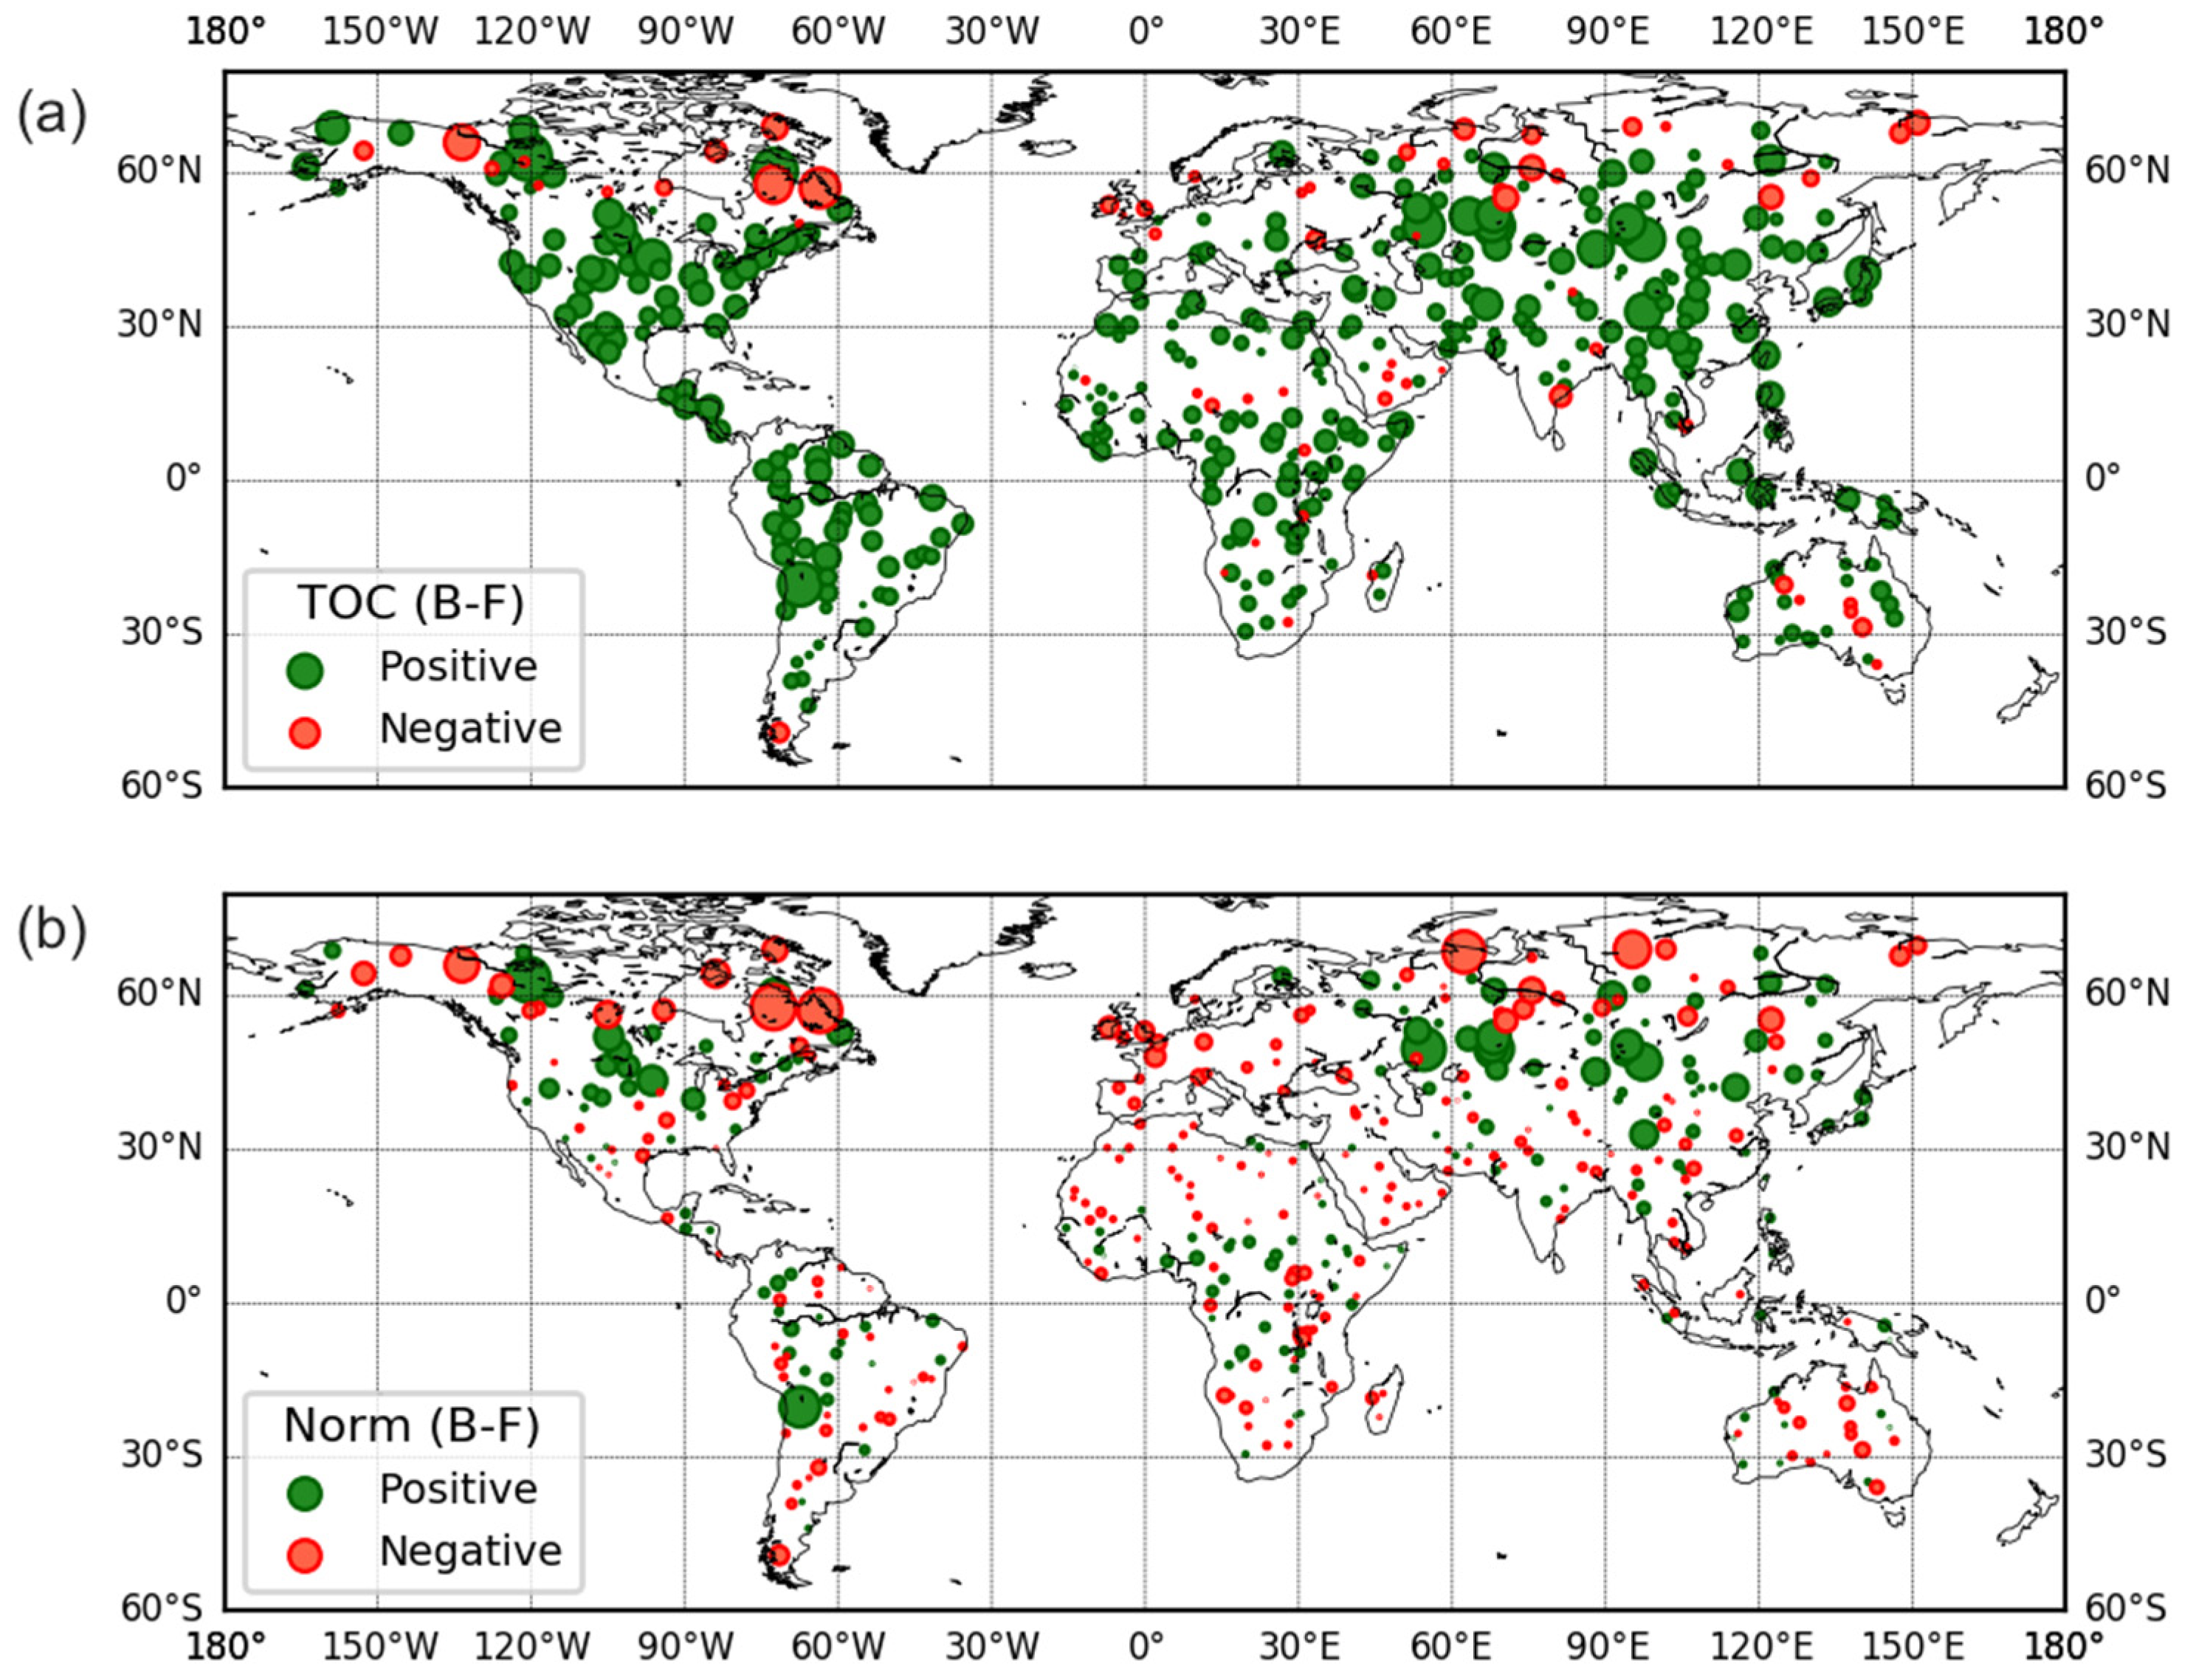
The geographical distribution of the azimuthal asymmetry in the estimated drifts for backward and forward scattering directions and for TOC and BRDF-normalized NIR reflectances is presented in Figure 11 over all BELMANIP-2 sites. The azimuthal asymmetry is presented in the maps in terms of difference between the drifts estimated in the backward and forward scattering directions ( d r i f t d i f f = d r i f t b a c k w a r d d r i f t f o r w a r d ), respectively. The sign of this difference is visualized in the map with colors (green for positive and red for negative), while the size of the points is proportional to the magnitude of the absolute difference.
Several considerations can be inferred from the maps. Firstly, when considering the TOC data, the azimuthal asymmetry in the estimated drifts, observed over the four sample sites, is now confirmed at global scale; particularly, the drift difference is positive for most of the analyzed sites. The magnitude of the difference is generally larger over vegetated sites, notably over tropical forests in South America, Africa and Asia, as well as over cropland, shrubland and grassland sites in North America and Asia. There is no evidence of a latitudinal or regional dependence of the d r i f t d i f f , although larger occurrence of negative values is observed for high latitude in the Northern Hemisphere. When comparing the spatial distribution of the d r i f t d i f f for TOC and BRDF-normalized reflectances, we can clearly see that the BRDF normalization allows for smoothing out the asymmetry in the two angular conditions. The magnitude of the drift differences for BRDF-normalised data is in fact strongly reduced for most of the sites, except a single outlier in the Southern Hemisphere, meaning that the drifts estimated in the two scattering conditions are generally consistent after the BRDF normalization. On the other hand, this smoothing is not globally uniform, since large differences, both positive and negative, remain at high latitude in the Northern Hemisphere. This behavior seems to point to a flaw in the BRDF-procedure over this latitude region, which can be reliably explained by residual impact of undetected clouds. It is in fact known that the cloud detection algorithm, used to generate the input Proba-V TOC products Collection 1, suffers a systematic issue for latitude above 50° North [36], resulting in high amounts of undetected clouds. This issue can clearly impact the normalization procedure, notably for high latitude regions and during wintertime, when the combination of persistent cloudy conditions and the presence of remaining undetected clouds can lead to scarce and unreliable input data, with resulting noisy BRDF retrieved parameters [37].

4.3.3. Statistical Analysis of Azimuthal Asymmetry

The statistical distribution of the azimuthal asymmetry is here analyzed over the BELMANIP-2 sites. The sites above 50° are not included in the analysis to limit the impact of undetected clouds. The statistics are aggregated per land cover classes: Crop, Tree, Shrubland, Grassland, Sparse, Bare. The statistical population within each class after the latitudinal filtering is: cropland (34), forest (96), shrubland (47), grassland (34), sparse vegetation (22), bare soils (65).
The aggregation works as follows. For each land cover class, the estimated drifts over all sites belonging to the class are considered as part of the statistical population; the median and the inter-quartile range (IQR) of this ensemble of data is hence computed. These statistical metrics may be impacted by the number population within each class as well as the natural variability of surface and atmospheric conditions over the considered sites. In particular, for grassland and sparse vegetation classes, the lower number of sites could potentially lead to less robust statistics as compared to the other classes.
The statistical analysis for TOC and BRDF-normalized reflectances is presented in Figure 12 and Figure 13. The results of Figure 12 provide a comprehensive verification at a global scale of the azimuthal asymmetry observed over the four sample sites. In particular, estimated drifts in TOC products are higher and generally positive in the backward scattering direction, and lower and mostly negative in the opposite direction. This general behavior is particularly evident for NIR and SWIR bands, as predicted in the simulation study. The Blue and Red bands (Figure 12, panels (a) and (b)) show comparable patterns, although the drift difference ( d r i f t d i f f = d r i f t b a c k w a r d d r i f t f o r w a r d ) is significantly lower than the infrared bands; this is due to the lower dynamic range of surface reflectance in the visible range. In the infrared bands, the asymmetry is typically higher over cropland, forest and shrubland sites. Larger variability in the estimated drift is observed for sparse vegetation and grassland sites, which can be related to the less representative statistical population within these classes. The drift difference is lower, but still clearly observed, over bare soils for all spectral bands, particularly in the infrared bands.
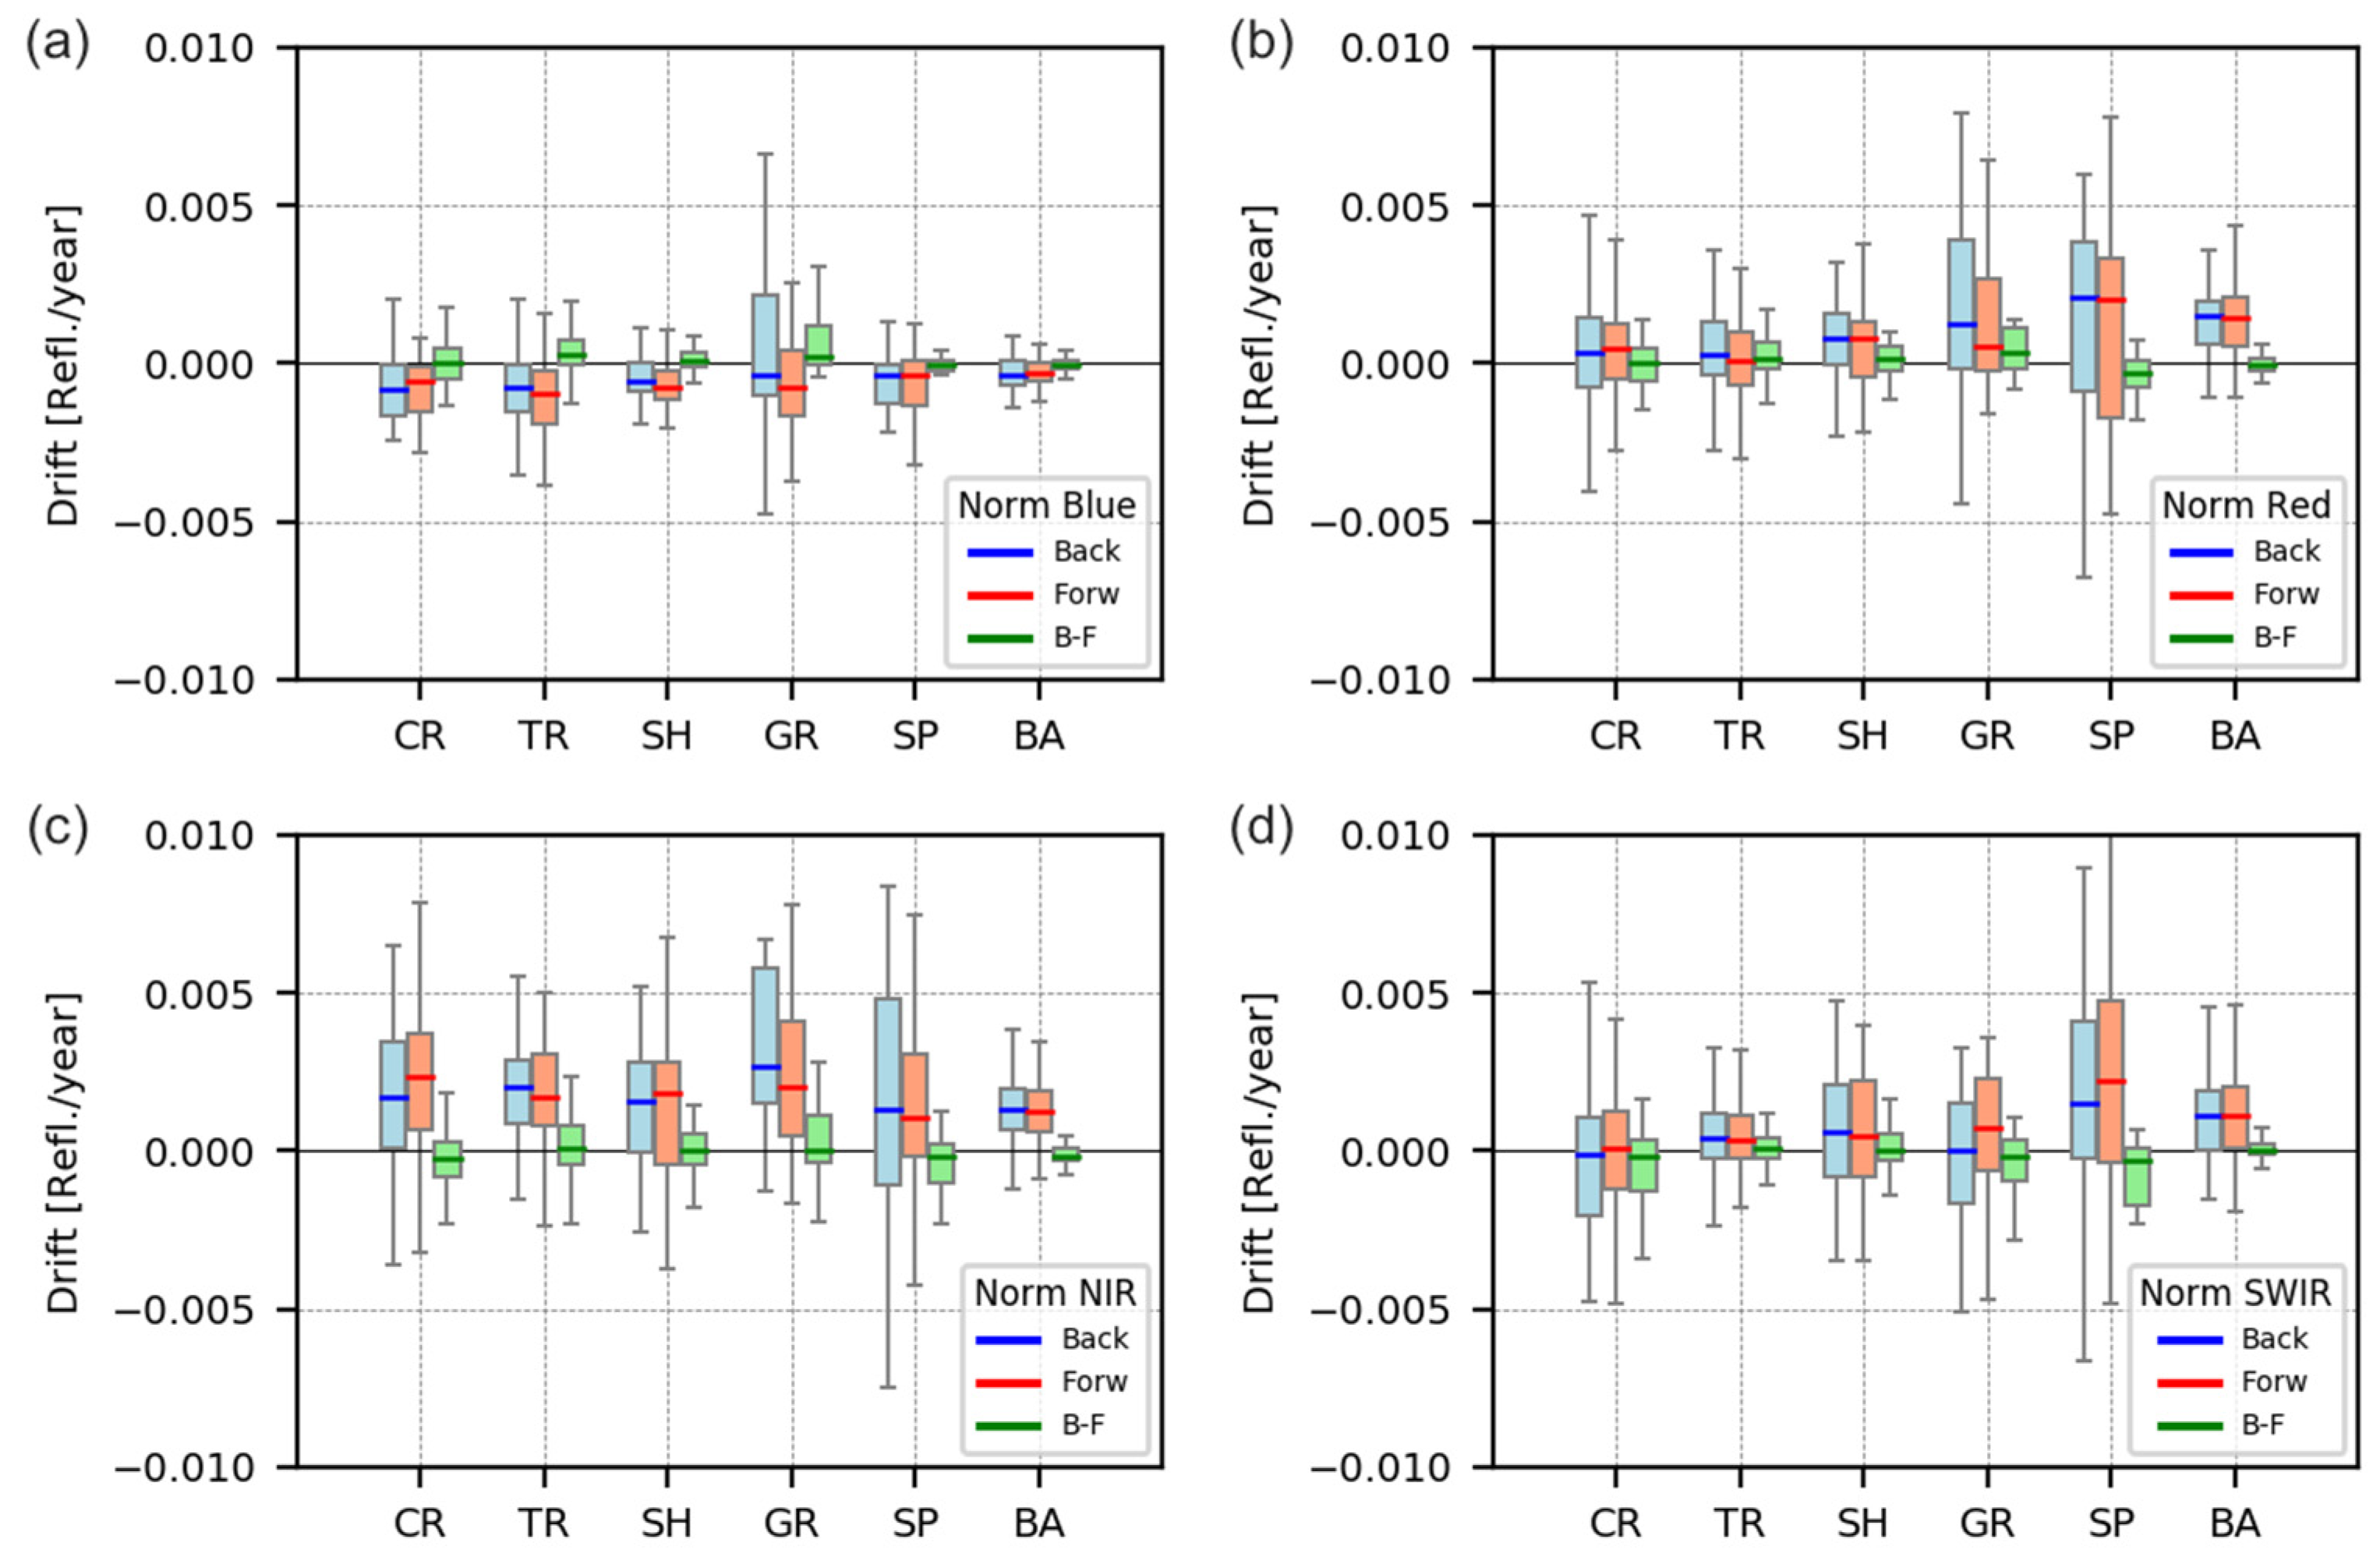
The statistical analysis for BRDF-normalized data (Figure 13) clearly demonstrates that the azimuthal asymmetry in the TOC drifts is dramatically reduced after BRDF normalization, as already observed over the four sample sites. Specifically, the statistical distribution of the drift difference ( d r i f t d i f f ) is much narrower than the original TOC data and the median is centered around the zero value for all spectral bands and land cover classes. This reduction is particularly evident for the NIR and SWIR bands, where the drift difference decreases by more than one order of magnitude.
The same analysis was also conducted for the temporal series of TOC NDVI. The results (see Supplementary Materials, Section S.4) show that the evident azimuthal asymmetry verified in the Red and NIR bands are largely smoothed out in the NDVI ratio. The statistical distribution of the estimated NDVI drifts in the two angular conditions is broad with no obvious bias. The BRDF normalization procedure only slightly impacts the statistical distribution of the TOC NDVI estimated drifts in the two scattering directions. This finding is consistent with similar investigations into MODIS-derived vegetation indices [10], showing that NDVI is more robust to changes in azimuthal configuration with respect to other indices, notably EVI.

4.3.4. Statistical Analysis of Estimated Drifts for Near-Nadir Observations

The same procedure used in the previous paragraph is repeated here, selecting only observations acquired under the viewing condition VZA < 10°. This condition results in selecting only measurements acquired from the Proba-V nadir camera.
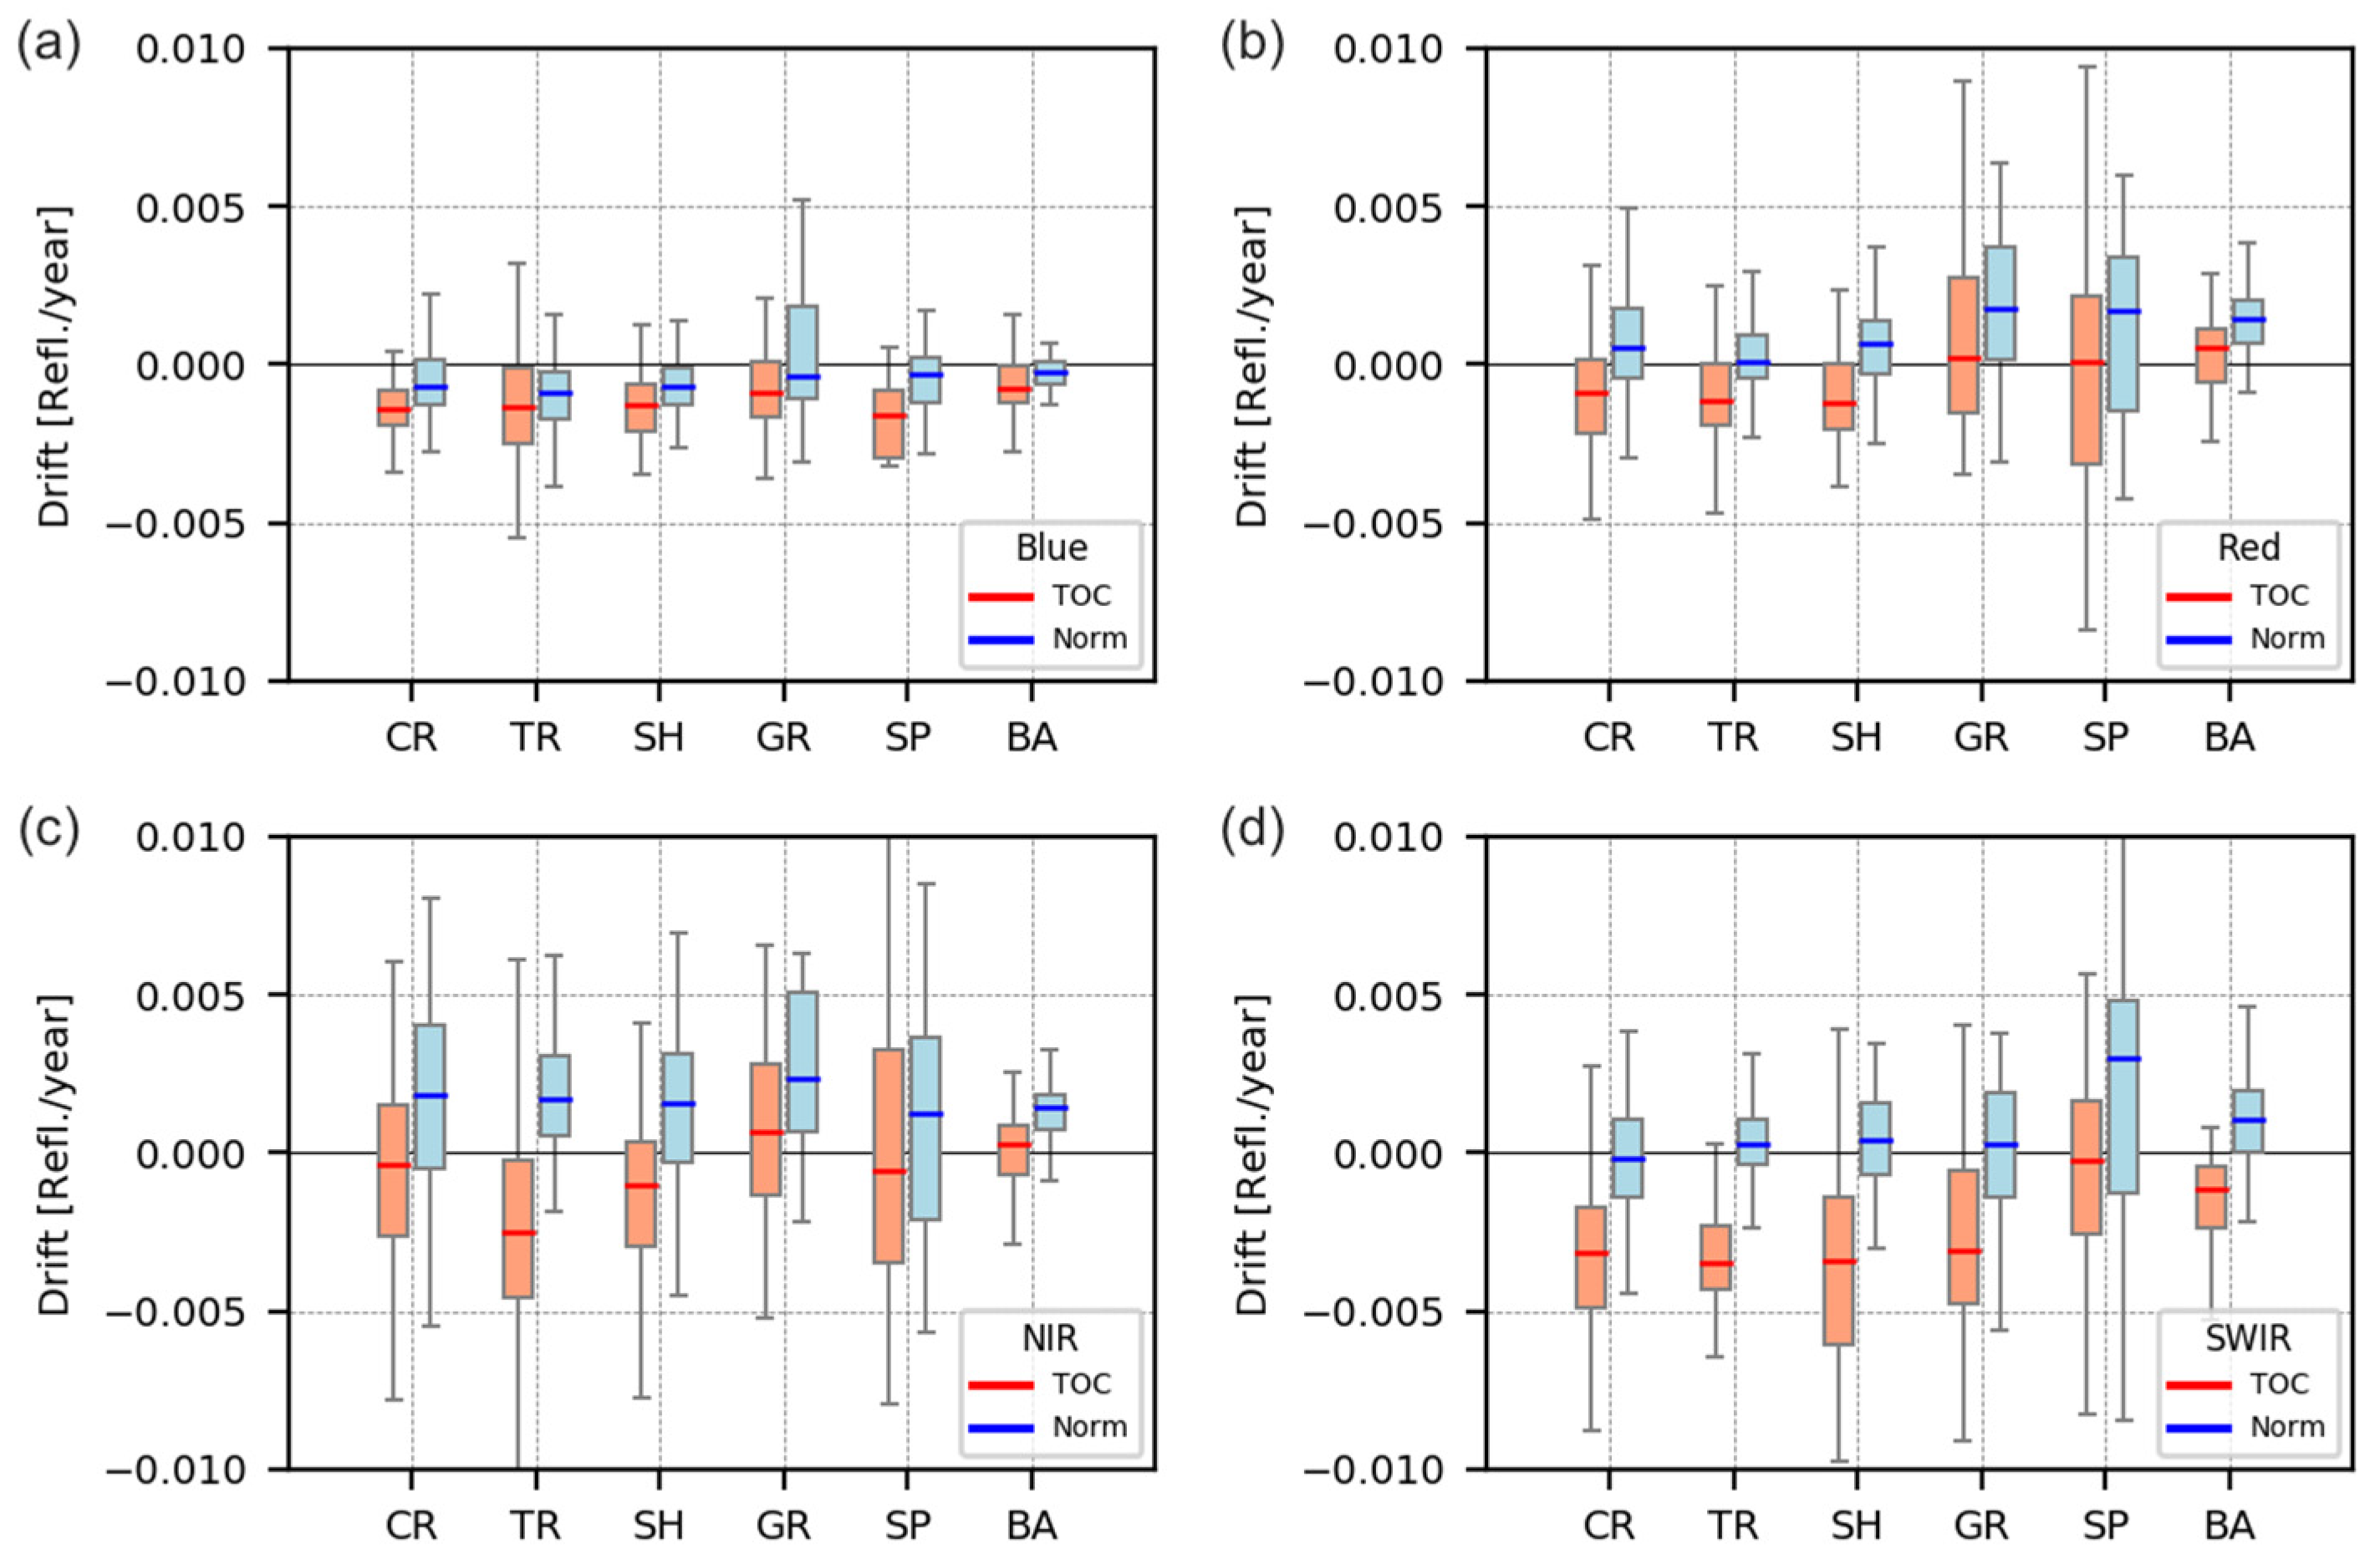
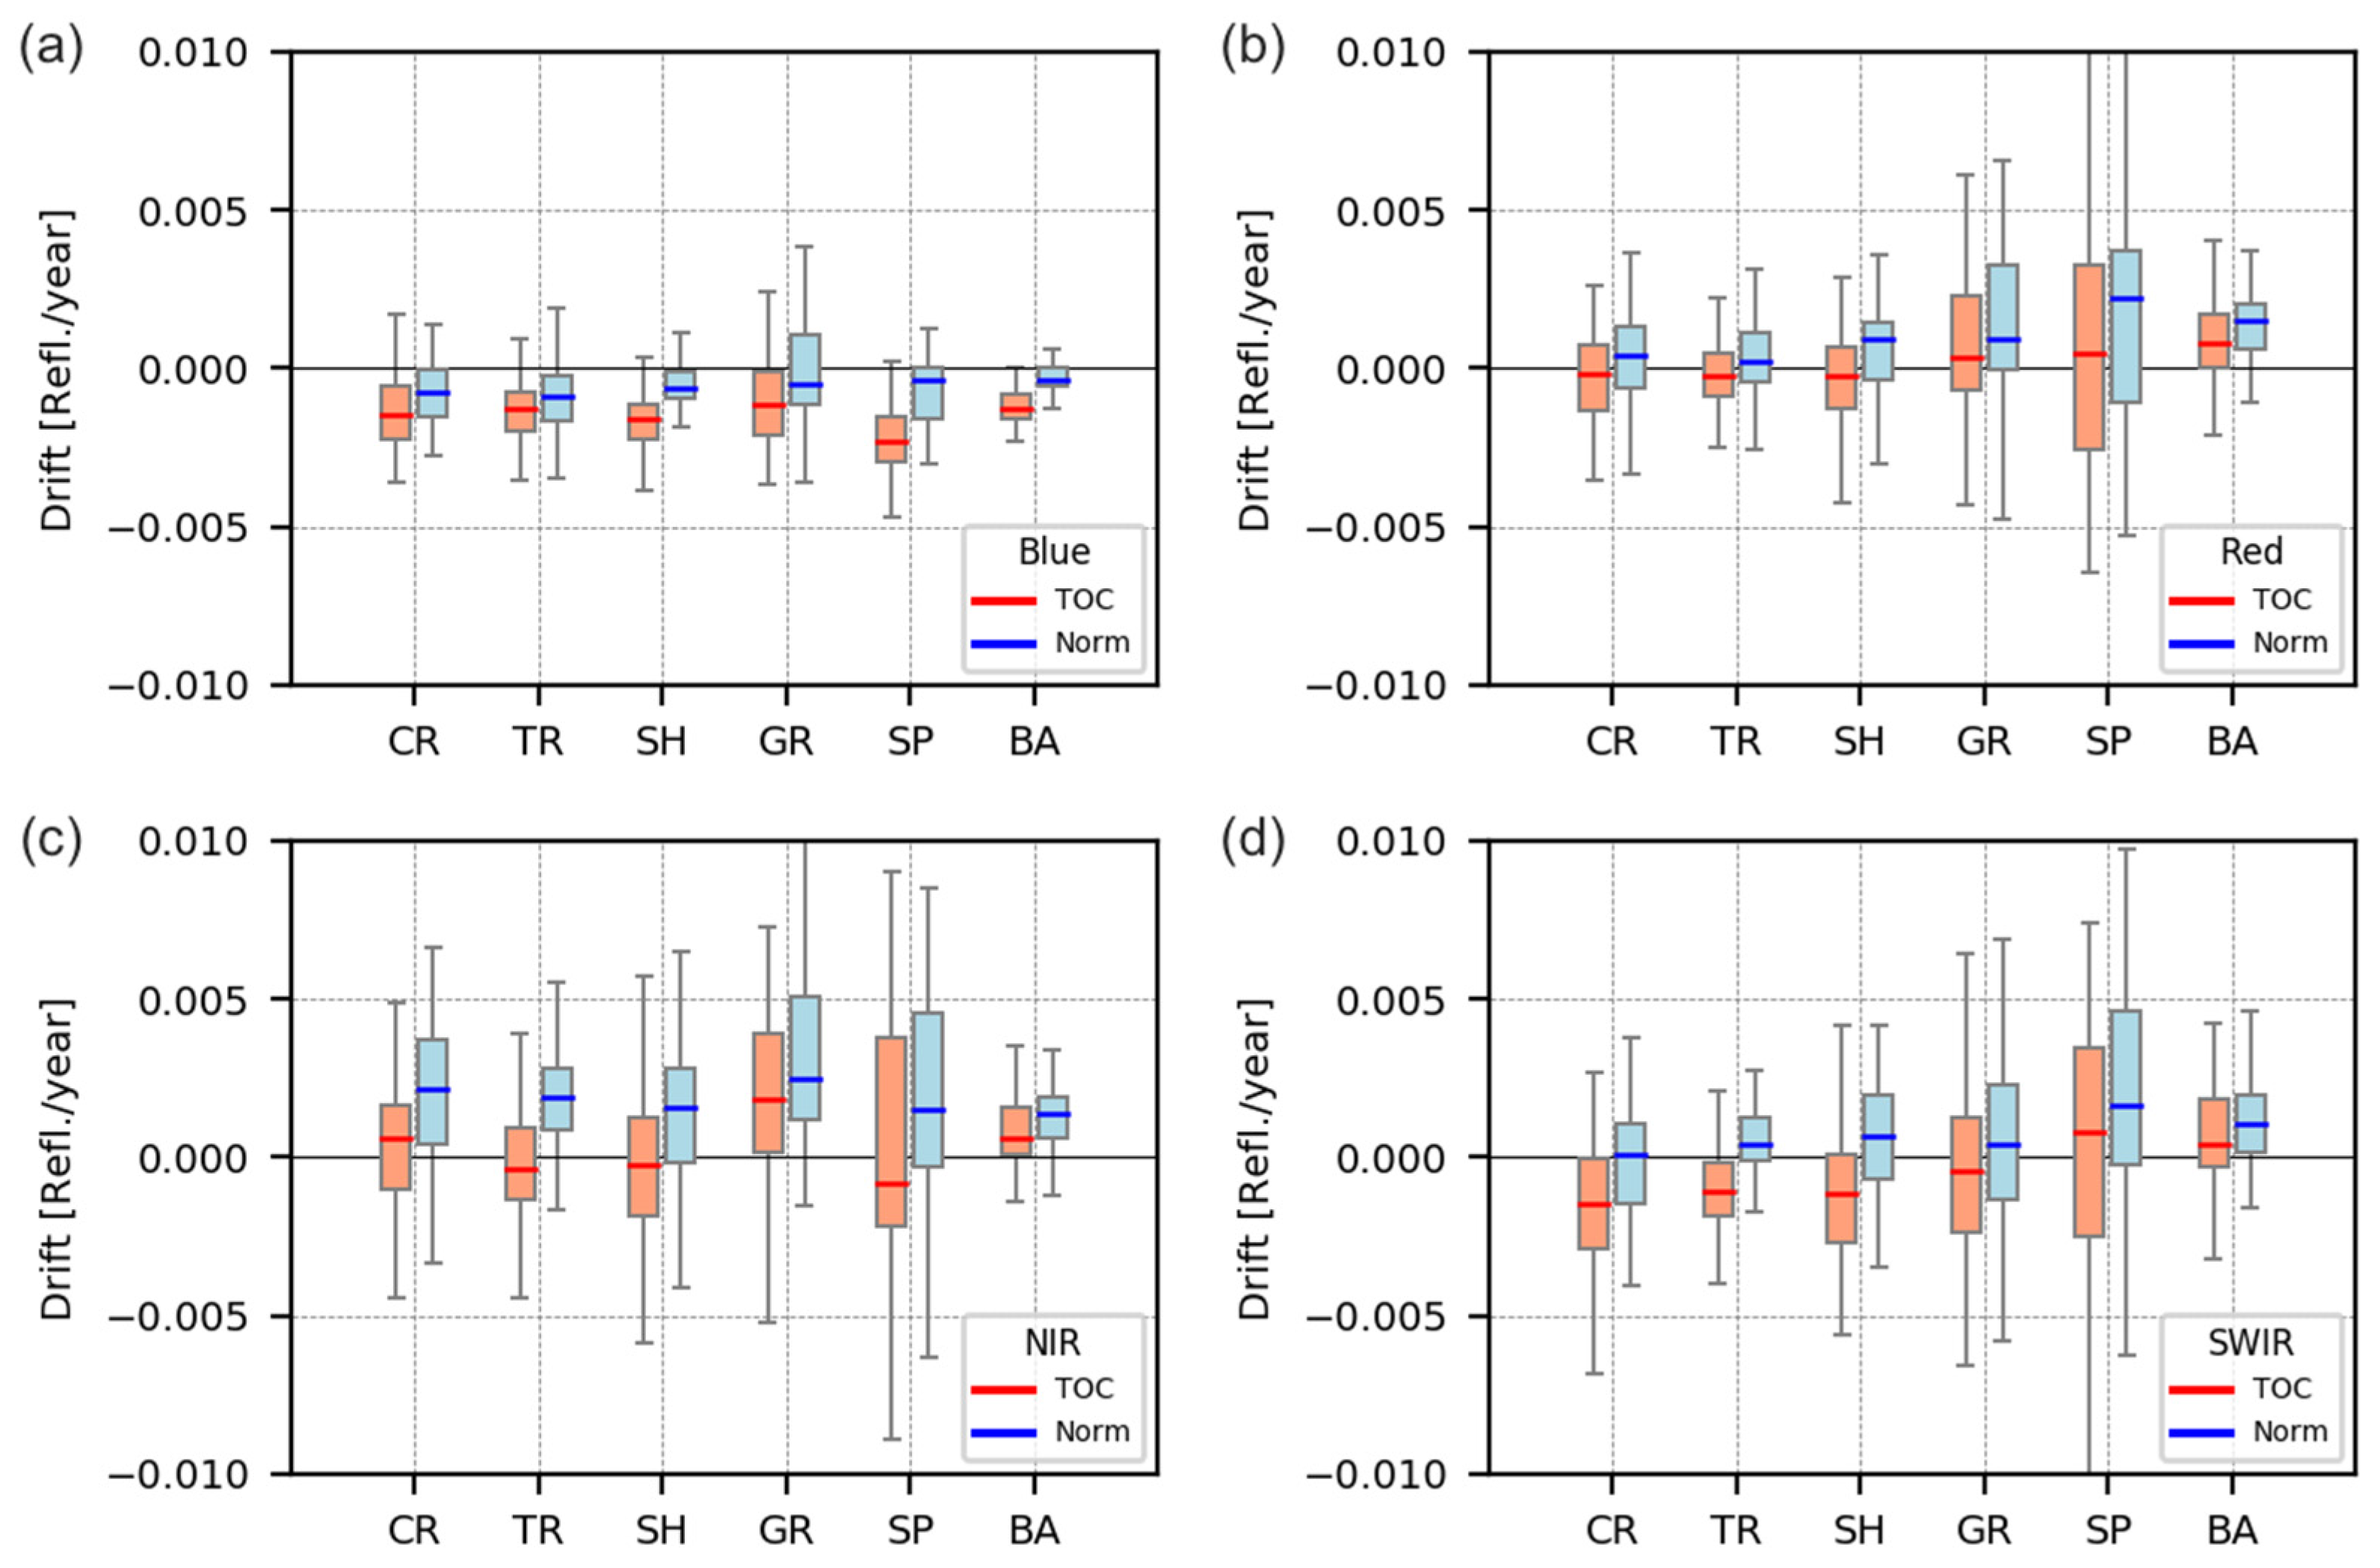
The statistical distribution of estimated drift for TOC and BRDF-normalized near-nadir reflectances are presented in Figure 14. We can observe that noticeable drifts appear in TOC products, showing, to a large extent, the presence of negative biases for all bands, in particular for the SWIR, and all land cover classes, with more pronounced effects over forest, cropland and shrubland sites. This result is quantitatively consistent with the predicted negative changes of surface reflectances for the nadir camera over a forest site (see Figure 5 and Supplementary S.2).
The biases observed in BRDF-normalized time series—see, in particular, a negative bias in the Blue and a positive one in the NIR band—can be ascribed to potential remaining real drifts in the measured reflectances, such as those caused by residual calibration drifts at Top-Of-Atmosphere (TOA) level. However, discussion on these temporal patterns is out of the scope of this paper, which is focused on quantifying the impact of the orbital decay under the assumption that the BRDF-normalized data provide the benchmark value, free of any spurious orbit-induced effect.

4.3.5. Statistical Analysis of Estimated Drifts for All Angular Conditions

The statistical distribution of estimated drift for TOC and BRDF-normalized reflectances when observations from all angles are merged is presented in Figure 15. This condition corresponds to the typical user case scenario, when all clear observations are retained for multi-temporal analysis. Overall, the dispersion of the estimated drifts lies around the 0 value for most of the spectral bands, in particular for the Red and NIR, and land cover classes, with some remaining negative biases in the Blue and SWIR bands. This is a confirmation, at global scale, of the results observed over the four sample sites for the NIR band (see Figure 7, Figure 8, Figure 9 and Figure 10). In particular, the opposite drifts, clearly identified in the two scattering directions, largely cancel out when observations from all angular conditions are merged and the differences between the drifts estimated for TOC and BRDF-normalized data are within their combined ranges of variability.

4.3.6. Statistical Analysis of NDVI Drifts

The same statistical analysis on the observed drifts was carried out for the temporal series of NDVI over the same ensemble of evaluation sites. The estimated drift for TOC and BRDF-normalized NDVI are presented in Figure 16 for all observations and restraining the analysis to near-nadir acquisitions (VZA < 10°). Overall, there is no clear evidence of the impact of the orbital decay for any angular conditions or land cover class. The deviation of the median from the 0 value is well within the statistical dispersion of the estimated drifts, demonstrating that the orbital drift effect on NDVI time series is less evident than for surface reflectances data, even for near-nadir observations.

4.3.7. Summary Results

The statistical analysis presented in the previous paragraphs shows that the difference between BRDF-normalized and TOC data often lies within the range of variability of the estimated drifts, particularly when observations from all angular conditions are merged. Hence, in order to quantitatively assess the statistical significance of the orbital effect, a common metric is adopted in this final summary section.
To this purpose, a normalized version of the Root Mean Square Error (RMSE) is considered. The RMSE is commonly used to measure the difference between values predicted by a model and the observed values. Within this study, the RMSE is used to measure the statistical difference between a bias-free temporal series of nadir-normalized reflectances and the actual observations. Large values of RMSE indicate significant impact of the changing illumination conditions along the mission. The RMSE is here normalized to the IQR, which is a measure of the range of variability of the estimated drifts for each considered land cover class and was adopted in the statistical analysis presented in Figure 12, Figure 13, Figure 14, Figure 15 and Figure 16. Specifically, the mean IQR of the TOC and BRDF-normalized data is used as normalization factor. The Normalized RMSE (NRMSE) is hence computed as follows:
NRMSE = 1 N i = 1 N ( Y i TOC Y i Norm ) 2 1 2 ( IQR TOC + IQR Norm )
In this equation, Y i TOC and Y i Norm are the TOC and BRDF-normalized drifts (in reflectances unit /year or no unit/year in the case of NDVI), respectively, with i = 1, …, N spanning the considered ensemble of sites within each land cover class. IQR TOC and IQR Norm represent the IQR of the estimated drifts in each class for TOC and BRDF-normalized data, respectively.
The NRMSE provides a quantitative measure of how much the observed differences between the drifts estimated for TOC and BRDF-normalized reflectances or NDVI lie within the range of variability of the data. In particular, NRMSE values larger than 1 indicate that the orbital drift has a statistically significant impact on the TOC data. Conversely, values lower than 1 correspond to conditions when the orbital effect cannot be reliably identified within the statistical ensemble of sites for the considered land cover class.
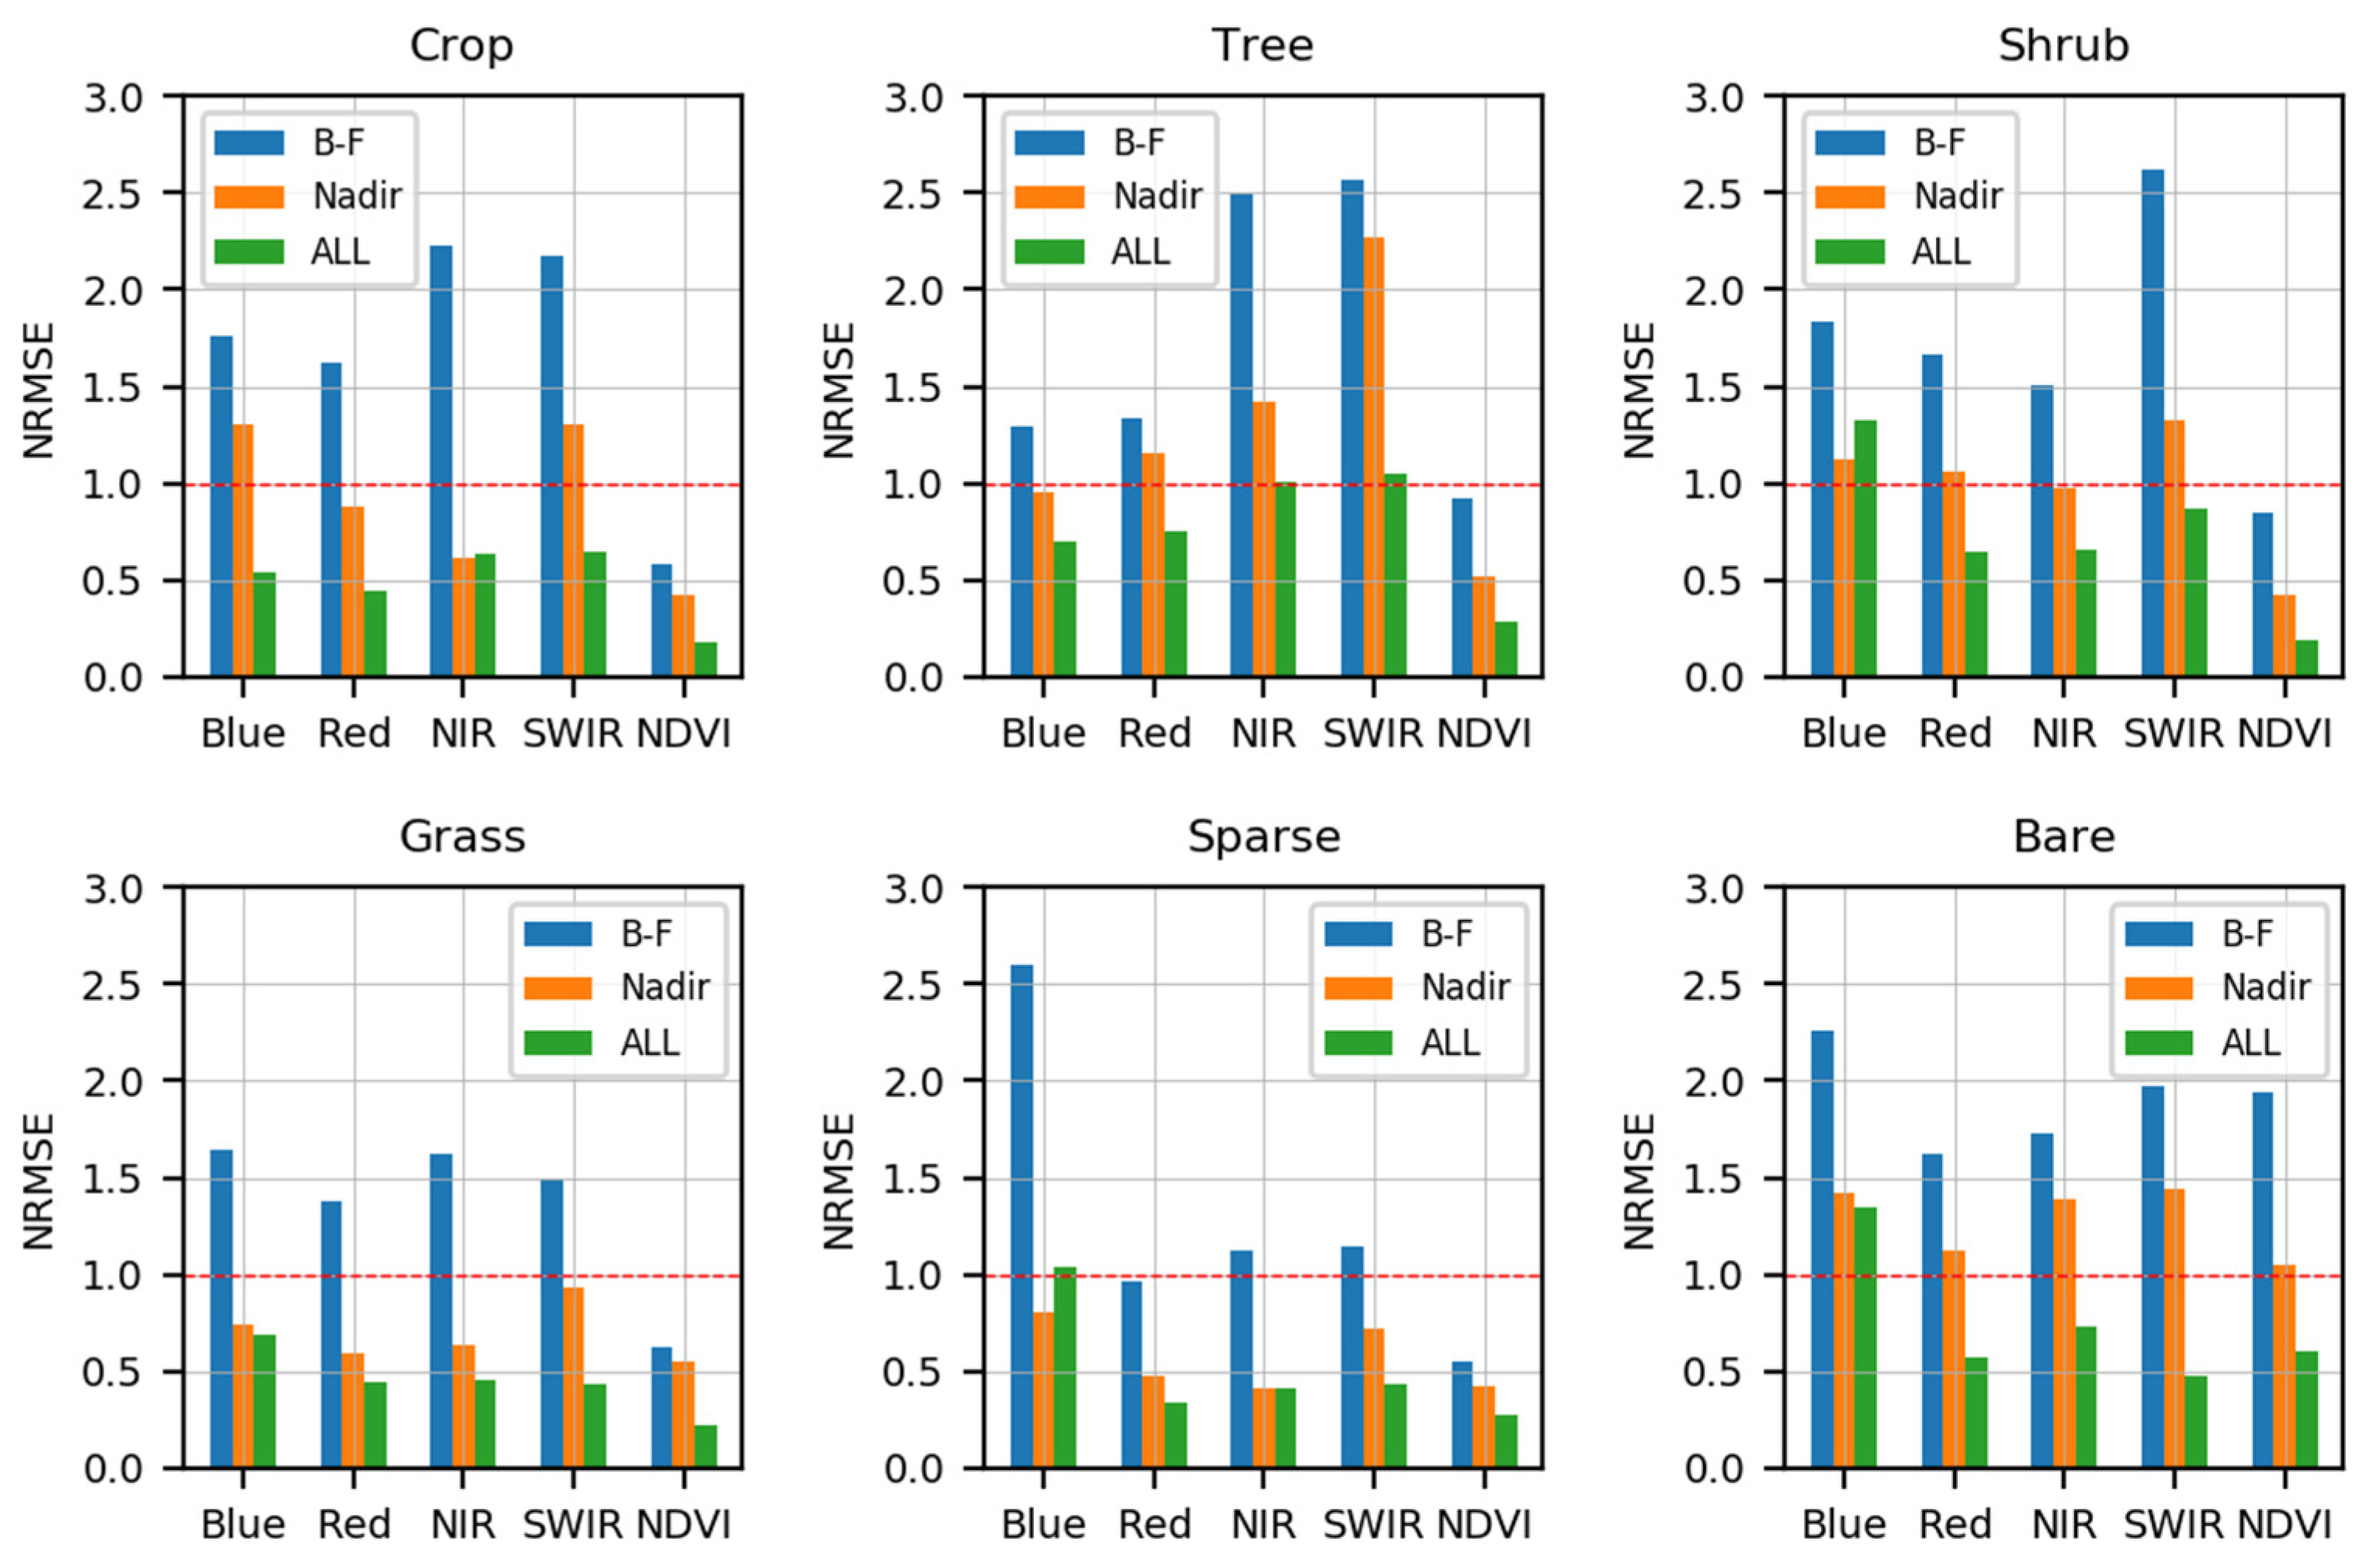
The NRMSE values for the different bands and NDVI are presented in Figure 17 aggregated per land cover class and angular conditions: azimuthal asymmetry, meaning the difference between observations in backward and forward scattering, near nadir and all observations. Overall, the results in Figure 17 are consistent with the previous ones, while providing additional information on the statistical significance of the orbital effect. When considering the azimuthal asymmetry, the NRMSE values strongly deviate from the threshold for the majority of land cover classes and spectral bands, notably for the NIR and SWIR bands, with stronger impact over cropland, forest and shrubland sites as well as over bare soils. No azimuthal dependency is observed for the NDVI in any considered class, except for bare soils, where the larger NRMSE values are not meaningful since they are caused by the very small and noisy NDVI values for the considered set of desert sites. In the case of near-nadir observations, the NRMSE exceeds the threshold mostly for forest sites—and to a lesser extent, for cropland, shrubland and bare soils—in most of the spectral bands, especially in the SWIR band. These results are in line with the previously reported statistical analysis (Figure 12, Figure 13, Figure 14 and Figure 15), as well as with the simulation study.
When observations from all angular conditions are retained, the impact of the drift is not statistically significant for all considered cases. Only over forest sites for the NIR and SWIR bands the NRMSE is close to the threshold value, while for all other classes and spectral bands, the impact of the orbital drift is largely within the statistical dispersion of the data. Yet, in the Blue band over shrubland and bare soils, NRMSE exceeds the threshold. This is mainly due the extremely low reflectance signal for this band and the very low IQR values for these land cover classes (see Figure 15). These large NRMSE values for the Blue band are therefore noisy and cannot be related to the orbital drift, which was demonstrated, both in the simulation and analysis of real data, to be stronger over vegetated sites and for the infrared bands. Finally, for NDVI, no statistically significant orbit-related effect is observed for any land cover class or angular conditions, as already presented and discussed in the previous paragraph (see Figure 16).

5. Discussion

Evaluating drifts in temporal series of satellite-derived surface reflectances is a complex task, since sensor-related effects, such as calibration drifts or variation in orbit parameters and sun-viewing conditions, are highly interrelated with the natural variability of surface and atmospheric conditions. The two-fold approach chosen in this paper, based on numerical simulations and analysis of real observations, provides the means to reliably characterize the component of the drift induced by the drifting orbit.
The simulation study represents an idealized case, where the temporal variability of the synthetic surface reflectances over the mission lifetime is modulated solely by the SZA seasonal changes and the LTDN decay. The results show that the orbital drift induces a positive spurious bias in the westward-looking camera and a negative one in the nadir and eastward-looking cameras. The reason for such azimuthal asymmetry is because the three cameras sense different regions of the BRDF angular distribution (see Figure 6), with the westward camera sensing in the proximity of the retro-reflectance peak and the other cameras in the dips of the opposite azimuthal regions. These findings were used as benchmark in the analysis of real observations.
The investigation of the orbital effect on real data is based on the assumption that the BRDF-normalized temporal series is free of spurious bias induced by the drifting LTDN. The statistical difference between BRDF-normalized and TOC reflectances therefore provides a quantitative measure of the orbit effect. The statistical analysis of real data is aggregated by land cover classes to understand the impact for different surface types. The statistical population of the classes for the considered ensemble of sites is not equally distributed, and therefore fewer robust statistical metrics were derived for the grassland and, in particular, for sparse vegetation sites. For these classes, large statistical variability remains in the estimated drifts, and so the orbital effect cannot be reliably identified.
Despite the expected variability in surface anisotropy and atmospheric conditions, the outcomes of the simulation were consistently verified on real data, notably, the azimuthal asymmetry in the drifts, with a distinct positive bias in the backscattering direction. Yet, no clear indication of an orbit effect was found when the whole time series is considered in the analysis. This is due to compensation effects, since the spurious biases in the two scattering directions compensate each other to a large extent. Likewise, for the NDVI, the similar temporal patterns in Red and NIR bands largely cancel out in the NDVI ratio, resulting in no significant orbit-induced effect. The limited sensitivity of NDVI, as compared to EVI, to the sun-viewing azimuthal configuration was confirmed in previous results on MODIS data [10,12,38], and the limited impact of the orbital drift on temporal consistency of AVHRR NDVI series was verified with theoretical studies [6].

6. Conclusions

The impact of the orbital drift on Proba-V surface directional reflectances (TOC products) and NDVI temporal series at 1 km resolution was evaluated and quantitatively assessed within this study. Analysis was conducted on both synthetic and real observations, showing consistent results.
The largest impact of the orbital drift is detected when observations from backward and forward scattering conditions are treated separately. This effect is larger for the NIR and SWIR bands and for densely vegetated sites. Specifically, a clear, positive spurious trend is induced in the backward direction, corresponding to acquisitions from the westward looking camera, while a negative one is detected in the opposite forward scattering direction, which corresponds to the eastward looking camera acquisitions. A noticeable impact of the orbital drift is also observed for near-nadir acquisitions, with a spurious negative bias particularly for the NIR and SWIR bands and for forest, cropland and shrubland sites.
When observations from all angular conditions are merged, the opposite drifts in the two scattering conditions largely cancel out, with no remaining statistically significant impact of the orbital drift.
In conclusion, as long as data from all angular conditions are considered, there is no statistical evidence of an orbit-induced effect in the consistency of Proba-V surface reflectances and NDVI time series at 1 km resolution. This dataset is therefore suitable for further exploitation for inter-annual vegetation studies.

Supplementary Materials

The following are available at https://www.mdpi.com/article/10.3390/rs13122250/s1 in the Supplementary Material document: S.1: SZA Predicted and Observed Evolutions; S.2: BRDF predicted temporal evolution for all spectral bands; S.3: Temporal series over the four sites for all spectral bands; S.4: Statistical analysis of NDVI Azimuthal Asymmetry.

Funding

This research was carried out as part of the European Space Agency (ESA) Quality Assurance for Earth Observation (IDEAS-QA4EO) framework contract.

Institutional Review Board Statement

Not applicable.

Informed Consent Statement

Not applicable.

Data Availability Statement

The Proba-V data presented in this study are openly available within the Proba-V Mission Exploitation Platform (MEP), which can be accessed here (last accessed on 8 June 2021): https://proba-v-mep.esa.int/. All analysis was made within this platform using the embedded Python 3.5 scientific libraries. The MODIS Albedo daily products V6 (MCD43A1.006) was accessed within the Google Earth Engine (GEE) platform (last accessed on 8 June 2021): https://code.earthengine.google.com/.

Acknowledgments

The author greatly acknowledges the anonymous reviewers for the insightful and valuable comments that were instrumental in improving the quality of the manuscript. The author wishes to thank Erminia De Grandis (Serco) and the VITO MEP team who supported the deployment of the Python code in the MEP cluster. The Proba-V data used within this study are provided by the European Space Agency (ESA) and the Belgian Science Policy Office (BELSPO), they are generated and distributed by VITO.

Conflicts of Interest

The author declares no conflict of interest.

References

  1. GCOS, WMO. Systematic Observation Requirements for Satellite-Based Data Products for Climate—2011 Update; GCOS, WMO: Geneva, Switzerland, 2011. [Google Scholar]
  2. Price, J.C. Timing of NOAA afternoon passes. Int. J. Remote Sens. 1991, 12, 193–198. [Google Scholar] [CrossRef]
  3. Bhatt, R.; Doelling, D.R.; Scarino, B.R.; Gopalan, A.; Haney, C.O.; Minnis, P.; Bedka, K.M. A consistent AVHRR visible calibration record based on multiple methods applicable for the NOAA degrading orbits. Part I: Methodology. J. Atmos. Ocean. Technol. 2016, 33, 2499–2515. [Google Scholar] [CrossRef]
  4. Privette, J.L.; Fowler, C.; Wick, G.A.; Baldwin, D.; Emery, W.J. Effects of orbital drift on advanced very high resolution radiometer products: Normalized difference vegetation index and sea surface temperature. Remote Sens. Environ. 1995, 53, 164–171. [Google Scholar] [CrossRef]
  5. Nagol, J.R.; Vermote, E.F.; Prince, S.D. Quantification of impact of orbital drift on inter-annual trends in AVHRR NDVI data. Remote Sens. 2014, 6, 6680–6687. [Google Scholar] [CrossRef] [Green Version]
  6. Kaufmann, R.K.; Zhou, L.; Knyazikhin, Y.; Shabanov, V.; Myneni, R.B.; Tucker, C.J. Effect of orbital drift and sensor changes on the time series of AVHRR vegetation index data. IEEE Trans. Geosci. Remote Sens. 2000, 38, 2584–2597. [Google Scholar]
  7. Los, S.O.; North, P.R.J.; Grey, W.M.F.; Barnsley, M.J. A method to convert AVHRR Normalized Difference Vegetation Index time series to a standard viewing and illumination geometry. Remote Sens. Environ. 2005, 99, 400–411. [Google Scholar] [CrossRef]
  8. Julien, Y.; Sobrino, J.A. Correcting AVHRR Long Term Data Record V3 estimated LST from orbital drift effects. Remote Sens. Environ. 2012, 123, 207–219. [Google Scholar] [CrossRef]
  9. Weber, H.; Wunderle, S. Drifting Effects of NOAA Satellites on Long-Term Active Fire Records of Europe. Remote Sens. 2019, 11, 467. [Google Scholar] [CrossRef] [Green Version]
  10. Sims, D.A.; Rahman, A.F.; Vermote, E.F.; Jiang, Z. Seasonal and inter-annual variation in view angle effects on MODIS vegetation indices at three forest sites. Remote Sens. Environ. 2011, 115, 3112–3120. [Google Scholar] [CrossRef]
  11. Bhandari, S.; Phinn, S.; Gill, T. Assessing viewing and illumination geometry effects on the MODIS vegetation index (MOD13Q1) time series: Implications for monitoring phenology and disturbances in forest communities in Queensland, Australia. Int. J. Remote Sens. 2011, 32, 7513–7538. [Google Scholar] [CrossRef]
  12. Petri, C.A.; Galvão, L.S. Sensitivity of seven MODIS vegetation indices to BRDF effects during the Amazonian dry season. Remote Sens. 2019, 11, 1650. [Google Scholar] [CrossRef] [Green Version]
  13. Francois, M.; Santandrea, S.; Mellab, K.; Vrancken, D.; Versluys, J. The PROBA-V mission: The space segment. Int. J. Remote Sens. 2014, 35, 2548–2564. [Google Scholar] [CrossRef]
  14. Dierckx, W.; Sterckx, S.; Benhadj, I.; Livens, S.; Duhoux, G.; Van Achteren, T.; Francois, M.; Mellab, K.; Saint, G. PROBA-V mission for global vegetation monitoring: Standard products and image quality. Int. J. Remote Sens. 2014, 35, 2589–2614. [Google Scholar] [CrossRef]
  15. Lucht, W.; Lewis, P. Theoretical noise sensitivity of BRDF and albedo retrieval from the EOS-MODIS and MISR sensors with respect to angular sampling. Int. J. Remote Sens. 2000, 21, 81–98. [Google Scholar] [CrossRef]
  16. Maisongrande, P.; Duchemin, B.; Dedieu, G. VEGETATION/SPOT: An operational mission for the Earth monitoring; presentation of new standard products. Int. J. Remote Sens. 2004, 25, 9–14. [Google Scholar] [CrossRef]
  17. Sterckx, S.; Benhadj, I.; Duhoux, G.; Livens, S.; Dierckx, W.; Goor, E.; Adriaensen, S.; Heyns, W.; Van Hoof, K.; Strackx, G.; et al. The PROBA-V mission: Image processing and calibration. Int. J. Remote Sens. 2014, 35, 2565–2588. [Google Scholar] [CrossRef]
  18. Wolters, E.; Dierckx, W.; Iordache, M.D.; Swinnen, E. PROBA-V Products User Manual v3.01. VITO, 2014. Available online: https://proba-v.vgt.vito.be/sites/proba-v.vgt.vito.be/files/products_user_manual.pdf (accessed on 26 February 2021).
  19. Rahman, H.; Dedieu, G. SMAC: A simplified method for the atmospheric correction of satellite measurements in the solar spectrum. Remote Sens. 1994, 15, 123–143. [Google Scholar] [CrossRef]
  20. Maisongrande, P.; Duchemin, B.; Dedieu, G.; Leroy, M. A New Algorithm for Atmospheric Correction of Surface Reflectances Delivered by the VEGETATION System. In Proceedings of the Geoscience and Remote Sensing Symposium, IGARSS 2000, Honolulu, HI, USA, 24–28 July 2000; Volume 2, pp. 24–28. [Google Scholar]
  21. Drusch, M.; Del Bello, U.; Carlier, S.; Colin, O.; Fernandez, V.; Gascon, F.; Hoersch, B.; Isola, C.; Laberinti, P.; Martimort, P.; et al. Sentinel-2: ESA’s optical high-resolution mission for GMES operational services. Remote Sens. Environ. 2012, 120, 25–36. [Google Scholar] [CrossRef]
  22. ESA Web Page. Available online: https://www.esa.int/Enabling_Support/Space_Engineering_Technology/Proba_Missions/Ending_global_plant_tracking_Proba-V_assigned_new_focus (accessed on 26 February 2021).
  23. Bréon, F.M.; Vermote, E. Correction of MODIS surface reflectance time series for BRDF effects. Remote Sens. Environ. 2012, 125, 1–9. [Google Scholar] [CrossRef]
  24. Toté, C.; Swinnen, E.; Sterckx, S.; Adriaensen, S.; Benhadj, I.; Iordache, M.D.; Bertels, L.; Kirches, G.; Stelzer, K.; Dierckx, W.; et al. Evaluation of PROBA-V Collection 1: Refined Radiometry, Geometry, and Cloud Screening. Remote Sens. 2018, 10, 1375. [Google Scholar] [CrossRef] [Green Version]
  25. Goor, E.; Dries, J.; Daems, D.; Paepen, M.; Niro, F.; Goryl, P.; Mougnaud, P.; Della Vecchia, A. PROBA-V Mission Exploitation Platform. Remote Sens. 2016, 8, 564. [Google Scholar] [CrossRef] [Green Version]
  26. Expressions Derived from NOAA Solar Position Calculator Web Portal. Available online: https://www.esrl.noaa.gov/gmd/grad/solcalc/index.html; https://www.esrl.noaa.gov/gmd/grad/solcalc/solareqns.PDF; (accessed on 26 February 2021).
  27. Strahler, A.H.; Muller, J.; Lucht, W.; Schaaf, C.; Tsang, T.; Gao, F.; Li, X.; Lewis, P.; Barnsley, M.J. MODIS BRDF/albedo product: Algorithm theoretical basis document version 5.0. MODIS Doc. 1999, 23, 42–47. [Google Scholar]
  28. Roujean, J.L.; Leroy, M.; Deschamps, P.Y. A bidirectional reflectance model of the Earth’s surface for the correction of remote sensing data. J. Geophys. Res. Atmos. 1992, 97, 20455–20468. [Google Scholar] [CrossRef]
  29. Ross, J. The Radiation Regime and Architecture of Plant Stands; Springer Science & Business Media: Berlin/Heidelberg, Germany, 2012; Volume 3. [Google Scholar]
  30. Wanner, W.; Li, X.; Strahler, A.H. On the derivation of kernels for kernel-driven models of bidirectional reflectance. J. Geophys. Res. Atmos. 1995, 100, 21077–21089. [Google Scholar] [CrossRef]
  31. Lucht, W.; Schaaf, C.B.; Strahler, A.H. An algorithm for the retrieval of albedo from space using semiempirical BRDF models. IEEE Trans. Geosci. Remote Sens. 2000, 38, 977–998. [Google Scholar] [CrossRef] [Green Version]
  32. Schaaf, C.; Wang, Z. MCD43A1 MODIS/Terra+Aqua BRDF/Albedo Model Parameters Daily L3 Global—500 m V006. 2015; Distributed by NASA EOSDIS Land Processes DAAC. Available online: https://lpdaac.usgs.gov/products/mcd43a1v006/ (accessed on 6 August 2020). [CrossRef]
  33. Gorelick, N.; Hancher, M.; Dixon, M.; Ilyushchenko, S.; Thau, D.; Moore, R. Google Earth Engine: Planetary-scale geospatial analysis for everyone. Remote Sens. Environ. 2017, 202, 18–27. [Google Scholar] [CrossRef]
  34. Baret, F.; Morissette, J.T.; Fernandes, R.A.; Champeaux, J.L.; Myneni, R.B.; Chen, J.; Plummer, S.; Weiss, M.; Bacour, C.; Garrigues, S.; et al. Evaluation of the representativeness of networks of sites for the global validation and intercomparison of land biophysical products: Proposition of the CEOS-BELMANIP. IEEE Trans. Geosci. Remote Sens. 2006, 44, 1794–1803. [Google Scholar] [CrossRef]
  35. ESA. Land Cover CCI Product User Guide Version 2; Technical Reports; ESA: Paris, France, 2017; Available online: Maps.elie.ucl.ac.be/CCI/viewer/download/ESACCI-LC-Ph2-PUGv2_2.0.pdf (accessed on 26 February 2021).
  36. VITO Web Page Reporting on Proba-V Known Quality Issues. Available online: https://proba-v.vgt.vito.be/en/quality/known-issues (accessed on 26 February 2021).
  37. Duchemin, B.; Berthelot, B.; Dedieu, G.; Leroy, M.; Maisongrande, P. Normalisation of directional effects in 10-day global syntheses derived from VEGETATION/SPOT: II. Validation of an operational method on actual data sets. Remote Sens. Environ. 2002, 81, 101–113. [Google Scholar] [CrossRef]
  38. Morton, D.C.; Nagol, J.; Carabajal, C.C.; Rosette, J.; Palace, M.; Cook, B.D.; Vermote, E.F.; Harding, D.J.; North, P.R. Amazon forests maintain consistent canopy structure and greenness during the dry season. Nature 2014, 506, 221–224. [Google Scholar] [CrossRef]
Figure 1. The figure presents a simplified scheme of Proba-V across-track observation geometry, which is composed of three overlapping cameras arranged in a fan-shaped configuration. The geometry of observation in three cameras is presented in the panels: (a) left camera, (b) nadir camera, (c) right camera. The position of the sun is simplified for the sake of clarity, although the basic angular configuration of the descending morning orbit is maintained, meaning the left camera is looking westward, away from the sun, with prevalence of backscattering conditions, while the right one is looking eastward, towards the sun, with prevalence of forward scattering.
Remotesensing 13 02250 g001
Figure 2. The figure shows the predicted LTDN variation (h) of Proba-V orbit using flight model simulations. The drifting orbit (blue) is plotted together with a steady sun-synchronous orbit (dotted green) having a stable LTDN, fixed to the value reached after launch (10:45 a.m.).
Remotesensing 13 02250 g002
Figure 3. The figure shows the location of BELMANIP-2 sites [34] used for assessing the multi-temporal consistency of Proba-V TOC products at global scale and for different surface types and environmental conditions. The prevalent global land cover class is also shown with colors indicating the different classes as derived from ESA CCI Land Cover Map V2.0 [35].
Remotesensing 13 02250 g003
Figure 4. The figure shows (a) the estimated evolution of SZA from launch (7 May 2013) up to July 2021 as a function of the dates and latitude; (b) the absolute changes of SZA with respect to a steady orbit having a fixed overpass time, corresponding to the one reached after launch, 10:45 a.m. The end of Proba-V Operational Phase (30 June 2020) is plotted as a dashed red line.
Remotesensing 13 02250 g004
Figure 5. The figure shows simulated changes of synthetic surface reflectances, with respect to a fixed sun-synchronous orbit at 10:45 a.m. Changes are plotted for the NIR band as a function of date and latitude. Three plots are shown for three angular configurations corresponding to the viewing angle in the three Proba-V cameras: (a) left, (b) nadir and (c) right. The end of Proba-V Operational Phase (30 June 2020) is plotted as a dashed red line.
Remotesensing 13 02250 g005
Figure 6. The figure shows Proba-V NIR band BRDF for (a) SZA = 10°, (b) SZA = 20°, (c) SZA = 30°, (d) SZA = 40°. Distance from the origin is the zenith angle, while azimuth angles span the polar plot plane. The VZA positions of the left (L), nadir (N) and right (R) cameras are shown in each plot with black circles. In the used convention, the SAA is 180°, the VAA spans 0–360°, i.e., the region with relative azimuth angle (RAA = SAA–VAA) < 90° corresponds to the backscattering, while RAA > 90° to the forward scattering directions. Note that the convention used here for VAA and SAA is different from the one reported in the operational products, although the relative position of the sun and viewing azimuth directions are preserved.
Remotesensing 13 02250 g006
Figure 7. The figure shows TOC NIR reflectances over Belmanip-38 site in the Amazon rainforest (lat/lon = −9.75°/−60.33°). The plots present the temporal series of TOC (red) and BRDF-normalized (blue) reflectances for three angular conditions: (a): RAA < 90°, (b) RAA > 90°, (c): “All”; the latter corresponds to retaining all observations in the fit. The fitted linear curves are also shown for TOC (purple) and BRDF-normalized (green) data with drift values reported in the legend.
Remotesensing 13 02250 g007
Figure 8. The figure shows TOC reflectance in NIR band for a cropland site (Belmanip-232) located in Barrax, Spain (lat/lon = 39.06°/−2.07°). The plots present the temporal series of TOC (red) and BRDF-normalized (blue) reflectances for three angular conditions: (a): RAA < 90°, (b) RAA > 90°, (c): “All”; the latter corresponds to retaining all observations in the fit. The fitted linear curves are also shown for TOC (purple) and BRDF-normalized (green) data with drift values reported in the legend. In the plot (c), the two regression lines lies above each other.
Remotesensing 13 02250 g008
Figure 9. The figure shows TOC reflectance in NIR band for a shrubland site (Belmanip-57) located in the north of Mexico (lat/lon = 27.57°/−103.61°). The plots present the temporal series of TOC (red) and BRDF-normalized (blue) reflectances for three angular conditions: (a): RAA < 90°, (b) RAA > 90°, (c): “All”; the latter corresponds to retaining all observations in the fit. The fitted linear curves are also shown for TOC (purple) and BRDF-normalized (green) data with drift values reported in the legend.
Remotesensing 13 02250 g009
Figure 10. The figure shows TOC reflectance in NIR band for a bright desert site (Belmanip-207) located in Egypt (lat/lon = 27.87°/28.87°). The plots present the temporal series of TOC (red) and BRDF-normalized (blue) reflectances for three angular conditions: (a): RAA < 90°, (b) RAA > 90°, (c): “All”; the latter corresponds to retaining all observations in the fit. The fitted linear curves are also shown for TOC (purple) and BRDF-normalized (green) data with drift values reported in the legend.
Remotesensing 13 02250 g010
Figure 11. The two maps show the geographical distribution of the differences in the estimated drift ( d r i f t d i f f = d r i f t b a c k w a r d d r i f t f o r w a r d ) of NIR reflectances over BELMANIP-2 sites for the two temporal series of (a) TOC data and (b) BRDF-normalized data. The size of the points is proportional to the magnitude of the differences; the color indicates the sign, i.e., green is positive, red is negative.
Remotesensing 13 02250 g011
Figure 12. The figure shows boxplots of estimated drifts in TOC products aggregated per land cover class for the backward (blue) and forward (red) scattering directions, and their differences (green). Results are presented for bands: (a) Blue, (b) Red, (c) NIR, (d) SWIR. Aggregation is performed per land cover class: Crop (CR), Tree (TR), Shrubland (SH), Grassland (GR), Sparse vegetation (SP), Bare soils (BA). The height of the box extends from the upper to the lower quartile, Q3 and Q1, corresponding to the 75th and 25th percentiles, respectively. The median is plotted inside the box and the bars extend to 1.5 × IQR from the lower and upper quartiles, where IQR = Q3 − Q1.
Remotesensing 13 02250 g012
Figure 13. The figure shows boxplots of estimated drifts in BRDF-normalised products aggregated per land cover class for the backward (blue) and forward (red) scattering directions, and their differences (green). Results are presented for bands: (a) Blue, (b) Red, (c) NIR, (d) SWIR. Aggregation is performed per land cover class: Crop (CR), Tree (TR), Shrubland (SH), Grassland (GR), Sparse vegetation (SP), Bare soils (BA). The parameters of the boxplot chart are those used and described in Figure 12.
Remotesensing 13 02250 g013
Figure 14. The figure shows the boxplots of estimated drifts in the four spectral bands for near-nadir observations (VZA < 10°) aggregated per land cover class: Crop (CR), Tree (TR), Shrubland (SH), Grassland (GR), Sparse vegetation (SP), Bare soils (BA). Estimated drifts for TOC (red) and BRDF-normalized (blue) reflectances are presented for the bands: (a) Blue, (b) Red, (c) NIR, (d) SWIR. The parameters of the boxplot chart are those used and described in Figure 12.
Remotesensing 13 02250 g014
Figure 15. The figure shows the boxplots of estimated drifts in the four spectral bands when all angular observations are merged. The statistics are aggregated per land cover class: Crop (CR), Tree (TR), Shrubland (SH), Grassland (GR), Sparse vegetation (SP), Bare soils (BA). Estimated drifts for TOC (red) and BRDF-normalized (blue) reflectances are presented for the bands: (a) Blue, (b) Red, (c) NIR, (d) SWIR. The parameters of the boxplot chart are those used and described in Figure 12.
Remotesensing 13 02250 g015
Figure 16. The figure shows the boxplots of estimated drifts in NDVI considering (a) all acquisitions and (b) near-nadir acquisitions (VZA < 10°). Results are aggregated per land cover class: Crop (CR), Tree (TR), Shrubland (SH), Grassland (GR), Sparse vegetation (SP), Bare soils (BA). Estimated drifts for TOC (red) and BRDF-normalized (blue) NDVI are plotted. The parameters of the boxplot chart are those used and described in Figure 12.
Remotesensing 13 02250 g016
Figure 17. The figure shows the NRMSE of the estimated drifts for the different angular conditions: blue bars are the azimuthal symmetry (difference in the drifts estimated for backward and forward scattering), orange bars are near nadir observations (VZA < 10°) and green bars correspond to all observations. The NRMSE is computed for each per land cover class and spectral bands, including NDVI. The red horizontal line is the threshold value used to identify a statistically significant impact of the orbital drift in the TOC archive.
Remotesensing 13 02250 g017
Table 1. BRDF parameters used for the simulation.
BlueRedNIRSWIR
f i s o M O D I S 0.02040.02960.41080.2108
f V o l M O D I S 0.01960.02990.28350.1845
f G e o M O D I S 0.00420.00640.07230.0495
Publisher’s Note: MDPI stays neutral with regard to jurisdictional claims in published maps and institutional affiliations.