
Building Extraction from Very-High-Resolution Remote Sensing Images Using Semi-Supervised Semantic Edge Detection


Abstract
1. Introduction
2. Related Work
2.1. Building Extraction from VHR Images
2.2. Deep Learning-Based Edge Detection
2.3. Deep Learning-Based Semi-Supervised Method
3. Methodology
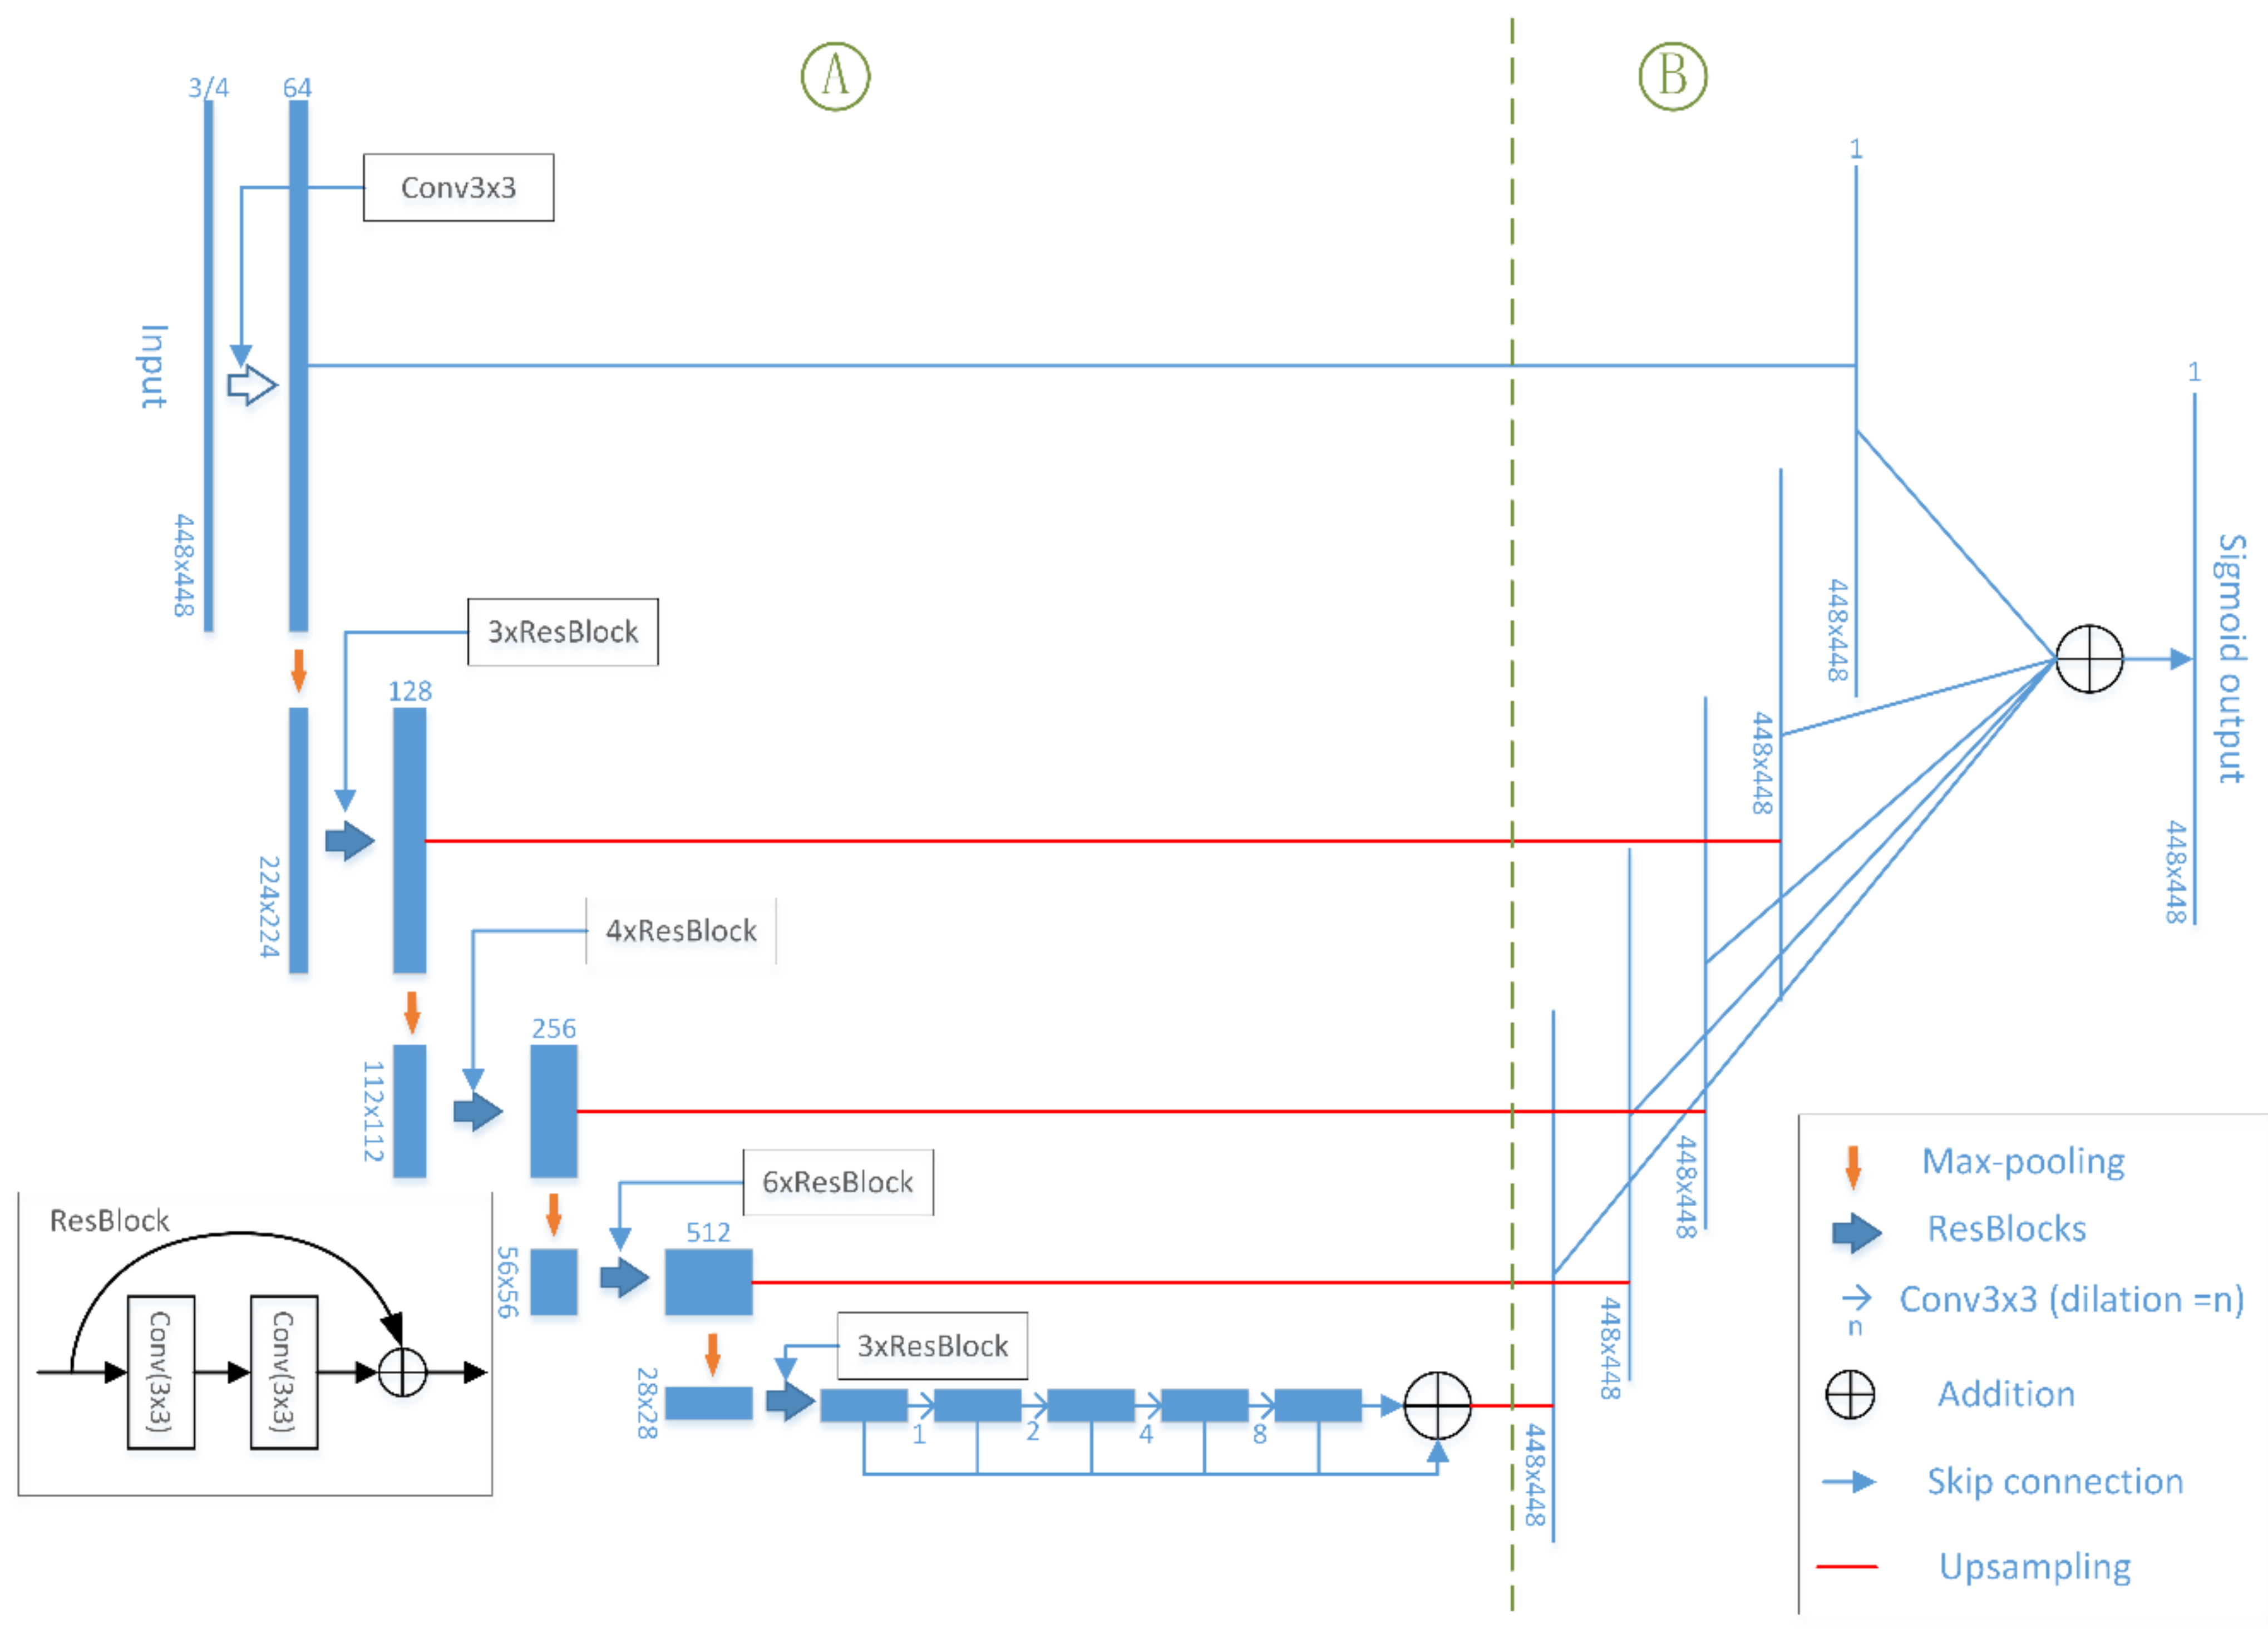
3.1. Network Architectures
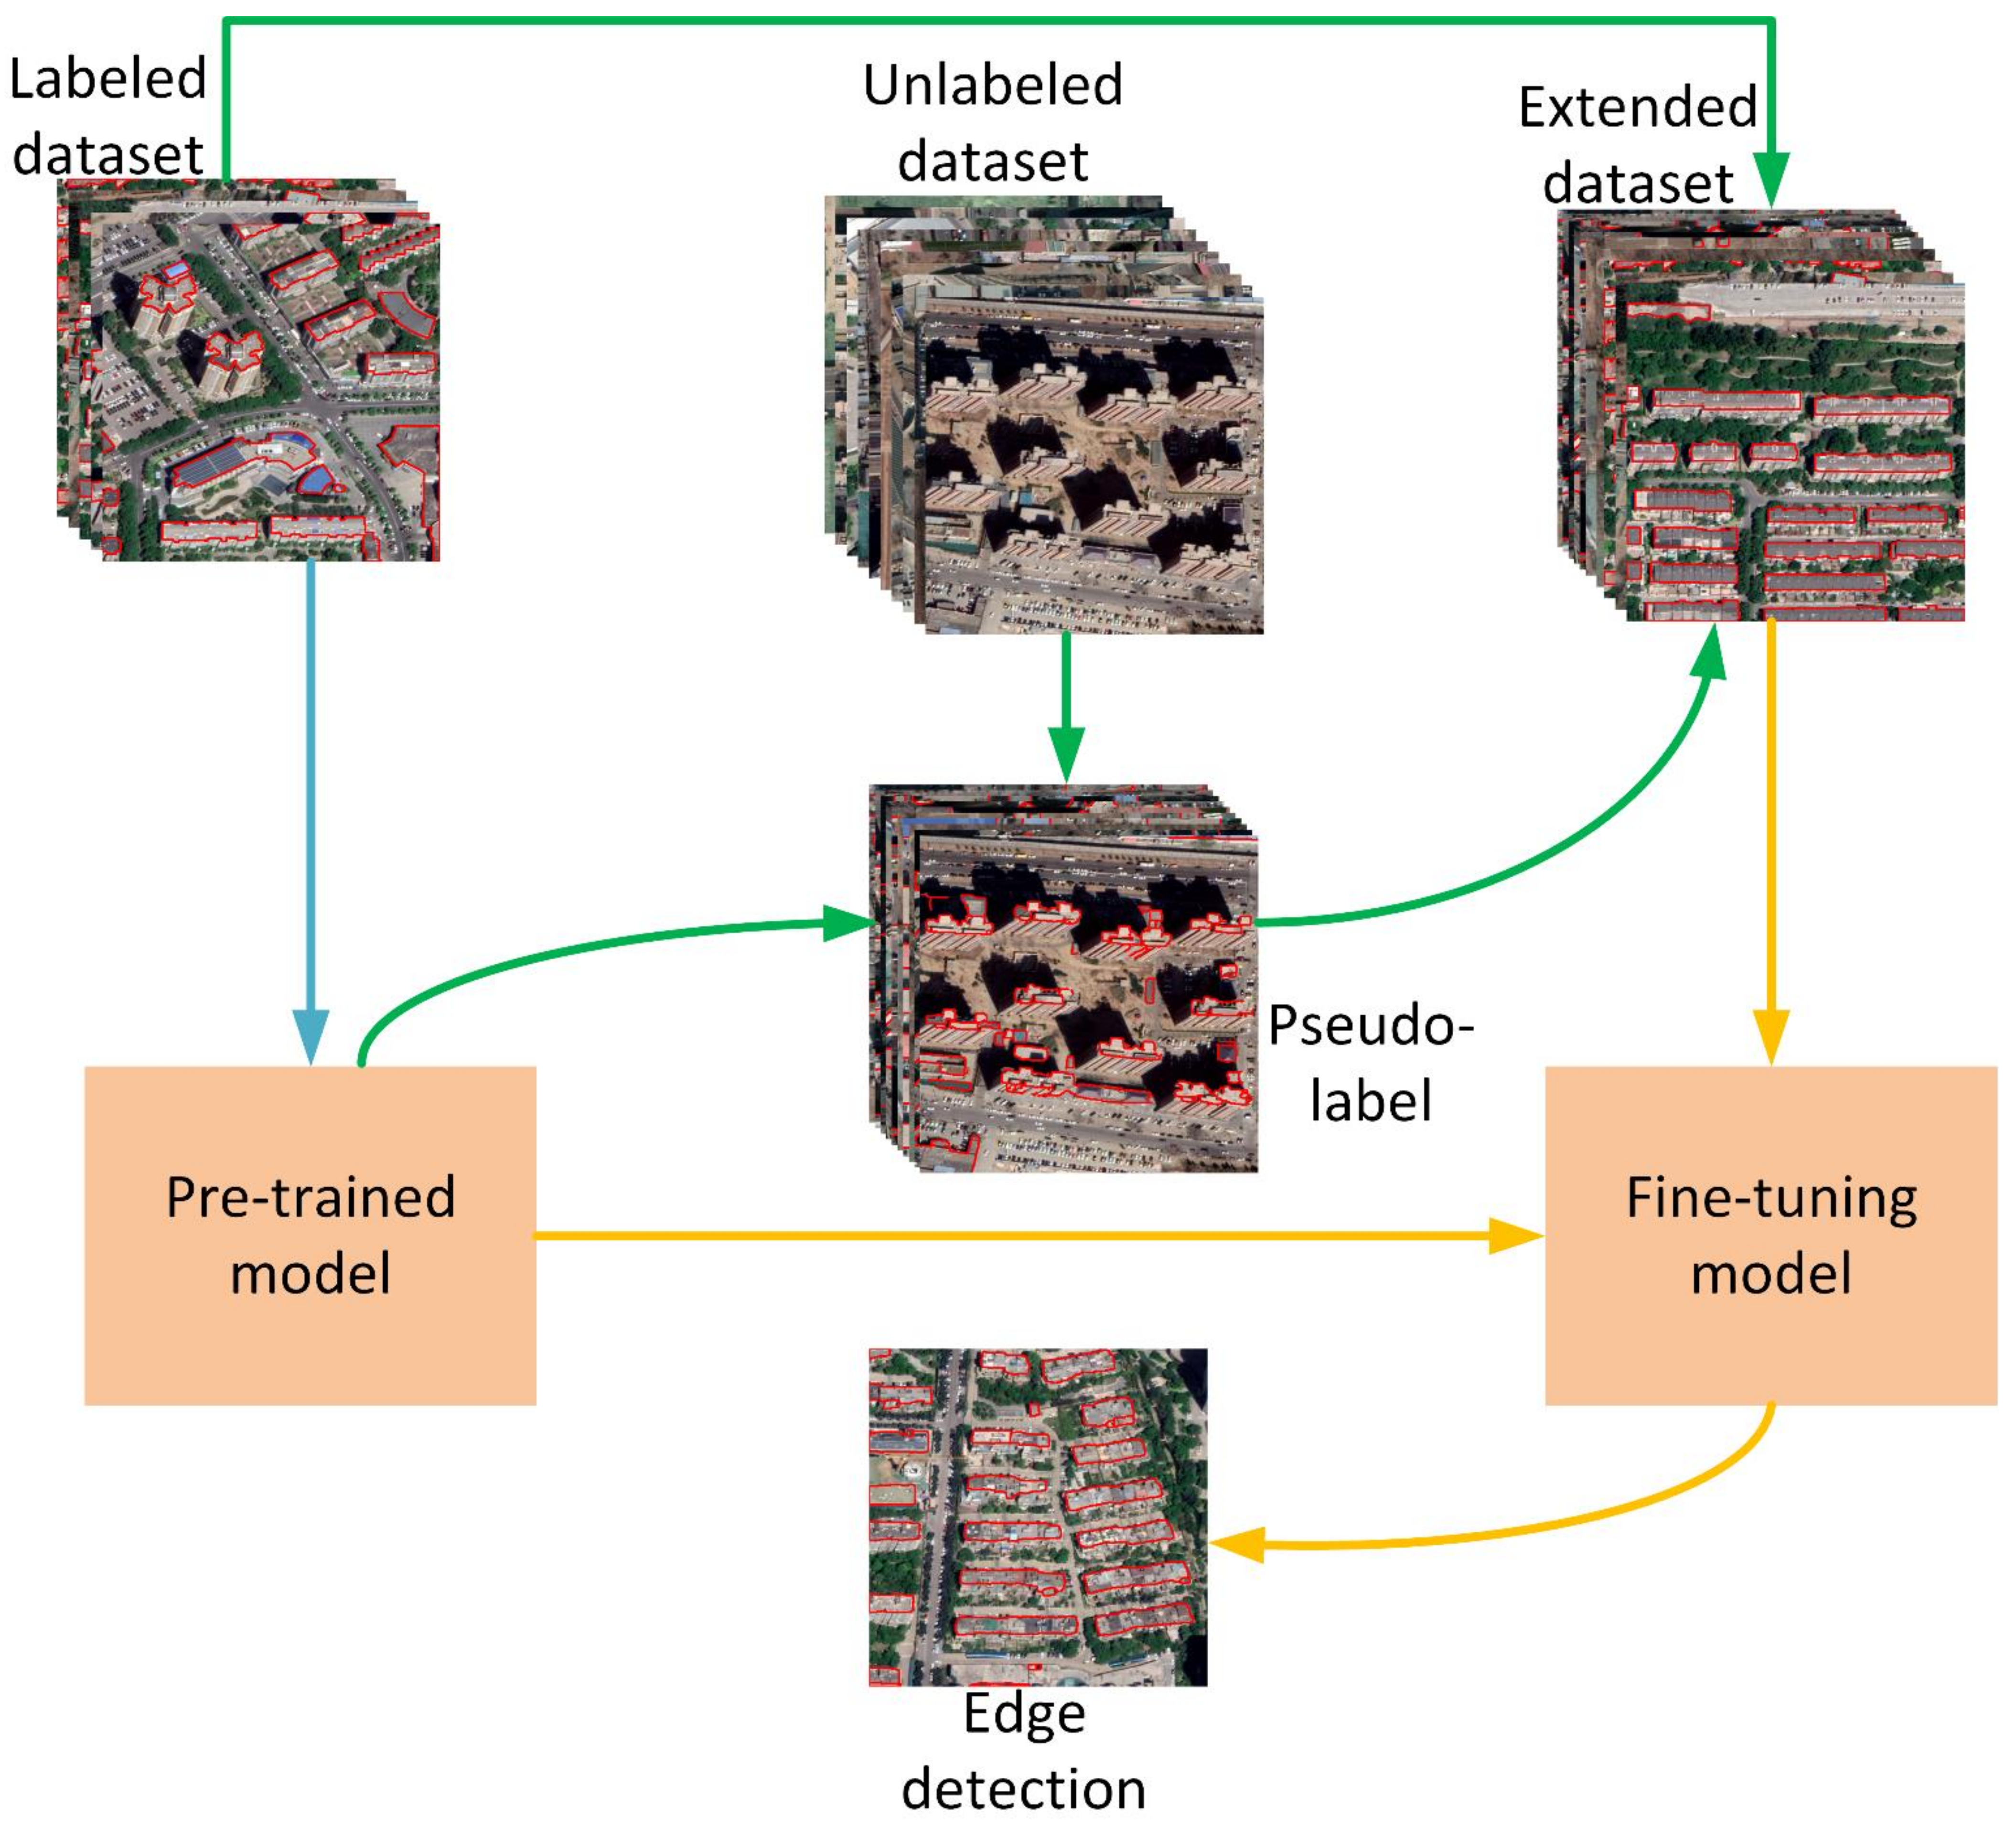
3.2. Training Process
4. Experiment and Results
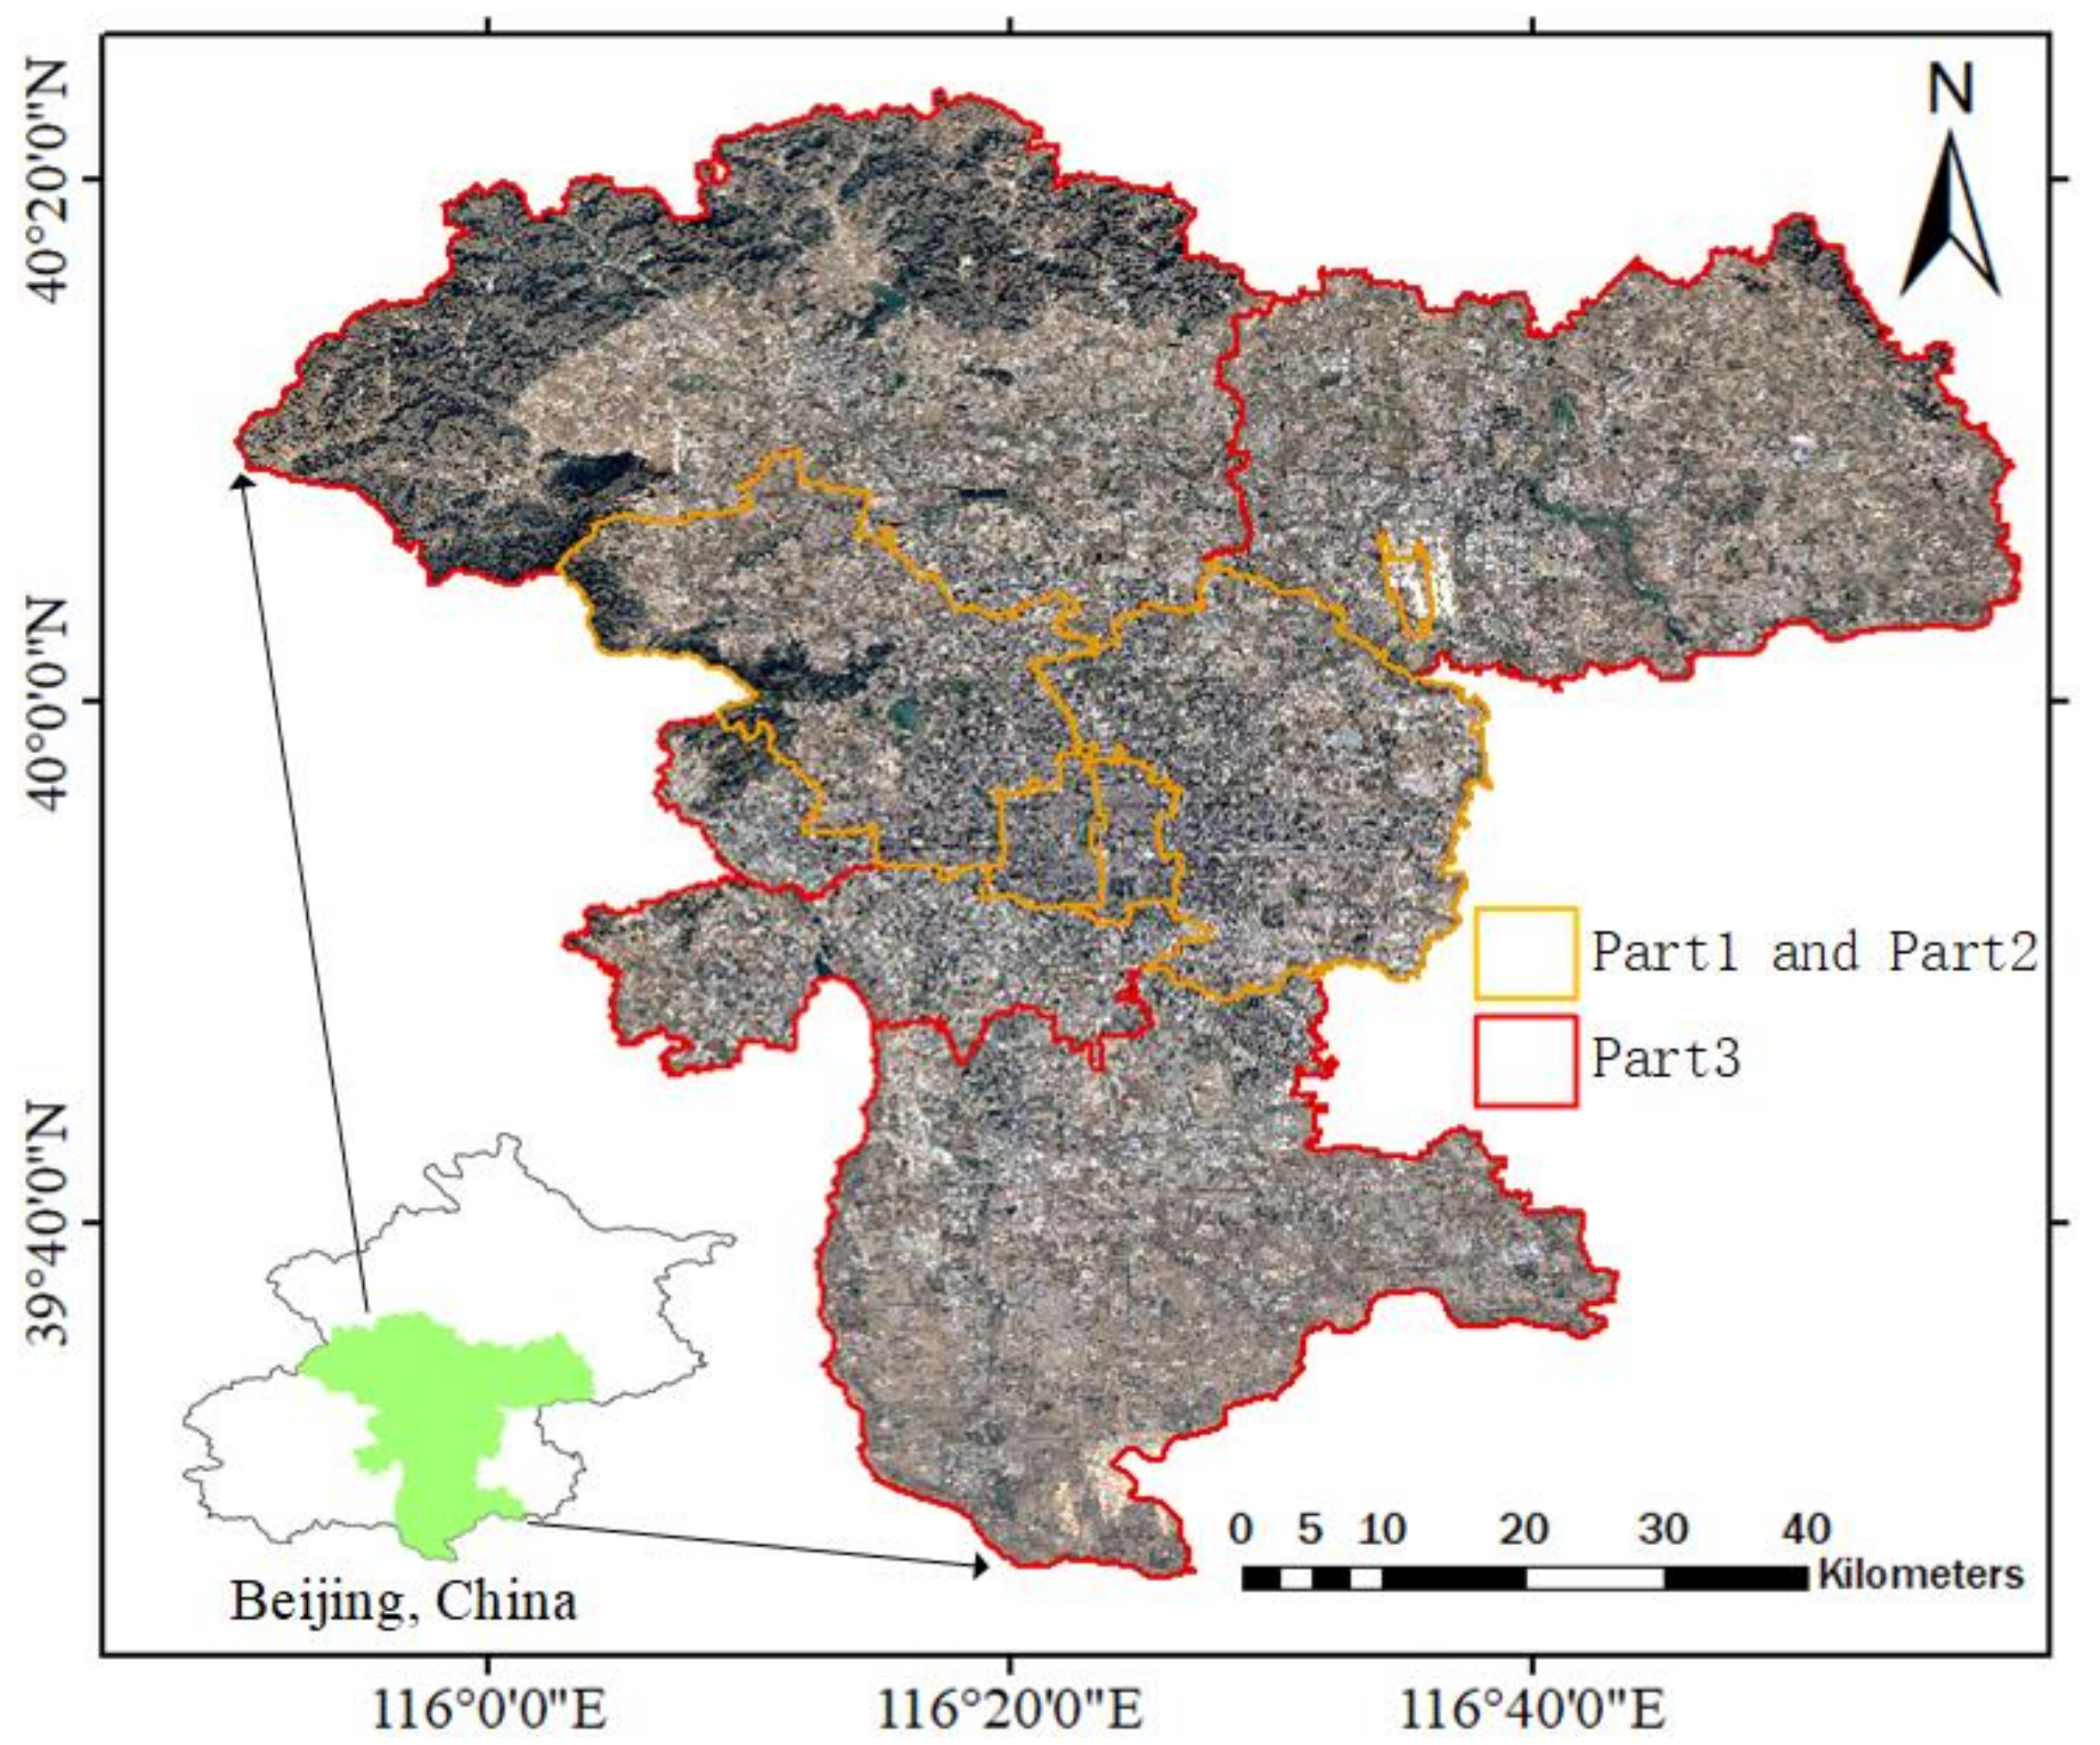
4.1. Dataset
4.2. Training Details
4.3. Evaluation
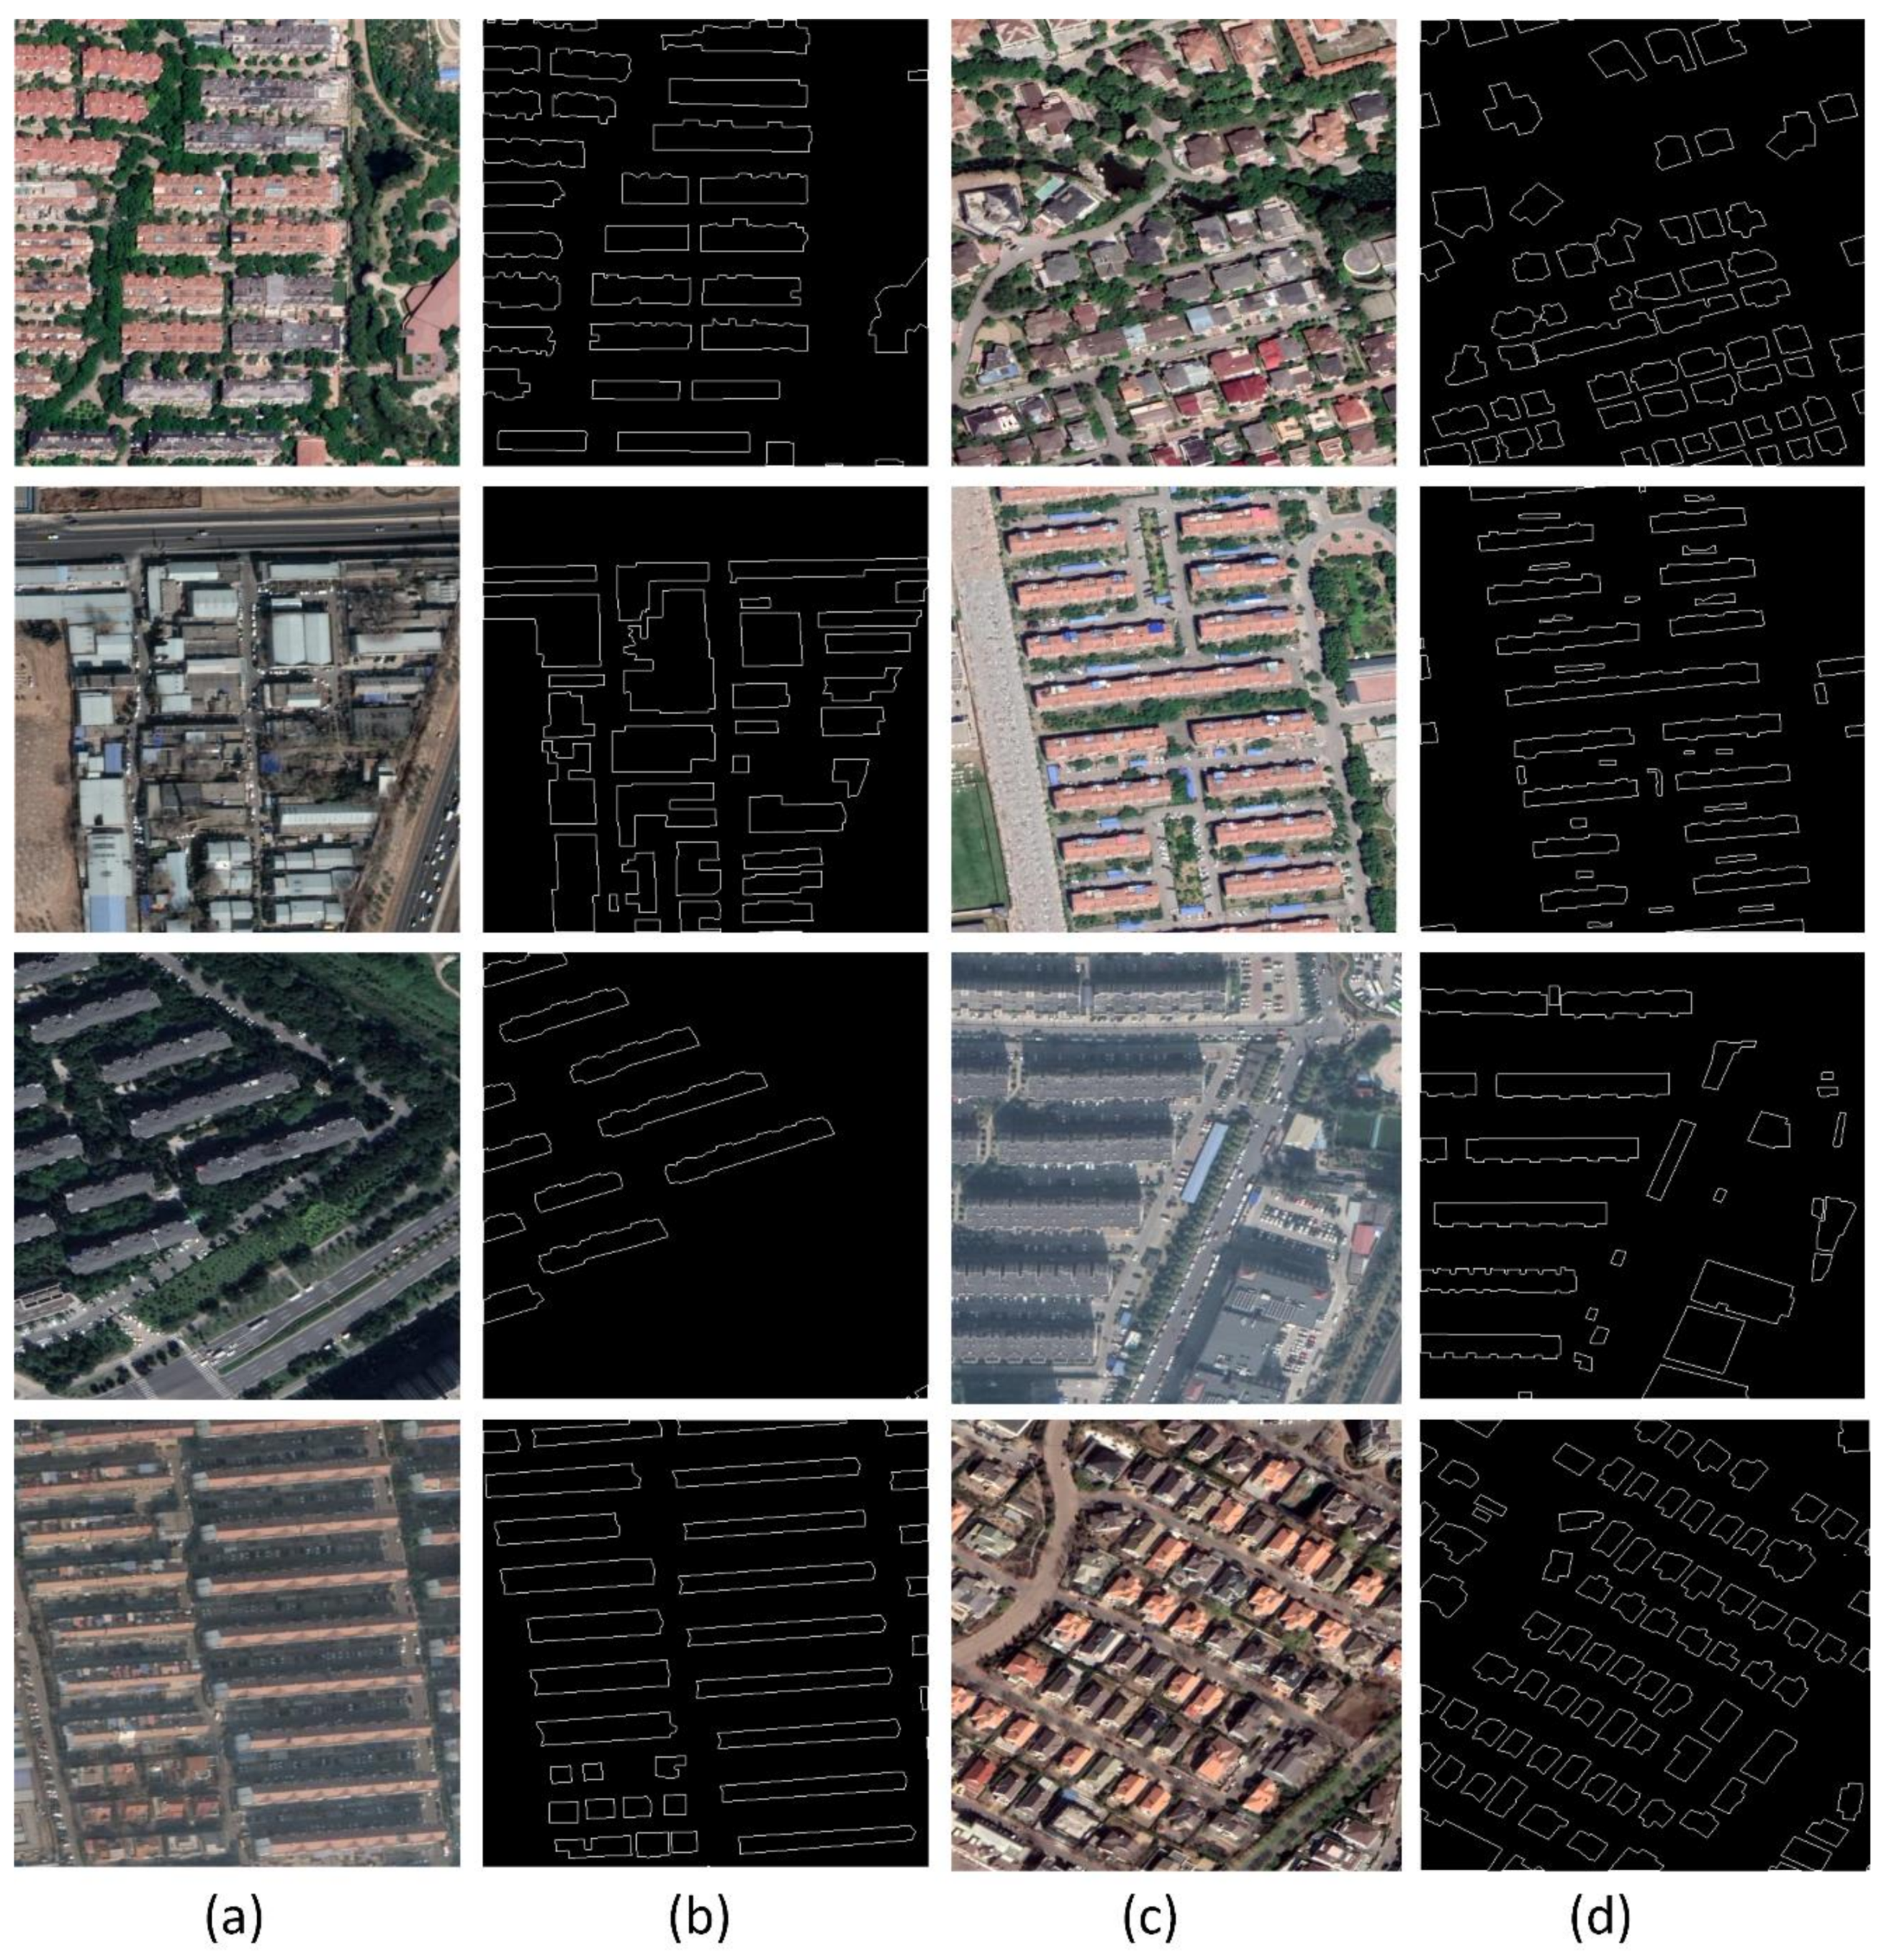
4.4. Results
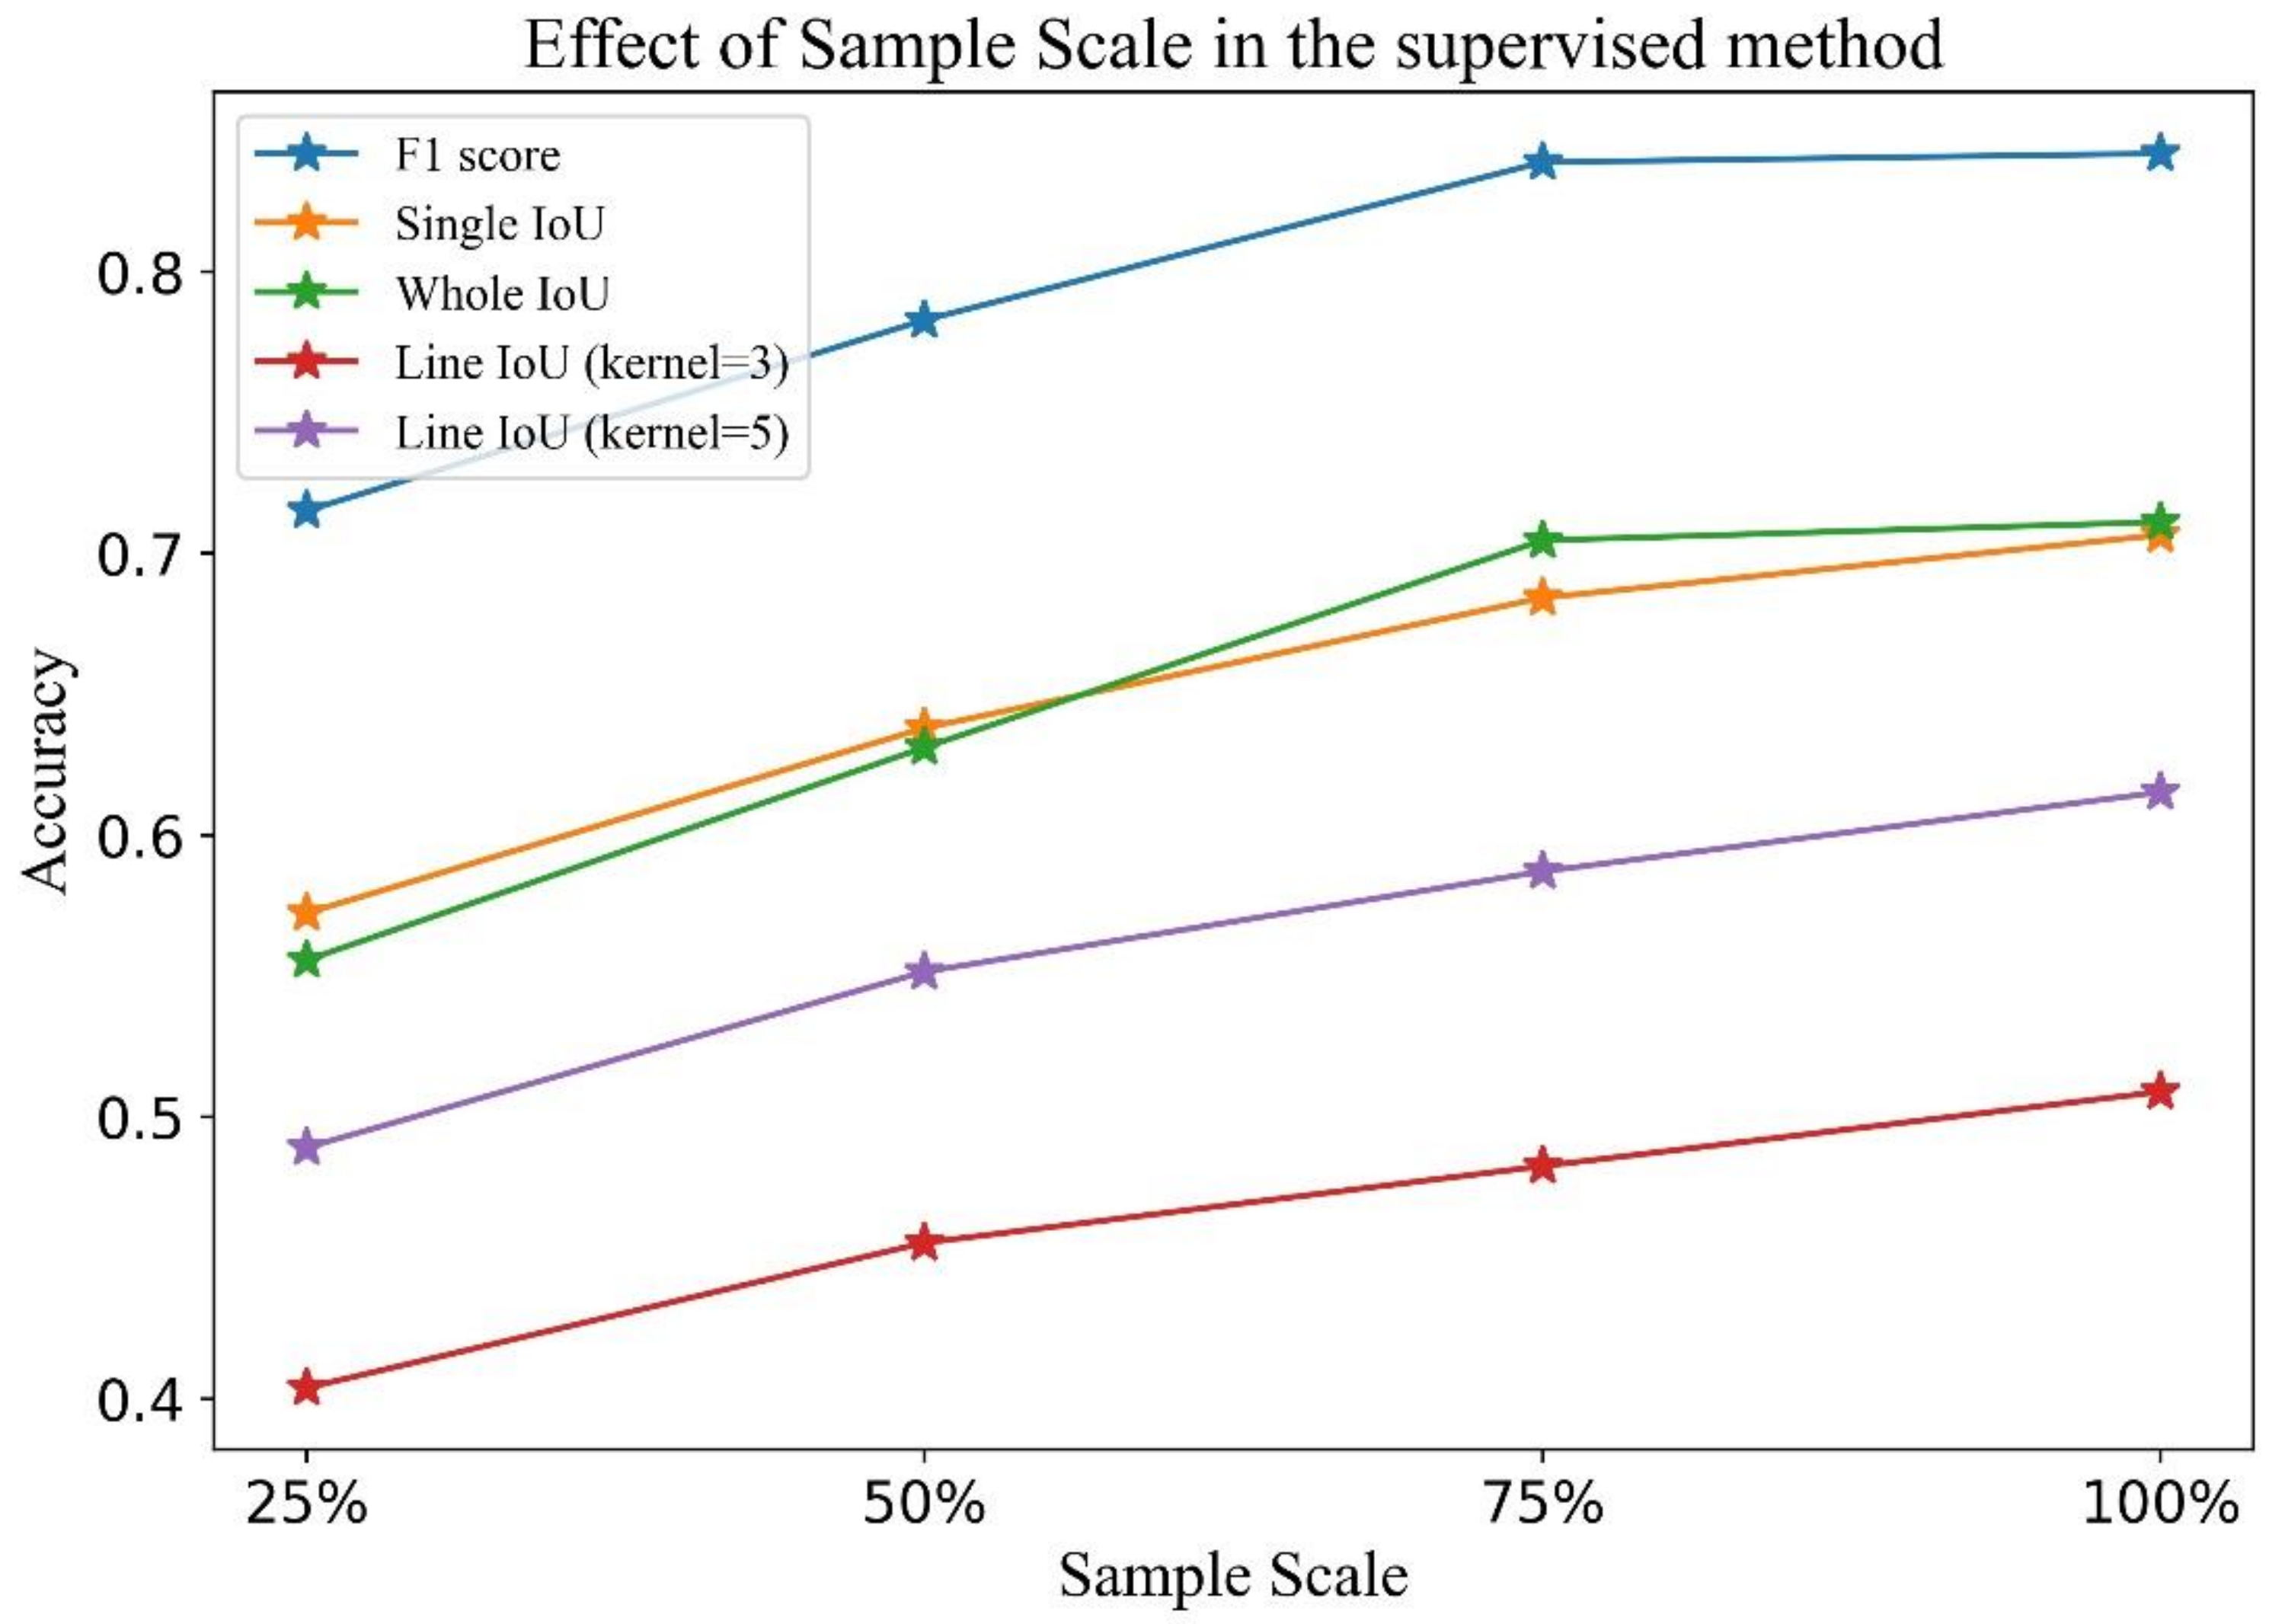
4.4.1. Effect of the Sample Scale in the Supervised Method
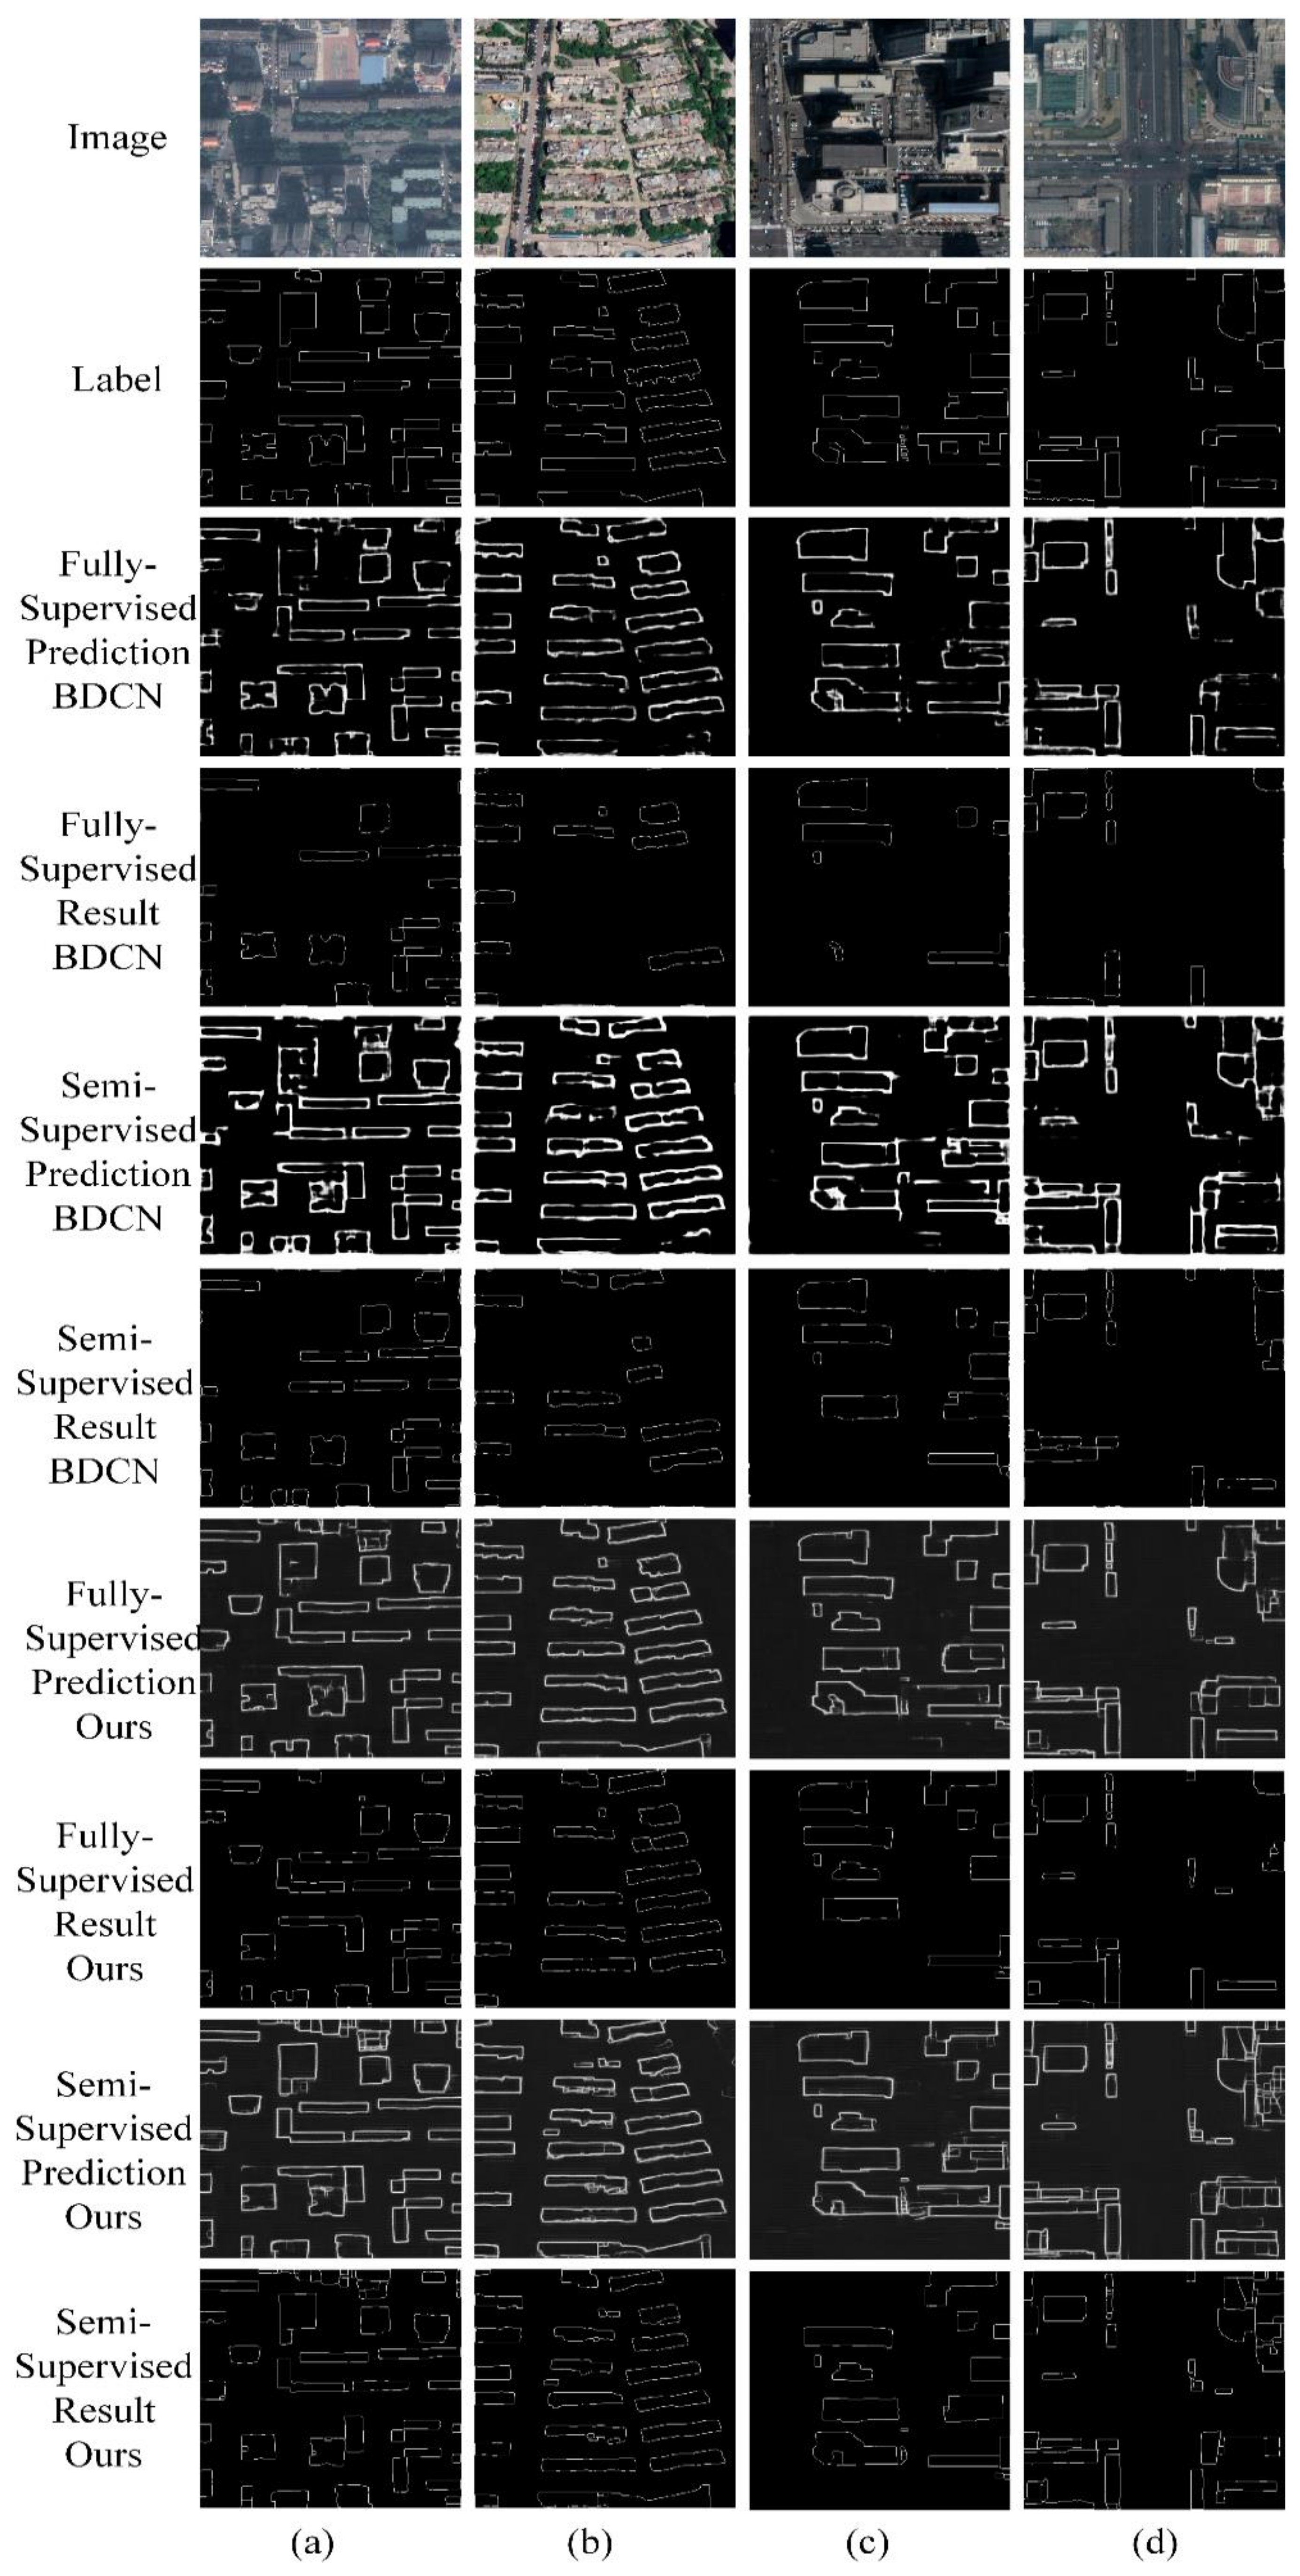
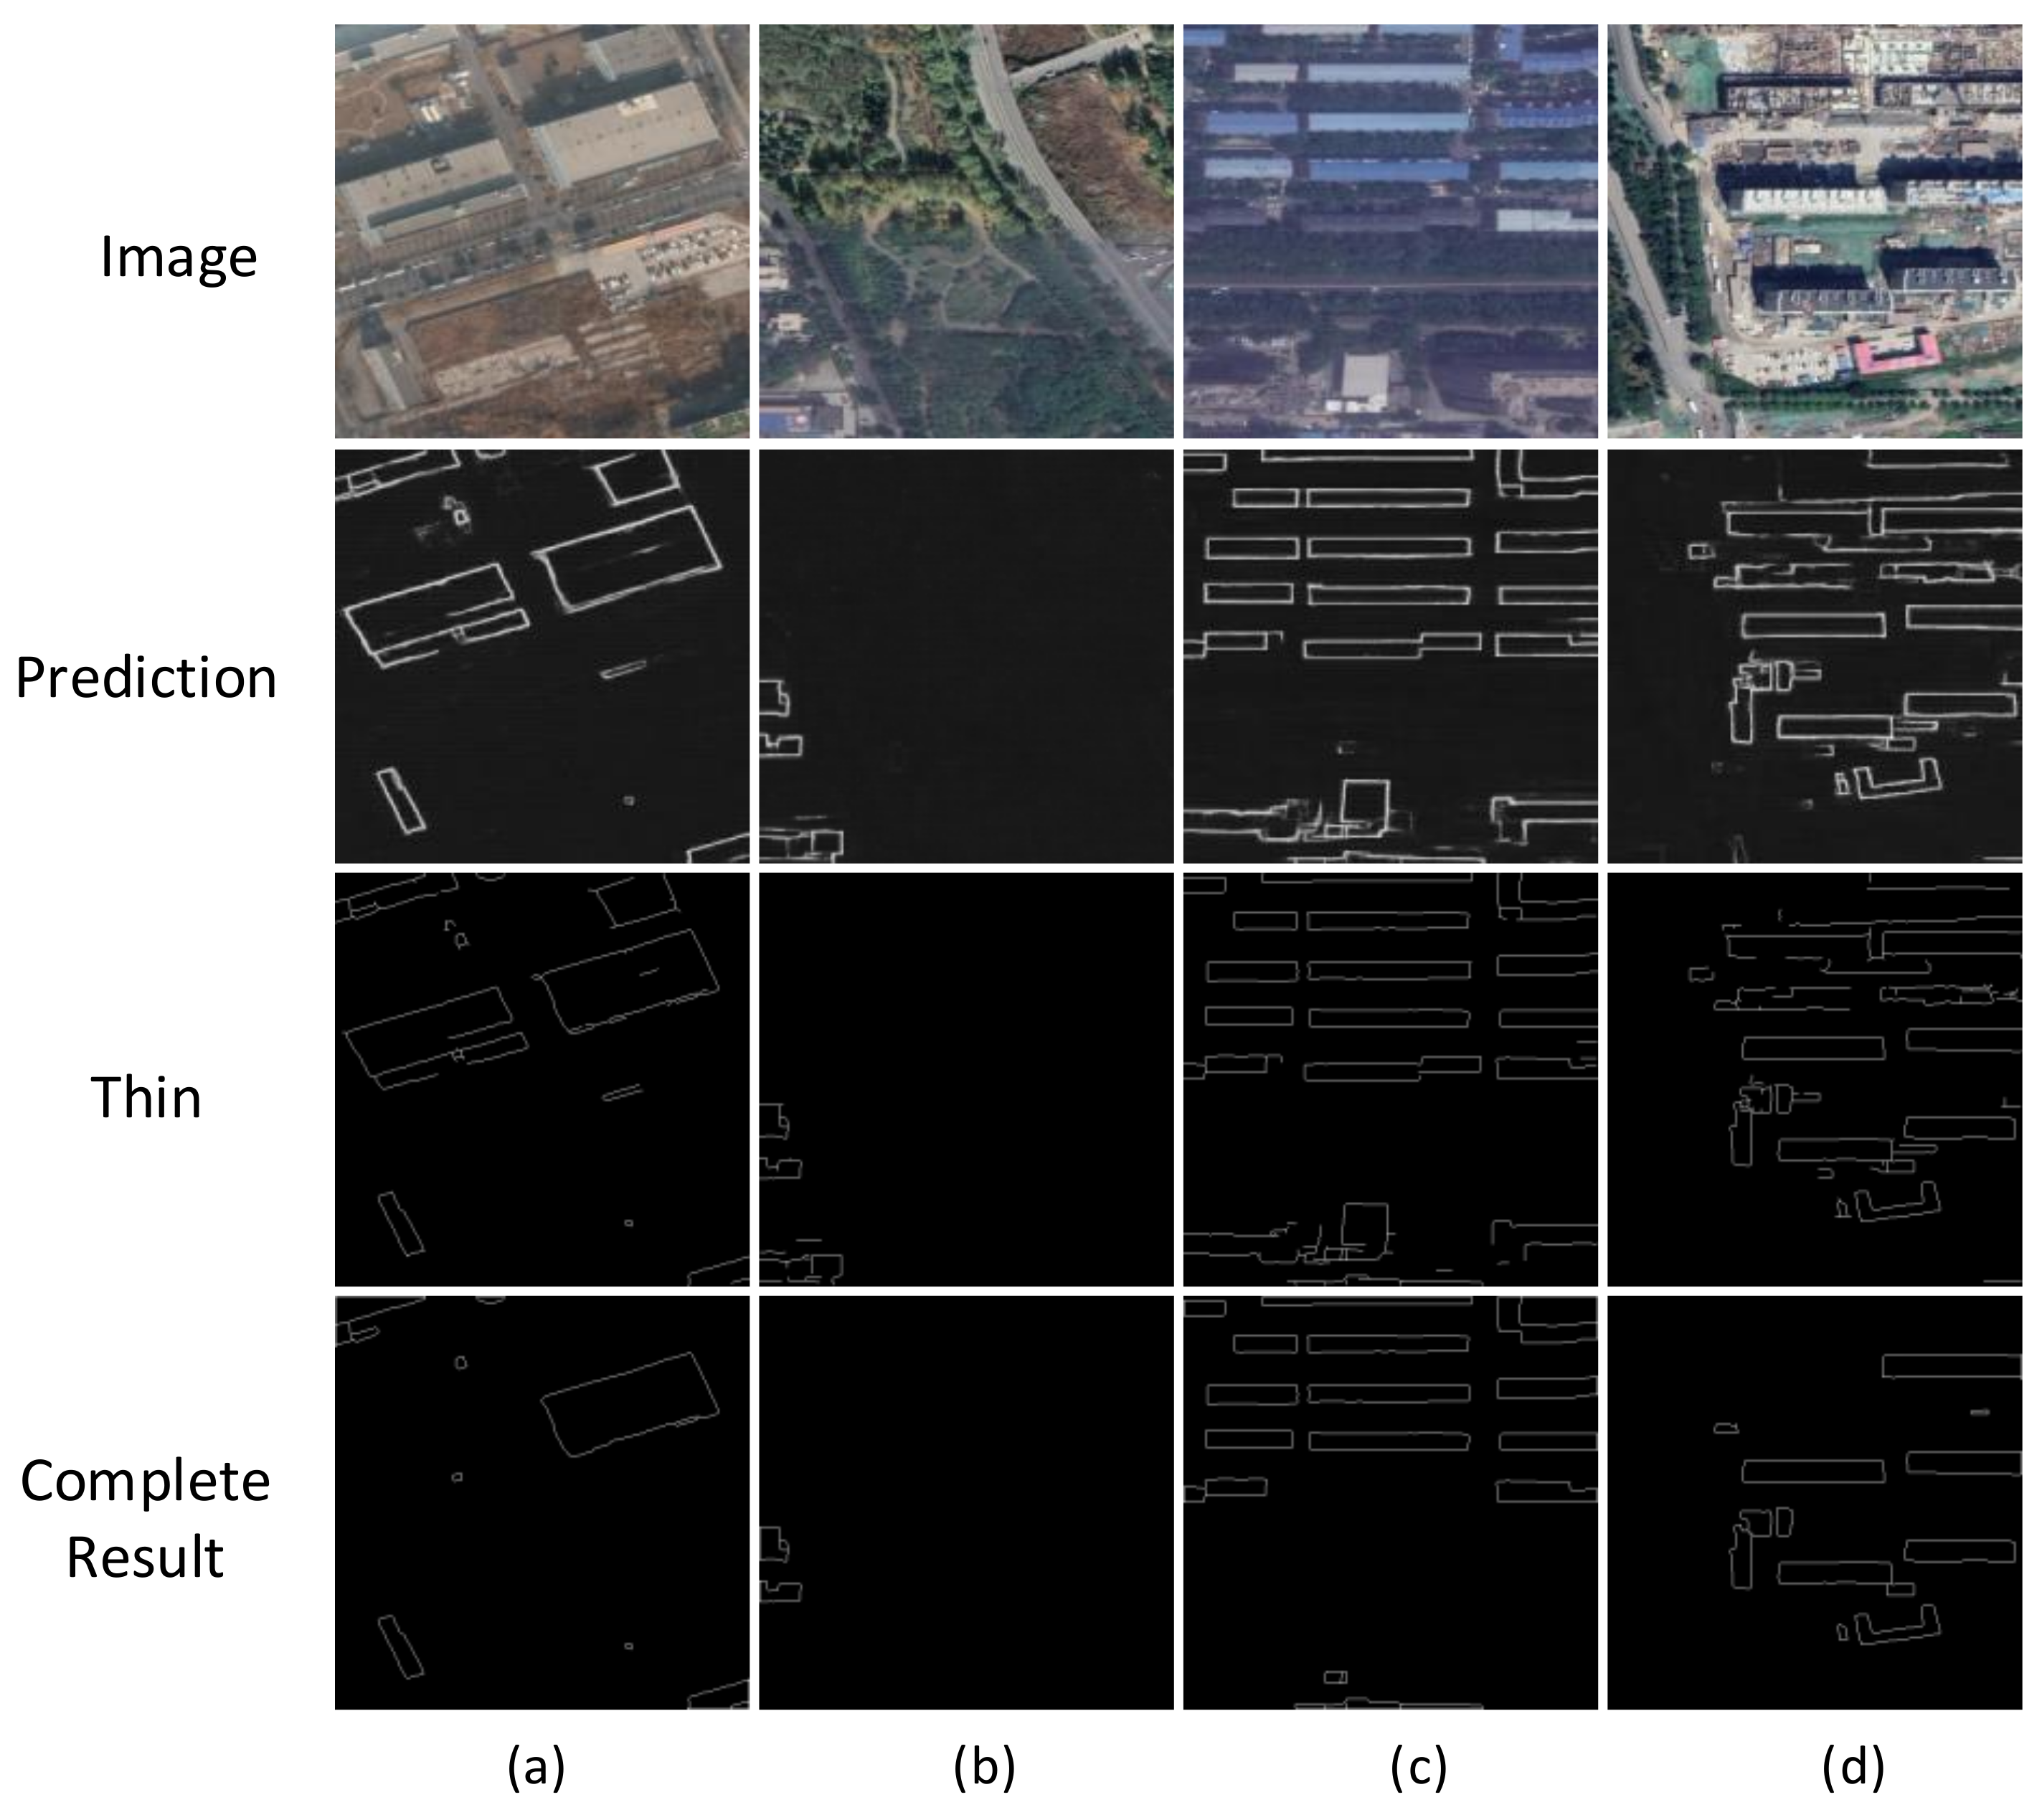
4.4.2. Effect of Edges in SDLED Prediction
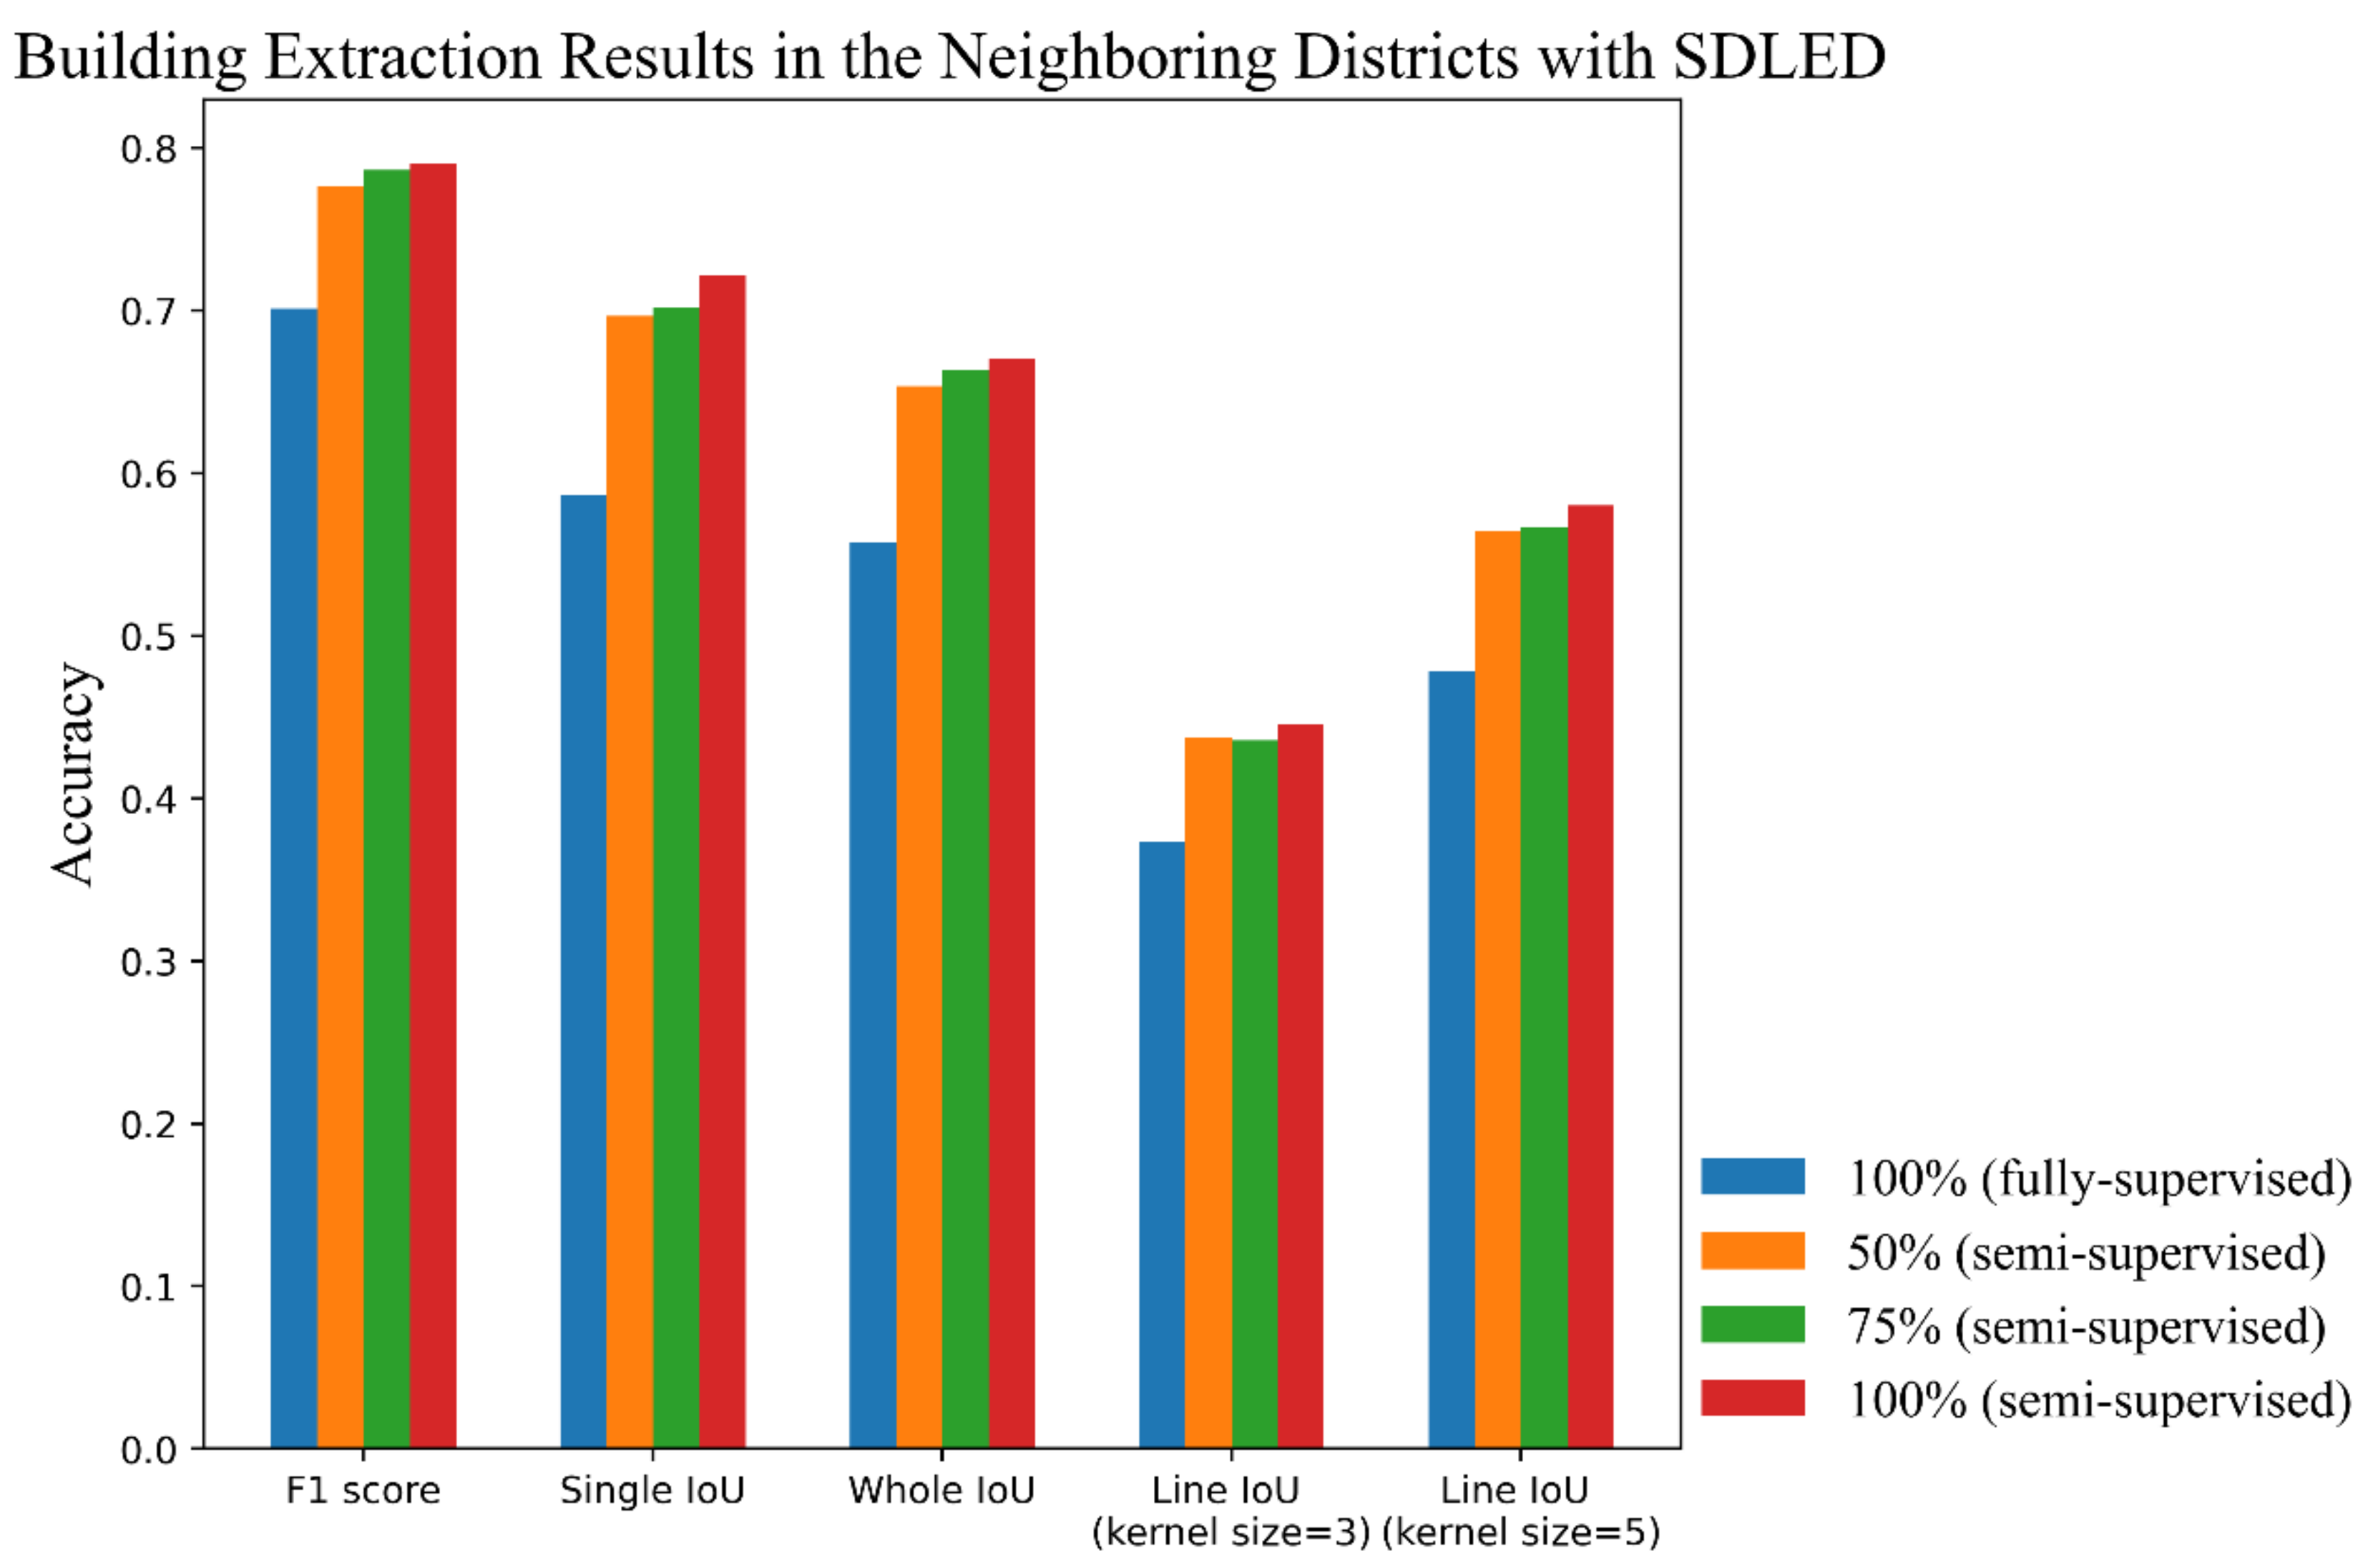
4.4.3. Generalization Ability Analysis in SDLED Prediction
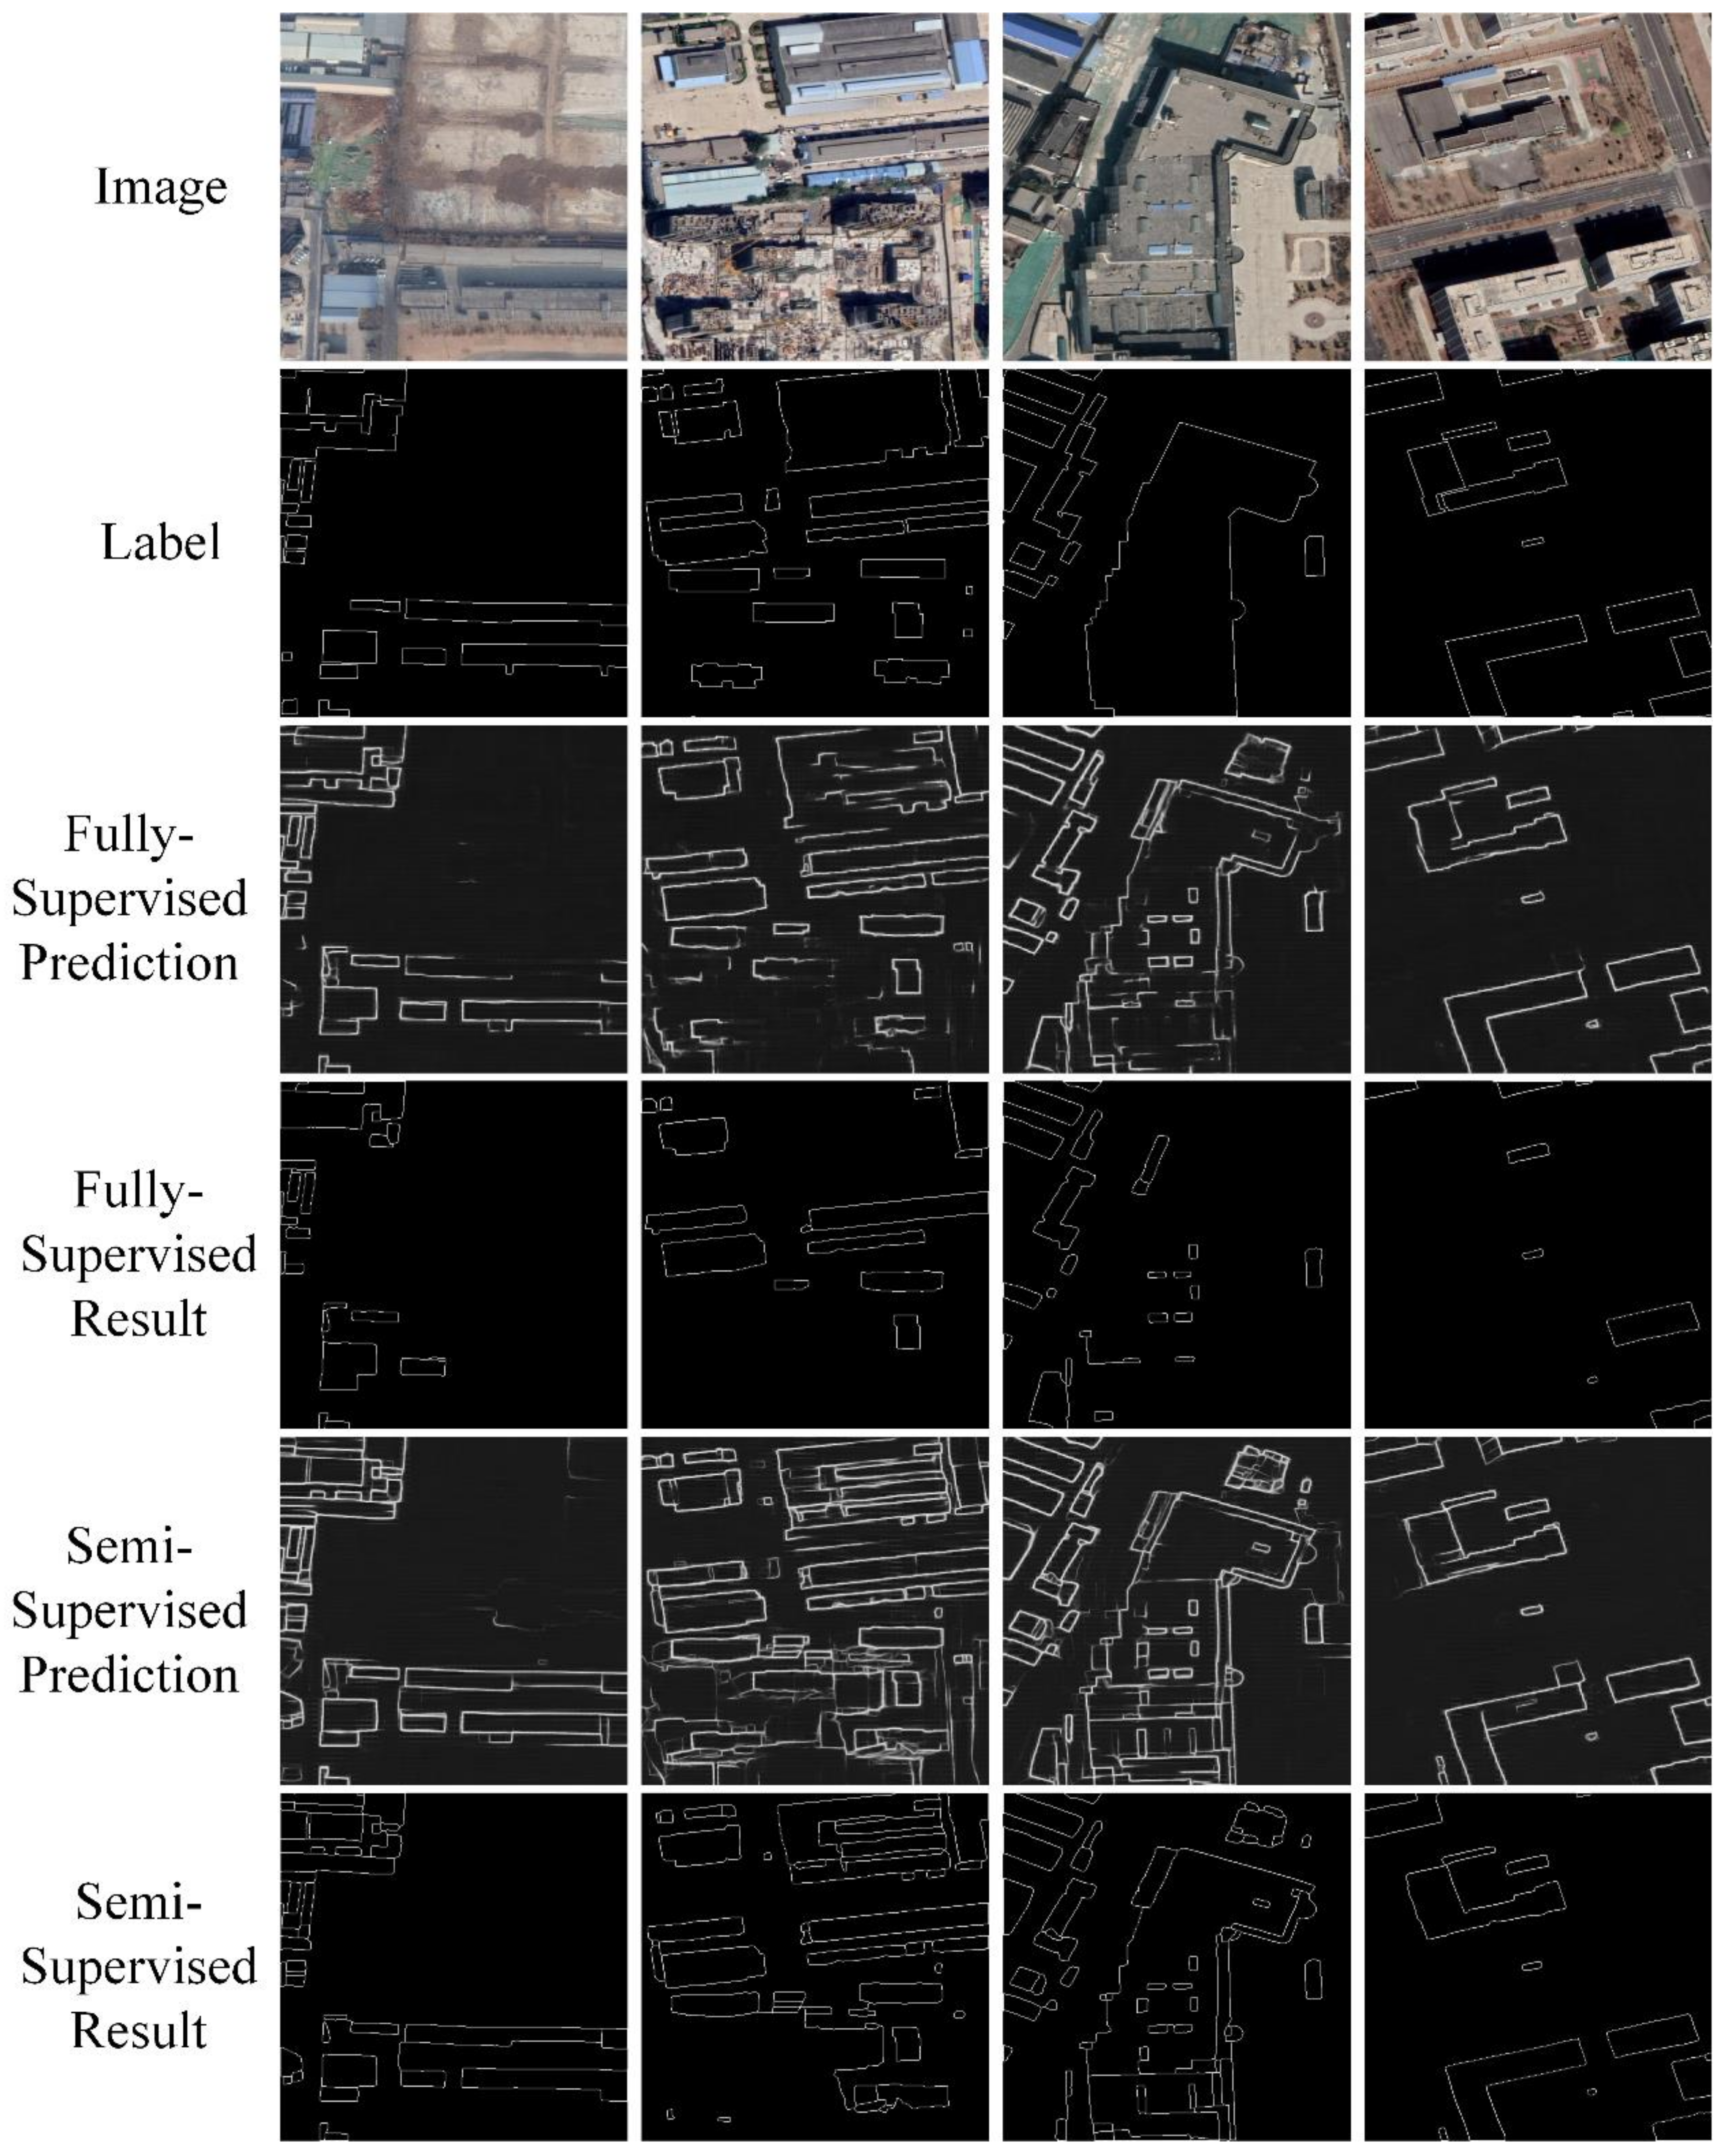
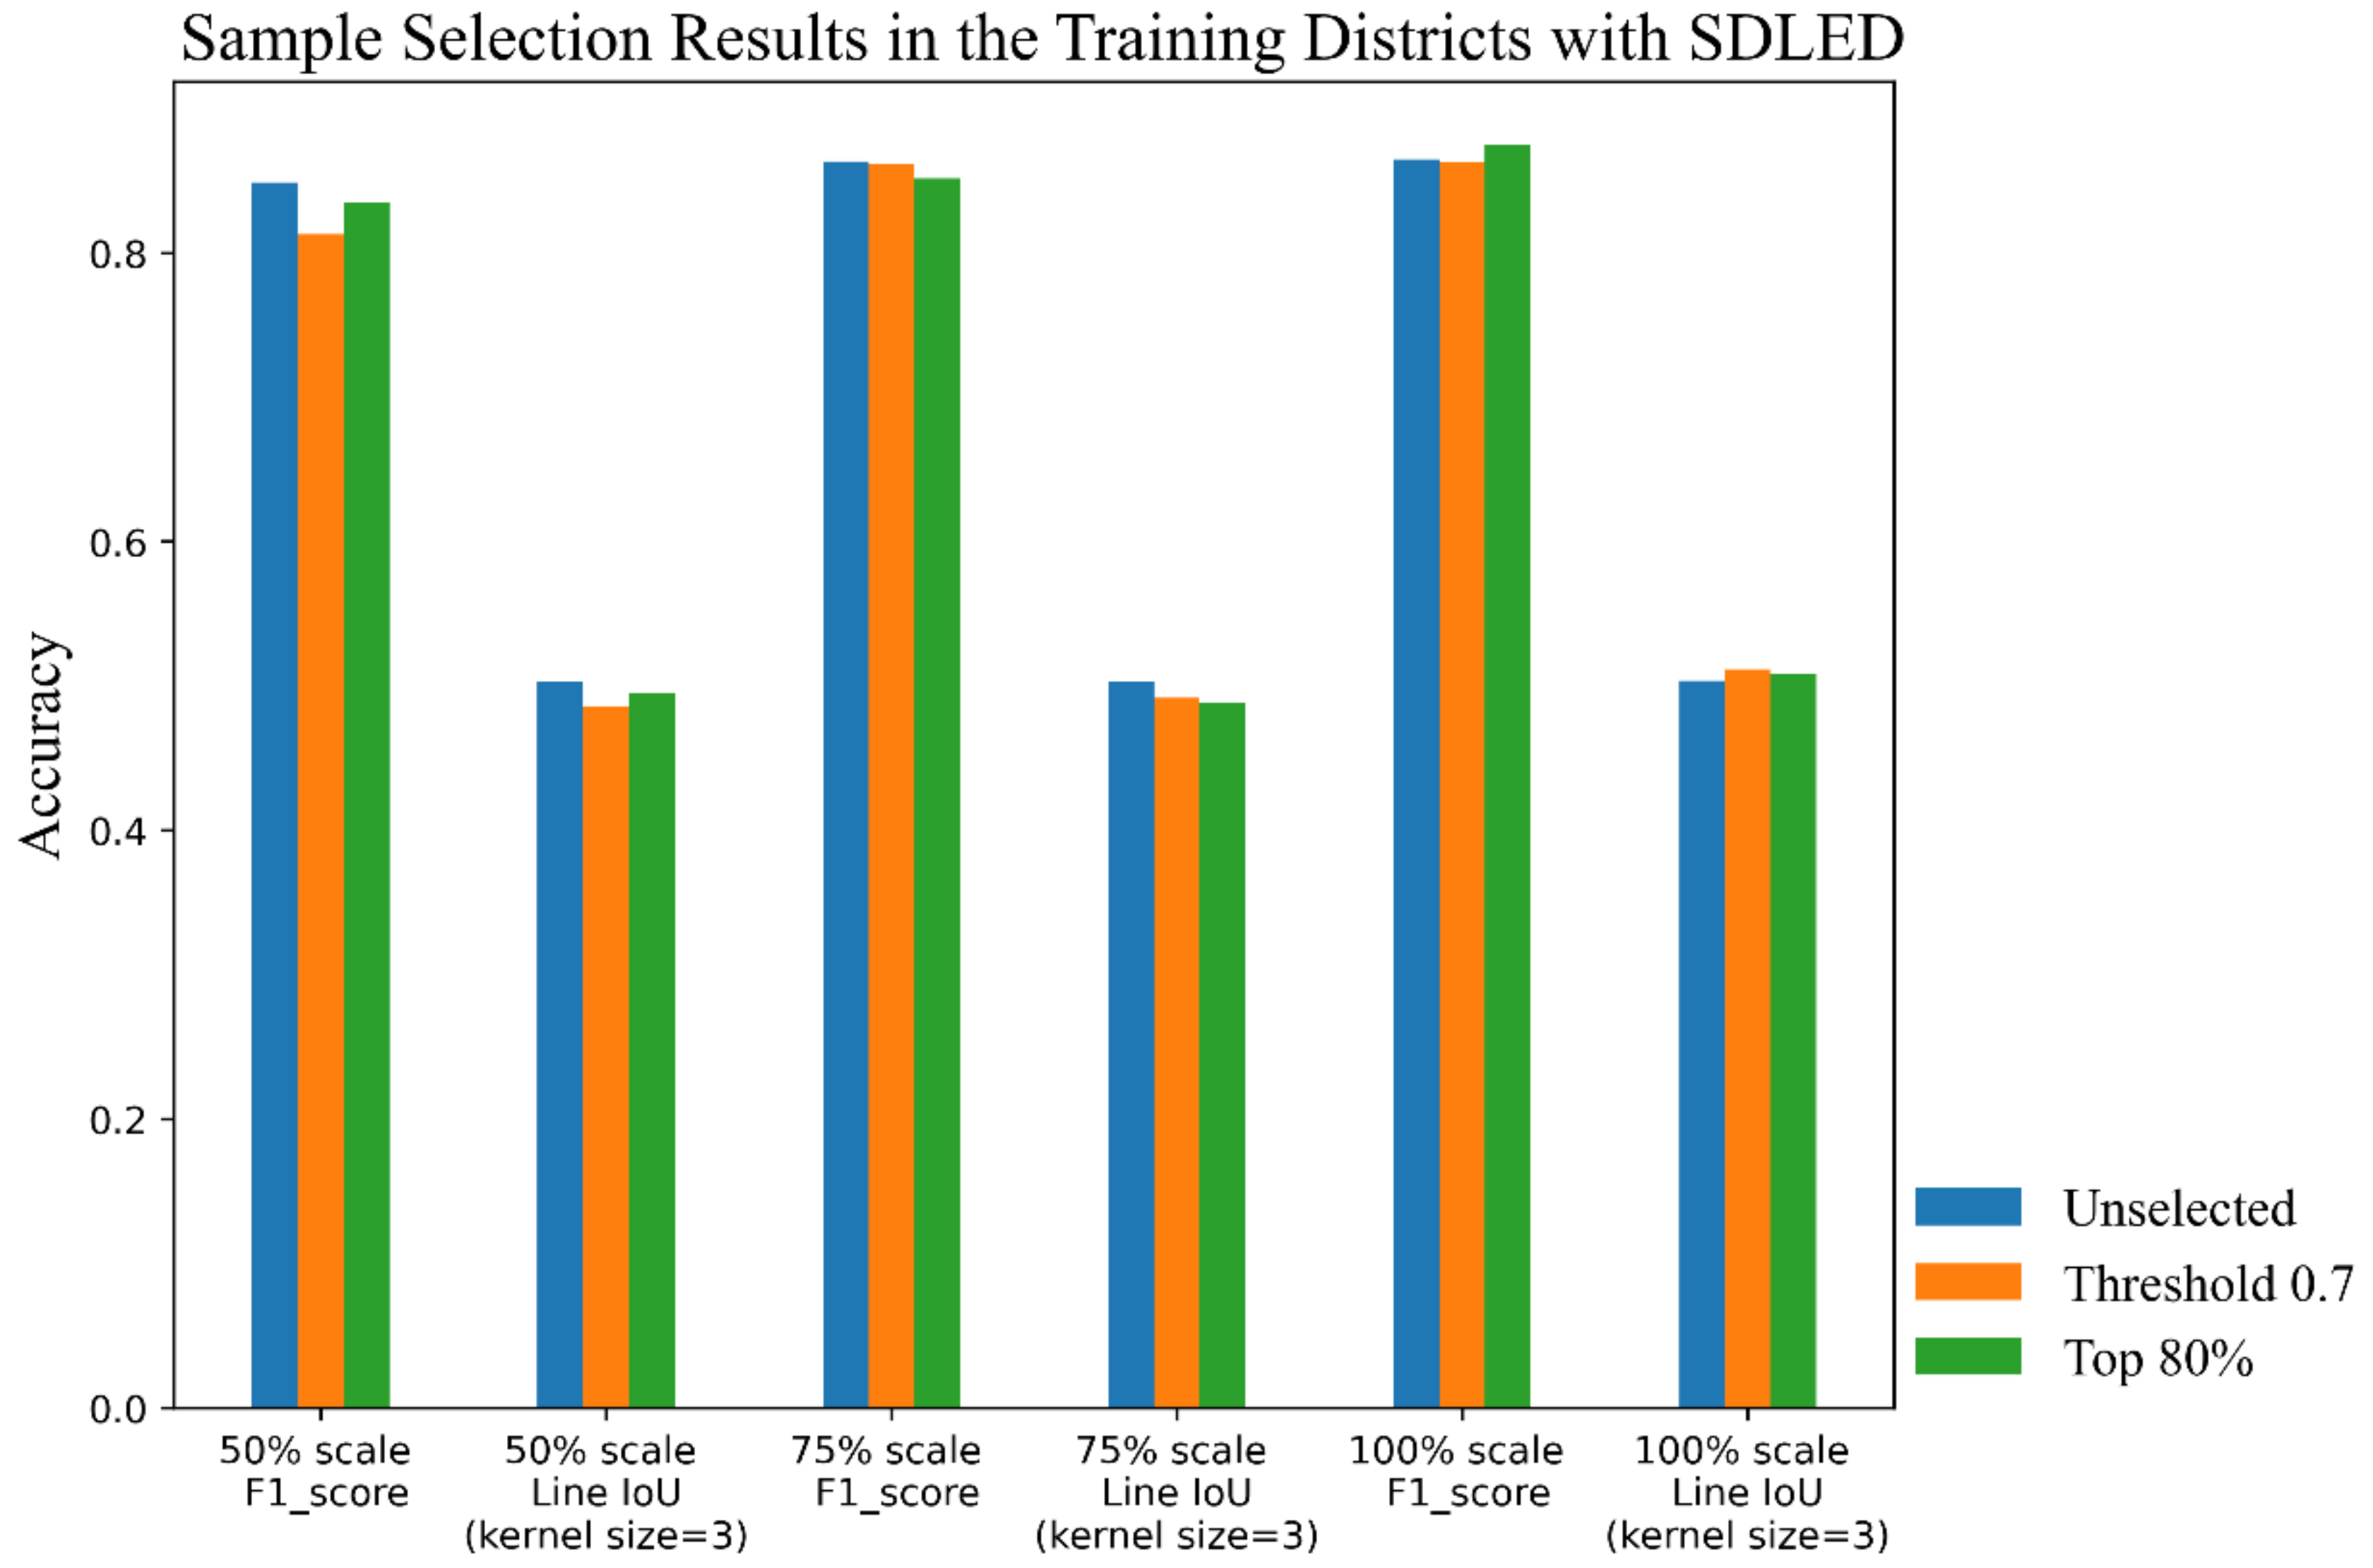
4.4.4. Sample Selection Method Analysis in Semi-Supervised Prediction
5. Discussion
6. Conclusions
Author Contributions
Funding
Institutional Review Board Statement
Informed Consent Statement
Data Availability Statement
Acknowledgments
Conflicts of Interest
Abbreviations
| BDCN | Bi-Directional Cascade Network |
| C-DPMM | Constrained Dirichlet process mixture model |
| CNN | Convolutional neural network |
| CRNN | Convolutional recursive neural network |
| DFF | Dynamic feature fusion |
| D-LinkNet | LinkNet with Pretrained Encoder and Dilated Convolution |
| FCN | Fully convolutional network |
| FER-CNN | Faster edge R-CNN |
| FN | False negatives |
| FP | False positives |
| GPU | Graphics processing unit |
| HED | The holistically nested edge detection network |
| HSI | Hyperspectral image |
| IoU | Intersection-over-Union |
| RCF | Richer convolutional features network |
| RDP | Ramer–Douglas–Peucker |
| ResNet | Residual network |
| SDLED | Semi-supervised deep learning approach based on the edge detection network |
| SEM | Scale enhancement module |
| SNNRCE | Self-training nearest neighbor rule using cut edges |
| TN | True negatives |
| TP | True positives |
| VHR | Very-High-Resolution |
| WTDS | Weighted ternary decision structure |
References
- Harirchian, E.; Hosseini, S.E.A.; Jadhav, K.; Kumari, V.; Rasulzade, S.; Işık, E.; Wasif, M.; Lahmer, T. A Review on Application of Soft Computing Techniques for the Rapid Visual Safety Evaluation and Damage Classification of Existing Buildings. J. Build. Eng. 2021, 102536. [Google Scholar] [CrossRef]
- Valentijn, T.; Margutti, J.; van den Homberg, M.; Laaksonen, J. Multi-hazard and spatial transferability of a cnn for automated building damage assessment. Remote Sens. 2020, 12, 2839. [Google Scholar] [CrossRef]
- Bai, Y.; Hu, J.; Su, J.; Liu, X.; Liu, H.; He, X.; Meng, S.; Mas, E.; Koshimura, S. Pyramid Pooling Module-Based Semi-Siamese Network: A Benchmark Model for Assessing Building Damage from xBD Satellite Imagery Datasets. Remote Sens. 2020, 12, 4055. [Google Scholar] [CrossRef]
- Xu, S.; Noh, H.Y. PhyMDAN: Physics-informed knowledge transfer between buildings for seismic damage diagnosis through adversarial learning. Mech. Syst. Signal Process. 2021, 151, 107374. [Google Scholar] [CrossRef]
- Cerovecki, A.; Gharahjeh, S.; Harirchian, E.; Ilin, D.; Okhotnikova, K.; Kersten, J. Evaluation of Change Detection Techniques using Very High Resolution Optical Satellite Imagery. Preface 2015, 2, 20. [Google Scholar]
- Schlosser, A.D.; Szabó, G.; Bertalan, L.; Varga, Z.; Enyedi, P.; Szabó, S. Building extraction using orthophotos and dense point cloud derived from visual band aerial imagery based on machine learning and segmentation. Remote Sens. 2020, 12, 2397. [Google Scholar] [CrossRef]
- Reda, K.; Kedzierski, M. Detection, Classification and Boundary Regularization of Buildings in Satellite Imagery Using Faster Edge Region Convolutional Neural Networks. Remote Sens. 2020, 12, 2240. [Google Scholar] [CrossRef]
- Zhang, F.; Du, B.; Zhang, L. Saliency-guided unsupervised feature learning for scene classification. IEEE Trans. Geosci. Remote Sens. 2014, 53, 2175–2184. [Google Scholar] [CrossRef]
- Huang, X.; Cao, Y.; Li, J. An automatic change detection method for monitoring newly constructed building areas using time-series multi-view high-resolution optical satellite images. Remote Sens. Environ. 2020, 244, 111802. [Google Scholar] [CrossRef]
- Liu, C.; Huang, X.; Zhu, Z.; Chen, H.; Tang, X.; Gong, J. Automatic extraction of built-up area from ZY3 multi-view satellite imagery: Analysis of 45 global cities. Remote Sens. Environ. 2019, 226, 51–73. [Google Scholar] [CrossRef]
- Anniballe, R.; Noto, F.; Scalia, T.; Bignami, C.; Stramondo, S.; Chini, M.; Pierdicca, N. Earthquake damage mapping: An overall assessment of ground surveys and VHR image change detection after L’Aquila 2009 earthquake. Remote Sens. Environ. 2018, 210, 166–178. [Google Scholar] [CrossRef]
- Dong, Y.; Zhang, L.; Cui, X.; Ai, H.; Xu, B. Extraction of buildings from multiple-view aerial images using a feature-level-fusion strategy. Remote Sens. 2018, 10, 1947. [Google Scholar] [CrossRef]
- Zhang, X.; Cui, J.; Wang, W.; Lin, C. A study for texture feature extraction of high-resolution satellite images based on a direction measure and gray level co-occurrence matrix fusion algorithm. Sensors 2017, 17, 1474. [Google Scholar] [CrossRef]
- Hossain, M.D.; Chen, D. Segmentation for Object-Based Image Analysis (OBIA): A review of algorithms and challenges from remote sensing perspective. ISPRS J. Photogramm. Remote Sens. 2019, 150, 115–134. [Google Scholar] [CrossRef]
- Hu, Y.; Guo, F. Building Extraction Using Mask Scoring R-CNN Network. In Proceedings of the 3rd International Conference on Computer Science and Application Engineering, Sanya, China, 22–24 October 2019; pp. 1–5. [Google Scholar]
- Xie, S.; Tu, Z. Holistically-nested edge detection. In Proceedings of the IEEE International Conference on Computer Vision, Santiago, Chile, 7–13 December 2015; pp. 1395–1403. [Google Scholar]
- He, K.; Gkioxari, G.; Dollár, P.; Girshick, R. Mask r-cnn. In Proceedings of the IEEE International Conference on Computer Vision, Venice, Italy, 22–29 October 2017; pp. 2961–2969. [Google Scholar]
- Redmon, J.; Divvala, S.; Girshick, R.; Farhadi, A. You only look once: Unified, real-time object detection. In Proceedings of the IEEE Conference on Computer Vision and Pattern Recognition, Las Vegas, NV, USA, 27–30 June 2016; pp. 779–788. [Google Scholar]
- Lu, T.; Ming, D.; Lin, X.; Hong, Z.; Bai, X.; Fang, J. Detecting building edges from high spatial resolution remote sensing imagery using richer convolution features network. Remote Sens. 2018, 10, 1496. [Google Scholar] [CrossRef]
- Yuan, J. Learning building extraction in aerial scenes with convolutional networks. IEEE Trans. Pattern Anal. Mach. Intell. 2017, 40, 2793–2798. [Google Scholar] [CrossRef] [PubMed]
- Fang, B.; Li, Y.; Zhang, H.; Chan, J.C.-W. Semi-supervised deep learning classification for hyperspectral image based on dual-strategy sample selection. Remote Sens. 2018, 10, 574. [Google Scholar] [CrossRef]
- Triguero, I.; García, S.; Herrera, F. Self-labeled techniques for semi-supervised learning: Taxonomy, software and empirical study. Knowl. Inf. Syst. 2015, 42, 245–284. [Google Scholar] [CrossRef]
- Li, M.; Zhou, Z.-H. Improve computer-aided diagnosis with machine learning techniques using undiagnosed samples. IEEE Trans. Syst. Man Cybern. Part A Syst. Hum. 2007, 37, 1088–1098. [Google Scholar] [CrossRef]
- Wang, Y.; Xu, X.; Zhao, H.; Hua, Z. Semi-supervised learning based on nearest neighbor rule and cut edges. Knowl. Based Syst. 2010, 23, 547–554. [Google Scholar] [CrossRef]
- Saigal, P.; Rastogi, R.; Chandra, S. Semi-supervised Weighted Ternary Decision Structure for Multi-category Classification. Neural Process. Lett. 2020, 52, 1555–1582. [Google Scholar] [CrossRef]
- Han, W.; Feng, R.; Wang, L.; Cheng, Y. A semi-supervised generative framework with deep learning features for high-resolution remote sensing image scene classification. ISPRS J. Photogramm. Remote Sens. 2018, 145, 23–43. [Google Scholar] [CrossRef]
- Wu, H.; Prasad, S. Semi-supervised deep learning using pseudo labels for hyperspectral image classification. IEEE Trans. Image Process. 2017, 27, 1259–1270. [Google Scholar] [CrossRef] [PubMed]
- Lee, D.-H. Pseudo-label: The simple and efficient semi-supervised learning method for deep neural networks. In Proceedings of the Workshop on Challenges in Representation Learning ICML, Atlanta, GA, USA, 16–21 June 2013. [Google Scholar]
- Ji, S.; Wei, S.; Lu, M. A scale robust convolutional neural network for automatic building extraction from aerial and satellite imagery. Int. J. Remote Sens. 2019, 40, 3308–3322. [Google Scholar] [CrossRef]
- Bischke, B.; Helber, P.; Folz, J.; Borth, D.; Dengel, A. Multi-task learning for segmentation of building footprints with deep neural networks. In Proceedings of the 2019 IEEE International Conference on Image Processing (ICIP), Taipei, Taiwan, 22–25 September 2019; pp. 1480–1484. [Google Scholar]
- Liu, Y.; Cheng, M.-M.; Hu, X.; Wang, K.; Bai, X. Richer convolutional features for edge detection. In Proceedings of the IEEE Conference on Computer Vision and Pattern Recognition, Honolulu, HI, USA, 21–26 July 2017; pp. 3000–3009. [Google Scholar]
- Hu, Y.; Chen, Y.; Li, X.; Feng, J. Dynamic feature fusion for semantic edge detection. arXiv 2019, arXiv:1902.09104. [Google Scholar]
- He, J.; Zhang, S.; Yang, M.; Shan, Y.; Huang, T. Bi-directional cascade network for perceptual edge detection. In Proceedings of the IEEE/CVF Conference on Computer Vision and Pattern Recognition, Long Beach, CA, USA, 15–20 June 2019; pp. 3828–3837. [Google Scholar]
- Li, Y.; Chen, J.; Xie, X.; Ma, K.; Zheng, Y. Self-Loop Uncertainty: A Novel Pseudo-Label for Semi-supervised Medical Image Segmentation. In Proceedings of the International Conference on Medical Image Computing and Computer-Assisted Intervention, Lima, Peru, 4–8 October 2020; pp. 614–623. [Google Scholar]
- Zhou, L.; Zhang, C.; Wu, M. D-linknet: Linknet with pretrained encoder and dilated convolution for high resolution satellite imagery road extraction. In Proceedings of the IEEE Conference on Computer Vision and Pattern Recognition Workshops, Salt Lake City, UT, USA, 18–22 June 2018; pp. 182–186. [Google Scholar]
- Xia, L.; Zhang, X.; Zhang, J.; Wu, W.; Gao, X. Refined extraction of buildings with the semantic edge-assisted approach from very high-resolution remotely sensed imagery. Int. J. Remote Sens. 2020, 41, 8352–8365. [Google Scholar] [CrossRef]


| Sample Scale | F1 Score | Single IoU | Whole IoU | Line IoU (Kernel = 3) | Line IoU (Kernel = 5) |
|---|---|---|---|---|---|
| 25% | 0.7151 | 0.5723 | 0.5556 | 0.4038 | 0.4891 |
| 50% | 0.7828 | 0.6380 | 0.6311 | 0.4553 | 0.5515 |
| 75% | 0.8388 | 0.6842 | 0.7046 | 0.4825 | 0.5871 |
| 100% | 0.8419 | 0.7065 | 0.7111 | 0.5089 | 0.6152 |
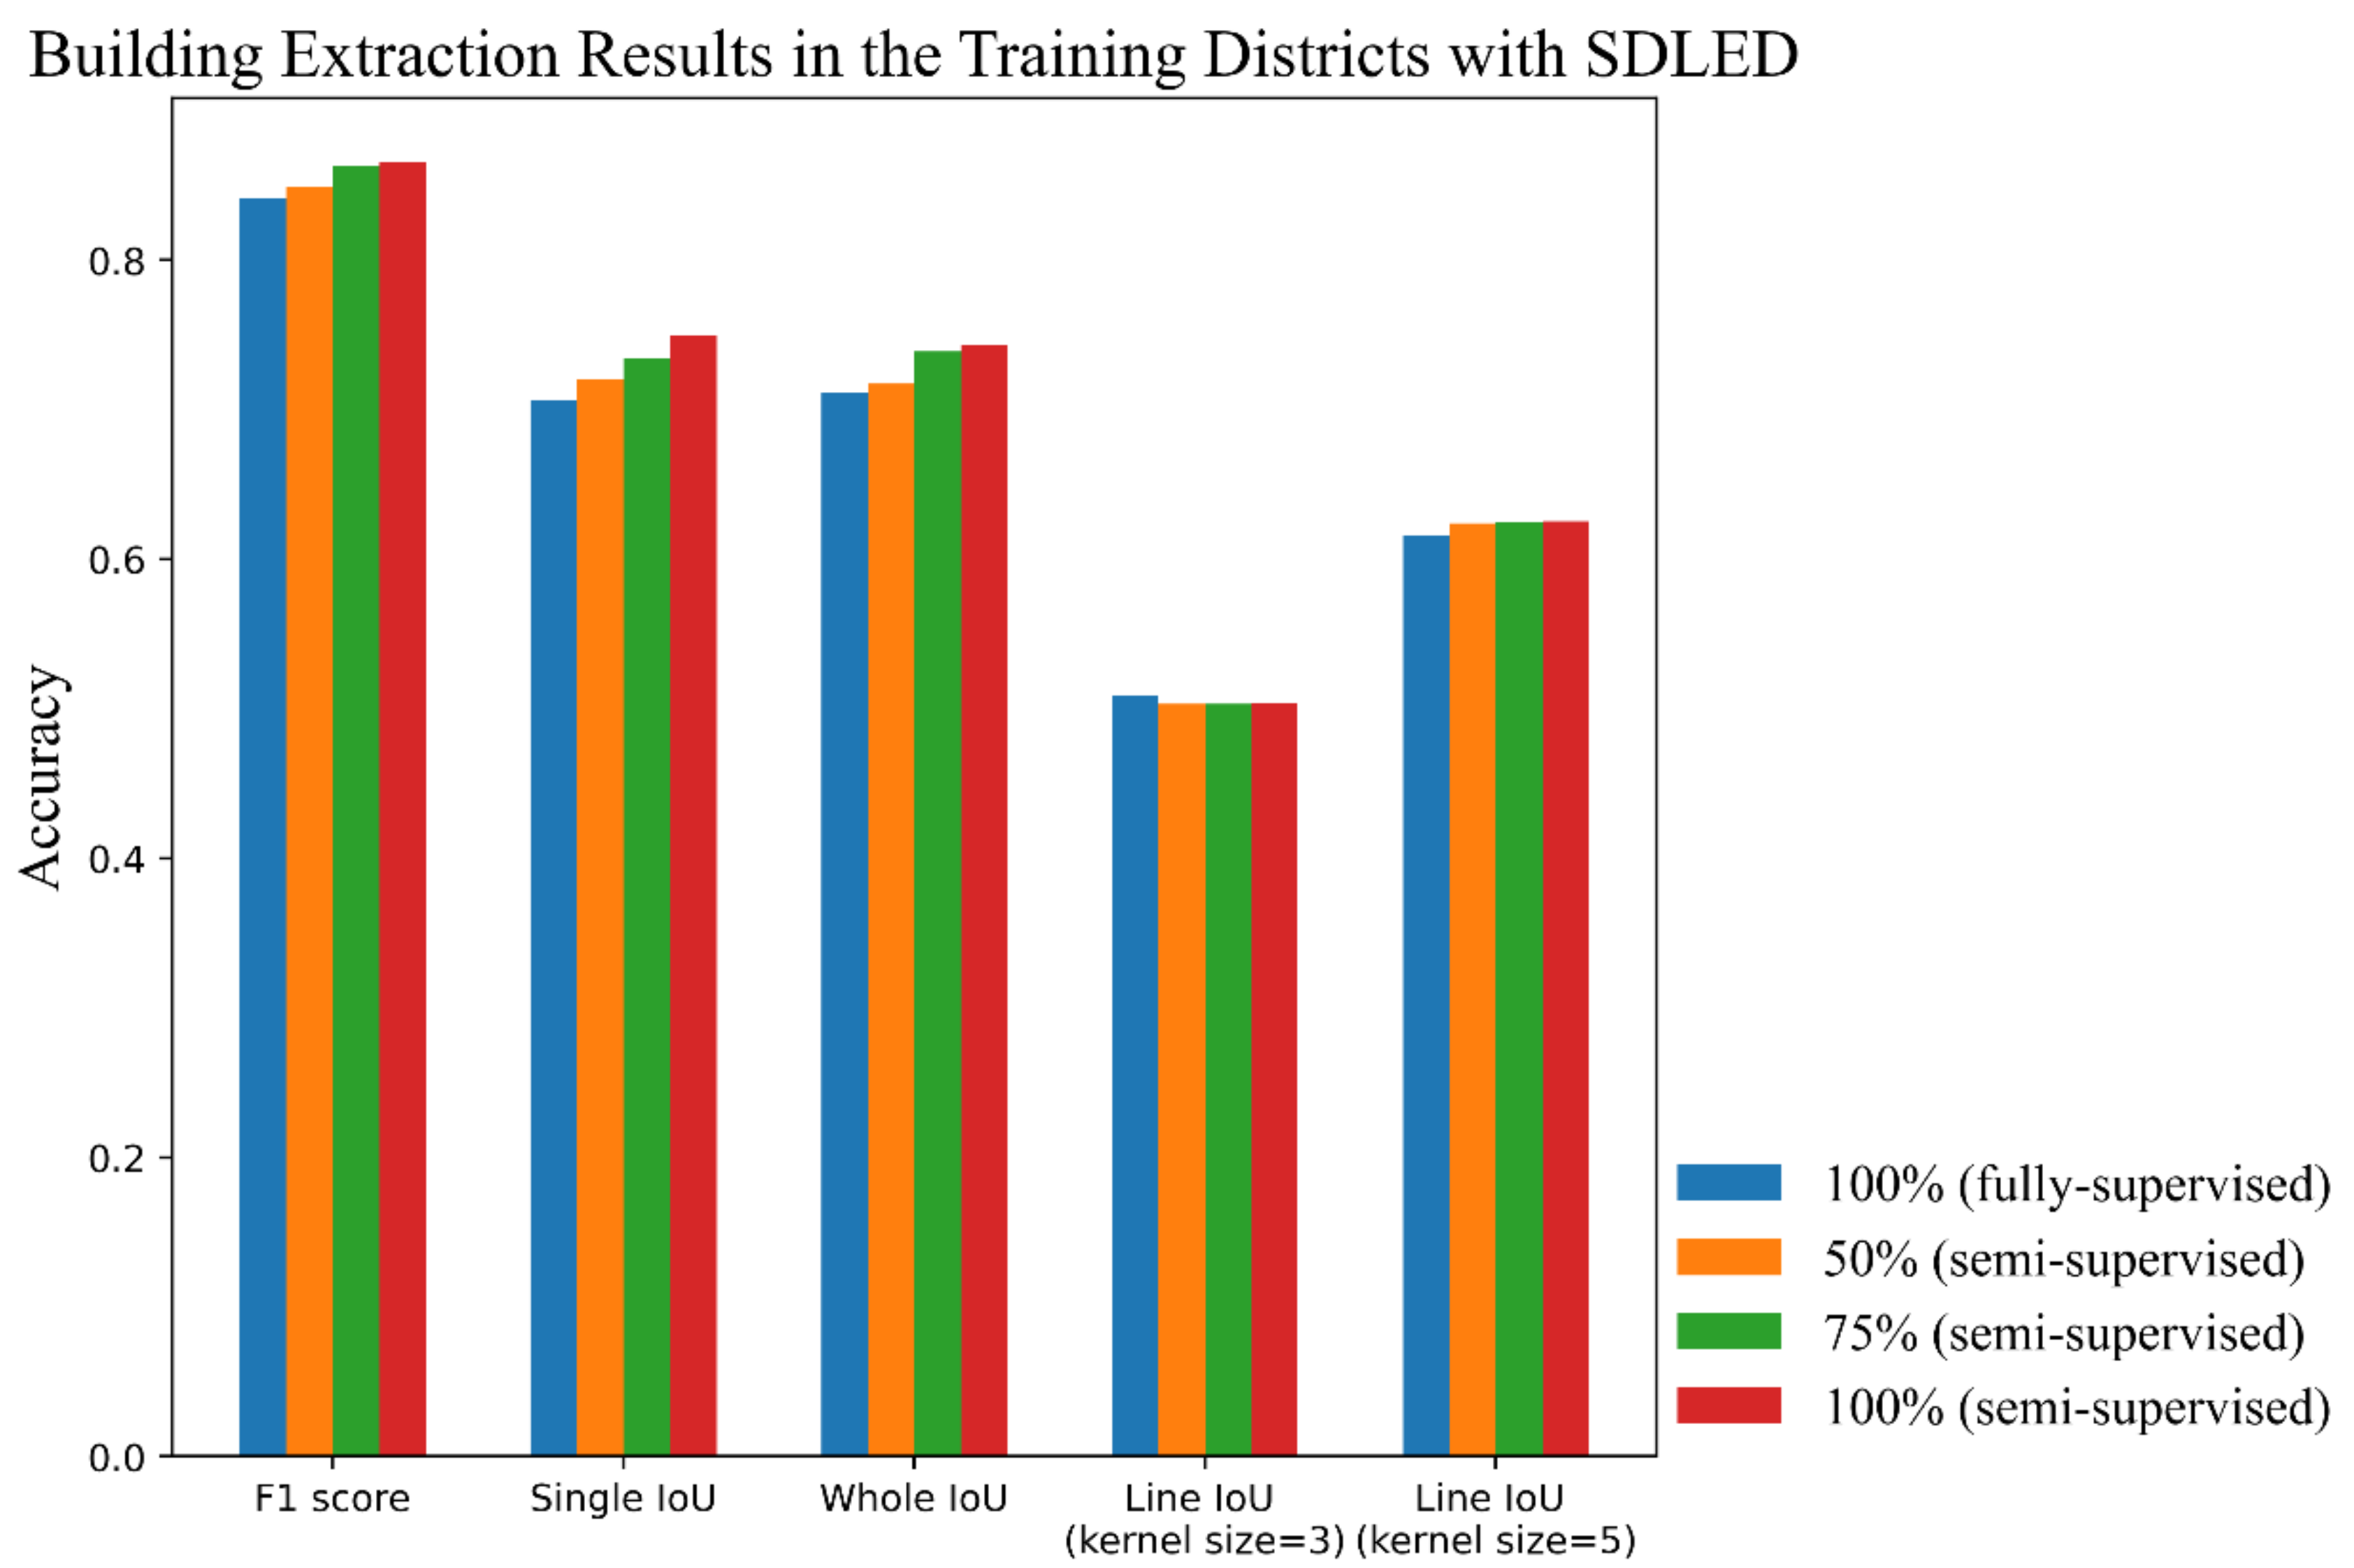
| Network | Sample Scale | ||||
|---|---|---|---|---|---|
| 100% (Fully) | 50% (Semi) | 75% (Semi) | 100% (Semi) | ||
| BDCN | F1 score | 0.5362 | 0.6267 | 0.6613 | 0.7014 |
| Single IoU | 0.4043 | 0.4950 | 0.5254 | 0.5509 | |
| Whole IoU | 0.3941 | 0.4866 | 0.5281 | 0.5724 | |
| Line IoU (kernel = 3) | 0.3233 | 0.3337 | 0.3503 | 0.3676 | |
| Line IoU (kernel = 5) | 0.3849 | 0.4281 | 0.4487 | 0.4706 | |
| Ours | F1 score | 0.8419 | 0.8490 | 0.8632 | 0.8650 |
| Single IoU | 0.7065 | 0.7204 | 0.7346 | 0.7495 | |
| Whole IoU | 0.7111 | 0.7175 | 0.7391 | 0.7436 | |
| Line IoU (kernel = 3) | 0.5089 | 0.5030 | 0.5033 | 0.5037 | |
| Line IoU (kernel = 5) | 0.6152 | 0.6240 | 0.6243 | 0.6255 | |
| Sample Scale | F1 Score | Single IoU | Whole IoU | Line IoU (Kernel = 3) | Line IoU (Kernel = 5) |
|---|---|---|---|---|---|
| 100% (fully supervised) | 0.7013 | 0.5867 | 0.5573 | 0.3732 | 0.4787 |
| 50% (semi-supervised) | 0.7762 | 0.6969 | 0.6535 | 0.4379 | 0.5648 |
| 75% (semi-supervised) | 0.7867 | 0.7021 | 0.6634 | 0.4357 | 0.5667 |
| 100% (semi-supervised) | 0.7901 | 0.7216 | 0.6710 | 0.4452 | 0.5801 |
| Sample Selection Mechanism | Sample Scale | |||
|---|---|---|---|---|
| 50% | 75% | 100% | ||
| Unselected | F1 score | 0.849 | 0.8632 | 0.865 |
| Single IoU | 0.7204 | 0.7346 | 0.7495 | |
| Whole IoU | 0.7175 | 0.7391 | 0.7436 | |
| Line IoU (kernel = 3) | 0.503 | 0.5033 | 0.5037 | |
| Line IoU (kernel = 5) | 0.624 | 0.6243 | 0.6255 | |
| Threshold 0.7 | F1 score | 0.8128 | 0.8618 | 0.8628 |
| Single IoU | 0.7195 | 0.7361 | 0.7563 | |
| Whole IoU | 0.7087 | 0.7375 | 0.7398 | |
| Line IoU (kernel = 3) | 0.486 | 0.4917 | 0.5114 | |
| Line IoU (kernel = 5) | 0.6004 | 0.6129 | 0.6369 | |
| Top 80% | F1 score | 0.8349 | 0.8515 | 0.8746 |
| Single IoU | 0.7331 | 0.7416 | 0.7511 | |
| Whole IoU | 0.7176 | 0.722 | 0.7561 | |
| Line IoU (kernel = 3) | 0.495 | 0.4883 | 0.5088 | |
| Line IoU (kernel = 5) | 0.6129 | 0.613 | 0.6317 | |
Publisher’s Note: MDPI stays neutral with regard to jurisdictional claims in published maps and institutional affiliations. |
© 2021 by the authors. Licensee MDPI, Basel, Switzerland. This article is an open access article distributed under the terms and conditions of the Creative Commons Attribution (CC BY) license (https://creativecommons.org/licenses/by/4.0/).
Share and Cite
Xia, L.; Zhang, X.; Zhang, J.; Yang, H.; Chen, T. Building Extraction from Very-High-Resolution Remote Sensing Images Using Semi-Supervised Semantic Edge Detection. Remote Sens. 2021, 13, 2187. https://doi.org/10.3390/rs13112187
Xia L, Zhang X, Zhang J, Yang H, Chen T. Building Extraction from Very-High-Resolution Remote Sensing Images Using Semi-Supervised Semantic Edge Detection. Remote Sensing. 2021; 13(11):2187. https://doi.org/10.3390/rs13112187
Chicago/Turabian StyleXia, Liegang, Xiongbo Zhang, Junxia Zhang, Haiping Yang, and Tingting Chen. 2021. "Building Extraction from Very-High-Resolution Remote Sensing Images Using Semi-Supervised Semantic Edge Detection" Remote Sensing 13, no. 11: 2187. https://doi.org/10.3390/rs13112187
APA StyleXia, L., Zhang, X., Zhang, J., Yang, H., & Chen, T. (2021). Building Extraction from Very-High-Resolution Remote Sensing Images Using Semi-Supervised Semantic Edge Detection. Remote Sensing, 13(11), 2187. https://doi.org/10.3390/rs13112187