Abstract
We introduce a novel ultra-high-resolution Digital Terrain Model (DTM) processing system using a combination of photogrammetric 3D reconstruction, image co-registration, image super-resolution restoration, shape-from-shading DTM refinement, and 3D co-alignment methods. Technical details of the method are described, and results are demonstrated using a 4 m/pixel Trace Gas Orbiter Colour and Stereo Surface Imaging System (CaSSIS) panchromatic image and an overlapping 6 m/pixel Mars Reconnaissance Orbiter Context Camera (CTX) stereo pair to produce a 1 m/pixel CaSSIS Super-Resolution Restoration (SRR) DTM for different areas over Oxia Planum on Mars—the future ESA ExoMars 2022 Rosalind Franklin rover’s landing site. Quantitative assessments are made using profile measurements and the counting of resolvable craters, in comparison with the publicly available 1 m/pixel High-Resolution Imaging Experiment (HiRISE) DTM. These assessments demonstrate that the final resultant 1 m/pixel CaSSIS DTM from the proposed processing system has achieved comparable and sometimes more detailed 3D reconstruction compared to the overlapping HiRISE DTM.
1. Introduction
Over the last 50 years, mankind’s knowledge of Mars has greatly increased as a direct result of the various orbital and robotic missions. Since the early 1970s, digital imaging sensors aboard these missions have been pivotal, because they not only show what the surfaces look like but also can provide three-dimensional (3D) information. Over that time period, the resolution and quality of orbital imagery has improved from hundreds of metres down to tens of centimetres. In parallel, through stereo and/or photoclinometry techniques, detailed surface feature studies can now be undertaken with 3D and terrain corrected imagery from multiple orbiting spacecraft.
In Europe, stereo acquisitions are now routine from sensors such as the European Space Agency (ESA) Mars Express High-Resolution Stereo Camera (HRSC) [1] or the ESA Trace Gas Orbiter’s Colour and Stereo Surface Imaging System (CaSSIS) [2], whereas the U.S. sensors, including the Mars Reconnaissance Orbiter’s Context Camera (CTX) [3] and the High-Resolution Imaging Experiment (HiRISE) [4], tend to acquire 3D information only from serendipitous repeat, off-nadir acquisitions. In particular, among the international community of planetary scientists, stereo-derived HiRISE Digital Terrain Models (DTMs), at metre-scale resolution [5], have been the most favoured source of 3D information for studying fine-scale features of the Martian surface.
However, the comparably limited global coverage of stereo HiRISE to date (<4% of Mars’ surface is imaged in mono) means that, for the vast majority of the Martian surface, there is a lack of high-resolution 3D information. In this work, we propose for CaSSIS imagery a novel ultra-high-resolution DTM processing chain using super-resolution restoration (SRR) coupled with the latest 3D modelling system employing a combination of photogrammetry and photoclinometry methods, i.e., Shape-from-Shading (SfS), from a slightly lower resolution imaging dataset such as CTX or HRSC, to retrieve compatible or even more detailed 3D information than stereo-derived 1 m/pixel HiRISE DTM.
The proposed DTM processing system uses a combination of photogrammetric 3D reconstruction, image co-registration, image SRR, SfS DTM refinement, and 3D co-alignment methods. In particular, for photogrammetric 3D reconstruction, we use the open-source Co-registered Ames Stereo Pipeline [6] with Gotcha matching [7] and Optimisations (CASP-GO) [8]. For image co-registration, we use an in-house mutual shape adaptive scale invariant feature transform (MSA-SIFT) algorithm that was described in [9]. For image SRR, we use the multi-scale adaptive-weighted residual super-resolution generative adversarial network (GAN) single-image SRR system (MARSGAN) described in [10]. For SfS DTM refinement, we use the HDEM algorithm described in [11,12]. Finally, for 3D co-alignment, we use the B-Spline fitting algorithm described in [13].
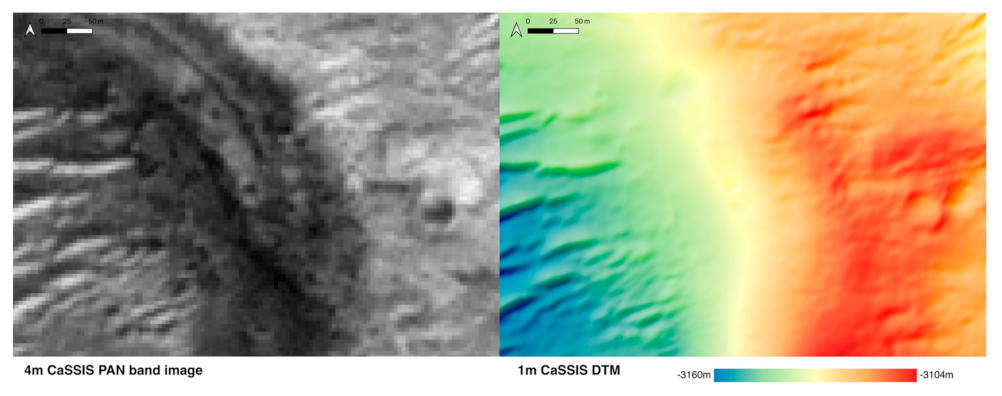
In this paper, we demonstrate the proposed DTM processing system with 4 m/pixel CaSSIS image crops and an 18 m/pixel stereo-derived CTX DTM to produce ~1 m/pixel CaSSIS DTMs over the ExoMars 2022 Rosalind Franklin [14] rover’s landing site, Oxia Planum [15]. A cropped example of the 4 m/pixel CaSSIS image (panchromatic band) and our DTM result (colourised and hill-shaded) is shown in Figure 1.
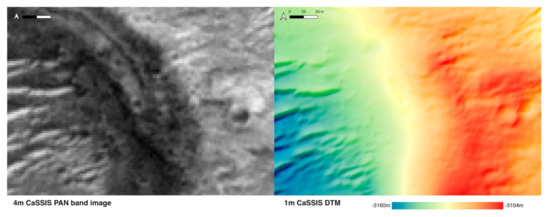
Figure 1.
(Left) a cropped example of the 4 m/pixel CaSSIS panchromatic band image, and (right) the resultant 1 m/pixel CaSSIS DTM using the proposed CaSSIS DTM processing system, colour-keyed for elevation and hill-shaded.
The layout of the paper is as follows. In Section 1.1, we review previous work that is relevant to the proposed processing system. In Section 2.1, we introduce the input and validation datasets used in this work. From Section 2.2, Section 2.3, Section 2.4, Section 2.5, Section 2.6 and Section 2.7 we describe the proposed processing system both in overview and also for each individual component. Experimental results and associated assessments are given in Section 3.1 and Section 3.2, respectively. In Section 4, we discuss issues arising before drawing conclusions in Section 5.
1.1. Previous Work
One of the two key techniques employed in this work is SRR. SRR refers to the process of enhancing the spatial resolution, quality, and resolvable details of a given lower-resolution (LR) image by combining non-redundant information contained in multiple LR inputs or through prediction of the best higher-resolution (HR) solution via deep learning. Over the past 10 years, deep learning-based SRR techniques have been highly successful in the field of real-life photo and video enhancement. These include residual based SRR networks [16,17,18], recursive SRR networks [19,20], attention-based SRR networks [21,22], and GAN-based SRR networks [23,24,25,26]. More recently, SRR techniques have been applied to Earth observation images [27,28,29,30] and also applied to Mars orbital images [10,31] to maximise the potential outcome from the original imaging data products. With particular relevance to this work, the MARSGAN network is proposed in [10] for single-image SRR of CaSSIS images. In this work, we further explore the MARSGAN CaSSIS SRR results, to be coupled with SfS techniques to produce high-resolution CaSSIS DTMs.
The other key technique used in this work is SfS. SfS refers to the process of inferring 3D surface slopes from the intensity variations of a single shaded image; when combined with photogrammetry, SfS can be used to resolve 3D details of a given shaded image with coarse 3D information. Starting from the pioneering work introduced in [32,33,34,35], many different SfS approaches have been proposed (for reviews, refer to [36,37]). These can be broadly classified into three categories, as follows: (1) the partial differential equation based methods mainly through characteristic line expansions [38,39,40] or approximations of viscosity [41,42,43,44,45,46]; (2) optimisation approaches based on chosen unknowns, optimisation functions, and minimisation methods [47,48,49,50]; and (3) approaches approximating the image irradiance equation [51,52,53,54,55,56]. SfS techniques have been actively applied to Moon images [57,58,59,60,61,62,63,64,65,66] and Mars images [11,12,67,68,69,70,71]. With particular relevance to this work, [11] introduced the HDEM SfS method for HiRISE and CTX images. In this work, we apply HDEM SfS to CaSSIS images based on CTX stereo-derived DTMs, and with a coarse-to-fine strategy, to further refine the DTM results with CaSSIS SRR images.
2. Materials and Methods
2.1. Datasets
In this work, we use the 6 m/pixel CTX [2] and 4 m/pixel CaSSIS [2] images for experiments and the 1 m/pixel stereo-derived HiRISE [4] DTM products [5] for intercomparison. The CTX images are accessible through the U.S. National Aeronautics and Space Administration (NASA) Planetary Data System (PDS) [72] imaging node at https://pds-imaging.jpl.nasa.gov/volumes/mro.html (accessed on 16 May 2021) or through Arizona State University’s Mars Image Explorer at http://viewer.mars.asu.edu/viewer/ctx (accessed on 16 May 2021). The CaSSIS images are accessible through the ESA Planetary Science Archive (PSA) [73] at https://archives.esac.esa.int/psa (accessed on 16 May 2021). The stereo-derived HiRISE PDS DTM products are available through the University of Arizona (UoA) HiRISE site at https://www.uahirise.org/dtm/ (accessed on 16 May 2021).
Our experiments were performed using the CTX and CaSSIS data over the ExoMars 2022 Rosalind Franklin [14] rover landing site at Oxia Planum [15]. Many CaSSIS, HiRISE, and CTX images have been repeatedly captured over Oxia Planum (please refer to Supplementary Materials for a complete list of available CaSSIS images, HiRISE DTMs and potential stereo pairs, and CTX stereo pairs). In order to provide intercomparison of the resultant CaSSIS DTM, we demonstrate the new functionality with a specific CTX stereo pair, F23_044811_1985_XN_18N024W and F23_044956_1984_XN_18N024W, and CaSSIS image MY34_001934_162_0_PAN, for areas that overlap with the PDS HiRISE DTM DTEEC_036925_1985_037558_1985_L01.
2.2. Overview of the Proposed Processing System
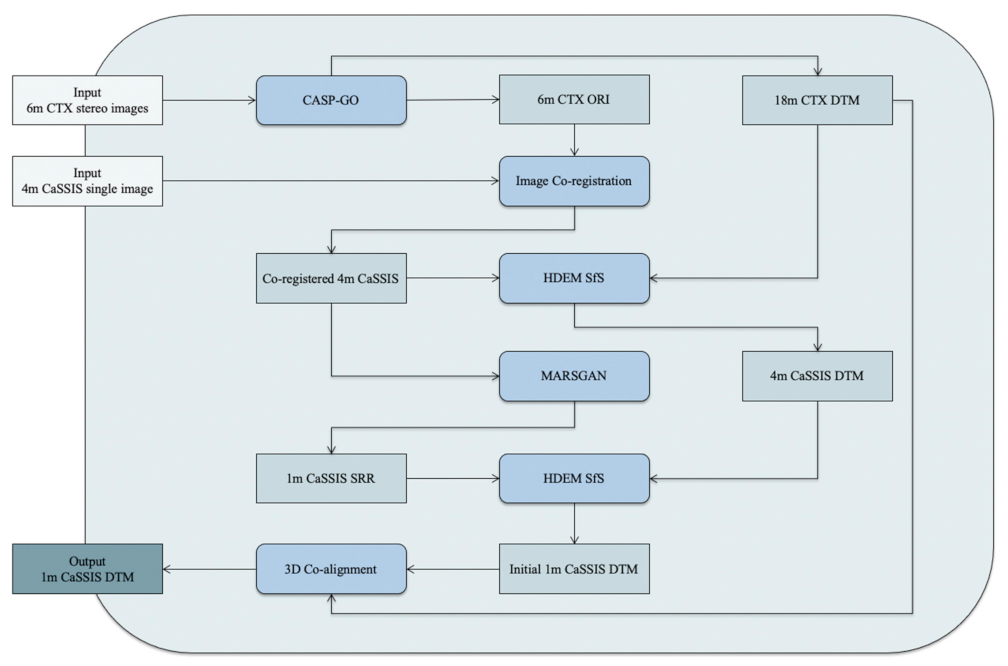
The overall workflow of the proposed CaSSIS DTM processing system is shown in Figure 2. It takes an arbitrary CaSSIS panchromatic band image and an overlapping CTX stereo pair as inputs and uses a sequence of novel techniques to produce DTM results that have higher resolution than the original input image. The complete workflow has 6 stages (a–f), which are listed as follows:
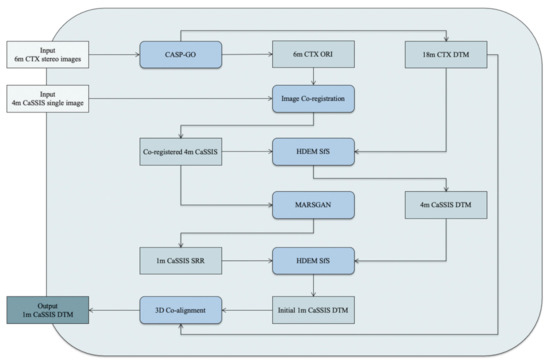
Figure 2.
Flow diagram of the proposed ultra-high-resolution CaSSIS DTM processing system.
- (a)
- Photogrammetric stereo reconstruction of the input 6 m/pixel CTX stereo pair using CASP-GO [8] to produce an 18 m/pixel CTX DTM and a 6 m/pixel CTX orthorectified image (ORI).
- (b)
- Co-registration of the input 4 m/pixel CaSSIS image with the reference 6 m/pixel CTX ORI from (a) using the MSA-SIFT tie-point based algorithm [9].
- (c)
- SfS 3D reconstruction of the co-registered 4 m/pixel CaSSIS image from (b), using HDEM [11], taking the low-resolution 18 m/pixel CTX DTM from (a) as initial input, to produce an intermediate 4 m/pixel CaSSIS DTM.
- (d)
- SRR processing of the co-registered 4 m/pixel CaSSIS image from (b), using MARSGAN [10], to produce a 1 m/pixel CaSSIS SRR image.
- (e)
- SfS 3D reconstruction of the 1 m/pixel CaSSIS SRR image from (d), using HDEM, taking the intermediate 4 m/pixel CaSSIS DTM from (c) as initial input, to produce a fine-scale 1 m/pixel CaSSIS DTM.
- (f)
- 3D co-alignment of the resultant 1 m/pixel CaSSIS DTM from (e) with the original 18 m/pixel CTX DTM from (a), using the B-Spline fitting algorithm described in [13], to produce the final output product.
The proposed CaSSIS DTM processing chain starts from a 4 m/pixel CaSSIS image and an initial low spatial resolution DTM (in this work we use CTX but HRSC could also be employed), using a coarse-to-fine strategy, to gradually exploit intensity variations of the CaSSIS/SRR images and retrieve a DTM from 18 m/pixel to 4 m/pixel then eventually down to 1 m/pixel. We reuse previously developed algorithms (or in-house software) [8,9,10,11,12,13] to achieve the above listed 6 processing stages. It should be noted that the HDEM SfS process requires an initial DTM as input, which can be produced via photogrammetry, laser altimetry, or SfS using any overlapping data source. In our case, a stereo-derived CTX DTM was a good option given the complete CTX stereo coverage of Oxia Planum and the similar spatial resolution between CTX and CaSSIS. However, if there is no CTX stereo available, we can always use a SfS-reconstructed HRSC DTM (at 12.5 m/pixel) or SfS-reconstructed CTX DTM (using HRSC DTM as initial input) to achieve similar outcomes with the same coarse-to-fine strategy used in this work. High-level technical details of the 6 processing stages are summarised in the following sections. For detailed descriptions of each of these, please refer to the original work in [8,9,10,11,12,13].
2.3. CTX DTM from CASP-GO
In the first processing stage (a), CASP-GO [8] is employed to produce an initial 18 m/pixel CTX DTM and 6 m/pixel ORI. The CASP-GO stereo reconstruction pipeline is based on the NASA ASP [6] framework with specific enhancements, dealing with matching artefacts, disparity gaps, and co-registration issues. In particular, CASP-GO uses adaptive least squares correlation (ALSC) and region-growing algorithms [7] to iteratively refine stereo matching accuracy and improve the matching completeness (fill in gaps). A simplified flow diagram of the CASP-GO stereo reconstruction pipeline is shown in Figure 3 and can be summarised with the following 6 main steps:

Figure 3.
Simplified flow diagram of the CASP-GO DTM processing system described in [8].
- (1)
- Stereo image pre-processing, including conversion of CTX raw data, denoising, camera model initialisation, epipolar map projection, and image enhancement.
- (2)
- Stereo matching using the ASP’s normalised cross-correlation and Bayes expectation maximisation weighted affine adaptive sub-pixel cross-correlation.
- (3)
- Matching refinement, achieved interactively with (2) using fast maximum likelihood matching, outlier rejection, and ALSC.
- (4)
- Use of initial stereo matching results from (2) and (3) as seed points and use of ALSC with region growing to obtain matches for the neighbours of the seed points to gradually fill in any gap areas.
- (5)
- Camera Triangulation and DTM creation.
- (6)
- DTM post-processing, including outlier filtering, smoothing, grid-spacing, co-kriging interpolation, ORI and DTM co-registration and corrections (with a given reference data, e.g., HRSC/MOLA), and georeferencing.
2.4. CaSSIS to CTX Image Co-Registration
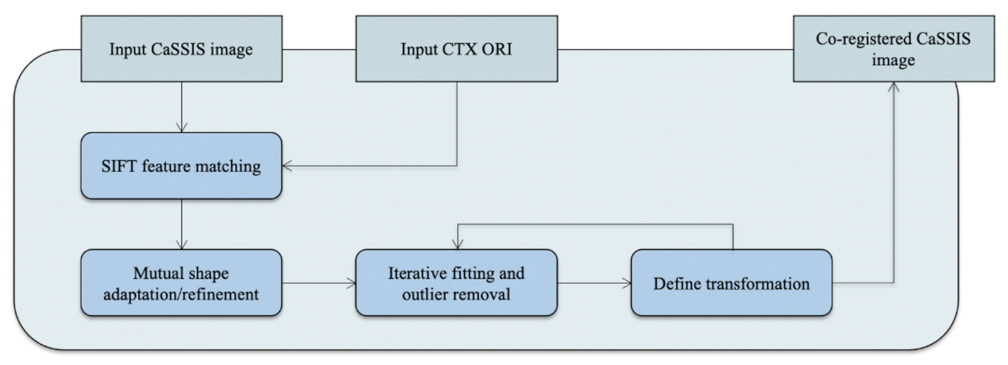
At the second processing stage (b), the MSA-SIFT tie-point based image co-registration [9] method is used to co-register the input 4 m/pixel CaSSIS image with the 6 m/pixel CTX ORI so that the initial height values from CTX DTM can be, as accurately as possible, associated with each CaSSIS image pixel. The MSA-SIFT based image co-registration algorithm provides sub-pixel co-registration accuracy through iterative refinement of SIFT feature matching and computes the image transformation function with globally minimised residuals. A simplified flow diagram of the MSA-SIFT based image co-registration method is shown in Figure 4. This method has 4 main steps, which are summarised as follows:
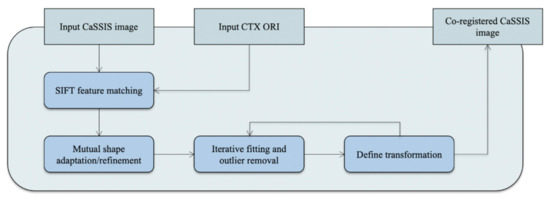
Figure 4.
Simplified flow diagram of the MSA-SIFT tie-point based image co-registration method described in [9].
- (1)
- Feature detection and matching of the input CaSSIS image and CTX ORI using the Perspective-SIFT [74,75] algorithm.
- (2)
- Iterative refinement of a scale invariant elliptical region using forward and backward ALSC and outputting of a list of tie-points.
- (3)
- Definition of an initial 2nd order polynomial transformation via least squares fitting, with residuals calculated and outliers removed.
- (4)
- Update of the transformation function and going back to (3) until a residual threshold is satisfied, then transformation of the input and writing out the co-registered CaSSIS image.
Given the large resolution difference between the CaSSIS image (4 m/pixel) and the CTX photogrammetric DTM (18 m/pixel), the image co-registration accuracy was not considered essential in this work and is thus not discussed any further.
2.5. HDEM SfS
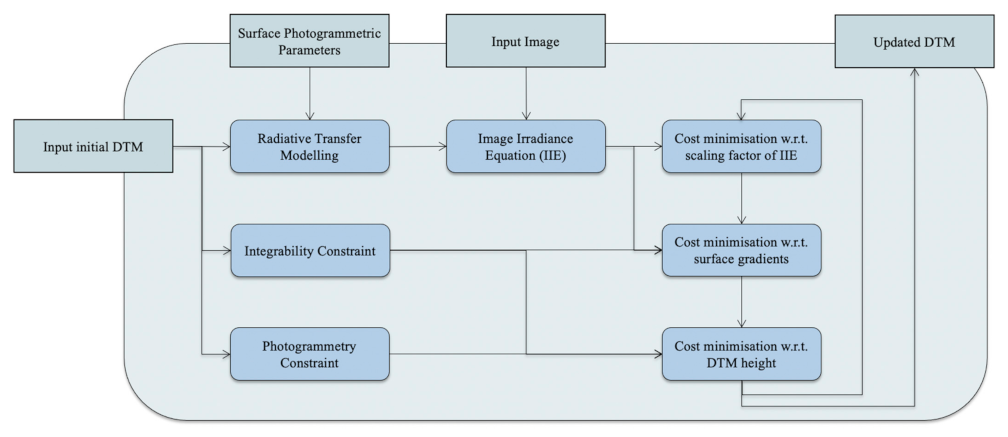
At the third and fifth processing stages (c) and (e), the HDEM [11] SfS method is employed to derive fine-scale 3D information from the 4 m/pixel co-registered CaSSIS image and subsequently the 1 m/pixel CaSSIS SRR image. HDEM SfS takes a single image and a co-registered coarse DTM as inputs, and iteratively refines the coarse input DTM via minimisation of a total cost function. The total cost function comprises 3 terms, i.e., the image irradiance function cost that combines a surface atmospheric radiative transfer scheme and a realistic bidirectional reflectance distribution function (BRDF; the Ross-Thick Li-Sparse model [76,77,78]), the integrability constraint regularisation term, and the photogrammetry constraint regularisation term.
In particular, HDEM SfS uses several novel approaches to produce robust high-resolution DTM products with little artefact. These include, firstly, a Cartesian coordinate system aligned with the directions parallel and perpendicular to the sun azimuth instead of the image coordinates; secondly, a separately weighted integration regularisation term, which poses more penalisation on the direction normal to the sun azimuth, and thirdly, a Gaussian convolution scheme for the weighted photogrammetric regularisation term to take into account any difference of spatial resolution between the initial and updated DTMs. Depending on the characteristics of the scene in terms of composition and spatial albedo distribution, the BRDF model is homogeneous, piece-wise constant, or spatially variegated. The spectrophotometric properties of the endmember terrains can be, where available, extracted from a near-coincident CRISM multi-angular acquisition sequence using the MARS-Reco method [79]. They can also come from reflectance measurements of Martian analogue materials in the laboratory or be reduced down to a standard photometric model [80]. Figure 5 shows a simplified flow diagram of the HDEM SfS process. The HDEM SfS process has 4 main steps, which can be summarised as follows:
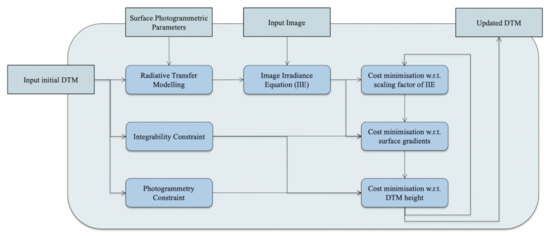
Figure 5.
Simplified flow diagram of the HDEM SfS processing chain described in [11].
- (1)
- For the given input image and its geometrical acquisition conditions, the pre-calculated surface reflectance model, and the initial DTM input, calculate image intensity fields and thus minimise the cost function for the image irradiance equation and integrability constraint with respect to the surface gradients to obtain updated surface gradients.
- (2)
- For the given initial DTM input and pre-computed and updated surface gradients from (1), minimise the cost function for the integrability and photogrammetry constraints with respect to the DTM height to obtain an updated DTM.
- (3)
- For the given input image, pre-calculated surface reflectance model, and updated surface gradients from (1), minimise the cost function for the image irradiance equation with respect to the scaling factor of the image irradiance equation to obtain an updated scaling factor.
- (4)
- Repeat steps (1) to (3) but use the updated DTM from (2) to replace the initial DTM input until a pre-set maximum number of iterations is reached or until the total cost function for the image irradiance equation, integrability constraint, and photogrammetry constraint converges.
2.6. MARSGAN SRR
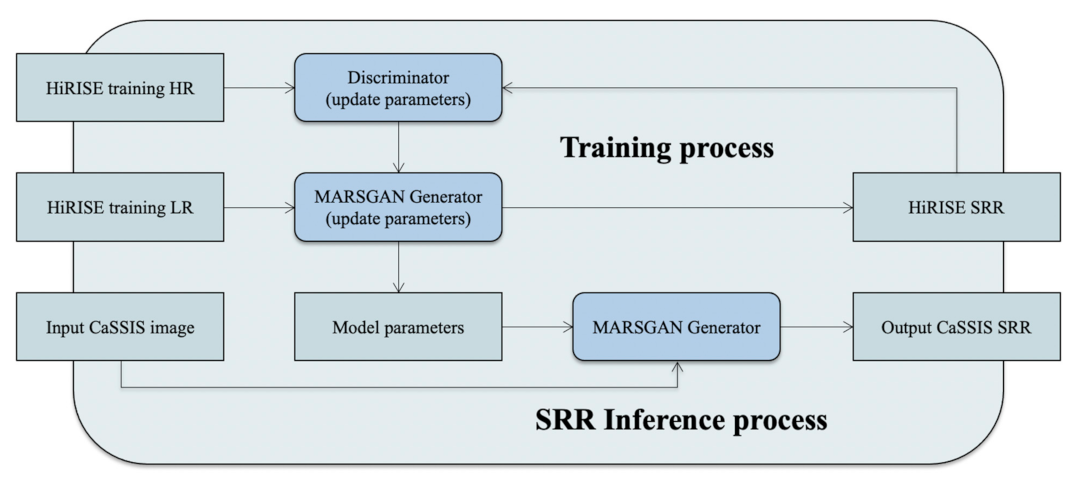
At the fourth processing stage (d), MARSGAN [10] is used to super-resolve the 4 m/pixel co-registered CaSSIS image and produce a 1 m/pixel CaSSIS SRR image, which will then be used as an input for the HDEM SfS 3D retrieval. MARSGAN is a deep learning-based single-image SRR network that is based on the GAN framework [81]. MARSGAN contains a generator network to generate potential SRR solutions that are highly similar to the HR version of the same scene, and in parallel, to compete with the generator network, a relativistic discriminator network [82] is used to divide the potential SRR solutions into 2 classes, i.e., “more realistic” or “more like fake”. In particular, the generator of MARSGAN contains 23 adaptive weighted residual-in-residual dense blocks, followed by an adaptive weighted multi-scale reconstruction block, providing high network capacity and restoration of information at different image scales. Details of the MARSGAN network architecture can be found in [10]. Figure 6 shows a simplified flow diagram of the MARSGAN SRR training and inference process.
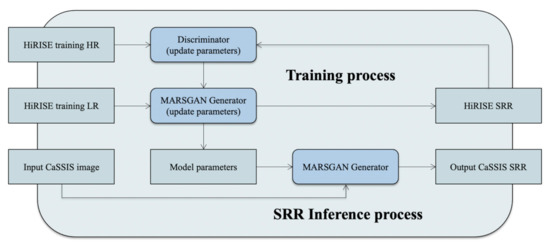
Figure 6.
Simplified flow diagrams of the MARSGAN training and SRR inference process.
MARSGAN is able to produce state-of-the-art SRR results for CaSSIS images at 4 times the original scale with an effective resolution enhancement factor of about 3 times [10]. In this work, we reuse the pre-trained MARSGAN network based on HiRISE images described in [10] to produce CaSSIS SRR results at 1 m/pixel spatial resolution. Subsequently, the intermediate 4 m/pixel CaSSIS DTM is further refined using the resultant 1 m/pixel CaSSIS SRR image via the same HDEM SfS process described in the previous section.
2.7. 3D Co-Alignment
At the sixth processing stage (f), a B-spline fitting algorithm (as originally described in [13]) is used to check and correct any systematic errors of the resultant 1 m/pixel CaSSIS DTM with respect to the 18 m/pixel stereo-derived CTX DTM. Although systematic errors from HDEM SfS are generally rare, they could still occur when using a standard “Mars surface dust covered” as the BRDF model, i.e., without involving separate calculation of a regional Ross-Thick Li-Sparse model using multi-angular sequences of the Compact Reconnaissance Imaging Spectrometer for Mars (CRISM) data [83], as originally used in [11]. In this work, we use the default pre-computed “dusty-Mars” model for HDEM SfS and subsequently apply an in-house B-Spline fitting method to perform a systematic correction and finally produce the 1 m/pixel CaSSIS DTM that is co-aligned with the stereo-derived CTX DTM. Figure 7 shows a simplified flow diagram of the B-spline fitting algorithm, which has 4 main steps that can be summarised as follows:

Figure 7.
Simplified flow diagram of the B-spline fitting based 3D co-alignment method as described in [13].
- (1)
- Compute two planar B-spline surfaces that represent the large-scale topography of the 1 m/pixel CaSSIS DTM and 18 m/pixel CTX DTM.
- (2)
- Assign initial local affine transformations for each 3D point of the B-spline surface of the CaSSIS DTM from (1).
- (3)
- Update local affine transformations by minimising the cost function that comprises 3 terms, i.e., the weighted distance between the target and reference 3D points, the weighted stiffness term to penalise transformations of neighbouring 3D points, and the weighted landmark term, which in this case is simply a collection of the closest 3D points.
- (4)
- Lower the stiffness weights to allow more localised transformations and go back to (3) until the cost function in (3) is minimised, then update the input CaSSIS DTM.
3. Results
3.1. Demonstration and Visual Analysis
We provided intercomparison of the resultant CaSSIS DTM with existing PDS HiRISE DTM (DTEEC_036925_1985_037558_1985_L01) using overlapping cropped areas from the CTX stereo pairs (F23_044811_1985_XN_18N024W and F23_044956_1984_XN_18N024W), a CaSSIS panchromatic band image (MY34_001934_162_0_PAN), and the PDS HiRISE ORI (ESP_036925_1985_RED_A_01_ORTHO). It should be noted that the HiRISE ORI and DTM were co-aligned with the CTX ORI and DTM, which were themselves co-aligned with HRSC and MOLA (as part of the CASP-GO processing), in order to perform intercomparisons within the same geospatial context. Table 1 shows a list of the image IDs with associated geometrical metadata. It should be noted that except for image-specific parameters, we used the default sets of parameters for each processing step. There was still room for further improvement of the demonstrated results via fine-tuning of these parameters. However, in this work, we aimed at demonstrating the overall processing concept in the simplest possible manner.

Table 1.
List of image metadata of the input CTX and CaSSIS images and validation HiRISE image.
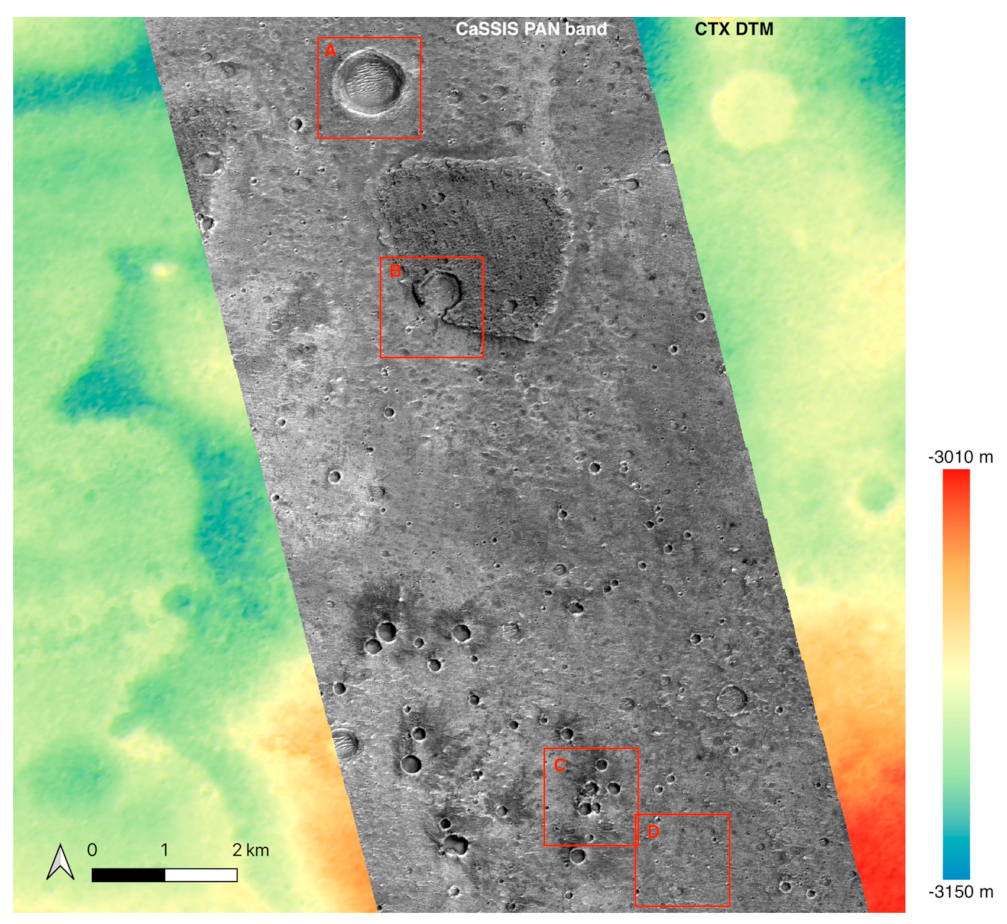
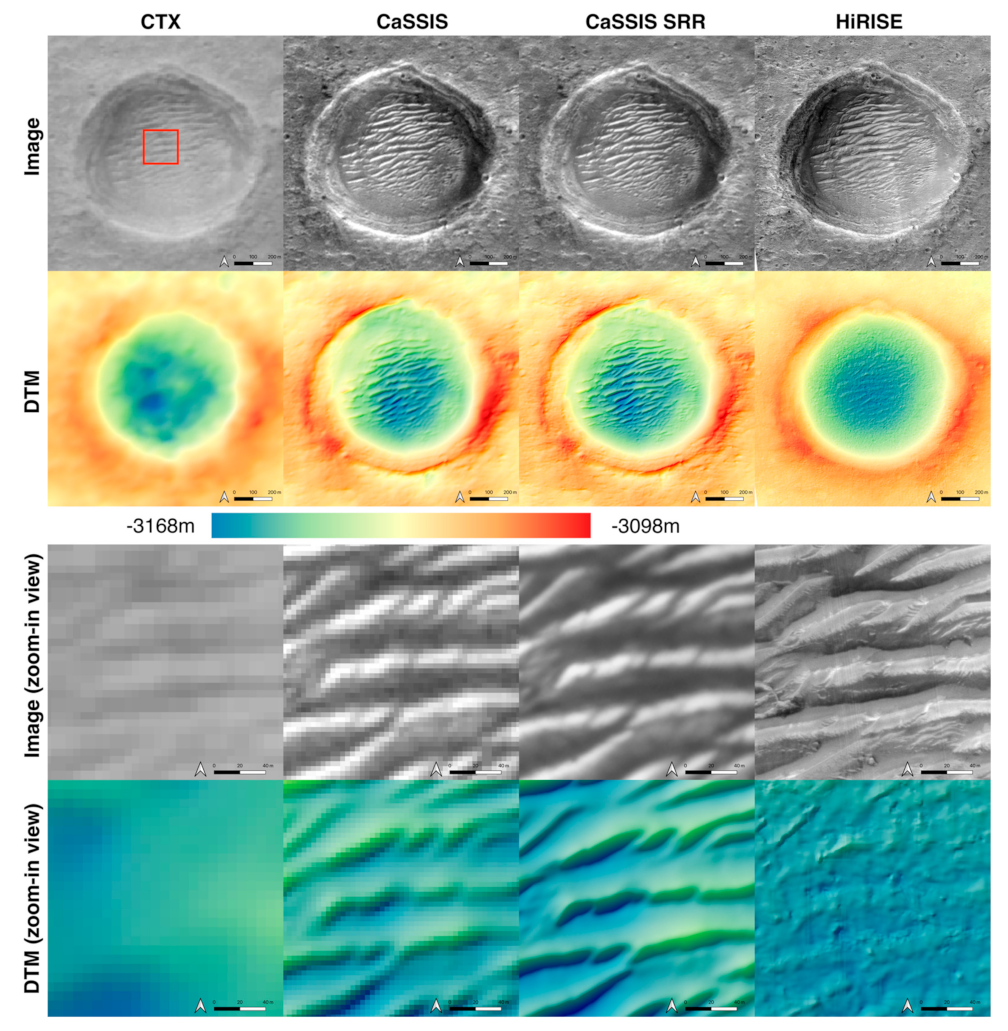
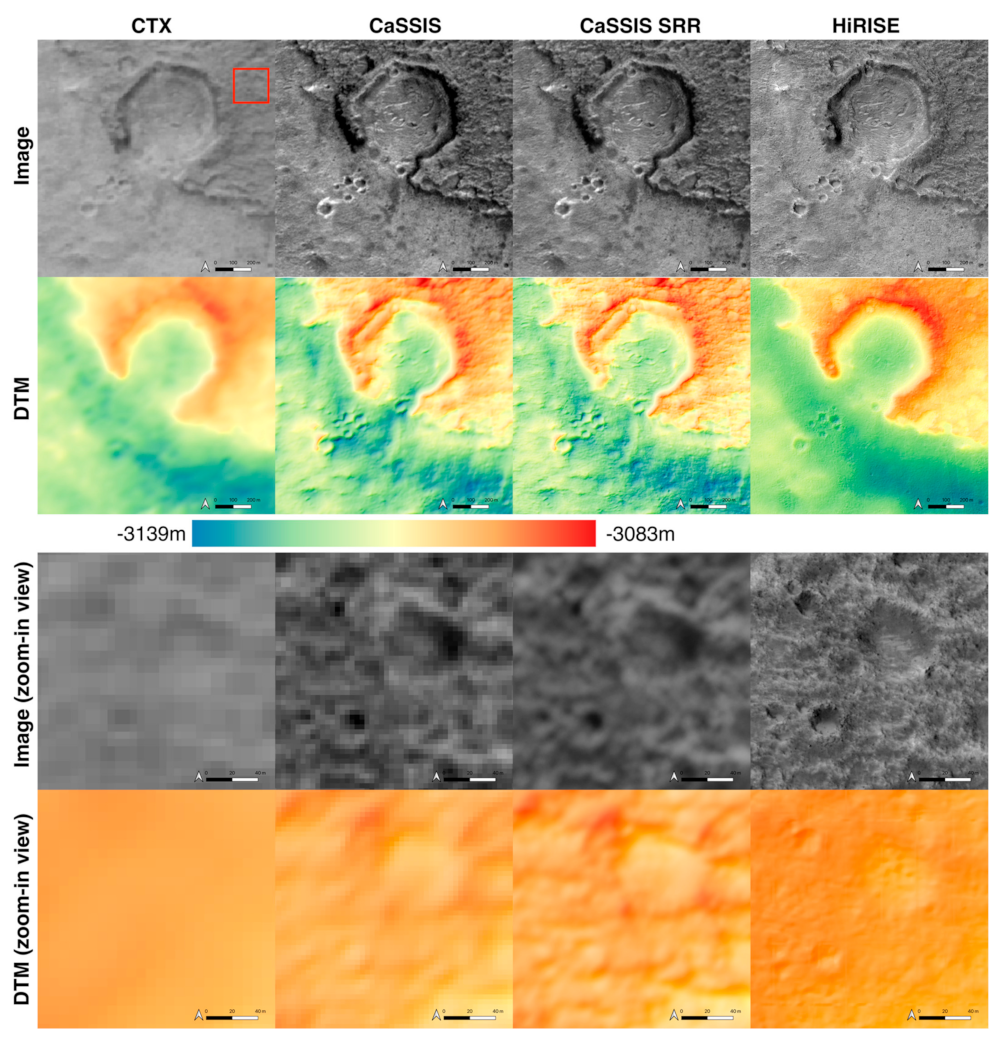
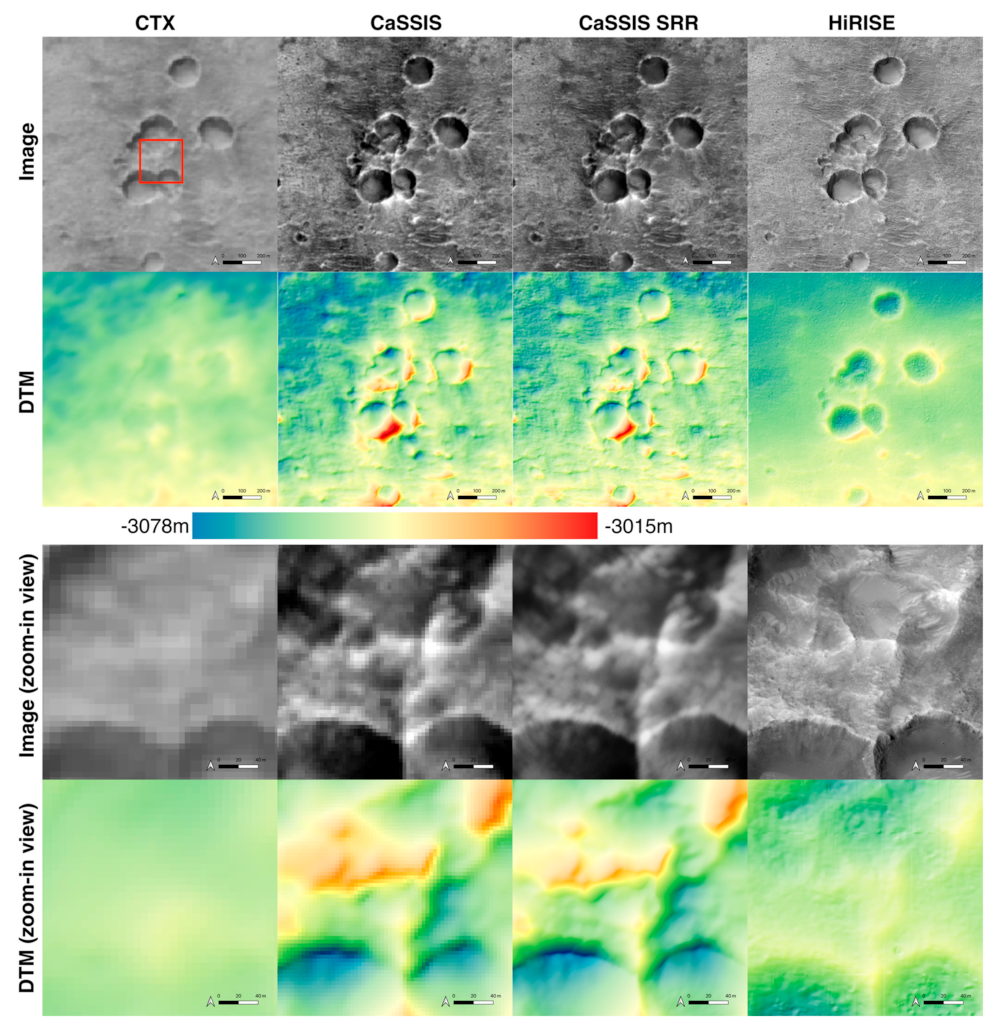
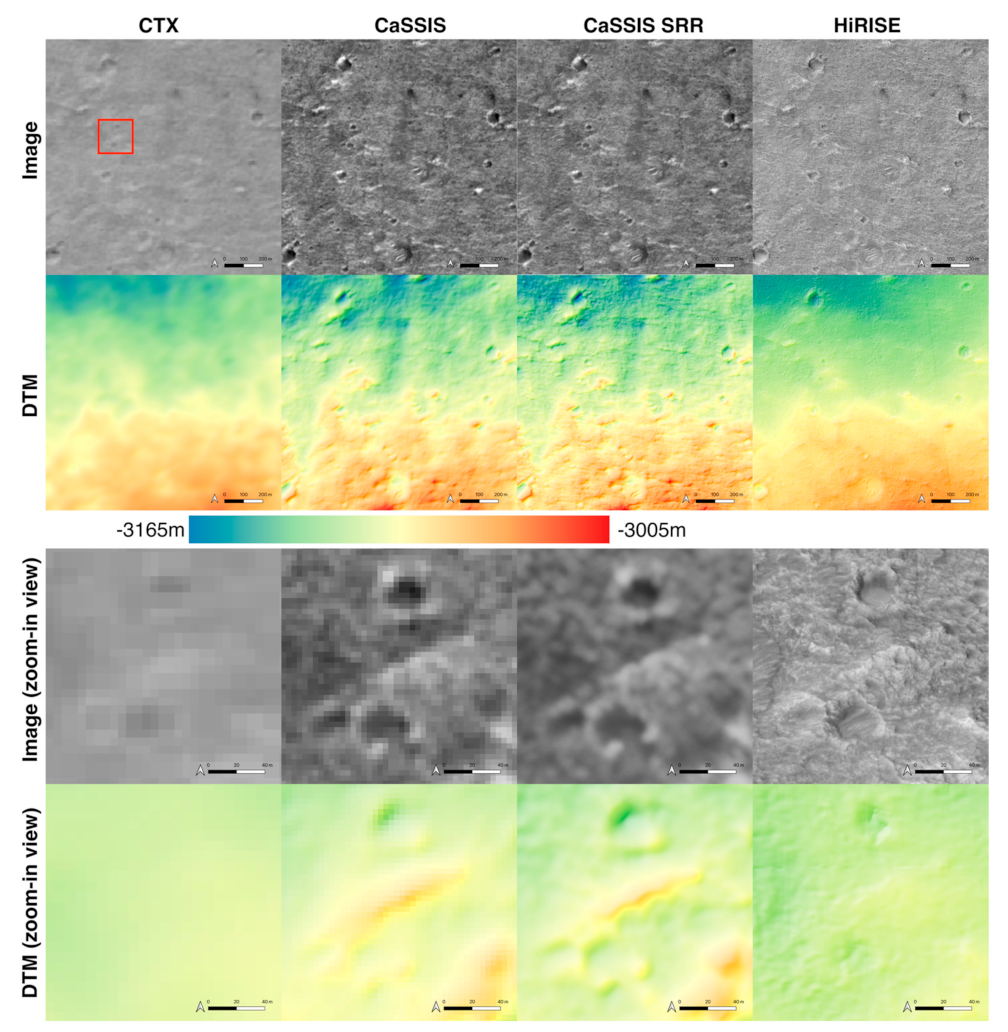
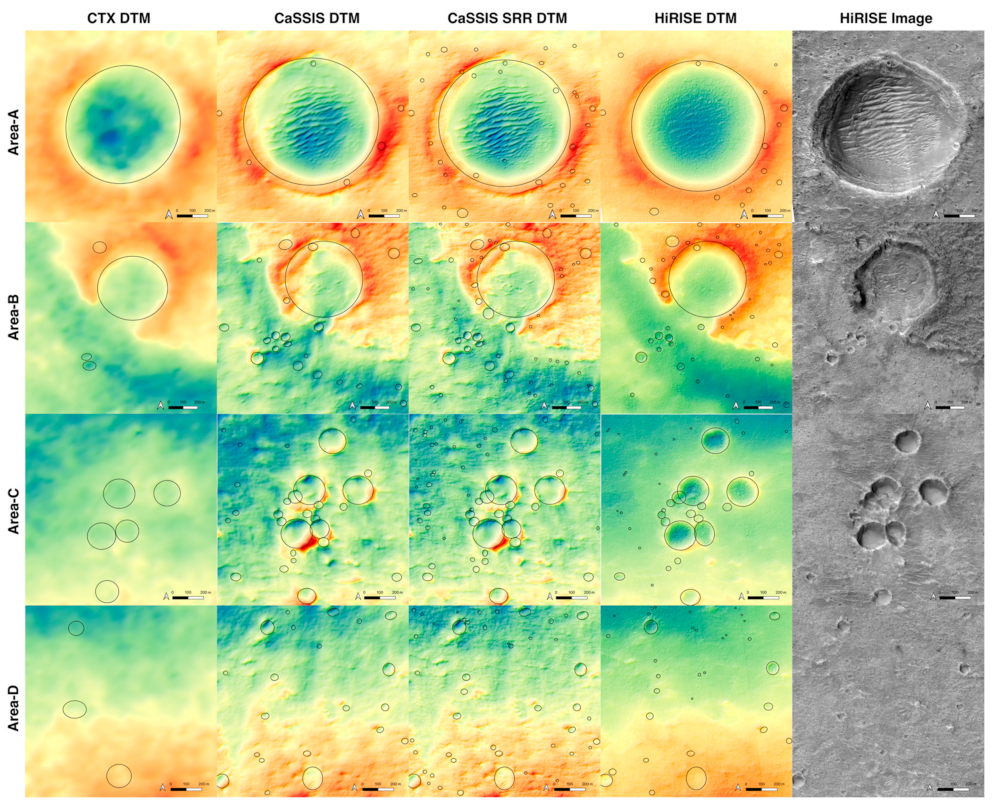
In this paper, we show examples of four cropped areas, each containing 375*375 pixels taken from the original CaSSIS image (1500*1500 pixels in terms of the output CaSSIS SRR and DTM). The locations of the four cropped areas (A, B, C, and D) are shown in Figure 8. The four selected areas contained different-sized craters in Oxia Planum in order to compare the crater-counts for different DTM products. In particular, Area-A contained a large-sized crater with rippled dunes in the centre and many small-sized craters around the crater ridge. Area-B contained a plateau notched by an open large-sized crater, with many small-sized craters on the mesa and surrounding the mesa. Area-C contained many sometimes overlapping medium-sized and small-sized craters. Area-D was a mostly flat region containing several small-sized craters. Comparisons of the 6 m/pixel CTX ORI, 18 m/pixel CTX DTM, 4 m/pixel CaSSIS image, intermediate 4 m/pixel CaSSIS DTM, 1 m/pixel CaSSIS SRR image, final 1 m/pixel CaSSIS SRR DTM, 0.25 m/pixel PDS HiRISE ORI, and 1 m/pixel PDS HiRISE DTM, as well as their zoom-in views, are shown in Figure 9 for Area-A, Figure 10 for Area-B, Figure 11 for Area-C, and Figure 12 for Area-D.
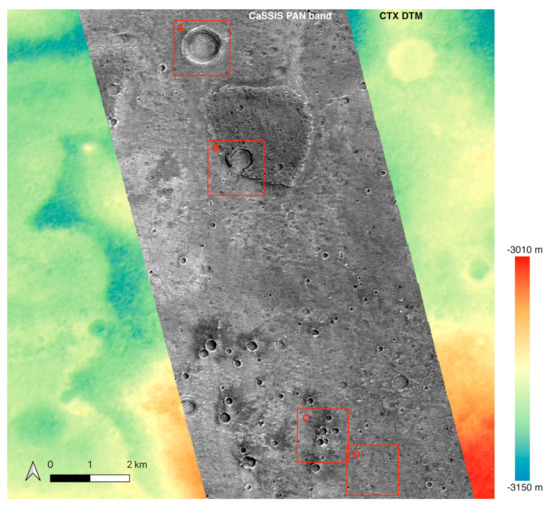
Figure 8.
A crop of CaSSIS panchromatic image (MY34_001934_162_0_PAN) showing on top of the CASP-GO CTX DTM (stereo-derived from F23_044811_1985_XN_18N024W & F23_044956_1984_XN_18N024W; showing as colourised and hillshaded map) over Oxia Planum. The 4 red bounding boxes (A, B, C, and D) show the locations of the demonstration areas used in this section.
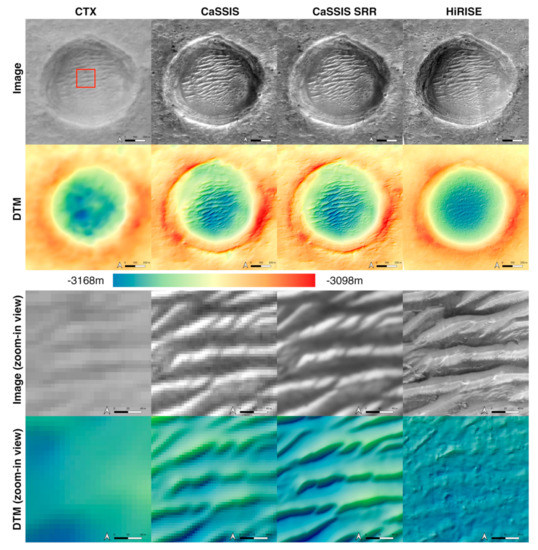
Figure 9.
Crops of Area-A and sub-crops (i.e., zoom-in views) for the location showing in the red bounding box on the top-left sub-figure (i.e., the CTX image). The 1st column shows the 6 m/pixel CTX ORI and 18 m/pixel CTX DTM (produced from F23_044811_1985_XN_18N024W & F23_044956_1984_XN_18N024W) and their zoom-in views. The 2nd column shows the 4 m/pixel CaSSIS image (MY34_001934_162_0_PAN) and 4 m/pixel CaSSIS DTM using SfS and their zoom-in views. The 3rd column shows the 1 m/pixel CaSSIS SRR image (produced from MY34_001934_162_0_PAN) and 1 m/pixel CaSSIS SRR DTM using SfS and their zoom-in views. The 4th column shows the 0.25 m/pixel PDS HiRISE ORI (ESP_036925_1985_RED_A_01_ORTHO) and the 1 m/pixel PDS HiRISE DTM (DTEEC_036925_1985_037558_1985_L01) and their zoom-in views.
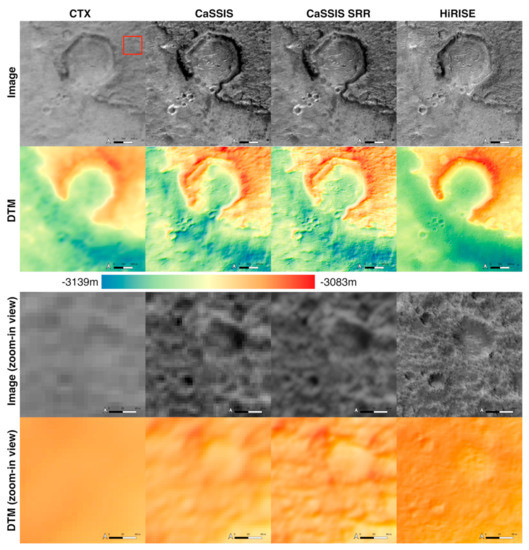
Figure 10.
Crops of Area-B and sub-crops (i.e., zoom-in views) for the location showing in the red bounding box on the top-left sub-figure (i.e., the CTX image). The 1st column shows the 6 m/pixel CTX ORI and 18 m/pixel CTX DTM and their zoom-in views. The 2nd column shows the 4 m/pixel CaSSIS image and 4 m/pixel CaSSIS DTM and their zoom-in views. The 3rd column shows the 1 m/pixel CaSSIS SRR image and 1 m/pixel CaSSIS SRR DTM and their zoom-in views. The 4th column shows the 0.25 m/pixel PDS HiRISE ORI and the 1 m/pixel PDS HiRISE DTM and their zoom-in views.
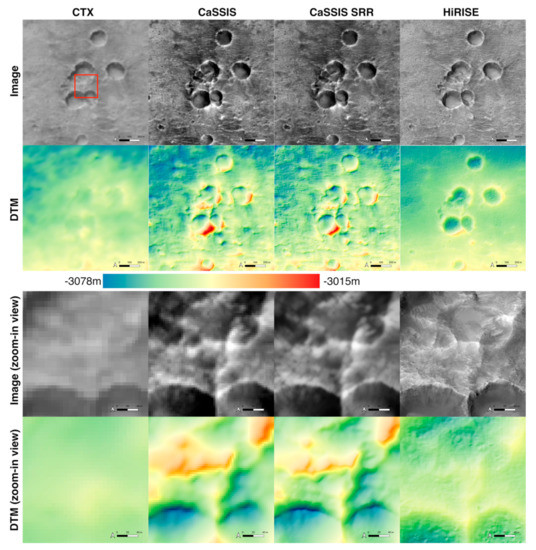
Figure 11.
Crops of Area-C and sub-crops (i.e., zoom-in views) for the location showing in the red bounding box on the top-left sub-figure (i.e., the CTX image). The 1st column shows the 6 m/pixel CTX ORI and 18 m/pixel CTX DTM and their zoom-in views. The 2nd column shows the 4 m/pixel CaSSIS image and 4 m/pixel CaSSIS DTM and their zoom-in views. The 3rd column shows the 1 m/pixel CaSSIS SRR image and 1 m/pixel CaSSIS SRR DTM and their zoom-in views. The 4th column shows the 0.2 5m/pixel PDS HiRISE ORI and the 1 m/pixel PDS HiRISE DTM and their zoom-in views.
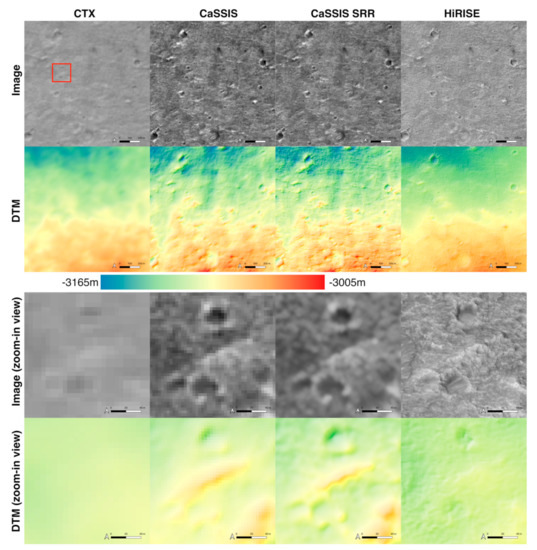
Figure 12.
Crops of Area-D and sub-crops (i.e., zoom-in views) for the location showing in the red bounding box on the top-left sub-figure (i.e., the CTX image). The 1st column shows the 6 m/pixel CTX ORI and 18 m/pixel CTX DTM and their zoom-in views. The 2nd column shows the 4 m/pixel CaSSIS image and 4 m/pixel CaSSIS DTM and their zoom-in views. The 3rd column shows the 1 m/pixel CaSSIS SRR image and 1 m/pixel CaSSIS SRR DTM and their zoom-in views. The 4th column shows the 0.25 m/pixel PDS HiRISE ORI and the 1 m/pixel PDS HiRISE DTM and their zoom-in views.
From Figure 9 (Area-A), we can observe significant improvements of the CaSSIS DTMs in comparison to the CTX DTM, in terms of resolvable features, local topography variations, and clarity of large-scale features. Although the HiRISE DTM seemed to be smoother and therefore more visually pleasing, there were many surface features and peaks that had been smoothed out as a result of window-based matching products. For example, in the HiRISE DTM, the rippled dune features in the crater centre were mostly shown as flat terrain, and the crater shape had also been smoothed out into a “perfect” circle. Overall, in this example, the CaSSIS SRR DTM seemed to have similar or even higher resolution compared to the HiRISE DTM. The zoom-in views show that the fine-scale topography was significantly improved by using the proposed approach, and the topography features aligned with the features shown in the HiRISE image at 0.25 m/pixel.
In terms of errors (or artefacts), it was difficult to determine whether the CaSSIS SRR DTM or HiRISE DTM was more “correct”, because there was no available higher-resolution ground-truth for validation. However, the artefacts, if there were any, would be at a slightly larger-scale for the CaSSIS SRR DTM, while the artefacts were mostly at small-scale for the HiRISE DTM, from a visual sense. Regarding the possible errors of the resultant CaSSIS SRR DTM, they could either have originated from any inherited errors of the initial DTM input (CTX DTM in our case) or come from any localised errors from using a generalised (instead of a locally computed) BRDF model. However, the latter issue (assuming this is correct) should only cause minor variations, as the final CaSSIS DTM was corrected against the CTX DTM at the final stage of the proposed processing chain, i.e., medium-to-large scale errors should have been eliminated unless they were in the CTX DTM. This can be observed, from the CaSSIS DTM and CaSSIS SRR DTM, for the inner crater ridge on the west, and just outside the crater edge on the south, as we can see that some outliers that do not agree with the CTX DTM or the HiRISE DTM have been eliminated (or largely reduced) in the CaSSIS SRR DTM. In order for the reader to examine the aforementioned details for the other areas, please refer to the full-resolution figures provided in the Supplementary Materials.
From Figure 10 (Area-B), we can observe increasing numbers of fine-scale surface features from the CTX DTM, CaSSIS DTM, and CaSSIS SRR DTM. HiRISE DTM seemed to have a level of detail similar to that of the CaSSIS DTM, but less detail than the CaSSIS SRR DTM. For example, the linear peaks inside the central crater were observable from both the CaSSIS image and HiRISE image; they have been brought out in the CaSSIS SRR DTM, but were not clear in the CaSSIS DTM and were even completely missing in the HiRISE DTM. The CaSSIS SRR DTM showed the most detail of the layered structures at the northeast corner. Additionally, the reconstruction quality of several of the small craters at the southwest region in the CaSSIS SRR DTM were better than those in the HiRISE DTM.
On the other hand, we could observe some errors around the edges of the open channel of the central crater from the CaSSIS DTM. Although the errors were reduced in the CaSSIS SRR DTM, they were not fully removed. The other point is, for the northwest crater ridge, there seemed to be a three-layer structure as shown in the CaSSIS and HiRISE image, where either or both the CaSSIS SRR DTM and HiRISE DTM may have been wrong. For the HiRISE DTM, the large-scale structure looked more correct, but the inner layer was completely missing, whereas in the CaSSIS SRR DTM, the inner layer was strongly shown but seemed to be incorrectly higher than it appeared in the images.
For Figure 11 (Area-C), the four DTM results showed good agreement with each other at large scale. The CaSSIS SRR DTM showed better agreement with the CTX and HiRISE DTM for the northwest corner in comparison with the CaSSIS DTM. Similar issues that are shown in Figure 10 (Area-B) are also shown in Figure 11 (Area-C), regarding the crater ridges. The crater walls shown in the CaSSIS DTM and the CaSSIS SRR DTM were much steeper compared to the HiRISE DTM. This seemed to agree with visual inspection of the images, but which one was more accurate remained an outstanding question. In addition, the CaSSIS SRR DTM showed good detail of the surface including revealing some very small-sized craters and the reconstruction of small height variations over flat areas. Such small craters and height variations were mostly smoothed out in the HiRISE DTM.
This observation is also reflected in Figure 12 (Area-D). Over the mostly flat region, as shown in Figure 12 (Area-D), we could observe the different levels of detail shown in the CaSSIS SRR DTM and HiRISE DTM while displaying good agreement with each other in broad scale. In the next section, profile measurements are given for 4 profile lines for the CTX DTM, CaSSIS DTM, CaSSIS SRR DTM, and HiRISE DTM over each of the 4 areas, in order to provide a more intuitive view regarding the observed differences as discussed above.
3.2. DTM Assessment: Profile Measurements and Crater Counting
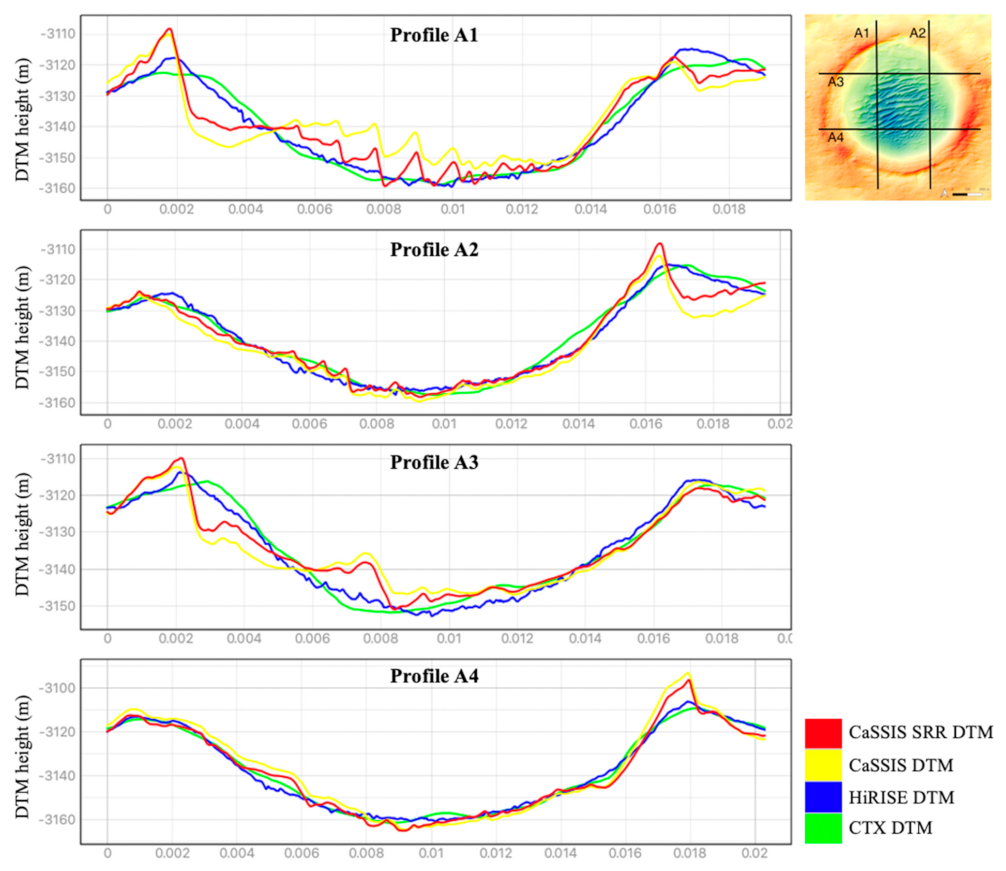
The four measured profile lines (A1, A2, A3, and A4) for Area-A are shown in Figure 13, with A1 and A2 crossing the crater ridges and the central dunes feature from north to south, and with A3 and A4 crossing the main crater from west to east. The overall agreements for the 4 DTMs were fairly good for Area-A. The largest difference between the CaSSIS SRR DTM and HiRISE DTM was about 10 m, which occurred at the north and south edges of the crater as well as for the central rippled runes feature. We can observe that the CaSSIS SRR DTM that co-aligned with the CTX DTM was also better co-aligned with the HiRISE DTM. Similar to previous visual inspections, the CaSSIS SRR DTM has shown details of many features that were not shown on the HiRISE DTM, e.g., the peaks and valleys at the crater ridge and centre; however, their absolute accuracy remains a question.
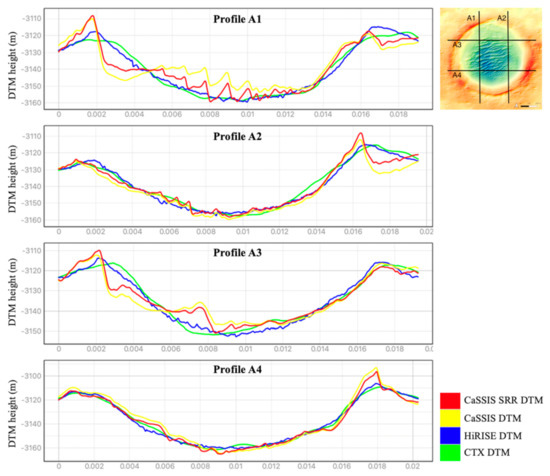
Figure 13.
DTM profile measurements of CTX, HiRISE, CaSSIS, and CaSSIS SRR DTMs for Area-A shown in Figure 9.
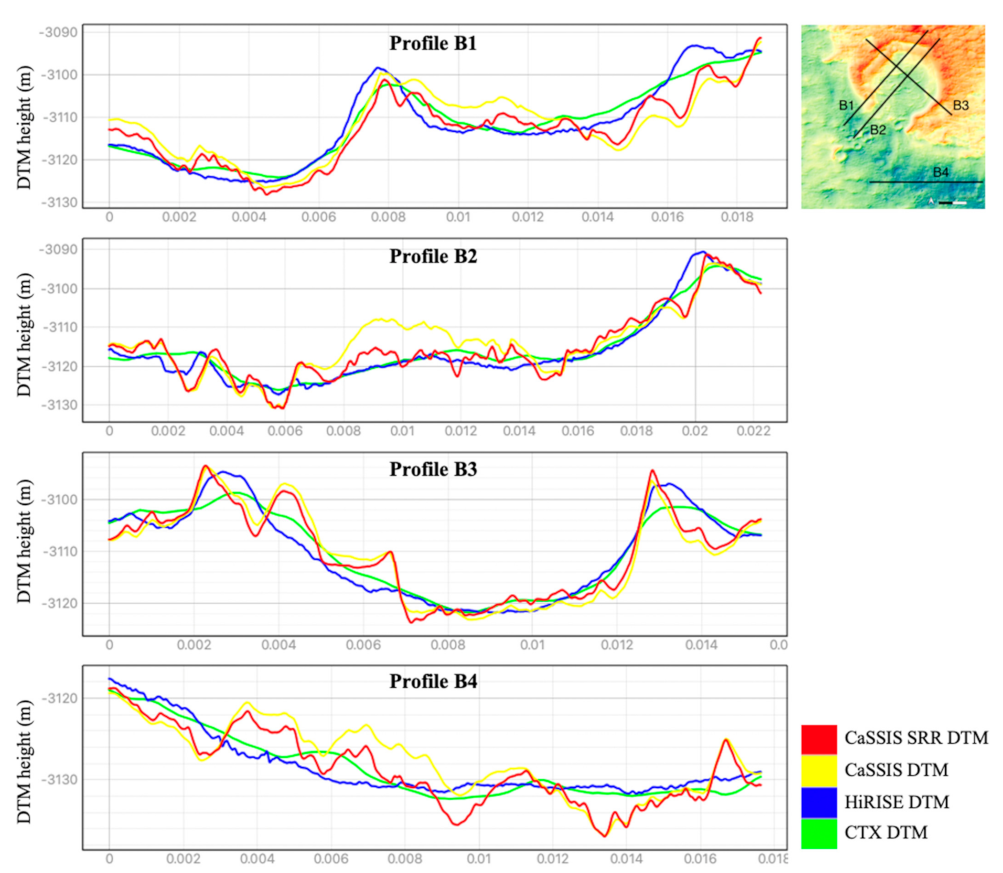
Figure 14 shows four measured profile lines (B1, B2, B3, and B4) for Area-B, with B1 and B2 crossing the edge of the open channel of the large crater from southwest to northeast, with B3 crossing the open crater from northwest to southeast, and with B4 measuring the shallow valley along the south. With B1 and B2, we could observe increasing levels of detail whilst displaying better CTX co-alignments for the CaSSIS SRR DTM in comparison to the CaSSIS DTM. The central part of profile B2 showed the aforementioned effects of the 3D co-alignment processing, which eliminated regional errors (about 10 m) shown on the intermediate CaSSIS DTM. B3 measured the aforementioned “three-layer” crater structure at the northwest side of the crater ridge, which appeared to be the major difference between the CaSSIS SRR DTM and HiRISE DTM for Area-B. The differences were around 8 m. The centre part and the northwest crater ridges in B3 showed fairly good agreement in the 4 DTMs. B4 also showed good agreement in the 4 DTMs, with the largest difference between CaSSIS SRR DTM and HiRISE DTM less than 6m. These differences were mostly due to the reconstructed topographic variations of the CaSSIS SRR DTM, whereas they were mostly smoothed out on the HiRISE DTM.
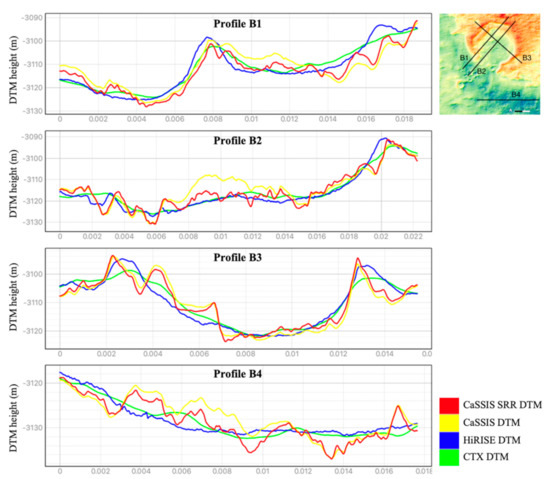
Figure 14.
DTM profile measurements of CTX, HiRISE, CaSSIS, and CaSSIS SRR DTMs for Area-B shown in Figure 10.
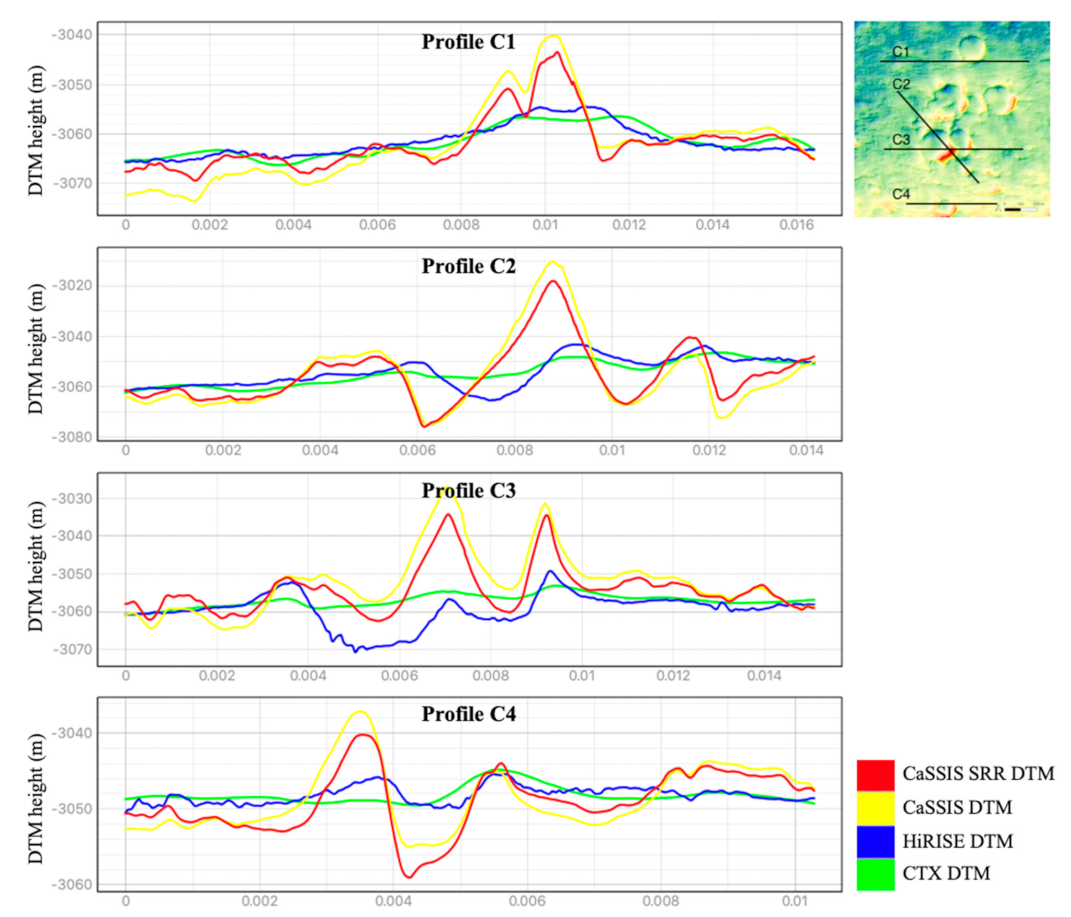
The four measured profile lines (C1, C2, C3, and C4) for Area-C are shown in Figure 15, with C1 crossing the south ridge of the main crater in the north, and C2 and C3 measuring the area that showed the major difference between the CaSSIS DTM, CaSSIS SRR DTM, and HiRISE DTM in Area-C, and with C4 crossing the main crater on the south. The main difference between the CaSSIS SRR DTM and HiRISE DTM, shown in C1, was the peak feature of the south ridge of the crater, whereas the HiRISE DTM showed a mostly flat profile. By visually inspecting the CaSSIS and HiRISE images, the peak, shown in the CaSSIS SRR DTM, seemed realistic; however, the 12 m maximum difference seemed too large to be real. C2 and C3 measured the area where the largest difference between CaSSIS SRR DTM and HiRISE DTM appeared in Area-C. The peaks of the two connected crater ridges had a maximum relative height difference between 15 m and 27 m for the CaSSIS SRR DTM, but the maximum relative height difference was between 6 m and 18 m for the HiRISE DTM.
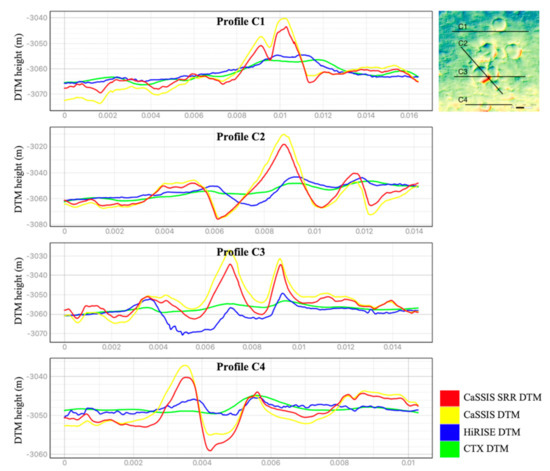
Figure 15.
DTM profile measurements of CTX, HiRISE, CaSSIS, and CaSSIS SRR DTMs for Area-C shown in Figure 11.
In C3, the joint ridge of the two connected craters, shown in the HiRISE DTM, was lower than the northwest crater ridge and a small peak on the southeast, whereas the joint ridge of the two connected craters, shown in the CaSSIS SRR DTM, was much higher than the northwest crater ridge. Visually comparing the CaSSIS and HiRISE images, the peaks shown in the HiRISE DTM seemed too low, but the peaks shown in the CaSSIS SRR DTM appeared too high. C4 showed a similar issue; the crater on the south seemed to have a much higher peak at the crater edge, as shown in the CaSSIS SRR DTM in comparison to the HiRISE DTM. This could be a smoothing issue with the HiRISE DTM or an over-structuring issue with the CaSSIS SRR DTM.
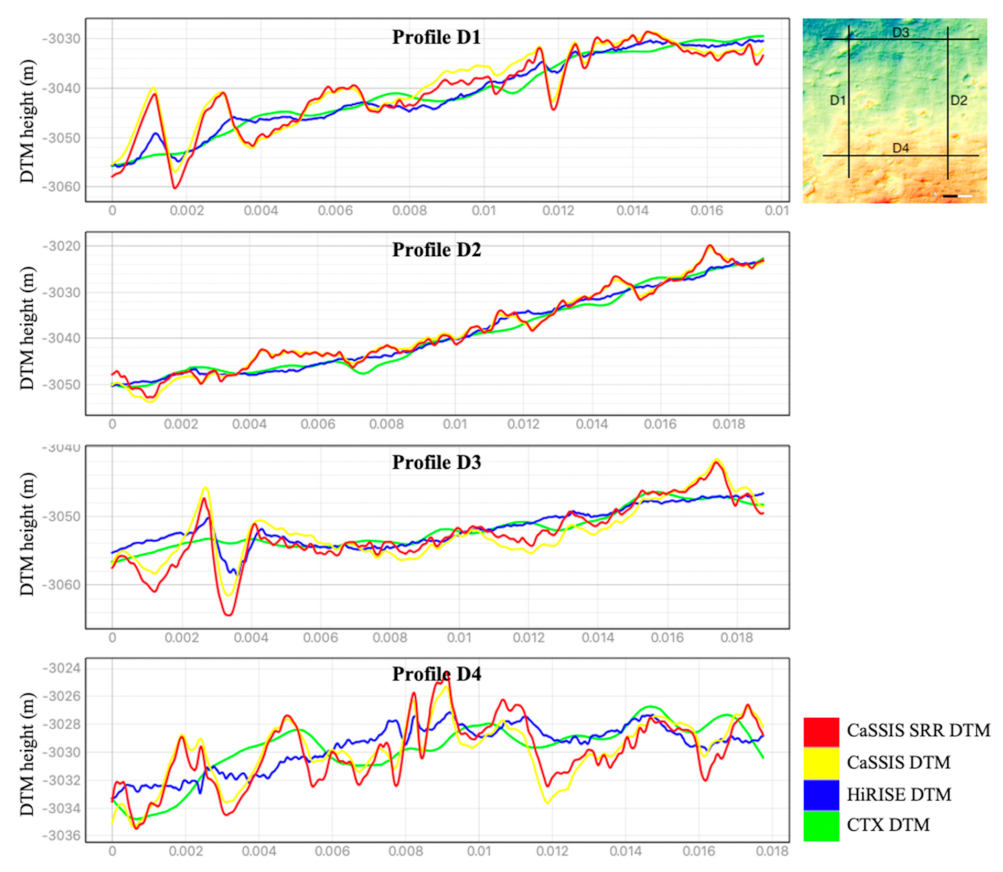
In the last example, Figure 16 shows four measured profile lines (D1, D2, D3, and D4) for Area-D, with D1 and D2 crossing from north to south for the west and east parts, respectively, and with D3 and D4 crossing from west to east for the north and south parts, respectively. Overall, the CaSSIS SRR DTM showed more detail and sharper peaks than the HiRISE DTM for this flatter terrain. The largest difference between the CaSSIS SRR DTM and the HiRISE DTM was less than 10 m for Area-D. This appeared on D1 and D3 when crossing the crater and peaks at the northwest region of Area-D. For flat areas, e.g., the middle part of D2 and D3, the differences were within 4 m. D4 clearly showed the local topographic variations that the CaSSIS SRR DTM brought out in comparison to the HiRISE DTM. These variations were mostly within 4 m and were highly realistic in visual assessments of the CaSSIS and HiRISE images.
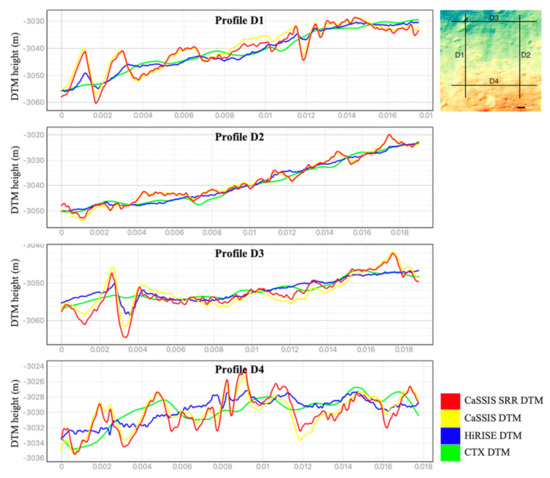
Figure 16.
DTM profile measurements of CTX, HiRISE, CaSSIS, and CaSSIS SRR DTMs for Area-D shown in Figure 12.
In addition to the profile analysis, we also counted the numbers of craters revealed on the CTX DTM, CaSSIS DTM, CaSSIS SRR DTM, and HiRISE DTM for the four example areas (A, B, C, and D). The resolvable craters are marked and shown in Figure 17. The marked craters were cross-checked against the HiRISE ORI in order to exclude any false-positives. Their diameters were determined using the ORI information (the same craters could show different sizes in a DTM due to errors). The crater counts, in terms of small-sized craters (diameter less than 30 m), medium-sized craters (diameter between 30 m and 100 m), and large-sized craters (diameter larger than 100 m), are summarised in Table 2.
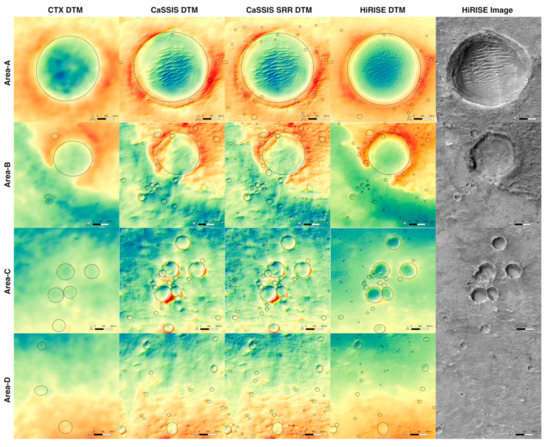
Figure 17.
Craters revealed on the CTX DTM, CaSSIS DTM, CaSSIS SRR DTM, and HiRISE DTM (manually annotated).

Table 2.
Summary of crater counts using the CTX DTM, CaSSIS DTM, CaSSIS SRR DTM, and HiRISE DTM.
Crater counts and analysis of the smallest resolvable craters were intuitive indicators as to the quality and effective resolution of the DTM products. Strong smoothing of DTMs could increase their perceptual quality due to reduced visible artefacts; however, it would conversely lower the number of resolvable craters (especially small-sized craters). From Table 2, we can observe that all four DTMs were able to resolve the large-sized craters, and there were increasing numbers of resolvable medium-sized and small-sized craters in the CaSSIS DTM, HiRISE DTM, and CaSSIS SRR DTM. For medium-sized and small-sized resolvable craters, the CaSSIS SRR DTM outperformed the HiRISE DTM in all four areas, therefore yielding a higher effective resolution.
It has been noted that the differences in results between medium-sized craters (from CaSSIS SRR DTM and HiRISE DTM) were generally larger than the differences between small-sized craters. We believe this was because the 4 m CaSSIS image had natively recorded fewer very-small-sized craters (e.g., <10 m), thus the CaSSIS SRR image (the MARSGAN SRR processing improved the resolution of existing information but did not create fake information that did not exist in the original input). Therefore, some of the successfully reconstructed tiny craters (e.g., <10 m) that had good contrast and disparities in the HiRISE stereo images compromised some of the total counts of the small-sized class (<30 m) in Table 2. However, it should be noted that the crater counting work described here should only be considered as indicative. A more thorough evaluation with a much larger area using an automated crater-counting method will be considered in future works.
4. Discussion
From the experiments conducted to date, we observed successful 3D reconstructions from CaSSIS for very fine-scale details of the Martian surface. These included resolving small features, e.g., rippled dunes, small craters, restoring local topographic variations, and obtaining better clarity of large-scale features. Whilst resolving more 3D details compared to stereo-derived HiRISE DTM, the correctness of such details cannot yet be validated, given the lack of high-resolution ground-truth 3D information that the future rover will be able to provide. Validation of the differences between the CaSSIS SRR DTM and HiRISE DTM observed over some of the demonstrated areas remains an open question. However, the maximum difference between CaSSIS SRR DTM and HiRISE DTM was 12 m, which occurred at the central peak of the two connected crater ridges in Area-C; for most of the other places, differences between the CaSSIS SRR DTM and HiRISE DTM were less than 5 m, which is acceptable, given their resolution differences. On the other hand, there were a pair of pre-chosen hyper parameters in the HDEM SfS process that controlled the weights of the integrability term and photogrammetric constraint. By tuning these weights, we could control the production of any artefacts (like overshooting) versus producing more detail. A default set of these weights as 10−3 and 10−7, respectively, is usually employed.
It should be noted that the radiometric calibration of the CaSSIS images may influence the contrast of the image and thus the performances of the SfS algorithm. We used the conversion factor from digital number (DN) to reflectance, given in the header file of version 1 of the archived CaSSIS image (1.86352e-005/DN).
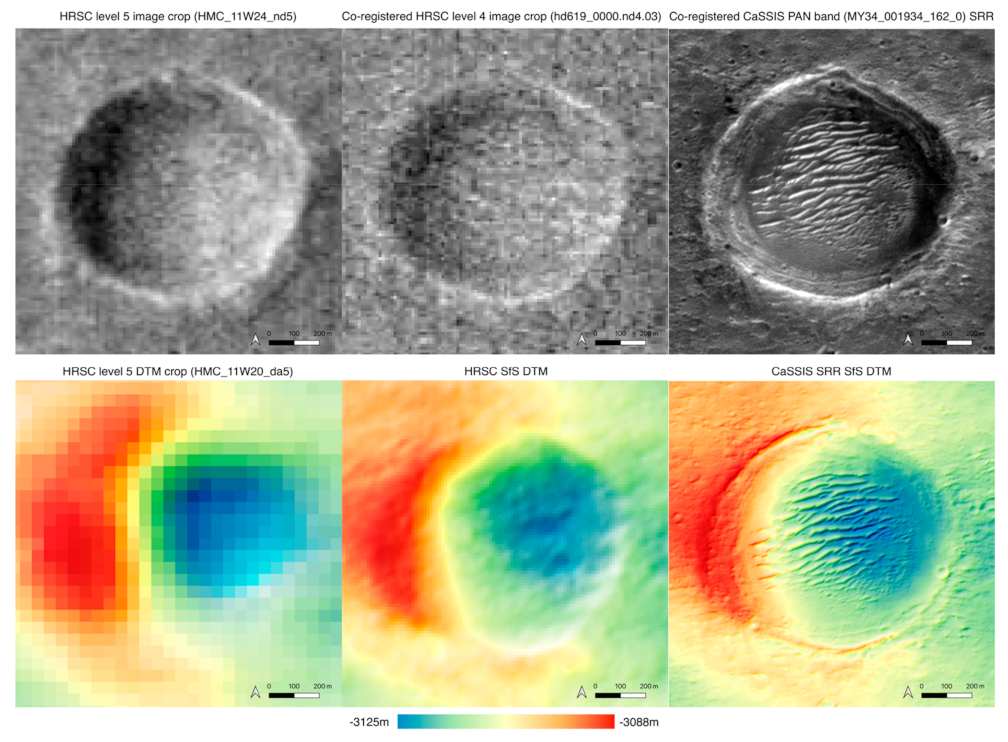
In this work, we demonstrated how a high-resolution DTM can be generated using a coarse stereo-derived 18 m/pixel CTX DTM as an initial input followed by the SfS process with a 4 m/pixel CaSSIS image, given the close spatial resolution between CTX DTM and CaSSIS image. CTX has obtained global coverage of Mars to date and more than half of the surface has been covered with CTX stereo. This implies that it may be possible to produce semi-global DTMs at 4-6 m/pixel whenever CaSSIS data are available and satisfy the general SfS requirements (with incidence angles higher than 40° and phase angles higher than 30°). Additionally, CTX has a greater swath width compared to the CaSSIS image, which makes it an ideal input source for CaSSIS SfS DTM reconstruction. However, if a CTX stereo pair is not available for a CaSSIS image, we can always start from a HRSC stereo pair. In this case, an additional HDEM SfS process may be required to bring the stereo-derived HRSC DTM into a higher spatial resolution, e.g., from 50 m/pixel to 25 m/pixel, in order to be used as the initial DTM input. Figure 18 shows an example of the resultant CaSSIS SRR DTM produced using a 50 m/pixel HRSC level 5 DTM (HMC_11W20_DA5) as input to replace the CTX stereo-derived DTM. In this example, the HRSC level 5 DTM was first refined to 12.5 m/pixel using SfS given a co-registered HRSC level 4 ORI (hd619_0000.nd4.03). Then, the 12.5 m/pixel HRSC SfS DTM was further refined using the 1 m/pixel CaSSIS SRR image. Note that given the 12.5 m/pixel HRSC SfS DTM was closer in resolution to the CaSSIS SRR image compared to the 18 m/pixel CTX DTM previously used, we did not need to use the original CaSSIS image to produce an intermediate 4 m/pixel CaSSIS DTM but used the CaSSIS SRR image directly to refine the HRSC SfS DTM. Even though in theory we could go up to a factor of 15 for the difference in scale between each SfS step, in practice scale jumps of a factor of 4 produce the most robust result. Finally, it should be noted that the proposed workflow could also be used to produce ultra-high-resolution HiRISE DTMs using HiRISE SRR and SfS.
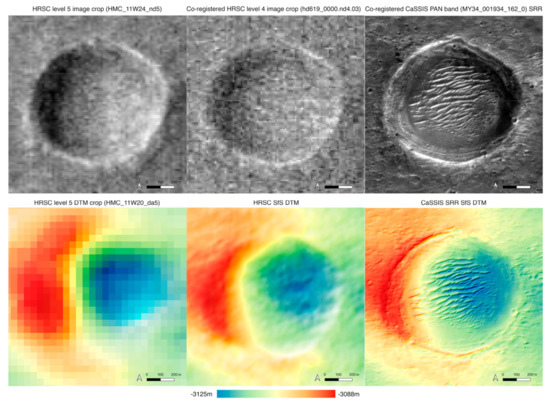
Figure 18.
Illustration of building a 1 m/pixel CaSSIS SRR SfS DTM starting from a 50 m/pixel HRSC level 4 DTM. First row (left to right): crop of HRSC level 5 ORI (HMC_11W24_ND5), crop of HRSC level 4 ORI (hd619_0000.nd4.03) co-registered with the HRSC level 5 ORI, crop of CaSSIS SRR image produced from CaSSIS PAN band image (MY34_001934_162_0_PAN); Second row (left to right): crop of HRSC level 5 DTM (HMC_11W20_DA5), crop of HRSC SfS DTM produced using the HRSC level 5 ORI and DTM, crop of the CaSSIS SRR SfS DTM produced using the HRSC SfS DTM and CaSSIS SRR image.
The current limitation is the processing speed of the HDEM SfS process. Processing of full-strip CaSSIS images should not be a problem using tiled processing in parallel, but larger areas, e.g., covering the whole of Oxia Planum, will require huge processing resources. GPU porting of the algorithm is also an option in the future. Another limitation is the need for spatially variant BRDF, which is not yet possible given the CRISM and OMEGA data currently available.
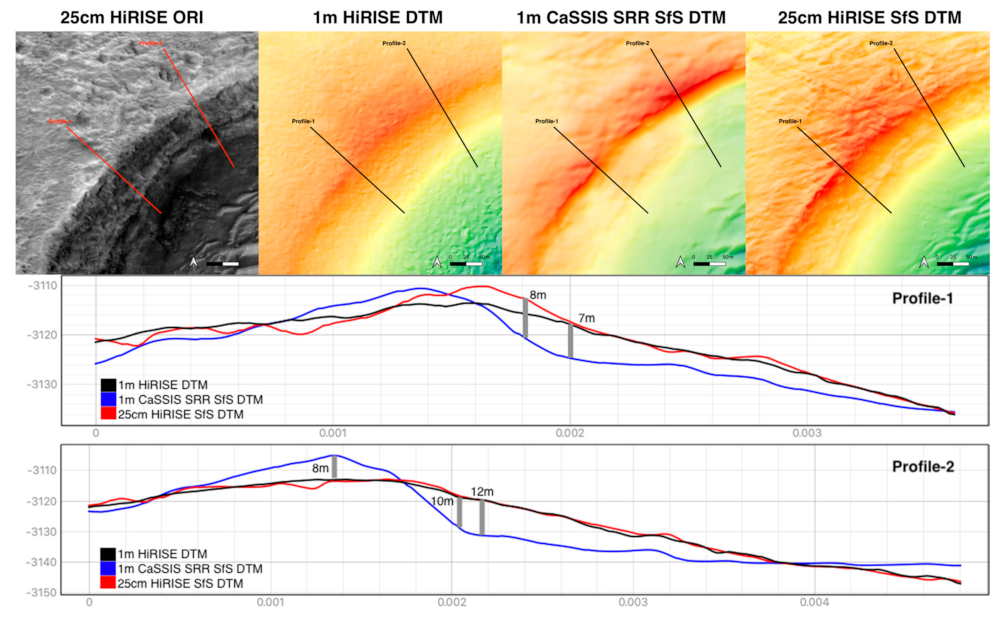
Another issue that could be studied in the future is the potential “overshooting” problem for steep slopes. Without fine-tuning the HDEM SfS parameters, certain levels of uncertainty are inevitable. Here we compare the HDEM SfS result from the CaSSIS SRR image with the SfS result from the HiRISE image in Figure 19. By measuring a profile line that crosses the crater rim where we previously observed the overshooting issue in Figure 13, we could observe that the differences between the HiRISE stereo-derived DTM and HiRISE SfS refined DTM (using the HiRISE stereo-derived DTM and HiRISE ORI as inputs) were smaller, at a maximum of 4 m, whereas the differences between the HiRISE stereo-derived DTMs and CaSSIS SRR SfS DTM were larger, at a maximum of 12 m. In Profile-1, the maximum difference between HiRISE stereo-derived DTM and CaSSIS SRR SfS DTM was 8 m (this would be reduced to 5 m if comparing against the HiRISE SfS DTM for the same location), and at another location, the maximum difference between HiRISE stereo-derived DTM and CaSSIS SRR SfS DTM was 7 m (it is also would be ~7 m if comparing against the HiRISE SfS DTM for the same location). In Profile-2, the HiRISE stereo-derived DTM and HiRISE SfS refined DTM had very little difference at the crater edge, whereas in the CaSSIS SRR SfS DTM, the overshooting appeared to be 8 m and the undershooting appeared to be 12 m maximum. These differences mainly come from a poor photogrammetric constraint for the HDEM SfS process, as we started from a much lower resolution DTM to produce the CaSSIS SRR SfS DTM. We believe this issue could be reduced or eliminated in the future by using a higher-resolution input CaSSIS stereo-derived DTM— for example, CaSSIS stereo derived DTM, or CaSSIS predicted DTM using deep learning-based monocular DTM estimation techniques.
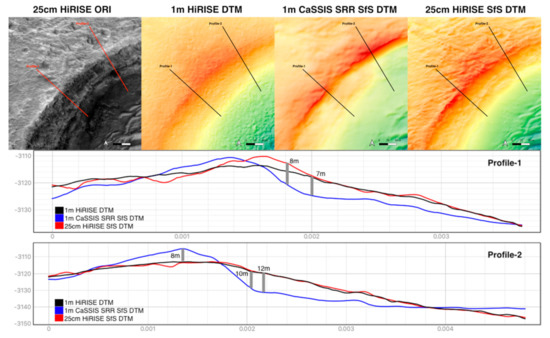
Figure 19.
Illustration of the potential overshooting issue of the 1 m/pixel CaSSIS SRR SfS DTM. First row: 25 cm/pixel HiRISE ORI, 1 m/pixel stereo-derived HiRISE DTM, 1 m/pixel CaSSIS SRR SfS DTM, and 25 cm/pixel HiRISE SfS DTM (showing location of the measured profile lines that are crossing the crater edge where we observed potential overshooting); second row: measured Profile-1; third row: measured Profile-2.
In this work, we demonstrated the concept of using a series of automated processing techniques to obtain sub-pixel level DTMs of CaSSIS images. As mentioned in Section 3.1, we use the default set of parameters (i.e., algorithm-related parameters were identical, but image-related parameters were different) throughout the processing chain, in order to demonstrate a prototype in the simplest possible manner. However, fine-tuning the algorithm-related processing parameters could potentially improve the results. For example, improving the initial photogrammetric results by fine-tuning the image matching parameters could potentially improve the photoclinometry results, improving the SRR network parameters could potentially improve the image and DTM resolution, and fine-tuning the SfS parameters could result in better DTM quality. In addition, the selection of processing parameters could be either area- or surface feature-specific, thus the computational limitation of tiled processing could also become an advantage in such circumstances.
5. Conclusions
In this paper, we introduced a novel ultra-high-resolution DTM processing chain using a combination of photogrammetric 3D reconstruction, image co-registration, image SRR, SfS DTM refinement, and 3D co-alignment methods. Technical details were provided, and results were demonstrated using 4 m/pixel CaSSIS panchromatic images and an overlapping 6 m/pixel CTX stereo pair to produce 1 m/pixel CaSSIS SRR DTM for four small areas over Oxia Planum. Visual inspections and quantitative assessments were presented using the publicly available 1 m/pixel HiRISE DTM for intercomparison. Such assessments showed that the final resultant CaSSIS DTM from the proposed processing system achieved comparable and sometimes more detailed 3D information compared to a HiRISE DTM.
Supplementary Materials
The following are available online at https://www.mdpi.com/article/10.3390/rs13112185/s1. The DTM and ORI results including intermediate results used in the comparisons. All figures in full resolution. List of HiRISE, CTX, and CaSSIS image IDs over Oxia Planum.
Author Contributions
Conceptualization, Y.T. and J.-P.M.; methodology, Y.T. and S.D.; software, Y.T. and S.D.; validation, Y.T. and J.-P.M.; formal analysis, Y.T.; investigation, Y.T., J.-P.M., and S.J.C.; resources, Y.T., J.-P.M., N.T., and G.C.; data curation, Y.T., J.-P.M., S.J.C., N.T., and G.C.; writing—original draft preparation, Y.T.; writing—review and editing, Y.T., J.-P.M., S.D., and S.J.C.; visualization, Y.T.; supervision, J.-P.M.; project administration, Y.T. and J.-P.M.; funding acquisition, Y.T., J.-P.M., and S.J.C. All authors have read and agreed to the published version of the manuscript.
Funding
The research leading to these results received funding from the UKSA Aurora programme (2018-2021) under grant no. ST/S001891/1 as well as partial funding from the STFC MSSL Consolidated Grant ST/K000977/1. S.J.C. is grateful to the French Space Agency CNES for supporting her CaSSIS and HiRISE related work.
Institutional Review Board Statement
Not applicable.
Informed Consent Statement
Not applicable.
Data Availability Statement
Not applicable.
Acknowledgments
The research leading to these results is receiving funding from the UKSA Aurora programme (2018-2021) under grant ST/S001891/1, as well as partial funding from the STFC MSSL Consolidated Grant ST/K000977/1. SJC is grateful to the French Space Agency CNES for supporting her CaSSIS and HiRISE related work. CaSSIS is a project of the University of Bern and funded through the Swiss Space Office via ESA’s PRODEX programme. The instrument hardware development was also supported by the Italian Space Agency (ASI) (ASI-INAF agreement no. 2020-17-HH.0), INAF/Astronomical Observatory of Padova, and the Space Research Center (CBK) in Warsaw. Support from SGF (Budapest), the University of Arizona (Lunar and Planetary Lab.), and NASA are also gratefully acknowledged. Operations support from the UK Space Agency under grant ST/R003025/1 is also acknowledged.
Conflicts of Interest
The authors declare no conflict of interest.
References
- Neukum, G.; Jaumann, R. August. HRSC: The high resolution stereo camera of Mars Express. Sci. Payload 2004, 1240, 17–35. [Google Scholar]
- Thomas, N.; Cremonese, G.; Ziethe, R.; Gerber, M.; Brändli, M.; Bruno, G.; Erismann, M.; Gambicorti, L.; Gerber, T.; Ghose, K.; et al. The colour and stereo surface imaging system (CaSSIS) for the ExoMars trace gas orbiter. Space Sci. Rev. 2017, 212, 1897–1944. [Google Scholar] [CrossRef]
- Malin, M.C.; Bell, J.F.; Cantor, B.A.; Caplinger, M.A.; Calvin, W.M.; Clancy, R.T.; Edgett, K.S.; Edwards, L.; Haberle, R.M.; James, P.B.; et al. Context camera investigation on board the Mars Reconnaissance Orbiter. J. Geophys. Res. Planets 2007, 112. [Google Scholar] [CrossRef]
- McEwen, A.S.; Eliason, E.M.; Bergstrom, J.W.; Bridges, N.T.; Hansen, C.J.; Delamere, W.A.; Grant, J.A.; Gulick, V.C.; Herkenhoff, K.E.; Keszthelyi, L.; et al. Mars reconnaissance orbiter’s high resolution imaging science experiment (HiRISE). J. Geophys. Res. Planets 2007, 112. [Google Scholar] [CrossRef]
- Kirk, R.L.; Howington-Kraus, E.; Rosiek, M.R.; Anderson, J.A.; Archinal, B.A.; Becker, K.J.; Cook, D.A.; Galuszka, D.M.; Geissler, P.E.; Hare, T.M.; et al. Ultrahigh resolution topographic mapping of Mars with MRO HiRISE stereo images: Meter-scale slopes of candidate Phoenix landing sites. J. Geophys. Res. Planets 2008, 113. [Google Scholar] [CrossRef]
- Beyer, R.A.; Alexandrov, O.; McMichael, S. The Ames Stereo Pipeline: NASA’s open source software for deriving and processing terrain data. Earth Space Sci. 2018, 5, 537–548. [Google Scholar] [CrossRef]
- Shin, D.; Muller, J.P. Progressively weighted affine adaptive correlation matching for quasi-dense 3D reconstruction. Pattern Recognit. 2012, 45, 3795–3809. [Google Scholar] [CrossRef]
- Tao, Y.; Muller, J.P.; Sidiropoulos, P.; Xiong, S.T.; Putri, A.R.D.; Walter, S.H.G.; Veitch-Michaelis, J.; Yershov, V. Massive stereo-based DTM production for Mars on cloud computers. Planet. Space Sci. 2018, 154, 30–58. [Google Scholar] [CrossRef]
- Tao, Y.; Muller, J.P.; Poole, W. Automated localisation of Mars rovers using co-registered HiRISE-CTX-HRSC orthorectified images and wide baseline Navcam orthorectified mosaics. Icarus 2016, 280, 139–157. [Google Scholar] [CrossRef]
- Tao, Y.; Conway, S.J.; Muller, J.-P.; Putri, A.R.D.; Thomas, N.; Cremonese, G. Single Image Super-Resolution Restoration of TGO CaSSIS Colour Images: Demonstration with Perseverance Rover Landing Site and Mars Science Targets. Remote Sens. 2021, 13, 1777. [Google Scholar] [CrossRef]
- Douté, S.; Jiang, C. Small-Scale Topographical Characterization of the Martian Surface With In-Orbit Imagery. IEEE Trans. Geosci. Remote Sens. 2019, 58, 447–460. [Google Scholar] [CrossRef]
- Jiang, C.; Douté, S.; Luo, B.; Zhang, L. Fusion of photogrammetric and photoclinometric information for high-resolution DEMs from Mars in-orbit imagery. ISPRS J. Photogramm. Remote Sens. 2017, 130, 418–430. [Google Scholar] [CrossRef]
- Tao, Y.; Michael, G.; Muller, J.P.; Conway, S.J.; Putri, A.R. Seamless 3 D Image Mapping and Mosaicing of Valles Marineris on Mars Using Orbital HRSC Stereo and Panchromatic Images. Remote Sens. 2021, 13, 1385. [Google Scholar] [CrossRef]
- Vago, J.L.; Westall, F.; Coates, A.J.; Jaumann, R.; Korablev, O.; Ciarletti, V.; Mitrofanov, I.; Josset, J.L.; De Sanctis, M.C.; Bibring, J.P.; et al. Habitability on early Mars and the search for biosignatures with the ExoMars Rover. Astrobiology 2017, 17, 471–510. [Google Scholar] [CrossRef] [PubMed]
- Quantin-Nataf, C.; Carter, J.; Mandon, L.; Thollot, P.; Balme, M.; Volat, M.; Pan, L.; Loizeau, D.; Millot, C.; Breton, S.; et al. Oxia Planum: The Landing Site for the ExoMars “Rosalind Franklin” Rover Mission: Geological Context and Prelanding Interpretation. Astrobiology 2021, 21, 345–366. [Google Scholar] [CrossRef]
- Lim, B.; Son, S.; Kim, H.; Nah, S.; Mu Lee, K. Enhanced deep residual networks for single image super-resolution. In Proceedings of the IEEE Conference on Computer Vision and Pattern Recognition Workshops, Honolulu, HI, USA, 21–26 July 2017; pp. 136–144. [Google Scholar]
- Yu, J.; Fan, Y.; Yang, J.; Xu, N.; Wang, Z.; Wang, X.; Huang, T. Wide Activation for Efficient and Accurate Image Super-Resolution. arXiv 2018, arXiv:1808.08718. [Google Scholar]
- Ahn, N.; Kang, B.; Sohn, K.A. Fast, accurate, and lightweight super-resolution with cascading residual network. In Proceedings of the European Conference on Computer Vision (ECCV), Munich, Germany, 8–14 September 2018; pp. 252–268. [Google Scholar]
- Kim, J.; Lee, J.K.; Lee, K.M. Deeply-recursive convolutional network for image super-resolution. In Proceedings of the IEEE Conference on Computer Vision and Pattern Recognition, Las Vegas, NV, USA, 27–30 June 2016; pp. 1637–1645. [Google Scholar]
- Tai, Y.; Yang, J.; Liu, X. Image super-resolution via deep recursive residual network. In Proceedings of the IEEE Conference on Computer Vision and Pattern Recognition, Honolulu, HI, USA, 21–26 July 2017; pp. 3147–3155. [Google Scholar]
- Wang, C.; Li, Z.; Shi, J. Lightweight Image Super-Resolution with Adaptive Weighted Learning Network. arXiv 2019, arXiv:1904.02358. [Google Scholar]
- Zhang, Y.; Li, K.; Li, K.; Wang, L.; Zhong, B.; Fu, Y. Image super-resolution using very deep residual channel attention networks. In Proceedings of the European Conference on Computer Vision (ECCV), Munich, Germany, 8–14 September 2018; pp. 286–301. [Google Scholar]
- Ledig, C.; Theis, L.; Huszár, F.; Caballero, J.; Cunningham, A.; Acosta, A.; Aitken, A.; Tejani, A.; Totz, J.; Wang, Z.; et al. Photo-realistic single image super-resolution using a generative adversarial network. In Proceedings of the IEEE Conference on Computer Vision and Pattern Recognition, Honolulu, HI, USA, 21–26 July 2017; pp. 4681–4690. [Google Scholar]
- Sajjadi, M.S.; Scholkopf, B.; Hirsch, M. EnhanceNet: Single image super-resolution through automated texture synthesis. In Proceedings of the IEEE International Conference on Computer Vision, Venice, Italy, 22–29 October 2017; pp. 4491–4500. [Google Scholar]
- Wang, X.; Yu, K.; Wu, S.; Gu, J.; Liu, Y.; Dong, C.; Qiao, Y.; Change Loy, C. ESRGAN: Enhanced super-resolution generative adversarial networks. In Proceedings of the European Conference on Computer Vision (ECCV) Workshops, Munich, Germany, 8–14 September 2018. [Google Scholar]
- Rakotonirina, N.C.; Rasoanaivo, A. ESRGAN+: Further improving enhanced super-resolution generative adversarial network. In Proceedings of the ICASSP 2020–2020 IEEE International Conference on Acoustics, Speech and Signal Processing (ICASSP), Barcelona, Spain, 4 May 2020; pp. 3637–3641. [Google Scholar]
- Ma, W.; Pan, Z.; Yuan, F.; Lei, B. Super-Resolution of Remote Sensing Images via a Dense Residual Generative Adversarial Network. Remote Sens. 2019, 11, 2578. [Google Scholar] [CrossRef]
- Pouliot, D.; Latifovic, R.; Pasher, J.; Duffe, J. Landsat super-resolution enhancement using convolution neural networks and Sentinel-2 for training. Remote Sens. 2018, 10, 394. [Google Scholar] [CrossRef]
- Beaulieu, M.; Foucher, S.; Haberman, D.; Stewart, C. Deep Image-To-Image Transfer Applied to Resolution Enhancement of Sentinel-2 Images. In Proceedings of the IGARSS 2018–2018 IEEE International Geoscience and Remote Sensing Symposium, Valencia, Spain, 22–27 July 2018; pp. 2611–2614. [Google Scholar]
- Salgueiro Romero, L.; Marcello, J.; Vilaplana, V. Super-Resolution of Sentinel-2 Imagery Using Generative Adversarial Networks. Remote Sens. 2020, 12, 2424. [Google Scholar] [CrossRef]
- Tao, Y.; Muller, J.P. A novel method for surface exploration: Super-resolution restoration of Mars repeat-pass orbital imagery. Planet. Space Sci. 2016, 121, 103–114. [Google Scholar] [CrossRef]
- Van Diggelen, J. A photometric investigation of the slopes and the heights of the ranges of hills in the Maria of the moon. Bull. Astron. Inst. Neth. 1951, 11, 283. [Google Scholar]
- Rindfleisch, T. Photometric method for lunar topography (photometric method for deriving lunar surface elevation information from single picture). Jet Propuls. Lab. Rep. 1966, 32, 262–276. [Google Scholar]
- Horn, B.K.P. Shape from Shading: A Method for Obtaining the Shape of a Smooth Opaque Object from One View. Ph.D. Thesis, Massachusetts Institute of Technology, Cambridge, MA, USA, November 1970. [Google Scholar]
- Kirk, R.A. Fast Finite-Element Algorithm for Two-Dimensional Photoclinometry. Ph.D. Thesis, California Institute of Technology, Pasadena, CA, USA, 1987. [Google Scholar]
- Zhang, R.; Tsai, P.-S.; Cryer, J.E.; Shah, M. Shape from shading: A survey. IEEE Trans. Pattern Anal. Mach. Intell. 1999, 21, 690–706. [Google Scholar] [CrossRef]
- Durou, J.-D.; Falcone, M.; Sagona, M. Numerical methods for shape-from-shading: A new survey with benchmarks. Comput. Vis. Image Underst. Vis. 2008, 109, 22–43. [Google Scholar] [CrossRef]
- Oliensis, J. Uniqueness in Shape from Shading. Int. J. Comput. Vis. 1991, 6, 75–104. [Google Scholar] [CrossRef]
- Brooks, M.J.; Chojnacki, W.; Kozera, R. Impossible and Ambiguous Shading Patterns. Int. J. Comput. Vis. 1992, 7, 119–126. [Google Scholar] [CrossRef]
- Kozera, R. Uniqueness in Shape from Shading Revisited. J. Math. Imaging Vis. 1997, 7, 123–138. [Google Scholar] [CrossRef]
- Rouy, E.; Tourin, A. A Viscosity Solutions Approach to Shape-from-shading. SIAM J. Numer. Anal. 1992, 29, 867–884. [Google Scholar] [CrossRef]
- Oliensis, J.; Dupuis, P. A Global Algorithm for Shape from Shading. In Proceedings of the 4th IEEE International Conference on Computer Vision, Berlin, Germany, 11–14 May 1993; pp. 692–701. [Google Scholar]
- Camilli, F.; Siconol, A. Maximal Subsolutions of a Class of Degenerate Hamilton-Jacobi Problems. Indiana Univ. Math. J. 1999, 48, 1111–1131. [Google Scholar] [CrossRef]
- Camilli, F.; Grüne, L. Numerical Approximation of the Maximal Solutions for a Class of Degenerate Hamilton-Jacobi Equations. SIAM J. Numer. Anal. 2000, 38, 1540–1560. [Google Scholar] [CrossRef]
- Kain, J.; Ostrov, D.N. Numerical Shape-from-Shading for Discontinuous Photographic Images. Int. J. Comput. Vis. 2001, 44, 163–173. [Google Scholar] [CrossRef]
- Prados, E.; Faugeras, O. A Mathematical and Algorithmic Study of the Lambertian SFS Problem for Orthographic and Pinhole Cameras; Rapport 45 de Recherche 5005; Institut National de Recherche en Informatique et en Automatique: Sophia Antipolis, Valbonne, France, November 2003. [Google Scholar]
- Szeliski, R. Fast Shape from Shading. Comput. Vis. Graph. Image Process. Image Underst. 1991, 53, 129–153. [Google Scholar] [CrossRef]
- Pong, T.C.; Haralick, R.M.; Shapiro, L.G. Shape from Shading Using the Facet Model. Pattern Recognit. 1989, 22, 683–695. [Google Scholar] [CrossRef]
- Lee, K.M.; Kuo, C.-C.J. Shape from Shading with a Linear Triangular Element Surface Model. IEEE Trans. Pattern Anal. Mach. Intell. 1993, 15, 815–822. [Google Scholar] [CrossRef]
- Courteille, F.; Durou, J.-D.; Morin, G. A Global Solution to the SFS Problem Using B-spline Surface and Simulated Annealing. In Proceedings of the 18th International Conference on Pattern Recognition, Hong Kong, China, 20–24 August 2006; Volume II, pp. 332–335. [Google Scholar]
- Pentland, A.P. Local Shading Analysis. IEEE Trans. Pattern Anal. Mach. Intell. 1984, 6, 170–187. [Google Scholar] [CrossRef]
- Lee, C.-H.; Rosenfeld, A. Improved Methods of Estimating Shape from Shading Using the Light Source Coordinate System. Articial Intell. 1985, 26, 125–143. [Google Scholar] [CrossRef]
- Hayakawa, H.; Nishida, S.; Wada, Y.; Kawato, M. A Computational Model for Shape Estimation by Integration of Shading and Edge Information. Neural Netw. 1994, 7, 1193–1209. [Google Scholar] [CrossRef]
- Pentland, A.P. Linear Shape from Shading. Int. J. Comput. Vis. 1990, 4, 153–162. [Google Scholar] [CrossRef]
- Ulich, G. Provably Convergent Methods for the Linear and Nonlinear Shape from Shading Problem. J. Math. Imaging Vis. 1998, 9, 69–82. [Google Scholar] [CrossRef]
- Kozera, R.; Klette, R. Evaluation of Numerical Solution Schemes for Differential Equations. In Performance Characterization in Computer Vision; Klette, R., Stiehl, H.S., Viergever, M.A., Vincken, K.L., Eds.; Springer: Dordrecht, The Netherlands, 1999; Volume 17, pp. 153–166. [Google Scholar]
- Soderblom, L.; Kirk, R.; Herkenhoff, K. Accurate fine-scale topography for the Martian south polar region from combining MOLA profiles and MOC NA images. In Proceedings of the Lunar and Planetary Science Conference, Houston, TX, USA, 11–15 March 2002; p. 1254. [Google Scholar]
- Kirk, R.L.; Barrett, J.M.; Soderblom, L.A. Photoclinometry made simple. In Proceedings of the ISPRS Working Group IV/9 Workshop ‘Advances in Planetary Mapping’, Houston, TX, USA, 24–28 February 2003; p. 4. [Google Scholar]
- Lohse, V.; Heipke, C.; Kirk, R.L. Derivation of planetary topography using multi-image shape-from-shading. Planet. Space Sci. 2006, 54, 661–674. [Google Scholar] [CrossRef]
- Gaskell, R.W.; Barnouin-Jha, O.S.; Scheeres, D.J.; Konopliv, A.S.; Mukai, T.; Abe, S.; Saito, J.; Ishiguro, M.; Kubota, T.; Hashimoto, T.; et al. Characterizing and navigating small bodies with imaging data. Meteorit. Planet. Sci. 2008, 43, 1049–1061. [Google Scholar] [CrossRef]
- Grumpe, A.M.; Wöhler, C. DEM construction and calibration of hyperspectral image data using pairs of radiance images. In Proceedings of the 2011 7th International Symposium on Image and Signal Processing and Analysis (ISPA), Dubrovnik, Croatia, 4–6 September 2011; pp. 609–614. [Google Scholar]
- Grumpe, A.; Belkhir, F.; Wöhler, C. Construction of lunar DEMs based on reflectance modelling. Adv. Space Res. 2014, 53, 1735–1767. [Google Scholar] [CrossRef]
- Wu, B.; Chung Liu, W.; Grumpe, A.; Wöhler, C. Shape and albedo from shading (SAfS) for pixel-level DEM generation from monocular images constrained by low-resolution DEM. ISPRS Int. Arch. Photogramm. Remote Sens. Spat. Inf. Sci. 2016, 41, 521–527. [Google Scholar] [CrossRef]
- Wu, B.; Liu, W.C.; Grumpe, A.; Wöhler, C. Construction of pixel-level resolution DEMs from monocular images by shape and albedo from shading constrained with low-resolution DEM. ISPRS J. Photogramm. Remote Sens. 2018, 140, 3–19. [Google Scholar] [CrossRef]
- Liu, W.C.; Wu, B.; Wöhler, C. Effects of illumination differences on photometric stereo shape-and-albedo-from-shading for precision lunar surface reconstruction. ISPRS J. Photogramm. Remote Sens. 2018, 136, 58–72. [Google Scholar]
- Alexandrov, O.; Beyer, R.A. Multiview Shape-From-Shading for Planetary Images. Earth Space Sci. 2018, 5, 652–666. [Google Scholar] [CrossRef]
- Soderblom, L.A.; Kirk, R.L. Meter-scale 3-D models of the Martian surface from combining MOC and MOLA data. In Proceedings of the Lunar and Planetary Science Conference, League City, TX, USA, 17–21 March 2003; p. 1730. [Google Scholar]
- O’Hara, R.; Barnes, D. A new shape from shading technique with application to Mars Express HRSC images. ISPRS J. Photogramm. Remote Sens. 2012, 67, 27–34. [Google Scholar] [CrossRef]
- Tyler, L.; Cook, T.; Barnes, D.; Parr, G.; Kirk, R. Merged shape from shading and shape from stereo for planetary topographic mapping. In Proceedings of the EGU General Assembly Conference Abstracts, Vienna, Austria, 27 April–2 May 2014; p. 16110. [Google Scholar]
- Hess, M.; Wohlfarth, K.; Grumpe, A.; Wöhler, C.; Ruesch, O.; Wu, B. Atmospherically compensated shape from shading on the martian surface: Towards the perfect digital terrain model of mars. Int. Arch. Photogramm. Remote Sens. Spat. Inf. Sci. 2019, XLII-2/W13, 1405–1411. [Google Scholar] [CrossRef]
- Hess, M. High Resolution Digital Terrain Model for the Landing Site of the Rosalind Franklin (ExoMars) Rover. Adv. Space Res. 2019, 53, 1735–1767. [Google Scholar]
- McMahon, S.K. Overview of the planetary data system. Planet. Space Sci. 1996, 44, 3–12. [Google Scholar] [CrossRef]
- Besse, S.; Vallat, C.; Barthelemy, M.; Coia, D.; Costa, M.; De Marchi, G.; Fraga, D.; Grotheer, E.; Heather, D.; Lim, T.; et al. ESA’s Planetary Science Archive: Preserve and present reliable scientific data sets. Planet. Space Sci. 2018, 150, 131–140. [Google Scholar] [CrossRef]
- Cai, G.R.; Jodoin, P.M.; Li, S.Z.; Wu, Y.D.; Su, S.Z.; Huang, Z.K. Perspective-SIFT: An efficient tool for low-altitude remote sensing image registration. Signal Process. 2013, 93, 3088–3110. [Google Scholar] [CrossRef]
- Lowe, D.G. Distinctive image features from scale-invariant keypoints. Int. J. Comput. Vis. 2004, 60, 91–110. [Google Scholar] [CrossRef]
- Roujean, J.L.; Leroy, M.; Deschamps, P.Y. A bidirectional reflectance model of the Earth’s surface for the correction of remote sensing data. J. Geophys. Res. Atmos. 1992, 97, 20455–20468. [Google Scholar] [CrossRef]
- Wanner, W.; Strahler, A.; Hu, B.; Lewis, P.; Muller, J.-P.; Li, X.; Schaaf, C.; Barnsley, M. Global retrieval of bidirectional reflectance and albedo over land from EOS MODIS and MISR data: Theory and algorithm. J. Geophys. Res. Atmos. 1997, 102, 17143–17161. [Google Scholar] [CrossRef]
- Lucht, W.; Schaaf, C.B.; Strahler, A.H. An algorithm for the retrieval of albedo from space using semiempirical BRDF models. IEEE Trans. Geosci. Remote Sens. 2000, 38, 977–998. [Google Scholar] [CrossRef]
- Ceamanos, X.; Douté, S.; Fernando, J.; Schmidt, F.; Pinet, P.; Lyapustin, A. Surface reflectance of Mars observed by CRISM/MRO: Multi-angle Approach for Retrieval of Surface Reflectance from CRISM observations (MARS-ReCO). J. Geophys. Res. Planets 2013, 118, 540–559. [Google Scholar] [CrossRef]
- Vincendon, M. Mars surface phase function constrained by orbital observations. Planet. Space Sci. 2013, 76, 87–95. [Google Scholar] [CrossRef][Green Version]
- Goodfellow, I.J.; Pouget-Abadie, J.; Mirza, M.; Xu, B.; Warde-Farley, D.; Ozair, S.; Courville, A.; Bengio, Y. Generative Adversarial Networks. arXiv 2014, arXiv:1406.2661. [Google Scholar] [CrossRef]
- Jolicoeur-Martineau, A. The relativistic discriminator: A key element missing from standard GAN. arXiv 2018, arXiv:1807.00734. [Google Scholar]
- Murchie, S.; Arvidson, R.; Bedini, P.; Beisser, K.; Bibring, J.P.; Bishop, J.; Boldt, J.; Cavender, P.; Choo, T.; Clancy, R.T.; et al. Compact reconnaissance imaging spectrometer for Mars (CRISM) on Mars reconnaissance orbiter (MRO). J. Geophys. Res. Planets 2007, 112. [Google Scholar] [CrossRef]
Publisher’s Note: MDPI stays neutral with regard to jurisdictional claims in published maps and institutional affiliations. |
© 2021 by the authors. Licensee MDPI, Basel, Switzerland. This article is an open access article distributed under the terms and conditions of the Creative Commons Attribution (CC BY) license (https://creativecommons.org/licenses/by/4.0/).

