1. Introduction
Convective storms are common meteorological phenomena in many areas of the world during warm seasons that comprise complex processes at various spatial and temporal scales [
1,
2,
3]. Severe convective storms may bring along hazards such as hail or wind damage by strong small-scale downbursts or tornadoes, as well as flash floods [
4,
5]. Convective storms have considerable economic effect as in Europe they cause an estimated € 5–7 bn losses each year [
6]. These storms are also an increasing source of weather-related fatalities as they are not forecasted sufficiently early [
7,
8]. The nowcasting of convective storm initiation and development has been an ongoing issue due to its complexity [
9]. Regardless of the notable evolution of the numerical weather prediction models in the last decades, their accuracy for convective storm forecasting cannot meet the requirements of the end-users. Several case studies have been performed using various data sources [
10,
11,
12]. Still, more profound knowledge of convective storms based on long-term datasets is required to establish reliable nowcasting conditions [
13]. This kind of information is also helpful for verifying regional climate models and more widely in all fields affected by convective storms.
Convective storm research has progressed significantly in the last 50 years, along with the introduction of remote sensing methods and numerical modelling development [
14]. Earlier studies based on observations made at weather stations suffered predominantly from bias caused by the sparse weather station network and temporal resolution. Several lightning detection networks provide data for detailed, up to kilometre-scale, global and regional climatologies of thunderstorms [
15,
16,
17], but miss convective storms when they do not produce lightning. Satellite observations can provide characteristics of convective clouds for extensive areas, but the data they provide are mostly very limited or not available for the higher midlatitudes [
18]. Atmospheric reanalysis models such as European Centre for Medium-Range Weather Forecasts (ECMWF) ERA5 provide up to 30-kilometre resolution global climatologies of environmental conditions favourable for convective activity [
19]. Based on these various datasets, several pan-European climatologies of thunderstorms have been constructed [
20,
21]. Compared to the sources mentioned above, the use of ground-based weather radar has multiple benefits. It allows detecting early initiation and further development and the size and arrangement of storm areas in high spatiotemporal resolution. Nevertheless, radar measurements are affected by various sources of error, such as beam blockage, clutter, beam overshooting, and attenuation [
22]. Because of the inconsistencies in the technical aspects of radar data from various countries, it has not been used in pan-European studies of convective storms [
21] and has been limited to country-specific analyses [
23,
24,
25].
Several analyses using long-term radar datasets can be found in the literature. Such studies commonly rely on storm detection and tracking algorithms like Thunderstorm Identification, Tracking, Analysis and Nowcasting (TITAN, [
26]) or Storm Cell Identification Tracking (SCIT, [
27]). The detection is generally based on a set reflectivity threshold, and reliable tracking requires data from frequent scan intervals of around 5 minutes [
28]. The conventional approach is to establish the study solely on weather radar data. For example, Burcea et al. [
29] constructed a 15-year climatology of convective storms in Romania based on radar data. Goudenhoofdt and Delobbe [
30] analysed the statistical characteristics of more than 1 million storms and their tracks identified from 10 years of 5-minute datasets in Belgium. Fewer studies make use of additionally determining the convective environments from model data and investigation of the relation between convective storm activity and weather regimes. In Austria, Kaltenboeck and Steinheimer [
31] used ECMWF ERA-Interim reanalysis model output in conjunction with radar reflectivity to derive severe convective storm climatology related to wind shear and atmospheric instability.
In Estonia, there are very few studies about convective storms. The earlier works that used data until the beginning of the 21st century were based on observations made at weather stations [
32]. In the recent decade, based on the data since the beginning of the 21st century, the general distribution of thunderstorms in Estonia is known based on lightning detector data [
16,
17]. Weather radar data archive has been available in Estonia since 2010. So far, it has been used to analyse thunderstorm hail and lightning detection parameters [
33] and for quantitative precipitation estimation using polarimetric data [
34]. However, a convective storm analysis relying primarily on a long-term set of radar data is missing.
This work aims to provide a better understanding of the spatial and temporal distribution of convective storms over Estonia using data over an observation period of 9 years. The first task is to find suitable thresholds to define a severe convective storm utilising a combination of multiple parameters.
Section 2 describes the datasets and methods used in the study. Results are provided in
Section 3. The findings of the study are discussed in a broader context in
Section 4. Conclusions are drawn in
Section 5.
2. Materials and Methods
Nine-years-long (2010–2019, 2017 excluded) time-series of Estonian Environment Agency (EstEA) Sürgavere polarimetric weather radar data allows investigating the extent of the spatial distribution of severe storms. Data from the warm season, 5 months from May to September, were used. This is when more than 99% of convective storms in Estonia occur [
35]. Weather radars give the best spatial and temporal resolution (1 km, 15 min) available in higher mid-latitudes for these purposes. More detailed information about conditions in the atmosphere was obtained from model data. Territorial distributions of storms were filtered using indices calculated from ERA5 reanalysis data to evaluate the reliability. Several thresholds for convective available potential energy (CAPE) index and the wind shear between the 10 m and 500 hPa level were used for that purpose [
31]. Circulation types and prevailing airflow directions were calculated from reanalysis to assess the climatological representativity of these 9 years. Lightning detection network data were used for verification of the convective storm cells detected from radar data. An overview of the used datasets is provided in
Table 1. The study domain covers Estonia and some adjacent areas (
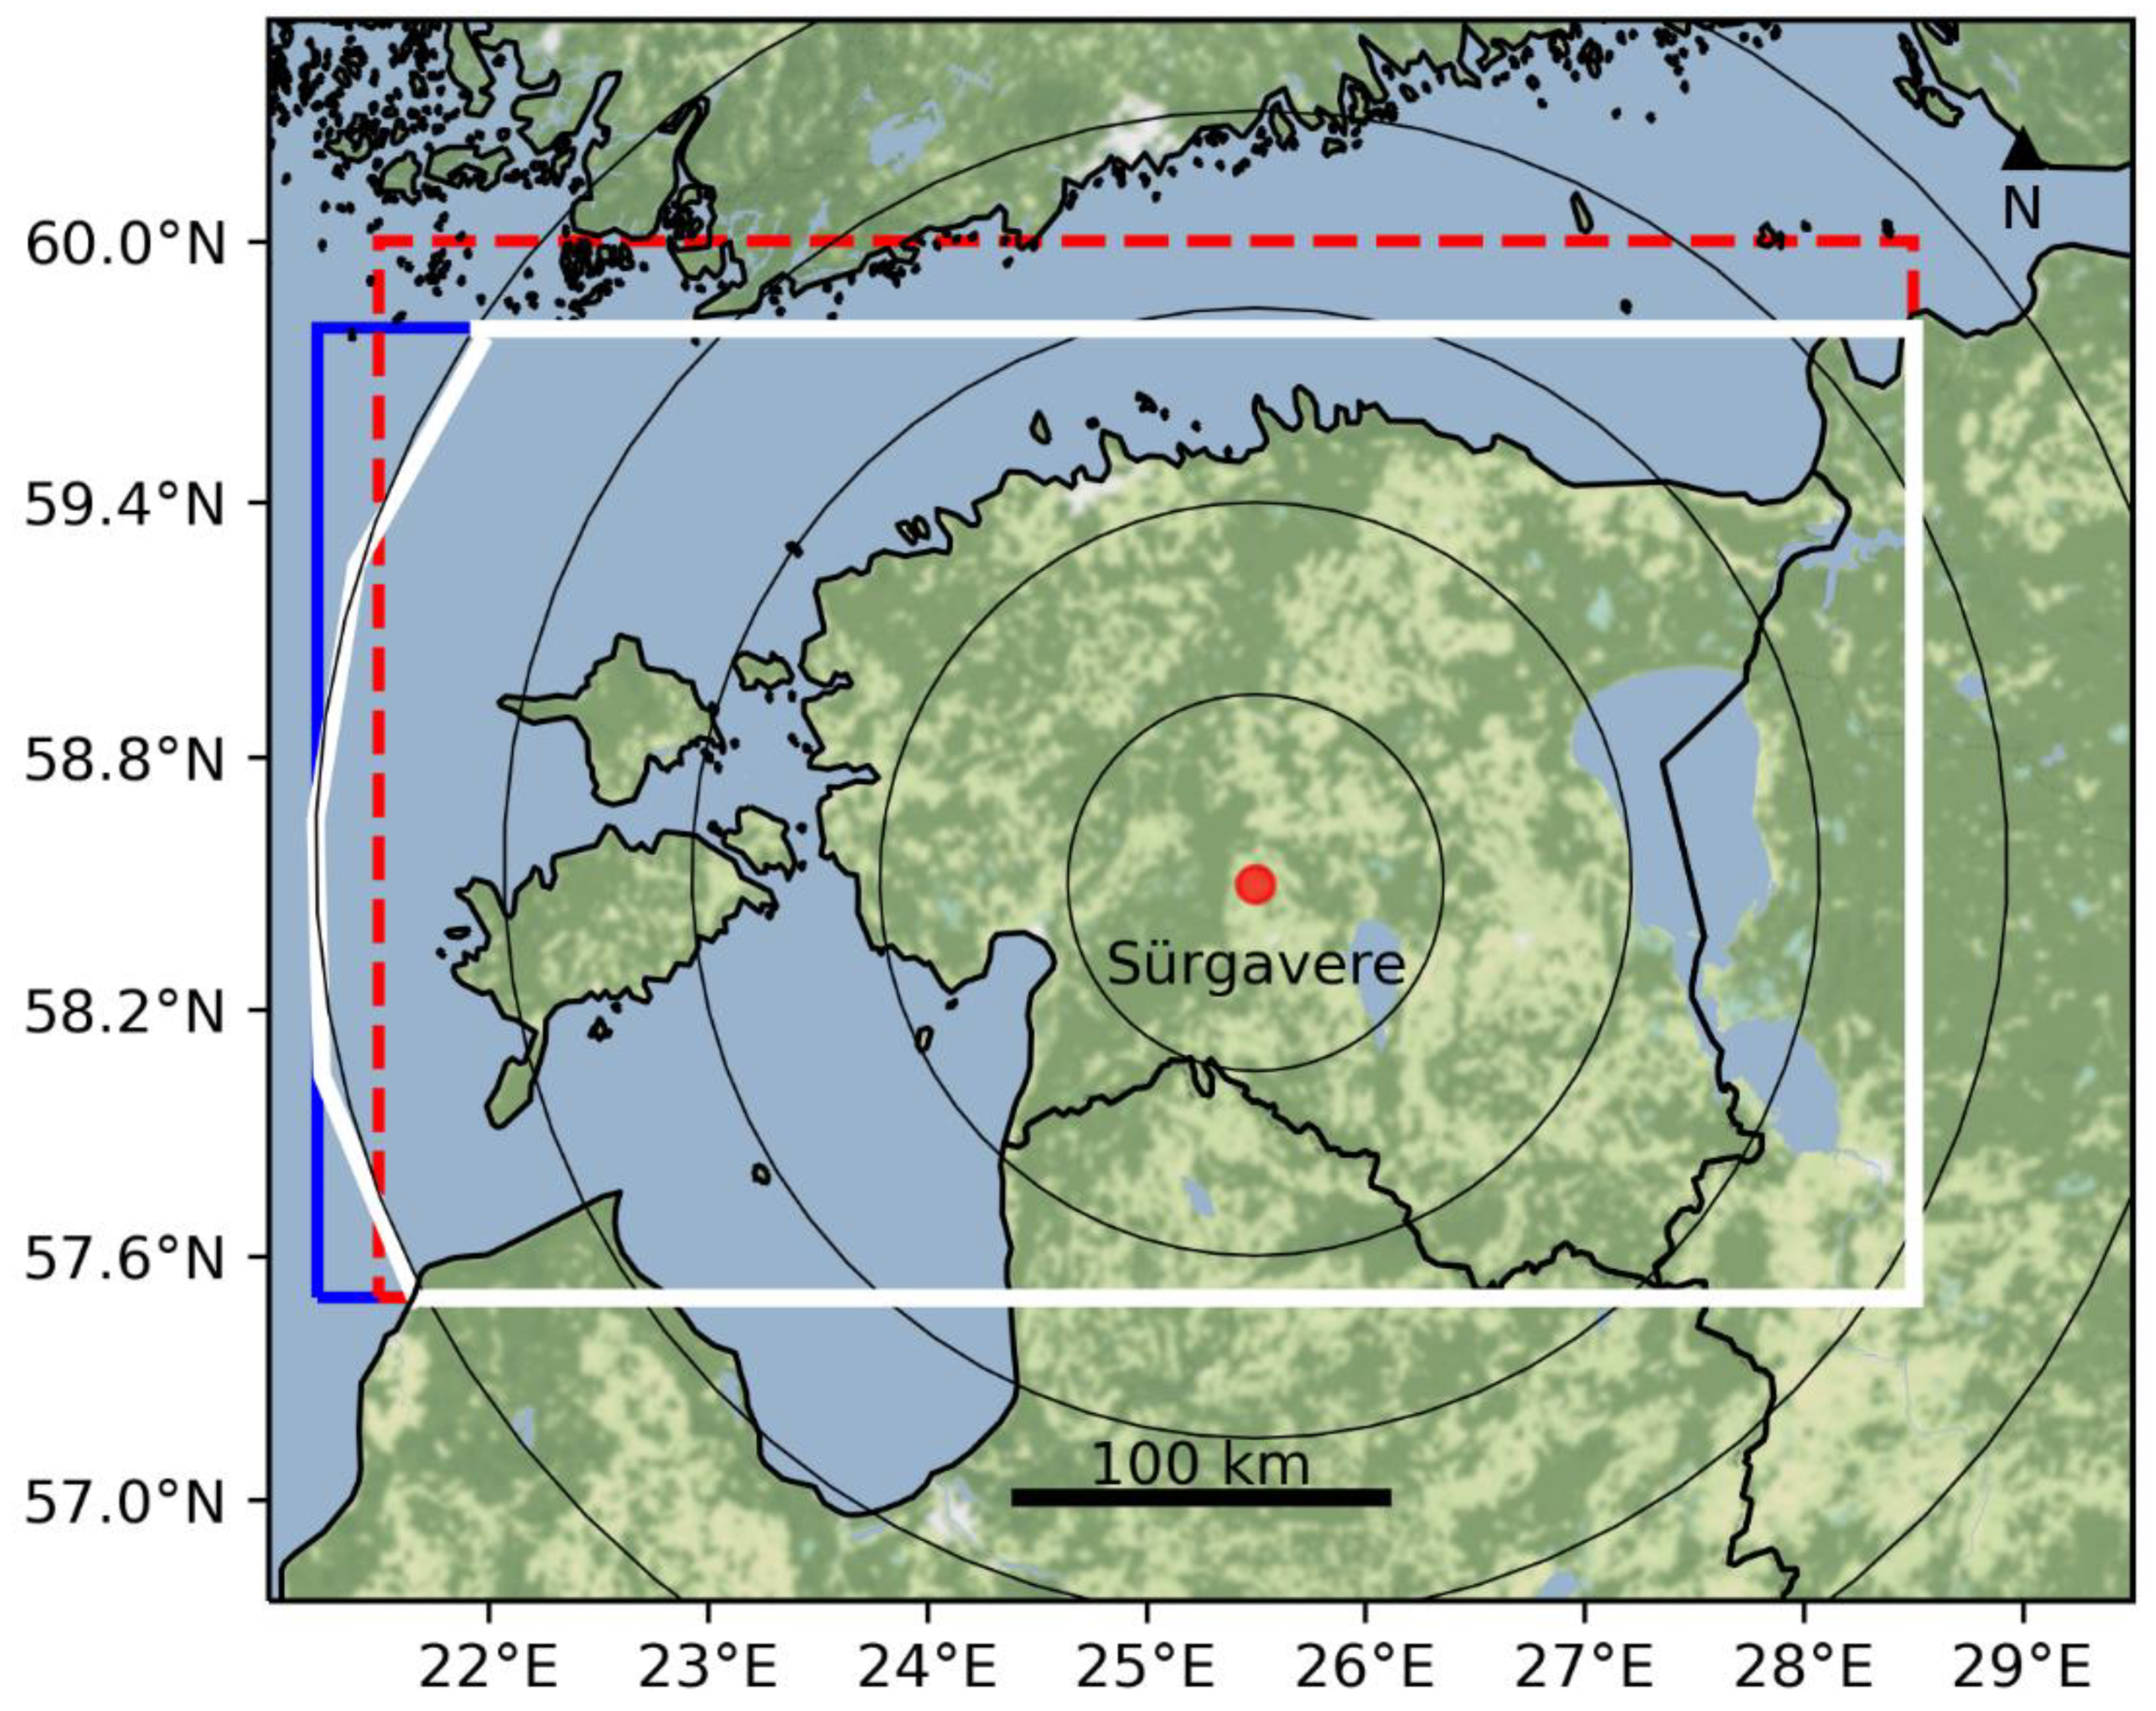
Figure 1).
There needs to be a higher reflectivity threshold and a threshold for CAPE to distinguish severe convective storms. The daily cycles of CAPE and maximum reflectivity of initial convective cells were compared to maximise the use of ERA5. For spatial analysis, the CAPE values from the closest point to the detected cell and from the approximate centre of Estonia were compared. These comparisons determine which CAPE value to choose for the detected cell concerning the timestep and location. Threshold selection was based on reflectivity and CAPE distributions. Four groups of storms were chosen based on the environment to verify the threshold selections for severe convective storms. The idea was to look at extreme cases of low/high CAPE and low/high vertical wind shear (VWS). At the same time, the size distribution for four different combinations should reveal the consistency of convective storms theory that CAPE plays a more substantial role in the formation and growth of the storms than VWS [
31]. The daily cycle of convective inhibition (CIN) was also analysed to see if it correlates with the intensity of the detected convective cells and CAPE values.
Python programming language was used to process data and plot the results. Python module netCDF4 was used to read reanalysis NetCDF format data [
36]. Other main Python modules used were numpy [
37], pandas [
38], and matplotlib [
39]. Spatial distribution maps were generated using the Python module cartopy [
40] alongside with 10 × 10 km map sheets from the Estonian Basic Map provided by the Estonian Land Board [
41].
2.1. Radar Data
Data from the EstEA-operated dual-polarisation Doppler C-band radar located in Sürgavere were used in this study. Detailed radar specifications, scan settings, and location description are provided in Voormansik et al. [
33]. All scanned data are archived in original spatial resolution and 16-bit data resolution. For this study, the horizontal reflectivity from the lowest scan of 0.5 degrees was used. Radar data were corrected using Doppler processing and speckle and clutter to signal ratio filtering to remove ground clutter. Polarimetric hydrometeor classification-based filtering was used to eliminate other non-meteorological targets from the data [
42].
Nine years of warm season (1 May to 30 September) radar data were used from 2010–2019. Data from 2017 were excluded because of the poor quality due to technical issues of the radar. The years 2012, 2014, and 2016 were the worst years as each of these had a month with less than 90% of data available. Those periods can be associated with serious radar system malfunctions. Other reasons for missing data were scheduled radar maintenance, data transmission errors, or other various more minor technical issues. Overall, the data availability was still reasonably high, with a total average of 95.44%.
Computer vision algorithms are extensively used to detect and track convective storms. In the current study, the initial convective cells were distinguished using the method used in Voormansik et al. [
33]. The approach was initially adopted from various earlier convective storm tracking algorithms (e.g., [
26,
27]). Cells were distinguished from the horizontal reflectivity field by using a 35 dBZ threshold. These are referred to as initial convective cells in the paper as well. Thresholds usually vary in the range 30–45 dBZ [
43,
44,
45,
46]. Lower values allow detecting convective storms in their earlier phases, while higher values are better for distinguishing individual convective cores. Therefore, by using the 35 dBZ threshold, we could better detect entire storm systems already in relatively early phases. On the other hand, it must be considered that a low threshold also allows possible misinterpretation of stratiform precipitation regions as weak convective cells. Reanalysis model data were used to isolate those cases.
The Python ARM Radar Toolkit (Py-ART) was used to ingest raw radar data in radar coordinates and generate georeferenced Cartesian reflectivity grids [
47]. Those grids were then processed using OpenCV to find 35 dBZ initial convective cells and the properties of each cell [
48]. Many descriptive parameters were derived for each identified cell to analyse and classify the storms: geographical coordinates of the centre point, area, mean and maximum reflectivity. Cells with a smaller size than 5 km
2 were omitted from further analysis to eliminate clutter.
2.2. Lightning Detector Data
A nine-year (2010–2019, 2017 excluded) record of lightning detector data was obtained from the Nordic Lightning Information System (NORDLIS). As of July 2020, NORDLIS is a network of about 39 Vaisala low-frequency sensors located in Denmark, Estonia, Finland, Latvia, Lithuania, Norway, and Sweden. For Finland, Tuomi and Mäkelä [
49] found the first stroke detection efficiency for cloud-to-ground (CG) lightning to be around 95%. Because of the limited capability of the network to detect intracloud lightning, only CG lightning flash data were derived from the NORDLIS dataset. The first sensor was installed in the South-East part of Estonia in Tõravere in June 2005. Since then, a similar performance to Finland has been expected over most of Estonia. However, one must keep in mind that no NORDLIS sensors were installed to the east and south of Estonia. Consequently, the CG lightning detection efficiency in Estonia decreased slightly from the north to the south and the west to the east [
50]. The quality and detection efficiency has gradually increased in Estonia since new sensors have been installed over the years in the region. In March 2014, three new sensors were installed in Lithuania. In May 2017, a new sensor was installed in the Western part of Estonia in Lääne-Nigula and in September 2017 in the Western part of Latvia in Stende.
2.3. Local Environment and Synoptic-Scale Conditions
The synoptic forcing and local factors are initiating thunderstorms, but the fast mesoscale thermodynamic processes are ingredients of convection [
51]. Therefore, it is essential to characterise the environments in both scales. Mesoscale environments of the severe convective storms are characterised by severe-storm predictors representing both thermodynamic and dynamical conditions. The severity of thunderstorms has been found to depend on CAPE and VWS [
19,
52,
53]. Often some parameter characterising moisture abundance is included, like mixing ratio or precipitable water.
Nowadays, it is reasonable to use high-resolution model data from reanalyses for wind, moisture, and temperature fields for local and synoptic scale effects [
19,
51,
54]. Previous studies have been using conditional statistics to differentiate between severe and non-severe events or environments. For example, this threshold value for CAPE has been 100–150 J/kg [
31,
51,
55]. In Taszarek et al. [
55], the thunderstorm environment was defined with CAPE > 150 J/kg and convective precipitation (CP) derived from ERA 5 with threshold of CP > 0.25 mm/h and for severe thunderstorm environment CAPE > 150 J/kg, CP > 0.25 mm/h, VWS (6 km) > 10 m/s and (2*CAPE*VWS)
1/2 > 500 m
2s
−2. In this case, CAPE was calculated as the vertical integral of positive buoyancy from lifted condensation level to equilibrium for air parcel from 0–500 m above ground level mixed-layer with virtual temperature correction [
55].
Wind fields (10 m and 500 hPa level) and CAPE fields from 0.25 degrees resolution ERA5 reanalysis [
56] were chosen here to characterise the local scale atmospheric factors of convective storms. Heavy precipitation as rain or hail is a parameter connected to convective storms. Instead of convective precipitation, radar data were used. Our initial threshold for radar reflectivity of 35 dBZ corresponds to precipitation of 4.8 mm/h.
For describing synoptic-scale atmospheric circulation and flow direction, 500 hPa geopotential height (GPH) fields were classified using synoptic weather types by Jenkinson and Collison [
57]. For this task, the GPH values from 16 points in and around the study area were used to calculate six different flow indices, quantifying the geostrophic airflow and vorticity (see Post et al. [
58] for details). Jenkinson Collison’ circulation types (JCT) are defined by comparing the numeric values of the indices. There are 26 circulation types in the original version of the classification, but we have used the version with only eight directional types: W, NW, N, NE, E, SE, S, SW. So, we do have a synoptic-scale airflow over the area centred at Estonia (58.75°N, 25°E). The classification is widely used in Europe and elsewhere (e.g., [
58,
59,
60,
61,
62,
63]). The selected method offers the simplicity of interpretation but also flexibility to make sensitivity studies.
JCTs were calculated for all days between 1979 and 2019 using gridded GPH data of ERA5 reanalysis [
56] at 12:00 UTC. The software package cost733class [
64] was used. It offers a flexible way to calculate several circulation classifications with a variable number of types over an arbitrarily selected area. The frequency distributions of JCT circulation types were calculated for the whole period ERA5 available—1979–2019, to show the relevance of these 9 years for an average climatological situation.
3. Results
Validation of the method for detecting convective storms is limited. There is no appropriate observational data of convective storms or phenomena associated with them for this period. One possibility is to use data from lightning detectors. Still, it should be kept in mind that they miss convective storms when they do not produce lightning. More than half of CG flashes could belong to only 1 day with a powerful frontal thunder passage. This is valid for 2011, the year with the highest number of flashes, but with the smallest number of convective cells by our method. Therefore, we compare the numbers of thunder days and convective storm days and the counts of storm areas and lightning flashes.
3.1. Convective Storm Classification and Threshold Selection
The reflectivity threshold of 35 dBZ to derive initial individual convective cells is relatively low, meaning that convective conditions do not cause all initially detected cells. Both high CAPE and high reflectivity are preconditions for detecting convective cells, and the question is what the exact thresholds in Estonian conditions are. We assume that temporal and spatial resolution of ERA5 data allows us to select the best CAPE value to represent the environment of the convective cell, which is determined with the reflectivity threshold.
We start from daily cycles of radar reflectivity and CAPE, which are expected to be closely related. For the daily cycle of CAPE, the mean values of the warm season days over the study period over the Estonian mainland are calculated. For the daily cycle of reflectivity, the mean of maximum reflectivities is also calculated. This comparison determines which CAPE value to choose for the detected cell concerning the timestep. For spatial analysis, the CAPE value of the closest point to the detected cell and the CAPE value of the approximate centre of Estonia are compared and again, the highest values of CAPE are considered. This results in different combinations of CAPE values from different timesteps and locations. For the CAPE values, the median is chosen over the mean because, in Estonia, the fraction of the convective environment is not dominant; hence, there are many cases with CAPE values close to zero.
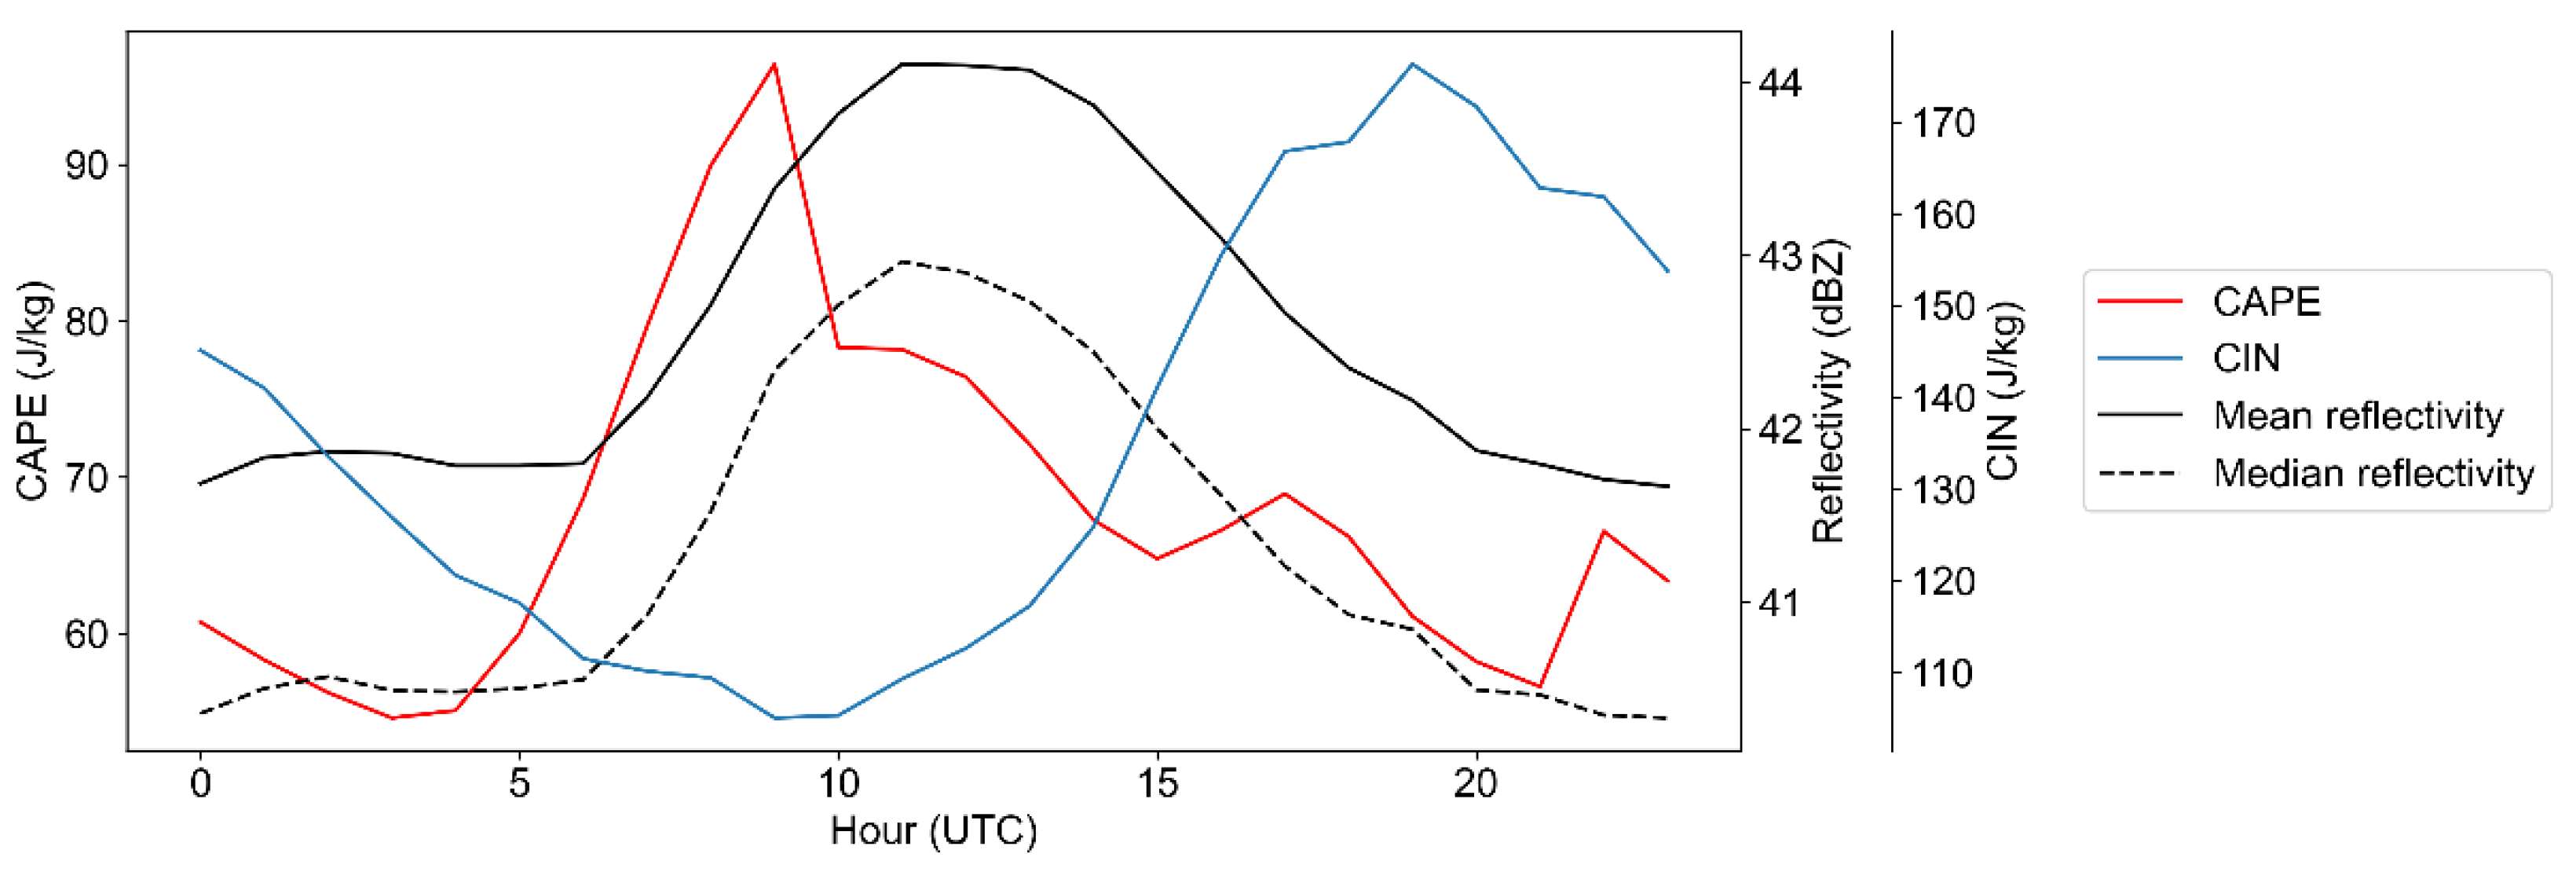
The daily cycles of maximum reflectivity of initial convective cells and CAPE in
Figure 2 show that daily maximums are not precisely at the same time. The data for CIN were analysed to explain this lack of coincidence. The maps (not presented here) show that the 9 UTC CAPE maximum is in the SW part of the mainland, and the higher values are explained by the fact that some parts of Northern Latvia are included in the study area. This also applies to the 17 UTC local maximum of CAPE. The maximum at 22 UTC is mainly due to high CAPE values over Lake Peipus. The only maximum when low CIN values coincide with high CAPE values is the 12 UTC local CAPE maximum. This also matches with the highest reflectivity maximum, given that 1 hour is enough for convective precipitation to form. To determine which CAPE value to assign to a specific cell from radar data, based on
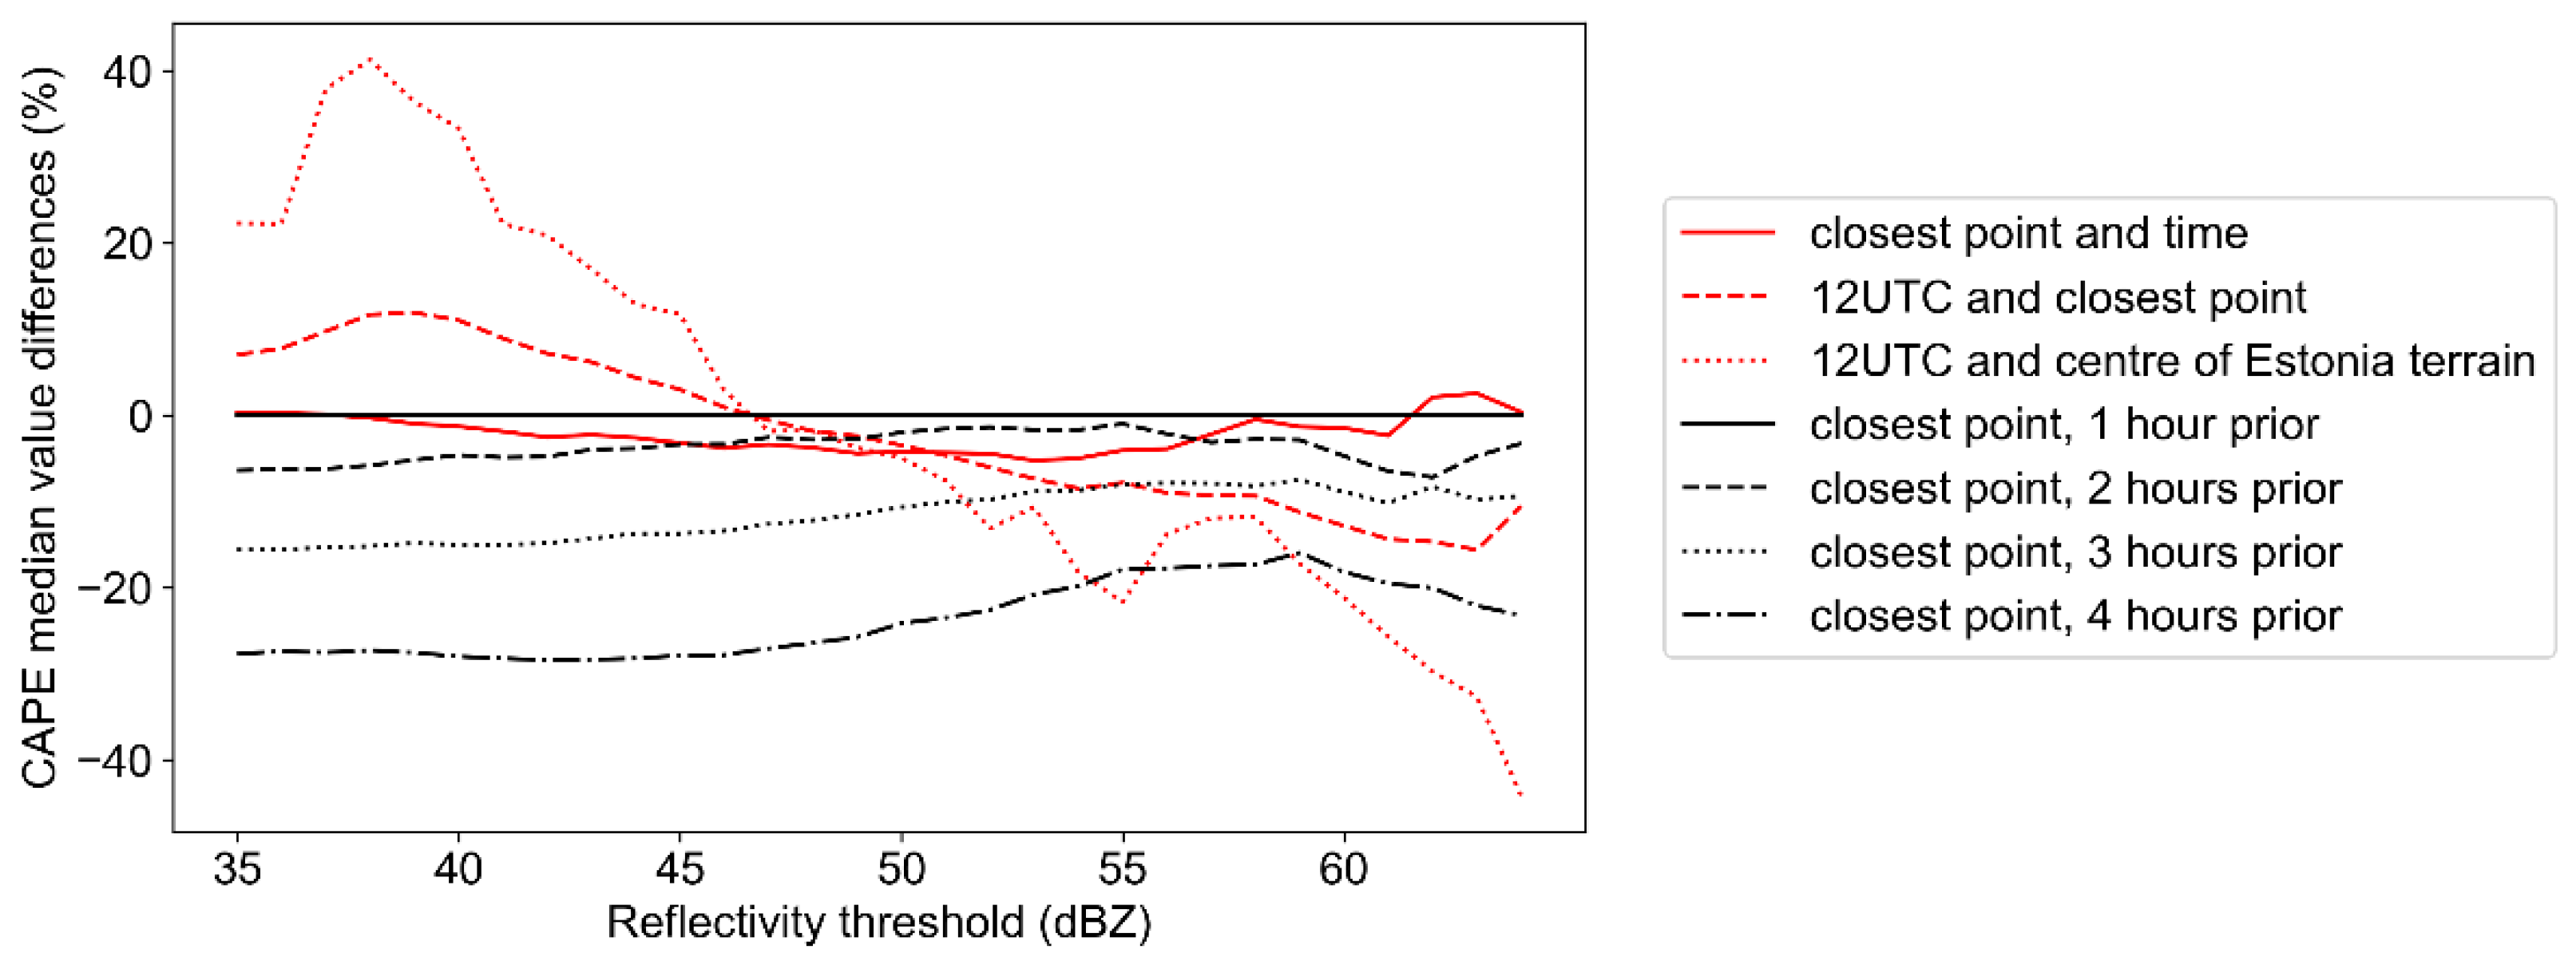
Figure 2, CAPE values starting from 4 hours before the detected cell and 1 hour later were compared to the closest point to the centre of the cell. The median of CAPE with various timestep and location combinations was calculated to select the reflectivity threshold for severe convective storms. The highest median Me
CAPE producing combination was then chosen to represent the CAPE corresponding to initial individual convective cells. Setting different thresholds from 35 dBZ to 65 dBZ and calculating the median CAPE value for each threshold and timestep/location combination, the results showed that from 47 dBZ and on, the highest median CAPE value originates from the closest grid points to the cells 1 hour before detecting the cells. Therefore, CAPE value from that point was considered the respective CAPE for every detected cell, and Me
CAPE was defined as the median value of those CAPE values. The fact that CAPE from the same point and location is the strongest with a reflectivity threshold of 62 dBZ is not considered because of the low number of cases.
Figure 3 represents the differences of various CAPE timestep/location combinations to the defined Me
CAPE.
From
Figure 3, six possible methods of determining the reflectivity threshold were selected, as shown in
Table 2. Two criteria secure the selection of the reflectivity threshold. First, the median CAPE value for severe convective storms was high enough to represent the cell’s convective origin truly. Secondly, after applying the reflectivity threshold, there should be enough cells to study the storm distributions further. Methods 1 and 4 were ruled out because the CAPE median value of 186 J/kg is considered too low for severe convective storms. Method 3 was excluded because the number of remaining cells would have been too low for further analysis. Therefore, the reflectivity threshold for severe convective storms in Estonia was selected to be 51 dBZ. This value corresponds to a precipitation intensity of about 56 mm/h.
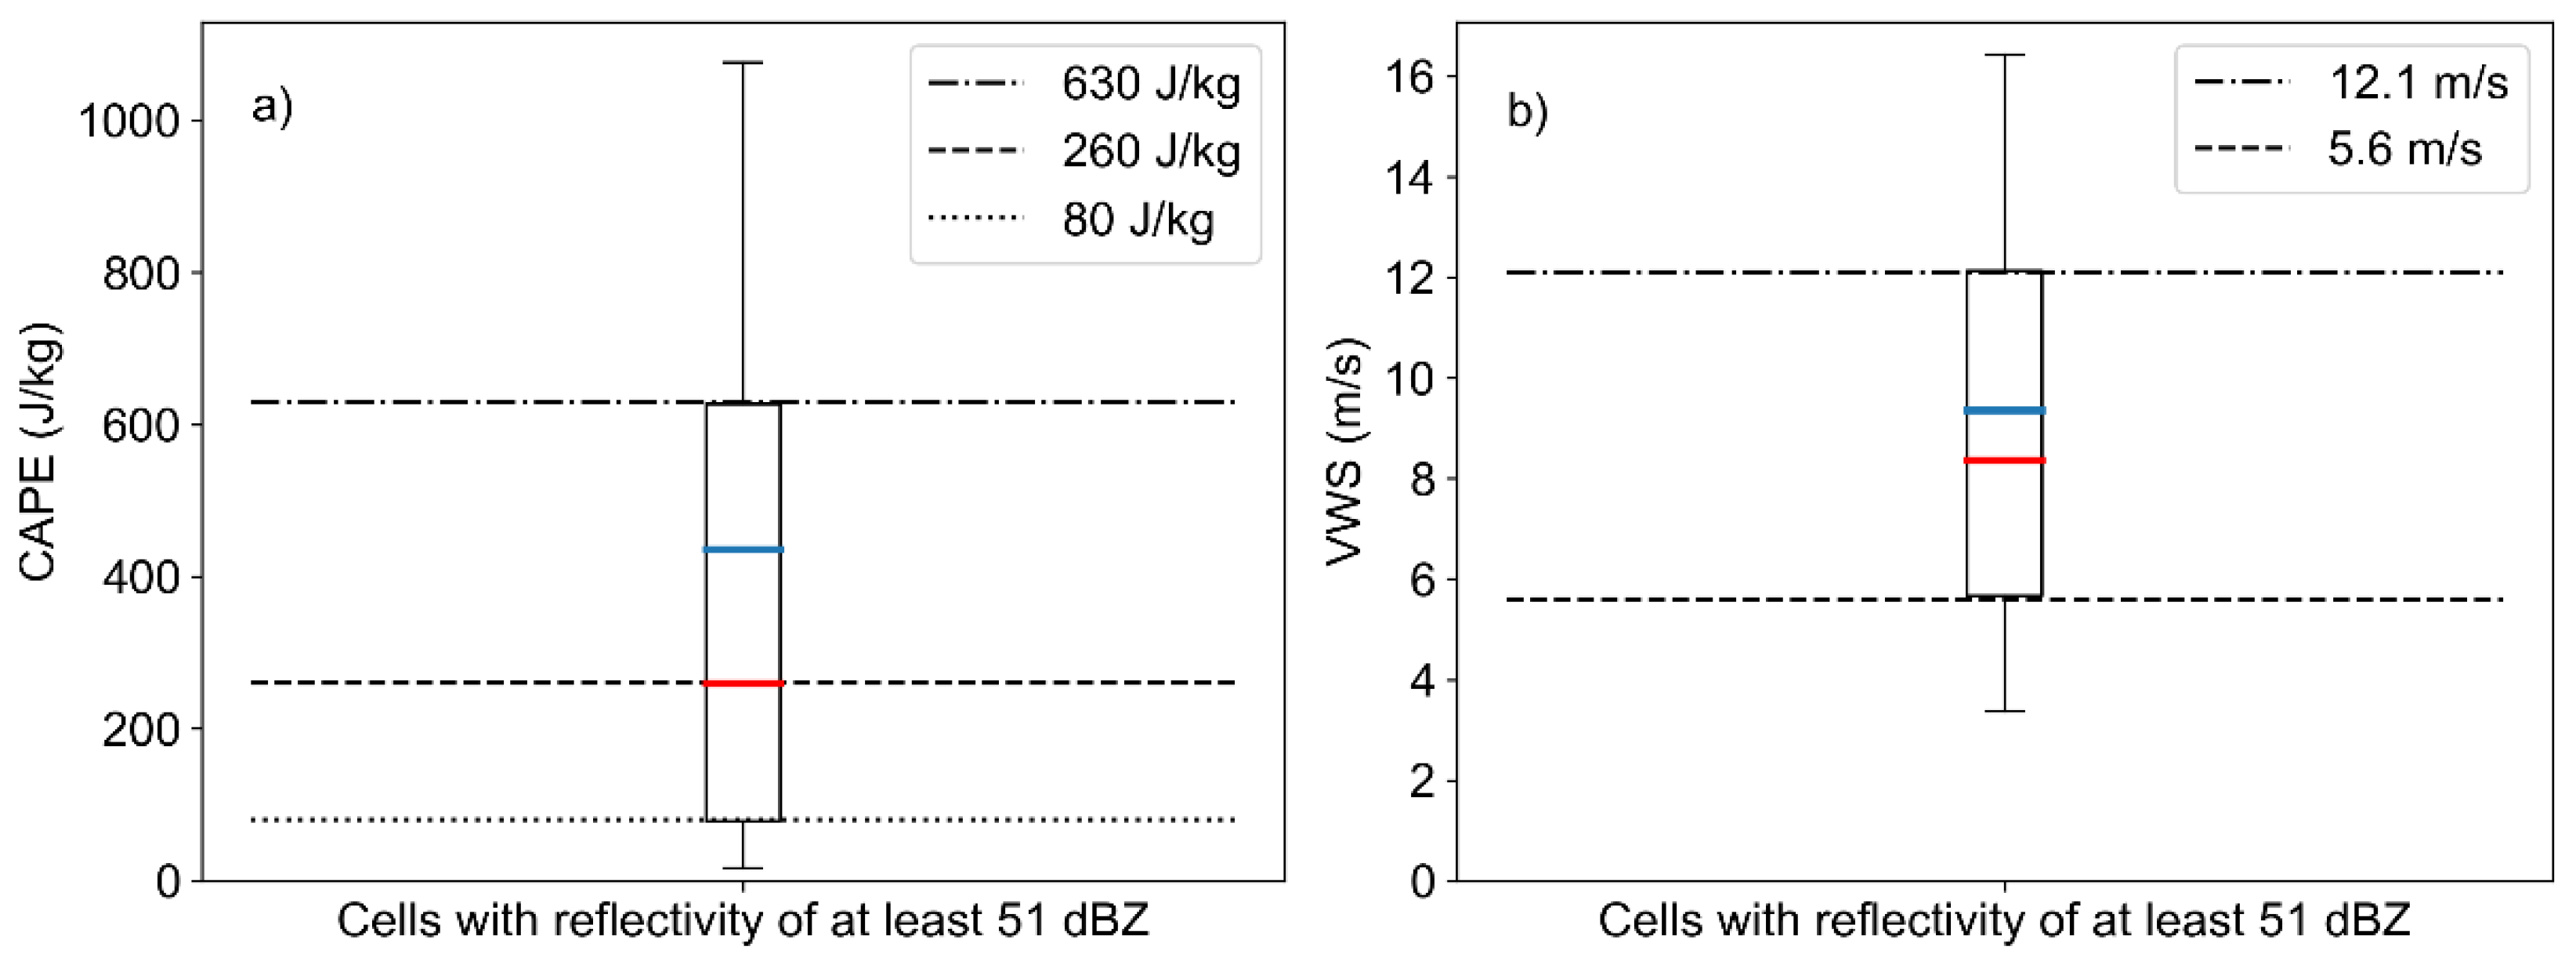
Therefore, to set the CAPE threshold, cells with maximum reflectivity over 51 dBZ were analysed. After selecting the reflectivity threshold, the CAPE threshold was determined by the CAPE frequency distributions, namely the 25th percentile. The median value of those remaining cells was found to be 259 J/kg. As shown in
Figure 4, the 25th percentile of CAPE is 80 J/kg, and this value was chosen as a threshold. In conclusion, thresholds for severe convective storms in Estonia were selected to be 51 dBZ for reflectivity and 80 J/kg for CAPE.
Furthermore, to verify whether the selected thresholds support the theory that the higher VWS results in larger storm cell areas, the remaining cells were divided into four groups. The combinations of thresholds for wind shear and CAPE are shown in
Table 3. Based on the wind shear distribution analysis (
Figure 4b), 25% (5.6 m/s) and 75% (12.1 m/s) quartile values were selected to represent thresholds for low wind shear and high wind shear conditions respectively. From CAPE values’ distribution for severe convective storms, the median value of CAPE (260 J/kg) was chosen to be the threshold for low CAPE conditions and 75% quartile for high CAPE conditions.
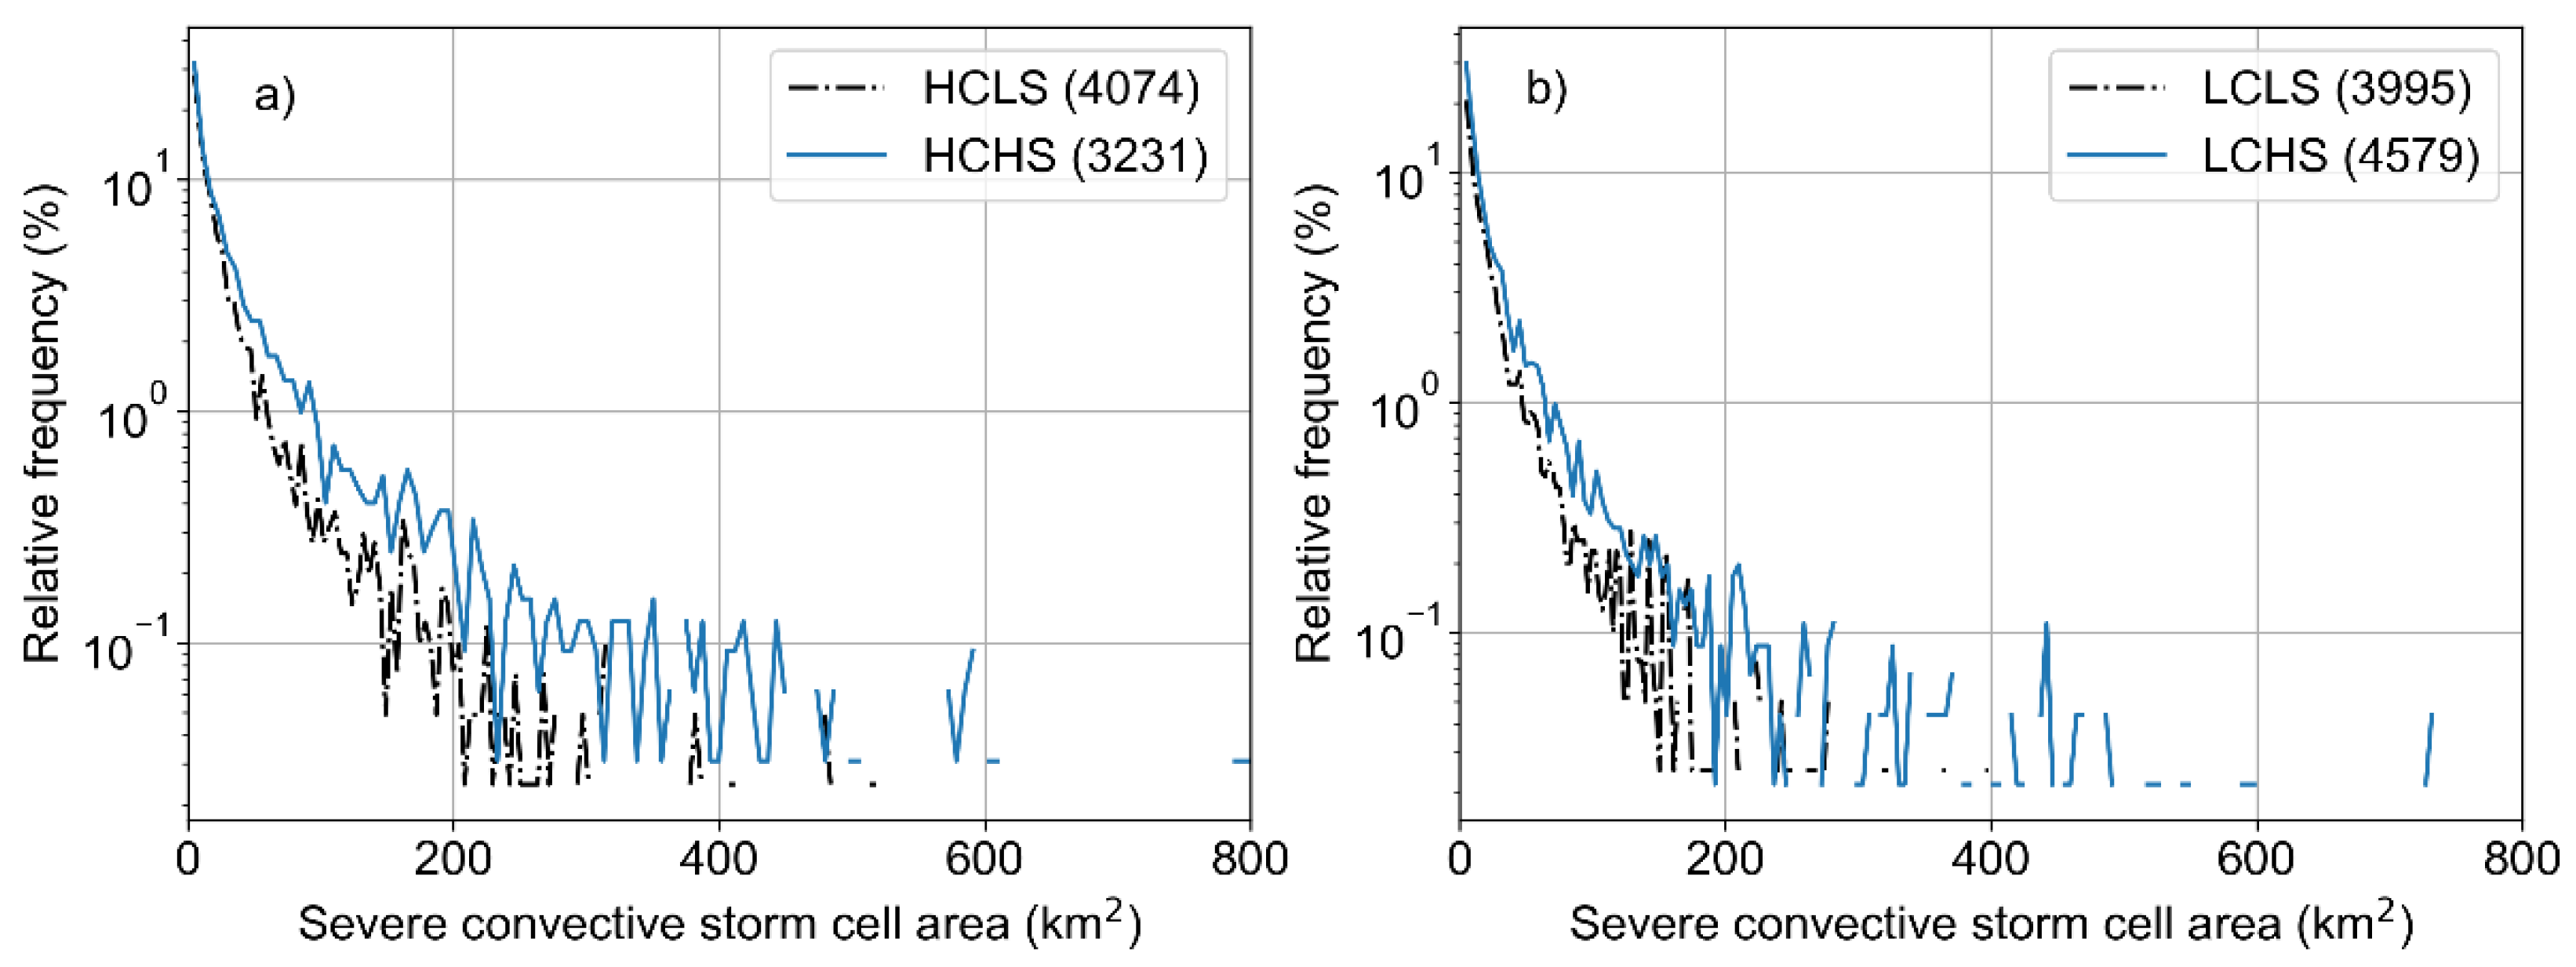
The distribution of every group was then analysed concerning the cell areas (
Figure 5). With both high and low CAPE, at high VWS conditions, the storm areas are more extensive than at common VWS conditions, which is in line with the theory of convective storms. However, in the case of high CAPE, the role of wind shear is no longer so significant, which indicates that VWS is still secondary to the formation of severe convective storms and can thus be left out from the severe convective storm definition in our case.
3.2. Verification of the Detected Severe Convective Storms against CG Lightning Data
We consider lightning detector data as an independent data source for verification of our convective storm detection method. Distributions of convective storm cells are compared to the numbers of CG flashes on various temporal scales starting from hourly up to yearly periods. The daily cycles depicted in
Figure 6 show a pronounced maximum of convective storm activity in the afternoon around 12–13 UTC (15–16 local time). Outside of the afternoon maximum, the relative frequency of the 35 dBZ initial convective cells (
Figure 6a) is higher than that of the severe convective storm cells (
Figure 6b) and CG lightning flashes (
Figure 6c). Using only the 35 dBZ threshold, we get cells that also contain stratiform areas. At the same time, applying the severe convective storm thresholds of 51 dBZ for reflectivity and a CAPE threshold of 80 J/kg results in a good correlation with CG lightning flashes in terms of the daily cycle. The CG lightning relative frequency distribution maximum is slightly delayed, and the evening decline is not as sharp as those of the severe convective storm cells. This could be caused by the merging of the storm cells as they develop. This assumption is supported by an earlier study from Estonia by Voormansik et al. [
33]. The mean storm cell area daily maximum was found to have a lag of several hours compared to the maximum of 35 dBZ cells.
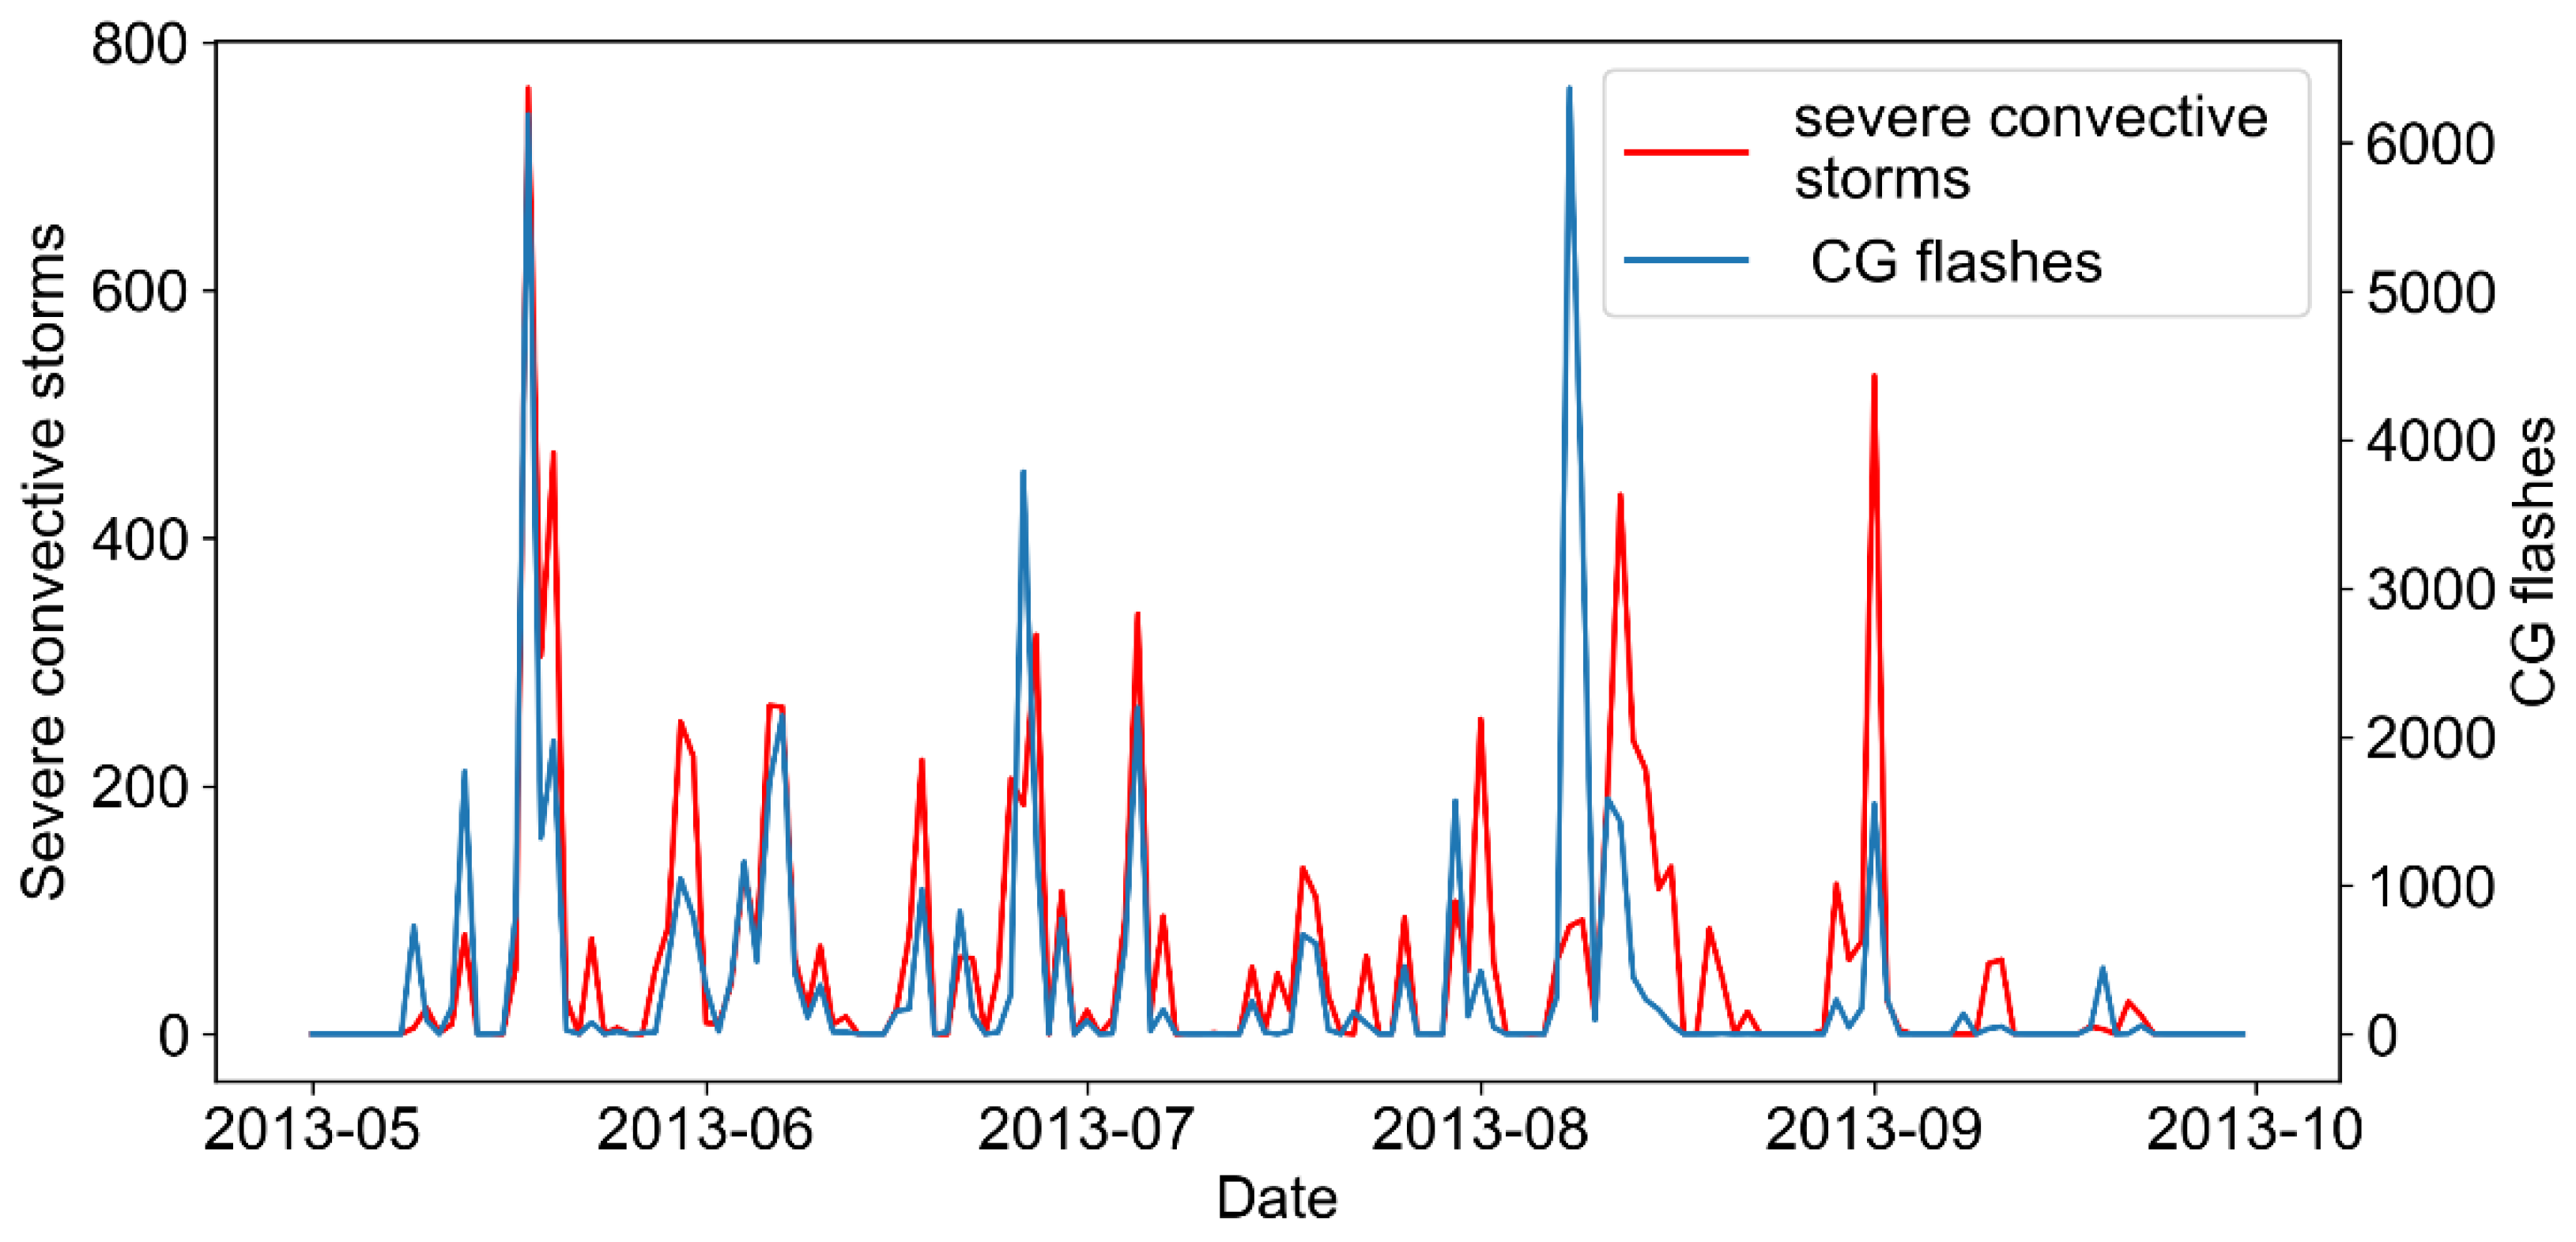
Moving on to the daily time step, the day-to-day occurrence of the severe convective storm cells and CG flashes have a good correlation, as can be seen in
Figure 7, where data from the year 2013 is presented. As expected, the higher the number of convective storm cells, the more CG flashes. On some occasions, it does not hold, and to a low number of severe convective storm cells corresponds an increased number of CG flashes and vice versa. It is the case, for example, in the first half of August 2013. This can at least partially be explained by looking at the storm cell areas. On 9 August 2013, there were a lot of CG flashes but relatively small numbers of strong convective cells with a mean area of 41.4 km
2, and on 12 August 2013, there were fewer CG flashes but more storm cells than in the previous case while their mean area was smaller (22.6 km
2). The CG flashes on 9 August 2013 were caused by sizeable frontal precipitation areas, which explains the considerable mean area of the storm cells.
The monthly scale comparison of the initial convective cells, severe convective storms, and CG lightning flashes exhibits a distinct and similar seasonality among the three parameters and high variability over the years and month to month (
Figure 8). Convective activity is generally shallow in May and September, and the most active period is from June to August. Severe convective cells have their maximum in July, whereas CG lightning flashes peak in August.
The overall numbers of initial convective cells vary from year to year, starting with 55641 in 2016 up to 96040 cells in 2013 (
Table 4). These numbers differ nearly two times. The high number of cells is characteristic of the warm summers. The number of severe convective storm cells ranges from 2936 in 2016 to 9623 in 2010. So this difference is more than threefold. The number of CG flashes varies even more, from 12972 in 2015 to 81783 in 2010, which is more than a sixfold difference. Thus, the number of initial convective cells is more stable from year to year than severe convective storms and CG flashes. The number of severe convective storms and CG flashes are generally well correlated also in a yearly comparison. In 2011, the number of CG flashes per severe convective storm cell was highest with 11.9 flashes per cell. It was the lowest in 2015 when there were only four CG flashes per severe convective storm cell.
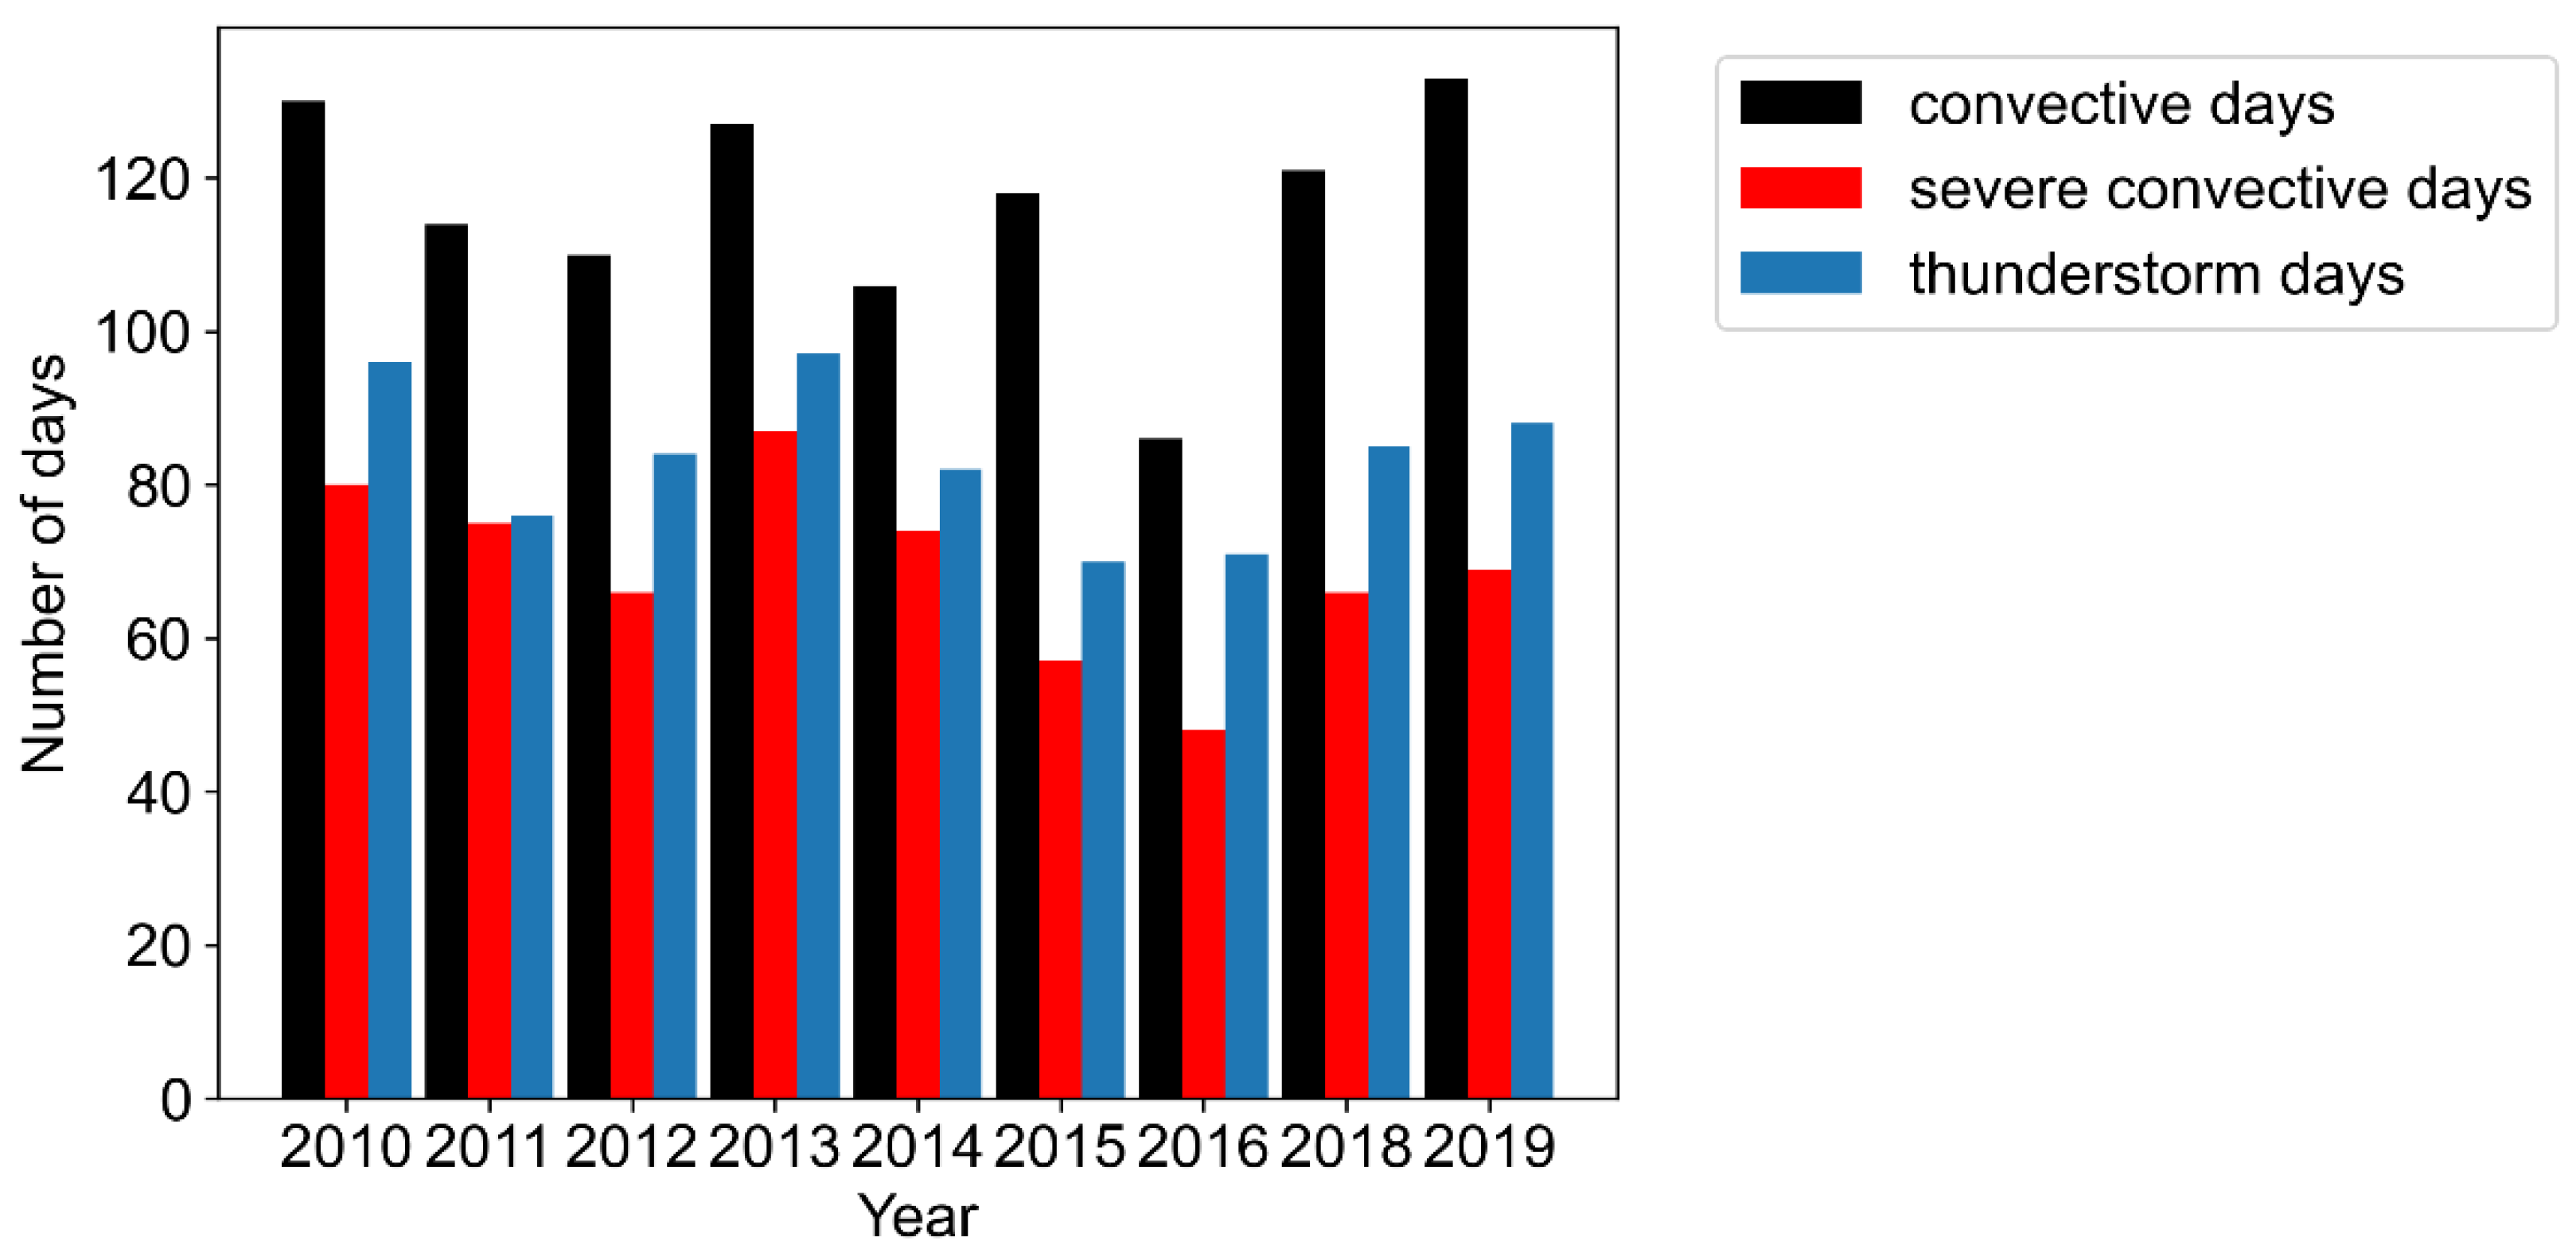
The numbers of convective days, severe convective storm days, and thunderstorm days for the whole study area are counted on a yearly level to determine the reliability of the selected combination of thresholds on this timestep. These three types of days are defined in the following way: As long as at least one convective storm, severe convective storm, or a CG flash is detected in the study area, then the respective type of day is registered. The number of severe convective storm days ranges from 48 in 2016 to 87 in 2013 (
Figure 9). The number of thunderstorm days varies from year to year, starting with 70 in 2015 up to 97 days in 2013. Severe convective storm thresholds put on tighter constraints compared to just thunderstorm days. On average, there are 14 more thunderstorm days per year than severe convective storm days. On the other hand, the 35 dBZ reflectivity convective cell days range from 86 in 2016 to 133 days in 2019. On average, there are 33 more of these days than thunderstorm days per year. This indicates that the proposed severe convective storm thresholds can be justified. These numbers of days are pretty high, reaching up to 76% of the entire summer season days considered as convective; on 45% of the days, there was a severe convective storm detected, and on 54% of the days, there was CG lightning flash detected. However, compared to many other studies here, we count these storms over the whole territory of Estonia; it shows that this kind of phenomena is not very rare during the summer season.
3.3. Distribution of Convective Storms over the Territory of Estonia
From the previous section, it came out that in about half of the warm season days, at least one storm cell could be found over the territory of Estonia. Now we follow how these storms are distributed from two sides. At first, from the viewpoint of prevailing synoptic-scale airflow, we check whether our 9-year period represents a more extended period. For this, we use JCT synoptic weather types centred over Estonia in eight directional classes. Secondly, we follow the territorial distribution of storms in general and depending on airflow directions.
From climatology, we know that the prevailing airflow directions at higher mid-latitudes are westerlies that could also be followed in
Figure 10a. However, compared to the 40-years climatology, there are more SW, W, and E directional flows during our 9-year period and fewer NW, N flows. The difference is only a few percent. The relative distribution of air flows changes when we look only at convective storm days. The relative frequency of days with SE, S, and SW flow increases, and the W, NW, and N flow decreases (
Figure 10b). Severe convective storm cells were detected in more than half of the days with SE, S, and SW flow (
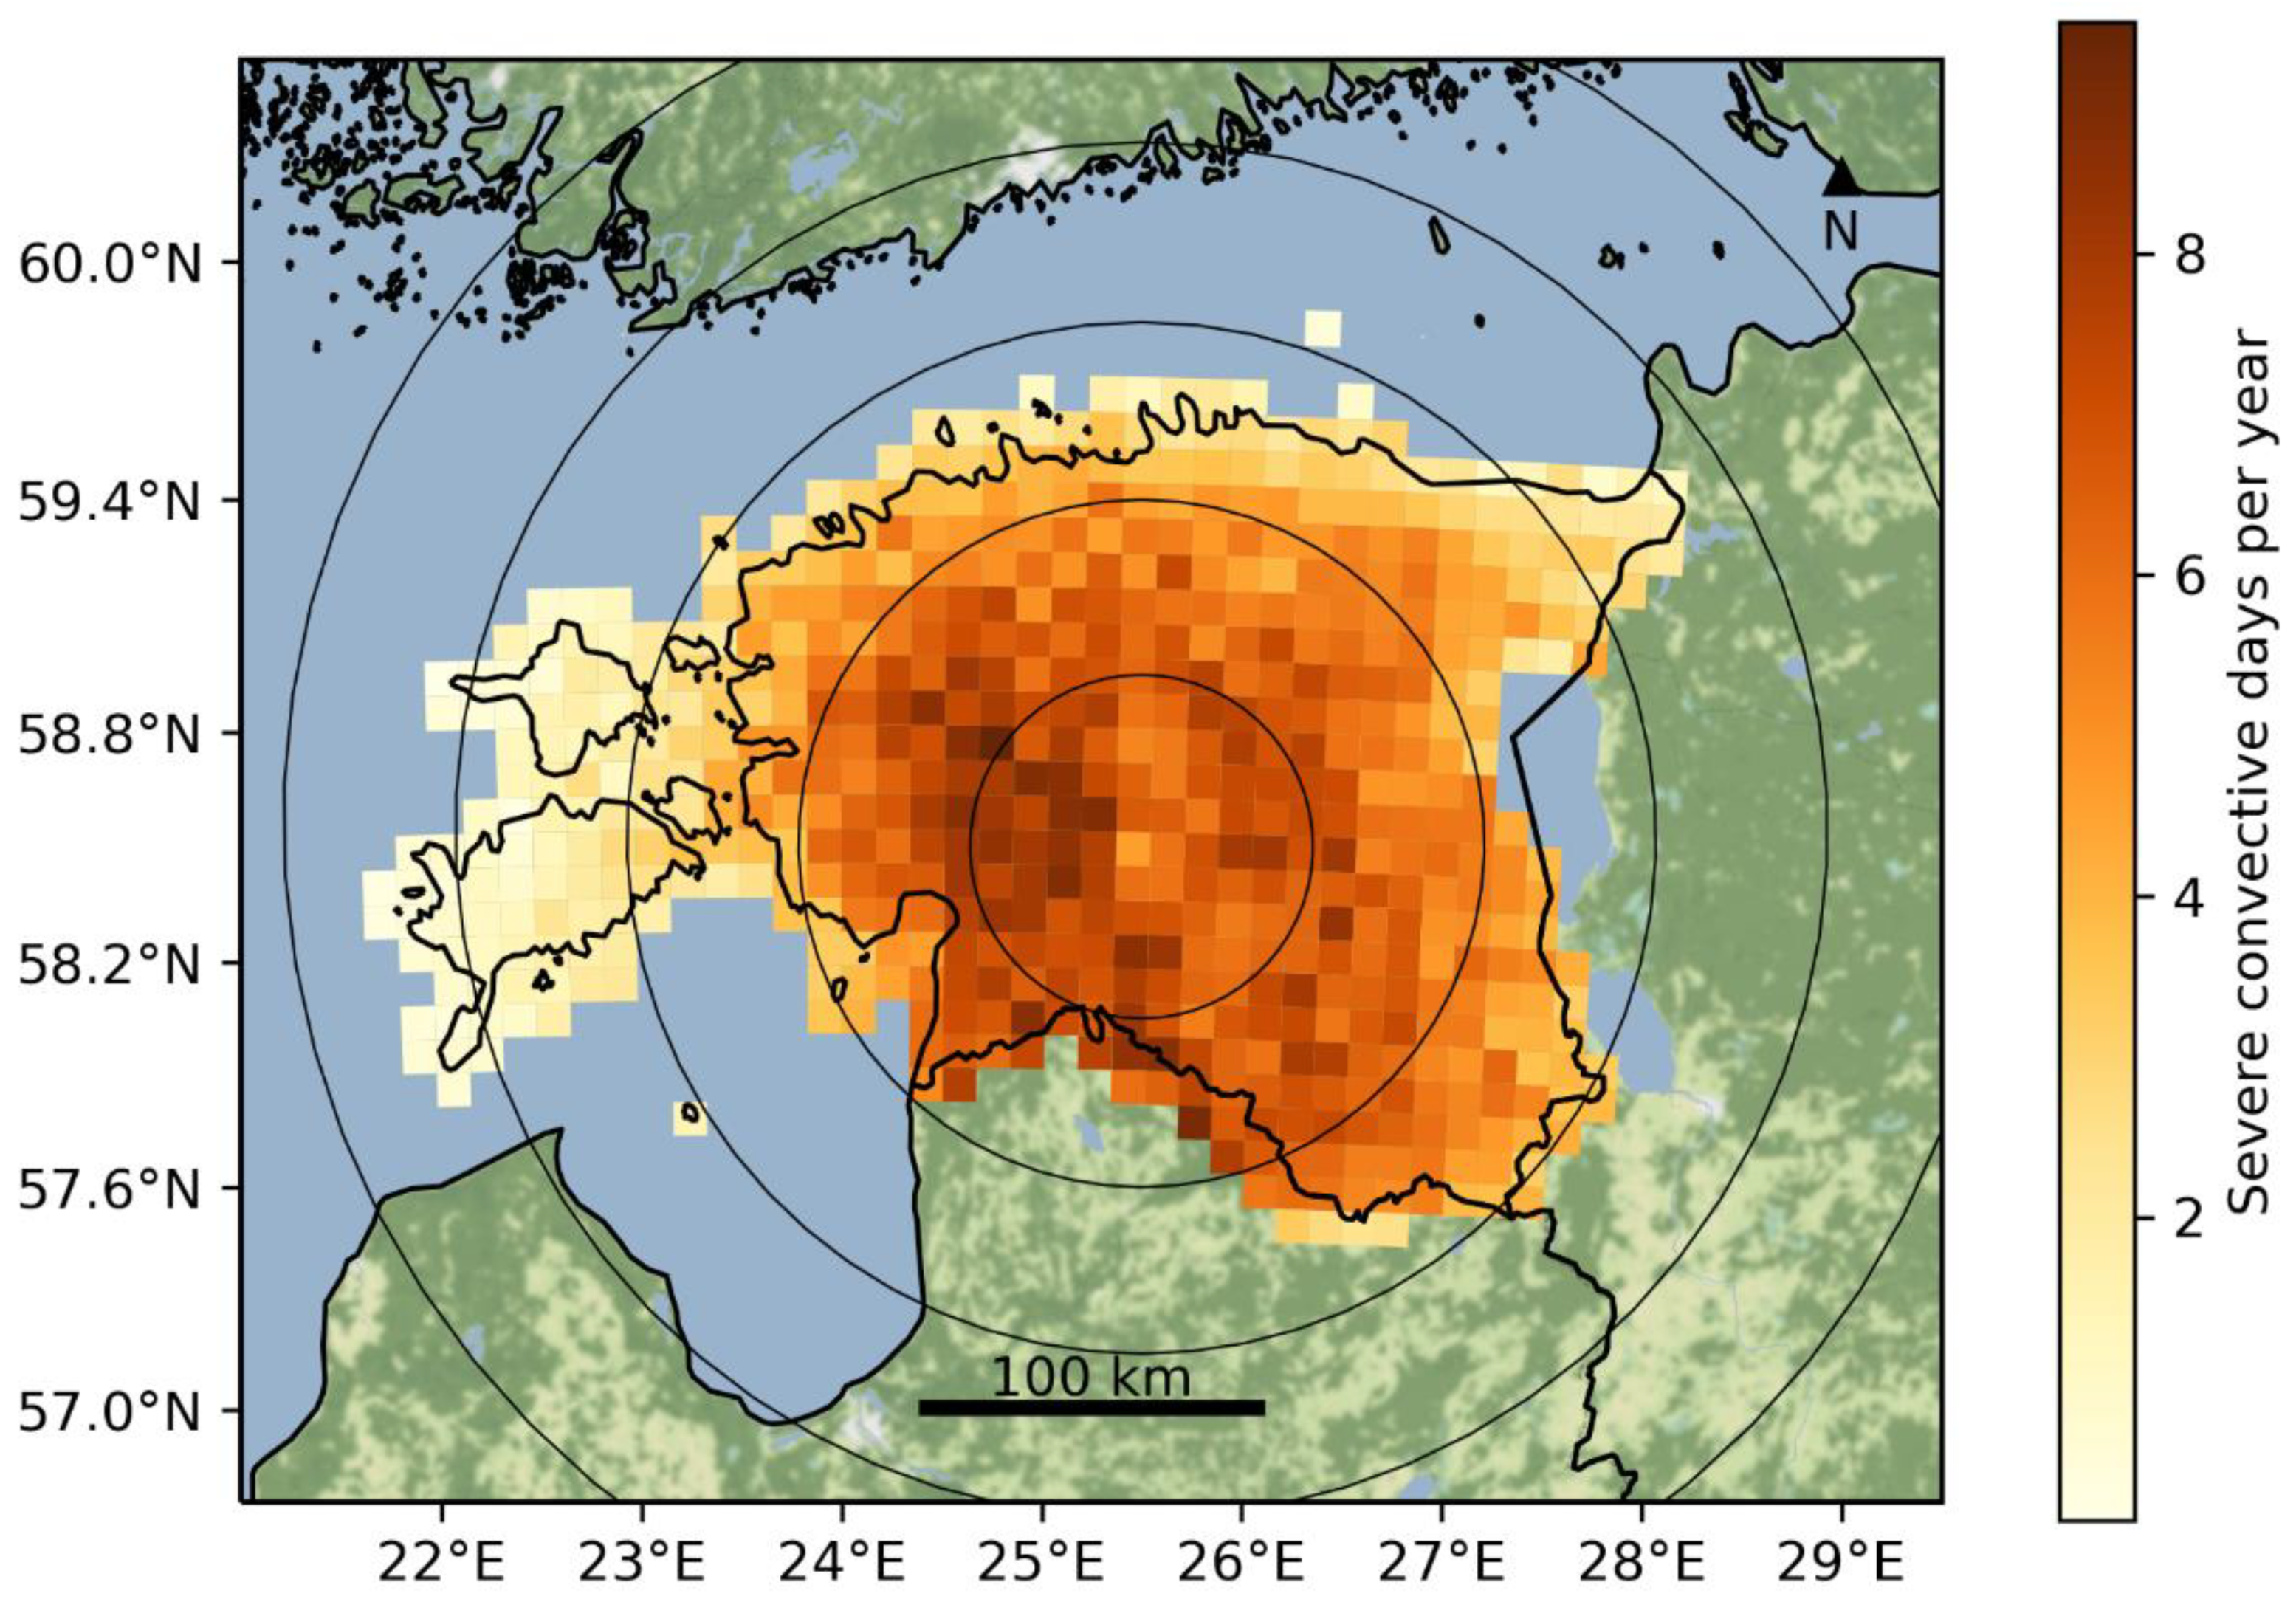
Figure 10c). Compared to other works, it may seem that the fraction of storm days is very high, but we count the storms over the entire territory of Estonia. From the territorial distribution of storms (
Figure 11), the number of severe convective storm days per 100 km
2 is up to about 8 per year, but then the storms could not be independent. The most significant density of storms stays in the W and SW parts of Estonia, but the number of storms is influenced by the distance of a grid cell from the radar. The circles centred with the radar position show that up to 100 km, the results can be considered reliable.
Distributions of storm cell densities during the three most frequent airflow directions that bring consecutive severe storms, SW, W, and S (not presented as a figure), are pretty different from each other. In all cases, the storms’ maximum occurs in this part of the country from where the airflow comes.
4. Discussion
There have been different methods to find the thresholds for severe convective storms. It is possible to use ESWD, as has been done for Central Europe [
65], where it was found that based on CAPE, it is possible to distinguish between dangerous phenomena with and without lightning. CAPE values were determined in the cases of heavy precipitation and wind, and the median value of CAPE turned out to be close to 500 J/kg, which is almost two times the value found for Estonia (260 J/kg). In the same study, the wind shear values for heavy rainfall and thunderstorms were usually less than 20 m/s, which matches the numbers in Estonia. Kaltenboeck and Steinheimer [
31] chose radar reflectivity thresholds of 46 dBZ and 54 dBZ to distinguish severe convective storms from data. These thresholds were simply selected on the specificity of the data as they were the two highest reflectivity values available. As for CAPE, the storm was considered convective when the midday CAPE value at the centre of the study area exceeded 100 J/kg. In our study, the CAPE threshold for the severe convective storm was a bit lower (80 J/kg), but it should be considered that the CAPE value was taken from the closest point to the detected cell 1 hour before the detection.
Similarly to the Kaltenboeck and Steinheimer [
31] study, we distinguished four groups of cells from the detected severe convective cells. The division into four groups was based on combinations of thresholds of wind shear and CAPE. Based on CAPE and wind shear frequency distributions, thresholds were set to separate high and low CAPE and wind shear environments. For Central Europe, the small CAPE was considered 250 J/kg, for a large CAPE of 600 J/kg and wind shear 5 m/s and 15 m/s, respectively. Our corresponding numbers were 260 J/kg and 630 J/kg, and 5.6 m/s and 12.1 m/s, respectively. The separation of storms made it possible to find the wind shear and CAPE impact on storm growth. In both this study and Kaltenboeck and Steinheimer [
31] study, storm growth dependence of wind shear and CAPE followed the theory of convective storm formation process.
The temporal distributions of the convective storms can be put into perspective by looking at radar data-based studies from other areas. Considering daily cycles, Wapler [
66] analysed the temporal evolution of 46 dBZ convective storms in Germany in 2007–2017. In the study, Wapler [
66] found that the storm cell area is symmetric to the maximum time, which is in the middle of the lifetime of a cell, while the lightning rate increase is slower, reaches maximum later, and does not decline to the initial value. This reflects well our diurnal cycle analysis results. On a monthly level, our results resemble the conclusions from other European studies as well. For example, Surowiecki and Taszarek [
25] studied a 10-year climatology of mesoscale convective systems over Poland based on radar data and found the peak to be mid-July. Looking at lightning data, Taszarek et al. [
21] stated that peak thunderstorm activity occurs during July and August over Northern, Eastern, and Central Europe.
Spatial distributions of the storms found in our study can be compared with earlier works that used lightning data and covered our study area. For instance, Enno et al. [
17] analysed the lightning flash density in Europe based on 10 years of Arrival Time Difference Network (ATDnet) data from 2008 to 2017. When thunderstorm days from Enno et al. [
17] are compared with the severe storm days from our study in the Estonian area, similarities can be found. The high number of storm days in central Estonia matches the thunder day distribution in that area. At the same time, more significant discrepancies can be observed in the farther regions from the radar site. For example, the high number of thunder days in SE Estonia that our severe storm distribution cannot confirm because of the decreasing detection efficiency with increasing distance from the radar. However, one has to keep in mind that the study period of Enno et al. [
17] did not overlap entirely with our work. There have been various definitions for convective storm days in earlier studies, depending on the storm detection methods used. Goudenhoofdt and Delobbe [
30] tracked the storms and therefore considered a day a convective storm day if a storm (an area with a reflectivity of at least 40 dBZ) with a duration of at least 1 hour was observed. As a result, they found out that the yearly probability of a convective storm day ranged from 24% to 33% for the area corresponding to Belgium. These numbers are lower than ours mainly because we only considered the summer period days while Goudenhoofdt and Delobbe [
30] used data from the whole year. Furthermore, we defined a day with at least one detected convective cell as a convective storm day, leading to more storm days. Still, if we assume that our detected convective storms correspond to the whole year, the mean probabilities become similar. The mean yearly probability of a convective storm day for the area of Estonia would be 32%, and the probability of a severe convective storm day would be 19%.
Regarding thunderstorm days in this study, we consider the whole Estonian domain while most earlier studies have looked at smaller areas. For example, Mäkelä et al. [
16] counted days with at least one flash in a circular area with a radius of 11.3 km, which equals 400 km
2, on a 1 km × 1 km grid to find the spatial distribution of thunderstorm days. While, in Enno et al. [
17], a thunderstorm day was defined as a day when at least two flashes occurred within 20 km from the centre of a 0.2° × 0.2° grid cell during a given day. This results in an area of over 1200 km
2. While the investigated period varies in the different studies, the general trend is evident. The larger the area, the more thunderstorm days there are. Mäkelä et al. [
16] estimated up to 18 thunderstorm days in our study area, while Enno et al. [
17] estimated up to 25 thunderstorm days in our study region per year on average based on a 10-year study period.
The study comprises several limitations, most of which are related to radar data. Because we are using single-site radar data up to the range of 250 km, we are first and foremost affected by beam overshooting, beam broadening, and beam attenuation. This results in underestimation of the reflectivity and decreased resolution with increasing distance from the radar. This means in the context of our work that the convective storm detection efficiency decreases in the periphery of the radar measurement range (a tendency to detect more storm cells close to the radar). Another constraint of our study is the inability to ensure the independence of the convective storm cells since we could not track the storm cells because of the sparse radar scanning interval of 15 minutes. As a result, one storm area may appear multiple times in our statistics. This could be avoided in future studies when using more frequent scans made by EstEA radars since May 2020. Other radar-related limitations that may result in storm cell over- and under-detection are bright band, miscalibration, and wet radome attenuation (e.g., [
67]). Regarding local environment conditions, the quality of CAPE values from ERA5 reanalysis is sufficient for our study. Still, CAPE derived from atmospheric sounding data would be more accurate if available with appropriate temporal resolution. Atmospheric soundings in the study area were not suitable as they are being made only once per day at night-time at 00 UTC (03 local time).
5. Conclusions
A 9-year (2010–2019, 2017 excluded) climatology of convective storms was constructed for Estonia. Our study is the first attempt to reveal a more detailed spatiotemporal distribution of convective storms depending on atmospheric conditions in Estonia and the wider Baltic Sea region. This is also the first time the spatial distributions of convective storms have been investigated in Estonia. The analysis is based on a multi-source dataset: radar observations to locate initial convective cells; ERA5 reanalysis data to determine convective environments and synoptic-scale conditions; and lastly, lightning detector network information for verification. Initial convective cells were derived from base level radar reflectivity using a reflectivity threshold of 35 dBZ. A total number of 692,784 initial convective cells were identified in the study area. Then the severe convective storm was defined based on radar data and statistical analysis of environmental conditions. This resulted in thresholds of 51 dBZ radar reflectivity accompanied by 80 J/kg CAPE. Based on these thresholds, 48,936 severe convective storm cells were determined, 7% of the initial convective cells. The daily cycle of severe convective storm cells reveals that 58% of storms occur between 12–13 UTC (15–16 local time).
The originality of our study was expanded further by adding synoptic-scale airflow analysis. Comparing the synoptic-scale airflow of our study period with the 40 years from 1979–2019 confirmed that our study period was representative of a more extended period. The prevailing airflow direction in the case of our severe convective storm days was from SW (33%), W (23%), and S (15%); the higher the CAPE and reflectivity were, the more significant percent of flows was from the southern directions. The smallest number of severe convective storms occurred in north-eastern and north-western flows, both just 3% of cases. The number of days with these flows is low as well, and therefore the highest probability of severe convective storm day is in the case of SE flow, followed by southern flow days. At the same time, most storms occur in the case of the SW airflow.
The numbers of convective storm days and thunder days correlate well, especially severe convective storm days using a higher reflectivity threshold together with the CAPE index threshold. The 35 dBZ threshold may be too low for convective clouds but combining low CAPE threshold with a relatively high reflectivity level for filtering makes the counts of days comparable. The most significant number of severe convective storm days, 87, was in 2013, and the smallest number of those days, 48, was in 2016. On average, based on the study period from May to September, there is a probability of a severe convective storm day of 45% and a probability of a thunderstorm day of 54%.
Altogether this study offers several perspectives for a better understanding of the convective storm activity in the region. Many of the results have considerable practical value. The severe convective storm threshold can be put into operational use, for example, in a convective storm nowcast system. Further developing from this work, radar polarimetric capabilities could also be used in convective storm research and nowcasting to better evaluate the hydrological risks through more precise rainfall intensity and accumulation estimation. Also, storm cell tracking methods could be applied as the high temporal resolution radar data has become available. This would help to gain additional knowledge of storm tracks and lifecycle.
