Abstract
With rapid urbanization, the disposal and management of urban construction waste have become the main concerns of urban management. The distribution of urban construction waste is characterized by its wide range, irregularity, and ease of confusion with the surrounding ground objects, such as bare soil, buildings, and vegetation. Therefore, it is difficult to extract and identify information related to urban construction waste by using the traditional single spectral feature analysis method due to the problem of spectral confusion between construction waste and the surrounding ground objects, especially in the context of very-high-resolution (VHR) remote sensing images. Considering the multi-feature analysis method for VHR remote sensing images, we propose an optimal method that combines morphological indexing and hierarchical segmentation to extract the information on urban construction waste in VHR images. By comparing the differences between construction waste and the surrounding ground objects in terms of the spectrum, geometry, texture, and other features, we selected an optimal feature subset to improve the separability of the construction waste and other objects; then, we established a classification model of knowledge rules to achieve the rapid and accurate extraction of construction waste information. We also chose two experimental areas of Beijing to validate our algorithm. By using construction waste separability quality evaluation indexes, the identification accuracy of construction waste in the two study areas was determined to be 96.6% and 96.2%, the separability indexes of the construction waste and buildings reached 1.000, and the separability indexes of the construction waste and vegetation reached 1.000 and 0.818. The experimental results show that our method can accurately identify the exposed construction waste and construction waste covered with a dust screen, and it can effectively solve the problem of spectral confusion between the construction waste and the bare soil, buildings, and vegetation.
1. Introduction
Construction waste refers to waste concrete, waste soil, and waste masonry generated in production, construction, demolition and repair, as well as construction waste generated in engineering due to man-made aspects or for natural reasons [1]. With the acceleration of urbanization in China, the output of construction waste in cities is continuing to increase. Statistically, construction waste accounted for 30%~40% of urban waste in 2018 [2]. Due to the generation and accumulation of construction waste, a large number of land resource areas are occupied, which also causes air pollution, water pollution, and soil pollution, and the large amount of waste destroys the environment, which human survival relies on [3]. Scientific management of construction waste is one of the important aspects of current urban management [4], and the identification of illegal accumulation areas is the premise of scientific management of construction waste. Due to the wide and irregular distribution of construction waste, which is easily confused with the surrounding land objects, it is a great challenge to identify the location information about construction waste.
The traditional method of manual field inspection is time-consuming, laborious, and inefficient [5]. Due to the rapid changes in the accumulation sites of construction waste, remote sensing has become an important source for obtaining the latest regional data on construction waste [6]. In recent years, with the rapid development of space technology, sensor technology, computer technology, and related technologies, remote sensing technology has made rapid progress. Multi-source remote sensing image resources with high spatial resolution and high temporal resolution are becoming increasingly abundant, which provides a new technical means for the identification and extraction of construction waste.
The composition of construction waste is complex, and its spectral features are also complex. The phenomenon of “foreign objects with the same spectrum, different spectrum of the same object” [7] is common between construction waste, surrounding buildings, bare earth, and other ground objects, and it causes many confusion problems in the classification process. Therefore, it is difficult to identify a construction waste storage area by using only spectral features. Although many scholars use a single feature to extract information from the objects of interest, the extracted objects are usually regular artificial objects, or there are obviously separable features for information extraction research. For example, research objects in urban vegetation coverage [8,9], road detection [10], glacier feature analysis [11], lithology information extraction [12], and other aspects have a wide coverage range and have image features that are easily distinguished from other ground objects. In certain scenarios, analysis can be conducted by establishing a feature library [10] or band operation [13]. However, the distribution range of the construction waste is variable, and its shape is random. There is no clear single feature to distinguish construction waste from easily confused ground objects. Aiming at the problem that the spectral features of construction waste are easily confused with buildings and bare soil due to the interference of various factors, we combined spectral, geometric and texture features to improve the classification accuracy and to overcome the lack of image features that can help to distinguish construction waste from the confused ground objects. Many scholars have adopted the method of using a multi-feature combination to address the problem that the single feature method is difficult to solve. In the urban feature extraction[14], land use information extraction [14,15,16], construction land separation from other surfaces [6], crop growth analysis [17], earthquake disaster monitoring [18], and other directions, many scholars have analyzed and compared the image features of the target of interest and the interfering ground objects. Then, the appropriate feature combination and hierarchical structure are established for classification, which can effectively separate the target object from other objects that are easily confused.
Usually, buildings have regular geometric features and texture features. Buildings with roofs and walls demolished have random shapes and rough textures that are similar to the features of the construction waste and have low contrast with construction waste. Additionally, the demolished buildings are scattered in the construction waste and the buildings. The above situation leads to confusion in the classification process after the adoption of spectral, geometric and texture features of images. Many scholars adopt different image processing methods to extract the target information. For example, principal component analysis [19], edge enhancement [20,21], morphological enhancement [22,23,24], and other methods are used to optimize the image features of the target objects and to simplify the complexity of the feature selection. A large number of experiments have proved that in the direction of addressing road detection [10], building information extraction [21], water area information detection [25,26], reef extraction, geological structure information extraction [27], and other applications, image enhancement is conducive to highlighting target image features, reducing redundant and interfering information, and improving the classification accuracy.
In conclusion, using remote sensing technology to identify construction waste provides an effective way to accomplish urban management. The difficulty of remote sensing identification of construction waste lies in the following: (1) The spectral and texture characteristics of construction waste are not very homogeneous, and the shapes and sizes are complex and diverse. It is difficult to identify construction waste with a single feature. (2) Interfering features such as buildings and bare soil seriously affect the identification accuracy of construction waste, which means that they are easily confused with construction waste in remote sensing images. (3) There is a lack of reliable evaluation methods, especially for the evaluation of their separability.
Very high resolution (VHR) remote sensing images refers to remote sensing images with a spatial resolution below 10 m, which is very suitable for remote sensing identification of urban elements such as construction waste, but there are also problems such as the “salt and pepper effect”. Object-based image analysis (OBIA) can help us to avoid this type of effect and obtain multi-feature information by image segmentation, especially for the VHR remote sensing images. According to the characteristics of construction waste in remote sensing images, we can select features with greater heterogeneity to be the characteristics for identifying construction waste. Additionally, to solve the problem of confusion between construction waste and the surrounding ground objects, we consider introducing the idea of hierarchical segmentation in the image segmentation process. By comparing their feature differences, using different segmentation rules for image segmentation, we can finally obtain highly separable image objects for subsequent remote sensing identification research.
According to the above analysis, we proposed an object-oriented hierarchical segmentation method combined with a morphological index, to improve the separability between construction waste with buildings, buildings under demolition, and bare soil. By analyzing and comparing the spectral, geometric, and texture features of construction waste and confusable ground objects in images, we selected the optimal feature sets, and we identified and extracted the information in two different types of construction waste accumulation areas in Fangshan district and Daxing district of Beijing. In addition, we evaluated the accuracy of construction waste by constructing an accuracy evaluation index, and we analyzed the separability of construction waste and the surrounding ground objects by using the proposal construction waste separability index.
The remaining parts of this paper are mainly the following. Section 2 introduces the concept of image segmentation and morphological index image processing technology as well as the accuracy evaluation method of construction waste extraction. Section 3 discusses the feature selection for construction waste identification and the accuracy evaluation of the experimental results, as well as the analysis of the separability between construction waste and the surrounding ground objects in two study areas. Section 4 discusses the influence of image segmentation and threshold selection on the accuracy, and it shows the problem of identifying vegetation-covered construction waste. Section 5 outlines our conclusions.
2. Materials and Methods
2.1. Study Area and Data
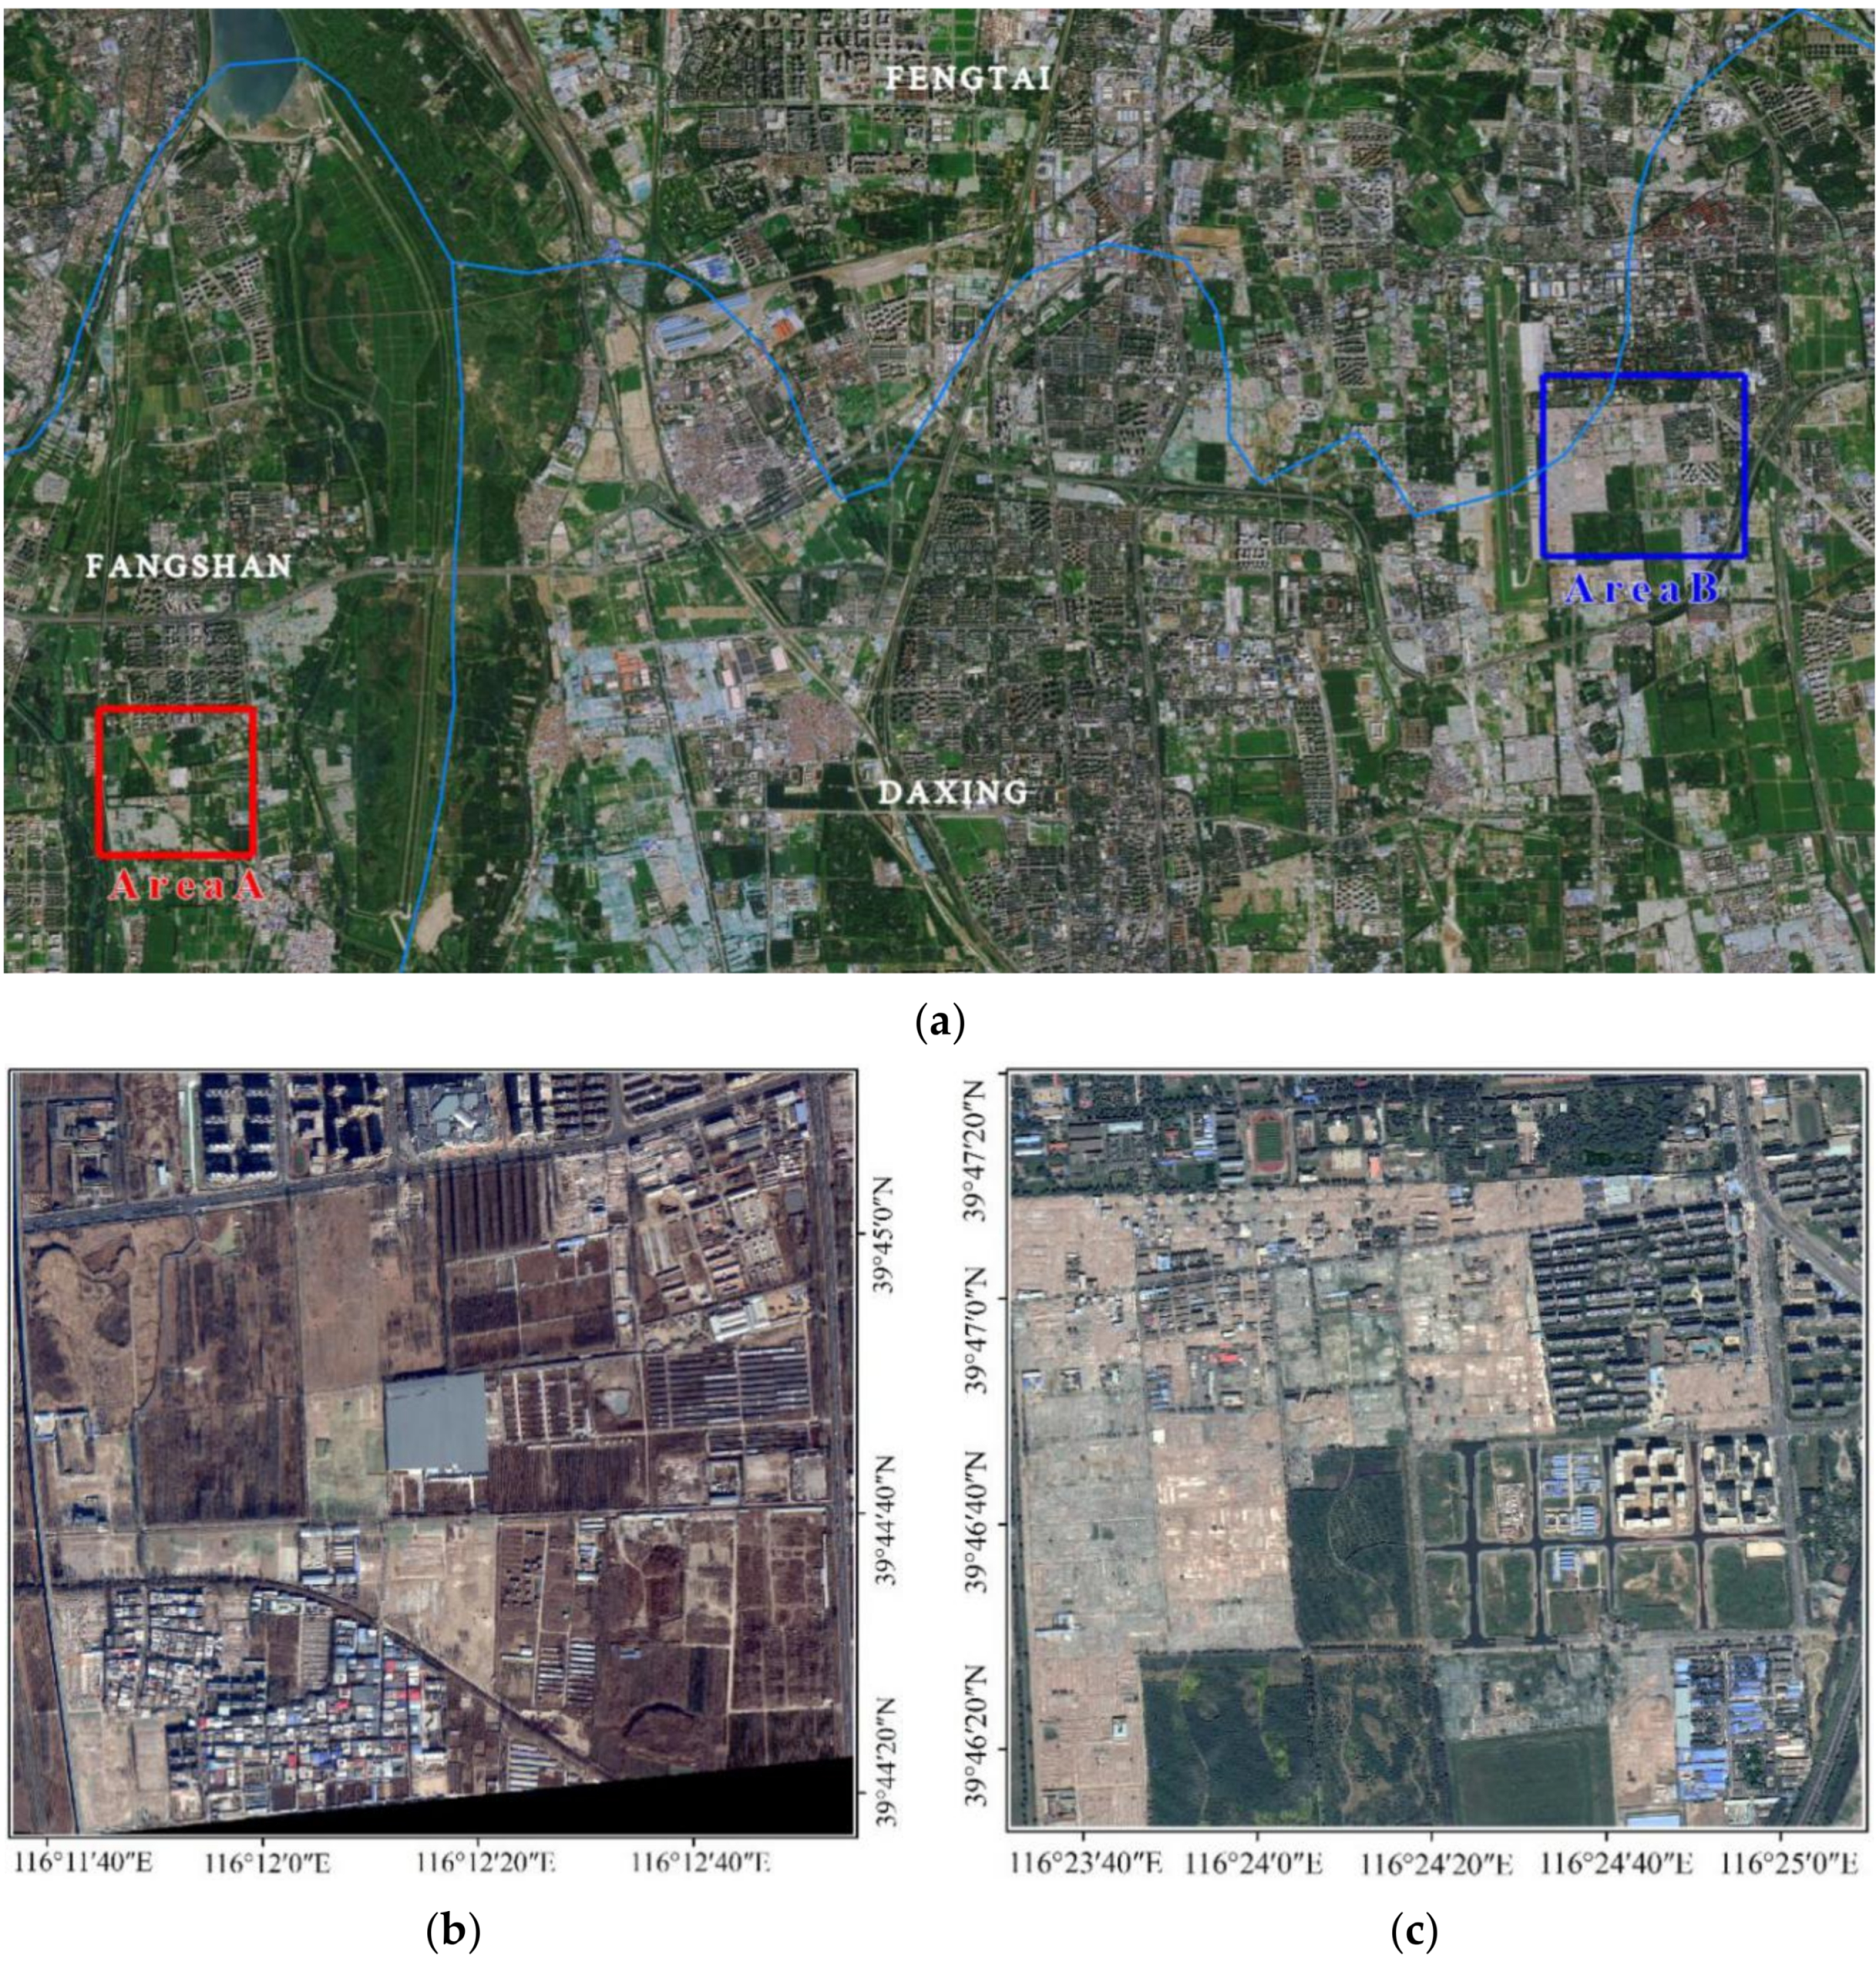
To prove the reliability of this method, we chose two regions located in Beijing, China as study areas. Study area A is located in the demolition area of Baohezhuang village in the east of Changyang town, Fangshan district, Beijing, China. The dominant ground objects are vegetation, roads, buildings, bare earth, and construction waste. The construction waste is mainly bare construction waste, which is mainly composed of waste residue, brick, limestone, and other demolition waste. According to the Google earth images, demolition occurred in and around Baohezhuang village in May 2017, and there were still piles of construction waste and undemolished buildings in this area until April 2018. Therefore, we chose this area as a typical area for long-term accumulation of construction waste for experiments.
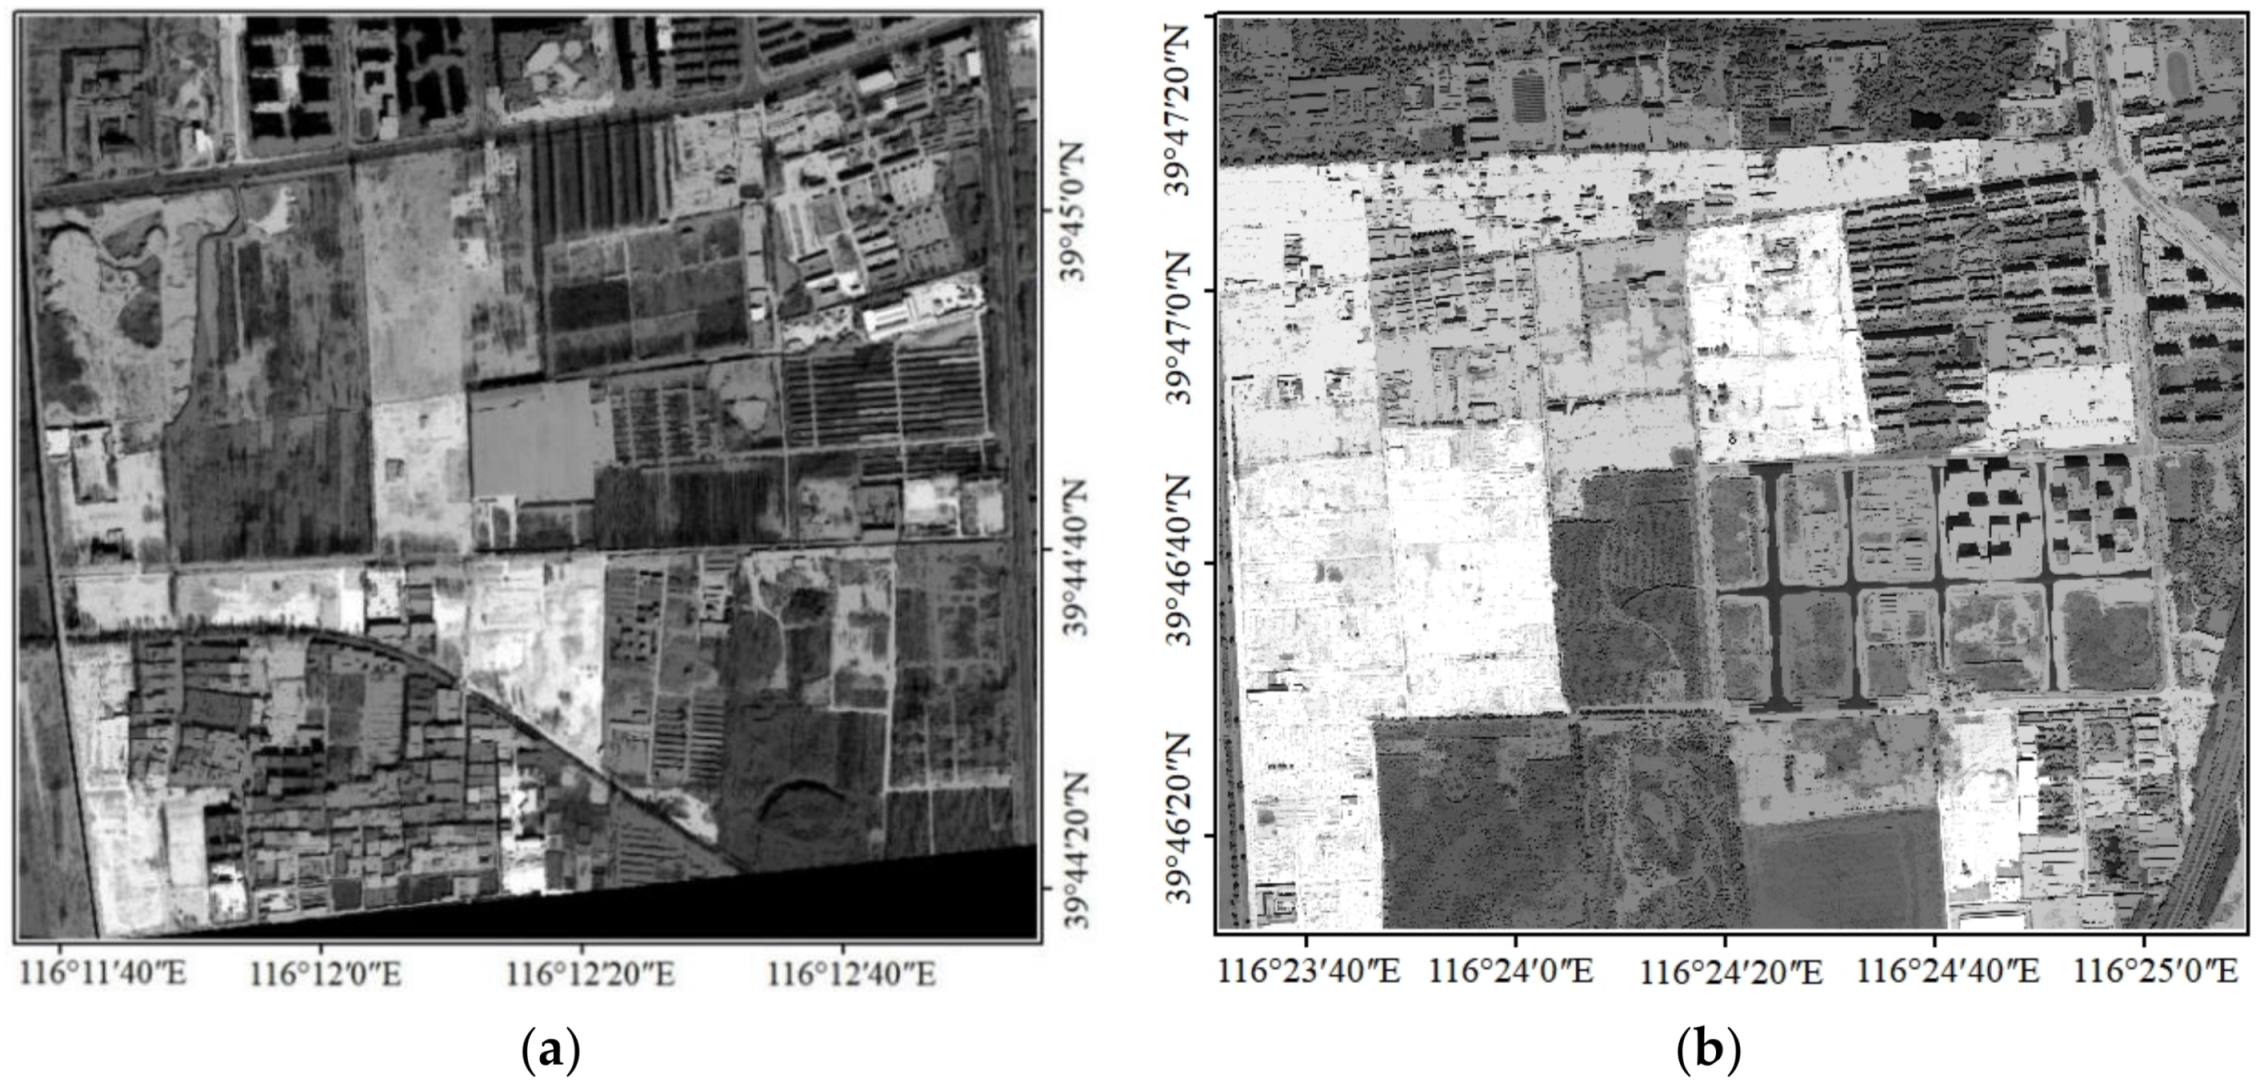
Study area B is located in the demolition area on the east side of Nanyuan airport in Daxing district, Beijing, China. The dominant ground objects are vegetation, roads, buildings, and construction waste, which include exposed construction waste and construction waste covered with dust screen and vegetation (Figure 1). The construction waste in study area B has a large coverage, which verifies the applicability of this method. At the same time, the vegetation coverage of the two study areas is different, which can verify the influence of vegetation on the identification of construction waste.
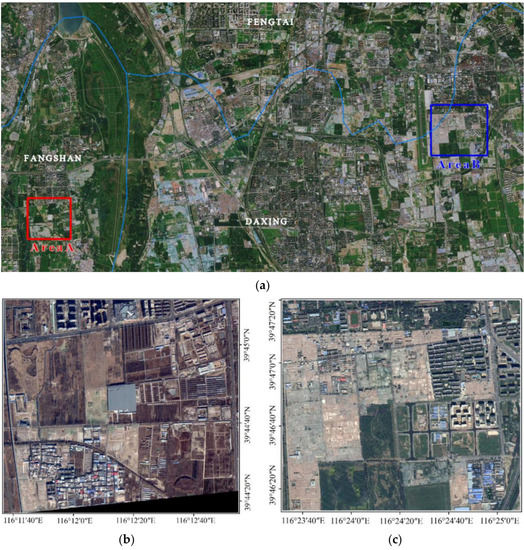
Figure 1.
Study area and material. (a) The whole study area; (b) study area A (WV2,2017/12/20); (c) study area B (GF2,2018/09/05).
Study area A was covered by WorldView-2 remote sensing images with a 0.5 m panchromatic image and 1.8 m multi-spectral image, which were obtained on 20 December 2017. Study area B was covered by Gaofen-2 remote sensing images, which had panchromatic images of 1 m and multi-spectral images of 4 m of resolution, including 4 standard bands, and they were acquired on 5 September 2018.
Firstly, remote sensing image preprocessing includes ortho-correction, geometric correction, atmospheric correction, and image fusion, which enables multi-spectral image data to have the spatial resolution of panchromatic bands. Then, a morphological index of the remote sensing images was calculated. After selecting the appropriate shape and scale of the structural elements, the processing results were fused with the original image to obtain a 5-band remote sensing image enhanced by open reconstruction. Figure 1 shows the single-band image results after the morphological index processing. Approximately 100 verification sample points were randomly distributed in study area A, including 10 construction waste verification points and 90 other types of verification points. Additionally, 100 verification samples were randomly distributed in study area B, including 50 construction waste verification samples and 50 other types of verification samples.
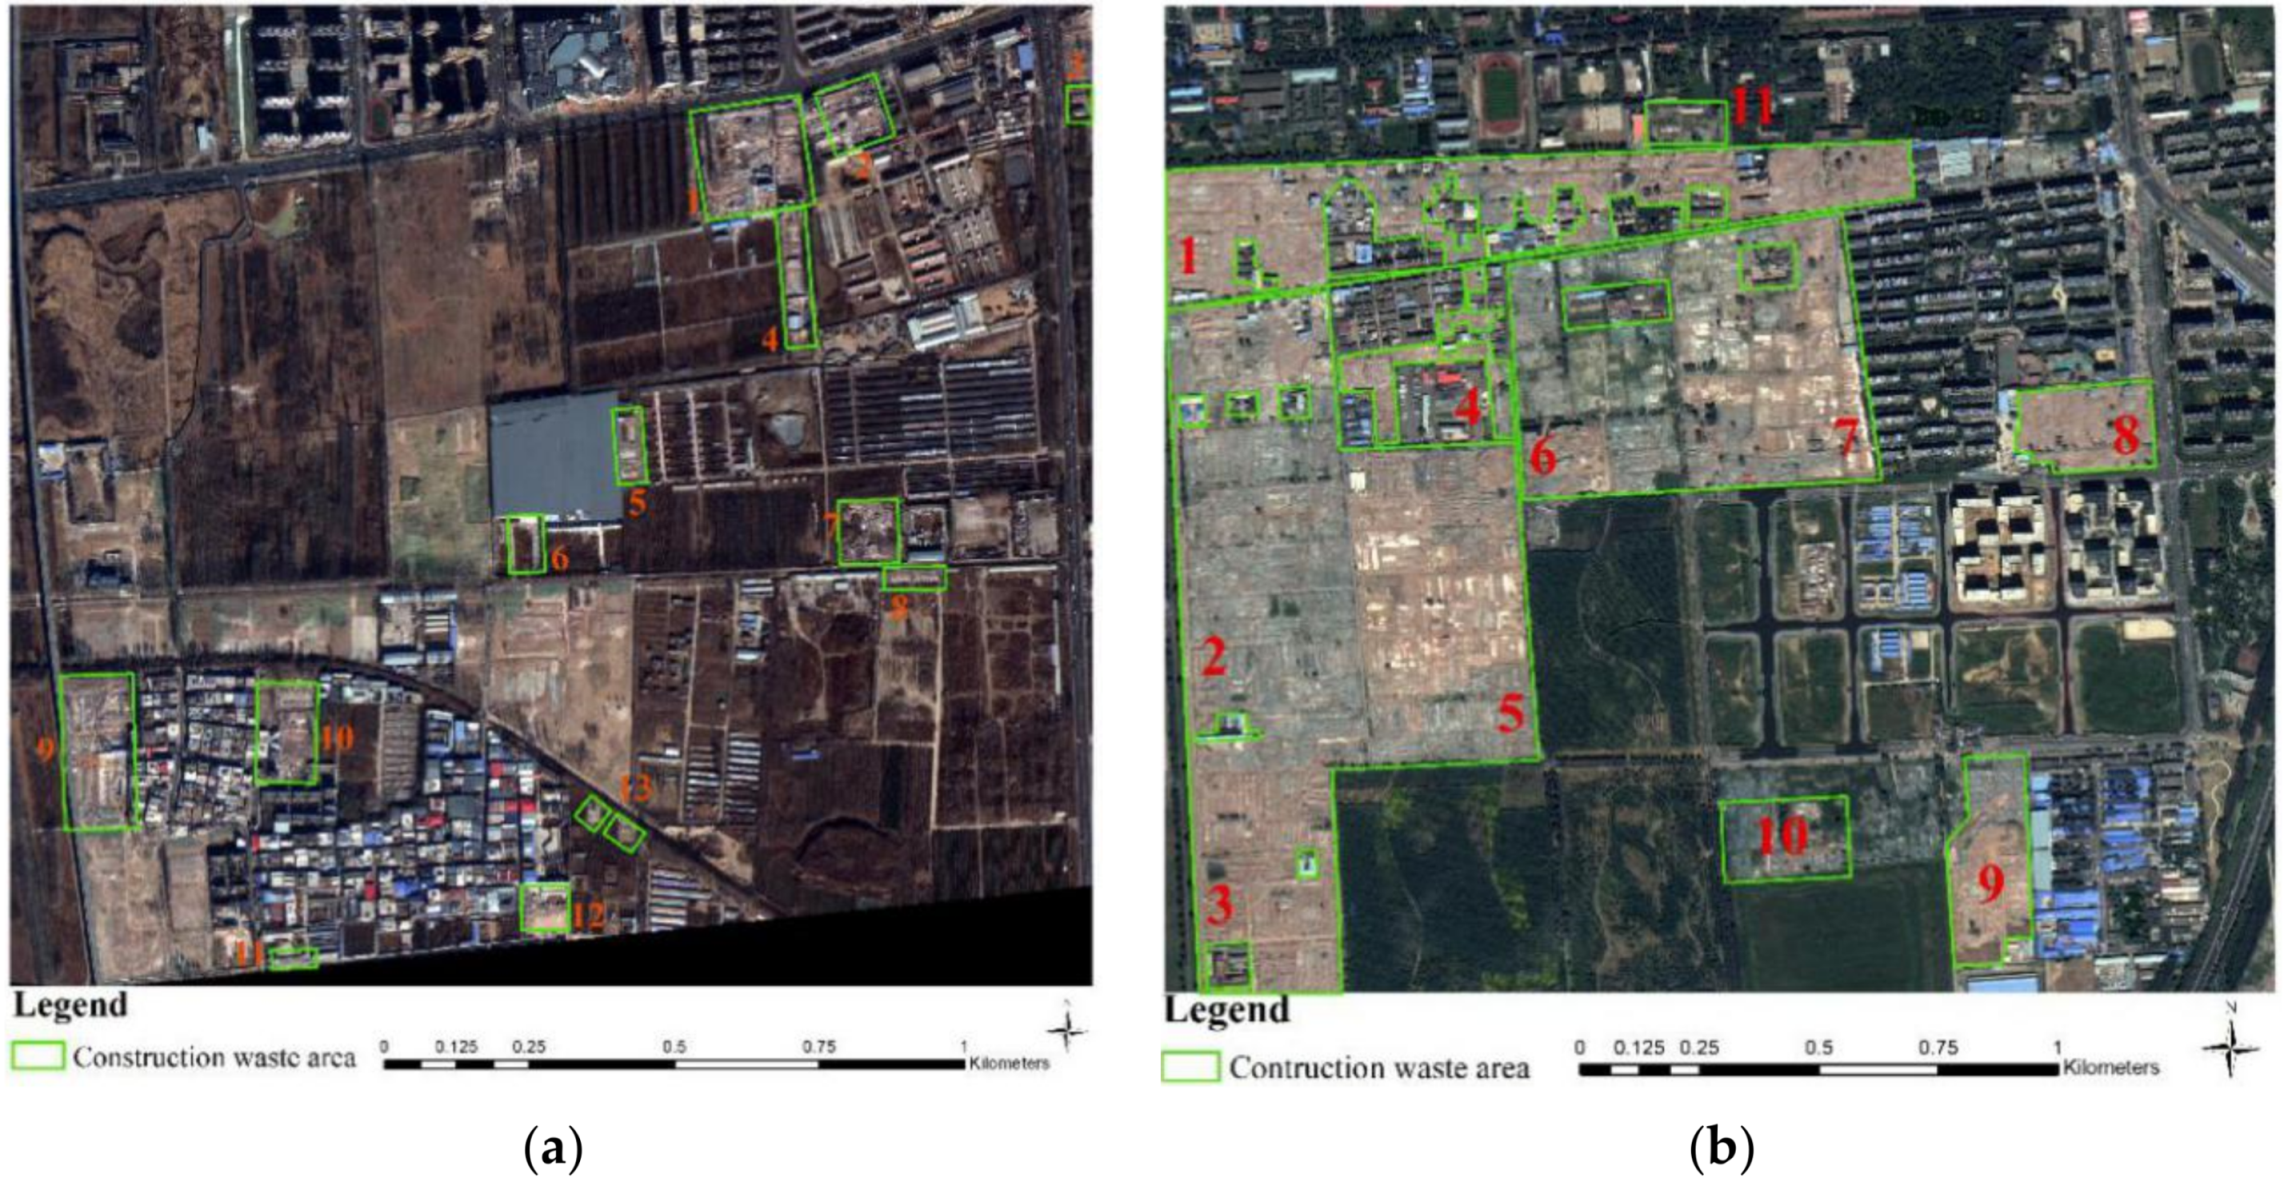
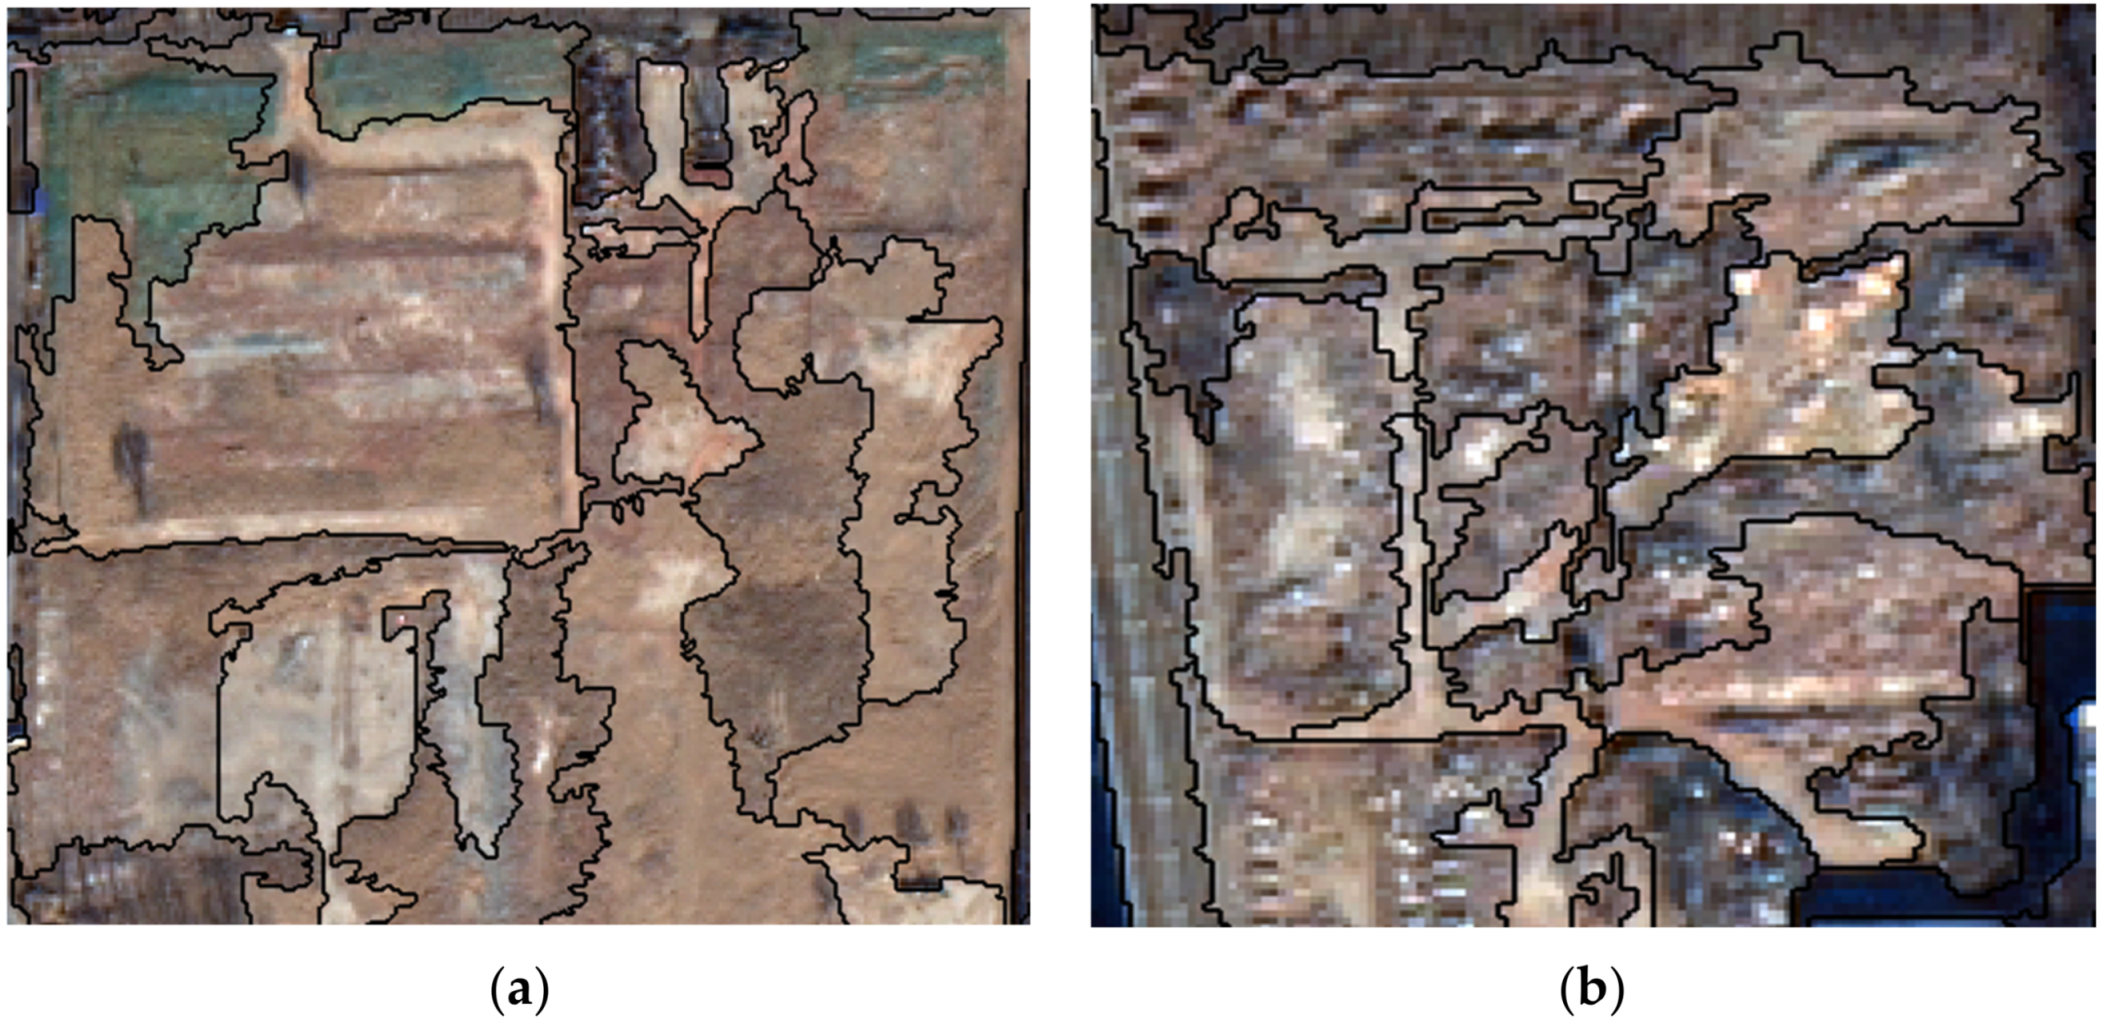
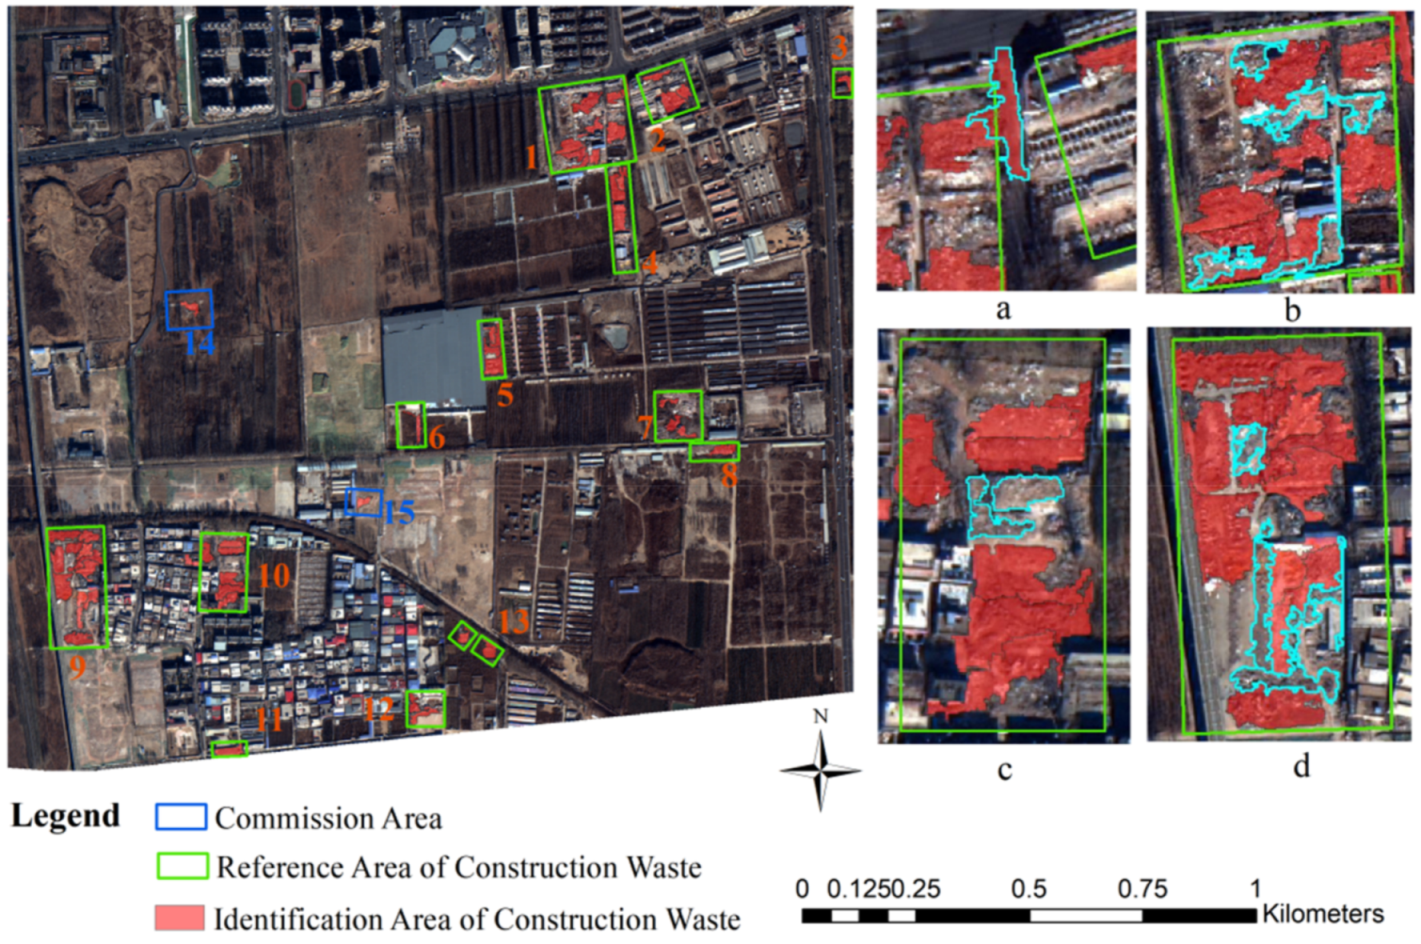
Additionally, we obtained GPS data points of construction waste accumulation locations through field surveys and identified the range and type of construction waste accumulation by using Google Earth images. According to the differences in the construction waste types and accumulation time in these areas, we found that there were 13 and 11 construction waste accumulation areas in cases A and B, respectively, as shown in Figure 2.
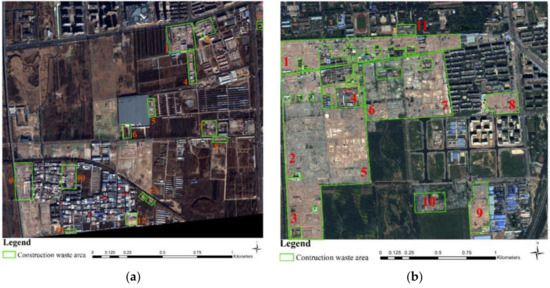
Figure 2.
The reference data for the construction waste. (a) Case A (13 points); (b) Case B (11 points).
2.2. Methods
This section introduces the object-based hierarchical segmentation and morphological index and constructs the accuracy evaluation parameters and separability indexes. Hierarchical segmentation, knowledge classification rules, and accuracy evaluation were performed in eCognition Developer 9.1. Image preprocessing, sample collection, and feature statistics were conducted in ENVI 5.3. Morphological image processing was completed on MATLAB 2016b.
2.2.1. Feature Analysis and Selection
The construction waste in the study area mainly includes demolition construction waste, which is composed of roof waste and wall waste. The main components include bricks, sand, residual soil, asbestos tiles, and lime blocks. The composition of the demolition construction waste is complex, and it leads to complicated image features; this type of complexity is mainly manifested in blurred boundaries, irregular shapes, and disordered internal texture. Apparently, these properties caused the construction waste to be confused with surrounding ground objects, especially buildings and bare soil. Therefore, in this study, by comparing the differences of each feature, we try to find the optimal feature combination, which would be used to establish knowledge classification rules.
- (1)
- Special Features
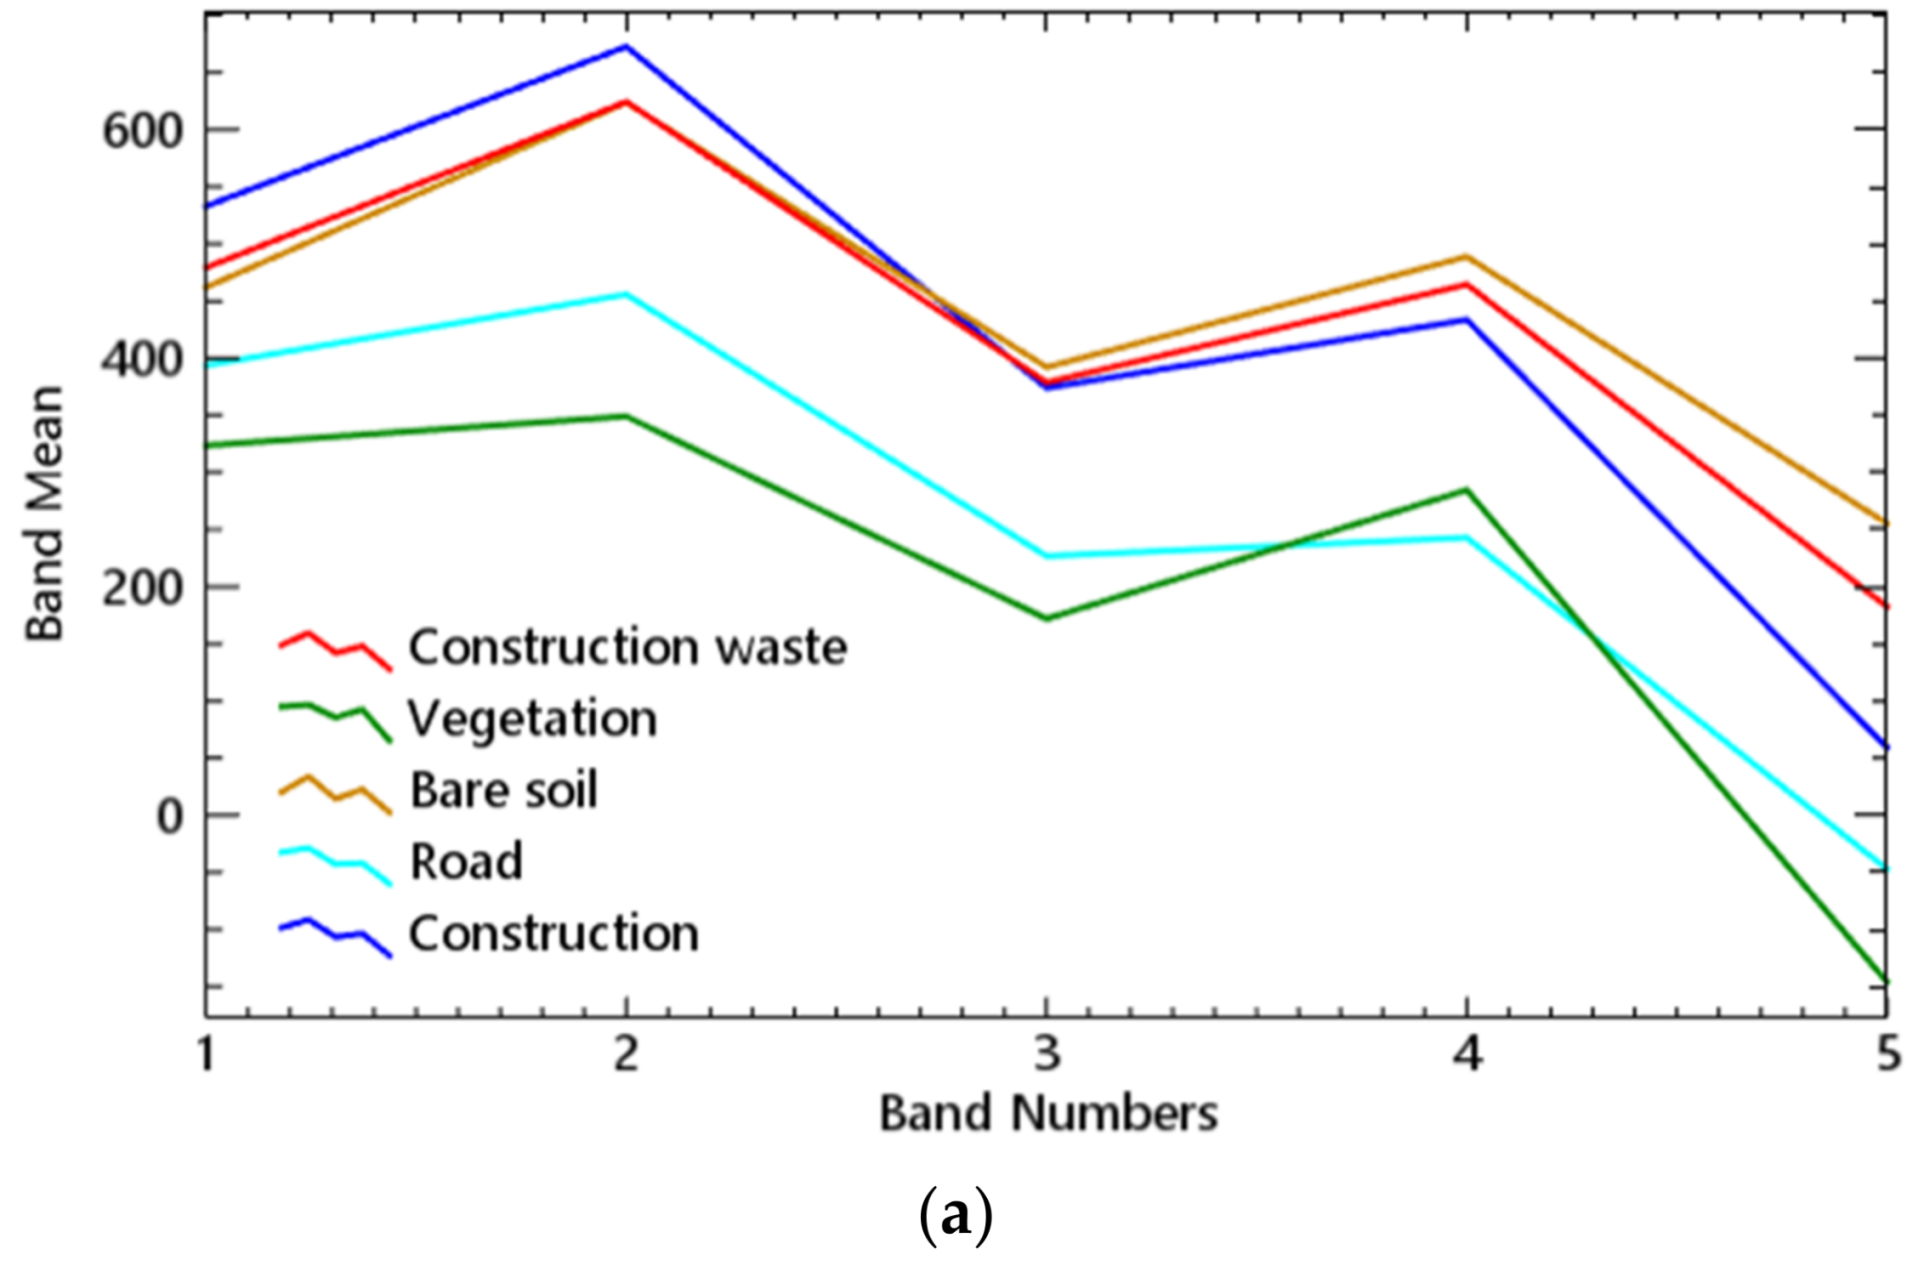
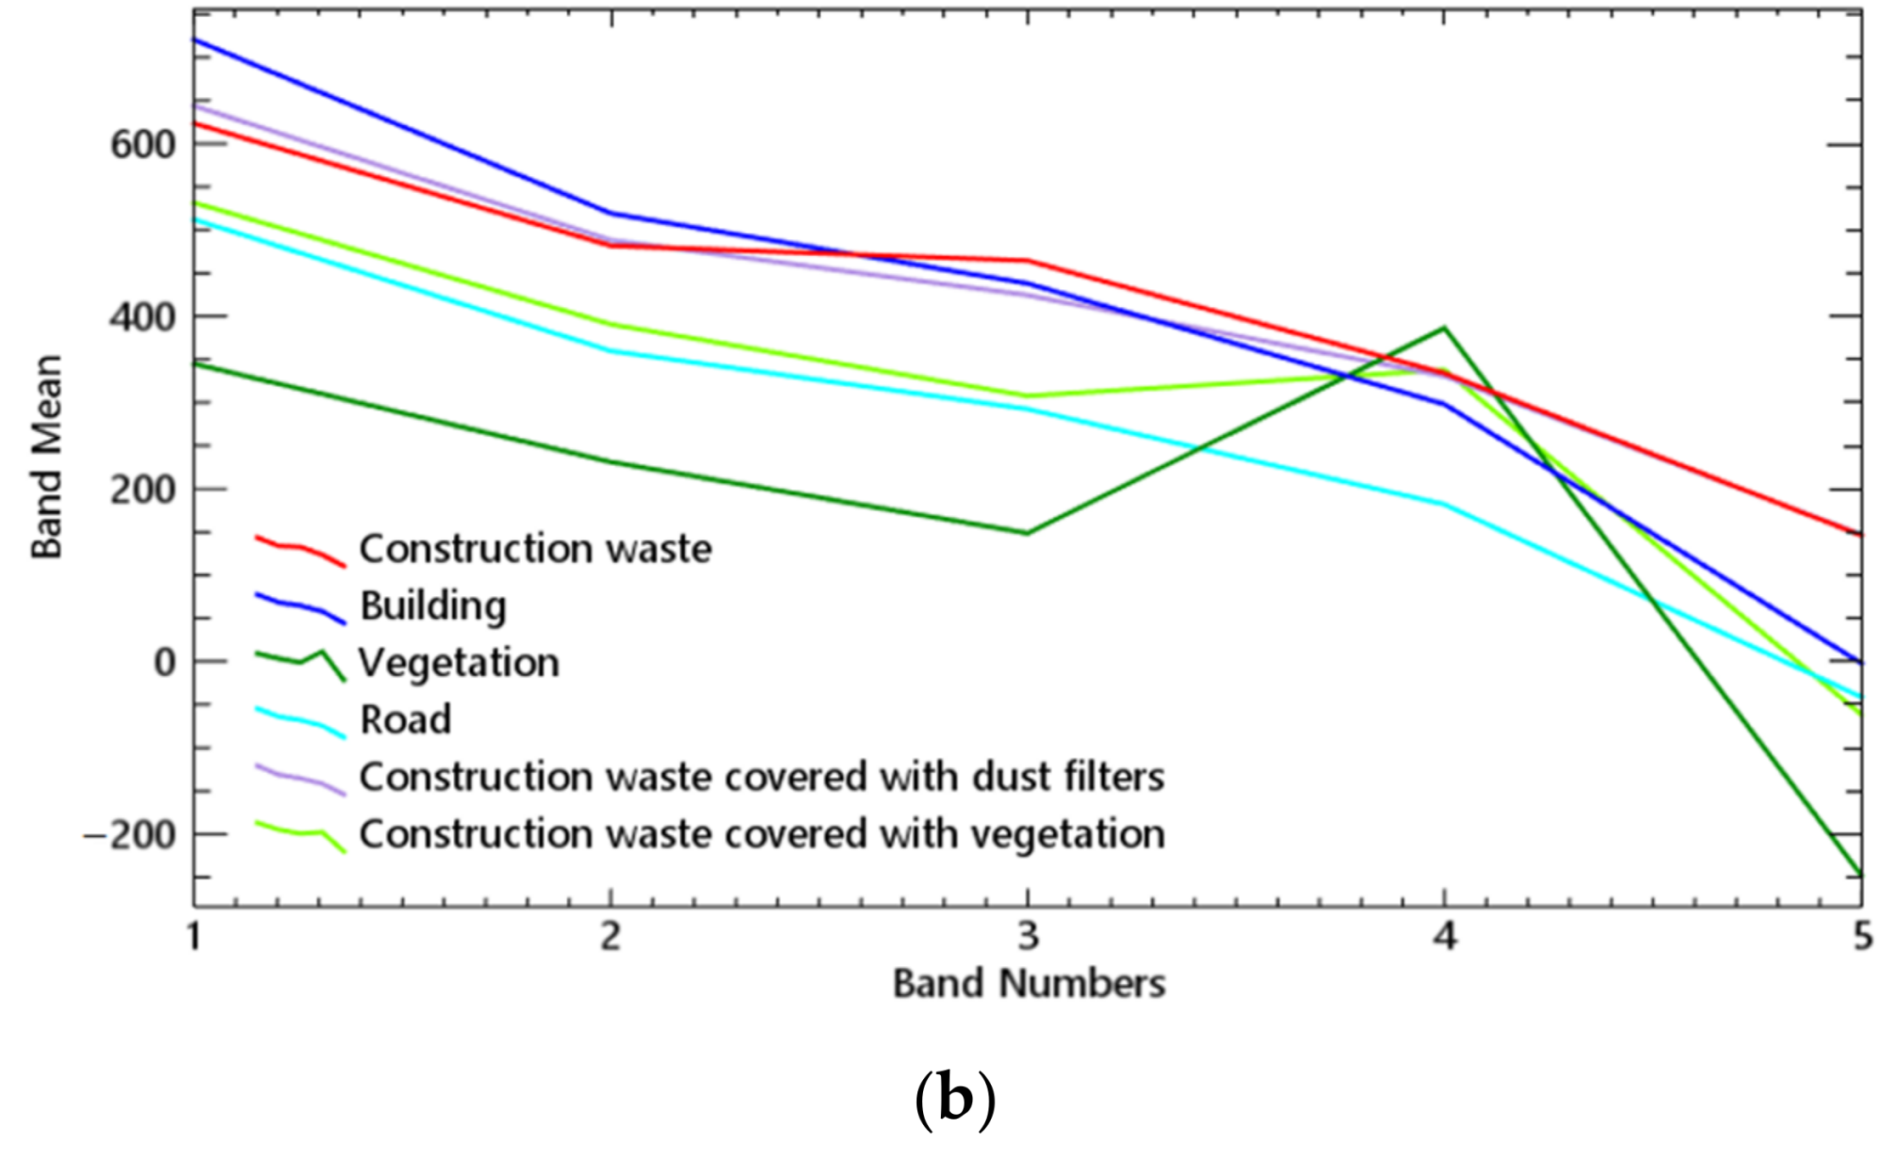
The spectral features of the construction waste are mainly related to the composition of the construction waste on the VHR remote sensing image. Different soil contents, wall, roof waste, and other components will exhibit different spectral features, which makes it more difficult to interpret the construction waste. Moreover, the surface features of the construction waste vary depending on the accumulation time. In this study, spectral mean analysis was performed on samples collected from construction waste and the surrounding ground objects in the study area, as shown in Figure 3 and Figure 4. The X-axis represents the image bands, which are blue, green, red, near-infrared bands, and single bands processed by the morphological index. The Y-axis represents the mean statistics of each band.
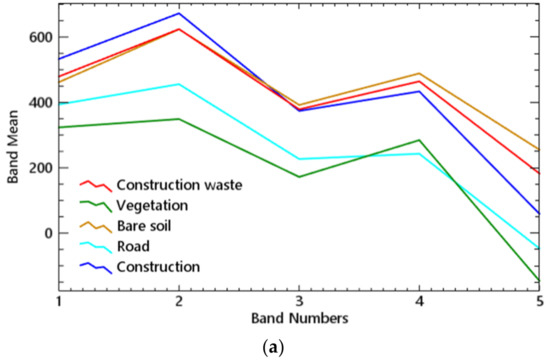
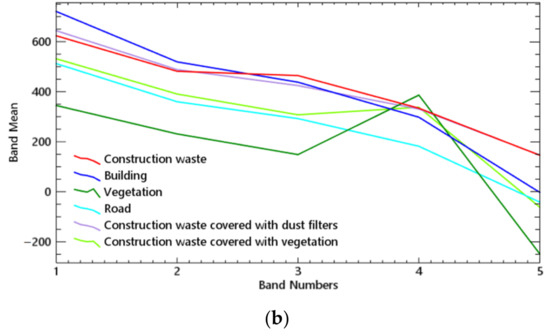
Figure 3.
Spectral distribution of cases A and B: (a) Case A; (b) Case B.
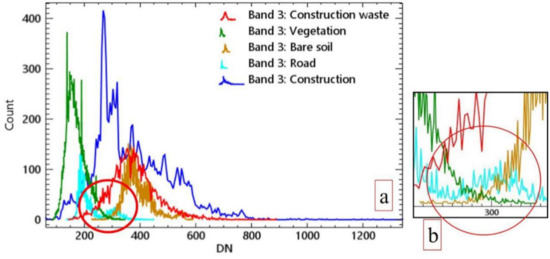
Figure 4.
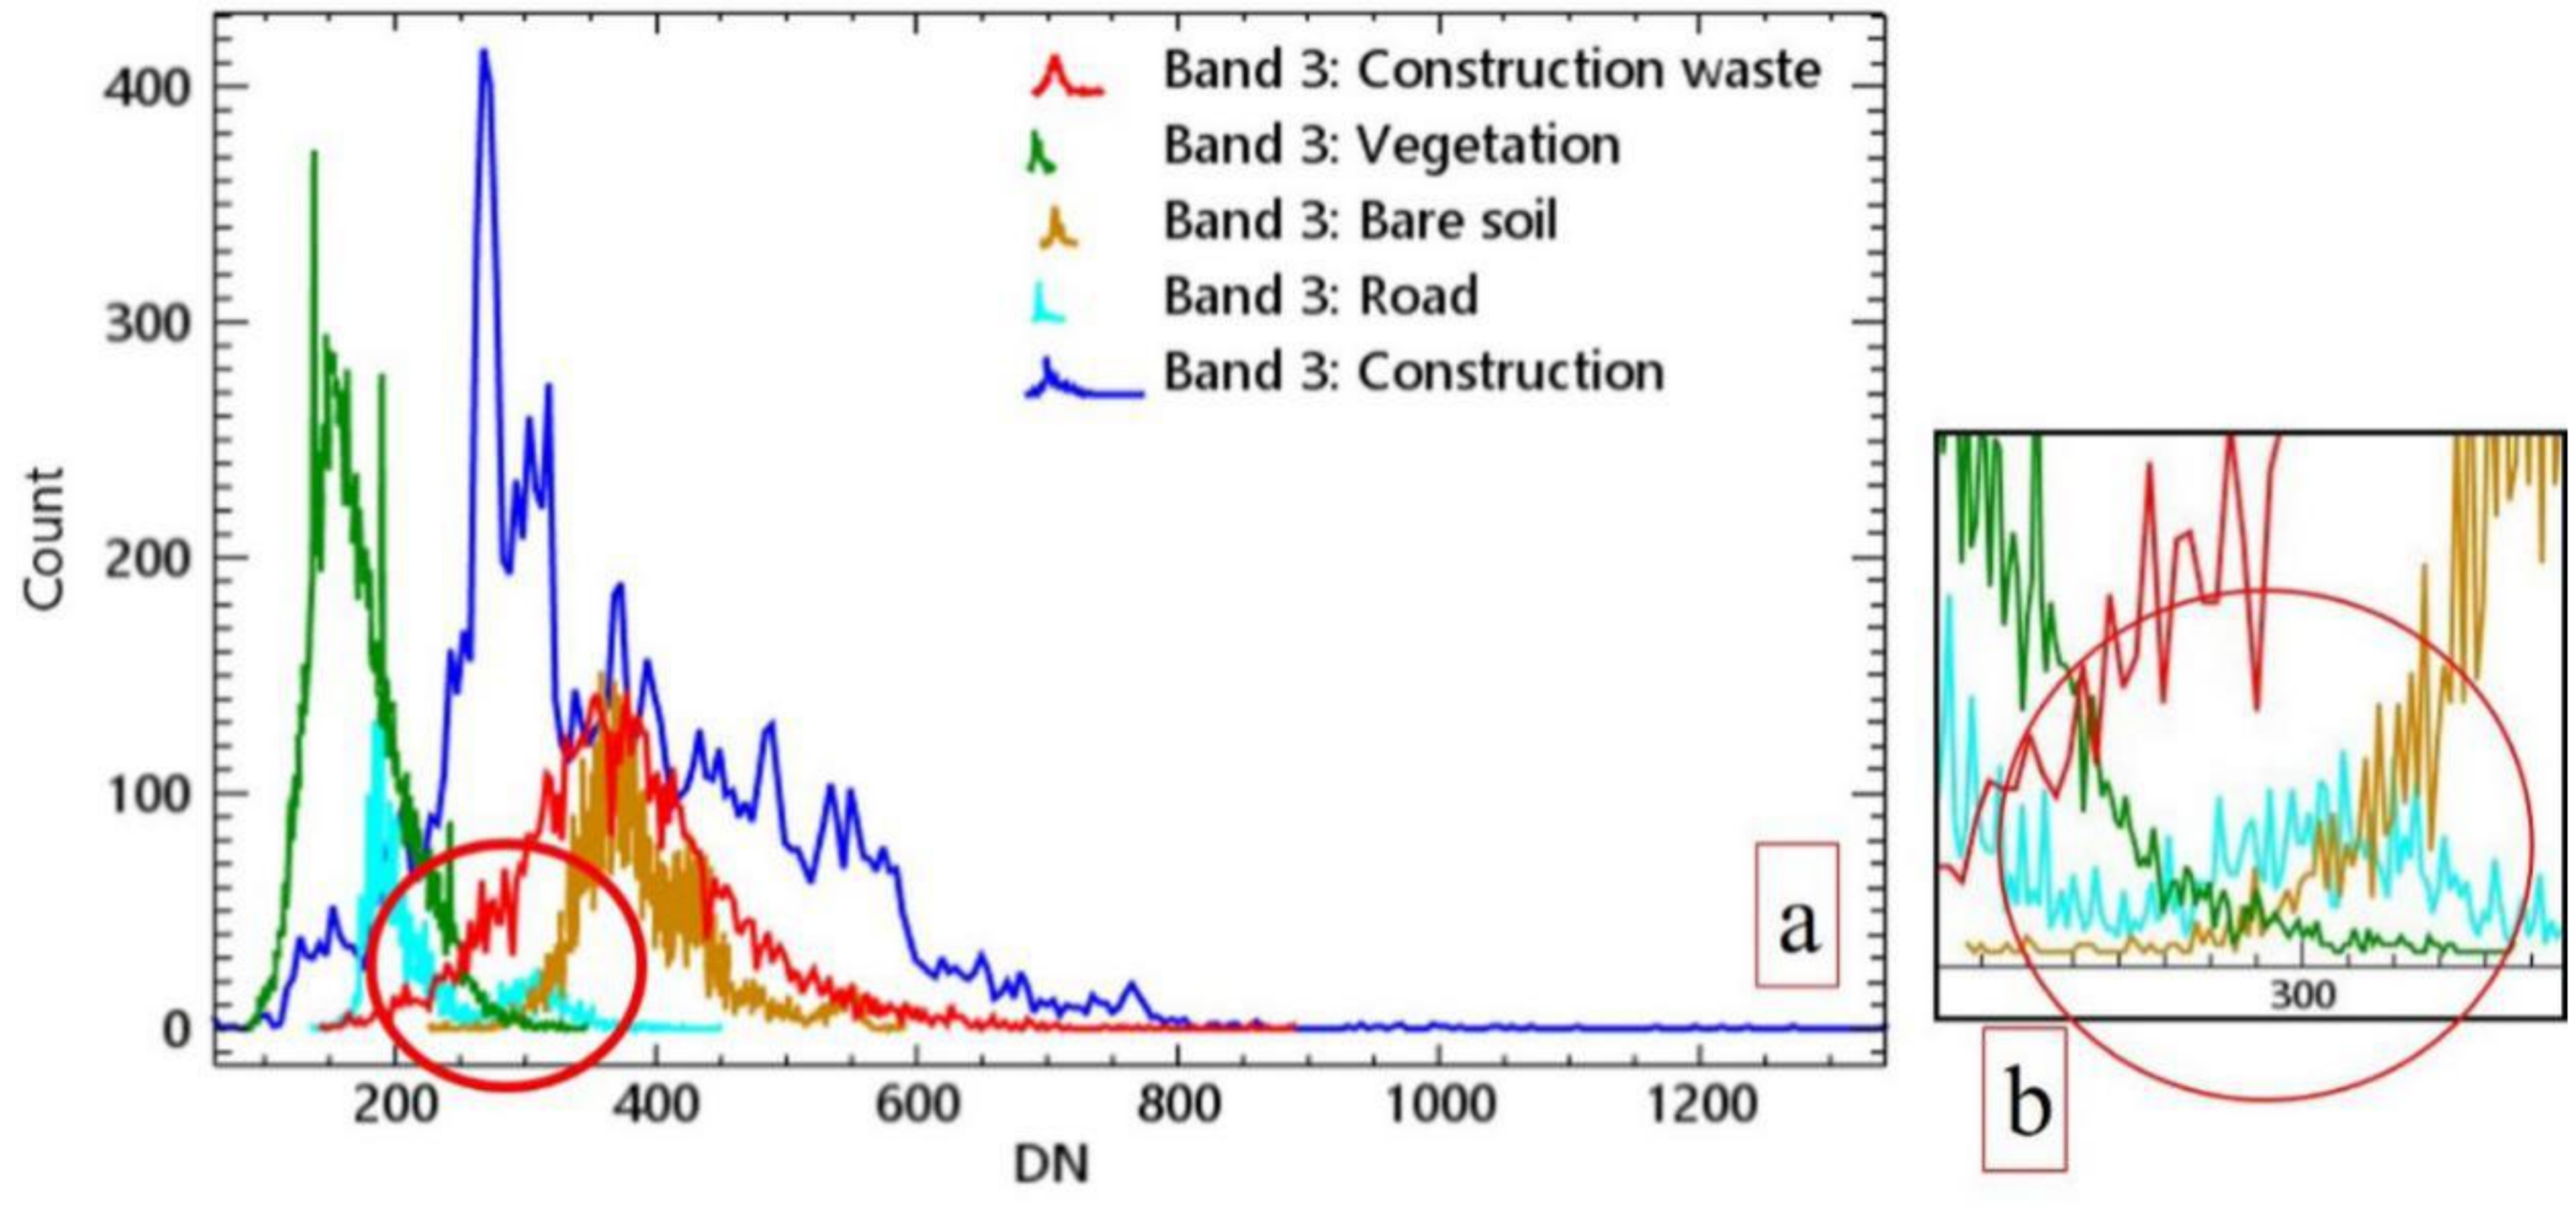
Histogram distribution of the third band in case A: (a) the junction of the vegetation road and the construction waste; (b) the approximate distribution range of the separated vegetation, road and other ground objects is 250~350.
The distribution of the spectral mean value for these two study areas is obviously different, according to the different land cover types, image acquisition time and surface reflectance. However, the construction waste in these two areas is similar to the spectral mean values of the buildings and bare soil. In other words, there is a problem of confusion between the construction waste and other land features in both areas, when using only the spectral features to identify the construction waste area on the VHR remote sensing image.
In case A, vegetation and roads could significantly be separated from other land features on all of the bands, but construction waste, buildings, and bare soil are more closely distributed, especially in the third band, as shown in Figure 3a. In other words, this type of distribution could lead to many commission classifications in the regular classification by spectral bands. It is worthwhile to note that the fifth band is the image processed by the morphological index, and construction waste, buildings and bare soil are obviously separated in terms of their spectral mean value in this band.
Different from case A, the construction waste area in case B has been covered by dust screen and vegetation, as shown in Figure 3b, and the spectral distribution of the construction waste covered by dust screen and the exposed construction waste are relatively close, while the spectral distribution of the construction waste covered by vegetation and vegetation are also close. That means that it is difficult to identify the construction waste area when it has been covered by vegetation and; thus, the dust screen coverage has no particularly significant impact on the identification and extraction of the construction waste area using spectral features on a VHR remote sensing image, but vegetation does.
Considering the vegetation and bare soil with vegetation after the re-segmentation of the second layer, we applied the normalized differential vegetation index (NDVI) [28] to separate those ground objects according to the reflection feature differences of the vegetation in the near infrared band and the red band.
where Band 3 is the spectral mean value of the image objects in the red band, and Band 4 is the spectral mean value of the image objects in the NIR band.
In this article, the third band and the fifth band were used for threshold classification to separate the vegetation, roads, and some buildings as non-construction waste. The larger the value of the vertical axis is, the more concentrated the distribution of the gray values of the ground objects that correspond to the horizontal axis. For example, in Case A, the red circle in Figure 4a shows the junction of the vegetation road and the construction waste, and the approximate distribution range of the separated vegetation, road and other ground objects is 250~350 in Figure 4b. Finally, the optimal threshold value could be determined through multiple experiments.
- (2)
- Geometric Features
There are always many artificial ground objects around construction waste, such as buildings, farmlands, and roads, and they usually have regular shapes, while the geometry of construction waste is usually irregular (Figure 5a,b); as a result, we can use a rectangle function to discriminate the construction waste from the other surroundings. Sometimes; however, the boundary of the construction waste accumulation is similar to the boundary of the original building (Figure 5c,d). Thus, we need to use more geometric features to distinguish between buildings and construction waste, not only a rectangle function.

Figure 5.
Geometric shapes of construction waste: (a) Irregular shape, (b) irregular shape, (c) standard rectangular, (d) regular shape of building.
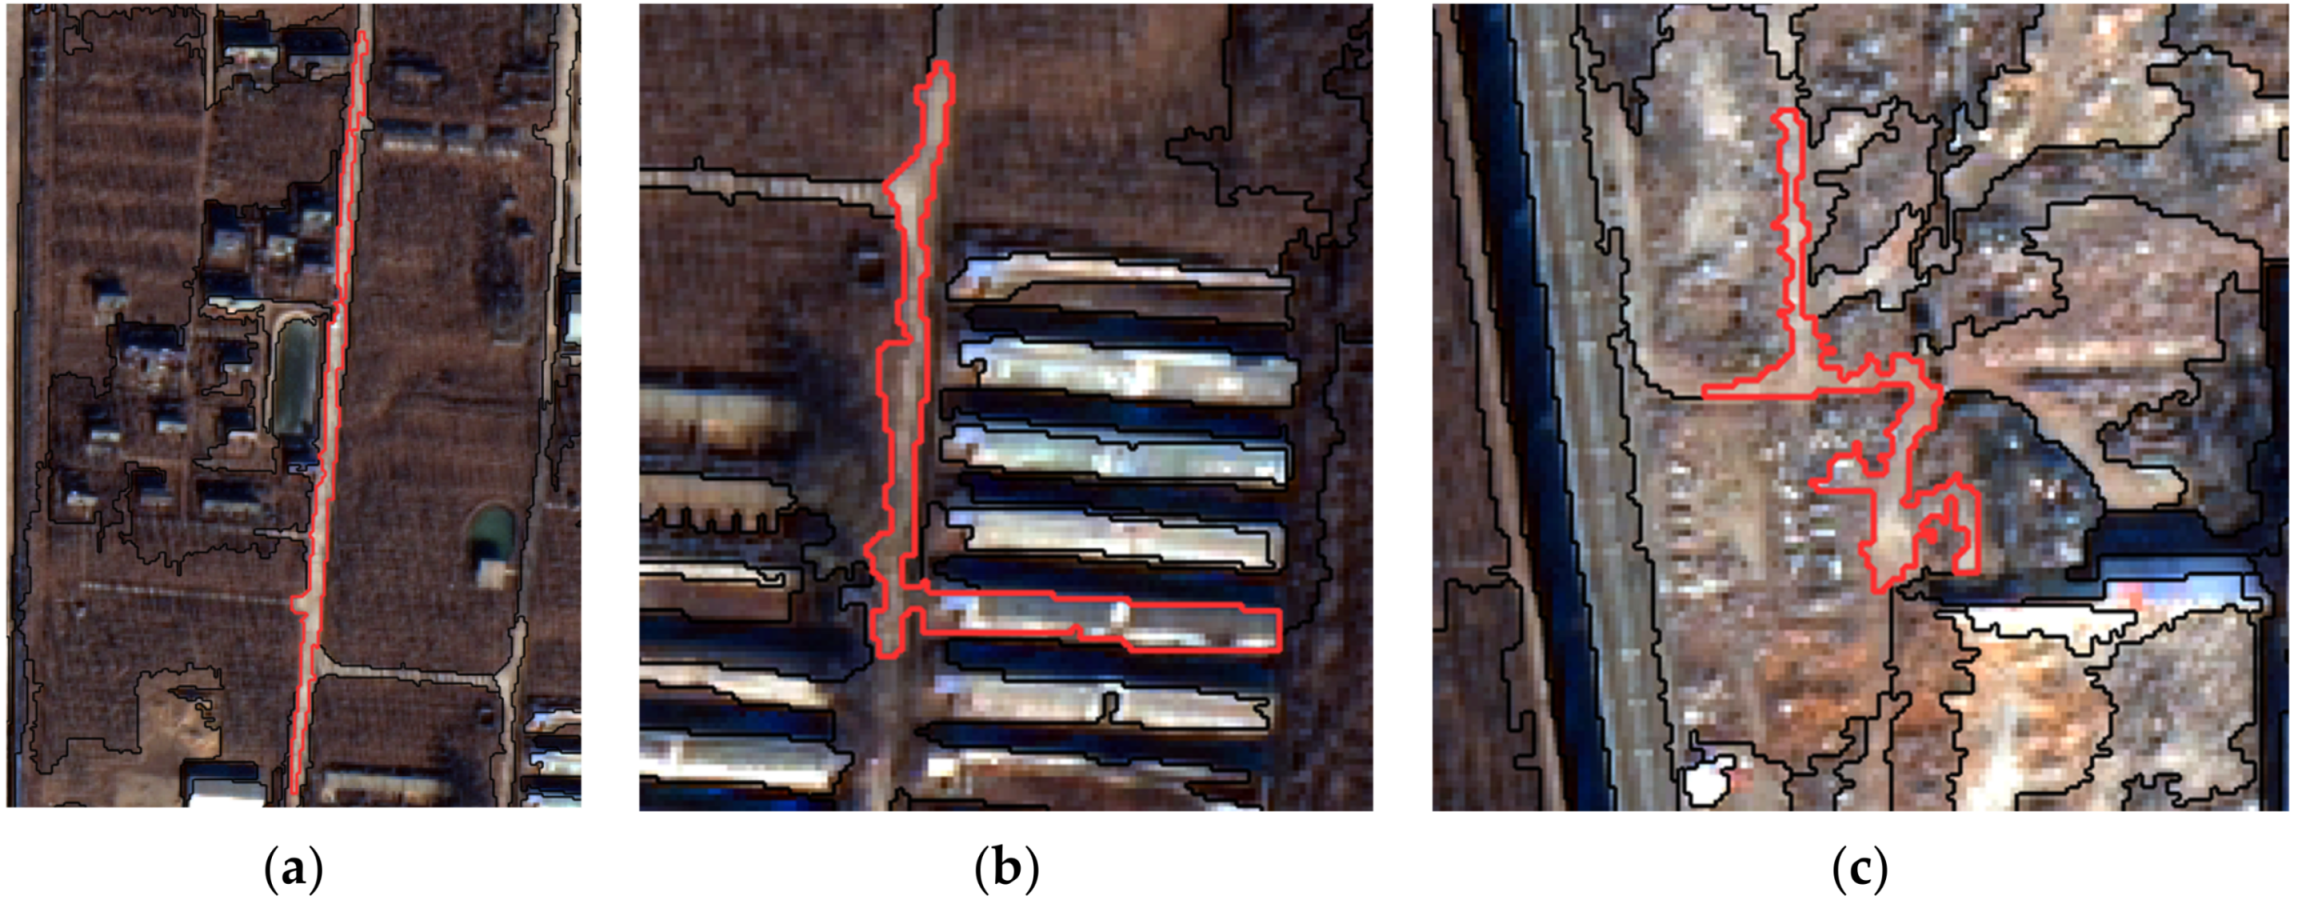
Roads always have some obvious linear features (Figure 6a) and low compactness (Figure 6b,c), which are significantly different from the geometric features of construction waste. According to this type of difference, we prefer to use the ratio of the length to width and polygon compactness to discriminate construction waste from roads.
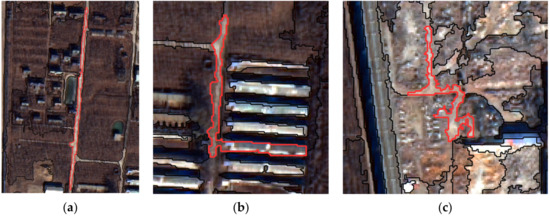
Figure 6.
Geometric features of roads: (a) Linear image objects, (b,c) image objects with low compactness.
The ratio of the length to the width is a common linear index parameter [29], which is used to identify image objects with linear characteristics such as roads.
where Length is the length of the image object, and Width is the width of the image object.
The compactness (polygon) is the ratio of the area of a polygon to the area of a circle with the same perimeter, which is used to separate image objects with low compactness, such as rural roads, due to the large number of serrated teeth caused by segmentation.
where Area represents the area of the polygon object, and Perimeter represents the perimeter of a polygon object.
Since image segmentation objects will have small areas of patches, we divided such objects into non-construction waste by setting an area threshold.
where Pv represents the number of pixels contained in the image object, and u represents the pixel size of the coordinate system units.
- (3)
- Texture Features
According to the field survey, we found that the differences in the image texture characteristics between construction waste and other surrounding objects are obvious in the study area (Figure 7). We used the gray level co-occurrence matrix (GLCM) [30] to obtain the texture features of the image objects.
where d is the distance, θ is the direction, and i and j represent the row and column numbers, respectively.
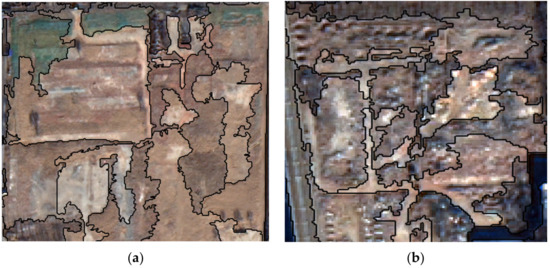
Figure 7.
Significant differences in the texture features: (a) Bare soil, (b) construction waste.
A series of statistics to describe the texture of the image object could be calculated by GLCM [31]. Homogeneity reflects the partial texture change of the image, and it can well characterize the partial texture features of the image [31]. The value range is [0, 1], as shown in Equation (6). For bare soil that is confused with the spectral features of the construction waste but has obvious differences in internal texture features (Figure 7), we used homogeneity to separate it into the non-construction waste.
The demolished buildings and some urban buildings cannot be completely separated by spectral and geometric features, but their features are obvious differences from the adjacent image objects.
GLCM describes the texture by measuring the spatial correlation features of the spectrum on the image [32]. The standard deviation is one of its statistics, which is different from the simple standard deviation of the grayscale in the image. It mainly addresses the combination of a reference pixel and adjacent pixel, and it measures the dispersion degree of the mean, as shown in Equation (7). The standard deviation is mainly used to separate the image objects that are easily confused with the construction waste in the vicinity of the vegetation and shadows in the study area.
The contrast reflects the sharpness of the image and the depth of the groove of the texture [33]. The deeper the groove is, the greater the contrast, and the clearer the effect. On the other hand, when the contrast is small, the groove grain is shallow, and the effect is fuzzy. We used the contrast eigenfunctions to separate the confusing image objects, such as buildings near the construction waste accumulation area.
- (4)
- Morphological Features
Most of the buildings around construction waste are in the process of demolition, and they do not have the regular geometric shape and texture features of undemolished buildings. Moreover, the spectral features of buildings and building waste during demolition are similar. As a result, it is difficult to separate the buildings from a demolition area because of this redundant and interfering information. In consequence, we use mathematical morphological image processing to highlight the characteristics of the buildings and to increase the differences between the construction waste and the buildings. The application of mathematical morphology in image processing can simplify image data, maintain the basic shape features of the target in the image, and eliminate any irrelevant noise structure [34]. There are four basic operations of mathematical morphology: dilation, erosion, opening, and closing. These basic operations are based on mathematical morphology and can also be deduced and combined into various practical algorithms for mathematical morphology, such as the top-hat transformation, bot-hat transformation, opening by reconstruction, closing by reconstruction, and so on [35]. The morphological reconstruction algorithm is the basis of many effective image transformation algorithms. Due to the constraints of the mask image, it solves the shortcoming that the traditional opening operation is highly dependent on accurate structural elements to correctly restore the shape. Moreover, due to its own nature, open reconstruction not only removes all of the parts that are corroded by structural elements but also spreads only at the highest level suitable for structural elements, in such a way that the contrast of bright image objects can be reduced to a certain extent. In this article, we used the opening by reconstruction algorithm to smooth the image and removed all objects that were smaller than structuring elements.
Therefore, the use of morphology not only provides morphological features for identification but also helps the higher reflectivity of construction waste to form high spatial contrast with adjacent buildings, which provides a method for the successful separation of construction waste from buildings.
Opening by reconstruction is an algebraic opening operation [36]. The realization of morphological reconstruction requires two elements: the mask image f and the mark image g. The basic idea is to use the marked image g to iteratively process the mask image f. When the propagation of the marked image is hindered by the mask image, the iteration is stabilized, and the algorithm is automated. In other words, image f is reconstructed with size n.
The structuring element b is defined to erode the input image to obtain the marker image g, and then, the original image is used as the mask image f to reconstruct the marker image g. The opening by reconstruction of image f at scale n is defined as the reconstruction of the f erosion at scale n. The opening by reconstruction of image f at scale n is defined as the erosion reconstruction of f at scale n.
where i is the number of cycles when , is the dilation reconstruction of image g to image f, and is the erosion operation of mask image f based on the structuring element b.
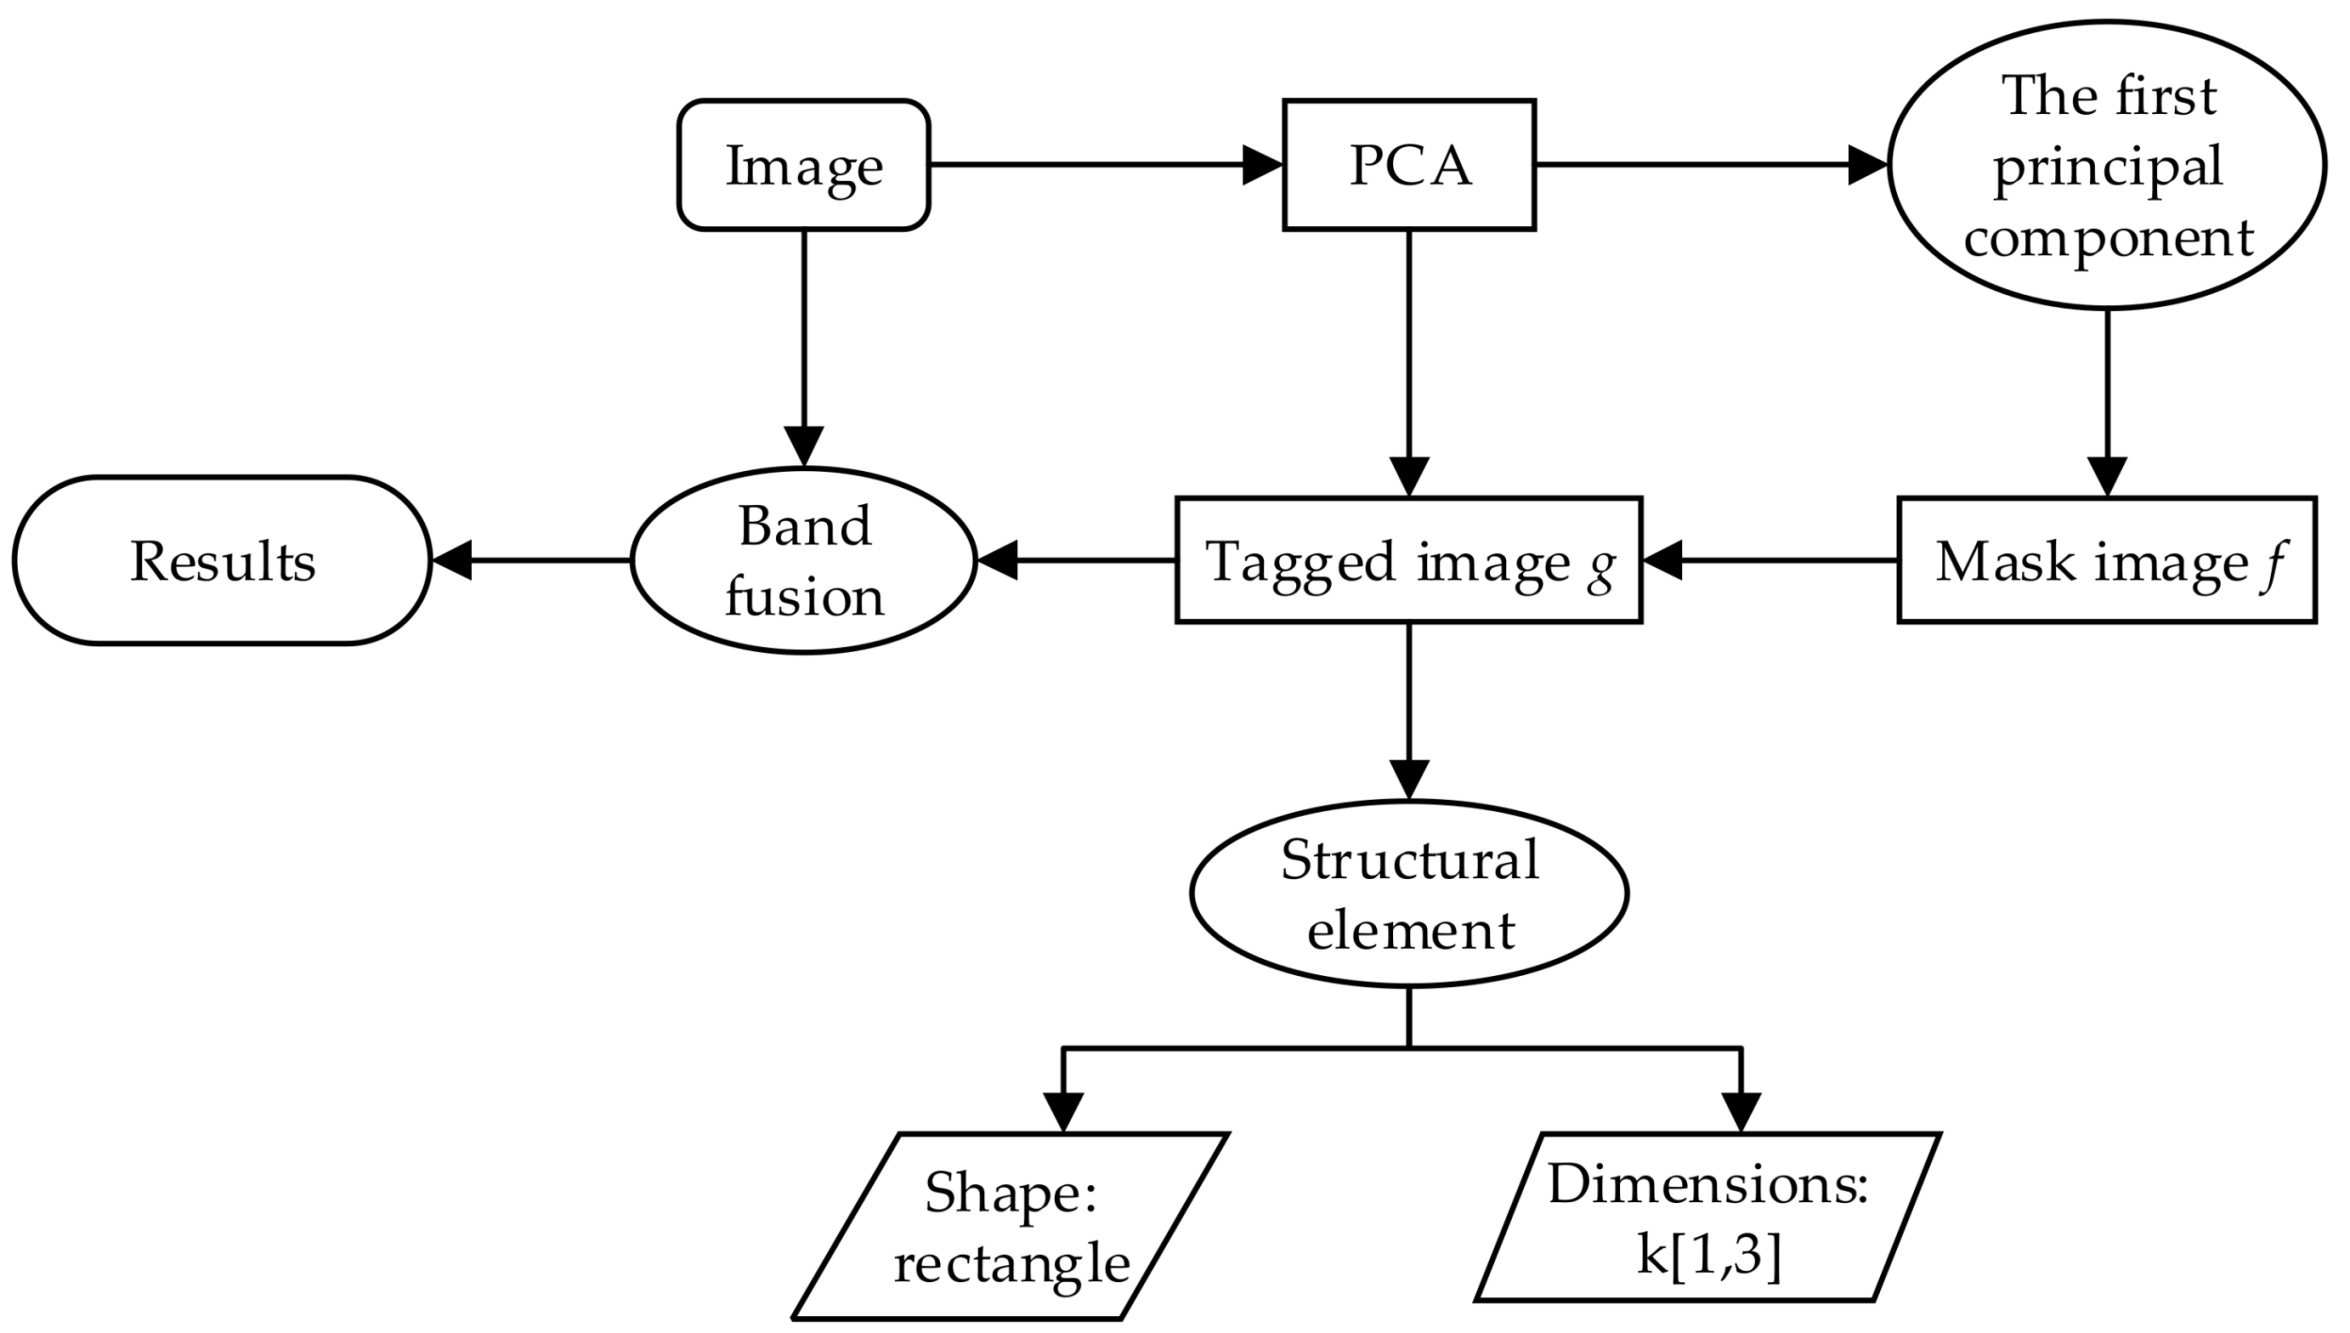
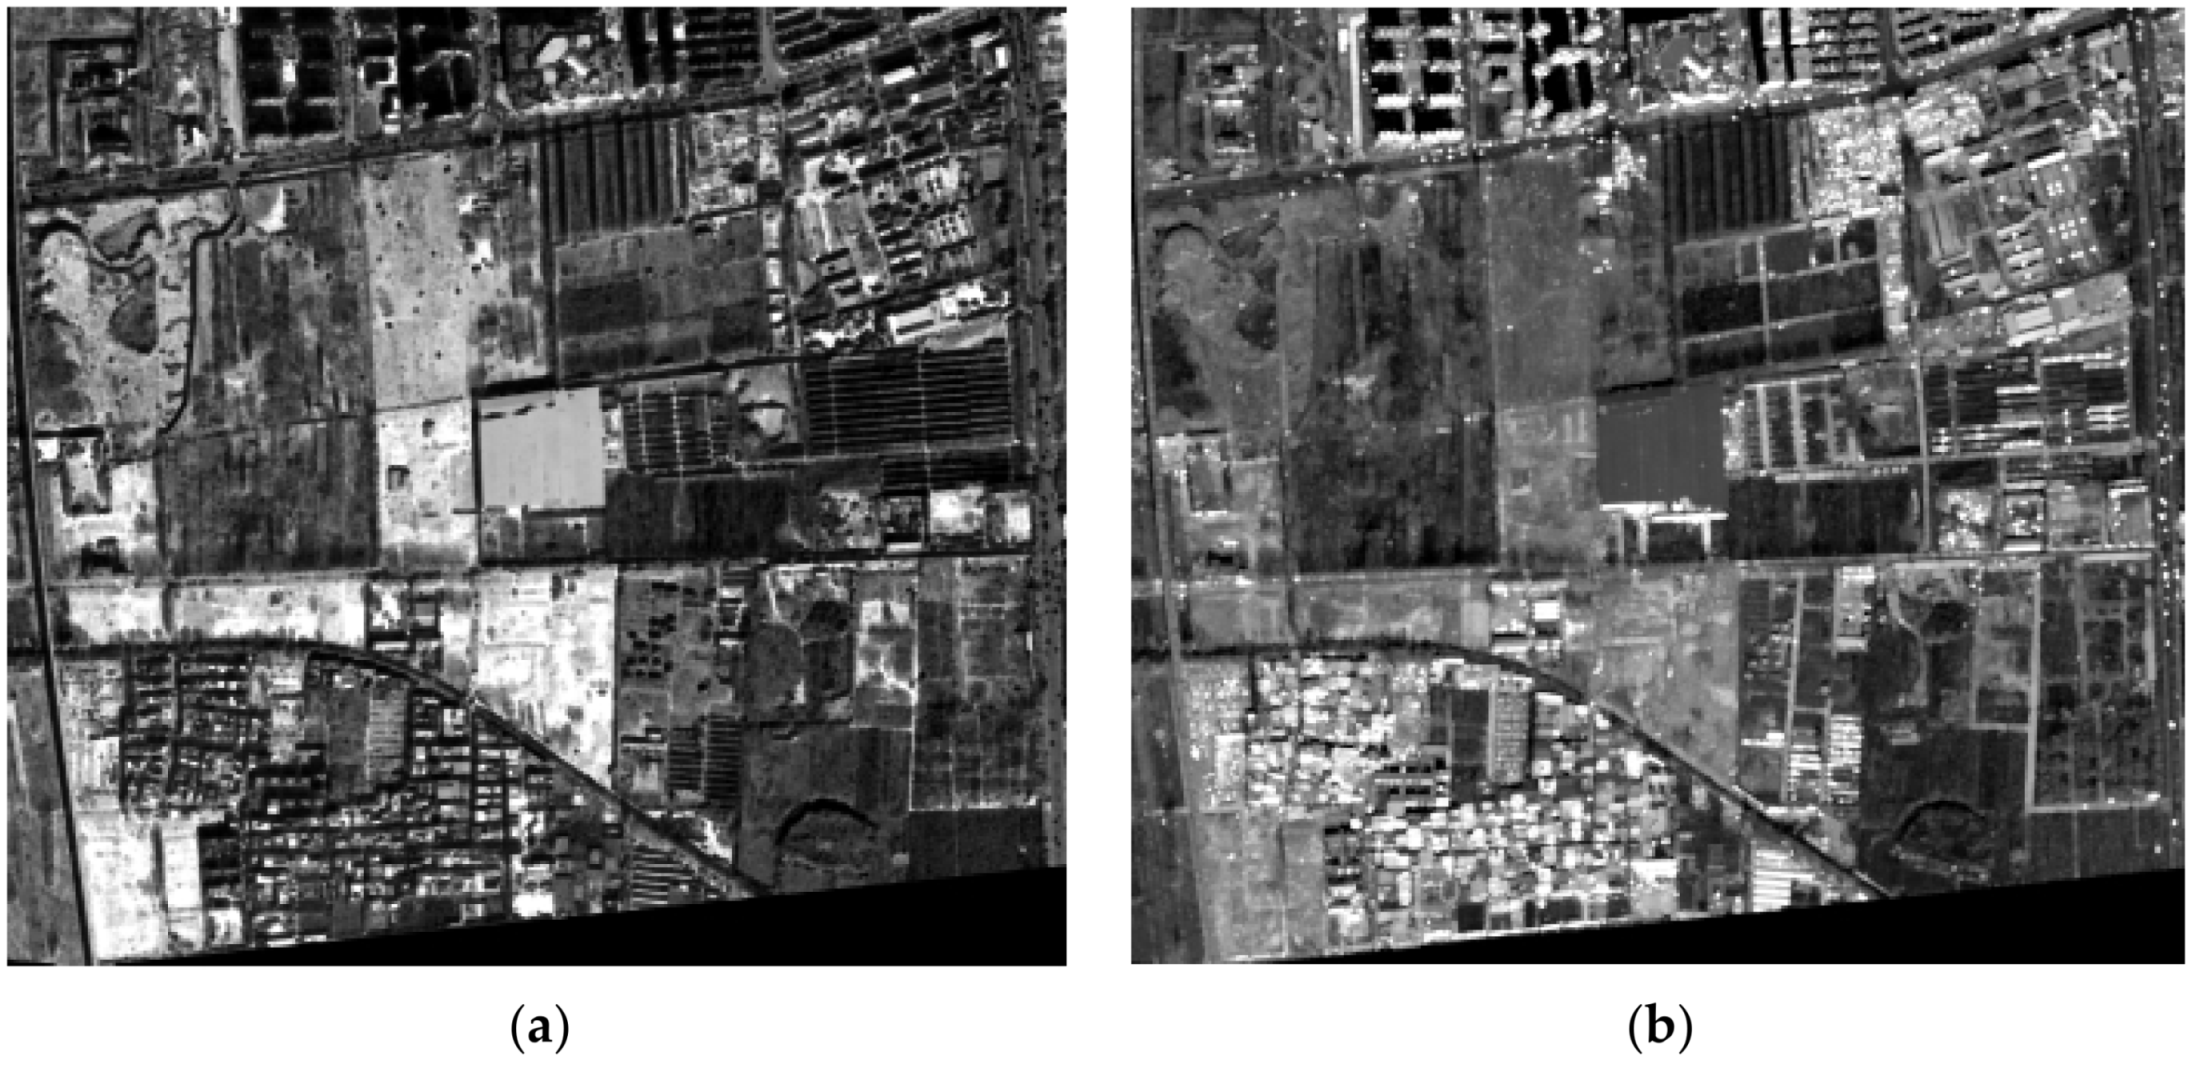
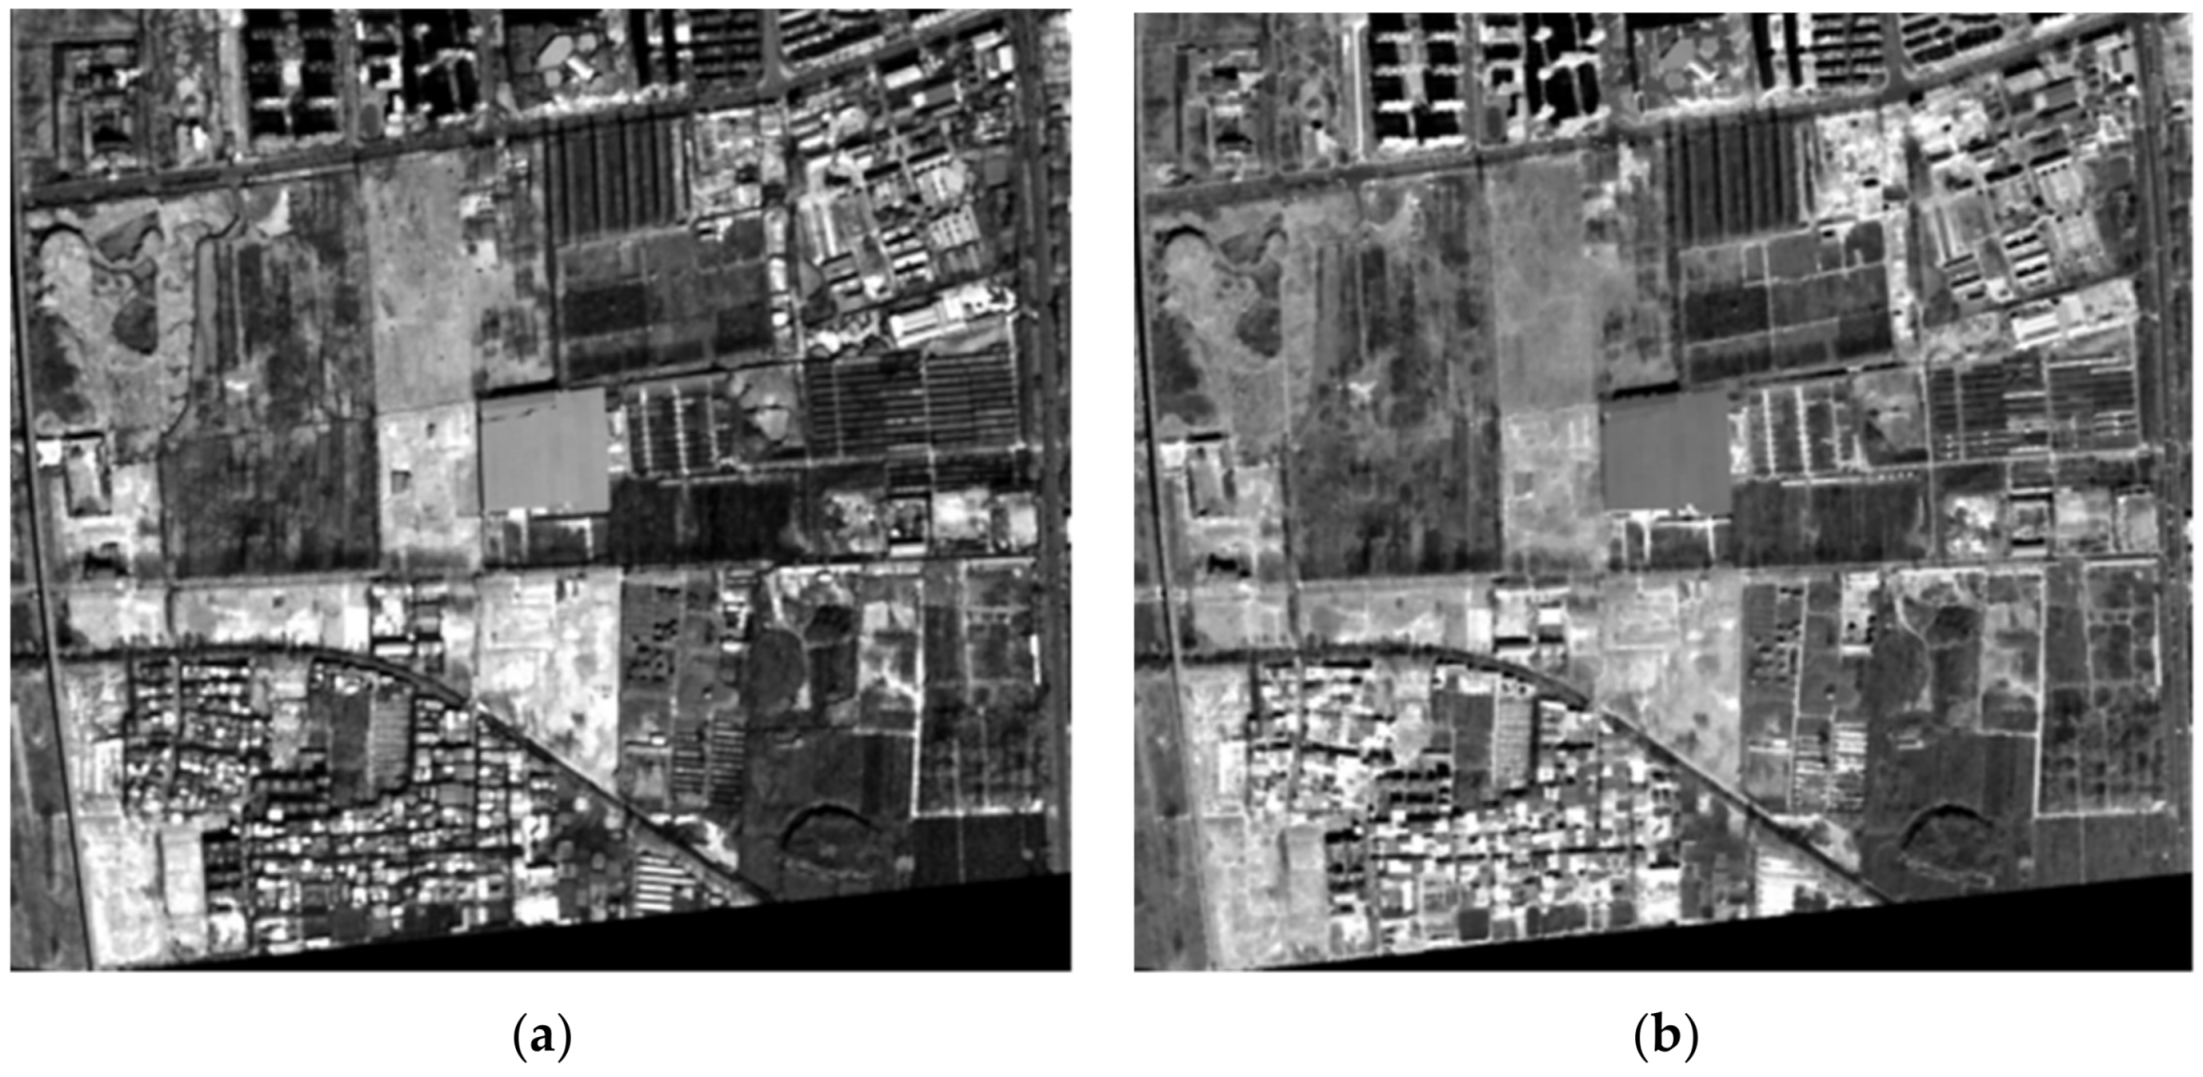
Firstly, we used the principal component analysis to transform the original image, and we used the first principal component as the mask image f. Thus, we could obtain the marked image g by corroding the mask image f. Then, according to the geometric characteristics of the buildings in the study area, we used the open reconstruction operations of different scales and shapes on the marked image g, under the restriction of the mask image f, and the scales and shapes were defined by the structuring element b. Finally, we selected the optimal shape and scale to reconstruct the image as the result of the morphological index processing, and we fused the result with the original image to obtain an image with five bands, as the input data for the image segmentation and classification.
Based on the above ideas, we used the basic morphological operations in study area A to compare the effect with the reconstruction operation, as shown in Figure 8, Figure 9, Figure 10 and Figure 11.
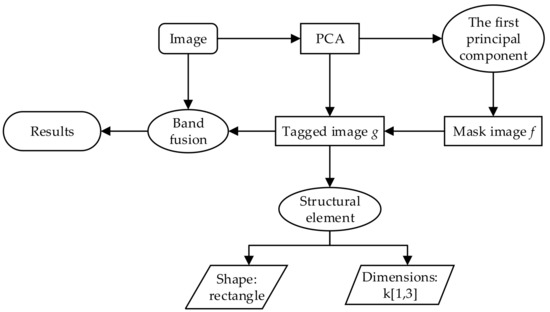
Figure 8.
Flowchart of morphological image processing. PCA: Principal Component Analysis.
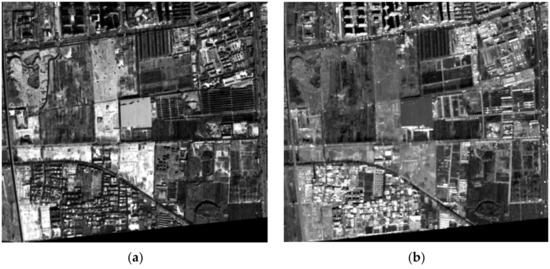
Figure 9.
The results of the erosion (a) and dilation (b) operation on study area A.
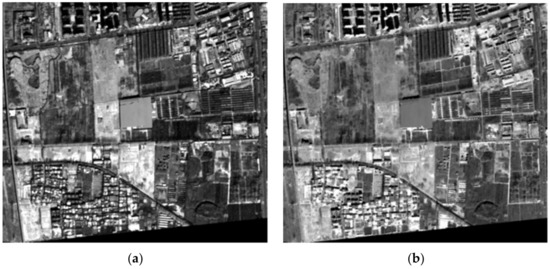
Figure 10.
The results of opening (a) and closing (b) operations on study area A.
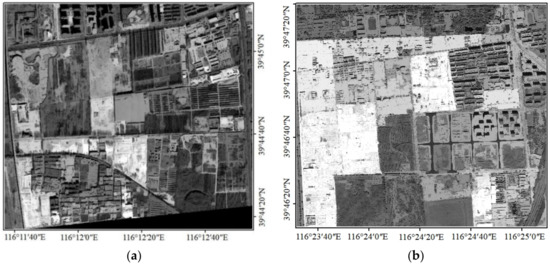
Figure 11.
The results of the morphological opening reconstruction: (a) Area A; (b) area B.
2.2.2. Hierarchical Segmentation
Multi-resolution segmentation (MRS) is known to be a general segmentation algorithm for VHR remote sensing applications. When using MRS, a large scale can result in small image objects being covered by larger objects, which is called “under-segmentation”, whereas a small scale can cause fragmentary image objects, which is called “over-segmentation“. The boundaries and number of image objects in these two situations might not be consistent with the actual object [37]. Multi-level optimization of MRS can achieve the corresponding level of application requirements through different scales, and the generated image objects have different attributes, which helps to extract different categories, to solve the problem of under and over segmentation caused by single-layer segmentation. This type of segmentation was called hierarchical segmentation. Aiming at the above problems, we adopted the hierarchical segmentation method to extract construction waste information, which ensured that different ground objects were completely segmented at different levels and scales [38].
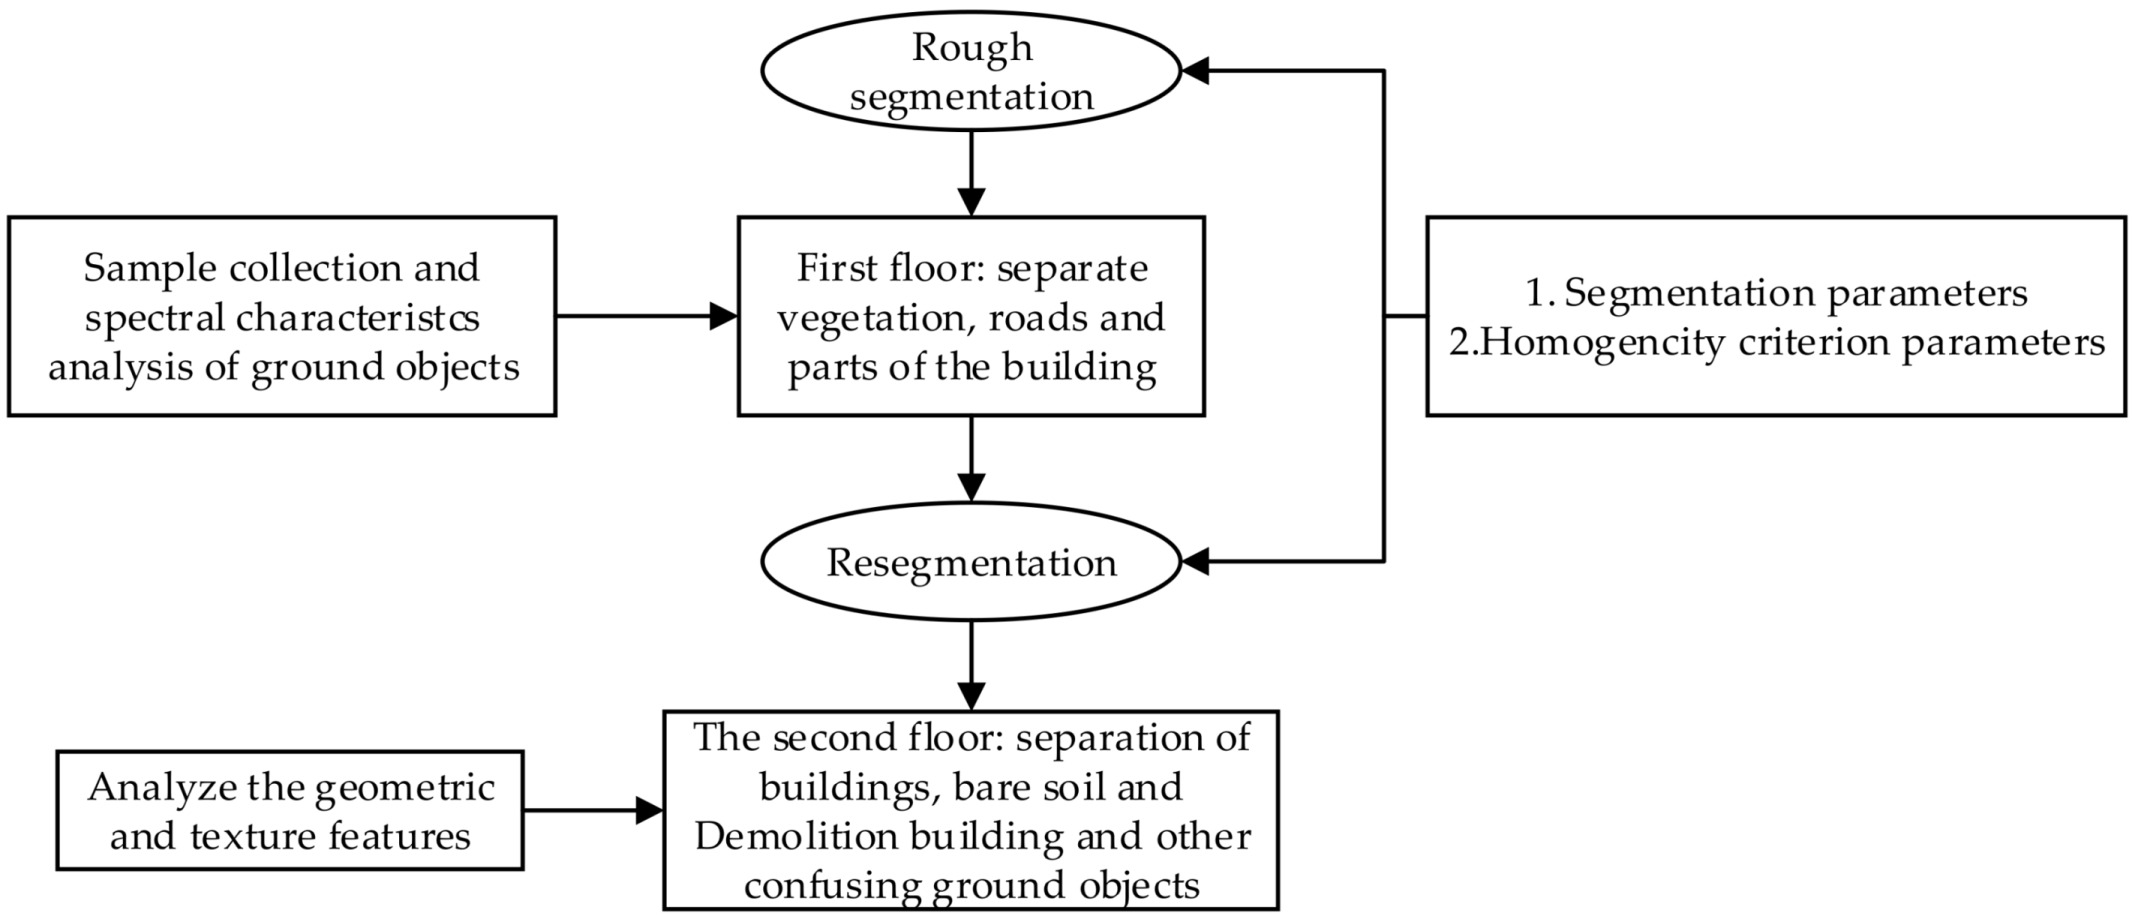
Hierarchical segmentation refers to the re-segmentation of the “child-layer” on the basis of the “parent layer”. This method combines the characteristics and inheritance relationships of the parent and child layers. We used the multi-resolution segmentation method with the segmentation parameters, which generally include dimension parameters and the conditions of homogeneity, to obtain the optimal objects. Figure 12 is a flowchart for the hierarchical segmentation.
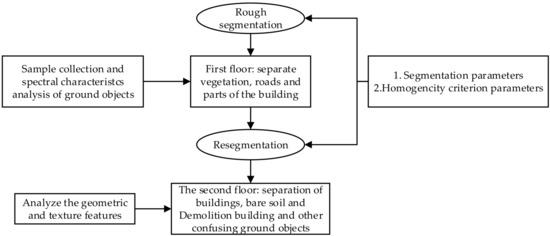
Figure 12.
The flowchart of the proposed hierarchical segmentation.
Scale parameter settings include the weight setting of each band and the scale parameter setting. The size parameter is an abstract concept that affects the size of the segmentation objects. The larger the segmentation parameter is, the larger the size of the image objects will be. In contrast, the smaller the segmentation parameter is, the smaller the image object is.
The homogeneity condition parameter setting consists of the following two parts:
- (1)
- The weight of the shape criterion refers to the degree of deviation from compact or smooth shapes. The higher its value is, the lower the influence of the color on the segmentation process. The sum of the weight of the shape criterion and the color criterion is 1, in other words, homogeneity = weight of color criterion + weight of shape criterion.
- (2)
- The weight of the color criterion refers to the sum of the weights of the standard deviations of all image layers. After we define the weight of the shape criterion, the weight of the color criterion is automatically generated.
- (3)
- The weight of the compactness criterion refers to the weight of the compactness criterion in the shape criterion, which is obtained by the quotient of the boundary length and the area. The higher the value is, the more compact image the objects could be. The sum of the weights of the compactness criterion and smoothness criterion in the shape criterion is 1.
- (4)
- The weight of the smoothness criterion refers to the quotient of the boundary length of the image object and the perimeter of the maximum enclosing rectangle. We define the weight of compactness, and the weight of smoothness is automatically generated.
According to Figure 12, we obtained the optimal parameter settings by combining the spatial and shape features of the construction waste and the surrounding ground objects.
2.2.3. Accuracy Evaluation of the Construction Waste Identification
Firstly, we used the confounding matrix method to evaluate the accuracy of the construction waste identification and extraction. Moreover, we defined the judging conditions for the separability of the construction waste, and we proposed a set of construction waste separability evaluation quality indexes to evaluate the reliability of the classification model in this paper.
- (1)
- Confusion Matrix
We randomly selected from a few samples and used the evaluation model to test the accuracy of the classification results, combined with the same period of ground truth data. The following evaluation factors, including the overall accuracy, Kappa coefficient, producer accuracy, and user accuracy, are obtained based on the calculation of the confusion matrix [39].
The confusion matrix can intuitively show the confounding ratio among the different types [40], which has two dimensions, including the true value and the predicted value, as show in Table 1. Each column of the confounding matrix represents the prediction category, and the total number of each column represents the number of predicted categories. Each row represents the true category of the data, and the total number of rows represents the true number of classes.

Table 1.
The graph of the confusion matrix.
The overall accuracy (OA) is equal to the number of correctly classified objects divided by the total number of objects. The number of correctly classified objects is distributed along the diagonal of the confusion matrix, and the total is equal to the total number of objects of all of the real reference data. We used the overall accuracy to measure the total experimental result accuracy. The Kappa coefficient (Kappa), which uses the information in the whole error matrix, can reflect the overall classification accuracy [41]. The Kappa coefficient is between −1 and 1, and a higher Kappa value indicates higher classification accuracy. The producer accuracy (PA) is the ratio of the number of objects correctly classified as class i (diagonal values) to the total number of true references in class i (the sum of columns i in the confusion matrix). Corresponding to PA is the omission error, in other words, omission error = 1 − PA. The user accuracy (UA) refers to the ratio between the number of objects correctly classified into class i (diagonal value) and the total number of objects classified into class i (the sum of the rows of class i in the confusion matrix). The commission error corresponds to the UA, in other words, the commission error = 1 − UA.
where i represents the sample of class i, n represents the number of categories, N represents the total number of objects (which refers to the test samples), represents the diagonal elements of the error matrix, represents the column sum of category i, and is the row sum of category i.
- (2)
- Construction Waste Separability Quality Evaluation Index
Since the construction waste is characterized by unclear edges, there is uncertainty in the extraction accuracy and separability of the construction waste measured by area, which will bring incalculable errors. However, the spatial distribution of the construction waste is visual and predictable. Therefore, we compared the spatial distribution and location of the construction waste with the classification results to evaluate the reliability of the experimental results.
We used the GPS data collected outdoors and the construction waste accumulation points obtained by visual interpretation as reference data to determine the storage location and approximate range of the construction waste.
The separability condition is the following:
- (1)
- The identified construction waste object has an intersection or inclusion relationship with the reference range.
- (2)
- In the case of condition (1), when the intersection takes up a large proportion of the reference range, or the number of objects beyond the reference range is small, it is considered that the separability meets the requirements (Figure 13a). When the reference range includes construction waste objects, and the proportion of the construction waste is large, the separability is considered to meet the requirements (Figure 13b). When the construction waste contains the reference range, separability is considered to meet the requirements (Figure 13c). The judgment of the proportion size must be analyzed according to the actual situation. We evaluated the separability by taking the proportion of greater than or equal to 50% to be a good separability standard.
 Figure 13. The criterion of separability quality analysis: (a) the separability meets the requirements, (b) the separability is considered to meet the requirements, (c) separability is considered to meet the requirements.
Formula (15) is the overall separability evaluation index for evaluating the construction waste identification. In Equation (15), the number of construction waste areas whose separability meets the requirements is taken as the numerator, and the total number of construction waste areas whose separability meets the requirements plus the number of wrong and missing areas is taken as the denominator. Equations (16)–(18) are the separability evaluation indexes of the construction waste and bare soil, buildings, and vegetation, respectively.
where a is the number of actual construction waste accumulation areas, b is the number of commission classification areas, c represents the number of omission classification areas, d represents the number of commission classification areas between the construction waste and bare soil, e represents the number of commission classification areas between the construction waste and the buildings, and f represents the number of omission classification areas between the construction waste and vegetation. The value range of the separability index is between 0 and 1, and the larger the value is, the better the separability quality.
3. Results
3.1. Classification of Knowledge Rules
Based on the analysis of the features of the construction waste and surrounding ground objects in Section 3.1, we established a one-to-one knowledge classification rule [42] and divided ground objects into two categories: Construction waste and non-construction waste. The classification model of the knowledge rules also has two parts. Firstly, the vegetation and road were classified in the first layer of the classification structure by coarse image segmentation. Secondly, the bare soil, regular buildings and demolition buildings were classified in the second layer of the classification structure by fine image segmentation.
In the first level, we used the coarse segmentation to separate the large parts of the vegetation and roads from the area and set the segmentation parameters according to the features of different objects. The spectral features of the construction waste and vegetation roads are obviously different, which makes the proportion of color weight be higher. When using the shape criterion, both smooth edge and compactness should be considered. Therefore, we set the weight of both smoothness and compactness to 0.5. The segmentation parameters of each layer of the classification model are set as shown in Table 2. Vegetation, roads, and parts of buildings could be classified according to the feature set of the first floor in Table 3.

Table 2.
The parameters of hierarchical segmentation.

Table 3.
Classification features selection.
In the second level, we used the re-segmentation to separate the surrounding ground objects and construction waste; additionally, these parameters are set according to Table 2. Moreover, the order of the features in the knowledge rule classification model has no effect on the extraction results of the construction waste.
3.2. Accuracy Assessment and Separability Analysis
The extraction results of the construction waste were evaluated concerning two aspects. Firstly, the accuracy of the extraction results on the construction waste was assessed by using the confusion matrix evaluation index in Section 2.2.3. Then, the separability quality for the extraction results was analyzed by overlaying the vector boundaries of the construction waste between the reference data and the extraction results, with the separability conditions of the construction waste in Section 2.2.3. Additionally, the experimental results of study areas A and B were compared and analyzed concerning these two aspects.
We have randomly selected some sample objects from the two study areas for accuracy assessment. As a result, there are 23 construction objects and 82 non-construction waste objects in area A. Additionally, 38 construction waste objects and 41 non-construction waste objects were in area B. The confounding matrix results of study area A and B are shown in Table 4 and Table 5, and the accuracy evaluation results and separability evaluation results of study areas A and B are shown in Table 6 and Table 7, respectively.

Table 4.
The confusion matrix for area A.

Table 5.
The confusion matrix of area B.

Table 6.
Accuracy evaluation of the construction waste identification.

Table 7.
Separability evaluation of the construction waste.
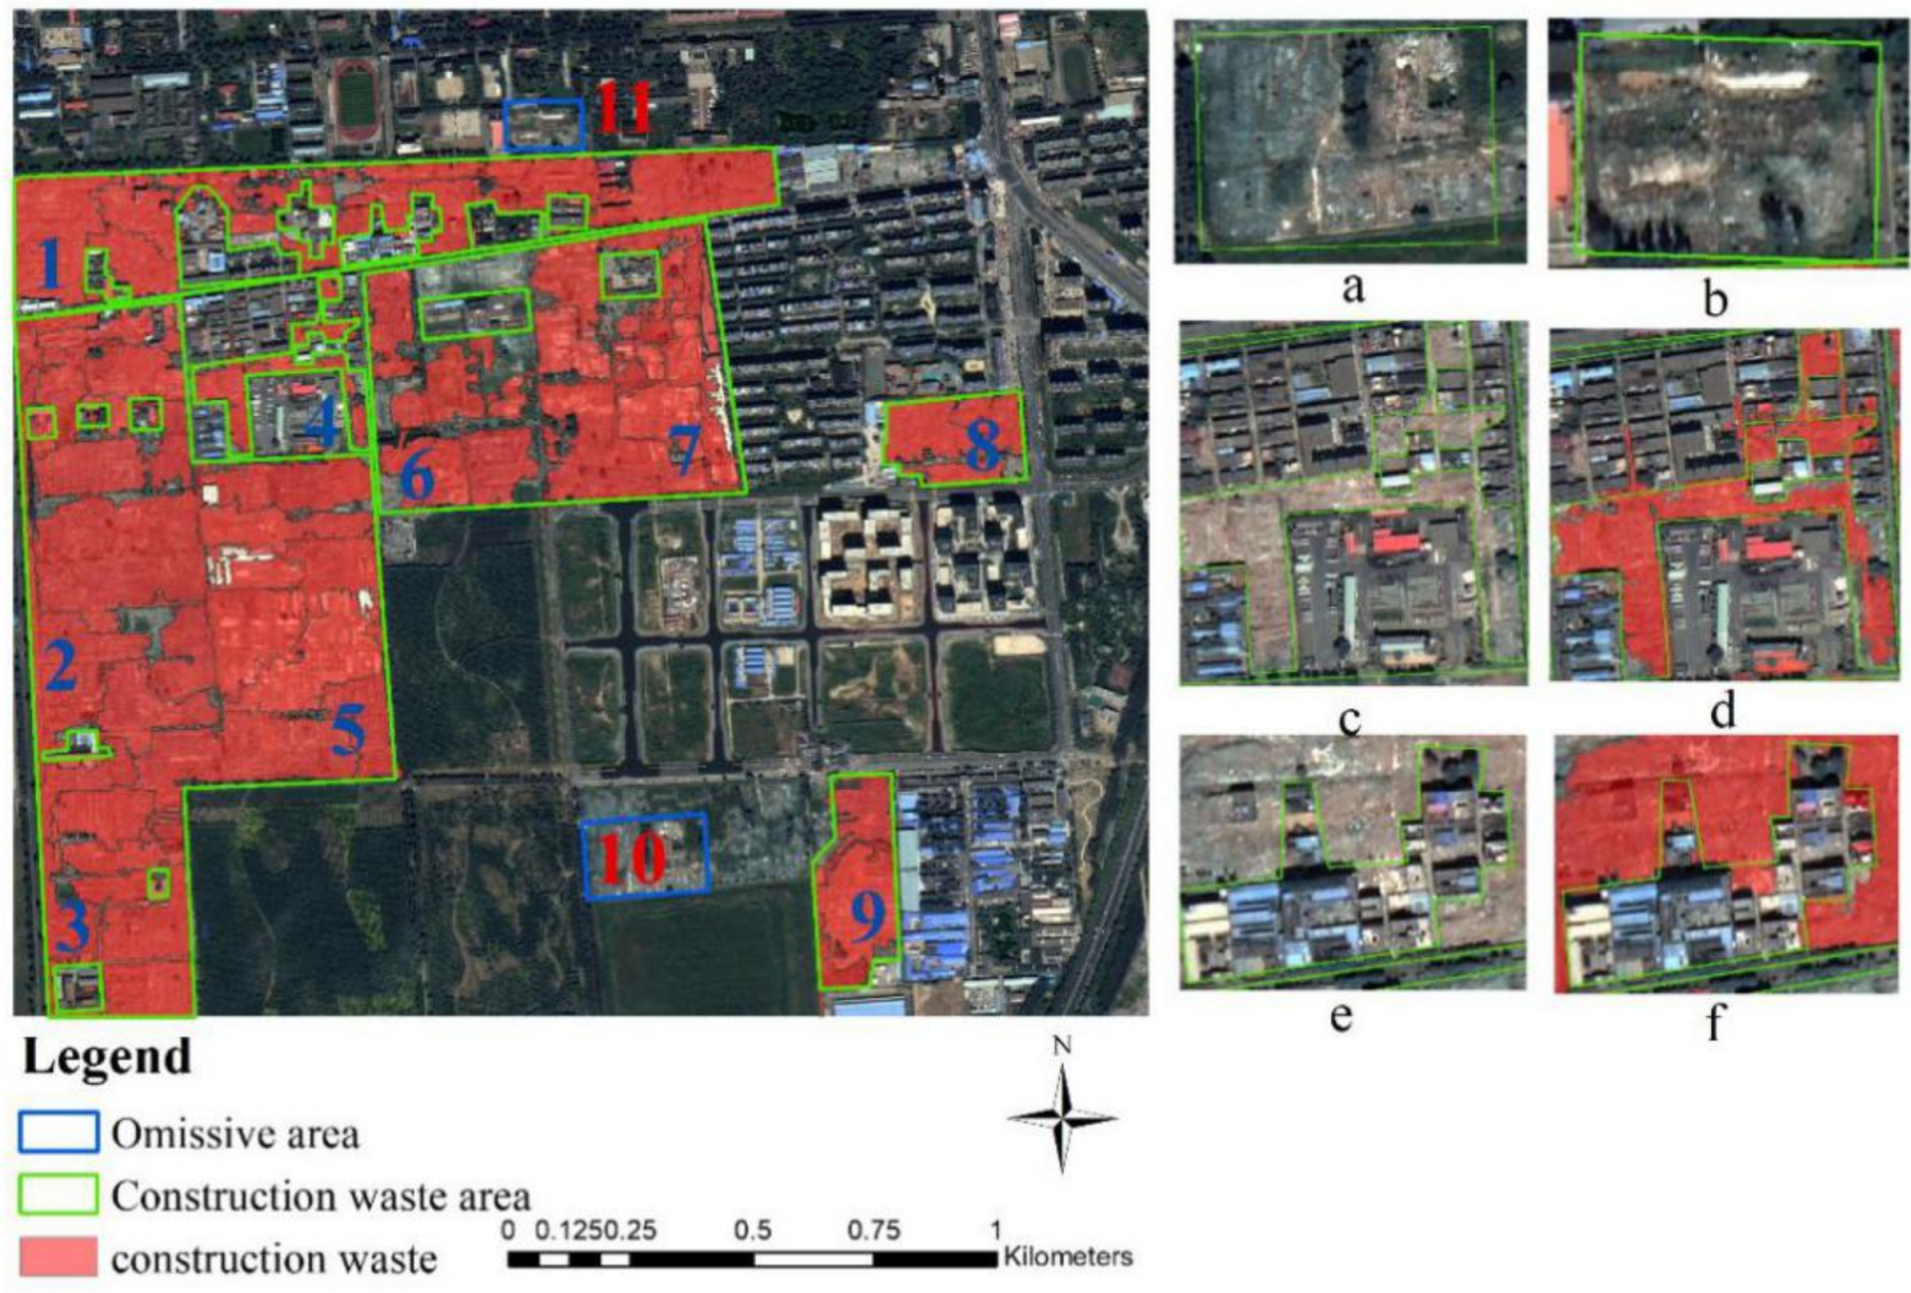
Through field surveying and image interpretation, we marked the storage sites of the construction waste in the two study areas. The green box is the reference range, and the number represents the amount of construction waste in the study area. The results are shown in Figure 14 and Figure 15.
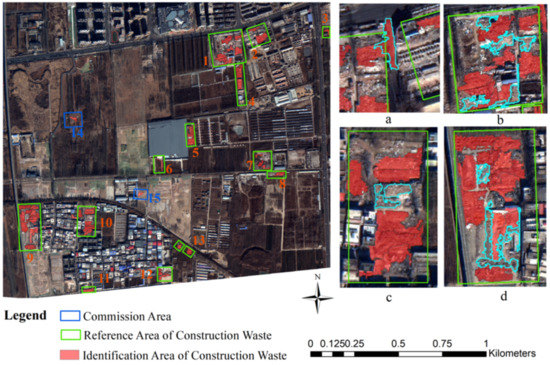
Figure 14.
Separability analysis of study area A: (a–d) the image objects in the construction waste accumulation area were not all identified, which results in the omission phenomenon.
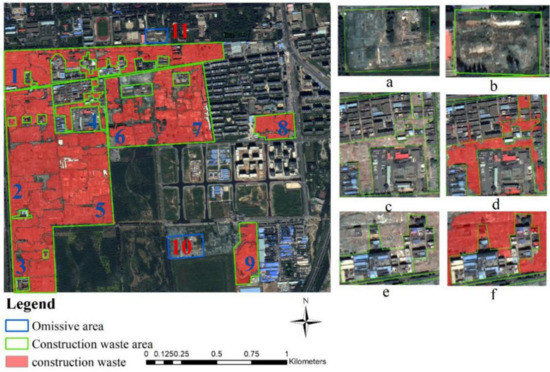
Figure 15.
Separability analysis of study area B: (a,b) vegetated construction waste, (c–f) the construction waste area.
3.2.1. Area A
Through the confusion matrix, we calculated that the OA of study area A was 0.966, and the Kappa coefficient was 0.838 and greater than 0.800, which indicates that the results were excellent, and the overall accuracy was excellent. The PA and UA of the construction waste are 0.900 and 0.810, respectively, and the corresponding error is the omission error and the commission error, among which the commission error is relatively high. Although all of the construction waste in study area A was successfully identified, two areas were wrongly classified as construction waste. According to the historical images and field surveying, the two misclassified areas are the open spaces after the construction waste is removed and transported, and the surface remains construction waste, which leads to the confusion with the features of the construction waste images and the phenomenon of misclassification. In addition, the image objects in the construction waste accumulation area were not all identified, which results in the omission phenomenon, as shown in Figure 14b–d.
In this paper, the separability analysis of the construction waste extraction results was conducted, and the actual accumulation areas of construction waste were finally determined according to the judging conditions. There were 13 areas in total, but two areas were misclassified areas, as shown in Figure 13. The red number indicates the correctly identified area, and the blue number indicates the misclassified area. Figure 14a shows the road in the middle of two construction waste accumulation areas. This area is often passed by construction waste vehicles, and there will be residual soil and gravel on the surface. Therefore, it was confused with construction waste in the experiment, but it met the condition judged by the conditions in Section 2.2.3. Therefore, this area meets the criteria for the separability of construction waste. Figure 14b–d conforms to condition b in the conditional judgment. It indicates that the accumulation range of the construction waste can be correctly identified, even if few image objects in the region are missing.
The result shows that the separability of the construction waste and buildings as well as the construction waste and vegetation can reach 1.000, which indicates that complete separability can be achieved. However, the two misclassified areas are bare soil, and as a result, the separability between the construction waste and bare soil is 0.846. According to Equation (7), the overall separability of the construction waste reaches 0.846, as shown in Table 7.
3.2.2. Area B
Through the confusion matrix, as shown in Table 6, we obtained that the OA of the construction waste in study area B was 0.962, and the KAPPA was 0.963 and greater than 0.8, which indicates that the result was excellent, and the overall accuracy was excellent. The PA and UA of the construction waste are 0.921 and 1.000, respectively, and the omission error is relatively high, which is consistent with the separability analysis. After judging the conditions of separability of the experimental results in study area B, we found that the identification and extraction results of the construction waste all met the conditions of separability, but two construction waste accumulation areas were missed, leading to a high omission error. As shown in Figure 15, there are 11 accumulation areas of construction waste according to whether the construction waste is exposed, covered with vegetation, or covered with dust screen. We successfully identified nine areas, and the two missed areas were vegetated construction waste, namely, the two areas marked “1” and “11” in Figure 15, as shown in Figure 15a,b. In addition, we successfully identified and extracted the construction waste area surrounded by buildings in the study area, such as d and f in Figure 15. The separability between the construction waste and the buildings is calculated to be 1.000. As the construction waste covered by vegetation is neglected, the separability of the construction waste and vegetation is calculated to be 0.818. Finally, the overall separability of the construction waste reaches 0.818, as shown in Table 7.
Buildings and demolition buildings are scattered around and inside the construction waste in study areas A and B. By integrating the morphological index into the classification model of the knowledge rules, we successfully solved the problem of confusion between the construction waste and bare soil, as well as between the construction waste and buildings.
By comparing and analyzing the object categories and feature selection of the two study areas, it is found that the feature analysis and selection of study area B is more simplified than that of study area A. The acquisition date of the image data in study area B was September, with lush vegetation covering the paths between farmland, which simplified the feature selection in the classification process. This vegetation circumstance contrasts with the sparse vegetation in study area A. In addition, the distribution range of the construction waste in study area B is large, and the demolition time is similar; thus, the types and features of construction waste are basically the same, which further simplifies the feature analysis and selection in the knowledge rule model.
At the same time, due to the vegetation cover, the construction waste accumulation area is more easily identified in study area A. For example, all of the construction waste accumulation areas in study area A have been identified, while some of the construction waste accumulation areas in study area B are covered by vegetation, which seriously affects the identification of building waste. Therefore, vegetation cover makes a great disturbance to the identification process of construction waste. Sparse vegetation is conducive to the identification of all construction waste, while lush vegetation coverage simplifies the selection of features.
3.3. Analysis of Construction Waste Identification Results
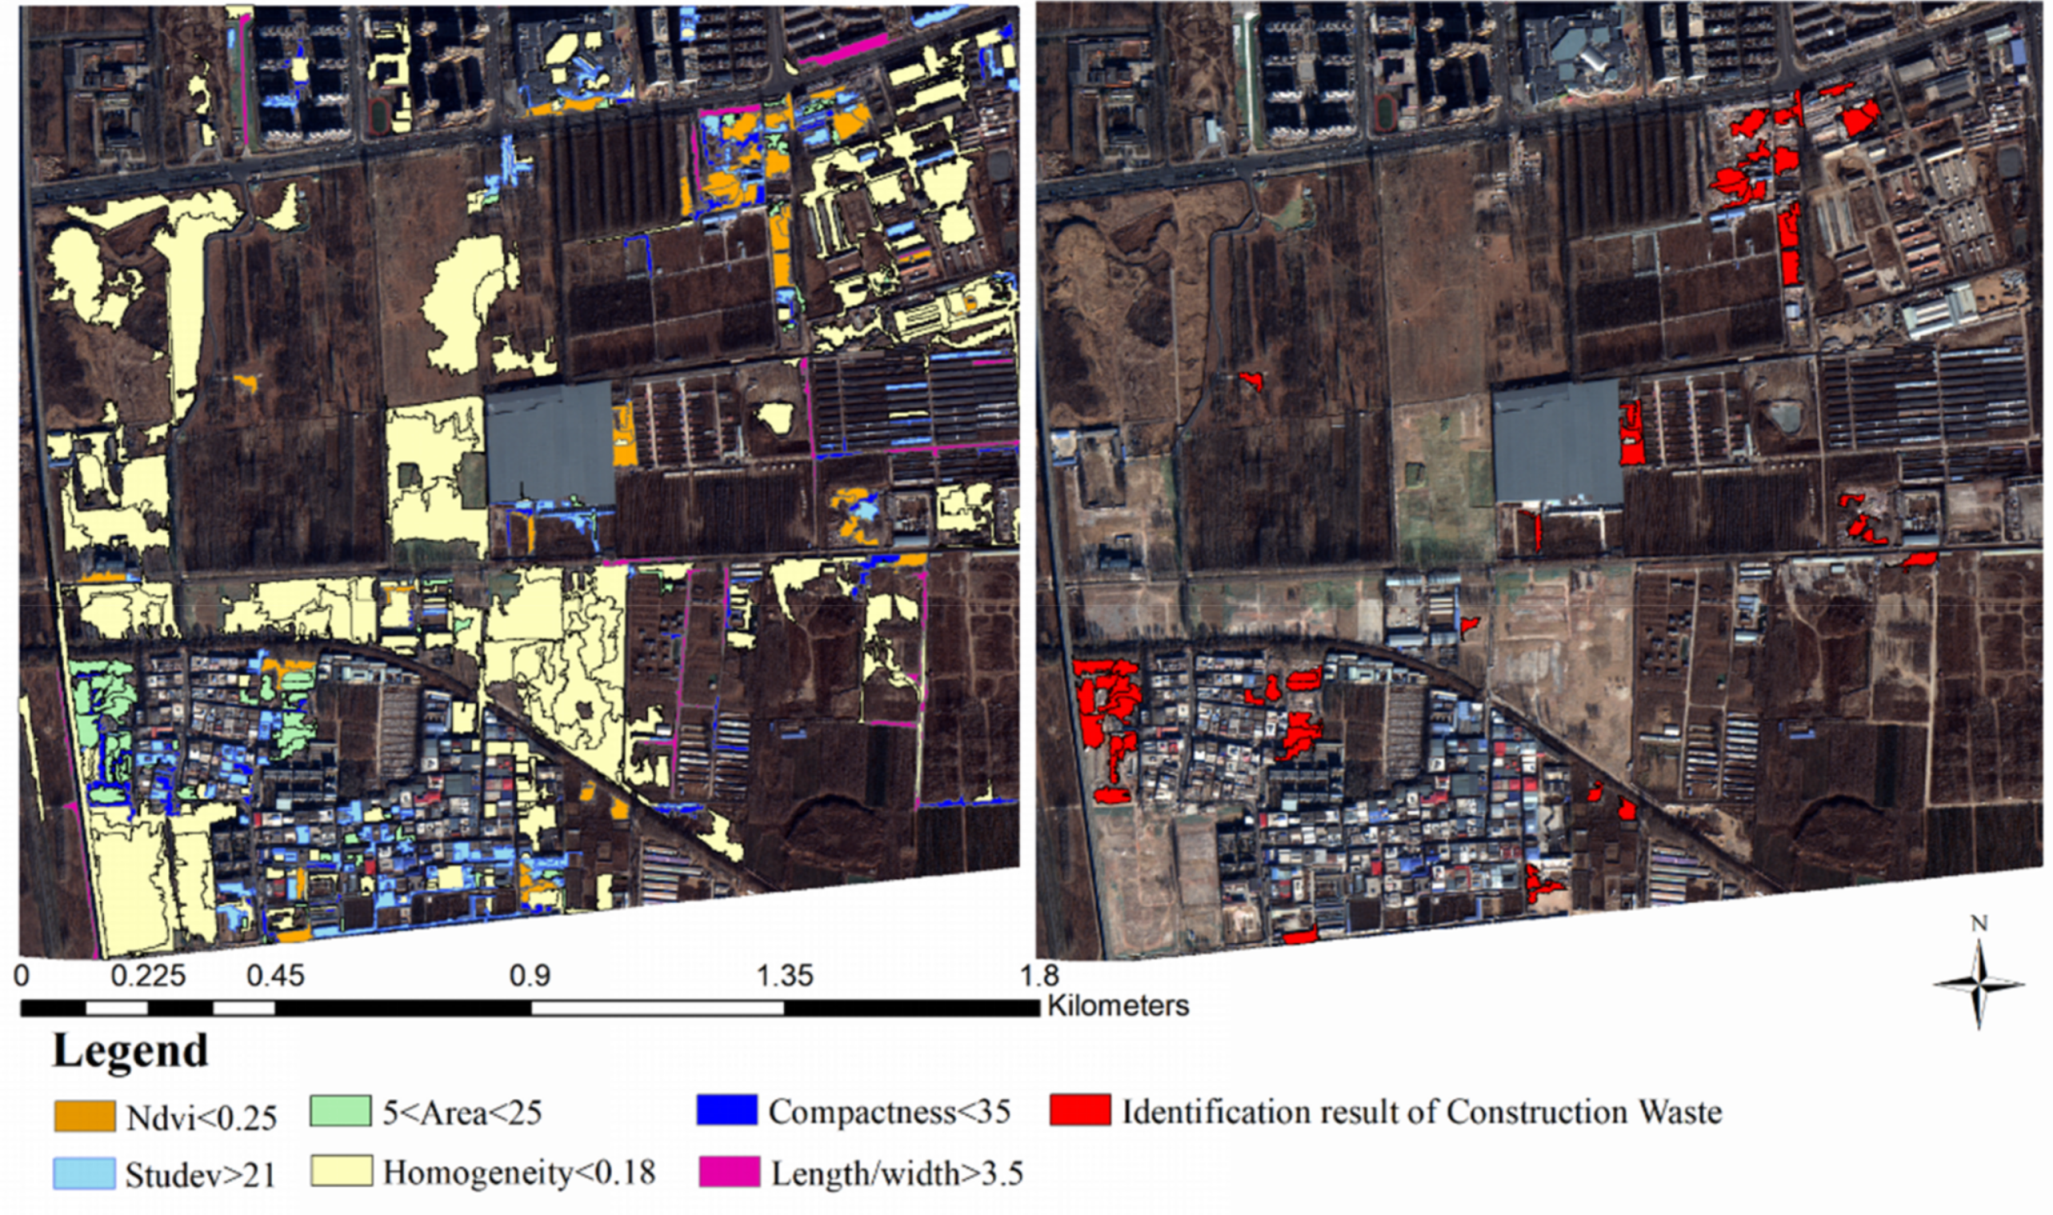
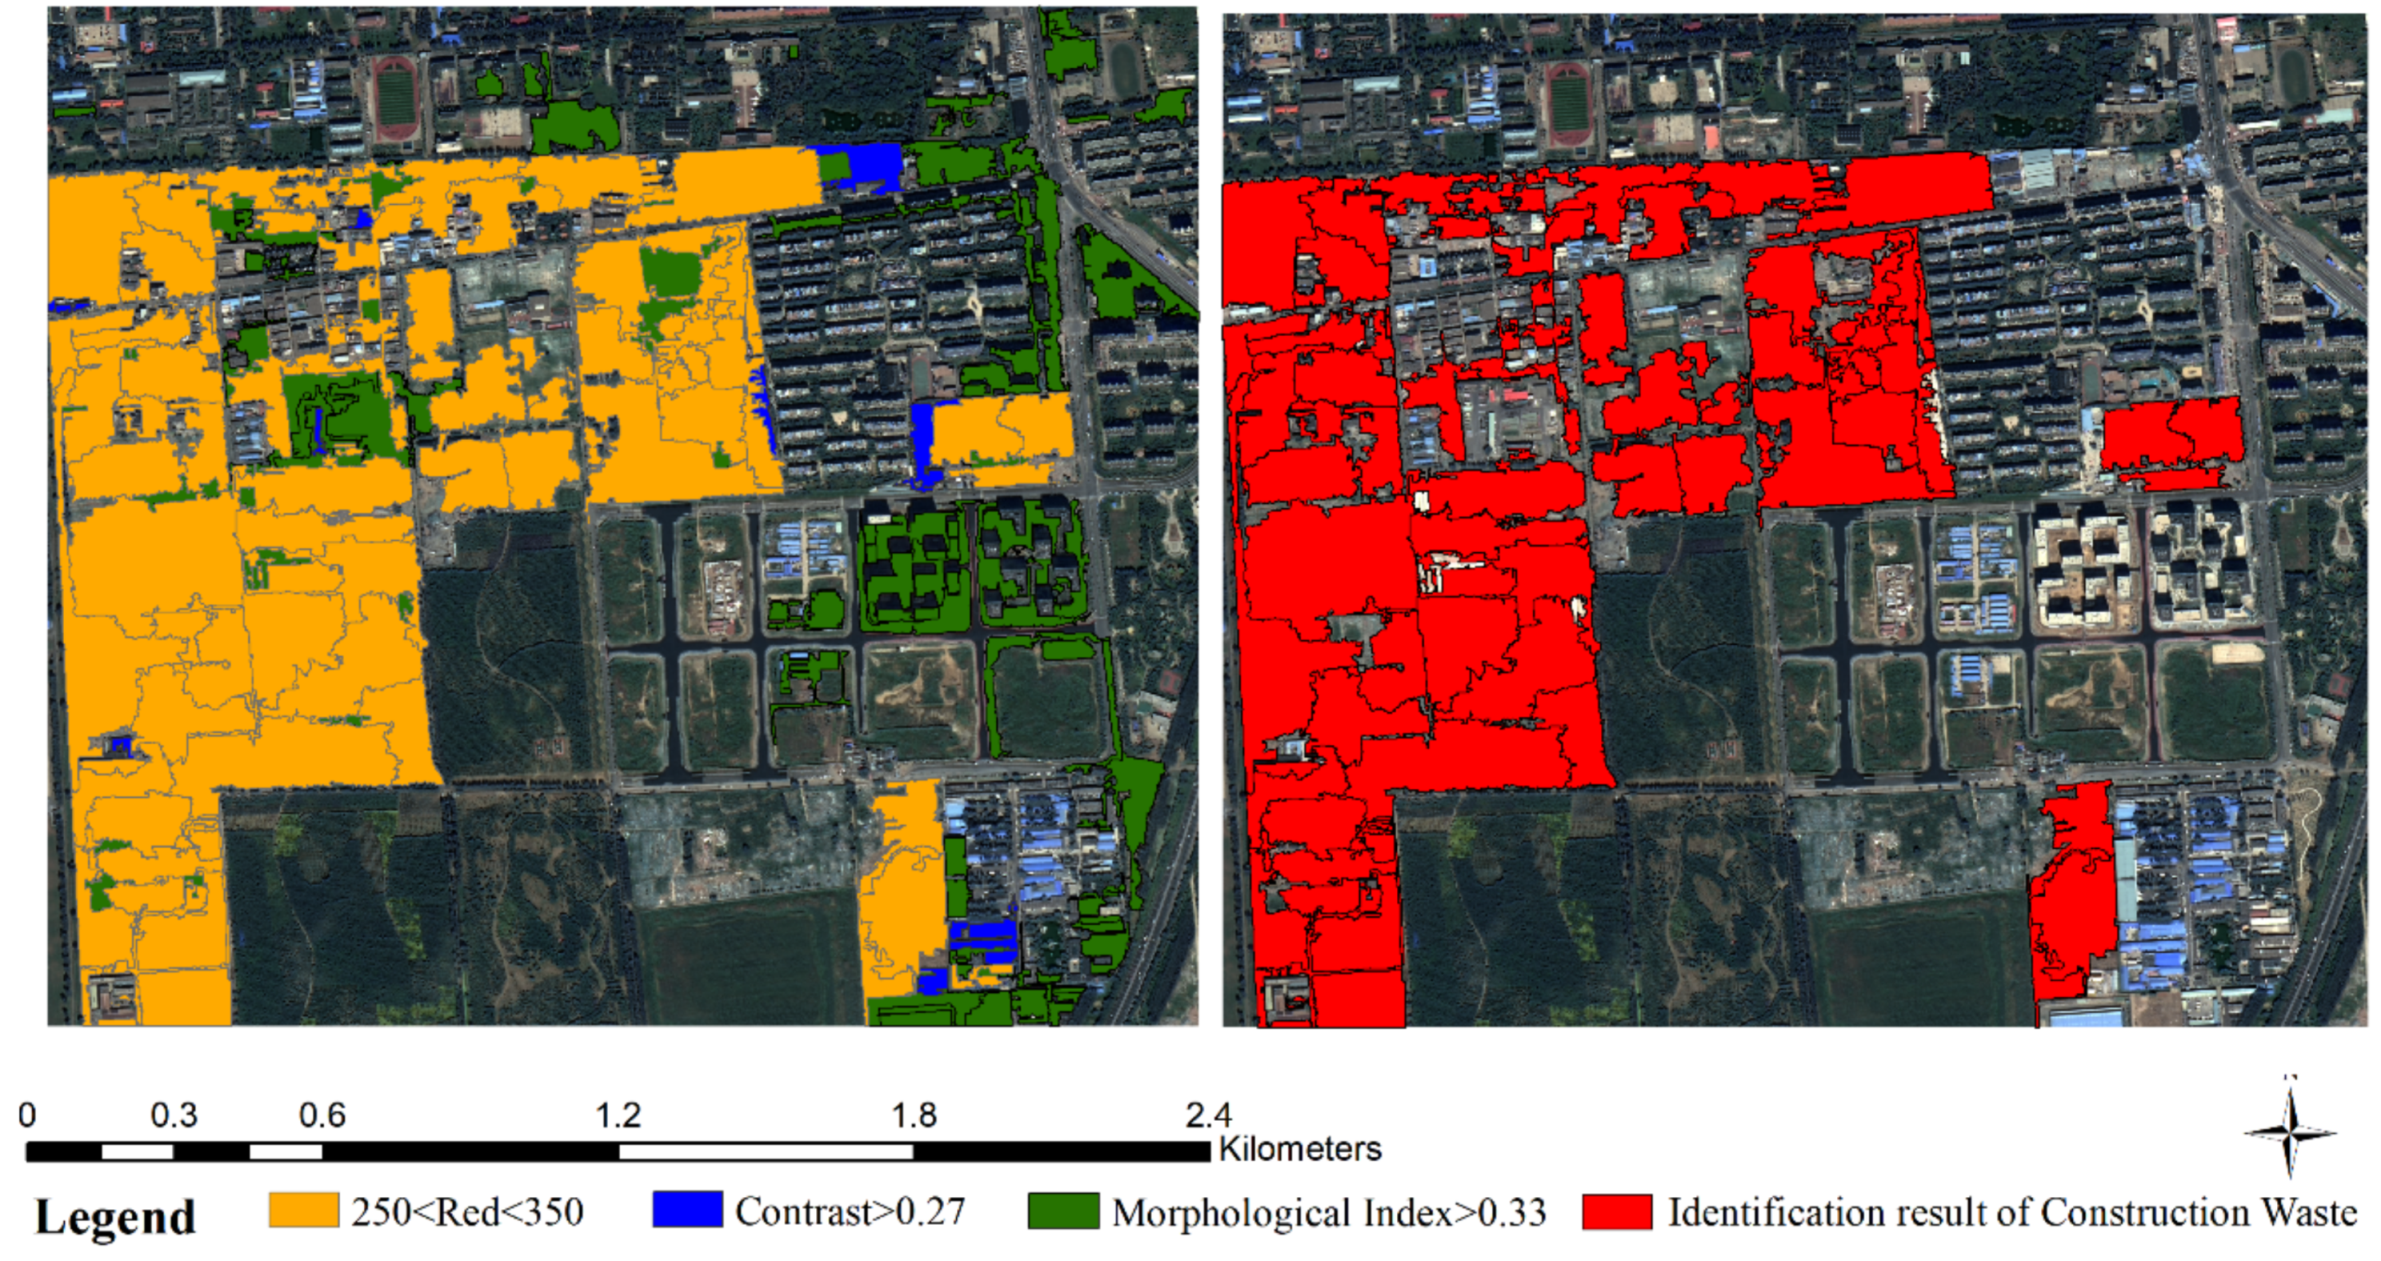
We used eigenfunctions to conduct one-to-one construction waste identification and extraction. The results are shown in Figure 16 and Figure 23, which are the experimental results in study areas A and B. The red area in the Figure 16 is the final identification result of the construction waste. We mark non-construction waste areas by different colors to correspond to different feature functions. According to different types of ground features, we mainly analyze the separability of the construction waste and buildings, as well as the construction waste and bare soil in study area A. In study area B, we mainly analyze the separability of the construction waste and buildings.
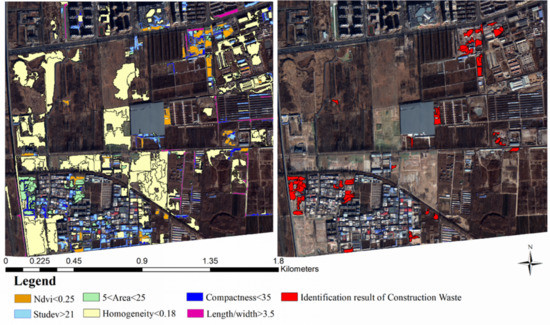
Figure 16.
Construction waste extraction results in study area A.
3.3.1. Area A
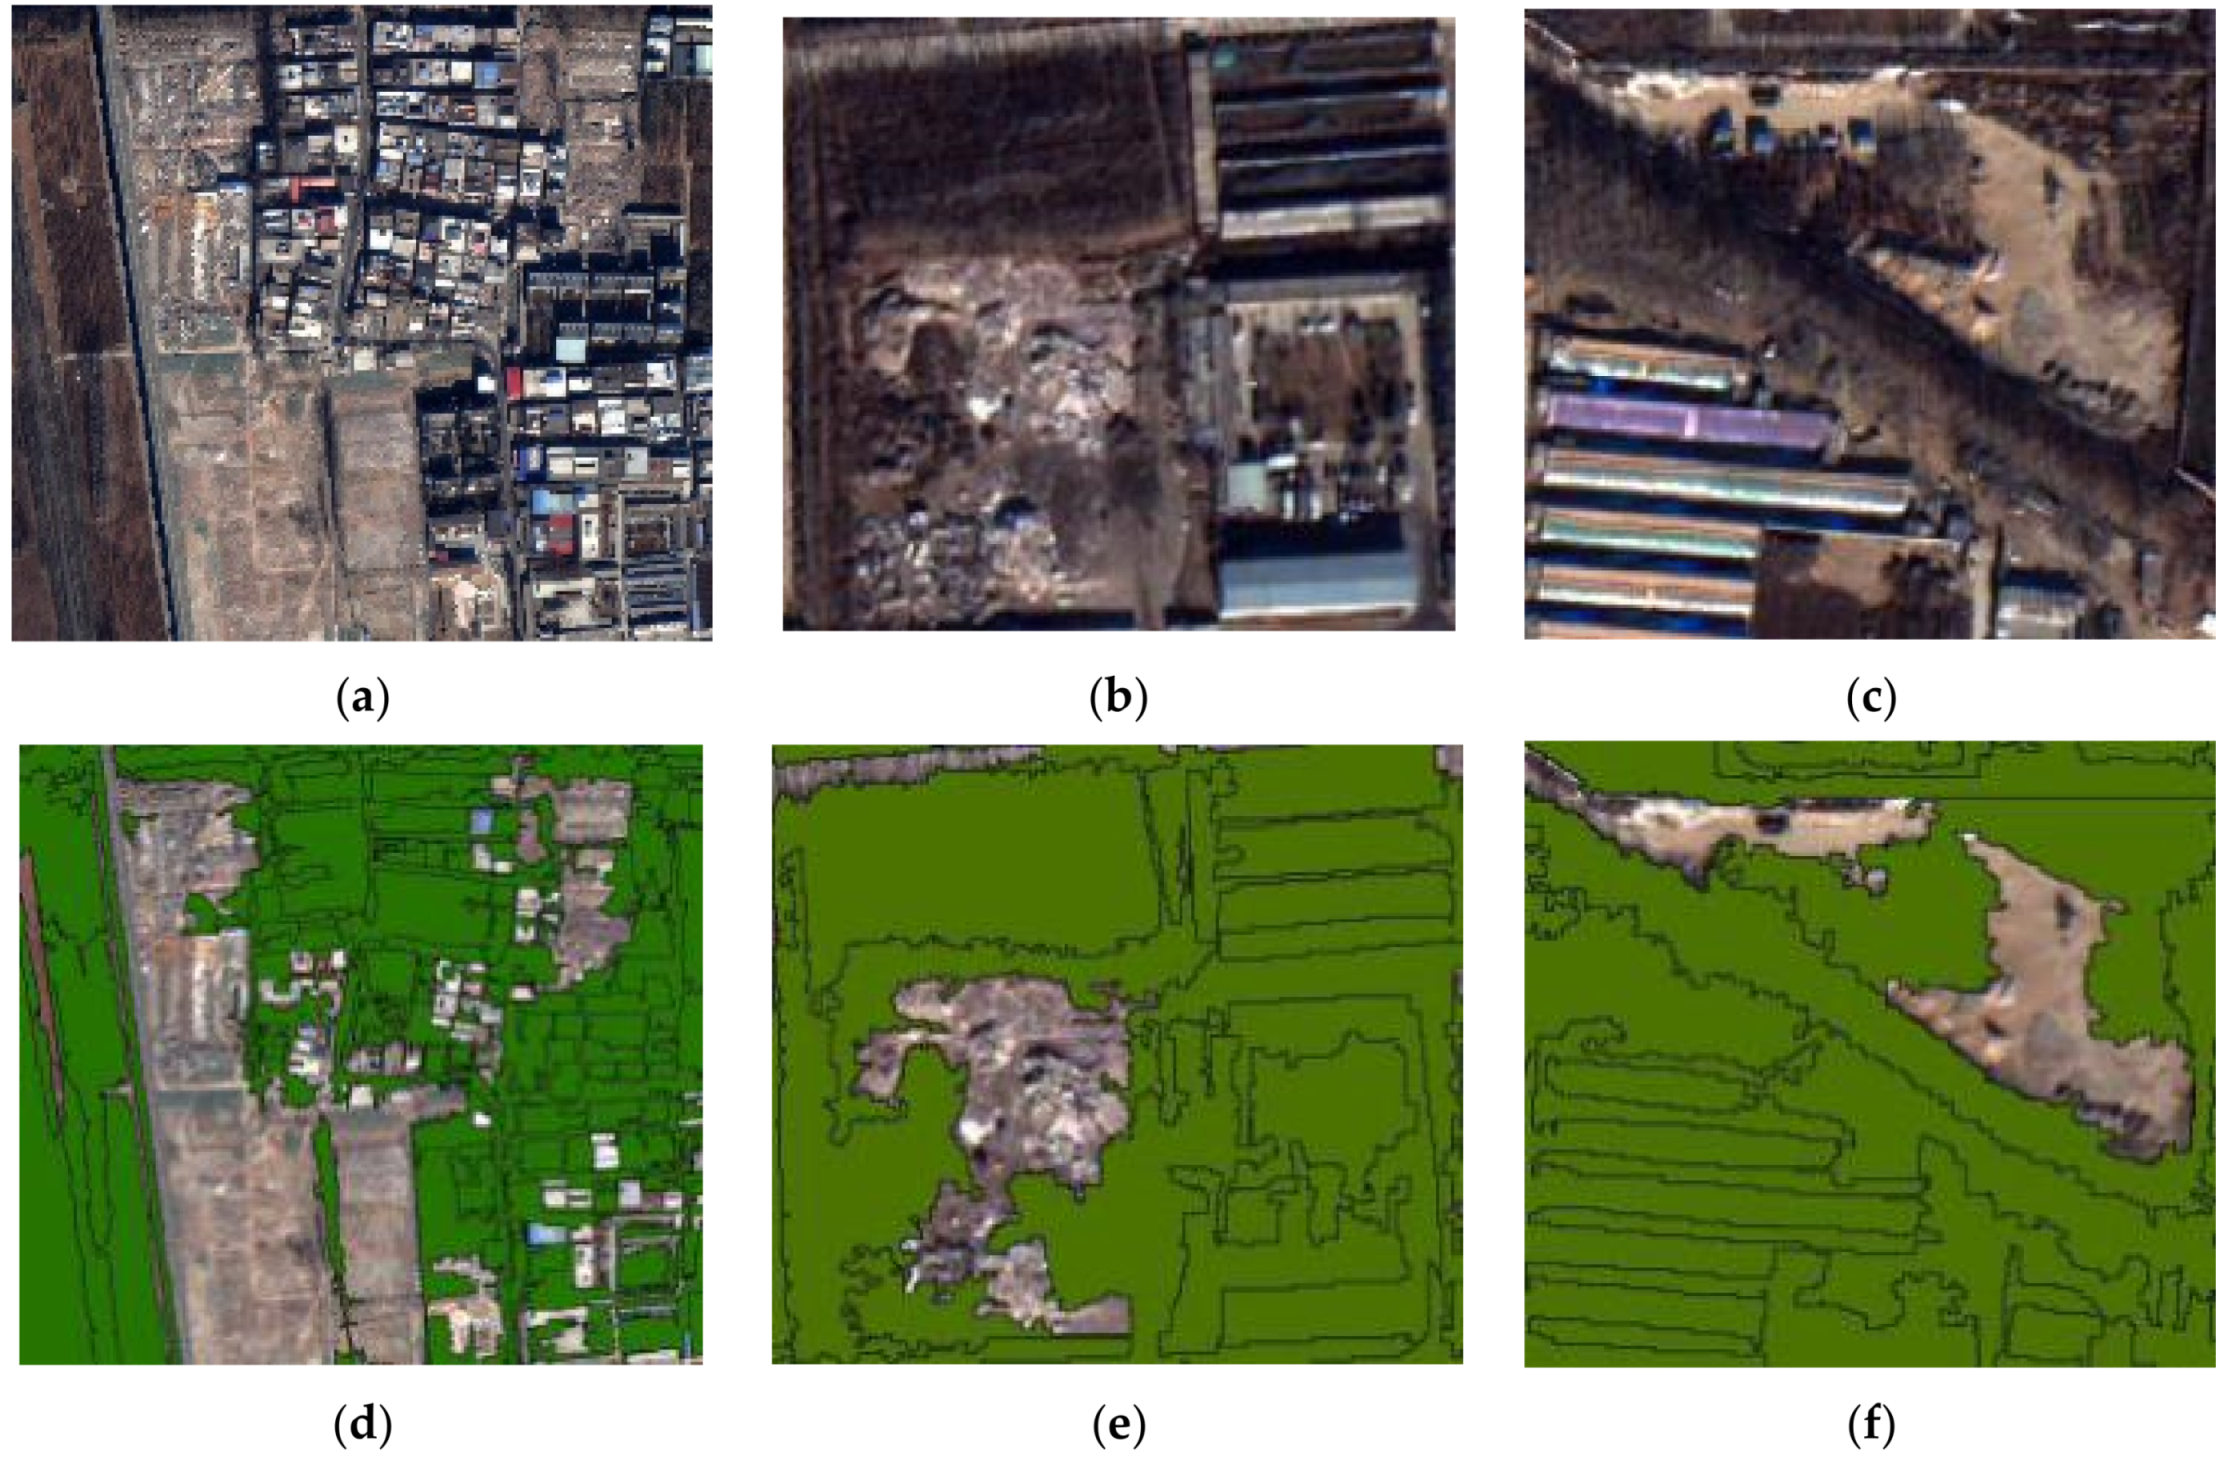
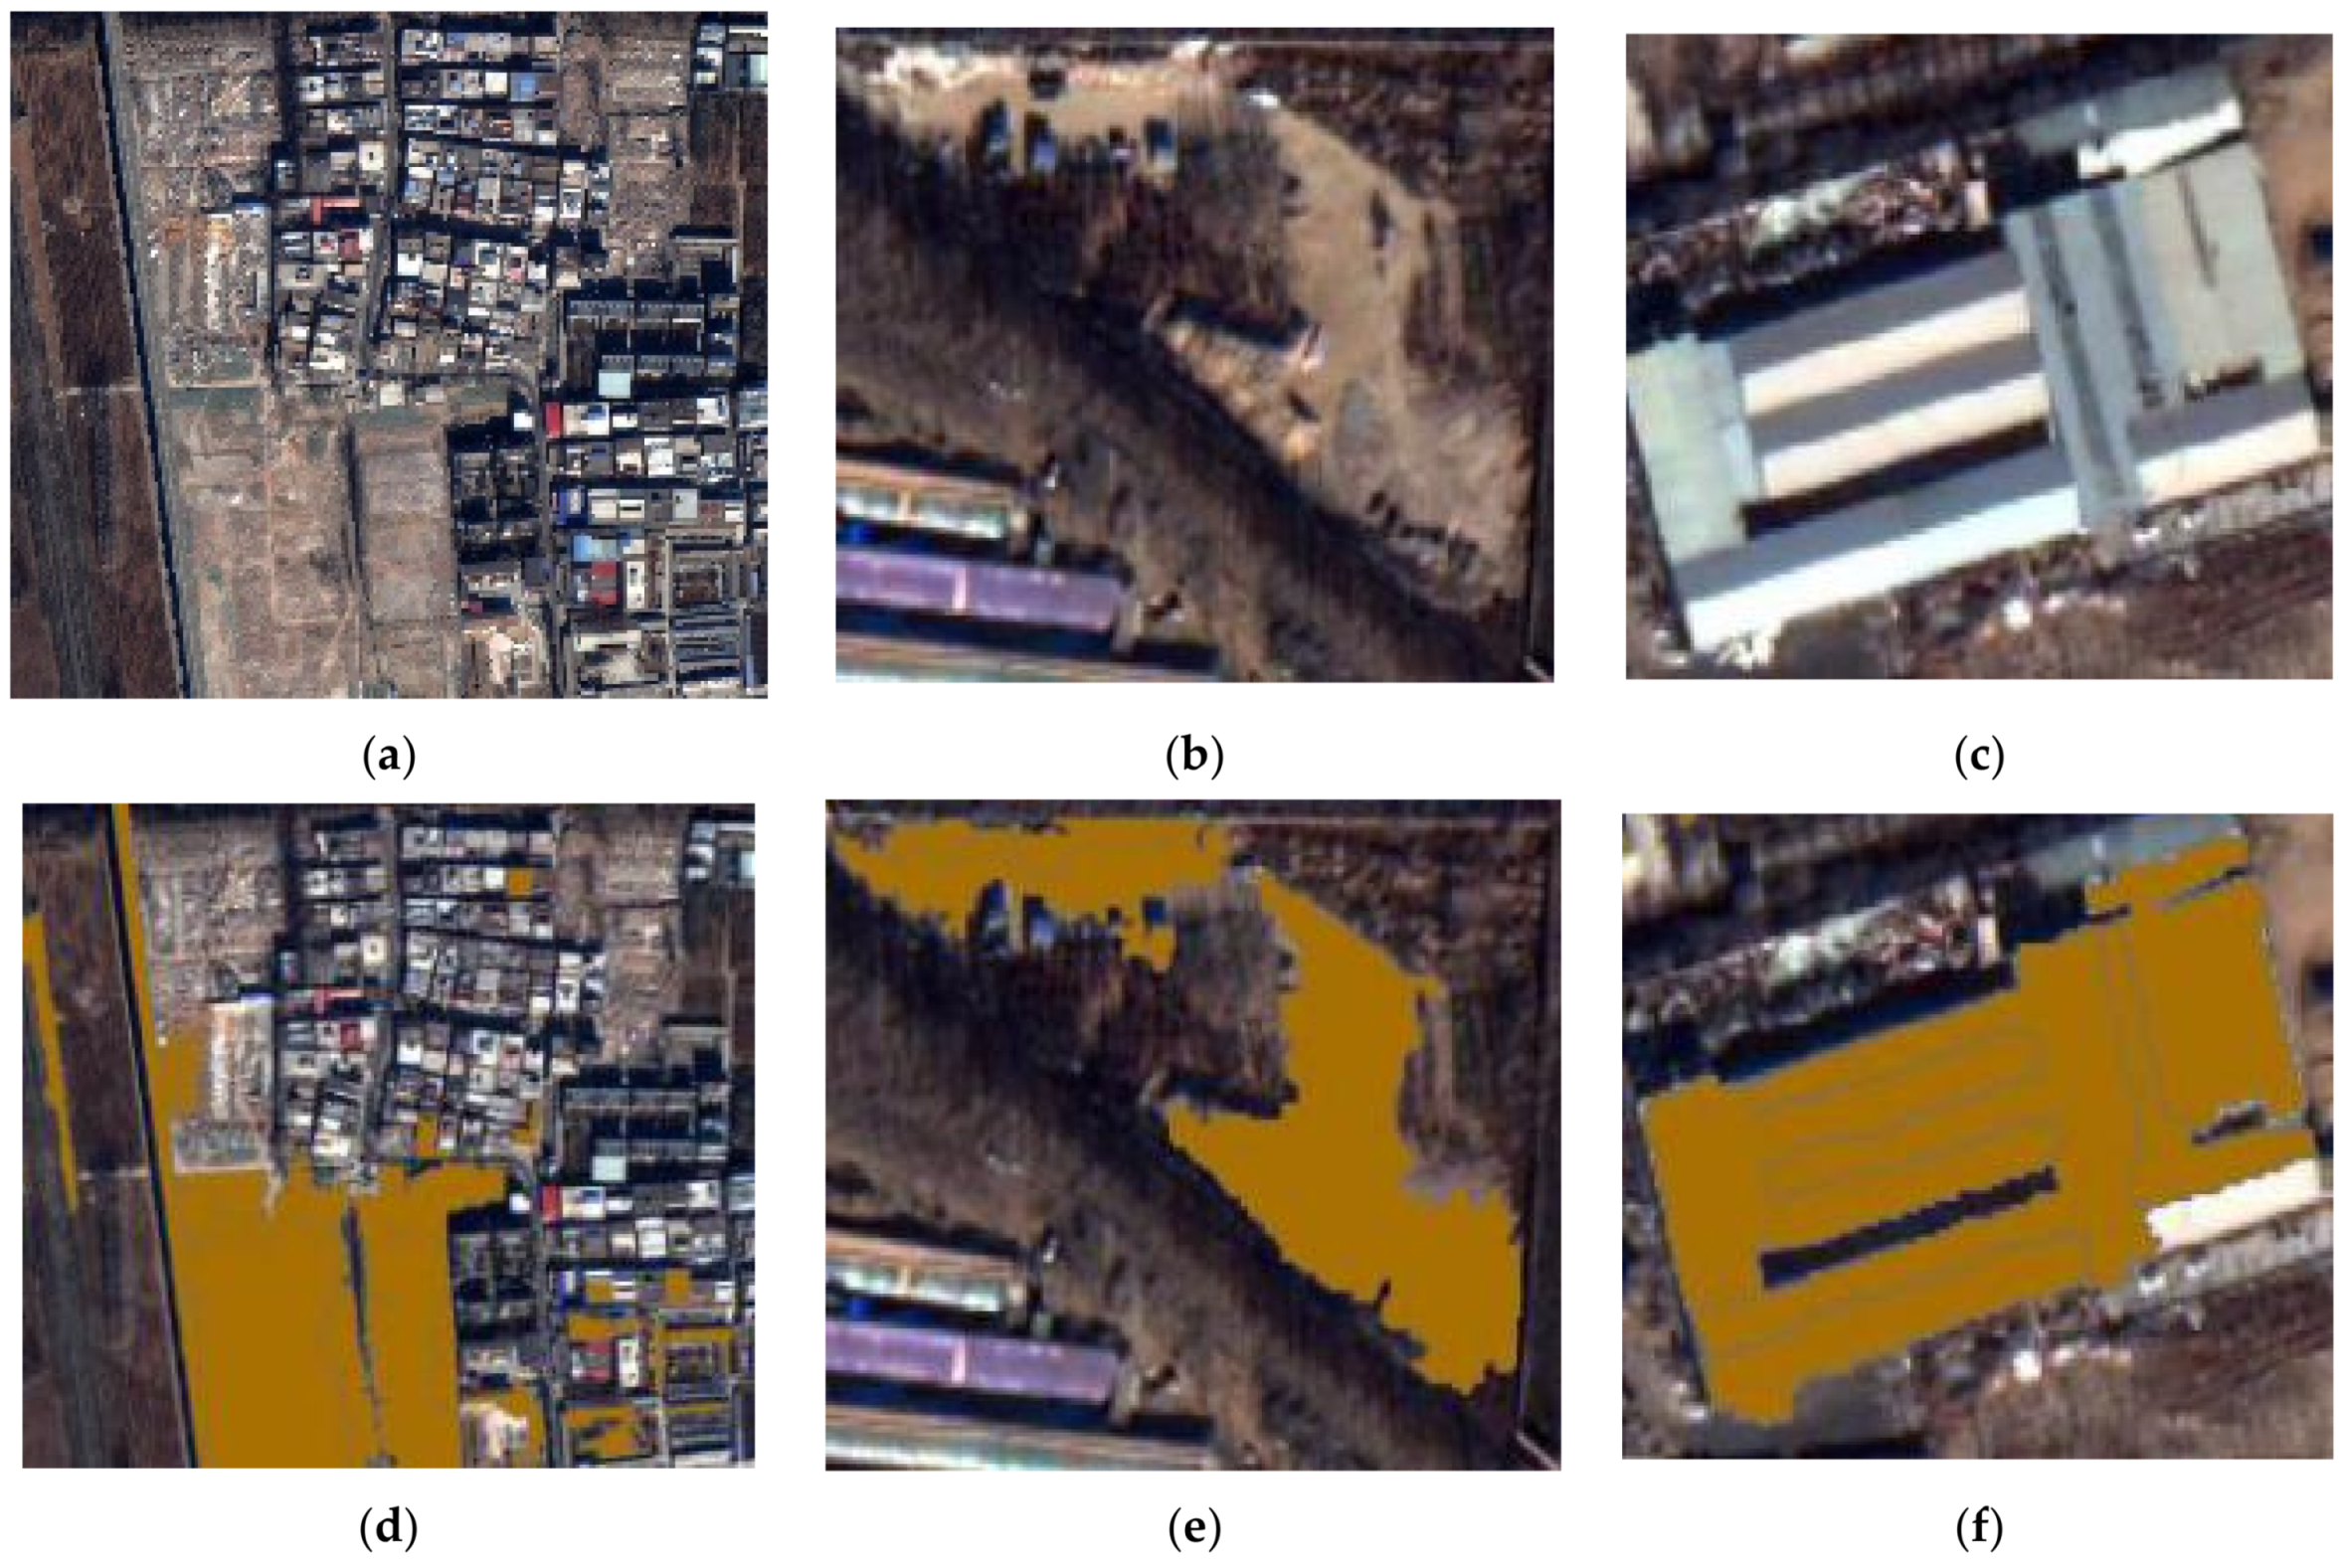
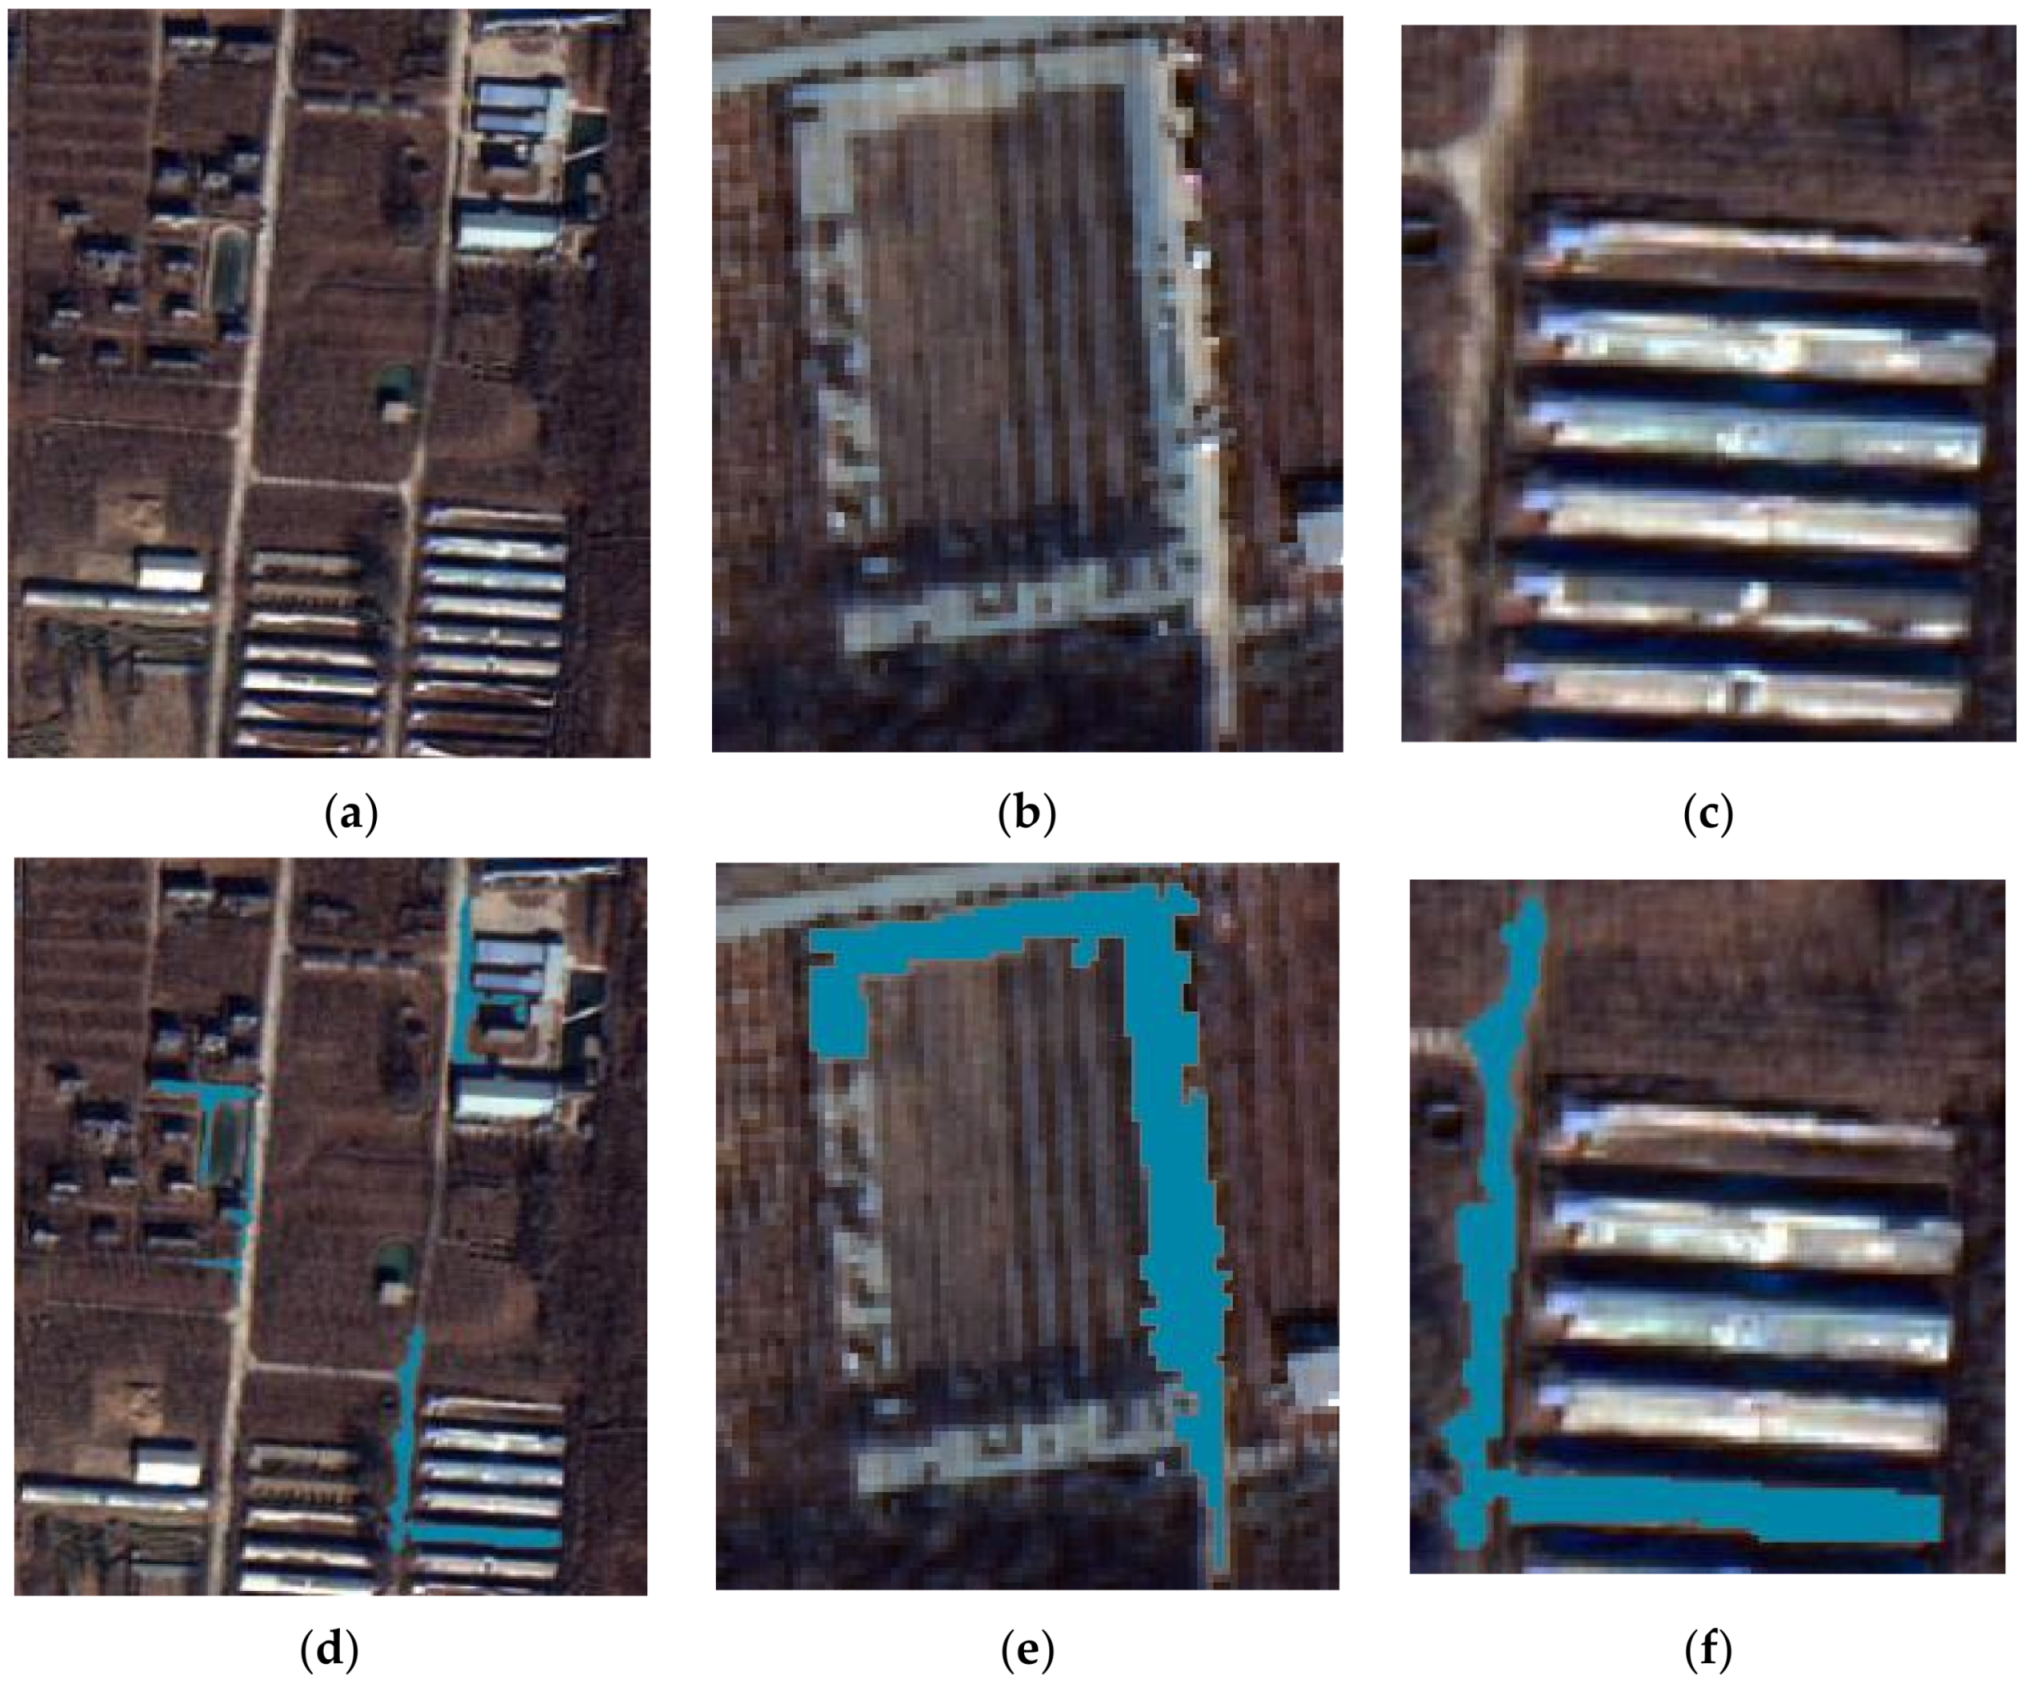
In study area A, the first layer of the classification model used the red band and the fifth band to separate vegetation, roads, and some buildings. As shown in Figure 17a–c are the original images. The green areas in (d), (e), and (f) are the areas classified as vegetation, roads, and some buildings. The morphological band can be used in the first level structure as well as the second layer structure. Through experiments, it was found that the first level structure in study area A has a better effect by using this band, which avoids the wrong division phenomenon caused by using the same band after re-segmentation.
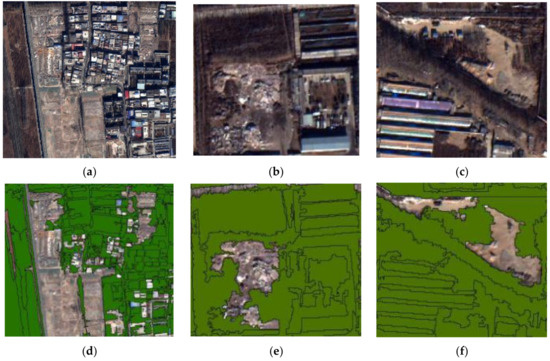
Figure 17.
Classification results for the first layer structure: (a–c) the red band and the fifth band to separate vegetation, roads, and some buildings, (d–f) the areas classified as vegetation, roads, and some buildings.
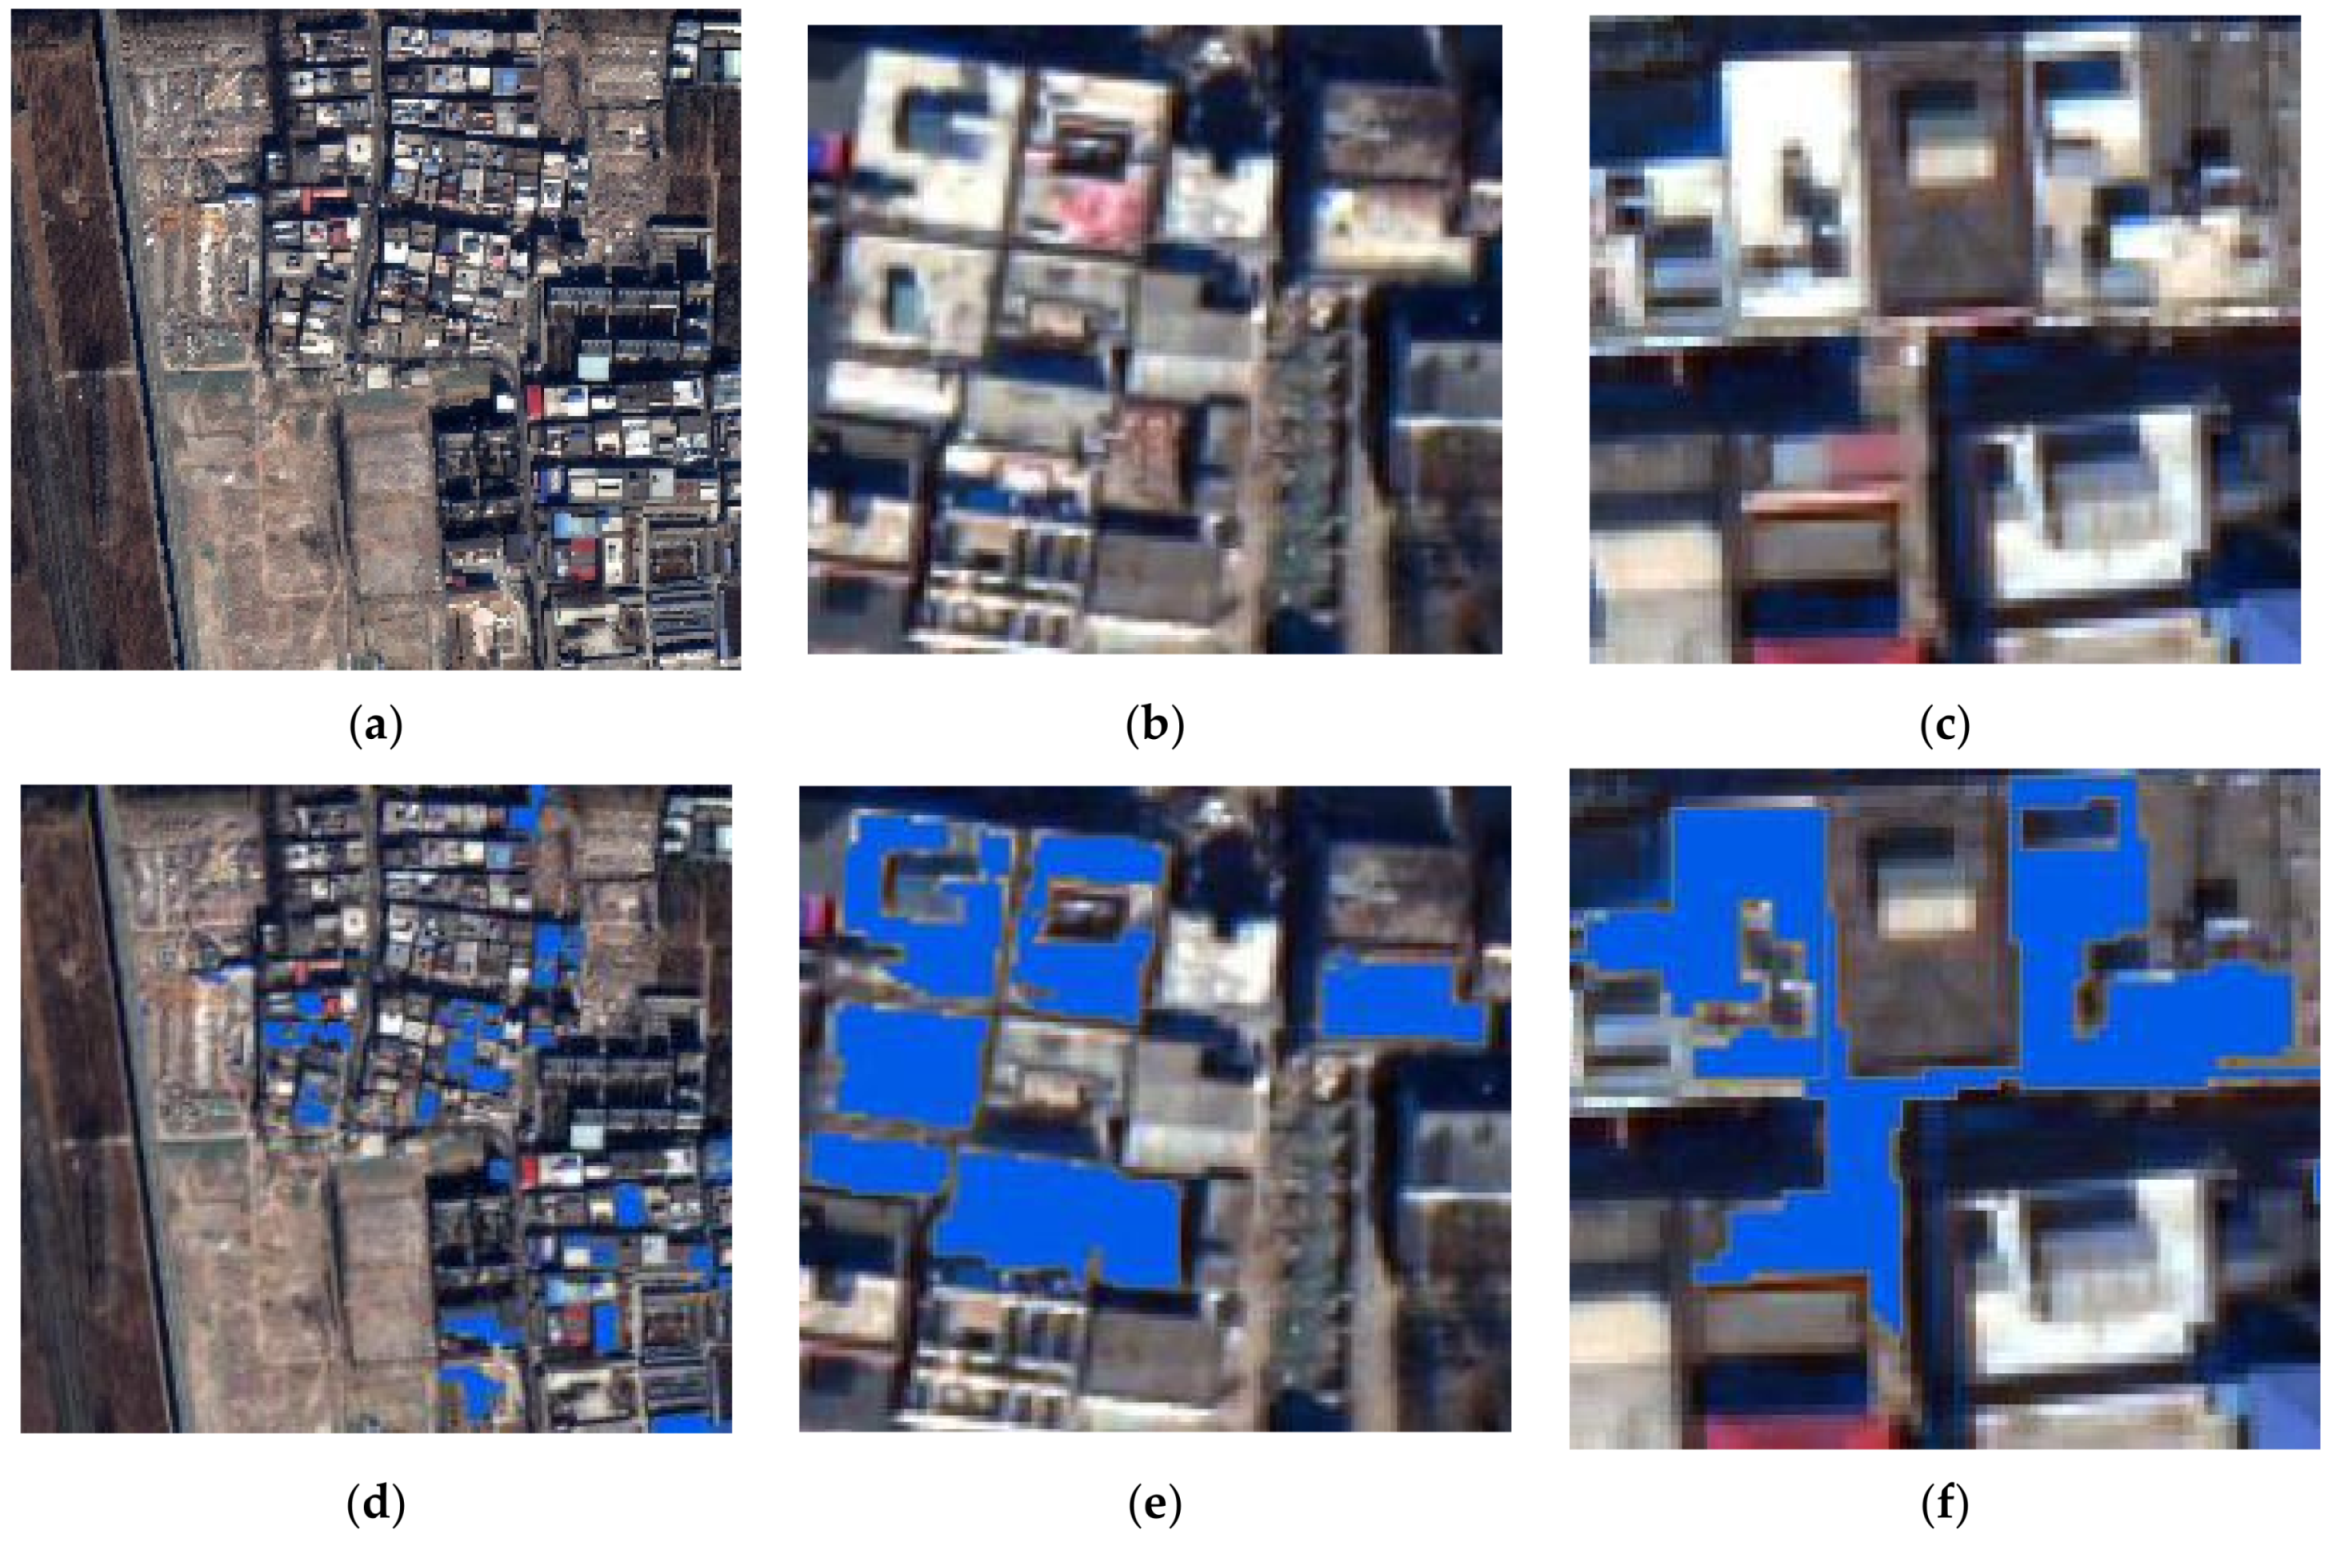
We used the GLCM homogeneity eigenfunction to classify ground objects with uniform surface texture, such as bare soil. As shown in Figure 18, some buildings with uniform texture are also separated by this feature. The brown part of Figure 18d,e are the separated bare soil area, and Figure 18f is the separation result of the flat house.
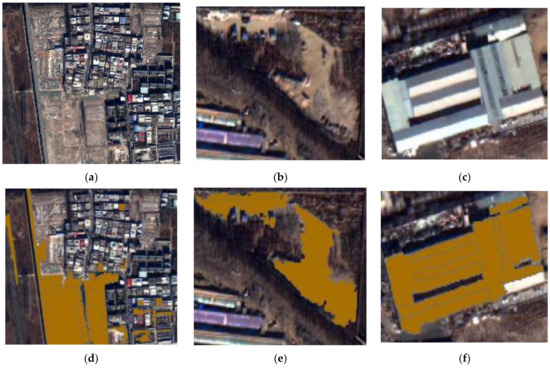
Figure 18.
Classification results for GLCM homogeneity: (a–c) buildings with uniform texture are also separated by this feature, (d,e) the separated bare soil area, (f) the separation result of the flat house.
Figure 19 is the classification result graphed by the standard deviation eigenfunction of GLCM. The image objects of the buildings under demolition and some urban buildings have a high dispersion degree with neighboring image objects [43], and there are obvious differences. This eigenfunction can effectively separate buildings from construction waste.
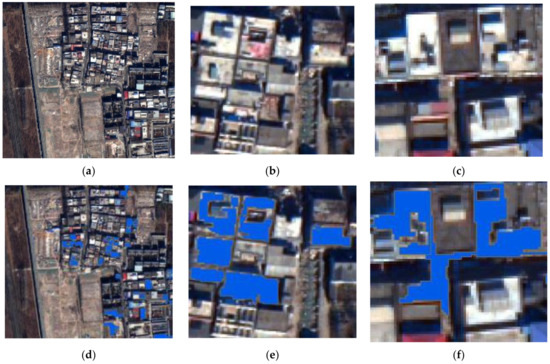
Figure 19.
Classification results for GLCM standard deviation: (a–f) the classification result graphed by the standard deviation eigenfunction of GLCM.
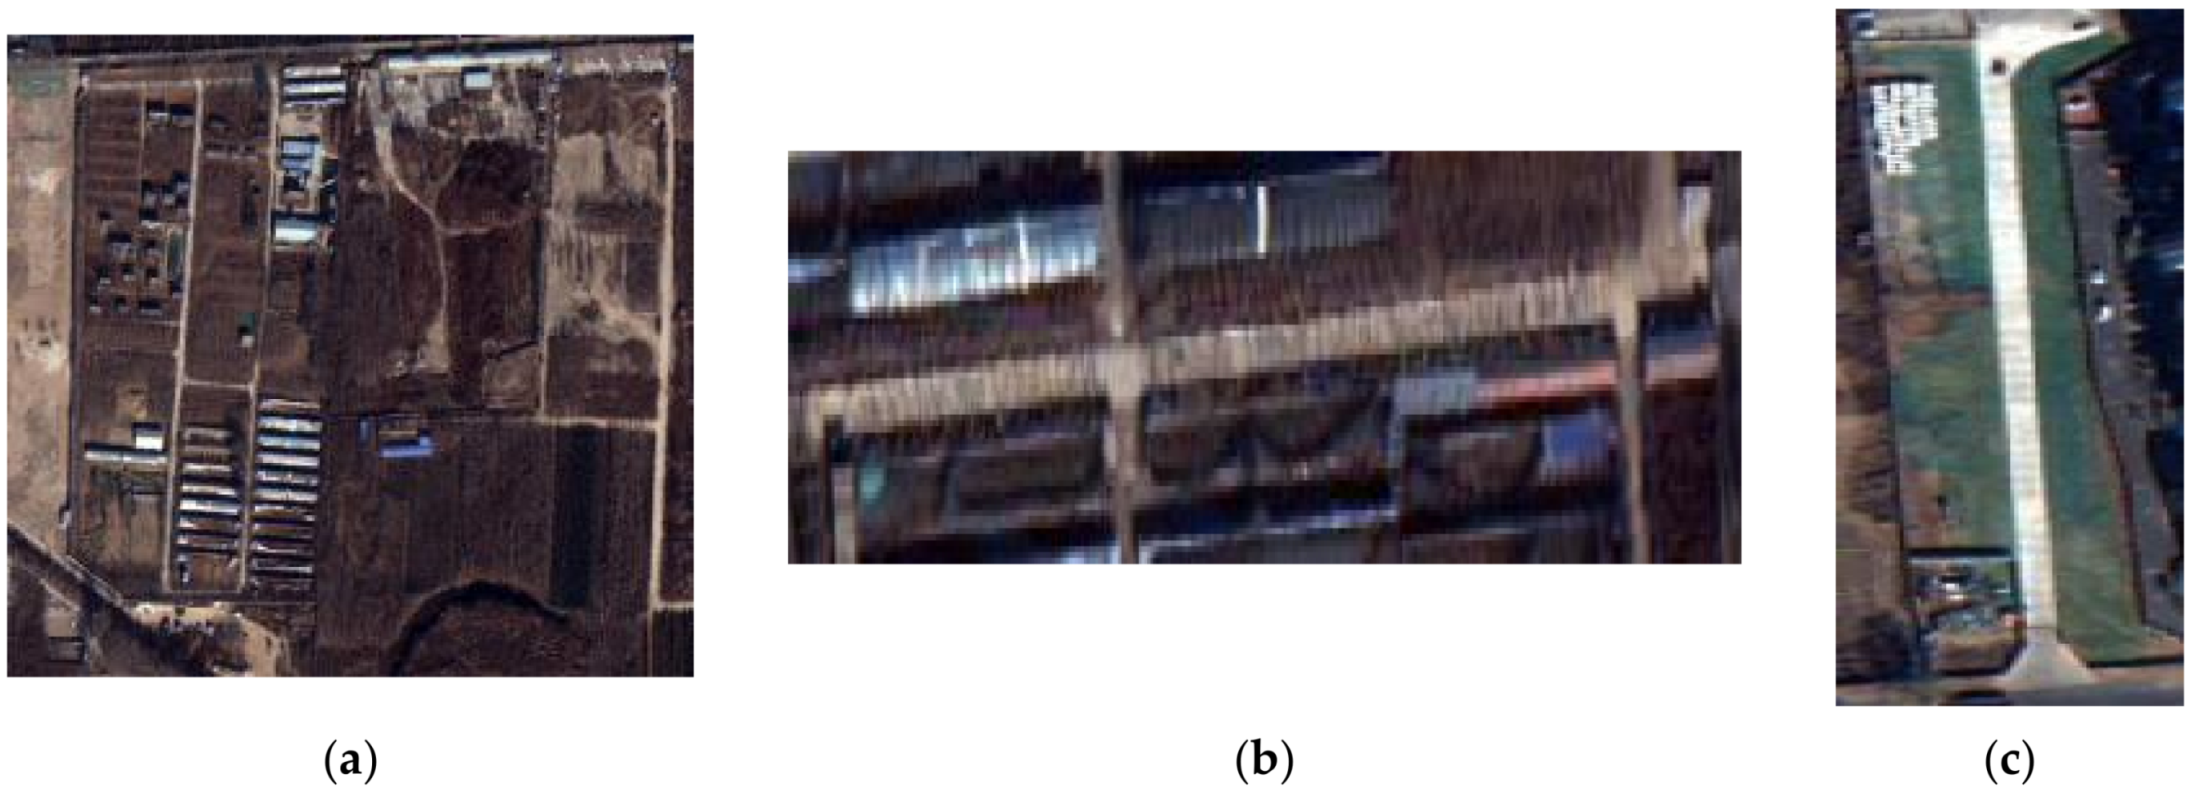
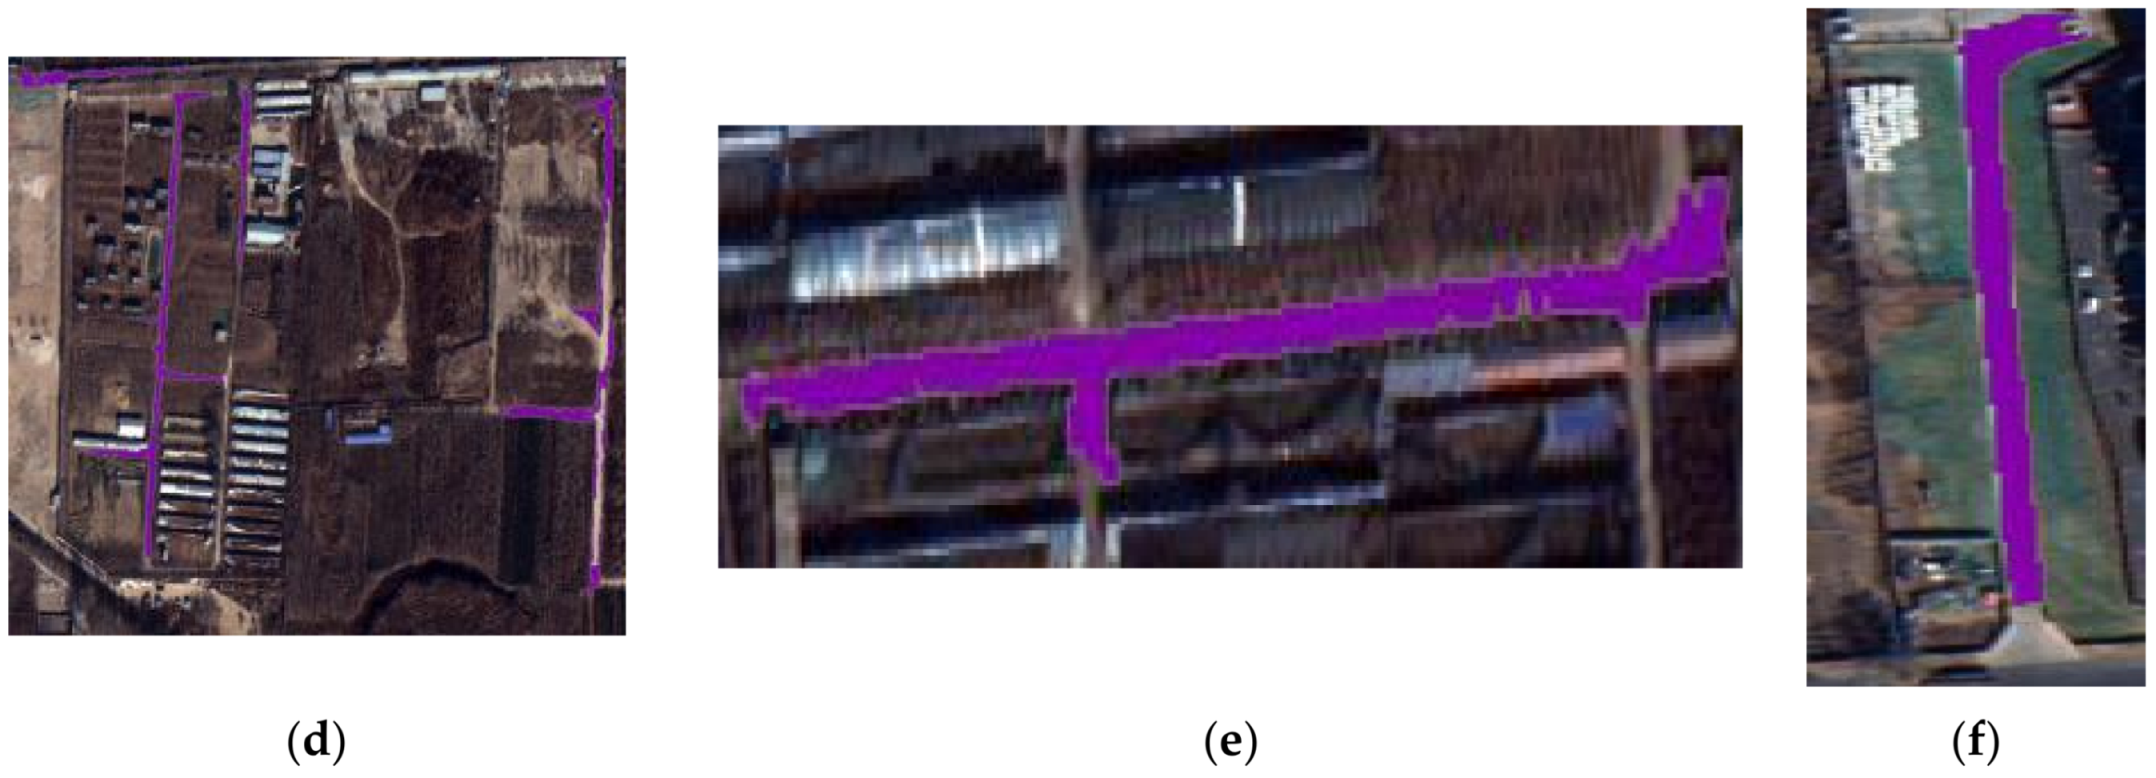
Figure 20 shows the result of separating linear features such as rural roads with the aspect ratio. The highlighted purple areas in Figure 20d are linear rural roads. The purple area in Figure 20e is the linear highway that appears after re-segmentation. The images in study area A were obtained in December, and the paths between the fields are exposed. Raised or sunken areas on the side of the road lead to significant differences in the internal texture of the path and bare soil. Moreover, the spectral features of the path are similar to those of bare soil but show linear geometric features after segmentation. Therefore, this type of object was accurately classified as non-construction waste by the ratio of the length to width in the geometric features.
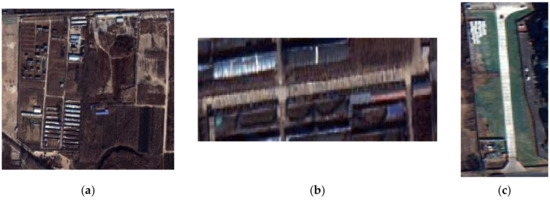
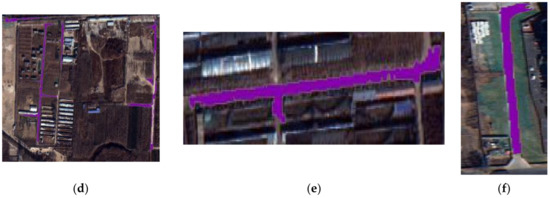
Figure 20.
Classification results of aspect ratio features: (a–f) he result of separating linear features such as rural roads with the aspect ratio.
Polygon compactness was used to separate the image objects with low compactness, especially for image objects with the T or L shape in study area A, which have a significant separation effect. The results are shown in Figure 21.
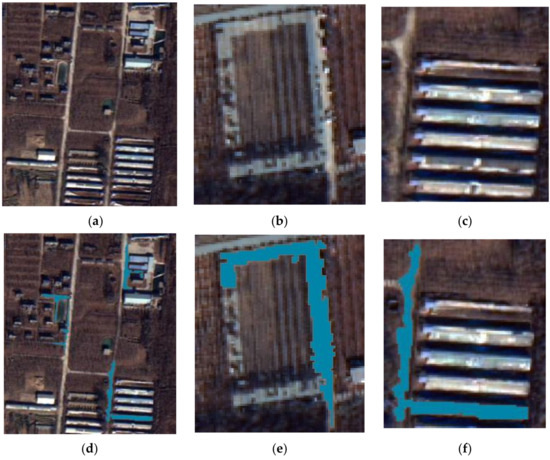
Figure 21.
Classification results for the compactness: (a–f) Polygon compactness was used to separate the image objects with low compactness, especially for image objects with the T or L shape in study area A.
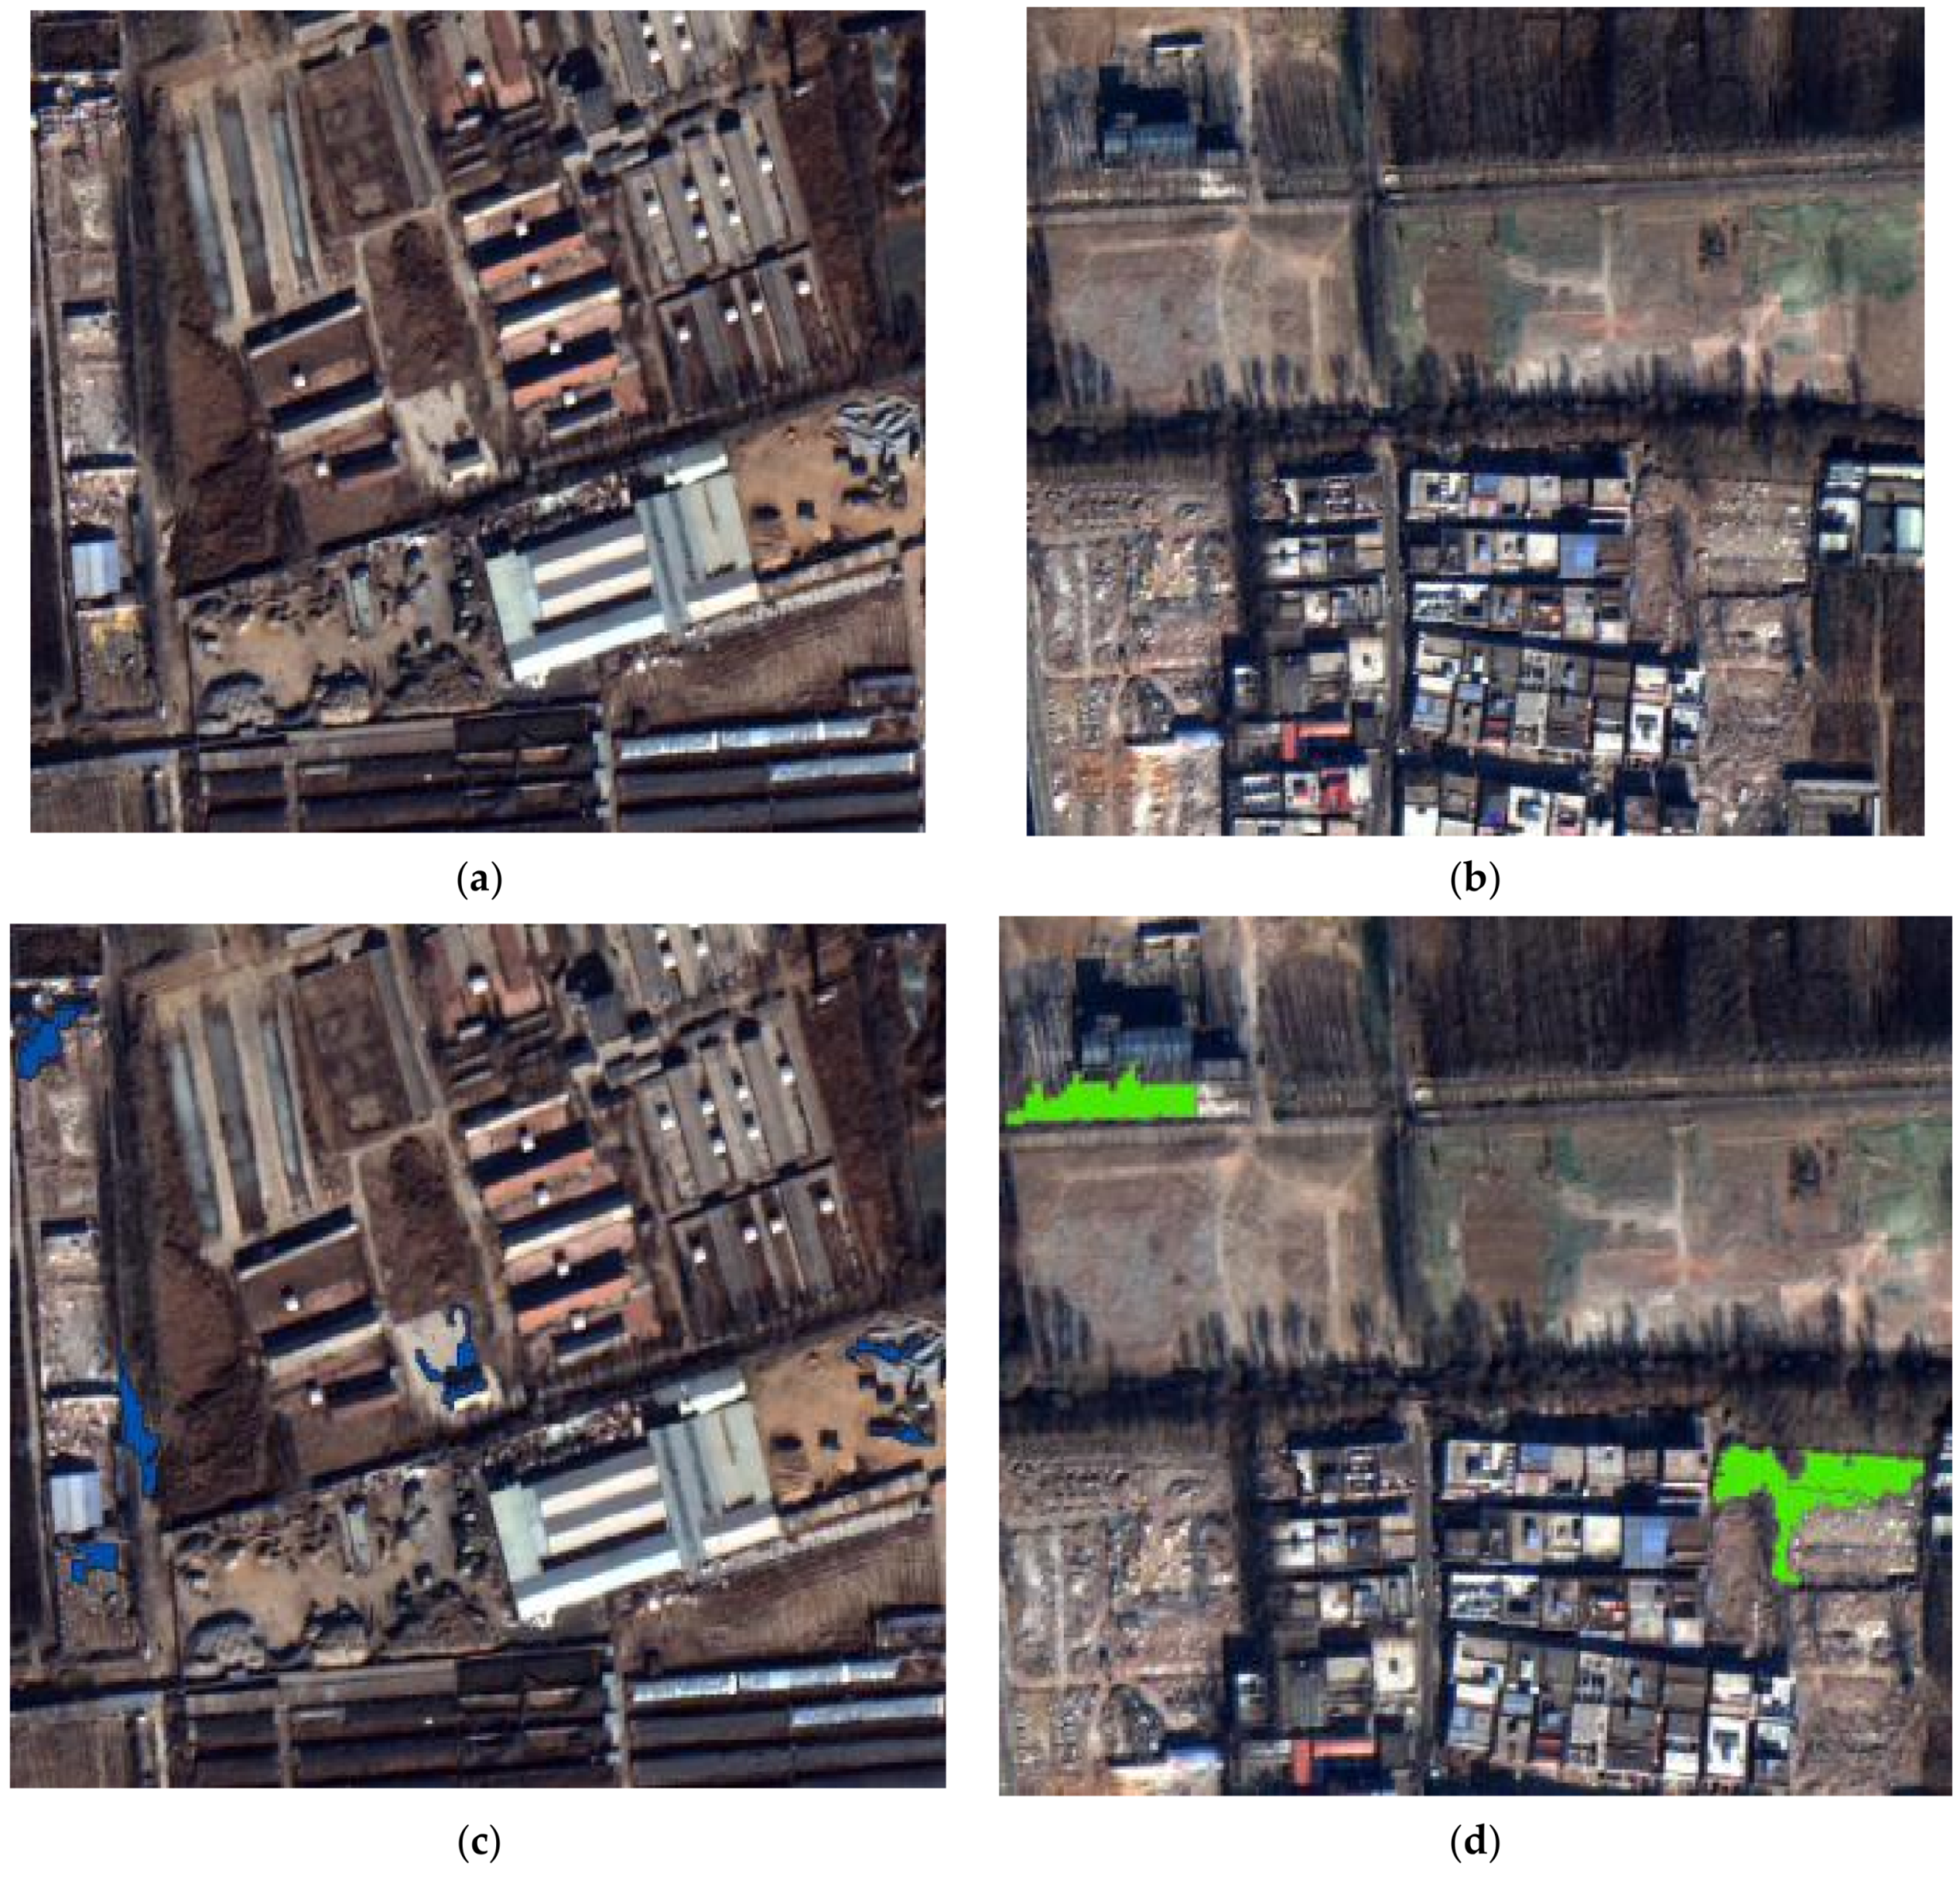
Finally, the area feature function and NDVI index were used to separate some fine interference objects, including image objects with too small and meaningless area and vegetation cover on the second layer, as shown in Figure 22. Figure 22a,c shows the effect diagram of the area threshold and the original image, and Figure 22b,d shows the original image and effect diagram of the vegetation area separated by the NDVI index.
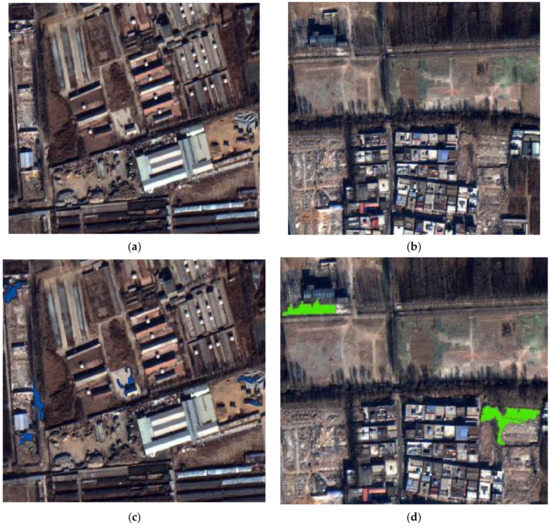
Figure 22.
Classification results of the area and NDVI index: (a,c) the effect diagram of the area threshold and the original image, (b,d) s the original image and effect diagram of the vegetation area separated by the NDVI index.
3.3.2. Area B
We use the knowledge rule classification model to identify and extract the construction waste in study area B, and the result is shown in Figure 23. By comparison, there are fewer image objects of bare soil and rural roads in study area B than in study area A, and the types of construction waste are relatively simple, but there is more construction waste covered by dust screen and vegetation. Therefore, we mainly analyzed and selected the features based on the confusion between the construction waste and buildings in study area B. Experiments were completed according to the classification rules in Table 3.
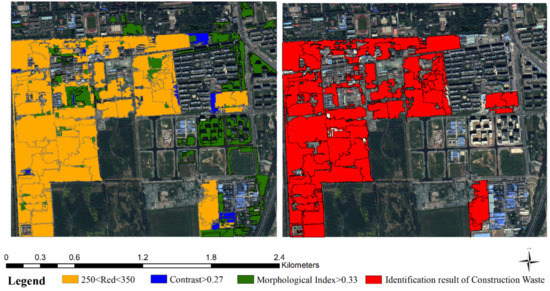
Figure 23.
Construction waste identification and extraction results for study area B.
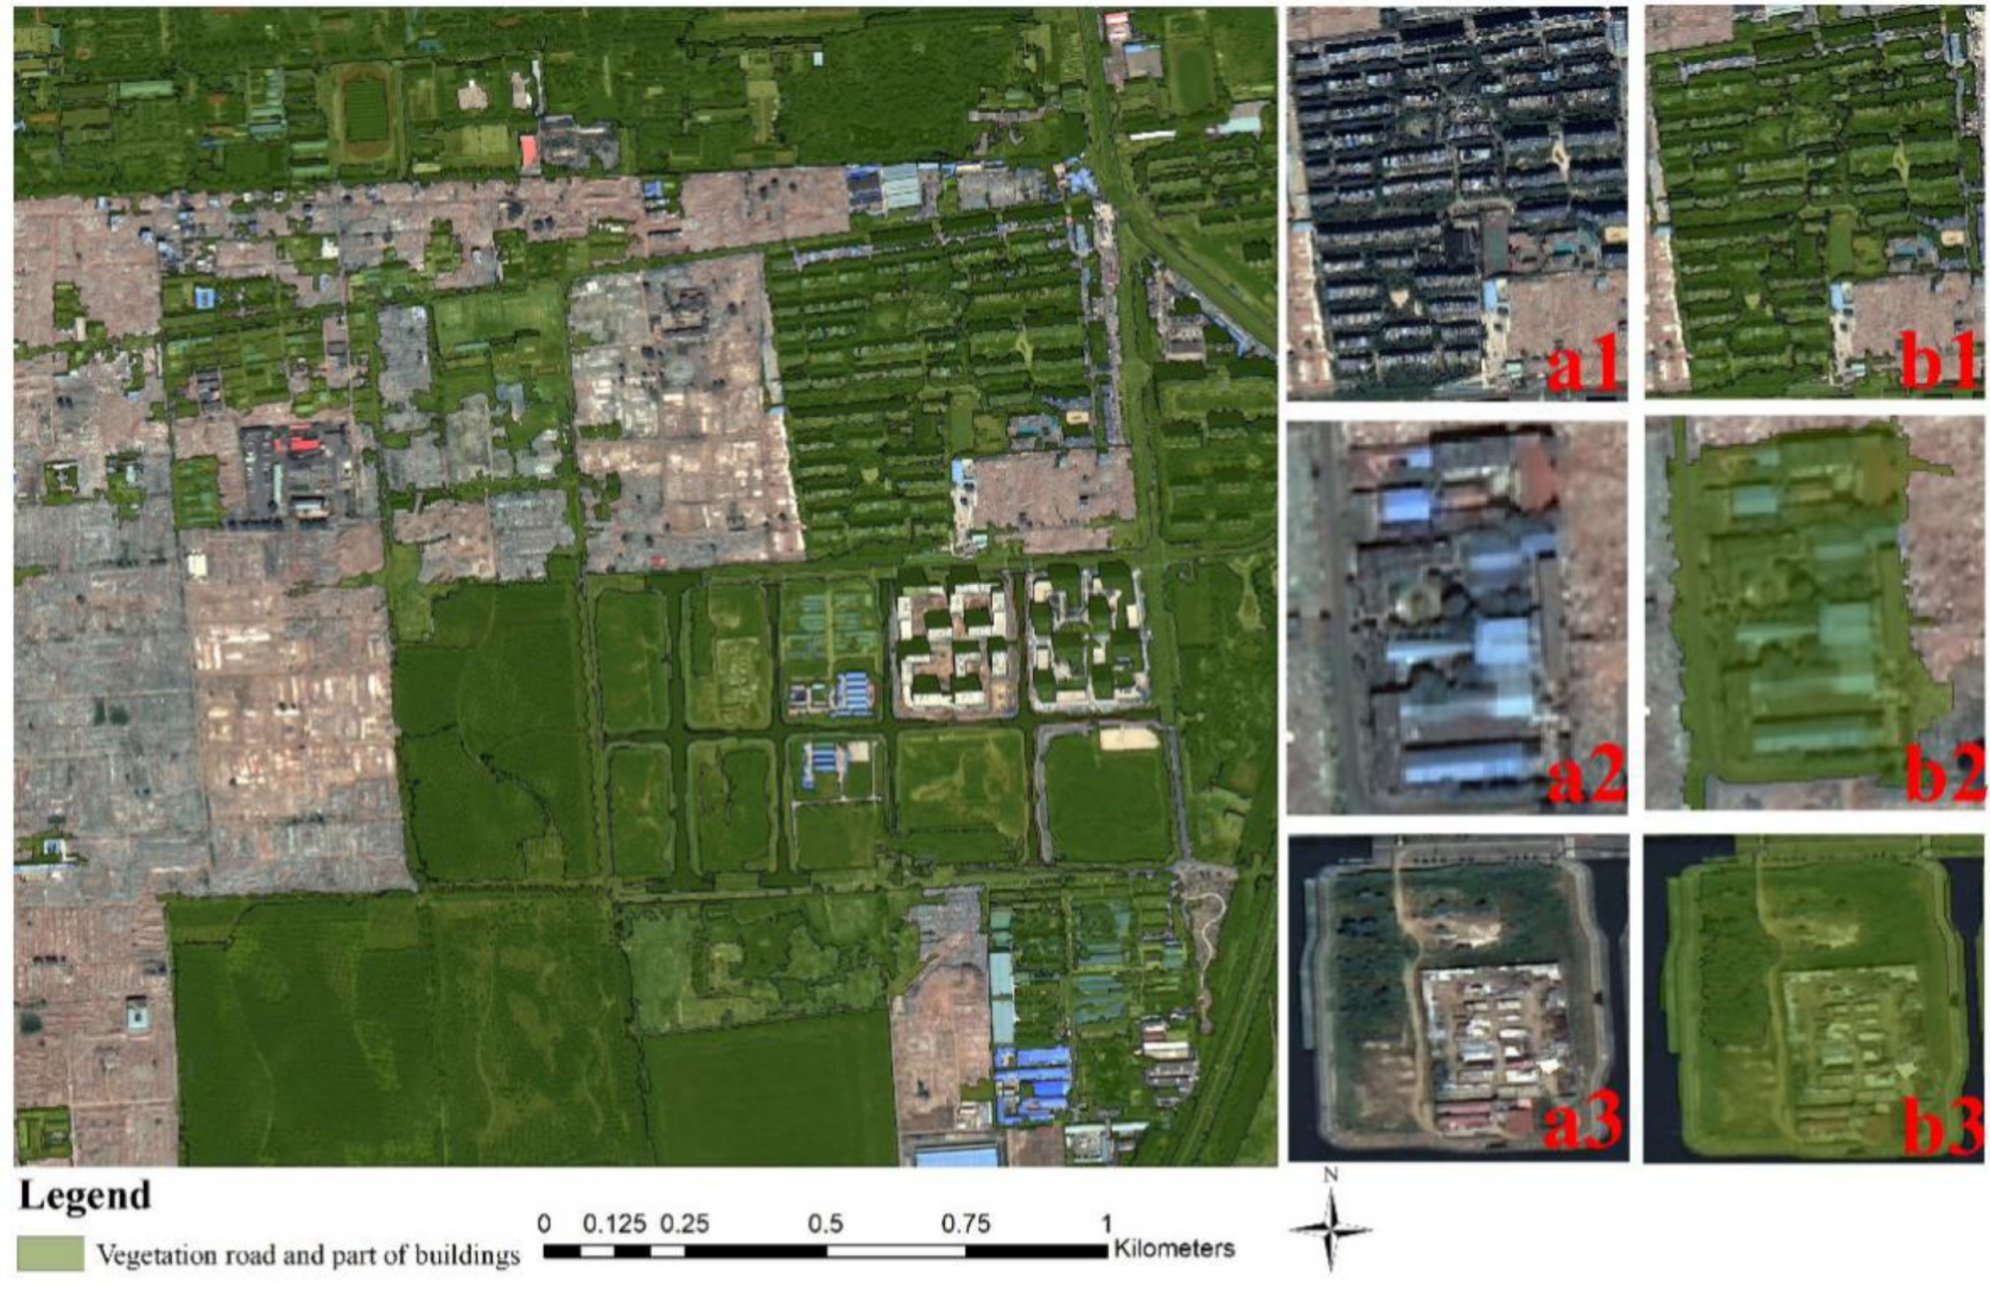
As shown in Figure 24, the first layer of classification rules successfully separated the image objects of vegetation and road by using the red band, and at the same time separated most buildings, including urban buildings and buildings in the demolition area. Figure 24(b1) shows urban residential buildings. Figure 24(b2) shows the buildings in the demolition area. Figure 24(b3) shows a small car park surrounded by vegetation. Figure 24(a1–a3) shows the corresponding original images.
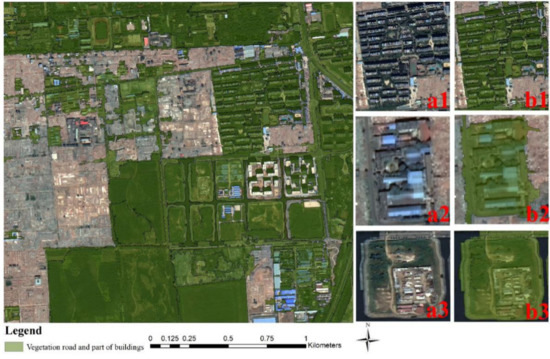
Figure 24.
The result diagram of the first layer classification structure: (a1–a3) the corresponding original images. (b1) the corresponding original images. (b2) the buildings in the demolition area. (b3) a small car park surrounded by vegetation.
Different from study area A, the fifth band was adopted in the second layer of the classification structure in this paper. Due to the large area of the construction waste in study area B, and since the first floor of the classification structure is designed to separate vegetation and road, the initial segmentation scale is large. Some buildings within the construction waste accumulation area appear in large numbers after re-segmentation; thus, it is helpful to separate the image objects of the buildings on the second floor. The result is shown in Figure 25. Figure 25d shows the building under construction. Figure 25e is a roadside car park. Figure 25f shows the building after re-segmentation. The blue area is the separated image object, and Figure 25a–c are the original image comparison diagram.
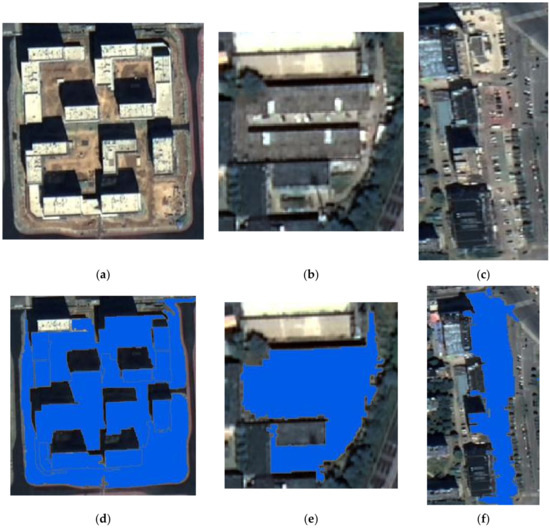
Figure 25.
Classification results of the fifth band:(a–c) are the original image comparison diagram, (d) a roadside car park, (e) the building under construction, (f) the building after re-segmentation.
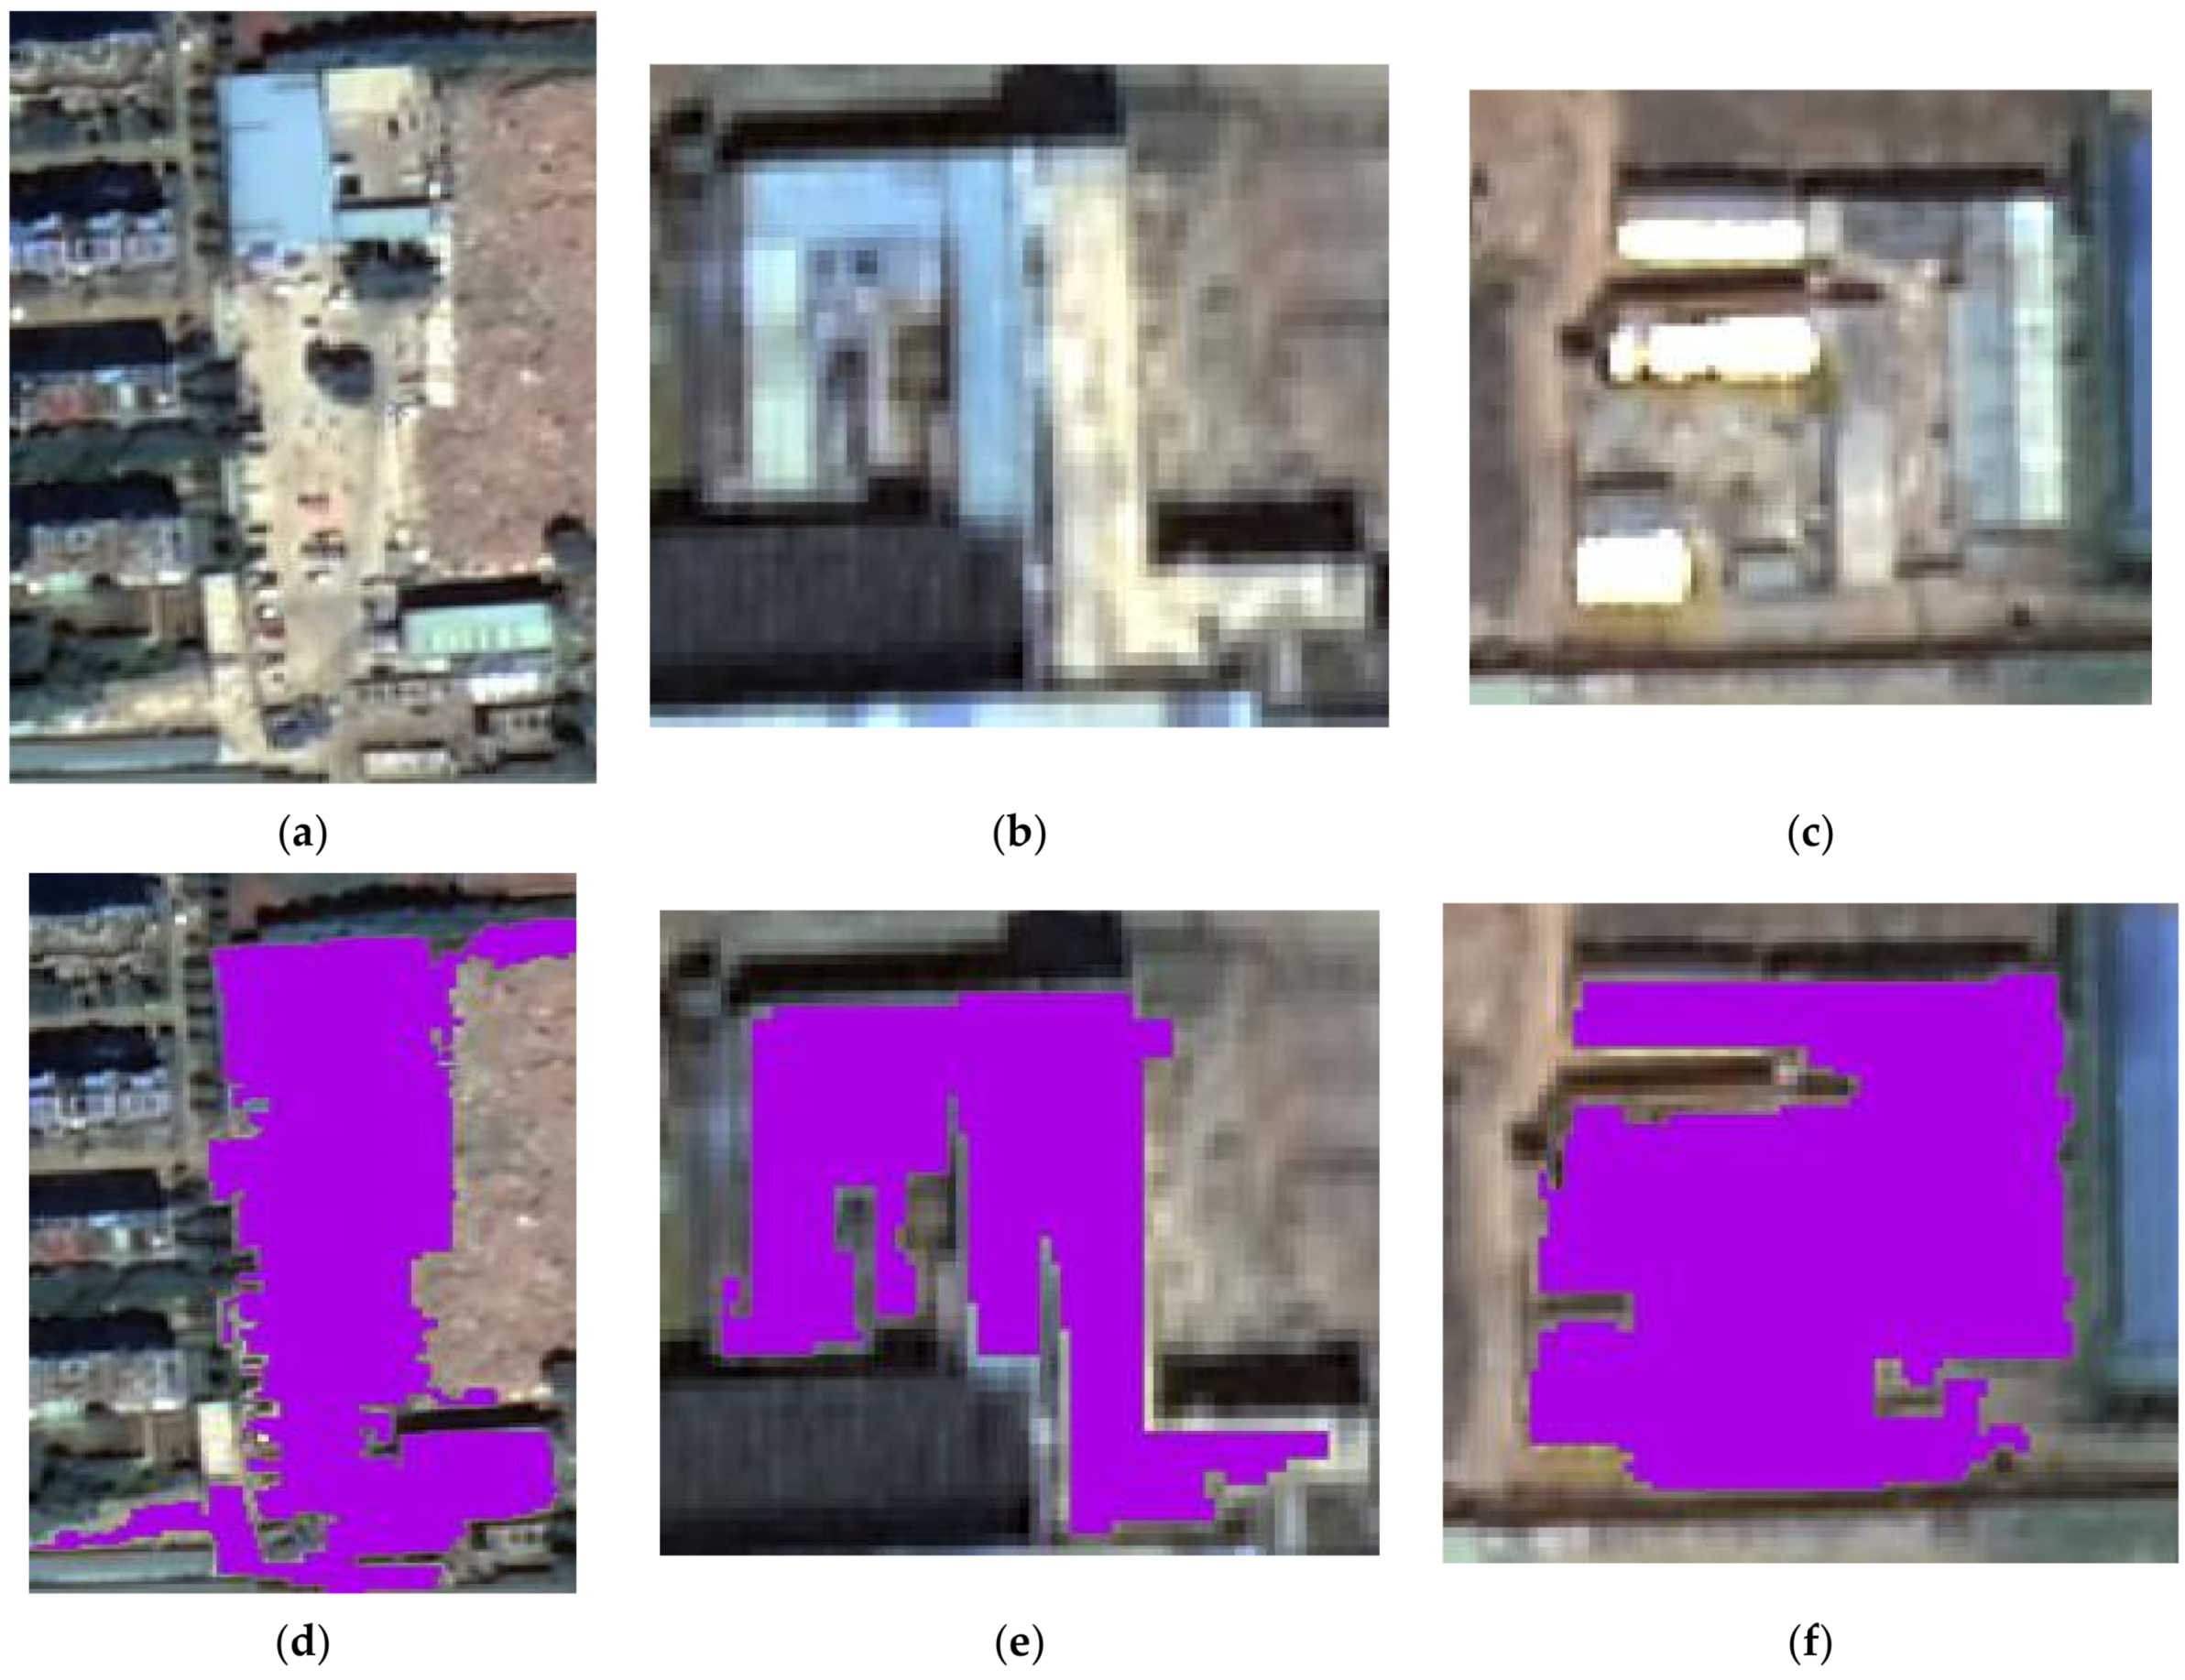
After the above classification operation, some image objects of buildings are still confused with construction waste. It is found in this paper that these easily confused building image objects are basically simple houses that are located near the construction waste area and have obvious brightness contrast with the nearby construction waste. However, the wide range of the brightness threshold of the construction waste will lead to many misclassification phenomena in the separation process. Therefore, GLCM contrast was used to separate such buildings, as shown in Figure 26. Figure 26a–c are the original images, and Figure 26d–f are separated simple houses. Finally, we used the red band to separate the vegetation, and roads appeared after re-segmentation, and we obtained the final construction waste extraction results.
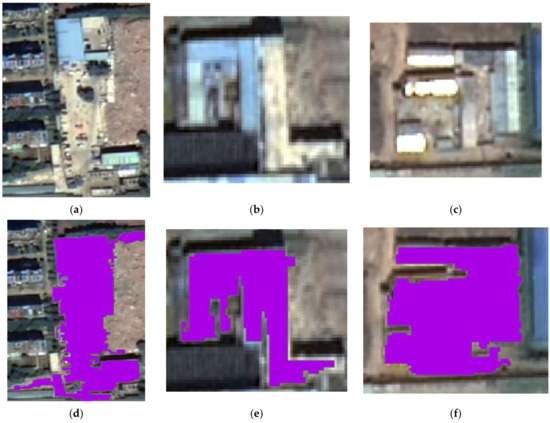
Figure 26.
Classification results of GLCM contrast: (a–c) the original images, (d–f) the separated simple houses.
4. Discussion
Based on the analysis and evaluation of the experimental results on the two study areas, the classification model in this paper can effectively identify the construction waste accumulation area. However, for the phenomenon of commission error or omission error, we will discuss two parts. Firstly, we analyzed the effects of image segmentation and threshold selection on construction waste identification. Then, we compared and analyzed the spectral features of the vegetation and the construction waste covered by vegetation to verify the confusion problem between them.
4.1. Image Segmentation and Threshold Selection
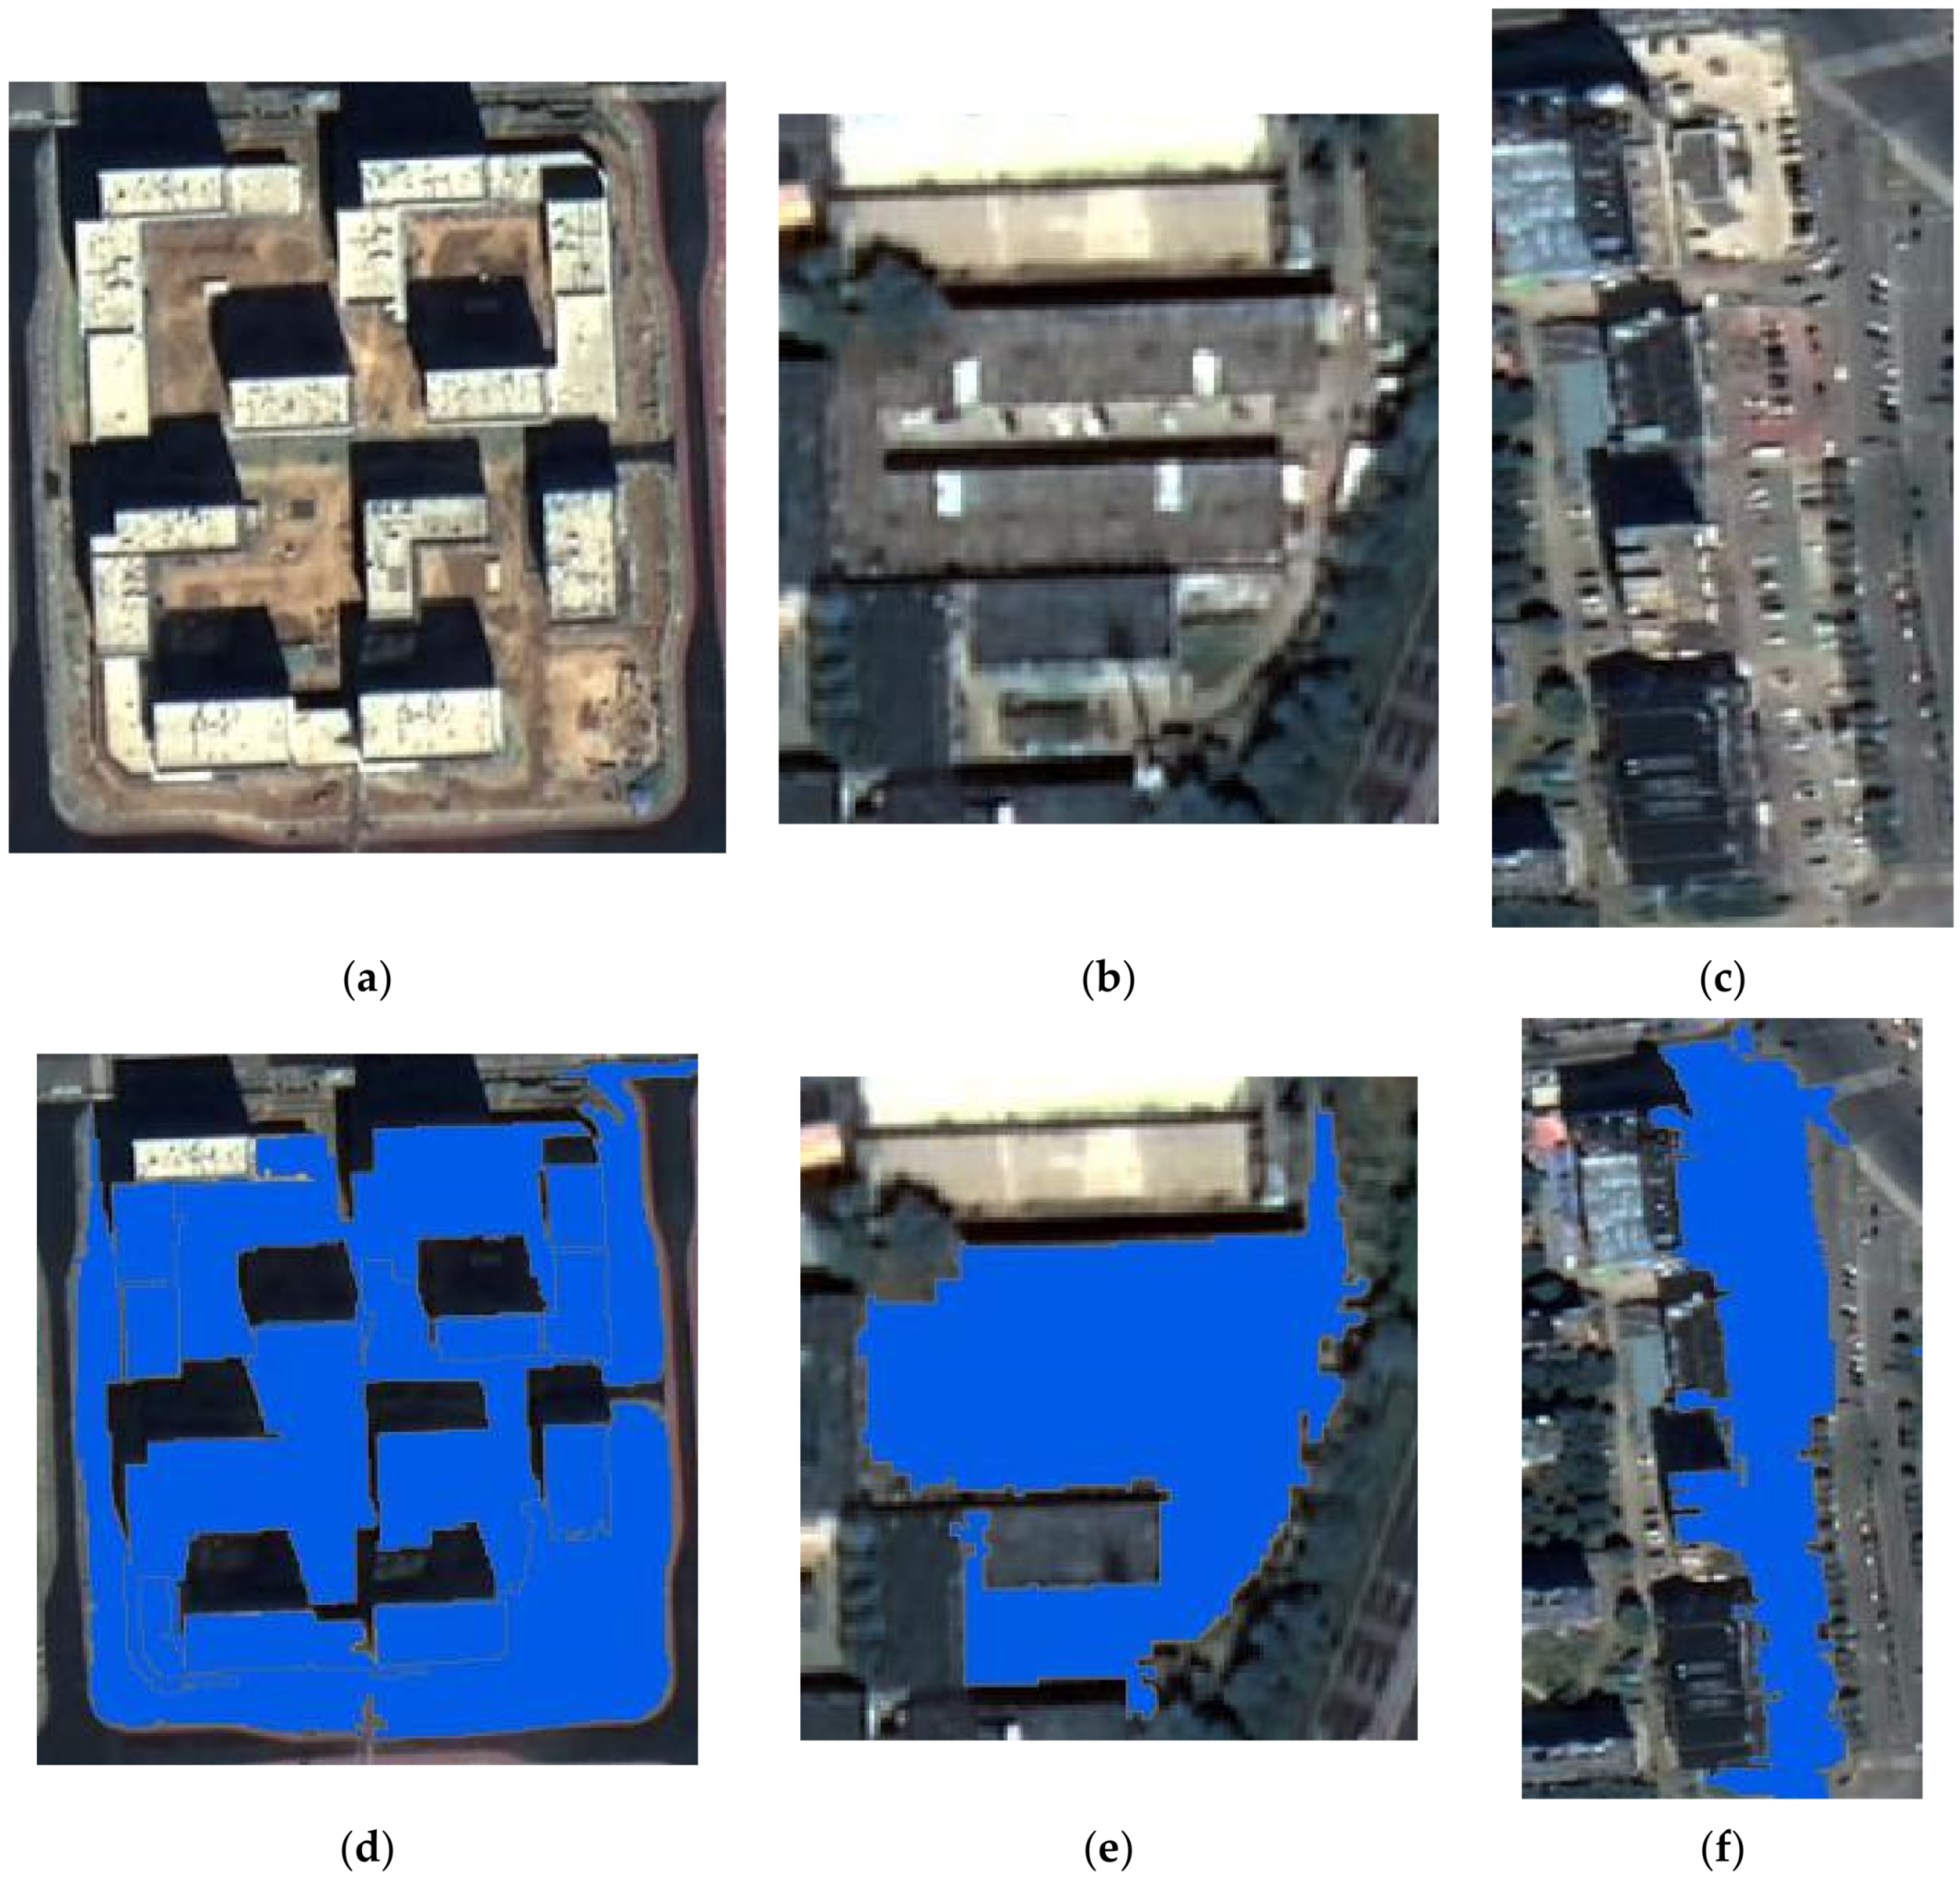
According to the accuracy analysis on the construction waste identification and extraction, the main reasons for commission and omission errors are image segmentation and threshold selection. The hierarchical segmentation method that we used to extract the construction waste ensures that different ground objects have different segmentation scales to some extent. However, some boundaries and features of non-construction waste objects are similar to those of construction waste, such as the construction waste accumulation area after cleaning, which could easily cause the phenomenon of wrong classification. Figure 27c,d in Figure 26 are two houses in study area A; these are wrongly classified into construction waste after demolishing and cleaning (Figure 27a,b).
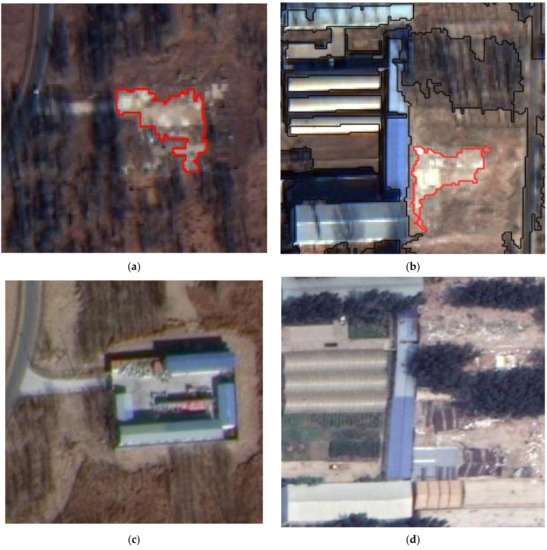
Figure 27.
The construction waste accumulation area after cleaning: (a,b) wrongly classified into construction waste after demolishing and cleaning, (c,d).
At the same time, the image feature value range of the construction waste is very wide, and we could miss some construction waste objects in the threshold classification, such as the fragmentary image objects in the accumulation area of the construction waste (Figure 14b–d). Different segmentation scales lead to different classification threshold settings. Therefore, image segmentation also has a large impact on the threshold classification. The selection of an appropriate segmentation scale and threshold value plays a key role in the identification and extraction of the construction waste.
4.2. Construction Waste Covered by Vegetation
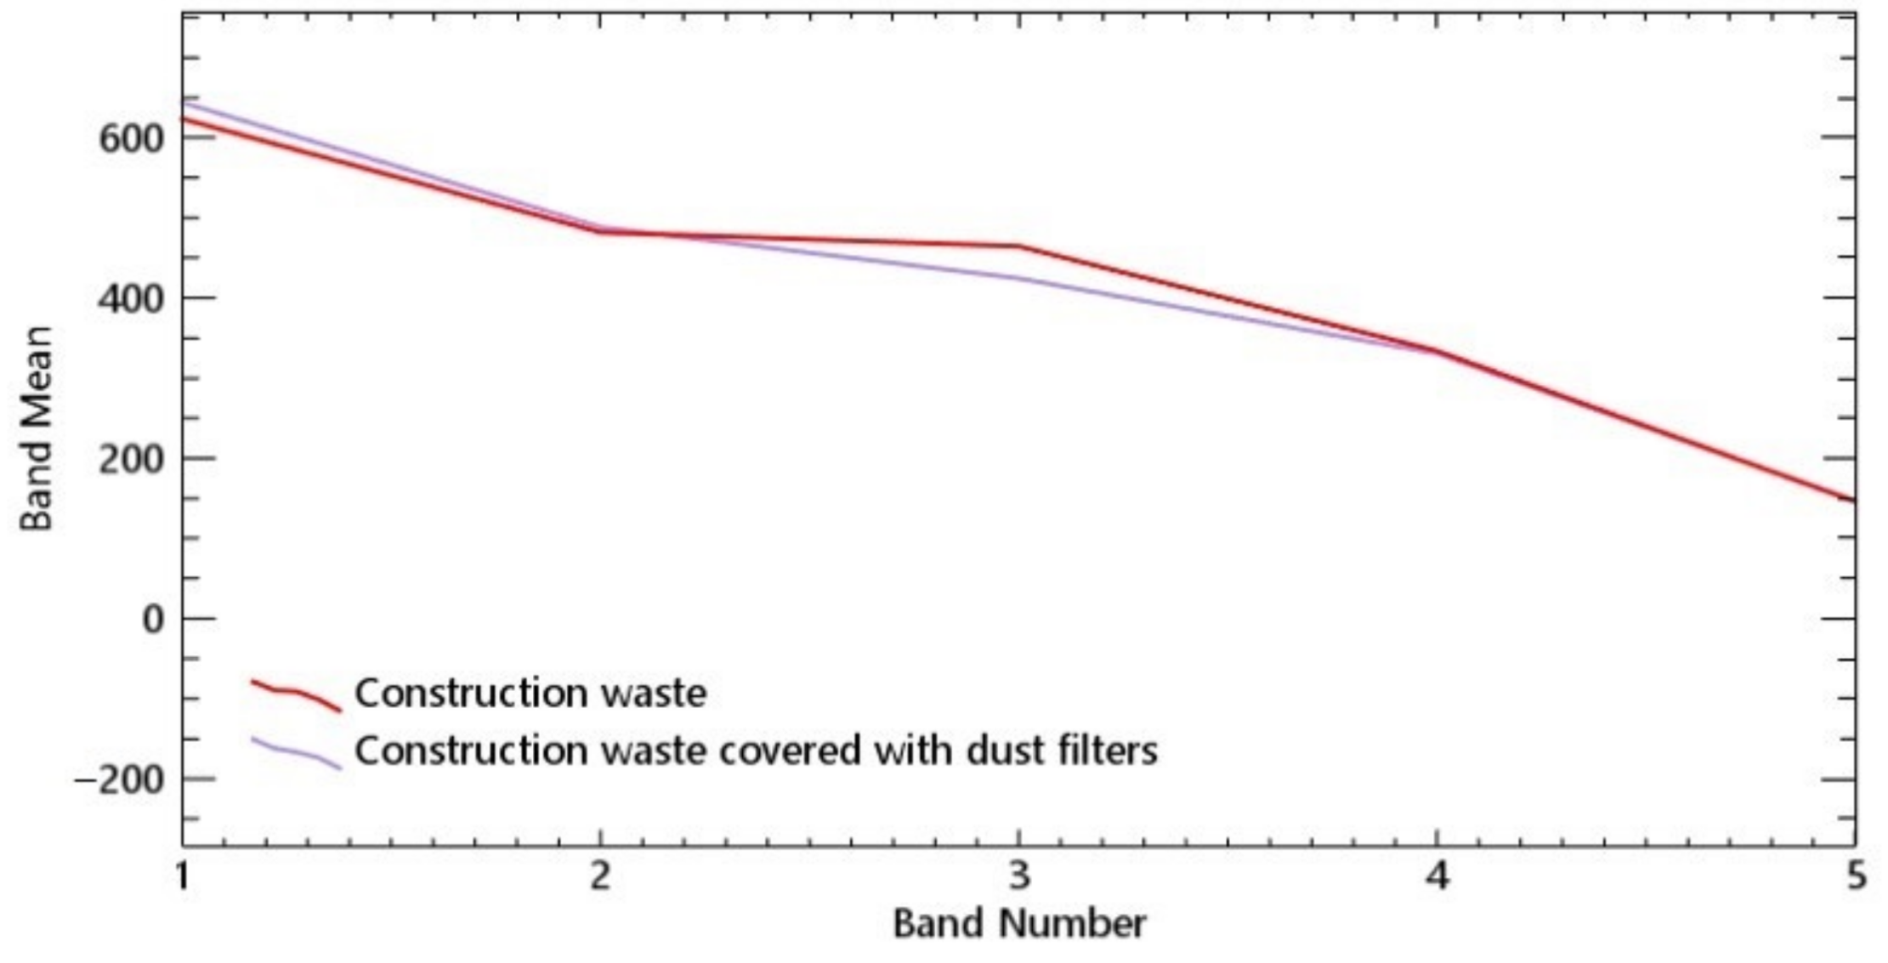
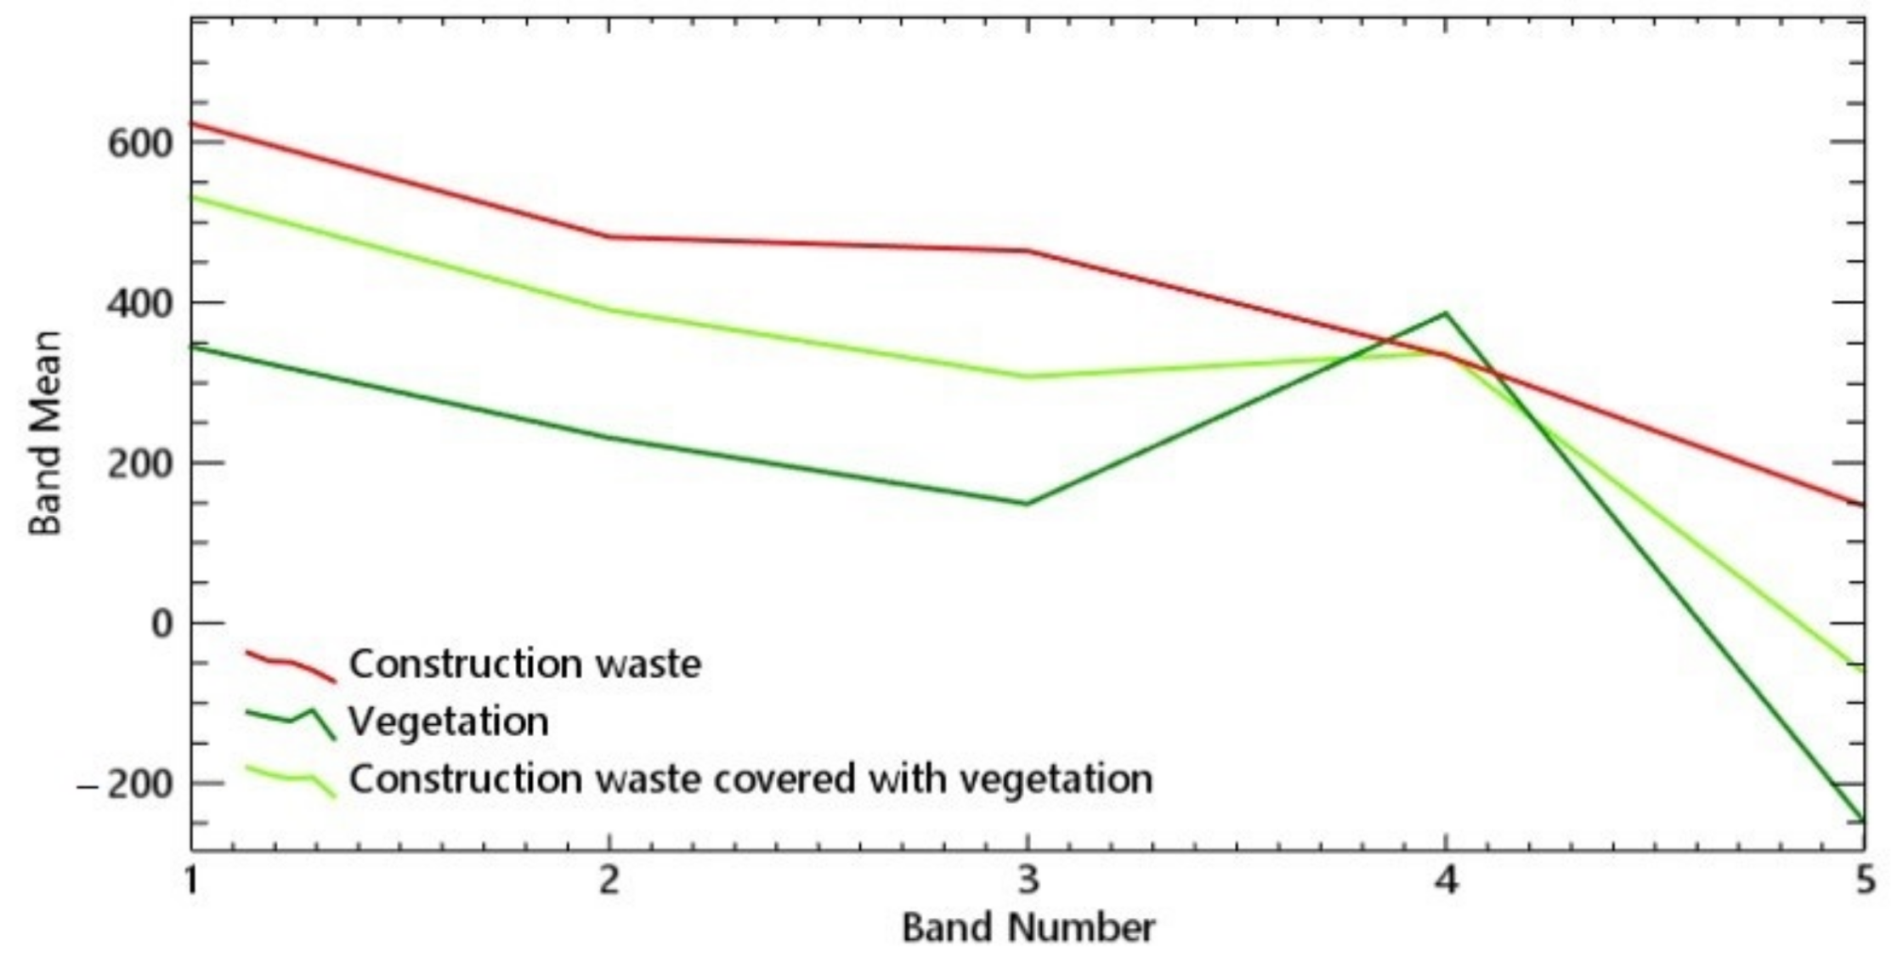
Construction waste in study B includes not only bare construction waste but also construction waste covered with dust screen and vegetation. The experimental results show that the exposed construction waste and the construction waste covered with dust screen can be identified, but the construction waste communication areas covered with vegetation were missed. As shown in Figure 28, the spectral mean distribution of the construction waste covered by dust screen is similar to that of bare construction waste, with no obvious changes. In Figure 29, the spectral mean distribution of the vegetation and construction waste covered by vegetation showed the same trend. Moreover, the band mean separation degree between the vegetation covered construction waste and the bare construction waste is obvious, and the band mean of the construction waste covered by vegetation lies between the construction waste and vegetation.
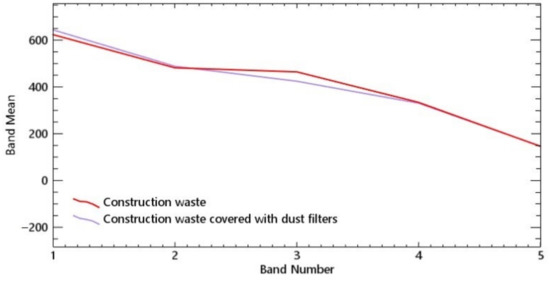
Figure 28.
Spectral mean distribution of construction waste covered with dust screen and exposed construction waste.
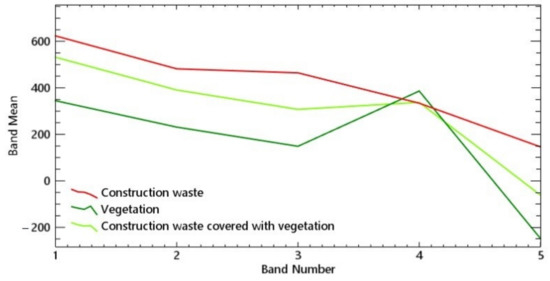
Figure 29.
Spectral mean distribution of vegetation and construction waste covered with vegetation.
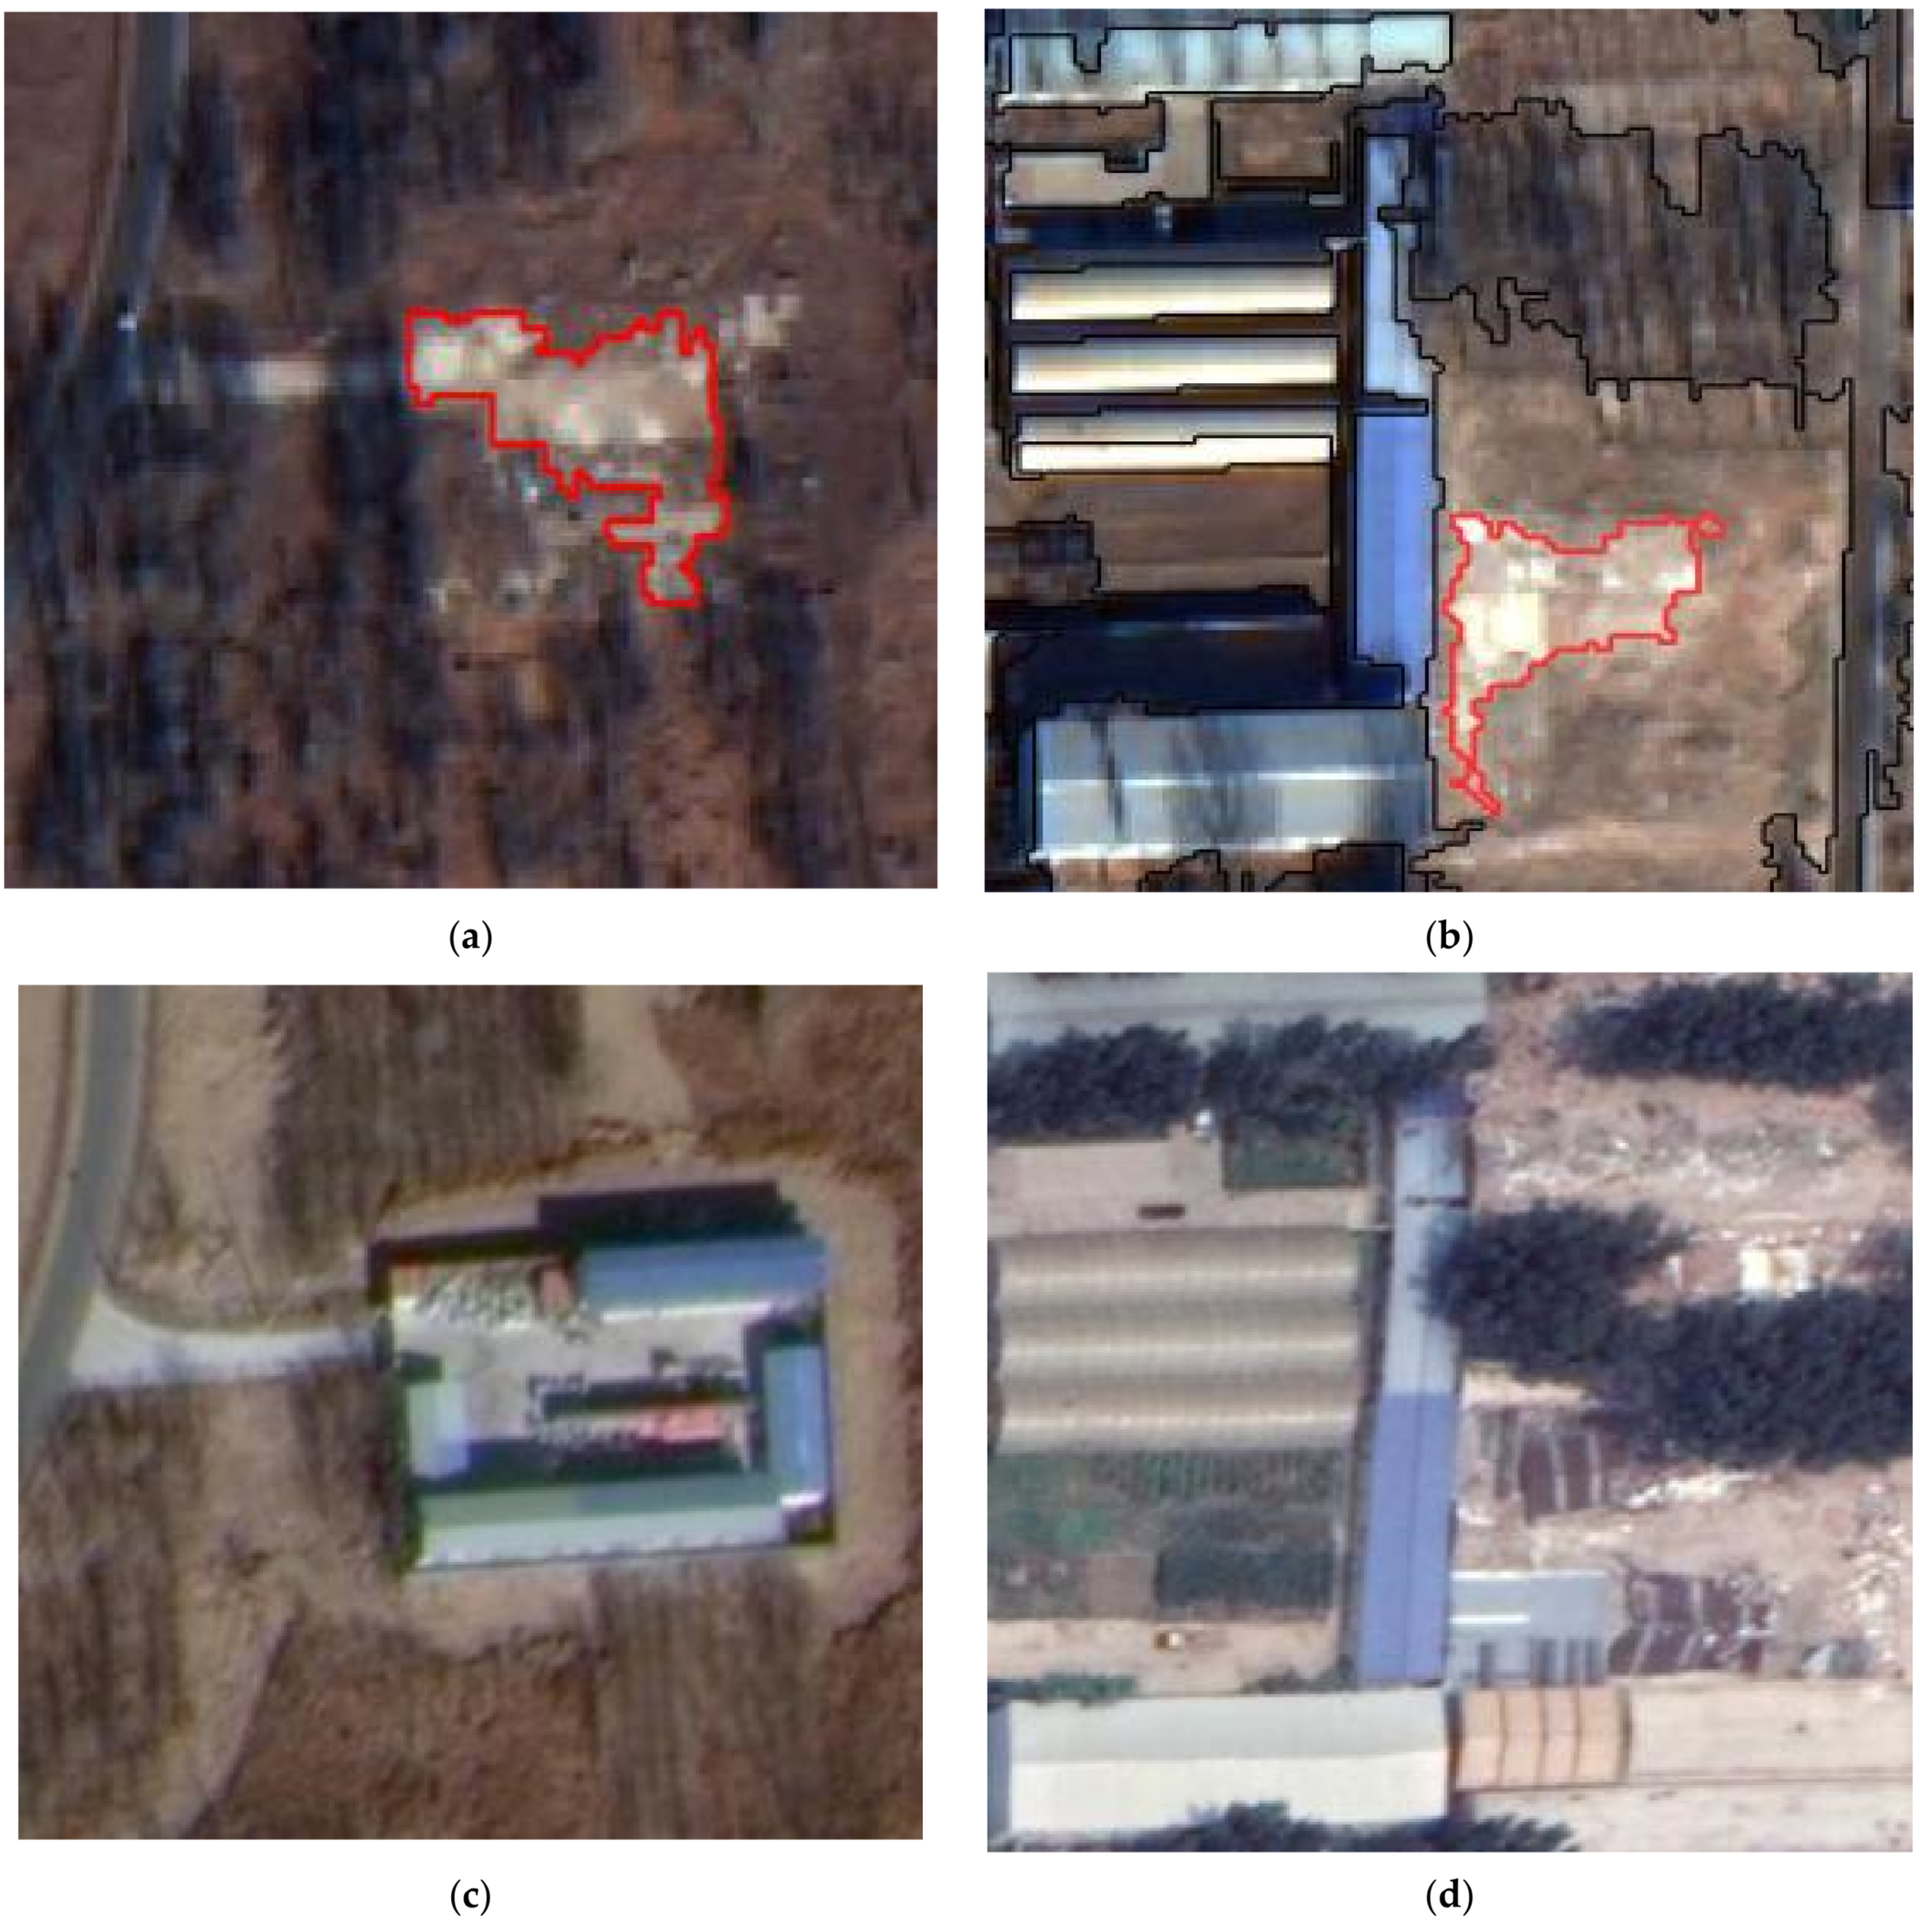
As shown in Figure 30, the spectral features of the construction waste in Figure 30a,b are interfered with by surface vegetation, which seriously affects the identification and extraction of the construction waste. Moreover, the first layer classification structure only used spectral features to separate vegetation and road; thus, such ground objects were mistakenly classified as vegetation. In Figure 30c, due to the presence of vegetation in the image object and the use of red bands used to separate vegetation and road at both levels of the classification rules, such ground objects were also missed in the second classification structure. Construction waste contains mainly residual soil, and its surface has sparse vegetation due to long-term accumulation, which causes substantial interference in the feature selection, and it is obviously different from the other two types of construction waste in terms of features. Therefore, the construction waste covered with vegetation cannot be fully identified in the classification.

Figure 30.
Construction waste covered with vegetation: (a,b) the spectral features of the construction waste, (c) the presence of vegetation in the image object and the use of red bands used to separate vegetation and road at both levels of the classification rules.
5. Conclusions
In this paper, the method of information extraction combining morphological index and hierarchical segmentation was used to extract construction waste information rapidly and accurately. By comparing the differences between the construction waste and building, bare soil, vegetation, and other features in the spectrum, the geometry, texture, and other features, we selected an appropriate feature subset and established a knowledge rule classification model of one-to-one features. In addition, we established the separability index rules for judging the construction waste and buildings, bare soil, and vegetation, and we evaluated the accuracy of the identification results of the construction waste with the accuracy evaluation index of the confusion matrix.
We have conducted experiments on two representative accumulation areas of construction waste in Beijing, and the analysis shows the reliability of the classification model. The confusion between the construction waste and the buildings can be effectively solved by integrating the morphological index into the classification structure of the knowledge rules. The GLCM homogeneity has a significant effect on the separation of the construction waste and bare soil. The GLCM standard deviation and GLCM contrast play an important role in separating the construction waste and demolishing buildings. The experimental results show that the overall accuracy of the two study areas can reach 96.6% and 96.2%, respectively, the separability between construction waste and buildings can reach 1.000, and the separability between construction waste and vegetation can reach 1.000 and 0.818. The separation between construction waste and bare soil in study area A is up to 0.846. The experimental results show that the classification model in this paper can effectively solve the confusion between the construction waste and the buildings and bare soil, and the separation effect is good.
The method can quickly and accurately separate construction waste from buildings and bare soil. Considering the influence of the threshold selection on construction waste identification, we will build a more comprehensive construction waste feature database to analyze the features and rules of construction waste and easily confused ground objects and to improve the accuracy and efficiency of the classification model.
At the same time, we will continue to conduct in-depth analysis on the confusion between the construction waste covered with vegetation and vegetation, and will attempt to combine different data sources and collect samples in the field for comparative experimental analysis, to find the features and methods that can accurately separate these two ground features.
Author Contributions
Conceptualization, Q.C. (Qiang Chen) and M.D.; Methodology, Q.C. (Qiang Chen); Software, Q.C. (Qianhao Cheng); Validation, Q.C. (Qiang Chen); Formal Analysis, Q.C. (Qiang Chen) and J.W.; Investigation, Q.C. (Qianhao Cheng); Resources, L.Z.; Data Curation, Q.C. (Qiang Chen); Writing—Original Draft Preparation, Q.C. (Qiang Chen); Writing—Review & Editing, J.W.; Visualization, Y.L.; Supervision, L.Z.; Project Administration, L.Z.; Funding Acquisition, M.D. All authors have read and agreed to the published version of the manuscript.
Funding
This research was funded by National Key Research and Development Program of China (2018YFC0706003), National Natural Science Foundation of China (41801235) and General Scientific Research Project of Beijing Educational Committee (KM20190016006).
Institutional Review Board Statement
Not applicable for studies not involving humans.
Informed Consent Statement
Not applicable for studies not involving humans or animals.
Data Availability Statement
The data that support the findings of this study are available from the author upon reasonable request.
Conflicts of Interest
The authors declare no conflict of interest.
References
- Ma, M.X.; Tam, V.W.Y.; Le, K.N.; Li, W.G. Challenges in current construction and demolition waste recycling: A China study. Waste Manag. 2020, 118, 610–625. [Google Scholar] [CrossRef] [PubMed]
- Lan, C.; Lu, J.L.; Chen, J.; Gao, Y.X. Status Quo and Development Analysis of Resource Utilization of Construction Waste in China. Jiangxi Build. Mater. 2018, 19, 22. [Google Scholar]
- Ding, Z.L. Construction waste reduction and resource utilization technology. JuShe 2018, 72. [Google Scholar]
- Fořt, J.; Černý, R. Transition to circular economy in the construction industry: Environmental aspects of waste brick recycling scenarios. Waste Manag. 2020, 118, 510–520. [Google Scholar] [CrossRef] [PubMed]
- Hoang, N.H.; Ishigaki, T.; Kubota, R.; Tong, T.K.; Nguyen, T.T.; Nguyen, H.G.; Yamada, M.; Kawamoto, K. Waste generation, composition, and handling in building-related construction and demolition in Hanoi, Vietnam. Waste Manag. 2020, 117, 32–41. [Google Scholar] [CrossRef]
- Cusworth, D.H.; Duren, R.M.; Thorpe, A.K.; Tseng, E.; Thompson, D.; Guha, A.; Newman, S.; Foster, K.T.; Miller, C.E. Using remote sensing to detect, validate, and quantify methane emissions from California solid waste operations. Environ. Res. Lett. 2020, 15, 054012. [Google Scholar] [CrossRef]
- Chen, C.; Fu, J.Q.; Sui, X.X.; Lu, X.; Tan, A.H. Construction and application of knowledge decision tree after a disaster for water body information extraction from remote sensing images. J. Remote Sens. 2018, 22, 792–801. [Google Scholar] [CrossRef]
- Zhang, X.L.; Zhang, F.; Qi, Y.X.; Deng, L.F.; Wang, X.L.; Yang, S.T. New research methods for vegetation information extraction based on visible light remote sensing images from an unmanned aerial vehicle (UAV). Int. J. Appl. Earth Obs. Geoinf. 2019, 78, 215–226. [Google Scholar] [CrossRef]
- Zhan, Z.Q.; Zhang, X.M.; Liu, Y.; Sun, X.; Pang, C.; Zhao, C.B. Vegetation land use/land cover extraction from high-resolution satellite images based on adaptive context inference. IEEE Access 2020, 8, 21036–21051. [Google Scholar] [CrossRef]
- Xin, J.; Zhang, X.C.; Zhang, Z.Q.; Fang, W. Road extraction of high-resolution remote sensing images derived from denseUNet. Remote Sens. 2019, 11, 2499. [Google Scholar] [CrossRef]
- Eriksen, H.Ø.; Rouyet, L.; Lauknes, T.R.; Berthling, I.; Isaksen, K.; Hindberg, H.; Larsen, Y.; Corner, G.D. Recent acceleration of a rock glacier complex, Ádjet, norway, documented by 62 years of remote sensing observations. Geophys. Res. Lett. 2018, 45, 8314–8323. [Google Scholar] [CrossRef]
- Han, L.; Zhao, B.; Wu, J.J.; Zhang, S.Y.; Pilz, J.; Yang, F. An integrated approach for extraction of lithology information using the SPOT 6 imagery in a heavily Quaternary-covered region—North Baoji District of China. Geol. J. 2018, 53, 352–363. [Google Scholar] [CrossRef]
- Liu, S.; Du, Q.; Tong, X.; Samat, A.; Bruzzone, L. Unsupervised Change Detection in Multispectral Remote Sensing Images via Spectral-Spatial Band Expansion. IEEE J. Sel. Top. Appl. Earth Obs. Remote Sens. 2019, 12, 3578–3587. [Google Scholar] [CrossRef]
- Gong, J.Y.; Liu, C.; Huang, X. Advances in urban information extraction from high-resolution remote sensing imagery. Sci. China Earth Sci. 2020, 63, 463–475. [Google Scholar] [CrossRef]
- Thyagharajan, K.K.; Vignesh, T. Soft computing techniques for land use and land cover monitoring with multispectral remote sensing images: A Review. Arch. Comput. Methods Eng. 2019, 26, 275–301. [Google Scholar] [CrossRef]
- Yao, X.D.; Yang, H.; Wu, Y.L.; Wu, P.H.; Wang, B.; Zhou, X.X.; Wang, S. Land Use Classification of the Deep Convolutional Neural Network Method Reducing the Loss of Spatial Features. Sensors 2019, 19, 2792. [Google Scholar] [CrossRef]
- Wang, L.J.; Zhang, G.M.; Wang, Z.Y.; Liu, J.G.; Shang, J.L.; Liang, L. Bibliometric analysis of remote sensing research trend in crop growth monitoring: A case study in China. Remote Sens. 2019, 11, 809. [Google Scholar] [CrossRef]
- Derakhshan, S.; Cutter, S.L.; Wang, C. Remote Sensing Derived Indices for Tracking Urban Land Surface Change in Case of Earthquake Recovery. Remote Sens. 2020, 12, 895. [Google Scholar] [CrossRef]
- Sun, W.; Yang, G.; Peng, J.; Du, Q. Lateral-Slice Sparse Tensor Robust Principal Component Analysis for Hyperspectral Image Classification. IEEE Geosci. Remote Sens. Lett. 2020, 17, 107–111. [Google Scholar] [CrossRef]
- Teng, L.; Xue, F.; Bai, Q. Remote Sensing Image Enhancement Via Edge-Preserving Multiscale Retinex. IEEE Photon. J. 2019, 11, 1–10. [Google Scholar] [CrossRef]
- Jiang, K.; Wang, Z.; Yi, P.; Wang, G.; Lu, T.; Jiang, J. Edge-Enhanced GAN for Remote Sensing Image Superresolution. IEEE Trans. Geosci. Remote Sens. 2019, 57, 5799–5812. [Google Scholar] [CrossRef]
- Salazar-Colores, S.; Cabal-Yepez, E.; Ramos-Arreguin, J.M.; Botella, G.; Ledesma-Carrillo, L.M.; Ledesma, S. A Fast Image Dehazing Algorithm Using Morphological Reconstruction. IEEE Trans. Image Process. 2019, 28, 2357–2366. [Google Scholar] [CrossRef] [PubMed]
- Pandey, P.; Sharma, L.N. Image Processing Techniques Applied to Satellite Data for Extracting Lineaments Using PCI Geomatica and Their Morphotectonic Interpretation in the Parts of Northwestern Himalayan Frontal Thrust. J. Indian Soc. Remote Sens. 2019, 47, 809–820. [Google Scholar] [CrossRef]
- Tu, B.; Zhang, X.F.; Wang, J.P.; Zhang, G.Y.; Ou, X.F. Spectral–Spatial Hyperspectral Image Classification via Non-local Means Filtering Feature Extraction. Sens. Imaging 2018, 19, 11. [Google Scholar] [CrossRef]
- Bachagha, N.; Luo, L.; Wang, X.; Masini, N.; Moussa, T.; Khatteli, H.; Lasaponara, R. Mapping the Roman Water Supply System of the Wadi el Melah Valley in Gafsa, Tunisia, Using Remote Sensing. Sustainability 2020, 12, 567. [Google Scholar] [CrossRef]
- Bijeesh, T.V.; Narasimhamurthy, K.N. Surface water detection and delineation using remote sensing images: A review of methods and algorithms. Sustain. Water Resour. Manag. 2020, 6, 68. [Google Scholar] [CrossRef]
- Sharifi, A.; Malian, A.; Soltani, A. Efficiency Evaluating of Automatic Lineament Extraction by Means of Remote Sensing (Case Study: Venarch, Iran). J. Indian Soc. Remote Sens. 2018, 46, 1507–1518. [Google Scholar] [CrossRef]
- Huang, S.; Tang, L.; Hupy, J.P.; Wang, Y.; Shao, G.F. A commentary review on the use of normalized difference vegetation index (NDVI) in the era of popular remote sensing. J. For. Res. 2020, 1–6. [Google Scholar] [CrossRef]
- Jiang, Z.Y.; Huete, A.R.; Chen, J.; Chen, Y.H.; Li, J.; Yan, G.J.; Zhang, X.Y. Analysis of NDVI and scaled difference vegetation index retrievals of vegetation fraction. Remote Sens. Environ. 2006, 101, 366–378. [Google Scholar] [CrossRef]
- Khaldi, B.; Aiadi, O.; Kherfi, M.L. Combining colour and grey-level co-occurrence matrix features: A comparative study. IET Image Process. 2019, 13, 1401–1410. [Google Scholar] [CrossRef]
- Zhang, L.; Gong, Z.N.; Wang, Q.W.; Jin, D.D.; Wang, X. Wetland mapping of Yellow River Delta wetlands based on multi-feature optimization of Sentinel-2 images. J. Remote Sens. 2019, 23, 313–326. [Google Scholar]
- Teng, X.P.; Song, S.L.; Zhan, Y.Z. Statistical Class Feature in Texture Analysis of Remote Sensing Imagery. Adv. Mater. Res. 2012, 518, 5749–5753. [Google Scholar] [CrossRef]
- Unser, M. Texture classification and segmentation using wavelet frames. IEEE Trans. Image Process. 1995, 4, 1549–1560. [Google Scholar] [CrossRef]
- Kimmel, G.J.; Dane, M.; Heiser, L.M.; Altrock, P.M.; Andor, N. Integrating Mathematical Modeling with High-Throughput Imaging Explains How Polyploid Populations Behave in Nutrient-Sparse Environments. Cancer Res. 2020, 80, 5109. [Google Scholar] [CrossRef] [PubMed]
- Zhao, H.M.; Yao, R.; Xu, L.; Yuan, Y.; Li, G.Y.; Deng, W. Study on a Novel Fault Damage Degree Identification Method Using High-Order Differential Mathematical Morphology Gradient Spectrum Entropy. Entropy 2018, 20, 682. [Google Scholar] [CrossRef] [PubMed]
- Zhang, J.; Xie, C.M.; Xu, X.; Shi, Z.W.; Pan, B. A Contextual Bidirectional Enhancement Method for Remote Sensing Image Object Detection. IEEE J. Sel. Top. Appl. Earth Obs. Remote Sens. 2020, 13, 4518–4531. [Google Scholar] [CrossRef]
- Zhang, C.; Li, G.; Cui, W. High-Resolution Remote Sensing Image Change Detection by Statistical-Object-Based Method. IEEE J. Sel. Top. Appl. Earth Obs. Remote Sens. 2018, 11, 2440–2447. [Google Scholar] [CrossRef]
- Zhang, L.; El-Gohary, N.M. Automated IFC-based building information modelling and extraction for supporting value analysis of buildings. Int. J. Constr. Manag. 2020, 20, 269–288. [Google Scholar] [CrossRef]
- García-Balboa, J.L.; Alba-Fernández, M.V.; Ariza-López, F.J.; Rodríguez-Avi, J. Analysis of Thematic Similarity Using Confusion Matrices. Isprs Int. J. Geo-Inf. 2018, 7, 233. [Google Scholar] [CrossRef]
- Ye, L.H.; Wang, L.; Zhang, W.W.; Li, Y.G.; Wang, Z.K. Deep metric learning method for high resolution remote sensing image scene classification. Acta Geod. Cartogr. Sin. 2019, 48, 698–707. [Google Scholar]
- Li, Q.; Zhang, J.F.; Luo, Y.; Jiao, Q.S. Recognition of earthquake-induced landslide and spatial distribution patterns triggered by the Jiuzhaigou earthquake in August 8, 2017. J. Remote Sens. 2019, 23, 785–795. [Google Scholar]
- Pham, T.; Tao, X.H.; Zhang, J.; Yong, J.M. Constructing a knowledge-based heterogeneous information graph for medical health status classification. Health Inf. Sci. Syst. 2020, 8, 10. [Google Scholar] [CrossRef] [PubMed]
- Chen, Y.; Fan, R.S.; Bilal, M.; Yang, X.C.; Wang, J.X.; Li, W. Multilevel Cloud Detection for High-Resolution Remote Sensing Imagery Using Multiple Convolutional Neural Networks. ISPRS Int. J. Geo-Inf. 2018, 7, 181. [Google Scholar] [CrossRef]
Publisher’s Note: MDPI stays neutral with regard to jurisdictional claims in published maps and institutional affiliations. |
© 2021 by the authors. Licensee MDPI, Basel, Switzerland. This article is an open access article distributed under the terms and conditions of the Creative Commons Attribution (CC BY) license (http://creativecommons.org/licenses/by/4.0/).

