Abstract
The utility of new imaging technologies to better understand hazardous geological environments cannot be overstated. The combined use of unmanned aerial vehicles (UAV) and digital photogrammetry (DP) represents a rapidly evolving technique that permits geoscientists to obtain detailed spatial data. This can aid in rapid mapping and analyses of dynamic processes that are modifying contemporary landscapes, particularly through the creation of a time series of digital data to help monitor the geomorphological evolution of volcanic structures. Our study comprises a short-term (in geological terms) monitoring program of the dynamic and diffuse Pisciarelli degassing structure caused by the interplay between intensive rainfall and hydrothermal activity. This area, an unstable fumarole field located several hundred meters east of the Solfatara Crater of the Campi Flegrei caldera (southern Italy), is characterized by consistent soil degassing, fluid emission from ephemeral vents, and hot mud pools. This degassing activity is episodically accompanied by seismic swarms and macroscopic morphology changes such as the appearance of vigorously degassing vents, collapsing landslides, and bubbling mud. In late-2019 and 2020, we performed repeated photogrammetric UAV surveys using the Structure from Motion (SfM) technique. This approach allowed us to create dense 3D point clouds and digital orthophotos spanning one year of surveys. The results highlight the benefits of photogrammetry data using UAV for the accurate remote monitoring and mapping of active volcanoes and craters in harsh and dangerous environments.
1. Introduction
In this paper, we present the first application of time-lapse unmanned aerial vehicle (UAV) photogrammetry for landform monitoring in the Pisciarelli fumarole field. This active volcanic context, one of the largest and most dangerous in the world, is located inside the Campi Flegrei caldera (Figure 1) near Naples, Italy. Digital photogrammetry using UAV image acquisition has become an important and widely used technique for investigating and monitoring areas prone to natural hazards. It is exceptionally useful in the geosciences when combined with the Structure from Motion (SfM) algorithm. The main purpose of this paper is to detail the application of well-developed technologies (UAV and SfM) to an under-explored field of geoscience: the landform change monitoring of highly dynamic environments such as volcanic and hydrothermal fields. The integration of time-lapse UAV survey data and time series of available geophysical/geochemical and meteorological parameters helped us to characterize geomorphological changes and investigate their causes.
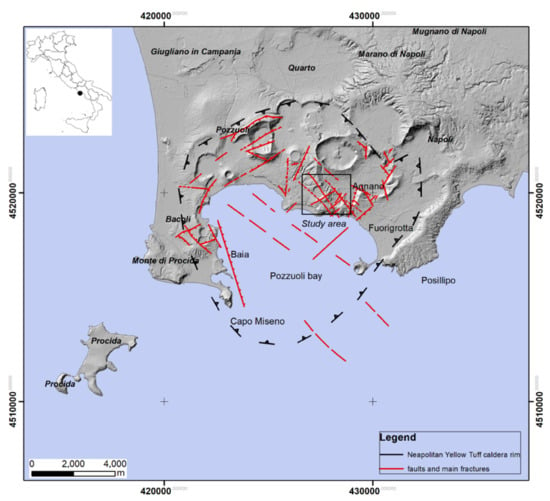
Figure 1.
Campi Flegrei caldera showing the main volcano-tectonic structures. The used coordinate system is WGS84/UTM zone 33N.
The main advantage of UAV photogrammetry is its ability to reconstruct 3D structures from 2D images; in particular, it permits the evaluation of the shape, position, and size of target elements or areas with great precision and in a shorter time frame than field investigations. This can be attributed to the improved technical performance of drones [1,2] and the development of upgraded artificial vision algorithms [3], or information technologies which significantly accelerate the processing times and the quality of 3D surface reconstructions [4,5]. The Structure from Motion (SfM) algorithm used in photogrammetry opens new application possibilities in the geosciences [6,7,8,9] because it allows for the creation of high-resolution digital elevation models (DEMs). It can facilitate the identification of centimetric-scale features of natural and artificial surfaces quickly at a low cost and in safer conditions for researchers. The number of applications of SfM- and UAV-based photogrammetry is growing rapidly in geomorphological research. This methodology is particularly suitable for repeated topographic surveys in remote or poorly accessible areas due to the combined accuracy and reproducibility reached by topographic data based on UAV imagery [10,11]. Some of the most striking uses of the technology include geomorphological mapping [12] and studies of landslides [13], erosion [14,15], and sedimentation [16].
In active volcanic contexts, it is essential to monitor the dynamic topography frequently. Detailed DEM analyses and multitemporal comparisons can aid in this endeavor. Photogrammetric techniques, too, can be successfully applied to study volcanic and geothermal hazards. The applications of these techniques range from change analyses in the morphology and structures of lava domes [17,18,19,20,21] and dykes [22] to volcanic landform monitoring [23], ancient lava flow field surveys [24], volcano-tectonic surveys [25], geothermal research [26,27], and volcanic gas and plumes [28,29,30,31]. These studies can additionally include the use of optical and thermal imaging capabilities [32] to provide frequent and detailed detection and monitoring while simultaneously permitting geoscientists to detect changes in volcanic activity without putting themselves in hazardous conditions. The time-lapse technique—which consists of performing identical photogrammetric surveys multiple times in the same location over defined time intervals—is highly useful for identifying topographic changes and yet has been rarely used in active volcanic areas for multitemporal monitoring [33].
In the context of Italian volcanism, this approach has only been used to monitor active lava flows in Mt. Etna (Sicily) [8,34] and coastal landslide evolution and geomorphic changes along tuffaceous coastal cliffs located around the Campi Flegrei caldera (Naples) [35,36]. The Pisciarelli fumarole field, a locus of both ancient and ongoing morphological changes, is localized near the Solfatara crater at the border between the towns of Pozzuoli and Naples. Historically, a vast amount of geochemical, geophysical, and topographic data is collected—both in discrete and continuous form—from this site, and many of its fumarolic vents have been subject to routine gas sampling and real-time geochemical measurements. In recent years, however, the Pisciarelli fumarole field has become less accessible due to the increasingly frequent openings of small fumarolic vents and the presence of boiling mud, hence the importance of remote sensing. In order to monitor and quantify the fast changes in the morphology of this area, UAV time-lapse surveys and SfM-based photogrammetric processing were performed starting in April 2019. These allowed us to highlight variations in the volume of the mud pools, acidic hot springs, and other topographic changes.
2. Geology and Morphology of the Pisciarelli Site
Campi Flegrei is a volcanic area dominated by a large caldera that was the source of the Neapolitan Yellow Tuff eruption (15.000 years BP), as well as potentially the debated, larger Campanian Ignimbrite eruption (39.000 years BP) [37,38,39,40,41,42]. The Campi Flegrei caldera has an unprecedented 2000-year record of historical unrest and eruption [43]. Following the Neapolitan Yellow Tuff eruption, more than 70 eruptions—most of them explosive—occurred during three main epochs: 15.0–10.6, 9.6–9.1, and 5.5–3.8 kyr [44,45,46]. The most recent eruption (the Monte Nuovo event) occurred in AD 1538 [47,48].
The geomorphological dynamics of this area have been characterized by both vertical and horizontal ground movements at gradients that range from centimeters to meters per year [49,50]. Two recent periods of unrest (in 1969–1972 and 1982–1984) caused a cumulative maximum uplift of over 3.5 m in the central sector of the caldera. A new episode of intense ground deformation started in 2011 and is characterized by a current cumulative maximum ground deformation of about 0.70 m [51].
The Pisciarelli area falls within the central sector of the Campi Flegrei caldera between the Solfatara, Astroni, and Agnano vents (Figure 2). The Astroni volcanic edifice was built through several eruptions at approximately 3.8 kyr [47]. The large Agnano–Monte Spina eruption occurred at about 4.1 kyr and was followed by the volcano-tectonic collapse of the Agnano plain [52]. The erupted magmas varied in composition from trachybasalt to latite, trachyte, and alkali-trachyte.
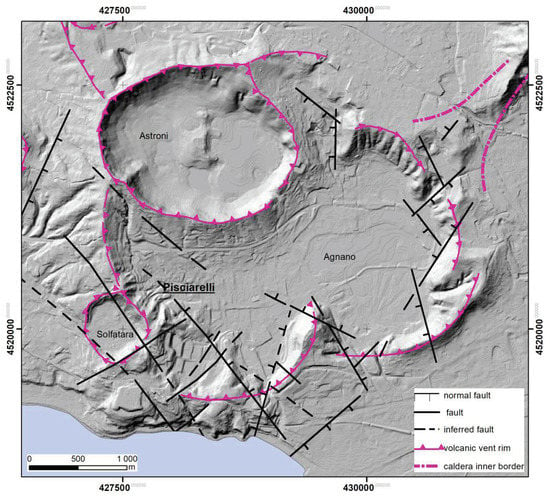
Figure 2.
Study area volcano-tectonic framework. Volcanic and tectonic elements are modified by Rosi and Sbrana [37]. The used coordinate system is WGS84/UTM zone 33N.
Solfatara is a maar-diatreme structure located at the caldera center and crossed by NW-SE and NE-SW faults [53]. It was formed 4.2 kyr ago by phreatic and phreatomagmatic eruptions and overlays several tephra deposits and the Mount Olibano lava dome [53,54]. The Solfatara hydrothermal system lies atop a hydrothermal plume created by large quantities of hot fluids (mainly H2O and CO2) derived from a magmatic body located at a depth of about 8 km [55,56]. After mixing with meteoric components in a hydrothermal reservoir located at a 3–4 km depth, these fluids are released through diffuse and direct degassing at the surface of the Solfatara crater [57]. The main surface hydrothermal features are represented by the Fangaia mud pool, the Bocca Grande and Bocca Nuova fumaroles within the Solfatara crater, and the fumarolic area at Pisciarelli located east of the Solfatara crater [56] along the intensely urbanized western margin of the Agnano crater (Figure 2).
The Pisciarelli fumaroles are located at about 75 m a.s.l. at the base of the slope declining from Solfatara vent volcanic rim (175 m a.s.l.). This slope is characterized by valleys with ephemeral streams separated by hilly divides (Figure 3). A hilly divide is located at 170 m a.s.l. and delimits the west and south sides of the fumarole field. The east-facing slope of the hill can be impacted by low-magnitude (1 to 10 m3 in volume) rockfalls, deposits of which can reach the underlying pools (Figure 3). Multiple small fumaroles, bubbling mud pools, and fractures with diffuse soil degassing and fluid emission surround the main fumarolic vent, which is locally named “Soffione” (gas temperature ~114 °C). This vent is comprised of a semi-circular shaped bubbling mud pool (water temperature ~90 °C) [58]. It was conjecturally formed in 2009, accompanied by a small explosion [59]. The bulk CO2 flux from the Pisciarelli and Solfatara sites reaches 50,000 g/m2d over an area of ∼1 km2 [60]. Fumarole discharges are mainly composed of H2O (>70%), followed by CO2 and H2S, and have surface temperatures between 40 and 60 °C. [61,62,63]. This degassing activity is episodically accompanied by local seismic activity at a shallow depth (1–2 km) and by some macroscopic changes in ground topography. The degassing activity is mainly controlled by both meteoric water and shallow aquifers [64].
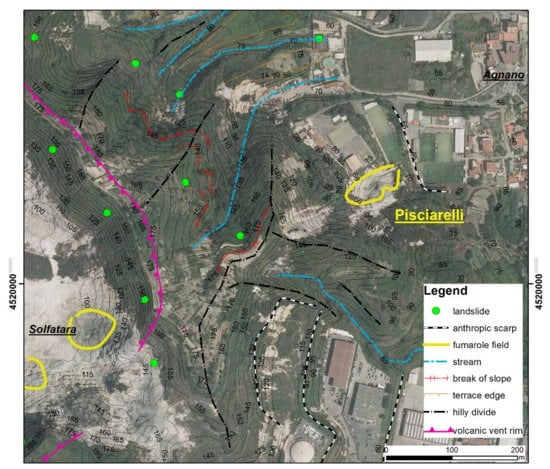
Figure 3.
Geomorphological map of the Pisciarelli area.
The Pisciarelli fumarolic field evidenced an increase in hydrothermal activity from 2005 to 2013 [59,65]; this is marked by a nearly linear trend in peak temperatures, from about 97 up to 112 °C, and by increased local seismic activity [66,67,68]. Several ground changes have occurred in recent years [69]. An episode of mud emission, prompted by a weak phreatic explosion, occurred in April 2006, followed by the opening of a boiling pool in October 2006. A new fumarole vent opened in March 2008 and a small explosion accompanied the opening of new boiling pools in March 2009. New fumaroles, formed on 20 December 2009 and 15 November 2010, were characterized by high-pressure steam ejections that led to the formation in January 2013 of a 4–5 m-high geyser-like fountain made of gases and condensed fluids [69]. On 1 December 2018, a significant enlargement of the emission area occurred [70]. The activity has remained very high in the last few years and has been monitored through our surveys during the 2019–2020 period.
3. Materials and Methods
Our fieldwork involved acquisition, reconstruction, and analysis sessions. In order to obtain multitemporal 3D point clouds and high-resolution orthophotographs, we performed repeated UAV surveys over the active Pisciarelli fumarolic field from October 2019 to November 2020. In total, we made ten surveys with interruptions due to the COVID-19 pandemic (March–April 2020) and drone maintenance (July and August 2020).
The UAV imagery was acquired with a DJI Phantom 3 Standard imaging platform with a Sony EXMOR 1/2.3” with effective pixels/photosites of 12.4 megapixels. The sensor is 6.16 mm wide and 4.62 mm high; the maximum created still image size is 4000 pixels wide by 3000 tall. The field of view is 94° with a 3.61 mm focal length, and the platform has an internal Global Positioning System (GPS) positioning system. The hover accuracy range is ±0.5 m (vertical) and ±1.5 m (horizontal).
The flight path was pre-configured by the flight-controlling commercial software Pix4Dmapper ® [71] and was performed at an altitude of 50 m above the ground surface. An average of 100 photos with an 80% overlap and sidelap was acquired in each flight [72,73]. The flight height of 50 m above the ground was selected by taking into consideration different requirements, such as narrowness, the morphological instability, and the harsh conditions (highly corrosive atmospheric environment conditions with high temperature and humidity) of the investigated area, and the presence of numerous vertical artifacts such as poles or nets. These conditions were considered to select the lowest possible Ground Sampling Distance (GSD) and consequently obtain very detailed images. GSD, generally expressed in cm/pixel, represents the distance between the centers of two consecutive pixels in the image on the ground [74]. For a given flying height H (m), the GSD is given by:
where P is the pixel size of the sensor (micro) and f is the focal length (in our case, 3.61 mm). In this study, the obtained GSD is about 2.13 cm/pixel.
The use of orthophotos with a high degree of definition allows the reconstruction of a more detailed three-dimensional model which is able to describe the ground surface in a much more detailed way. The total area covered by the reconstruction of the ground surface was 0.9 km2. Two different waypoints were used in each survey with the aim to obtain the best 3D image configuration. The flight time to complete each waypoint by drone was roughly 6 min. Figure 4 shows an example of a rectangular waypoint grid acquisition at a flight height of 50 m with the camera lens in a nadir orientation and an elliptical waypoint acquisition grid at a flight height of 50 m with oblique camera for the best definition of the vertical surface. We repeated the same waypoint for each survey.
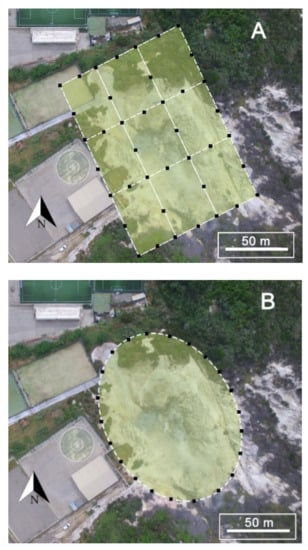
Figure 4.
Rectangular (A) and elliptical (B) waypoint acquisition grid.
The geometric accuracy of 3D models and derived DEMs also depends on the acquisition of Ground Control Points (GCPs). These GCPs are essential for geo-referencing the images and their homogenous distribution on both sides of the study area, which will influence the accuracy of the obtained point cloud [75]. In our study, nine fixed GCPs were distributed unevenly over the area for geo-referencing the reconstructed models. The surveyed areas are mostly covered by natural features that do not provide well-defined points to be used as GCPs, such as rocks and vegetation. Therefore, it was decided to put artificial points on the surface. These were mainly plastic bands with crosses in the middle and in contrasting colors. The position of these markers was measured in the WGS84/UTM (Universal Transverse Mercator)–Zone: 33N–EPSG (European Petroleum Survey Group): 25,833, with a static survey using Trimble Geo 7X GNSS (Global Navigation Satellite System), which is characterized by a horizontal accuracy of 3 mm + 0.5 ppm RMS and a vertical accuracy of 3.5 mm + 0.5 ppm RMS.
The Agisoft® Metashape software package version 1.6.4 [76] was used to process the photographs using SfM photogrammetric methods. The applied SfM image processing consists of extracting tie points from the photographs at a lower resolution, performing GNSS-assisted aerial triangulation and bundle adjustment, and generating three-dimensional point clouds and a 3D model (Figure 5).
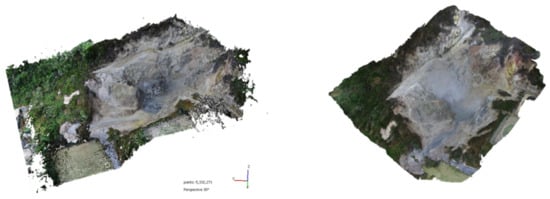
Figure 5.
Three-dimensional point clouds (left) and 3D model of Pisciarelli fumarolic field (right).
The SfM-based photogrammetric processing is designed to derive 2D orthomosaic and 3D DEMs data from a set of overlapping images acquired in several directions in order to cover the area of interest [77,78]. The parameters of the flight, imagery, and terrain reconstruction used for each survey are summarized in Table 1. The comprehensive processing required to obtain high-quality results during work sessions required 1 to 3 h with a PC-based workstation featuring a Core i9 9900 k processor, 32 GB DDR4 RAM, and Nvidia GeForce RTX 2080ti 11gb.

Table 1.
Parameters of the flight, imagery, and terrain reconstruction referred for each survey.
The image orientation was performed with normal full automation setup defaults by choosing the high-resolution option to have the maximum average number of points per photo. The obtained final value of root mean square error (RMSE), expressed in pixel units, was below 1 pixel RMSE for all the performed projections. It is important to stress that the high resolution of the orthophotos and the accuracy of the entire post photogrammetric processing allowed us to obtain accurate measurements of the fallen rock sizes and pool geometry within an accuracy range of ±2 cm. In particular, their volumes, areas, and perimeters are measured by means of an automatic tool of Agisoft Metashape software.
The software Cloud Compare [79], part of an open source project, was used to align the point cloud to correct for the incorrect georeferencing of the GCPs caused by the loss of some markers. Through the alignment toolbox, we obtained a cloud-cloud distance computation for each pairing of point clouds. The alignment procedure involves selecting the point clouds that will remain static and those which will move. After having chosen at least three constraint points (Figure 6), the Cloud Compare software makes a calculation based on a standard deviation of the displacement. After this procedure, all the raster outputs were aligned with each other. In each survey, we used nine fixed GCPs as control points and three as check points (CPs) for georeferencing the model to calculate the exterior orientation parameters of the point clouds. During the photogrammetric process, we performed manual GCPs positioning on images and then alignment optimization using the selected GCPs. Although the process of identifying GCPs is manual, it is relatively fast because their positions are predicted in all images and the user only needs to correct them. The bundle adjustment was repeated in a fixed reference system with camera self-calibration.
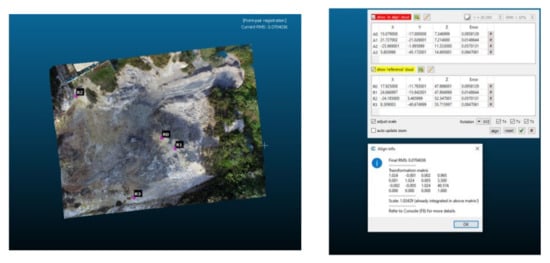
Figure 6.
Alignment procedure with the Cloud Compare software.
The time-lapse analysis of DEMs and orthophotos allowed us to detect changes in the geomorphology and topographic features in the study area. Multitemporal quantitative geomorphic changes in the fumarolic area were identified by comparing the SfM-derived point clouds in month pairs. In this way, we obtained time series of morphometric parameters of the main fumarolic vent. To aid in the interpretation of the detected geomorphic changes, we compared these with the datasets of several parameters. Meteorological data were derived from the monthly rainfall measured at the Pozzuoli rain gauge, which is part of the real-time hydrological monitoring network of the Campania Regional Agency of Civil Protection [80]. The rain gauge is located along the northern sector of the Solfatara crater rim, about 700 m away from the Pisciarelli area. Geochemical data relating to the CO2 soil fluxes were recorded since 2005 via the FLXOV3, an automatic station located in the Pisciarelli area. The CO2 flux is measured every 2 h using the accumulation chamber method [81]. Seismological data recorded by the Istituto Nazionale di Geofisica e Vulcanologia—Osservatorio Vesuviano (INGV-OV) seismic network at Campi Flegrei [82] were also used for correlation with the morphological data.
4. Results
During surveys beginning in October 2019, we performed repeated UAV surveys over the active Pisciarelli fumarolic field that allowed us to assess morphological changes. Two main types of changes occurred: rockfall events and shape variation in the main hot pool. A small rockfall occurred between November and December 2019 on the southwest slope of the fumarole field, as shown in Figure 7. This episode could have been caused by severe rainfall or (more likely) could be a result of the seismic swarms that occurred on 6 December 2019 with a main 3.1 M seismic event localized in the Pisciarelli area at 2.3 km in depth [82]. Another rockfall episode occurred between December 2019 and May 2020. In Figure 8, we show the presence of rock debris at a depth of 30–40 cm thick on the edge of the bubbling mud pool. It is not possible to exclude the possibility that a low-energy phreatic events proximal to the main fumarole vent may have caused the fall of rocky boulders from the slope surrounding the pool.
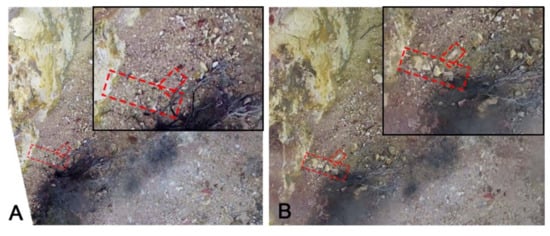
Figure 7.
Evidence of the rockfall that occurred between November (A) and December (B).
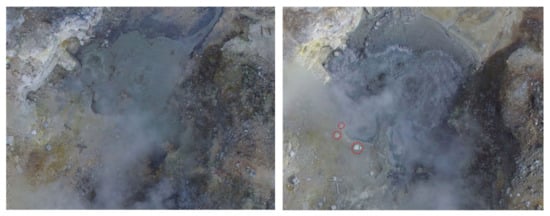
Figure 8.
The difference between December 2019 (left) and May 2020 (right) shows the presence of rocks on the ground, very close to the main fumarole vent (Soffione).
An additional aspect that we determined from the time-lapse images is the changing shape of the main bubbling mud pool over time (Table 2). In autumn—and, in general, during more intense rainfall periods—water accumulated in the shallowest topography and the bubbling mud pool appeared larger than in dry months. One of the most relevant changes was observed in the month of September 2020, when the water level of the bubbling mud pool dropped dramatically and the pool appeared completely dry. It is possible that this episode was associated with an unusual seasonal effect, such as very low rainfall (i.e., 3–10 mm during the previous six months). In Figure 9, the graphic differences in the bubbling mud pool in December 2019 versus September 2020 are shown, indicative of the wide range of morphological shapes the pool took during that year. Due to the acquisition of ortho-photos, it was possible to measure the size of the two areas (Figure 10) located in the center of the area previously occupied with water and bubbling mud.

Table 2.
Multitemporal sizes of the bubbling mud pool. The perimeter is related to a seasonal trend.
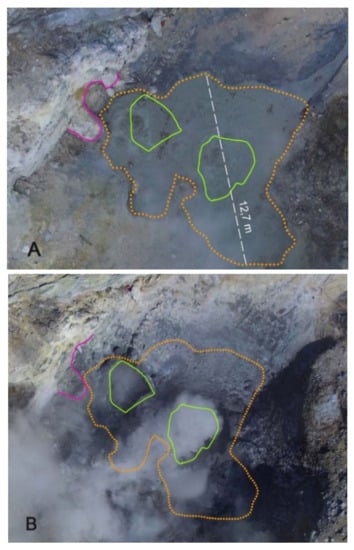
Figure 9.
Difference between the bubbling mud pool in December 2019 (A) compared with in September 2020 (B).
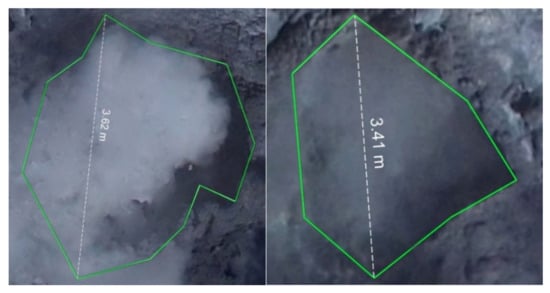
Figure 10.
Detail and size of the newly opened vents.
Multitemporal quantitative geomorphic changes in the fumarolic area were identified by comparing the SfM-derived point clouds in the following pairs: (2019) October–November, November–December, December–January (2020), January–February, February–May, May–June, June–September, and September–October (Figure 11A–I).
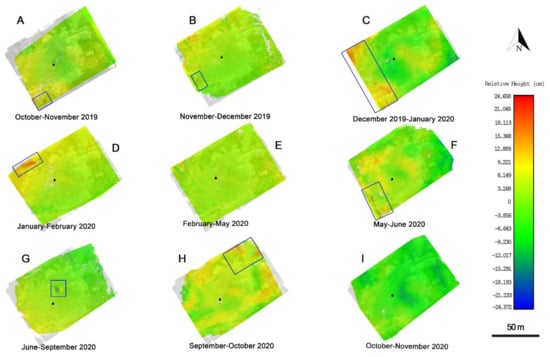
Figure 11.
Time-lapse of the relative heights (i.e., differences in height) obtained by comparing the SfM-derived point clouds in pairs. The “Soffione” main vent is indicated with a black small triangular symbol. The blue box indicates the area characterized by strong changes.
Overall, the image sequences confirm multiple episodes of rockfall and the accumulation of mud, particularly on the western side of the fumarole field. In Figure 11A, we quantify a 10–12 cm disparity visible on the western slope. This change is related to a maximum volume of 0.010 to 0.0025 m3 and is associated with the presence of rocks on the ground. In Figure 11C,D,F, the differences in height (13–20 cm) affecting the north-south west side of Pisciarelli are probably due to the accumulation of debris as a consequence of intense rainfall, which is visible in Figure 11H. In Figure 11G, the void left by the drying up of the bubbling mud pool and the accumulation of mud are clearly evident.
In other cases (Figure 11E,H), changes in volume are concentrated around the main fumarole (black triangular symbol) probably as a result of minor explosion events during intense hydrothermal activity. Through the analysis of the topographic changes detected with the time-lapse surveys compared with the obtained high-resolution orthoimages and 3D model, we identified two main landslide areas impacted by rockfall episodes at the western side of the Pisciarelli fumarole field. The limits of these two areas—respectively, 202.3 m2 and 119.7 m2 wide in November 2020—were automatically drawn with the segmentation tool of Agisoft Metashape (Figure 12). The topographic differences between the October 2019 and November 2020 surveys allowed us to evaluate the volumes of fallen materials, estimated at 78 and 22 m3 respectively (Figure 12).
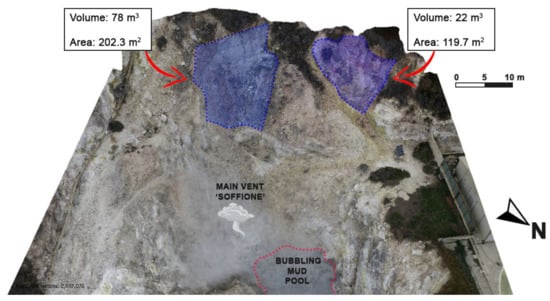
Figure 12.
The 3D model of the western side of the Pisciarelli fumarole field. During a year of survey, we identified two main landslide areas which prompted the accumulation of rocks and mud after intense rainfall or seismic events. Photo obtained by the November 2020 survey.
The draining of the bubbling mud pool, which occurred between July and August 2020, is clearly visible in Figure 13. The June and September 2020 point clouds show a void in the central part of the fumarole field and an accumulation of muddy material around the pool (10–12 cm high and a total volume of ~3 m3). Some days later, a spatter of ash deposit was observed close the eastern side of the bubbling mud pool.
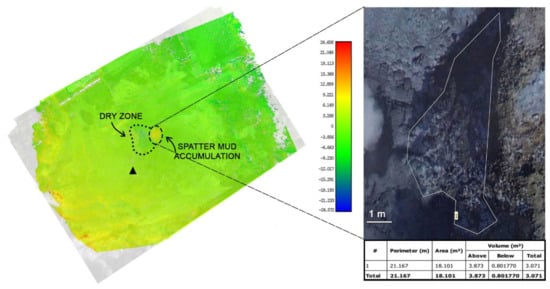
Figure 13.
June–September 2020. The bubbling mud pool appears dry and a spatter mud accumulation is present near the bubbling mud pool. The right photo is a zoomed-in image of the eastern side of the pool.
At the end of September, due to very intense rainfall (91.4 mm in 72 h), water reappeared in the bubbling mud pool (Figure 14).
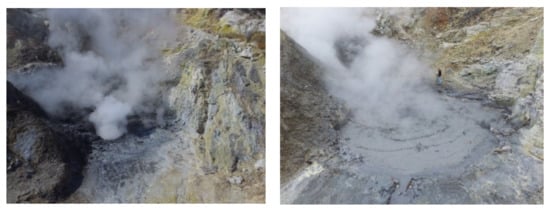
Figure 14.
A dry bubbling mud pool (left) in September 2020 compared with a saturated bubbling mud pool (right) at the beginning of October 2020.
5. Discussion and Conclusions
This is the first study using UAV-based time-lapse photogrammetry to analyze the morphological changes in Neapolitan volcanoes, specifically in the dramatically dynamic and challenging study area of the Campi Flegrei caldera and the Pisciarelli fumarole field. Analyses of the orthoimages and DEM-based volume differences allowed us to identify the morphological and topographic changes that occurred during a year of repeated, systematic survey. This study confirms the presence of instabilities on the west slope of the fumarole field, as demonstrated by the occurrence of rockfall episodes during intense rainfall or seismic swarms. This is crucial in terms of in situ monitoring, particularly for the safety of geoscientists.
Time-lapse photogrammetric data by UAV surveys also allowed us to follow the temporal evolution of the geometry of the main bubbling mud pool of Pisciarelli. The behavior of the bubbling mud pool appears in part to be correlated with rainfall rates. During warmer and drier months, we observed a decrease in the water level (and a minor size of the pool) and vice versa. This suggests that the geometry of the bubbling mud pool may be influenced by seasonal effects that are probably driven by the influx of rainwater into the system.
The macroscopic changes in the Pisciarelli area, including the overall expansion of the bubbling mud pool, can also be attributed to local hydrothermal volcanic activity. An increase in geochemical and geophysical signals, not observed prior to the onset of the unrest in 2005 and with an overall uplift of ~57 cm and ~448 seismic events, was recorded in 2018–2019 [58]. Additionally, the high pressure of fluids (CO2 and water) mobilized deeper underground is capable of altering the host rocks mechanically and/or chemically. To consider such connections, analyses of the morphology of the bubbling mud pool and other geophysical data were attempted. The parameters considered here are the CO2 fluxes, the rainfall rates, and the local seismicity. The CO2 fluxes were recorded in the Pisciarelli main vent during the period 2007–2020 (starting in 2012, the Campi Flegrei is at a “yellow” alert level in accordance with National Civil Protection, and for this reason the rate sampling of the CO2 soil flux is now weekly), in correspondence with the FLXOV3 measuring station. The monthly rainfall rates, relative to those measured during 2019 and 2020 at the meteorological station of Pozzuoli [79], are also reported in Figure 15.
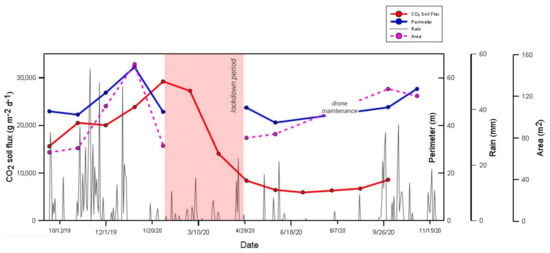
Figure 15.
Comparison between the perimeter and area of the bubbling mud pool time series, the rainfall rate, and the CO2 soil flux.
The comparison of the rainfall rate and CO2 soil flux, reported in Figure 15, shows a correlation with the geometry of the bubbling mud pool. A strong seasonal effect seems to influence the behavior of the CO2 fluxes and the expansion of the bubbling mud pool. Such a correlation could be due to a buffering and/or cumulation of the gas flowing from the geothermal system to the atmosphere in those zones. In fact, the water accumulated in the soil during the wet season could explain the low values of CO2 fluxes during the hot season.
This seasonal effect is also confirmed by the geophysical study, based on Electrical Resistiviy Tomography (ERT) time-lapse surveys applied in the same study area. Troiano and Di Giuseppe [33] demostrate the usefulness of time-lapse ERT to discern the areas dominated by seasonal effects from the ones more influenced by other, most significant endogenous contributions, linked to gas injected into the system from deep locations which cumulates in the subsoil.
The comparison between local earthquakes with the perimeter and area of the bubbling mud pool, reported in Figure 16, suggests a link between the parameters. The contribution of the seismic events seems to have an effect on the expansion of the bubbling mud pool, particularly when a seismic swarm occurs. At least in principle, the contribution of earthquakes to the observed changes in the geometry of the bubbling mud pool, such as fractures or rock alterations as a consequence of the very low depth seismic events (0.5–1 Km), cannot be excluded. Unfortunately, our data collection was interrupted by the COVID pandemic from mid-November 2020, and hence we lack data to confirm a the further expansion of the bubbling mud pool, as happened in 2019.
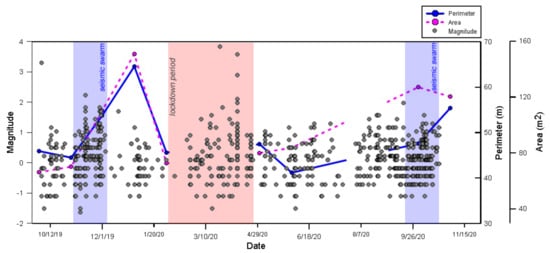
Figure 16.
Comparison between the local earthquakes as well as the perimeter and area of the bubbling mud pool as a function of time.
The results of the time-lapse analyses suggest that the observed rock mass deposits were likely caused by small, local seismic swarms in conjunction with rainfall-induced surface erosion. In this scenario, the monitoring technique described here provides useful data for hazard assessment in addition to a valid opportunity to monitor the harsh, inaccessible environment that an instable fumarole field represents. The capability to remotely monitor topographic changes, landslides, and surface mud pools is extremely important in an active volcanic area, especially during periods of unrest, which could be preludes to eruption and which are also time periods in which geoscientists are unable to collect data at close proximity. This technique, clearly, can also be of great use during and after dramatically transformative eruptions to rapidly update the DEMs of volcanic areas. This technique could additionally, however, be used for rapid, preliminary inspections during and after myriad other disasters, including earthquakes, landslides, floods, and fires.
In summary, our research confirms the usefulness of unmanned aerial vehicles for image collection and of SfM photogrammetry process for the long-/short-term investigation of single geo-hazards. These techniques can greatly reduce the bodily risks associated with fieldwork and provide exceptionally valuable, accurate, and high-resolution data to support volcanic hazard monitoring in a densely inhabited volcanic area.
Author Contributions
Conceptualization, A.F., R.S., F.M., C.T.; methodology, A.F., R.S., F.M.; validation, G.D.N., C.T.; formal analysis, A.F., R.S., F.M.; investigation A.F., R.S.; data curation, A.F., F.M., R.S., K.H.; writing—original draft preparation, A.F., R.S., F.M., K.H.; writing—review and editing, G.D.N., C.T.; supervision, G.D.N., C.T., R.S.; funding acquisition, G.D.N. All authors have read and agreed to the published version of the manuscript.
Funding
This work was supported by projects GEOGRID (funded by Campania Region), M027061 (funded by Italian Ministry of the Foreign Affairs), S4E (PON-MIUR) and by OT4CLIMA projects, funded by the Italian Ministry of Research.
Institutional Review Board Statement
Not applicable.
Informed Consent Statement
Not applicable.
Data Availability Statement
The data presented in this study are available in this article.
Acknowledgments
Authors would like to thank the Assistant Editor, Luka Bosnic and three anonymous referees for their comments and recommendations that helped to improve the manuscript.
Conflicts of Interest
The authors declare no conflict of interest.
References
- Chen, S.; Laefer, D.F.; Mangina, E. State of technology review of civilian UAVs. Recent Pat. Eng. 2016, 10, 160–174. [Google Scholar] [CrossRef]
- Colomina, I.; Molina, P. Unmanned aerial systems for photogrammetry and remote sensing: A review. ISPRS J. Photogramm. Remote Sens. 2014, 92, 79–97. [Google Scholar] [CrossRef]
- Byrne, J.; Laefer, D.F.; O’Keeffe, E. Maximizing feature detection in aerial unmanned aerial vehicle datasets. J. Appl. Remote Sens. 2017, 11, 025015. [Google Scholar] [CrossRef]
- Aguilar, W.G.; Angulo, C. Real-time video stabilization without phantom movements for micro aerial vehicles. EURASIP J. Image Video Process. 2014, 2014, 46. [Google Scholar] [CrossRef]
- Byrne, J.; O’Keeffe, E.; Lennon, D.; Laefer, D.F. 3D reconstructions using unstabilized video footage from an unmanned aerial vehicle. J. Imaging 2017, 3, 15. [Google Scholar] [CrossRef]
- Fonstad, M.A.; Dietrich, J.T.; Courville, B.C.; Jensen, J.L.; Carbonneau, P.E. Topographic structure from motion: A new development in photogrammetric measurement. Earth Surf. Process. Landf. 2013, 38, 421–430. [Google Scholar] [CrossRef]
- Westoby, M.J.; Brasington, J.; Glasser, N.F.; Hambrey, M.J.; Reynolds, J.M. ‘‘Structure-from-Motion’’ photogrammetry: A low-cost, effective tool for geoscience applications. Geomorphology 2012, 179, 300–314. [Google Scholar] [CrossRef]
- James, M.R.; Robson, S. Sequential digital elevation models of active lava flows from ground-based stereo time-lapse imagery. ISPRS J. Photogramm. Remote Sens. 2014, 97, 160–170. [Google Scholar] [CrossRef]
- Eltner, A.; Kaiser, A.; Castillo, C.; Rock, G.; Neugirg, F.; Abellán, A. Image-based surface reconstruction in geomorphometry-merits, limits and developments. Earth Surf. Dyn. 2016, 4, 359–389. [Google Scholar] [CrossRef]
- Clapuyt, F.; Vanacker, V.; Van Oost, K. Reproducibility of UAV-based earth topography reconstructions based on Structure-from-Motion algorithms. Geomorphology 2016, 260, 4–15. [Google Scholar] [CrossRef]
- Tonkin, T.N.; Midgley, N.G.; Graham, D.J.; Labadz, J.C. The potential of small unmanned aircraft systems and structure-from-motion for topographic surveys: A test of emerging integrated approaches at Cwm Idwal, North Wales. Geomorphology 2014, 226, 35–43. [Google Scholar] [CrossRef]
- Hackney, C.; Clayton, A. Unmanned Aerial Vehicles (UAVs) and their application in geomorphic mapping. Geomorphological Techniques. Br. Soc. Geomporl. 2015. [Google Scholar]
- Lucieer, V.; Hill, N.A.; Barrett, N.S.; Nichol, S. Do marine substrates ‘look’ and ‘sound’ the same? Supervised classification of multi beam acoustic data using autonomous underwater vehicle images. Estuar. Coast. Shelf Sci. 2013, 117, 94–106. [Google Scholar] [CrossRef]
- Eltner, A.; Schneider, D. Analysis of different methods for 3D reconstruction of natural surfaces from parallel-axes UAV images. Photogramm. Rec. 2015, 30, 279–299. [Google Scholar] [CrossRef]
- Smith, M.W.; Vericat, D. From experimental plots to experimental landscapes: Topography, erosion and deposition in sub-humid badlands from structure-from-motion photogrammetry. Earth Surf. Process. Landf. 2015, 40, 1656–1671. [Google Scholar] [CrossRef]
- Wheaton, J.M.; Brasington, J.; Darby, S.E.; Sear, D.A. Accounting for uncertainty in DEMs from repeat topographic surveys: Improved sediment budgets. Earth Surf. Process. Landf. J. Br. Geomorphol. Res. Group 2010, 35, 136–156. [Google Scholar] [CrossRef]
- Major, J.J.; Dzurisin, D.; Schilling, S.P.; Poland, M.P. Monitoring lava-dome growth during the 2004–2008 Mount St. Helens, Washington, eruption using oblique terrestrial photography. Earth Planet. Sci. Lett. 2009, 286, 243–254. [Google Scholar] [CrossRef]
- Salzer, J.T.; Thelen, W.A.; James, M.R.; Walter, T.R.; Moran, S.; Denlinger, R. Volcano dome dynamics at Mount St. Helens: Deformation and intermittent subsidence monitored by seismicity and camera imagery pixel offsets. J. Geophys. ResSol. Earth 2016, 121, 7882–7902. [Google Scholar] [CrossRef]
- Zorn, E.U.; Walter, T.R.; Johnson, J.B.; Mania, R. UAS-based tracking of the Santiaguito Lava Dome, Guatemala. Sci. Rep. UK 2020, 10, 1–13. [Google Scholar] [CrossRef]
- Andaru, R.; Rau, J.-Y. Lava dome changes detection at Agung mountain during high level of volcanic activity using uav photogrammetry. Int. Arch. Photogramm. Remote Sen. Spat. Inf. Sci. ISPRS Arch. 2019, 42, 173–179. [Google Scholar] [CrossRef]
- Darmawan, H.; Walter, T.R.; Brotopuspito, K.S.; Subandriyo, I.; Nandaka, G.M.A. Morphological and structural changes at the Merapi lava dome monitored in 2012–15 using unmanned aerial vehicles (UAVs). J. Volcanol. Geotherm. Res. 2018, 349, 256–267. [Google Scholar] [CrossRef]
- Dering, G.M.; Micklethwaite, S.; Thiele, S.T.; Vollgger, S.A.; Cruden, A.R. Review of drones, photogrammetry and emerging sensor technology for the study of dykes: Best practices and future potential. J. Volcanol. Geotherm. Res. 2019, 373, 148–166. [Google Scholar] [CrossRef]
- Nakano, T.; Kamiya, I.; Tobita, M.; Iwahashi, J.; Nakajima, H. Landform monitoring in active volcano by UAV and SFM-MVS technique. Int. Arch. Photogramm. Remote Sen. Spat. Inf. Sci. ISPRS Arch. 2014, 40, 71–75. [Google Scholar] [CrossRef]
- Favalli, M.; Fornaciai, A.; Nannipieri, L.; Harris, A.; Calvari, S.; Lormand, C. UAV-based remote sensing surveys of lava flow fields: A case study from Etna’s 1974 channel-fed lava flows. Bull. Volcanol. 2018, 80, 29. [Google Scholar] [CrossRef]
- Bonali, F.L.; Tibaldi, A.; Marchese, F.; Fallati, L.; Russo, E.; Corselli, C.; Savini, A. UAV-based surveying in volcano-tectonics: An example from the Iceland rift. J. Struct. Geol. 2019, 121, 46–64. [Google Scholar] [CrossRef]
- Walter, T.R.; Jousset, P.; Allahbakhshi, M.; Witt, T.; Gudmundsson, M.T.; Hersir, G.P. Underwater and drone based photogrammetry reveals structural control at Geysir geothermal field in Iceland. J. Volcanol. Geotherm. Res. 2020, 391, 106282. [Google Scholar] [CrossRef]
- Chio, S.-H.; Lin, C.-H. Preliminary study of UAS equipped with thermal camera for volcanic geothermal monitoring in Taiwan. Sensors 2017, 17, 1649. [Google Scholar] [CrossRef]
- Gomez, C.; Kennedy, B. Capturing volcanic plumes in 3D with UAV-based photogrammetry at Yasur Volcano–Vanuatu. J. Volcanol. Geotherm. Res. 2018, 350, 84–88. [Google Scholar] [CrossRef]
- McGonigle, A.J.S.; Aiuppa, A.; Giudice, G.; Tamburello, G.; Hodson, A.J.; Gurrieri, S. Unmanned aerial vehicle measurements of volcanic carbon dioxide fluxes. Geophys. Res. Lett. 2008, 35, L06303. [Google Scholar] [CrossRef]
- Diaz, J.A.; Pieri, D.; Wright, K.; Sorensen, P.; Kline-Shoder, R.; Arkin, C.R.; Fladeland, M.; Bland, G.; Buongiorno, M.F.; Ramirez, C.; et al. Unmanned aerial mass spectrometer systems for in-situ volcanic plume analysis. J. Am. Soc. Mass. Spectr. 2015, 26, 292–304. [Google Scholar] [CrossRef]
- Rüdiger, J.; Tirpitz, J.-L.; Maarten De Moor, J.; Bobrowski, N.; Gutmann, A.; Liuzzo, M.; Ibarra, M.; Hoffmann, T. Implementation of electrochemical, optical and denuder-based sensors and sampling techniques on UAV for volcanic gas measurements: Examples from Masaya, Turrialba and Stromboli volcanoes. Atmos. Meas. Tech. 2018, 11, 2441–2457. [Google Scholar] [CrossRef]
- Walter, T.R.; Legrand, D.; Granados, H.D.; Reyes, G.; Arámbula, R. Volcanic eruption monitoring by thermal image correlation: Pixel offsets show episodic dome growth of the Colima volcano. J. Geophys. Res. Solid Earth 2013, 118, 1408–1419. [Google Scholar] [CrossRef]
- Di Giuseppe, M.G.; Troiano, A. Monitoring active fumaroles through time-lapse electrical resistivity tomograms: An application to the Pisciarelli fumarolic field (Campi Flegrei, Italy). J. Volcanol. Geotherm. Res. 2019, 375, 32–42. [Google Scholar] [CrossRef]
- De Beni, E.; Cantarero, M.; Messina, A. UAVs for volcano monitoring: A new approach applied on an active lava flow on Mt. Etna (Italy), during the 27 February–02 March 2017 eruption. J. Volcanol. Geotherm. Res. 2019, 369, 250–262. [Google Scholar] [CrossRef]
- Esposito, G.; Salvini, R.; Matano, F.; Sacchi, M.; Danzi, M.; Somma, R.; Troise, C. Multitemporal monitoring of a coastal landslide through SfM-derived point cloud comparison. Photogramm. Rec. 2017, 32, 459–479. [Google Scholar] [CrossRef]
- Esposito, G.; Salvini, R.; Matano, F.; Sacchi, M.; Troise, C. Evaluation of geomorphic changes and retreat rates of a coastal pyroclastic cliff in the Campi Flegrei volcanic district, southern Italy. J. Coast. Conserv. 2018, 22, 957–972. [Google Scholar] [CrossRef]
- Rosi, M.; Sbrana, A. The phlegraean fields. Quadric Sci. 1987, 9, 1–175. [Google Scholar]
- De Vivo, B.; Rolandi, G.; Gans, P.B.; Calvert, A.; Bohrson, W.A.; Spera, F.J.; Belkin, H.E. New constraints on the pyroclastic eruptive history of the Campanian volcanic Plain (Italy). Miner. Petrol. 2001, 73, 47–65. [Google Scholar] [CrossRef]
- Deino, A.L.; Orsi, G.; de Vita, S.; Piochi, M. The age of the Neapolitan Yellow Tuff caldera-forming eruption (Campi Flegrei caldera–Italy) assessed by 40Ar/39Ar dating method. J. Volcanol. Geotherm. Res. 2004, 133, 157–170. [Google Scholar] [CrossRef]
- De Natale, G.; Troise, C.; Mark, D.; Mormone, A.; Piochi, M.; Di Vito, M.A.; Isaia, R.; Carlino, S.; Barra, D.; Somma, R. The Campi Flegrei Deep Drilling Project (CFDDP): New insight on caldera structure, evolution and hazard implications for the Naples area (Southern Italy). Geochem. Geophys. Geosyst. 2016, 17, 4836–4847. [Google Scholar] [CrossRef]
- De Natale, G.; Troise, C.; Kilburn, C.R.J.; Somma, R.; Moretti, R. Understanding volcanic hazard at the most populated caldera in the world: Campi Flegrei, Southern Italy. Geochem. Geophys. Geosyst. 2017, 18, 2004–2008. [Google Scholar] [CrossRef]
- Rolandi, G.; Bellucci, F.; Heizler, M.T.; Belkin, H.E.; De Vivo, B. Tectonic controls on the genesis of ignimbrites from the Campanian Volcanic Zone, southern Italy. Miner. Petrol. 2003, 79, 3–31. [Google Scholar] [CrossRef]
- Troise, C.; De Natale, G.; Schiavone, R.; Somma, R.; Moretti, R. The Campi Flegrei caldera unrest: Discriminating magma intrusions from hydrothermal effects and implications for possible evolution. Earth Sci. Rev. 2019, 188, 108–122. [Google Scholar] [CrossRef]
- Orsi, G.; Di Vito, M.; Isaia, R. Volcanic hazard assessment at the restless Campi Flegrei caldera. B Volcanol. 2004, 66, 514–530. [Google Scholar] [CrossRef]
- Smith, V.C.; Isaia, R.; Pearce, N.J.G. Tephrostratigraphy and glass compositions of post-15 kyr Campi Flegrei eruptions: Implications for eruption history and chronostratigraphic markers. Quat. Sci. Rev. 2011, 30, 3638–3660. [Google Scholar] [CrossRef]
- Di Vito, M.A.; Isaia, R.; Orsi, G.; Southon, G.; de Vita, S.; D’Antonio, M.; Pappalardo, L.; Piochi, M. Volcanism and deformation since 12,000 years at the Campi Flegrei caldera (Italy). J. Volcanol. Geotherm. Res. 1999, 91, 221–246. [Google Scholar] [CrossRef]
- Di Vito, M.A.; Lirer, L.; Mastrolorenzo, G.; Rolandi, G. The Monte Nuovo eruption (Campi Flegrei, Italy). B Volcanol. 1987, 49, 608–615. [Google Scholar] [CrossRef]
- Di Vito, M.A.; Acocella, V.; Aiello, G.; Barra, D.; Battaglia, M.; Carandente, A.; Del Gaudio, C.; de Vita, S.; Ricciardi, G.P.; Ricco, C.; et al. Magma transfer at Campi Flegrei caldera (Italy) before the 1538 AD eruption. Sci. Rep. 2016, 6, 32245. [Google Scholar] [CrossRef]
- Dvorak, J.J.; Mastrolorenzo, G. The mechanisms of recent vertical crustal movements in Campi Flegrei caldera, Southern Italy. Geol. Soc. Am. 1991, 263, 1–47, (Special paper). [Google Scholar]
- Iuliano, S.; Matano, F.; Caccavale, M.; Sacchi, M. Annual rates of ground deformation (1993–2010) at Campi Flegrei, Italy, revealed by Persistent Scatterer Pair (PSP)—SAR Interferometry. Int. J. Remote Sens. 2015, 36, 6160–6191. [Google Scholar] [CrossRef]
- INGV-Osservatorio Vesuviano. Available online: https://www.ov.ingv.it/ov/bollettini-mensilicampania/Bollettino_Mensile_Campi_Flegrei_2020_09.pdf (accessed on 3 September 2020).
- De Vita, S.; Orsi, G.; Civetta, L.; Carandente, A.; D’Antonio, M.; Deino, A.; Di Cesare, T.; Di Vito, M.A.; Fisher, R.V.; Isaia, R.; et al. The Agnano-Monte Spina eruption (4100 years BP) in the restless Campi Flegrei caldera (Italy). J. Volcanol. Geotherm. Res. 1999, 91, 269–301. [Google Scholar] [CrossRef]
- Isaia, R.; Vitale, S.; Di Giuseppe, M.G.; Iannuzzi, E.; Tramparulo, F.D.; Troiano, A. Stratigraphy, structure, and volcano-tectonic evolution of solfatara maar-diatreme (Campi Flegrei, Italy). Geol. Soc. Am. Bull. 2015, 127, 1485–1504. [Google Scholar] [CrossRef]
- Rolandi, G.; De Natale, G.; Kilburn, C.R.; Troise, C.; Somma, R.; Di Lascio, M.; Fedele, A.; Rolandi, R. The 39 ka Campanian Ignimbrite Eruption: New Data on Source Area in the Campanian Plain. In Vesuvius, Campi Flegrei, and Campanian Volcanism; Elsevier: Amsterdam, The Netherland, 2020; pp. 175–205. [Google Scholar]
- Pedone, M.; Granieri, D.; Moretti, D.; Fedele, A.; Troise, C.; Somma, R.; De Natale, G. Improved quantification CO2 emission at Campi Flegrei by combined Lagarngian Stochastic and Eulerian dispersion modelling. Using an enhanced dispersion modelling approach. Atmos. Environ. 2017, 170, 1–11. [Google Scholar] [CrossRef]
- Gresse, M.; Vandemeulebrouck, J.; Byrdina, S.; Chiodini, G.; Revil, A.; Johnson, T.C.; Ricci, T.; Vilardo, G.; Mangiacapra, A.; Lebourg, T.; et al. Three-dimensional electrical resistivity tomography of the Solfatara crater (Italy): Implication for the multiphase flow structure of the shallow hydrothermal system. J. Geophys. Res. Solid Earth 2017, 122, 8749–8768. [Google Scholar] [CrossRef]
- Zollo, A.; Maercklin, N.; Vassallo, M.; Dello Iacono, D.; Virieux, J.; Gasparini, P. Seismic reflections reveal a massive melt layer feeding Campi Flegrei caldera. Geophys. Res. Lett. 2008, 35. [Google Scholar] [CrossRef]
- Tamburello, G.; Caliro, S.; Chiodini, G.; De Martino, P.; Avino, R.; Minopoli, C.; Bitetto, M. Escalating CO2 degassing at the Pisciarelli fumarolic system, and implications for the ongoing Campi Flegrei unrest. J. Volcanol. Geotherm. Res. 2019, 384, 151–157. [Google Scholar] [CrossRef]
- Chiodini, G.; Avino, R.; Caliro, S.; Minopoli, C. Temperature and pressure gas geoindicators at the Solfatara fumaroles (Campi Flegrei). Ann. Geophys. 2011, 54. [Google Scholar] [CrossRef]
- Bodnar, R.; Cannatelli, C.; De Vivo, B.; Lima, A.; Belkin, H.E.; Milia, A. Quantitative model for magma degassing and ground deformation (bradyseism) at CampiFlegrei, Italy: Implications for future eruptions. Geology. 2007, 35, 791–794. [Google Scholar] [CrossRef]
- Fedele, A.; Pedone, M.; Moretti, R.; Wiersberg, T.; Somma, R.; Troise, C.; De Natale, G. Real-time quadrupole mass spectrometry of hydrothermal gases from the unstable Pisciarelli fumaroles (Campi Flegrei): Trends, challenges and processes. Int. J. Mass. Spectrom. 2017, 415, 44–54. [Google Scholar] [CrossRef]
- INGV-Osservatorio Vesuviano. Available online: http://www.ov.ingv.it/ov/bollettini-mensilicampania/Bollettino_Mensile_Campi_Flegrei_2020_08 (accessed on 10 September 2020).
- Pistolesi, M.; Isaia, R.; Marianelli, P.; Bertagnini, A.; Fourmentraux, C.; Albert, P.G.; Tomlinson, E.L.; Menzies, M.A.; Rosi, M.; Sbrana, A. Simultaneous eruptionsfrom multiple vents at Campi Flegrei (Italy) highlight new eruption processesat calderas. Geology 2016, 44, 487–490. [Google Scholar] [CrossRef]
- Chiodini, G.; Vandemeulebrouck, J.; Caliro, S.; D’Auria, L.; De Martino, P.; Mangiacapra, A.; Petrillo, Z. Evidence of thermal-driven processes triggering the2005–2014 unrest at Campi Flegrei caldera. Earth Planet. Sci. Lett. 2015, 414, 58–67. [Google Scholar] [CrossRef]
- INGV-Osservatorio, Vesuviano’s Bulletins 2017. Available online: http://www.ov.ingv.it/ov/it/bollettini/275.html (accessed on 10 September 2020).
- D’Auria, L.; Giudicepietro, F.; Aquino, I.; Borriello, G.; Del Gaudio, C.; Lo Bascio, D.; Martini, M.; Ricciardi, G.P.; Ricciolino, P.; Ricco, C. Repeated fluid-transfer episodes as a mechanism for the recent dynamics of Campi Flegrei caldera (1989–2010). Geophys. Res. Lett. 2011, 116, B04313. [Google Scholar] [CrossRef]
- Troiano, A.; Di Giuseppe, M.G.; Patella, D.; Troise, C.; De Natale, G. Electromagnetic outline of the Solfatara-Pisciarelli hydrothermal system, Campi Flegrei (southern Italy). J. Volcanol. Geotherm. Res. 2014, 277, 9–21. [Google Scholar] [CrossRef]
- Piochi, M.; Mormone, A.; Balassone, G.; Strauss, H.; Troise, C.; De Natale, G. Native sulfur, sulfates and sulfides from the active Campi Flegrei volcano (southern Italy): Genetic environments and degassing dynamics revealed by mineralogy and isotope geochemistry. J. Volcanol. Geotherm. Res. 2015, 304, 180–193. [Google Scholar] [CrossRef]
- Vilardo, G.; Sansivero, F.; Chiodini, G. Long-term TIR imagery processing for spatiotemporal monitoring of surface thermal features in volcanic environment: A case study in the Campi Flegrei (Southern Italy). J. Geophys. Res. Solid Earth 2015, 120, 812–826. [Google Scholar] [CrossRef]
- Giudicepietro, F.; Chiodini, G.; Caliro, S.; De Cesare, W.; Esposito, A.M.; Galluzzo, D.; Lo Bascio, D.; Macedonio, G.; Orazi, M.; Ricciolino, P.; et al. Insight into Campi Flegrei caldera unrest through seismic tremor measurements at Pisciarelli fumarolic field. Geochem. Geophys. Geosyst. 2019, 20, 5544–5555. [Google Scholar] [CrossRef]
- Pix4D. Pix4Dmapper 3.2 User Manual; Pix4D SA: Lausanne, Switzerland, 2017. [Google Scholar]
- Pepe, M.; Fregonese, L.; Scaioni, M. Planning airborne photogrammetry and remote-sensing missions with modern platforms and sensors. Eur. J. Remote Sens. 2018, 51, 412–436. [Google Scholar] [CrossRef]
- Zhang, Y.; Xiong, J.; Hao, L. Photogrammetric processing of low-altitude images acquired by unpiloted aerial vehicles. Photogramm. Rec. 2011, 26, 190–211. [Google Scholar] [CrossRef]
- Gonçalves, J.A.; Henriques, R. UAV photogrammetry for topographic monitoring of coastal areas. ISPRS J. Photogramm. 2015, 104, 101–111. [Google Scholar] [CrossRef]
- Antoine, R.; Lopez, T.; Tanguy, M.; Lissak, C.; Gailler, L.; Labazuy, P.; Fauchard, C. Geoscientists in the Sky: Unmanned Aerial Vehicles Responding to Geohazards. Surv. Geophys. 2020, 41, 1285–1321. [Google Scholar] [CrossRef]
- Agisoft LLC 11 Degtyarniy per., St. Petersburg, Russia 191144. Available online: https://www.agisoft.com/about/ (accessed on 30 December 2020).
- Jiang, S.; Jiang, C.; Jiang, W. Efficient structure from motion for large-scale UAV images: A review and a comparison of SfM tools. ISPRS J. Photogramm. Remote Sens. 2020, 167, 230–251. [Google Scholar] [CrossRef]
- Pepe, M.; Costantino, D. Techniques, Tools, Platforms and Algorithms in Close Range Photogrammetry in Building 3D Model and 2D Representation of Objects and Complex Architectures. Comput. Aided Des. Appl. 2020, 18, 42–65. [Google Scholar] [CrossRef]
- CloudCompare. Available online: http://www.danielgm.net/cc/ (accessed on 23 April 2015).
- Centro Funzionale Regione Campania. Available online: http://centrofunzionale.regione.campania.it (accessed on 14 October 2020).
- Chiodini, G.; Caliro, S.; Cardellini, C.; Granieri, D.; Avino, R.; Baldini, A.; Minopoli, C. Long-term variations of the Campi Flegrei, Italy, volcanic system as revealed by the monitoring of hydrothermal activity. J. Geophys. Res. Solid Earth 2010, 115. [Google Scholar] [CrossRef]
- INGV-Osservatorio Vesuviano. Available online: http://sismolab.ov.ingv.it/sismo/index.php?PAGE=SISMO/last&area=Flegrei (accessed on 14 October 2020).
Publisher’s Note: MDPI stays neutral with regard to jurisdictional claims in published maps and institutional affiliations. |
© 2020 by the authors. Licensee MDPI, Basel, Switzerland. This article is an open access article distributed under the terms and conditions of the Creative Commons Attribution (CC BY) license (http://creativecommons.org/licenses/by/4.0/).