Article

Evaluation of Gridded Precipitation Datasets in Malaysia

1
Department of Earth Sciences and Environment, Faculty of Science and Technology, Universiti Kebangsaan Malaysia, Bangi 43600, Selangor, Malaysia
2
Geography Section, School of Humanities, Universiti Sains Malaysia, Penang 11800, Malaysia
3
Institut Oseanografi dan Sekitaran (INOS), Universiti Malaysia Terengganu, Kuala Nerus 21030, Terengganu, Malaysia
*
Author to whom correspondence should be addressed.
Remote Sens. 2020, 12(4), 613; https://doi.org/10.3390/rs12040613
Submission received: 17 December 2019 / Revised: 7 February 2020 / Accepted: 8 February 2020 / Published: 12 February 2020
(This article belongs to the Special Issue Satellite Remote Sensing for Tropical Meteorology and Climatology)

Abstract

:
This study compares five readily available gridded precipitation satellite products namely: Climate Hazards Group Infrared Precipitation with Station Data (CHIRPS) at 0.05° and 0.25° resolution, Tropical Rainfall Measuring Mission Multi-Satellite Precipitation Analysis (TMPA 3B42v7) and Princeton Global Forcings (PGFv3), both at 0.25°, and Global Satellite Mapping of Precipitation Reanalysis (GSMaP_RNL) at 0.1°, and evaluates their quality and reliability against 41 rain gauge stations in Malaysia. The evaluation was based on three numerical statistical scores (r, Root Mean Squared Error (RMSE) and Bias) and three categorical scores (Probability of Detection (POD), False Alarm Ratio (FAR) and Critical Success Index (CSI)) at temporal resolutions of daily, monthly and seasonal. The results showed that TMPA 3B42v7, PGFv3, CHIRPS25 and CHIRPS05 slightly overestimated the rain gauge data, while the GSMaP_RNL underestimated the value with the largest bias for monthly data. The CHIRPS25 showed the best POD score, while TMPA 3B42v7 scored highest for FAR and CSI. Overall, TMPA 3B42v7 was found to be the best-performing dataset, while PGFv3 registered the worst performance for both for numerical (monthly) and categorical (daily) scores. All products captured the intensity of heavy rainfall (20–50 mm/day) rather well, but tended to underestimate the intensity for categories of no or little rain (rain <1 mm/day) and extremely heavy rain (rain >50 mm/day). In addition, overestimation occurred for low moderate (2–5 mm/day) to low heavy rain and (10–20 mm/day). In the case study of the extreme flooding event of 2006/2007 in the southern area of Peninsular Malaysia, TMPA 3B42v7 and GSMaP_RNL performed well in capturing most heavy rainfall events but tended to overestimate light rainfalls, consistent with their performance for the occurrence intensity of rainfall at different intensity level.

Graphical Abstract

1. Introduction

Generally, in most countries, especially the least developed and developing ones, the number of meteorological stations is limited and sparsely distributed. In mountainous and inaccessible areas, there is likely no meteorological station available. Hence, this can be a problem for various applications including validation of weather and climate simulations [1]. Most applications resort to gridded data derived from satellite products. Since the 1970s, due to their wide spatial and long temporal coverage, satellite-gridded precipitation datasets have been widely used in climate studies [2,3]. However, the readily available satellite-based precipitation datasets can have differences in quality, reliability, resolution and spatial-temporal coverage. The quality and reliability of these products can also be influenced by the onboard sensors and algorithms used for rainfall conversion [4]. For satellite and rain gauge blended datasets, the quality can also be dependent on rain gauge observations and interpolation techniques used to produce the gridded products. Hence, the pre-evaluation of these products prior to application, particularly for climate model evaluation, is necessary [5,6].
In Malaysia, despite the availability of various satellite or blended gridded-precipitation data, evaluation studies thus far are incomplete and limited to a few products. Six products have been evaluated including the Tropical Rainfall Measuring Mission (TRMM) [4,7], the Global Precipitation Measurement (GPM) [2], the Global Precipitation Climatology Project (GPCP) [8], the Precipitation Estimation from Remotely Sensed Information Using Artificial Neural Network (PERSIANN) [9], the Climate Prediction Center Morphing Technique (CMORPH) [10] and the Asian Precipitation-Highly Resolved Observational Data Integration Towards Evaluation (APHRODITE) [11]. Among these products, TRMM has been shown to have the best quality where it has the smallest biases and highest correlation when compared with rain gauge observation [12,13,14]. Other products such APHRODITE, CMORPH and GPM have also been considered as good product in some studies [14,15]. However, for extreme rainfalls Soo et al. [16] found that at basin scale in northeast Peninsular Malaysia, both TRMM and CMORPH showed better quality. In addition, Tan et al. [15] also showed good performance of TRMM and GPM in approximating extreme rainfalls. Nevertheless, because of its finer resolution (0.1°) and data availability in 30 minutes, GPM could be a better choice for investigation of extreme rainfall during flood events in Malaysia. Overall, the findings of these studies suggested that TRMM and GPM were considered as the most reliable and accurate gridded precipitation data over Malaysia. However, due to its long temporal coverage, TRMM has the advantage over GPM for most applications especially in climate model evaluation.
The reliability of a dataset is also dependent on the temporal resolutions and seasons. Studies found that most products performed well in approximating the annual and monthly rainfall, but less well in the daily values [14,16]. In addition, the performance was also dependent on the amount of rainfall and tended to be better during seasons with high rainfall. In Malaysia, rainfall amount tends to peak during the winter monsoon (locally known as northeast monsoon) although spatial variation is also featured [17]. Hence, the performance of the products can be dependent on location, where better performance is indicated over the eastern and southern parts of Peninsular Malaysia during the northeast monsoon, because of the higher amount of rainfall received in these areas [12,14].
A number of other products including the Climate Hazards Group Infrared with station data (CHIRPS) [18], Princeton Global Forcings (PGF) [19] and Global Satellite Mapping of Precipitation (GSMaP) [20] have yet to be evaluated for their quality and reliability over Malaysia. In many places around the world these data products have been investigated thoroughly. CHIRPS, which has the highest spatial resolution of 5 km, has been evaluated in various countries including Ethiopia [21,22], China [23], Brazil [24], Venezuela [25], Italy [26], Vietnam [27] and Indonesia [28]. CHIRPS exhibited a good performance in southern China during the warm season [23], and the performance was less affected by elevation variation at the Upper Blue Nile Basin in Ethiopia [22]. CHIRPS also approximated well the rain gauge data and its spatial pattern in the south-southeast region of Minas Gerais State, Brazil, although TRMM was of relatively better quality and reliability [24]. CHIRPS has also been used for extreme indices including drought and flood monitoring in the Lower Mekong Basin [27], South Sulawesi, Indonesia [28] and the Haihe River Basin, China [29]. Both the GSMaP and PGF have also been evaluated in some areas around the globe. In the Haihe River Basin, GSMaP showed good agreement with rain gauge measurements [30]. In the Karpuz River Basin, Turkey, GSMaP was shown to have reasonable performance in approximating the observation although it has a tendency to underestimate extreme rainfall during flash floods [31]. However, a study in Singapore found GSMaP has higher uncertainty than TRMM for sub-daily precipitation [32]. In addition, a study carried out in Adige Basin, Italy found that PGFv3 performance was less reliable compared to CHIRPS and TRMM [26].
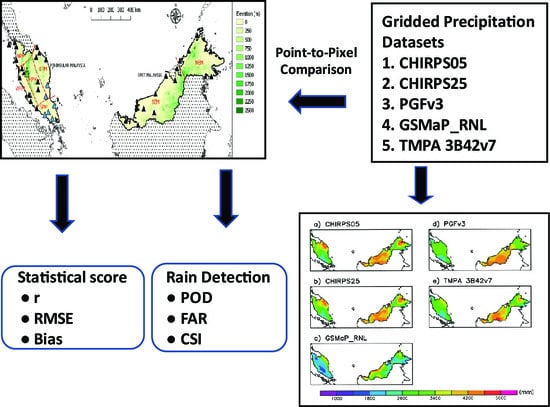
This paper focuses on evaluating the quality and reliability of three gridded precipitation products that have yet to be validated over Malaysia namely CHIRPS, GSMaP and PGFv3 by comparing the gridded data to rain gauge observation data. For comparison, TMPA 3B42v7 will also be included. The evaluation analyses consider spatial as well as temporal variations and possible factors that may contribute to the performances of the products.

2. Study Area and Datasets

2.1. Study Area and Its Climatology

Malaysia lies approximately in the center of Southeast Asia, bounded from 1°N to 8°N and 99°E to 120°E. Malaysia consists of two parts: Peninsular Malaysia, which is part of the Asian landmass protruding southward and located between Thailand in the north and Singapore in the south, and East Malaysia, which is part of northern Borneo consisting of Sabah and Sarawak states (Figure 1). Malaysia’s climate is characterized by a hot and humid tropical climate with a pronounced rainfall seasonality modulated by the Asian-Australian monsoon [17]. The wet season occurs during the northeast monsoon (December to February, DJF) while the dry season prevails during the southwest monsoon (June to August, JJA). In between these two pronounced seasons are the inter-monsoon periods of March–April–May (MAM) and September–October–November (SON) [33]. Influenced by various factors (e.g., topography, synoptic circulations and the Inter-Tropical Convergence Zone (ITCZ) migration), the rainfall distribution among these seasons can have pronounced differences [34]. For example, the annual rainfall cycles of stations on the west coast of Peninsular Malaysia have two maxima during MAM and SON that coincide with inter-monsoon periods [34]. The minimum rainfall during the JJA period and lower rainfall during DJF are associated with the blocking effects of the Barisan mountain over Sumatra and the Titiwangsa mountain over Peninsular Malaysia, respectively. On the east coast of Peninsular Malaysia, rainfall peaks during DJF to coincide with the cold surges and Borneo vortex [35]. Due to multiple interactions of various factors (cold surges, Borneo vortex and Madden-Julian Oscillations), extreme precipitation events that can lead to major floods can occur during DJF on the east coast of Peninsular Malaysia [33]. One example was the flood event that occurred in southern Peninsular Malaysia during the 2006/2007 rainy season, with reported economic losses of around USD 500 million, 16 deaths and 200,000 victims [33]. Equally, the flood that occurred in December 2014 in northeast Peninsular Malaysia was caused by strong cold surges [36]. Over northern Borneo, the annual rainfall cycle is partly influenced by the tails of typhoons passing the Philippines. Over Sarawak and Sabah, far fewer meteorological stations are available compared to those of Peninsular Malaysia; hence, the use of rainfall-gridded products to validate climate models over this region is necessary.

2.2. Rain Gauge Dataset

In this study, observed daily rainfall datasets were obtained from rain gauge stations of the Malaysia Meteorological Department (MMD). A period from 2008 to 2012 was chosen because the number of stations with complete data was maximum. According to the World Meteorological Organization (WMO)’s Guide to Climatological Practices, the period of five years is considered sufficient to carry out this kind of study [37]. This constitutes a total of 41 rain gauge stations of which 28 stations were in Peninsular Malaysia and 13 were in Borneo (Figure 1). The daily rainfall amount represents the 24 h accumulation for a period beginning at 0800 local time [38]. Peninsular Malaysia was sub-divided into five different sub-regions: northern Peninsular Malaysia (NPM), eastern Peninsular Malaysia (EPM), middle Peninsular Malaysia (MPM), western Peninsular Malaysia (WPM) and southern Peninsular Malaysia (SPM). Meanwhile, East Malaysia consists of two sub-regions: northern East Malaysia (NEM) and southern East Malaysia (SEM) (Figure 1) [12,13,14]. The latitude-longitude coordinates and elevations of these stations are provided in Table A1. Stations situated within a sub-region are taken as representative of rain gauge observations of that particular sub-region.

2.3. Gridded Rainfall Products

Five gridded products were evaluated in this study including CHIRPS at 0.25° and 0.05°, GSMaP_RNL at 0.1°, PGF version 3 and TRMM Multi-Satellite Precipitation Analysis (TMPA) 3B42v7 at 0.25° (Table 1). While the TMPA 3B42v7 has been evaluated previously and considered to be the best product [14], the other three products have yet to be analyzed. Hence, the performance of the three gridded products can be compared with TMPA 3B42v7.
CHIRPS is a dataset of daily, pentadal and monthly precipitation climatology (CHPclim) blended from multiple sources including rain gauge data of various sources, such as the Cold Cloud Duration (CCD)-based precipitation on thermal infrared (IR) data archived in the NOAA National Climate Data Center (NCDC), Version 7 TRMM 3B42 data and the Version 2 atmospheric model rainfall field of the NOAA Climate Forecast System (CFS) (Table 1) [18] (ftp://ftp.chg.ucsb.edu/pub/org/chg/products/CHIRPS-2.0). CHIRPS products are available in 0.05° and 0.25° horizontal resolutions covering a period spanning from 1981 until present. In this study, we denote CHIRPS05 and CHIRPS25 as products at 0.05° and 0.25° resolution, respectively.
GSMaP is a purely satellite-based rainfall dataset derived from the thermal IR and microwave radiometer (TIR-MWR) to produce hourly data products that cover the globe from 60°N to 60°S at 0.1° resolution [39]. The associated sensors include SSMI (Special Sensor Microwave/Imager) by the Defense Meteorological Satellite Program (DSMP), TRMM Microwave Imager (TMI) by TRMM, and Advanced Microwave Scanning Radiometer for EOS (ASMR-E) by Aqua. The IR sensor came from the CPC (Climate Prediction Center) of NOAA (Table 1) [40]. The development of GSMaP data was sponsored by the Core Research for Evolutional Science and Technology (CREST) of the Japan Science and Technology Agency (JST) from 2002–2007. From 2007, GSMaP activities are promoted by the JAXA Precipitation Measuring Mission (PMM) Science Team and the GSMaP products are distributed by the Earth Observation Research Center, Japan Aerospace Exploration Agency. GSMaP comprises of three variants: Rainfall Watch (GSMaP_RNL, GSMaP_MVK, GSMaP_NRT), GSMaP Realtime (GSMaP_NOW) and RIKEN Nowcast (GSMaP_RNC). The GSMaP_RNL uses the Japanese 55-year Reanalysis (JRA-55) data as ancillary data to produce a continuous and homogenous dataset. In this study, the GSMaP_RNL (Reanalysis Ver.), which has the same algorithm as GSMaP_MVK (moving vector with Kalman filter to estimate the rainfall rate) and with availability from March 2000 to February 2014 was used [40] (http://sharaku.eorc.jaxa.jp/GSMaP/index.htm).
PGF is a long-term dataset of meteorological forcings for the land surface hydrology modelling developed by Princeton University. The product is based on the merging of National Centers for Environmental Prediction-National Center for Atmospheric Research (NCEP-NCAR) reanalysis and globally available observation datasets. Although the original spatial resolution of PGF was 1.0° with temporal resolution of 3-hourly, the product was further downscaled to 0.5° and 0.25° resolutions with temporal resolutions of daily and monthly for a period from January 1948 to December 2016. This product provides various meteorological variables including precipitation, air temperature at 2 m above ground, downward long/shortwave radiation at surface, surface pressure, specific humidity and wind speed. The precipitation product was constructed from NCEP reanalysis, TRMM real time data, GPCP, Climatic Research Unit (CRU) and observation-based precipitation datasets (Table 1) through a process of downscaling and bias correction in both spatial and temporal resolution [19,41] (http://hydrology.princeton.edu/data/pgf/). In this study, PGF version 3 of daily precipitation at 0.25° resolution was used.
The TRMM product, introduced in 1997, was from a collaborative mission of United States National Aeronautics and Space Administration (NASA) and the Japan Aerospace Exploration Agency to study tropical and subtropical rainfall for weather and climate research [7,42]. It uses several instruments including Visible Infrared Radiometer (VIRS), TMI, Precipitation Radar (PR), Cloud and Earth Radiant Energy Sensor (CERES) and Lightning Imaging Sensor (LIS). The product datasets were available at 0.25 spatial resolutions and two temporal resolutions, i.e., 3-hourly and 7-day accumulated rainfall. The estimated precipitation is derived from two products, namely 3-hourly combined with microwave-IR estimation (with gauge adjustment) and monthly combined MWR-IR-gauge of about two months after the end of each month (satellite-gauge-gridded precipitation products). The onboard sensors include TRMM Combined Instrument algorithm (2B31) (TCI), TMI, SSMI, Special sensor microwave/Imager-Sounder (SSMIS), ASMR-E, Advanced Microwave Sounding Unit (AMSU) and Microwave Humidity Sounder (MHS) (Table 1) [42]. Different variants of TRMM products of various time resolutions can be found at https://pmm.nasa.gov/data-access/downloads/trmm. In this study, we used the daily precipitation totals derived from 3B42 Research Version using the Version 7 TRMM Multi-Satellite Precipitation Analysis released in June 2012. TMPA 3B42v7 provides precipitation data from January 1998 until present.

3. Methodology

3.1. Statistical Measures for Product Validation

For evaluation of performance of gridded precipitation datasets against the observed rain gauge dataset, we used pairwise comparison numerical statistics and categorical performance [43]. According to Tan et al. [44], the point-to-pixel and pixel-to-pixel comparison essentially produce similar results. Hence, the technique of point-to-pixel comparison was chosen due to insufficient station data for interpolation into gridded data [24,44]. In this technique, the values of gridded data were compared to the values of station data. The use of pairwise comparison based on three numerical statistical indicators, summarized in Table 2, allows the estimation of accuracy and reliability of gridded products [45]. The Pearson Correlation Coefficient (r) measures the degree of association between the gridded dataset and the rain gauge data. The Root Mean Squared Error (RMSE) calculates the differences between two datasets and provides the average magnitude of error. The bias measures the tendency of the gridded data to overestimate (Bias > 0) or underestimate (Bias < 0) the rain gauge data.
In addition, three categorical measures were used to detect rainfall occurrence and non-occurrence between satellite data and rain gauge data (Table 3) [16]. These measures are based on a contingency table where A is defined as hits (i.e., both gridded and station observations occur), B represents a false alarm (i.e., station does not occur, gridded occurs), C means misses (i.e., station occurs but gridded does not occur), D represents a correct negative (i.e., both station and gridded do not occur) and n is the sum of A, B, C and D. The rain occurrence threshold was set at 1 mm per day to detect a rainy or not rainy day.
The Probability of Detection (POD) calculates the rain occurrence in gridded datasets by ignoring false alarms. On the other hand, False Alarm Ratio (FAR) shows the sensitivity towards the event of rain occurrence in satellite data that does not occur in station data without calculating the rain-missed event. Meanwhile, the Critical Success Index (CSI) shows the correct estimation of the rain occurrence while removing the negative occurrence. The values of POD, FAR, and CSI range from 0 to 1. A POD score of 1 implies perfect agreement of rainfall occurrences in both station and gridded data, whereas a score of zero corresponds to a complete disagreement between the two datasets. On the other hand, FAR measures the false alarm rates where a score of zero indicates no false alarm occurred. Meanwhile, the CSI index provides the measure of a critical success rate that blends POD and FAR, whereas a perfect score of 1 implies zero occurrences in both the false alarm and misses categories. The frequencies of defined rain intensities were also compared between rain gauge data and satellite products. Thresholds for different categories of daily rainfall intensity follow World Meteorological Organization (WMO) [46] definitions: rain <1 mm (no/very light rain), 1–2 mm (light rain), 2–5 mm (low moderate rain), 5–10 mm (high moderate rain), 10–20 mm (low heavy rain), 20–50 mm (high heavy rain) and rain >50 mm (violent rain) [14,45,47].

3.2. Extreme Precipitation Events

To evaluate the appropriateness of the gridded data precipitation during extreme precipitation events, three events were considered as examples: i) 17–20 December 2006, ii) 24–28 December 2006 and iii) 11–14 January 2007, all of which contributed to the 2006/2007 flood event in the southern parts of Peninsular Malaysia [33].

4. Results

4.1. Performances Based on Statistical Measures

Figure 2 shows the 2-D histogram of total monthly data from five precipitation datasets versus rain gauge data during the five-year period. The color bar values indicate counts with the scale shown in the right y-axis. All products show variations when compared with rain-gauge observation as not all points fall on the straight lines. Generally, the larger the scatter implies the greater disagreement. In terms of point scattering TMPA 3B42v7, CHIPRS05 and CHIRPS25 products show similar patterns with correlation values of >0.80. All three products also show comparable peaks of point concentration. However, GSMaP_RNL and PGFv3 products show large scattering indicating high degree of disagreement with the rain gauge observation with correlation values of 0.76 and 0.62, respectively.
The statistical performance indicators for monthly data are summarized in Table 4. TMPA 342v7 slightly overestimated the station data with the smallest positive bias of 0.02, followed by PGFv3 (0.03), CHIRPS05 (0.06) and CHIRPS25 (0.08). The GSMaP_RNL was the only gridded precipitation dataset that underestimated the rain gauge with the highest bias magnitude of −0.11. TMPA 3B42v7 also recorded the lowest RMSE, whereas PGFv3 presented the highest RMSE value. Hence, TMPA 3B42v7 performed best for monthly total precipitation followed by the CHIRPS product. The CHIRPS05 performed slightly better than CHIRPS25, in agreement with a study in China [23], but differed from that in Adige Basin in Italy [26].
Figure 3 presents the monthly statistical performance indicators for all products based on seven sub-regions in Malaysia. In NPM, all products show monthly variation with highest values in March, June and July. In EPM, TMPA 3B42v7 and both CHIRPS products perform best during the wet season while performances decrease during dry season. Contrary to other products, the PGFv3 shows a negative correlation and high RMSE values during October, November and December, while GSMaP_RNL shows relatively high correlations, but underestimated the station rainfall by more than 50% in February. The MPM sub-region, which consists of two highlands, shows the highest statistical scores during February, March, April and October, but has low values during September and November. In WPM regions, the gridded precipitation datasets perform best during May–July and in October. Overall, GSMaP_RNL appears to perform the lowest compared to the other products. In the SPM, the gridded products perform the best during wet season. Meanwhile, in NEM, throughout the year, all gridded precipitation products except for GSMaP_RNL display relatively good statistical performance. Over the southern part of East Malaysia, gridded precipitation datasets recorded a better performance measure in January and May–September. Overall, in East Malaysia, the PGFv3 performs comparably with TMPA 3B42v7, while GSMaP_RNL is considered the worst.
Table 5 compares the performance of five gridded products based on a seasonal basis for the whole of Malaysia. Overall, the performance of gridded precipitation appears higher during DJF (wet season) followed by JJA (dry season) and inter-monsoon periods, consistent with that found by Tan and Santo [15]. TMPA 3B42v7 performs the best among the other products for all seasons.
The performance of all gridded products according to each sub-region is shown in Figure 4. Over NPM and SPM, the r and RMSE values of these products are comparable for all products, although the biases can be different. Generally, most performances of all products tend to be lower in the MPM region. In EPM, most products perform well, except PGFv3 which has a high RMSE and underestimated precipitation. However, PGFv3 performs comparably with other products in East Malaysia. The GSMaP_RNL has the lowest performance at WPM and both locations in East Malaysia. Overall, TMPA 3B42v7 performs best in most sub-regions, followed by CHIRPS of both resolutions.

4.2. Categorical Measurement Ability

Table 6 depicts the categorical performances of daily precipitation estimates of all gridded data products. Overall, TMPA 3B42v7 recorded its best scores in FAR and CSI, followed by GSMaP_RNL. On the other hand, CHIRPS25 recorded the highest score in POD, but has the lowest score in FAR. Despite having high resolution CHIRPS05 has lower POD compared to CHIRPS25. However, CHIRPS05 recorded lower FAR when compared to CHIRP25, which is consistent with the statistical score in Table 4. Meanwhile, PGFv3 recorded the worst score in almost all categorical performances.
Figure 5 shows the categorical scores for each month in all sub-regions. Consistent with Varikoden et al. [12] and Tan et al. [14], generally, all sub-regions in Peninsular Malaysia and East Malaysia tended to record the best (worst) values of POD, FAR and CSI scores coinciding with maximum (minimum) rainfall. Hence, all scores tend to have strong seasonality. PGFv3 product shows consistently lowest POD and highest FAR, indicating its inferiority. The CSI values also tended to be lower. However, despite identified as the most reliable product in previous analysis, TMPA 3B42v7 does not show the highest POD. It is CHIRPS25 that tended to produce highest POD values. However, in both FAR and CSI, TMPA 3B42v7 shows its superiority. GSMaP_RNL’s scores of POD, FAR and CSI indicate its performances to be somewhere in between TMPA 3B42v7 and CHIRPS.
The overall categorical performance scores for all products are shown in Figure 6. Consistent with the monthly values, TMPA 3B42v7 and GSMaP_RNL show better performances in FAR and CSI, while CHIRPS25 recorded slightly good performance in POD. However, both CHIRPS05 and CHIRPS25 tended to have much higher values in FAR compared to TMPA 3B42v7 and GSMaP_RNL. Hence, these scores suggest that TMPA 3B42v7 is the overall best performing product followed by GSMaP_RNL and CHIRSPS. The PGFv3, on the other hand, appears to have the lowest scores in almost all categories in most sub-regions, and hence can be considered the worst performing product. Furthermore, the POD and CSI (FAR) scores of all products tended to be the highest (lowest) in SEM compared with other sub-regions. Hence, these scores indicated that the products approximated the stations data much better in SEM.

4.3. Evaluation of Frequency on Different Rain Intensity

The frequency (or occurrence percentage) according to rainfall intensity in Malaysia is shown in Figure 7. The TMPA3B42v7 and GSMaP_RNL show small differences throughout all rain intensity categories. However, based on comparison with station data, the performance of all gridded products was considered inferior, with a tendency for underestimation in the no rain category (<1 mm/day), especially CHIRPS25 which underestimated it by as much as 22%. For light rain (1–2 mm/day), the differences are small except for CHIRPS05 and PGFv3, which underestimated the intensity by more than 5%, while in low moderate rain (2–5 mm/day), PGFv3 underestimated the rainfall frequency by more than 5%. From high moderate rain (5–10 mm/day) to low heavy rain (10–20 mm/day), all products tended to overestimate the frequency, especially CHIRPS05, CHIRPS25 and PGFv3. Noticeably, the PGFv3 shows different performances in different rainfall categories where it tended to underestimate the frequency of low moderate rain (5.24%), but overestimated the moderate rain (9.56%) and low heavy rain (20.76%). Interestingly, for high heavy rain (20–50 mm/day), all products appear to have reasonably estimated the frequency correctly. Meanwhile, for the frequency of rainfall above 50 mm per day, all products tended to underestimate, although the differences can be minimal.

4.4. Evaluation During the 2006/2007 Flood Event

The 2006/2007 flood event in the southern part of Peninsular Malaysia produced three episodes of extreme precipitation events [33]. The stations affected by the heavy rainfall events included Senai, Kluang, Batu Pahat, Mersing, Muadzam Shah and Kuantan, mostly situated in SPM and also in MPM and EPM (indicated with blue triangles in Figure 1). The time series of daily precipitation of affected areas for all gridded products are presented together with station data in Figure 8. Both TMPA 3B42v7 and GSMaP_RNL showed good agreement with rain gauge data in Senai, Kluang and Mersing, but indicated weaknesses in other stations for overestimating light rain and unable to completely capture all episodes of extreme rainfall. Generally, CHIRPS and PGFv3 can be considered having poor performances in detecting extreme events since their maximum intensity of heavy rainfall were lower compared to observations. The performance measures of gridded products during the three extreme events for the six rain gauge stations are given in Table 7. The ability of gridded products to detect extreme events varies according to stations. In general, the correction values are high, but both RMSE and the bias are higher as well. Generally, both TMPA 3B42v7 and GSMaP_RNL have good scores in some stations, while other products tended to underestimate, consistent with the findings of Soo et al. [16].

5. Discussion

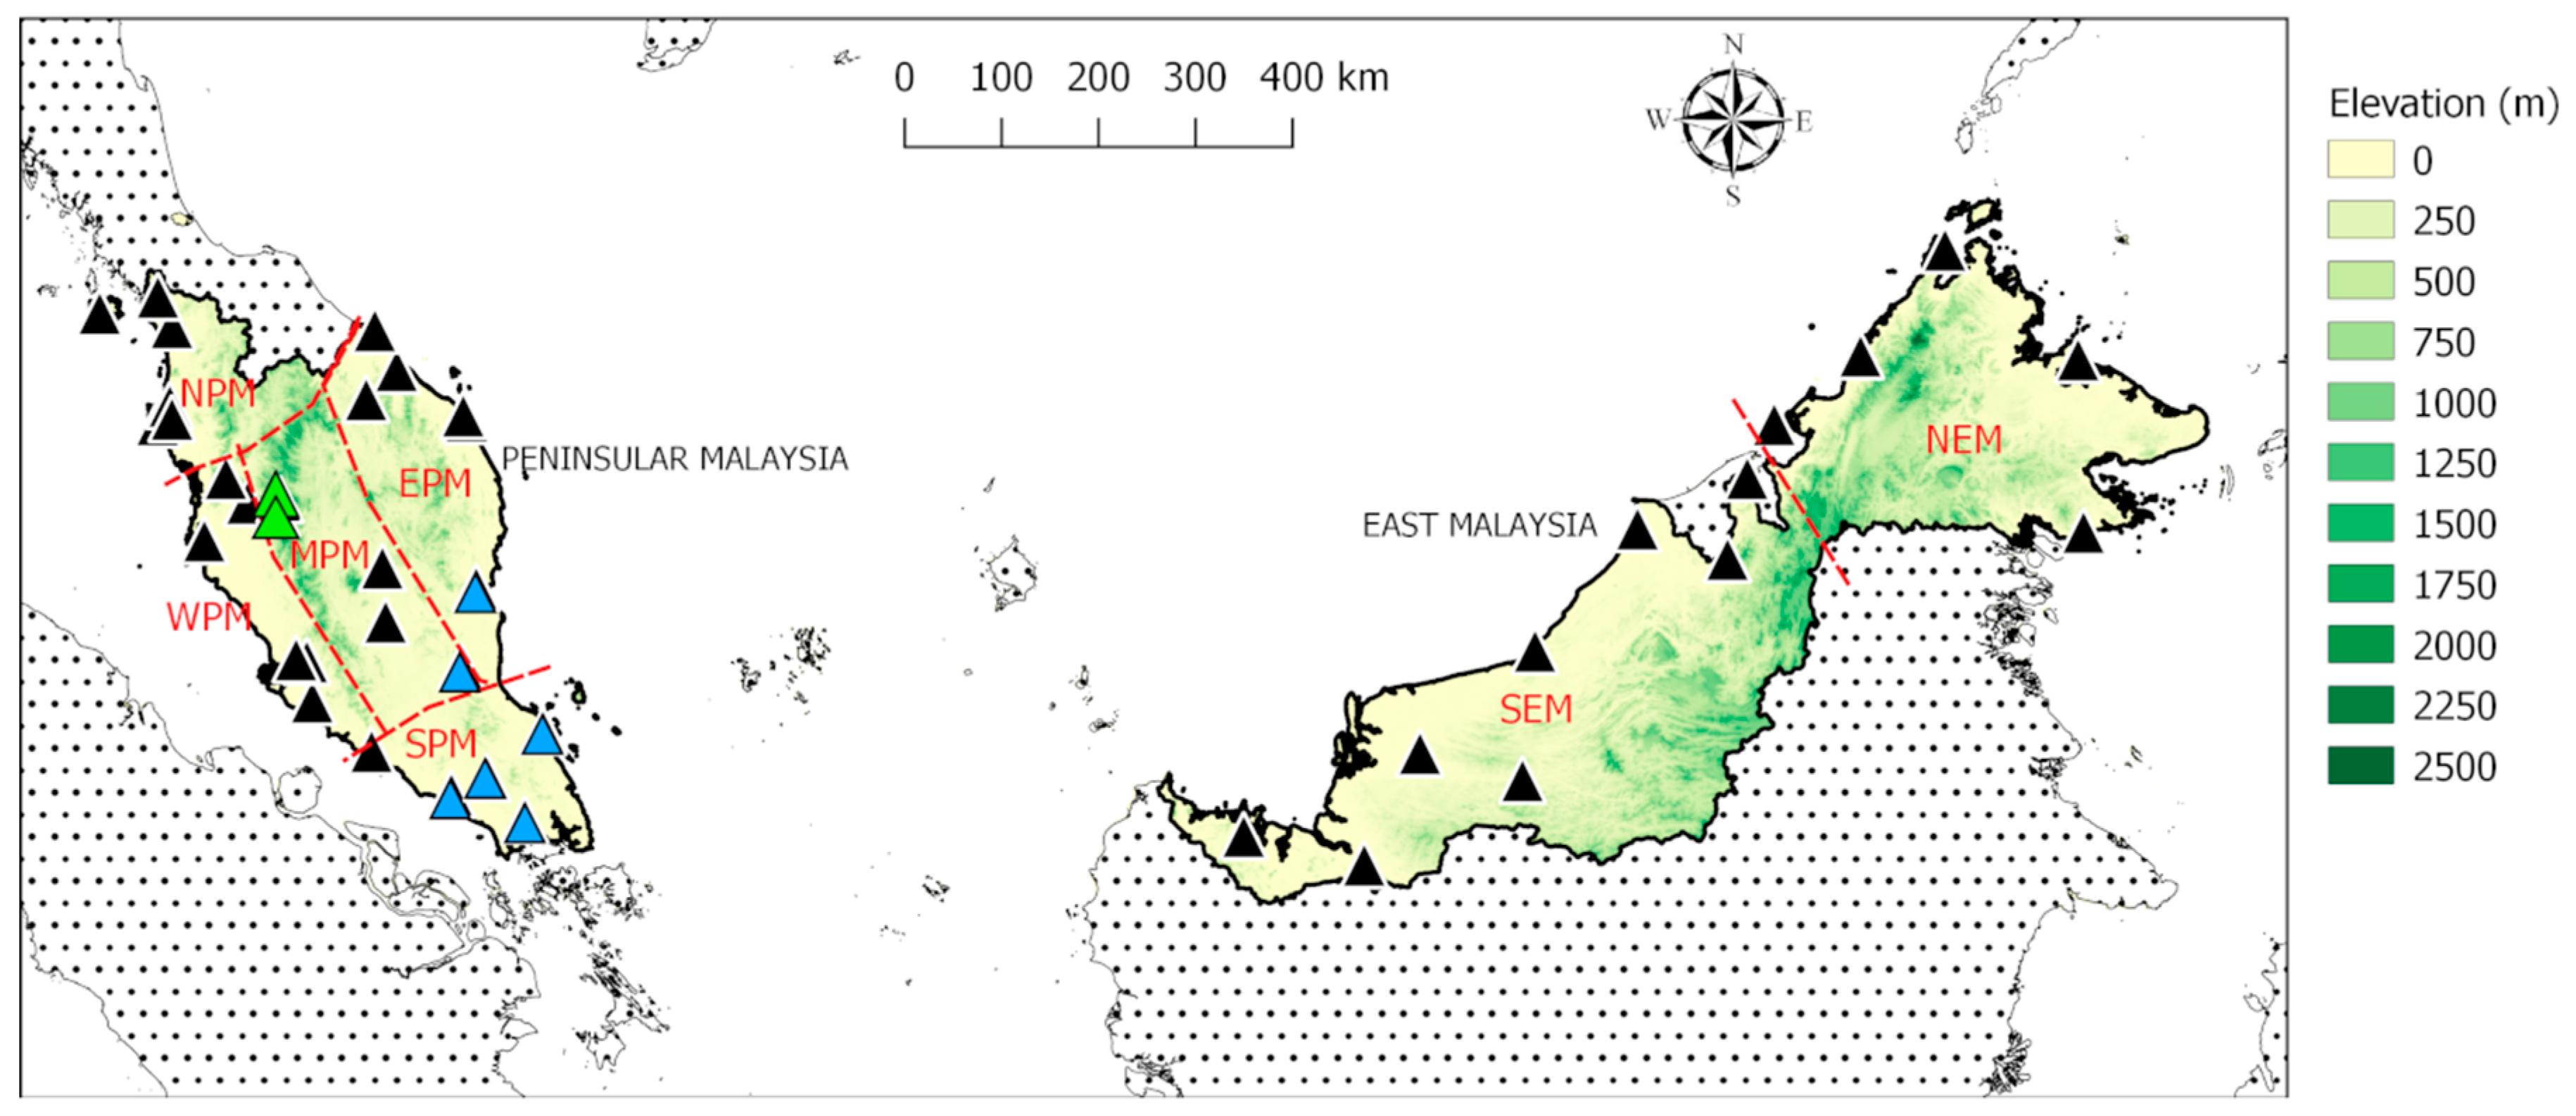
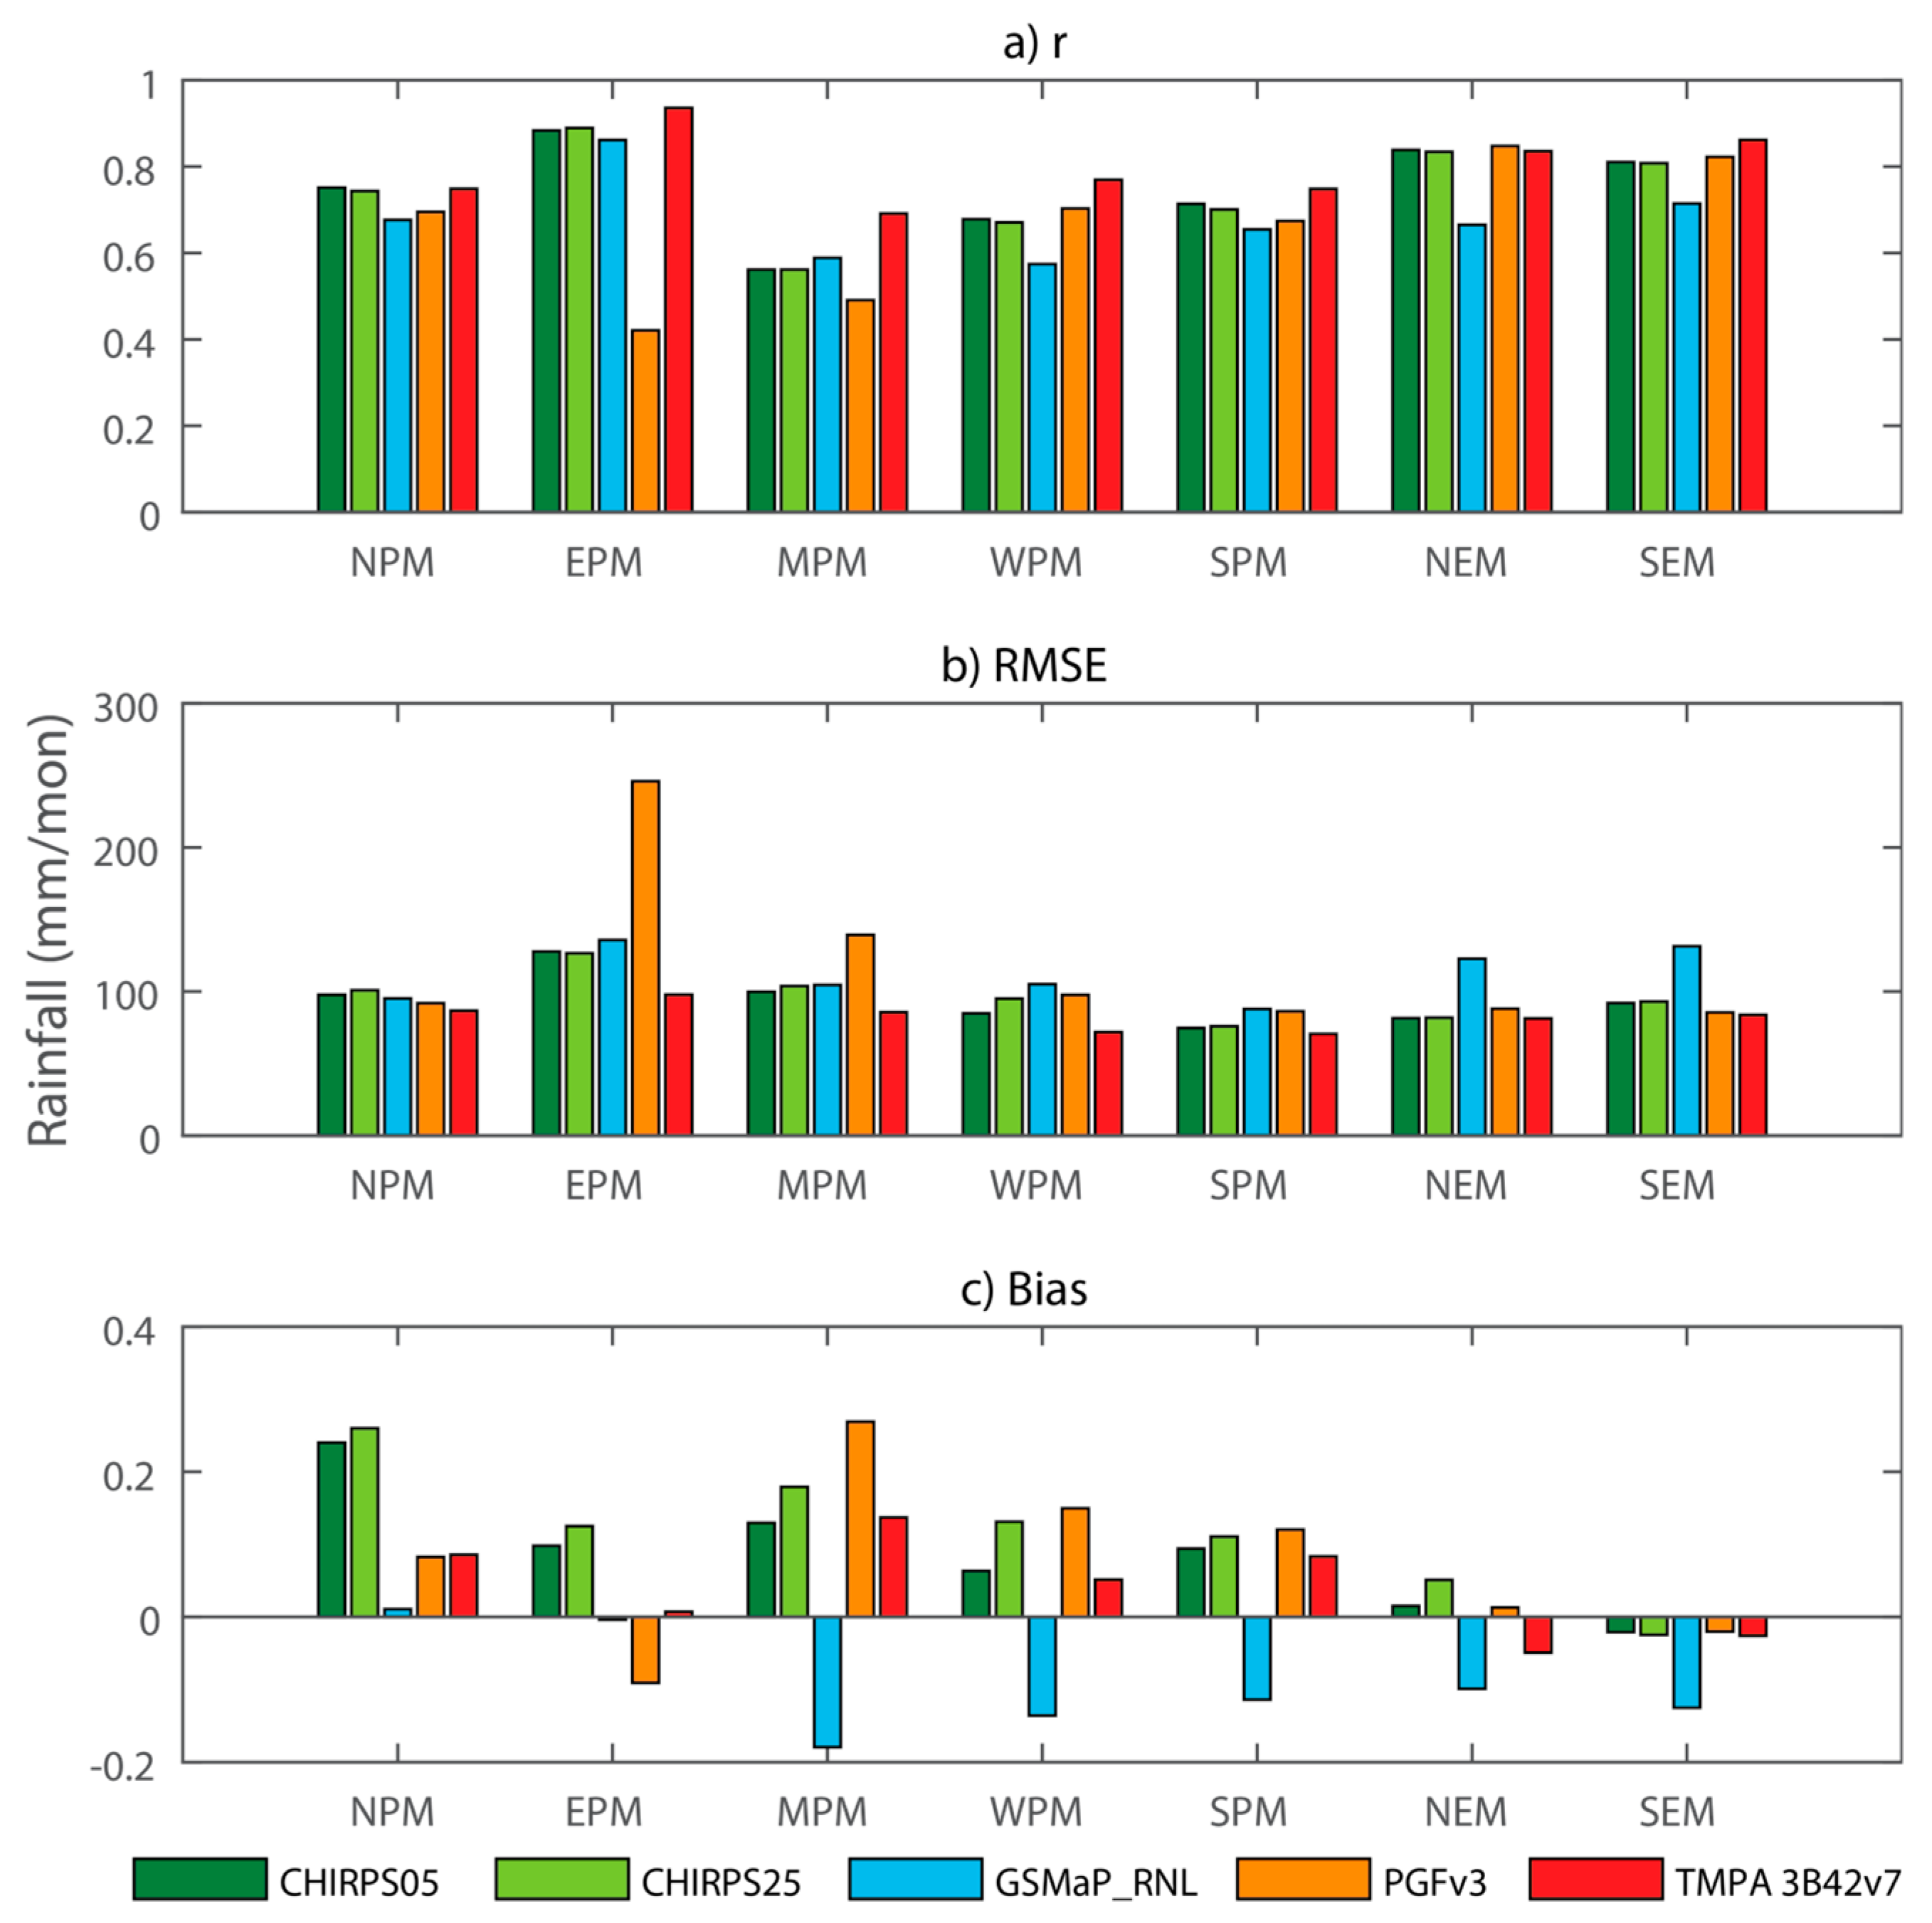
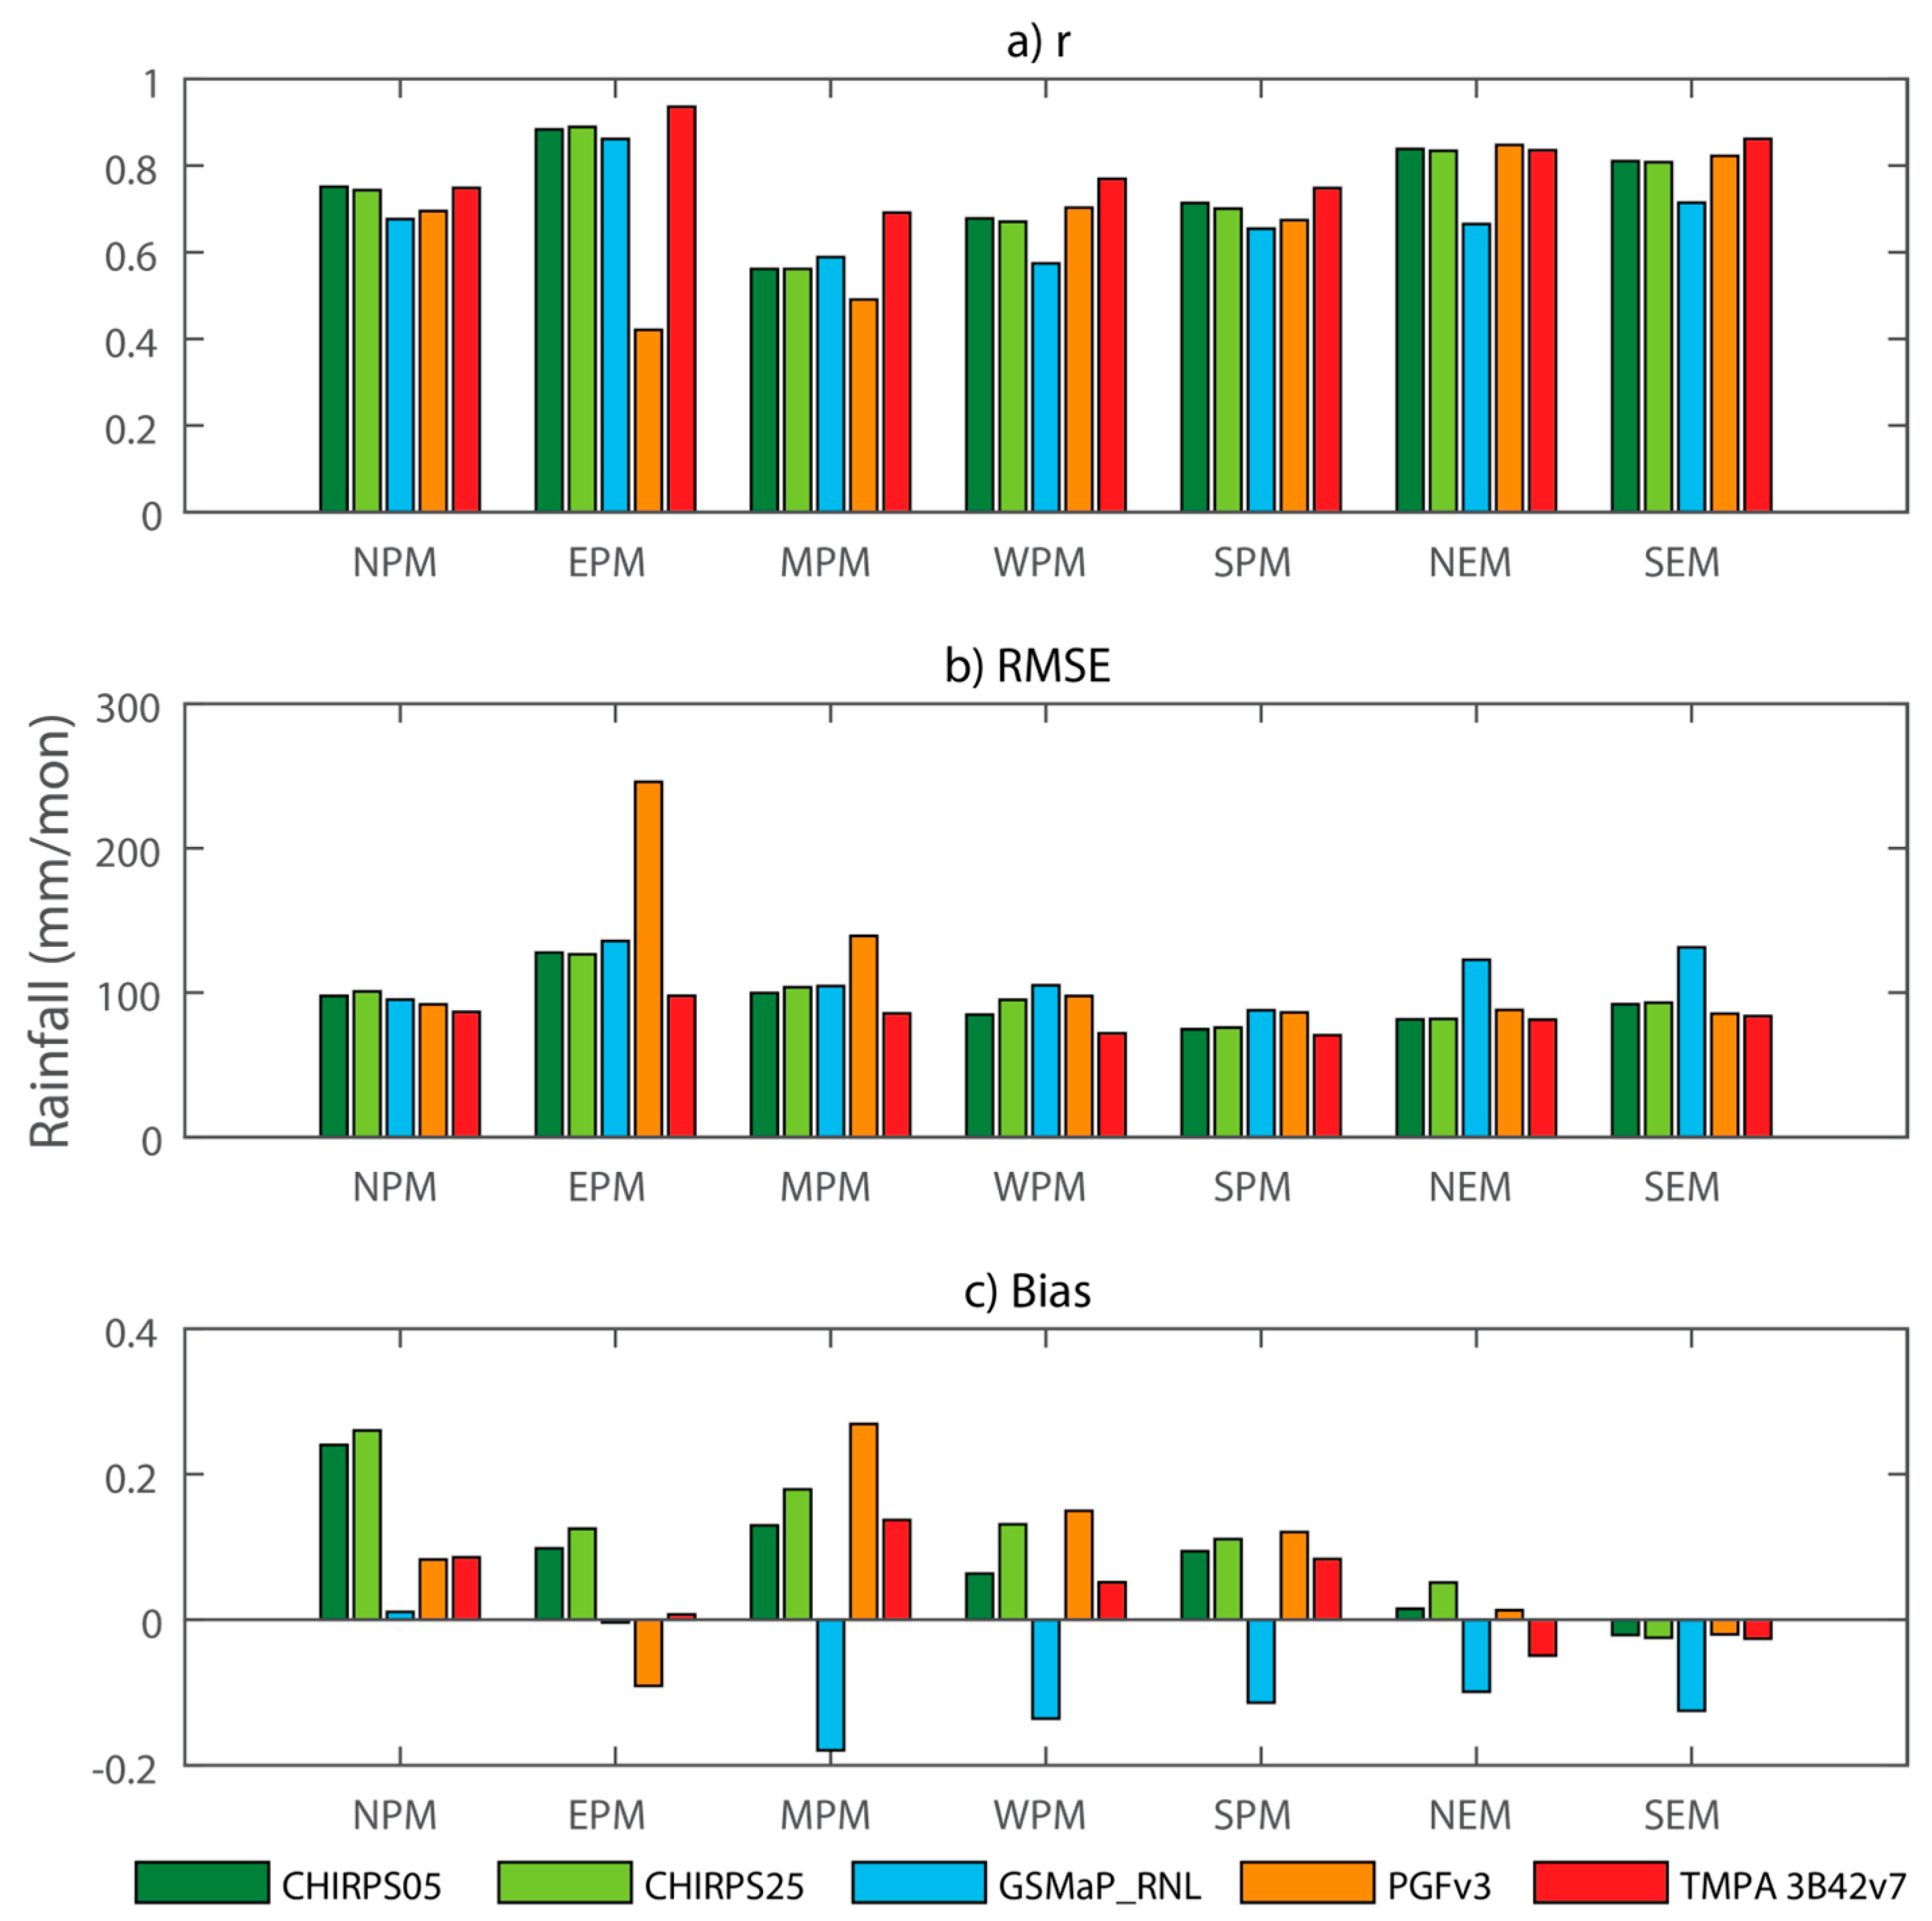
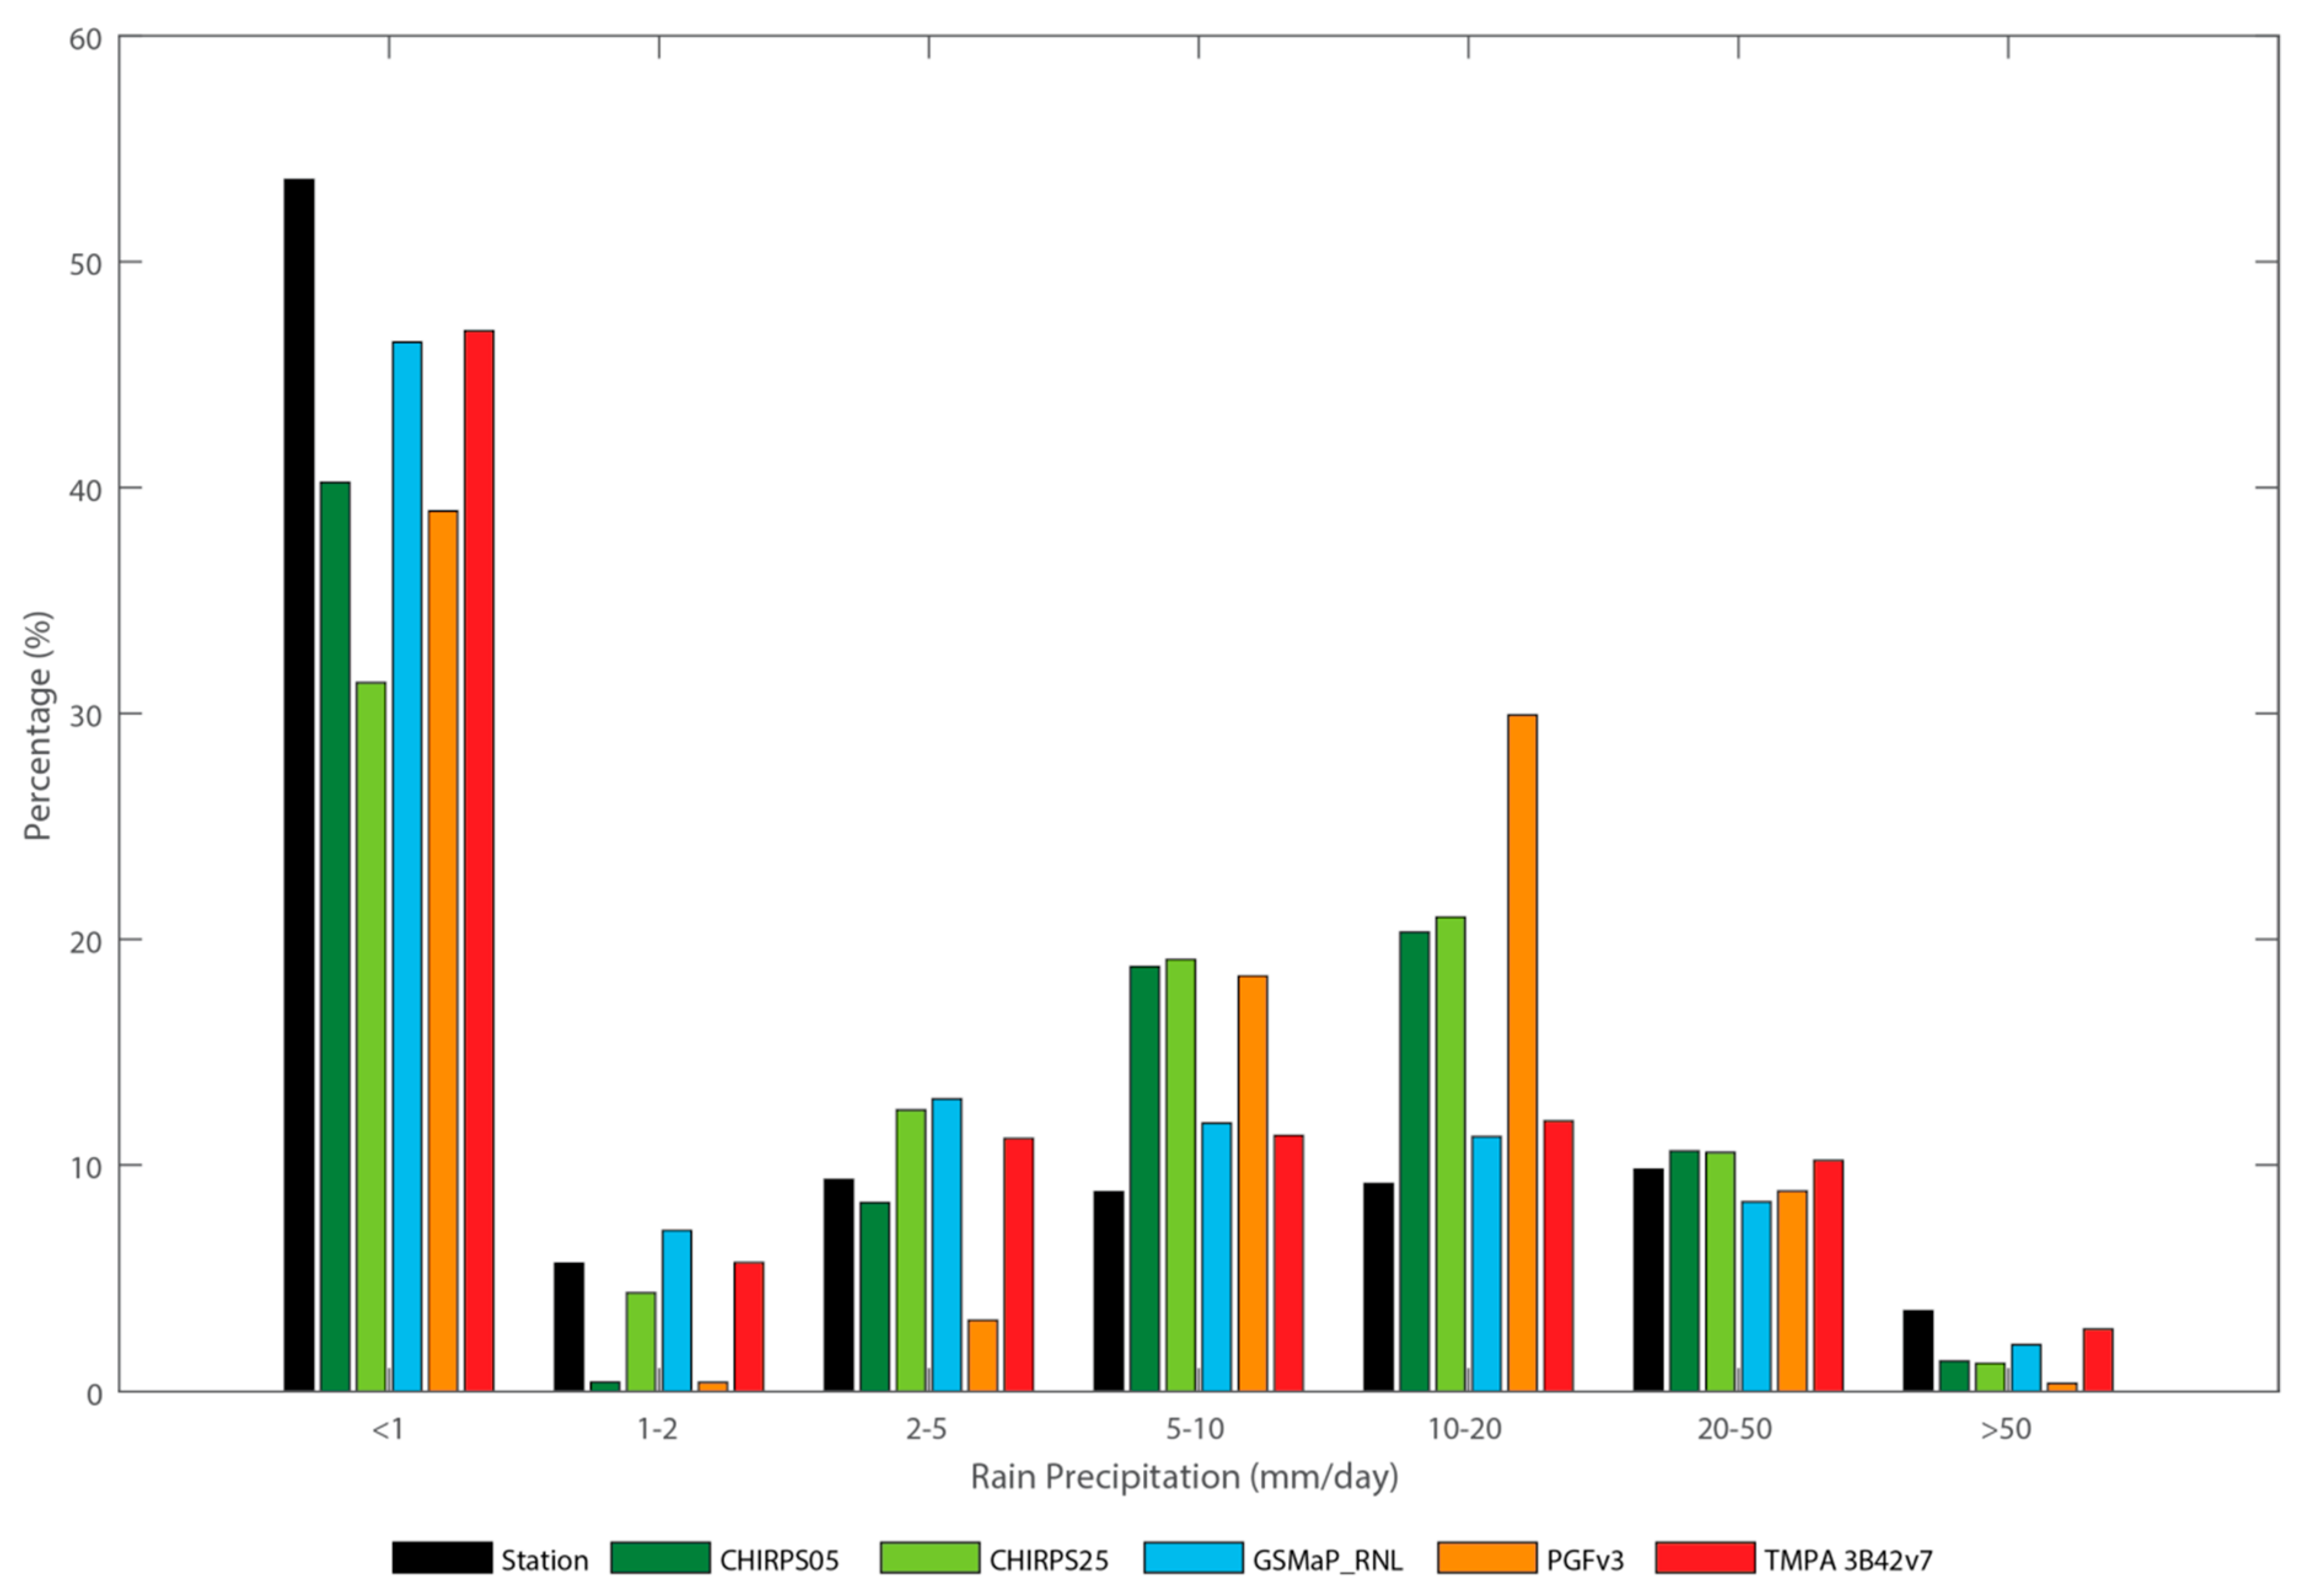
This analysis explored the reliability and quality of five readily available gridded precipitation datasets compared to observed rain gauge data. Consistent with Tan et al. [14,15] the result indicated that the TMPA 3B42v7 is the overall best performing gridded precipitation dataset in Malaysia followed by CHIRPS, GSMaP_RNL and PGFv3. These relative performances could be due various factors related to input data, onboard sensors, algorithm, and interpolation techniques (Table 1). However, it is difficult to attribute and quantify the effects of each factor. The blending of rain gauge data does not guarantee the highest quality of the products. For examples, both TMPA 3B42v7 and CHIRPS incorporated rain gauges (although number of stations used may be different) but the former has been consistently proven to be the best gridded precipitation data in this study and previous investigations [12,13,14,16]. Hence, other factors such as onboard sensors and algorithm could be more important. However, the performance could vary spatially due the characteristics of the sub-regions, especially in terms of elevation and topography [1,48]. In East Malaysia, PGFv3 appears to be a better product than GSMaP_RNL.
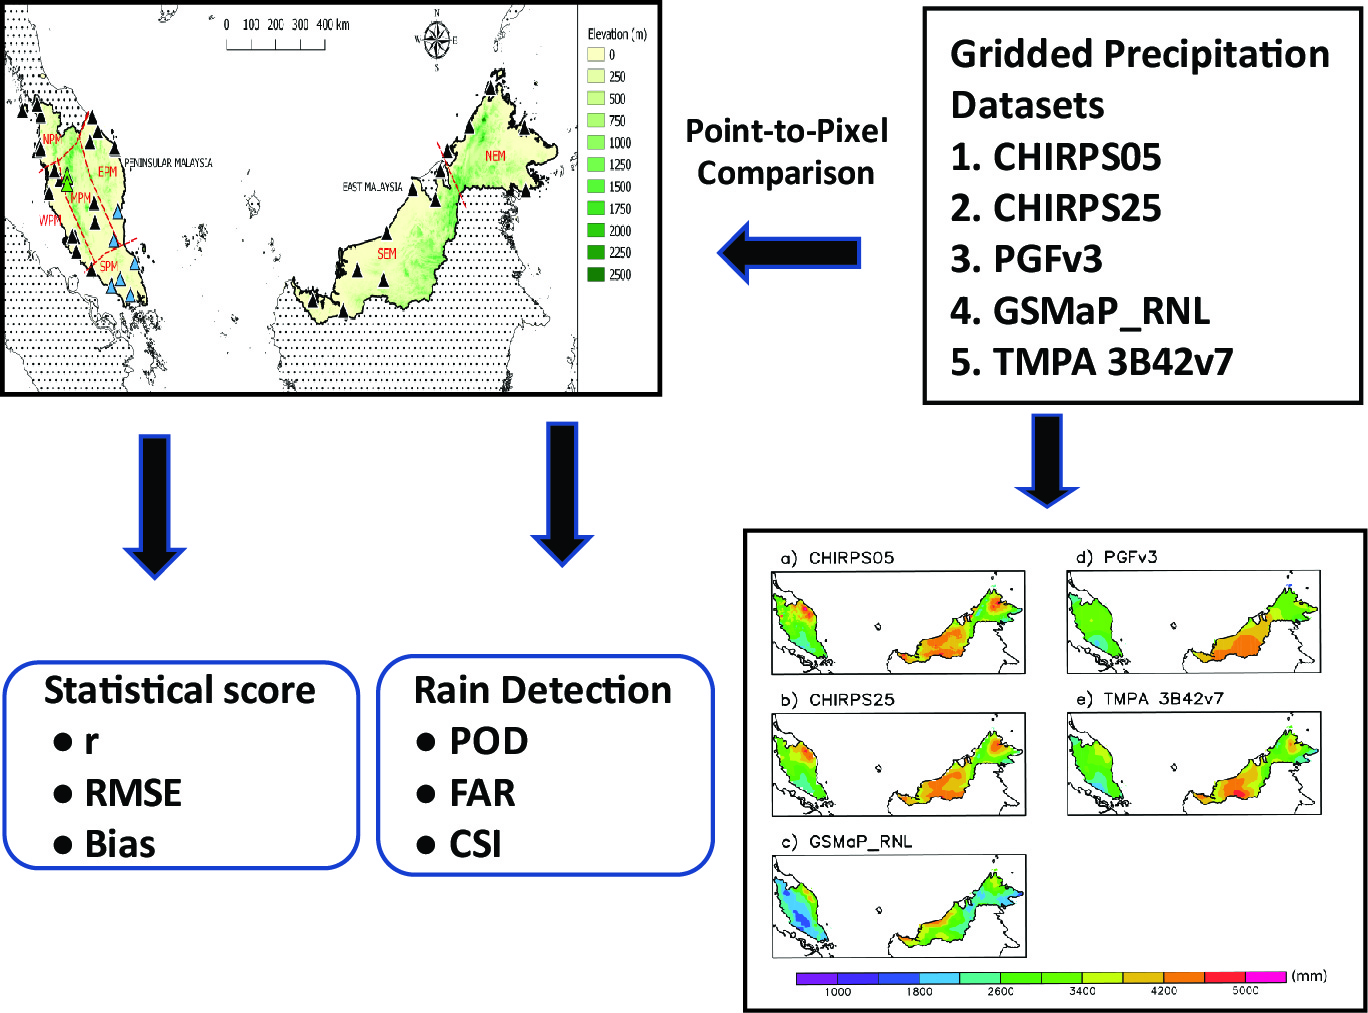
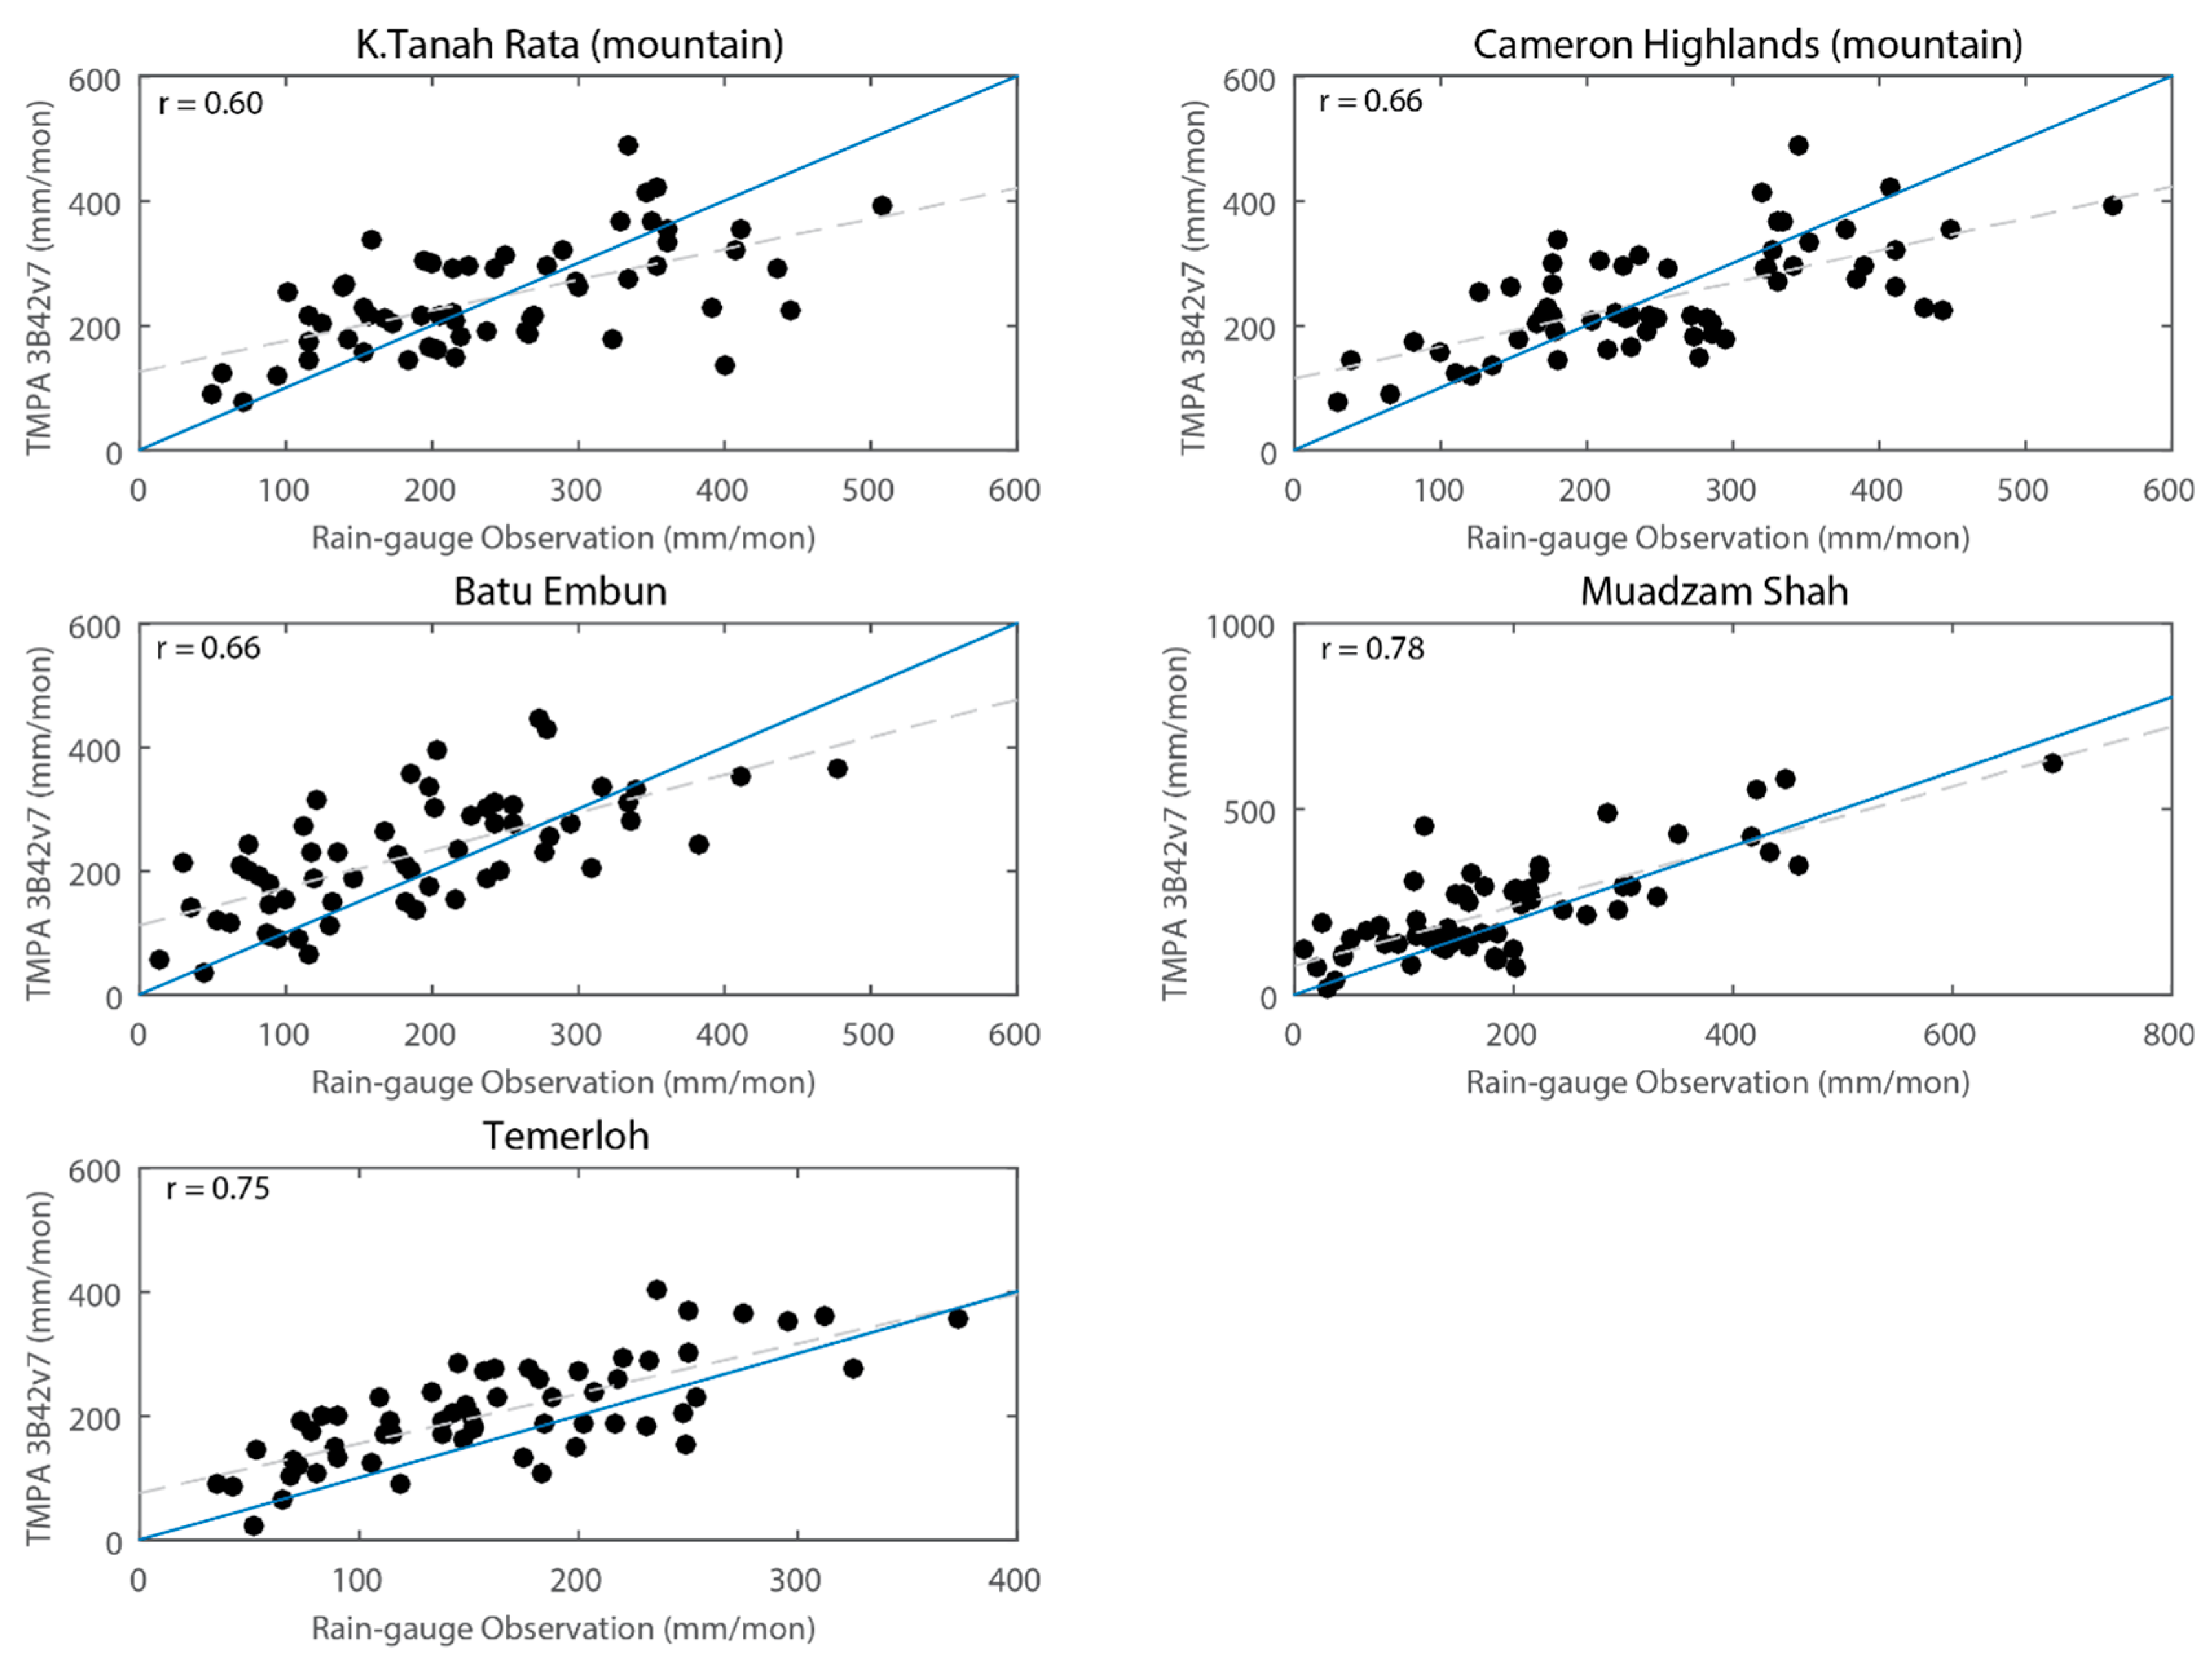
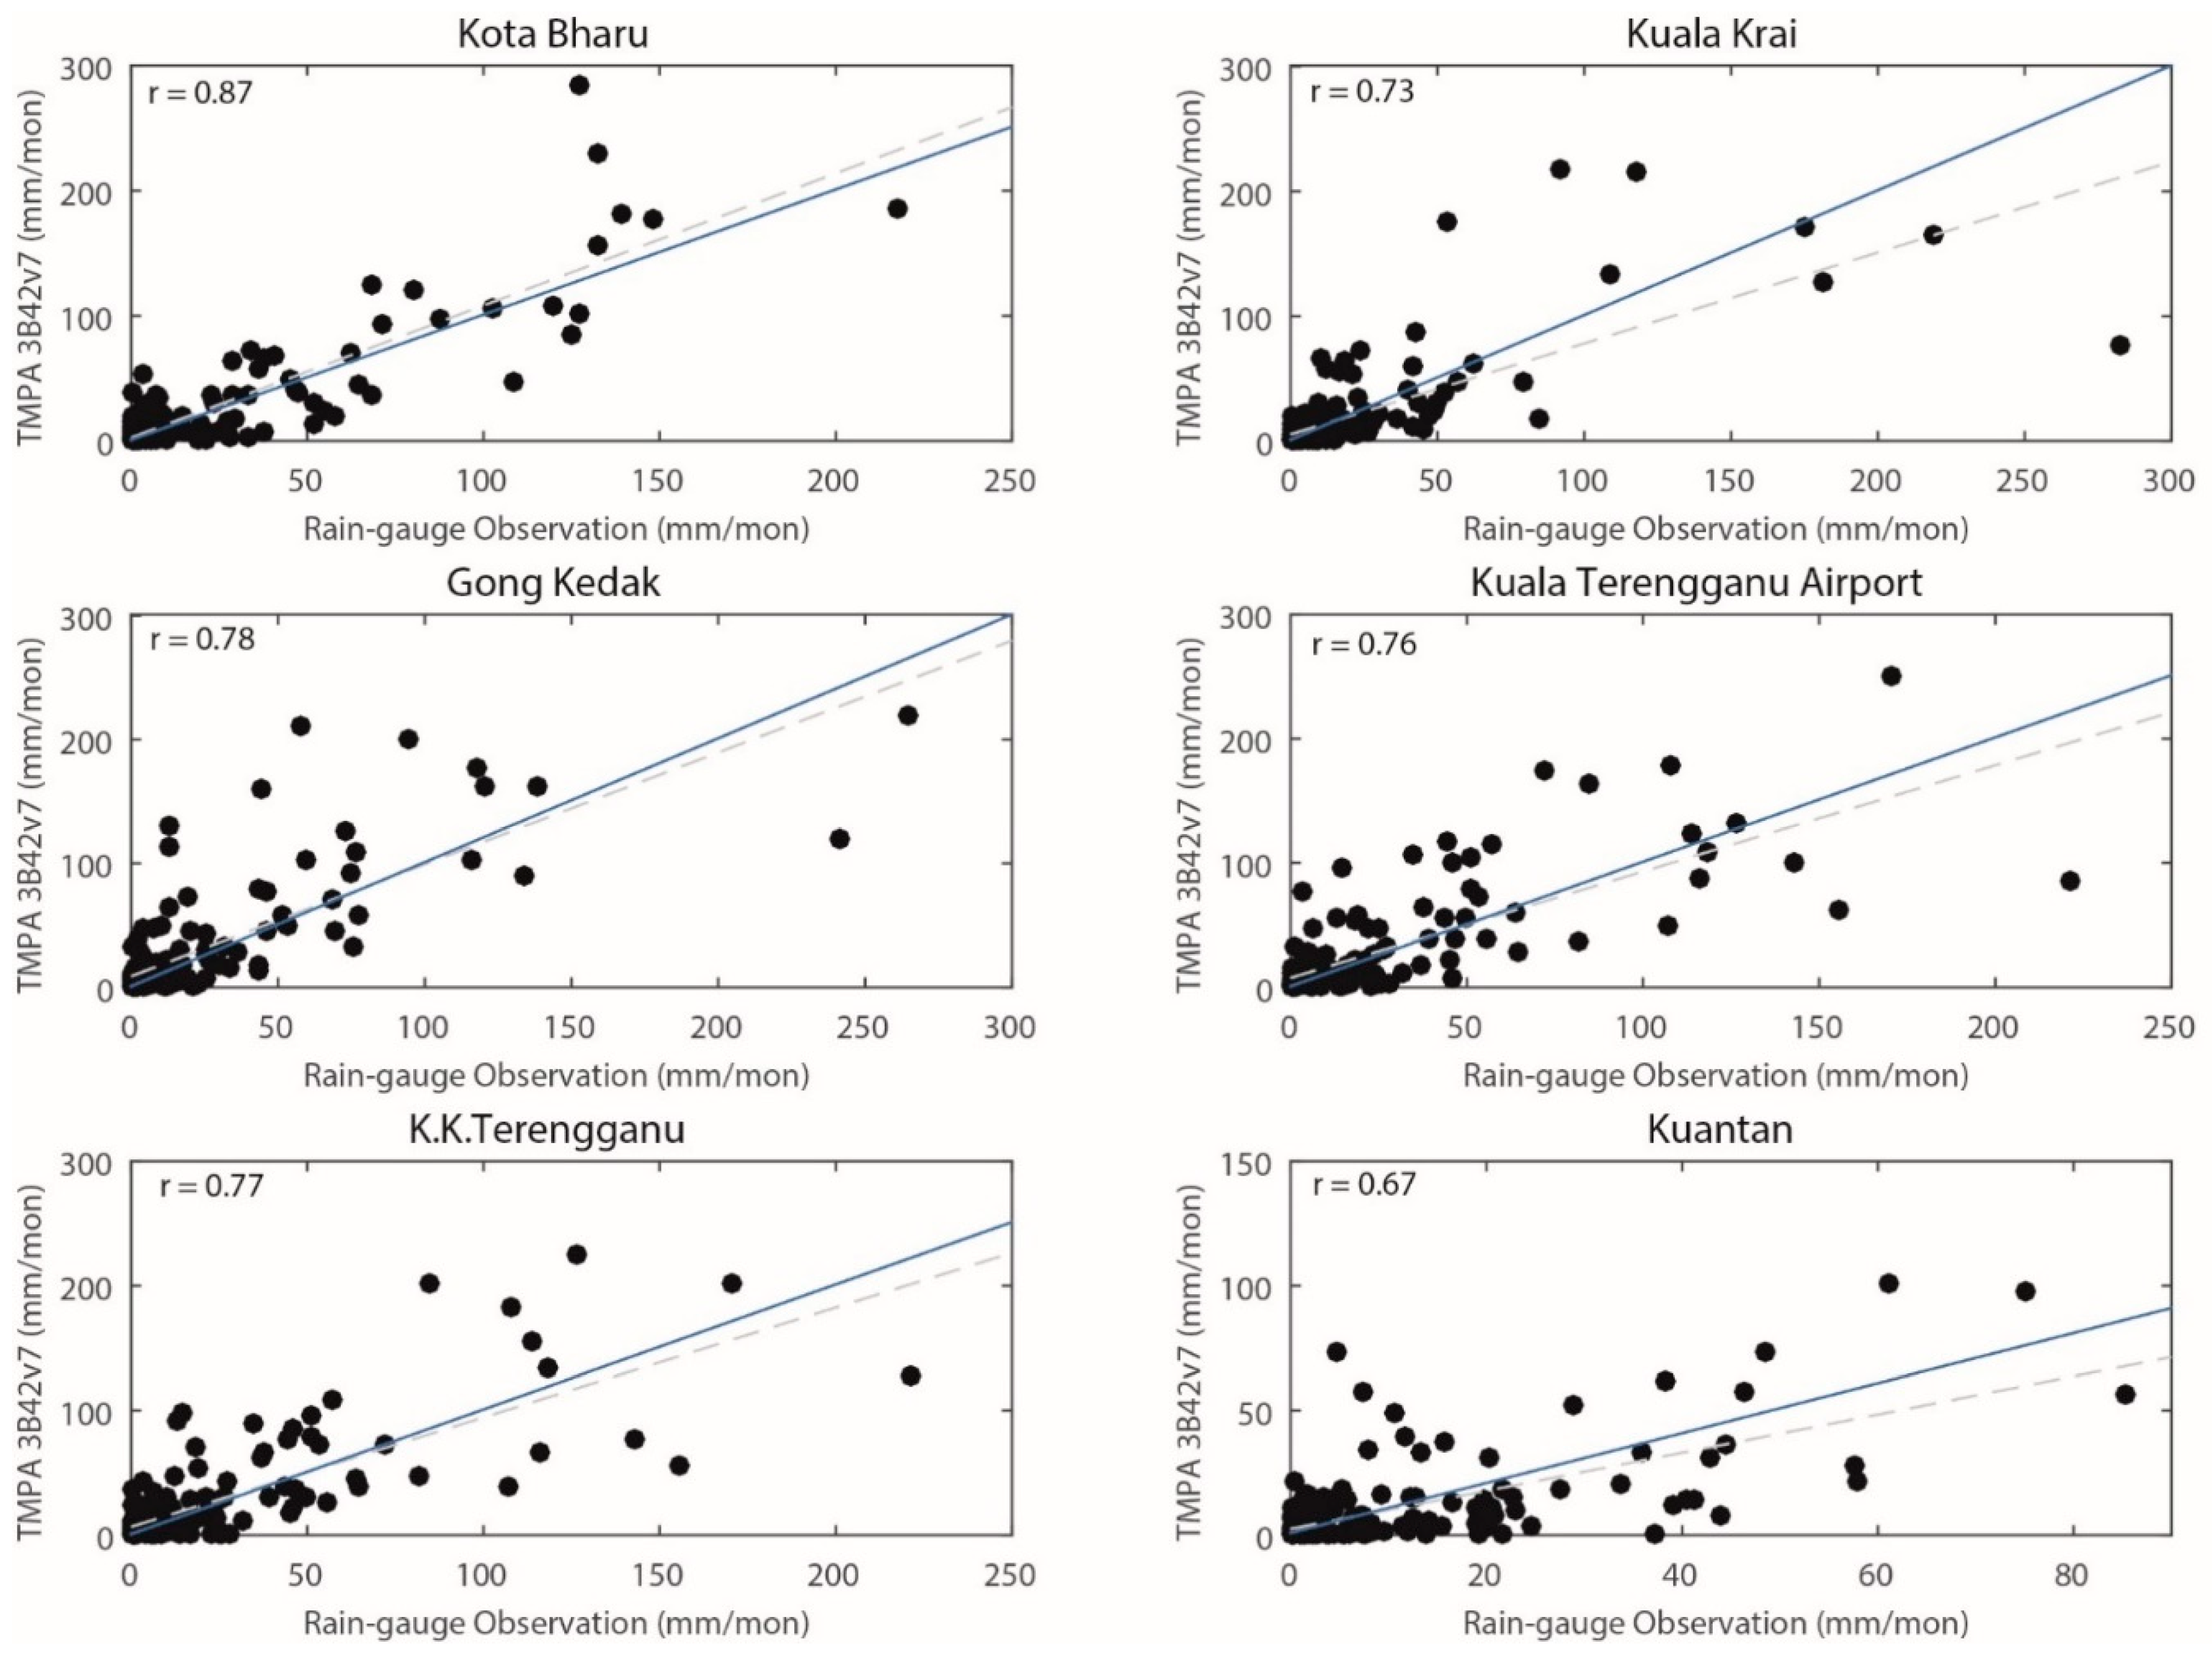
The results of the analyses could be least influenced by the number of rain gauges in each sub-region. In particular, with roughly equal number of stations: NPM–6 stations, EPM–6 stations, MPM–5 stations, WPM–6 stations, SPM–5 stations, NEM–5 stations and SEM–8 stations, the total number of stations may not be the dominant factor in determining the performance of gridded products. However, the MPM is the only sub-region with two rain gauges located in mountainous locations: K. Tanah Rata and Cameron Highlands (indicated with green triangles in Figure 1). The results showed that the gridded product performed the worst in MPM, possibly due to the existence of these two mountainous rain gauges. Figure 9 depicts the scatter plot of five locations in MPM for TMPA 3B42v7, which the two stations in the mountainous region showed lowest correlation. This relatively poor performance could be due the shortcoming in the satellite algorithm when applied in the highly complex terrain of mountainous areas [49]. In addition, in mountainous regions, radar signals that hit the surface could return false echoes [50].
Higher spatial-temporal gridded precipitation data was suggested to be of better quality compared to the lower-resolution product [4]. However, in this study, the higher resolution of the CHIRPS05 product does not improve much over TMPA 3B42v7. This could be a disadvantage of using the CCD technique which may classify some clouds from satellite signals as cold clouds, when in fact most of them are high clouds with no rainfall activity [51]. In addition, perhaps remote sensing algorithms used in gridded precipitation datasets play an important role in its performance.
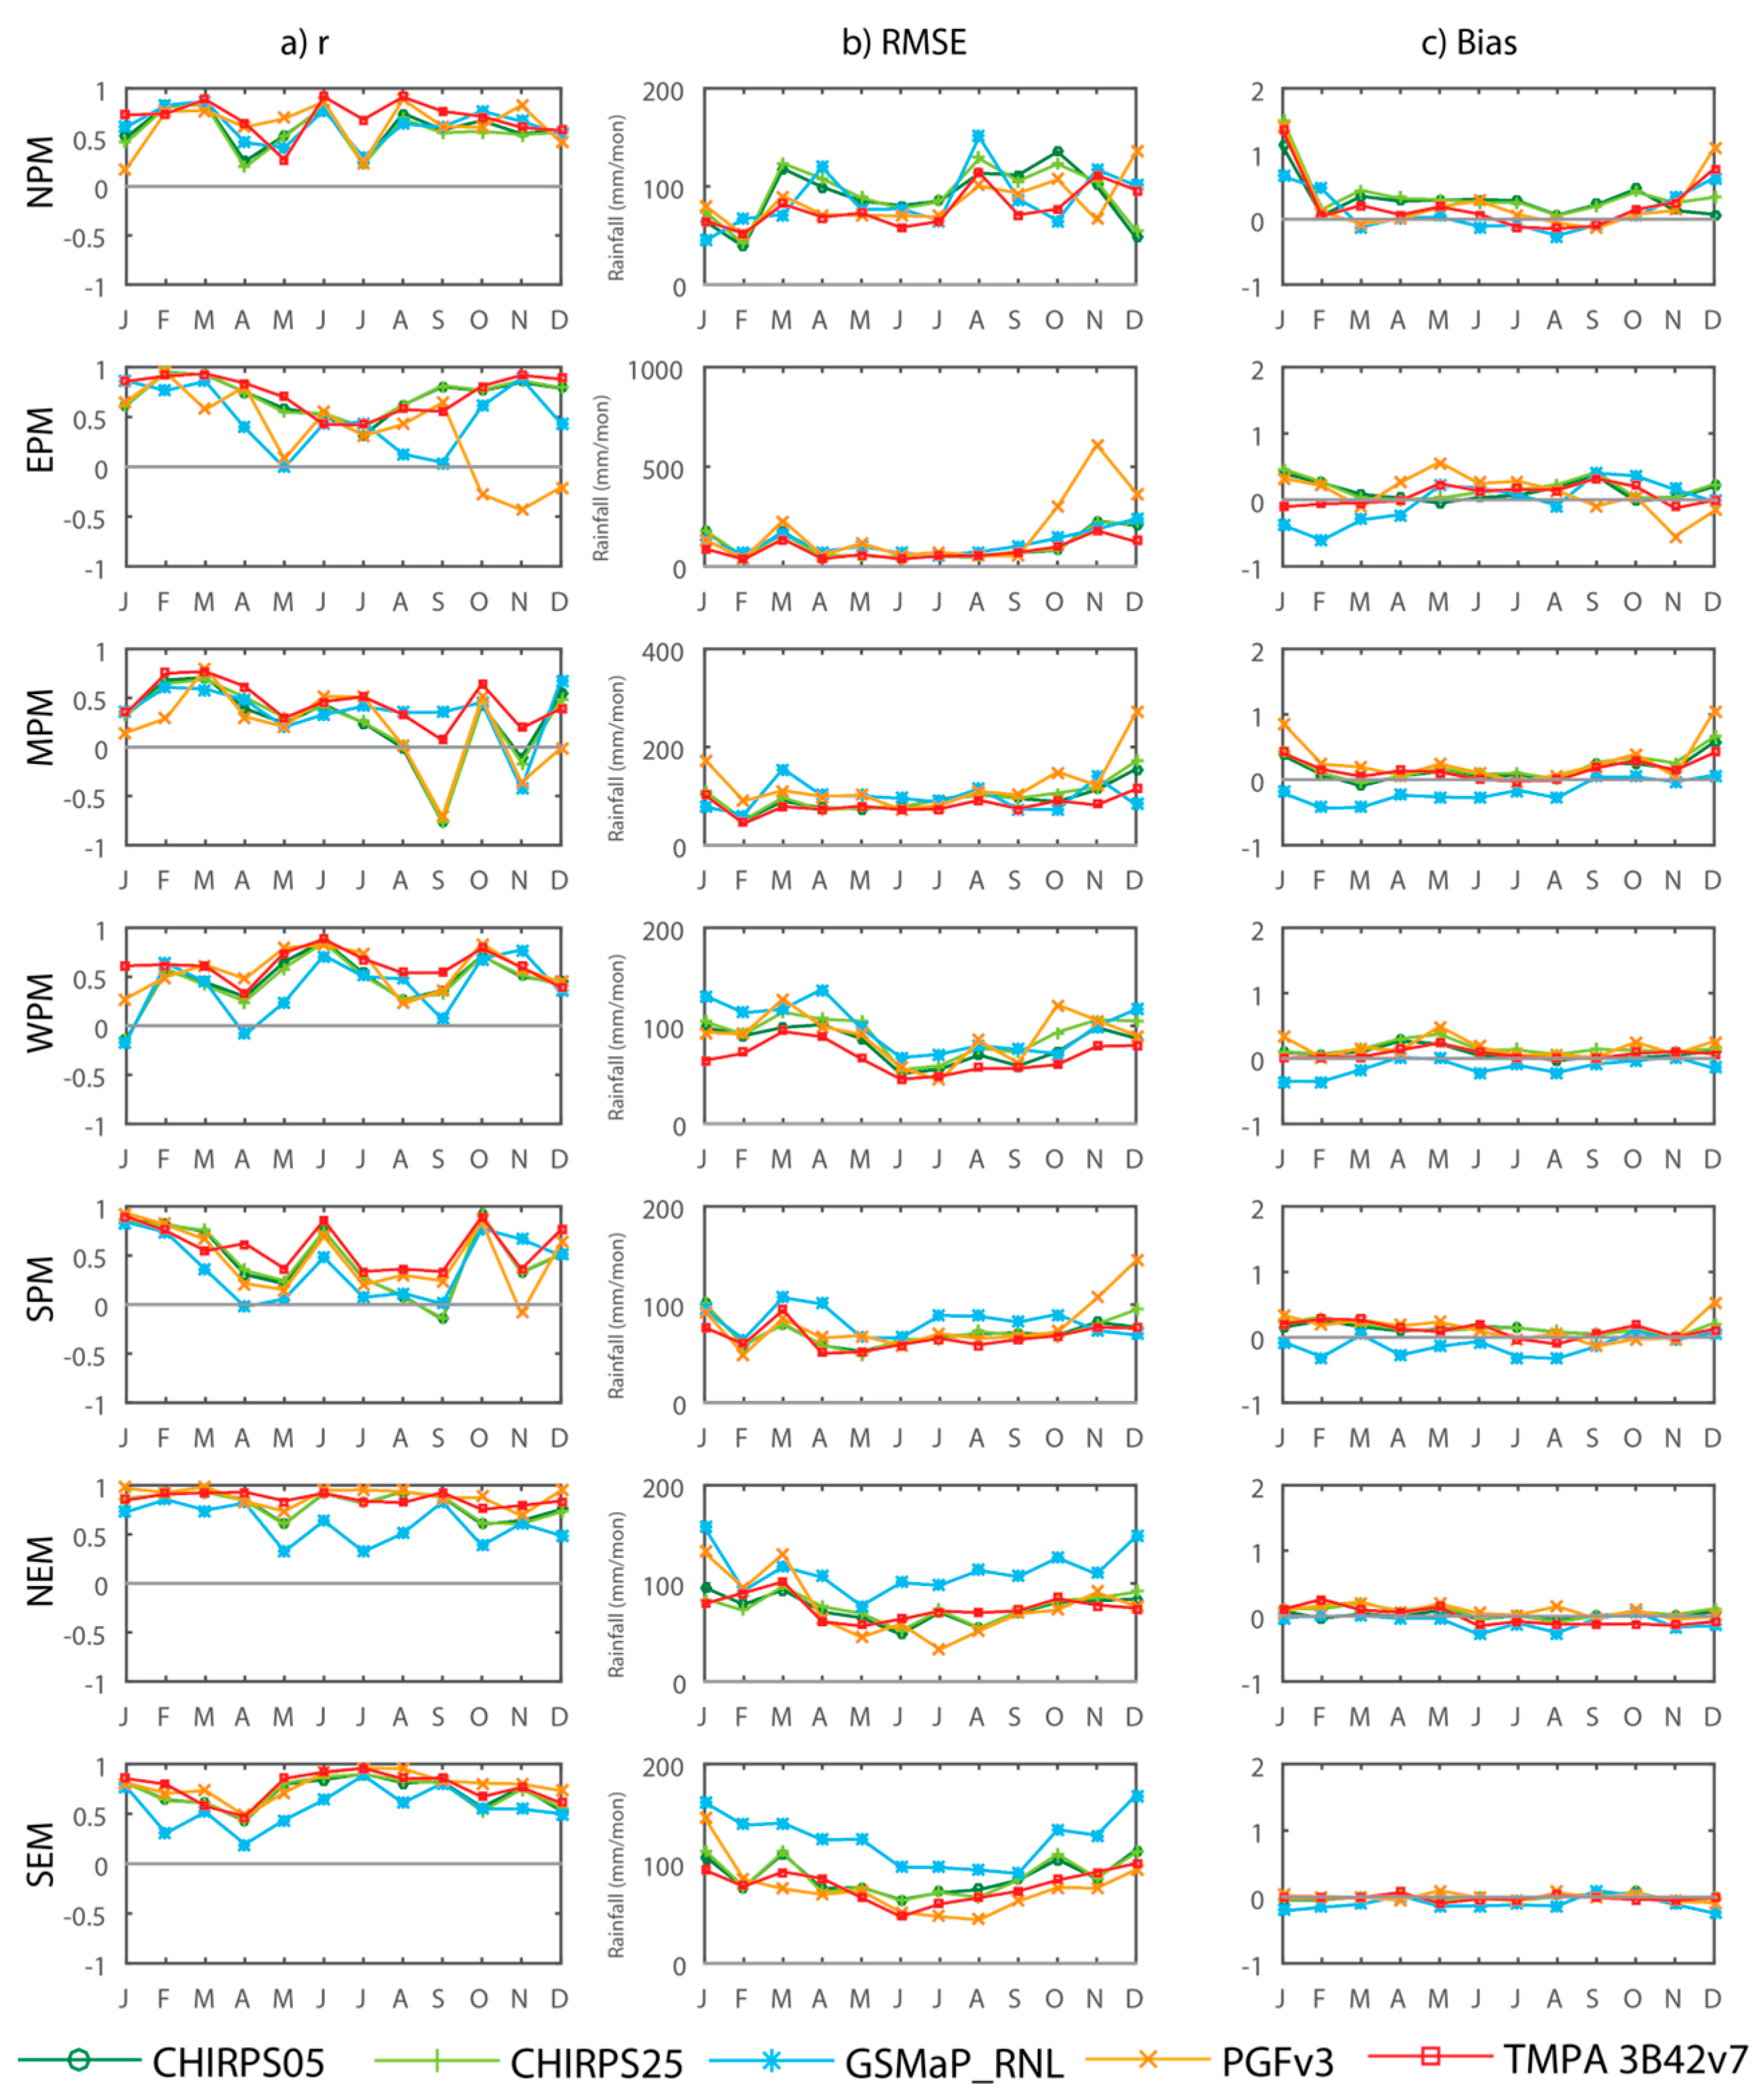
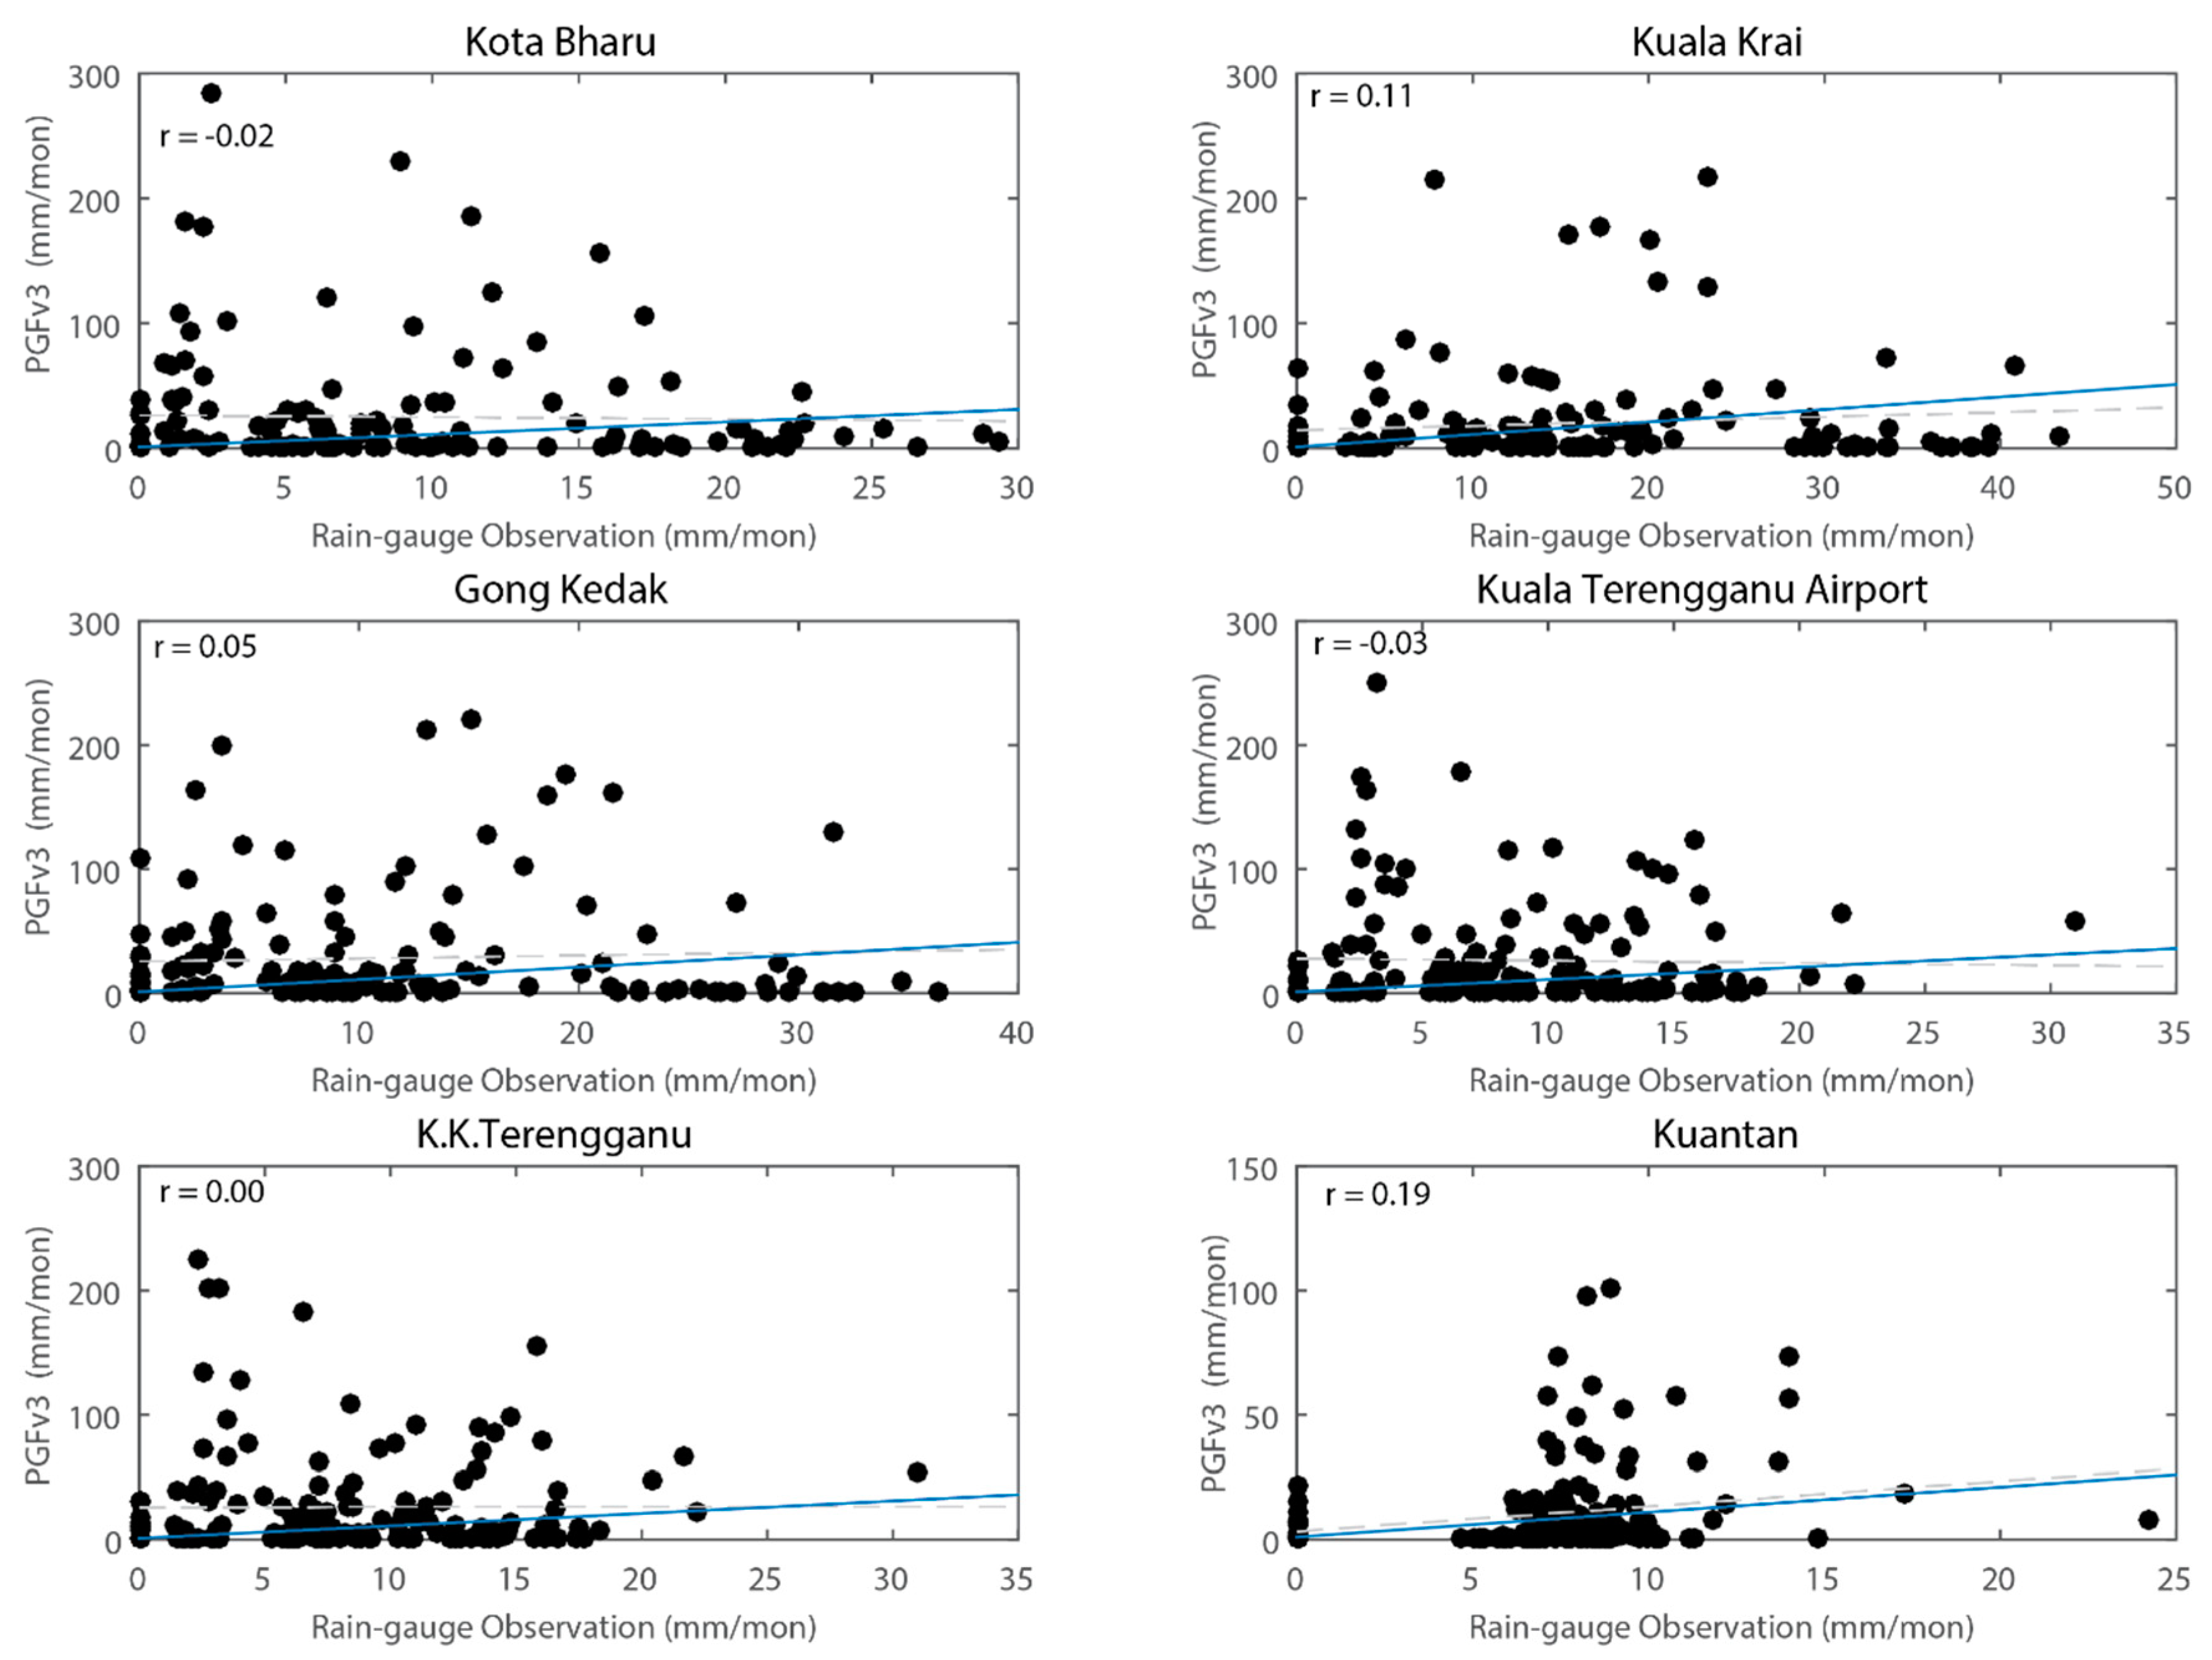
The accuracy of gridded precipitation datasets is also influenced by the seasonality of rainfall in each sub-region (Table 5). The ability of gridded precipitation datasets in approximating the observed rain gauge data is better during the wet season than the dry season, probably due to the capability of the satellite sensor to detect a convective precipitation system [15]. However, the PGFv3 does not seem to have the same characteristic in EPM for the period from October through December where the rainfall is considered high (Figure 3). The scatter plot in Figure 10 shows that PGFv3 was unable to correlate with station data in November, unlike the TMPA 3B42v7 product in Figure 11. This could be contributed by the downscaling application of reanalysis of global datasets [52].
Interpolation techniques within each product may also influence the quality. For example, some products may have better characteristics of precipitation gradient at the edge of the mountains compared with others. 
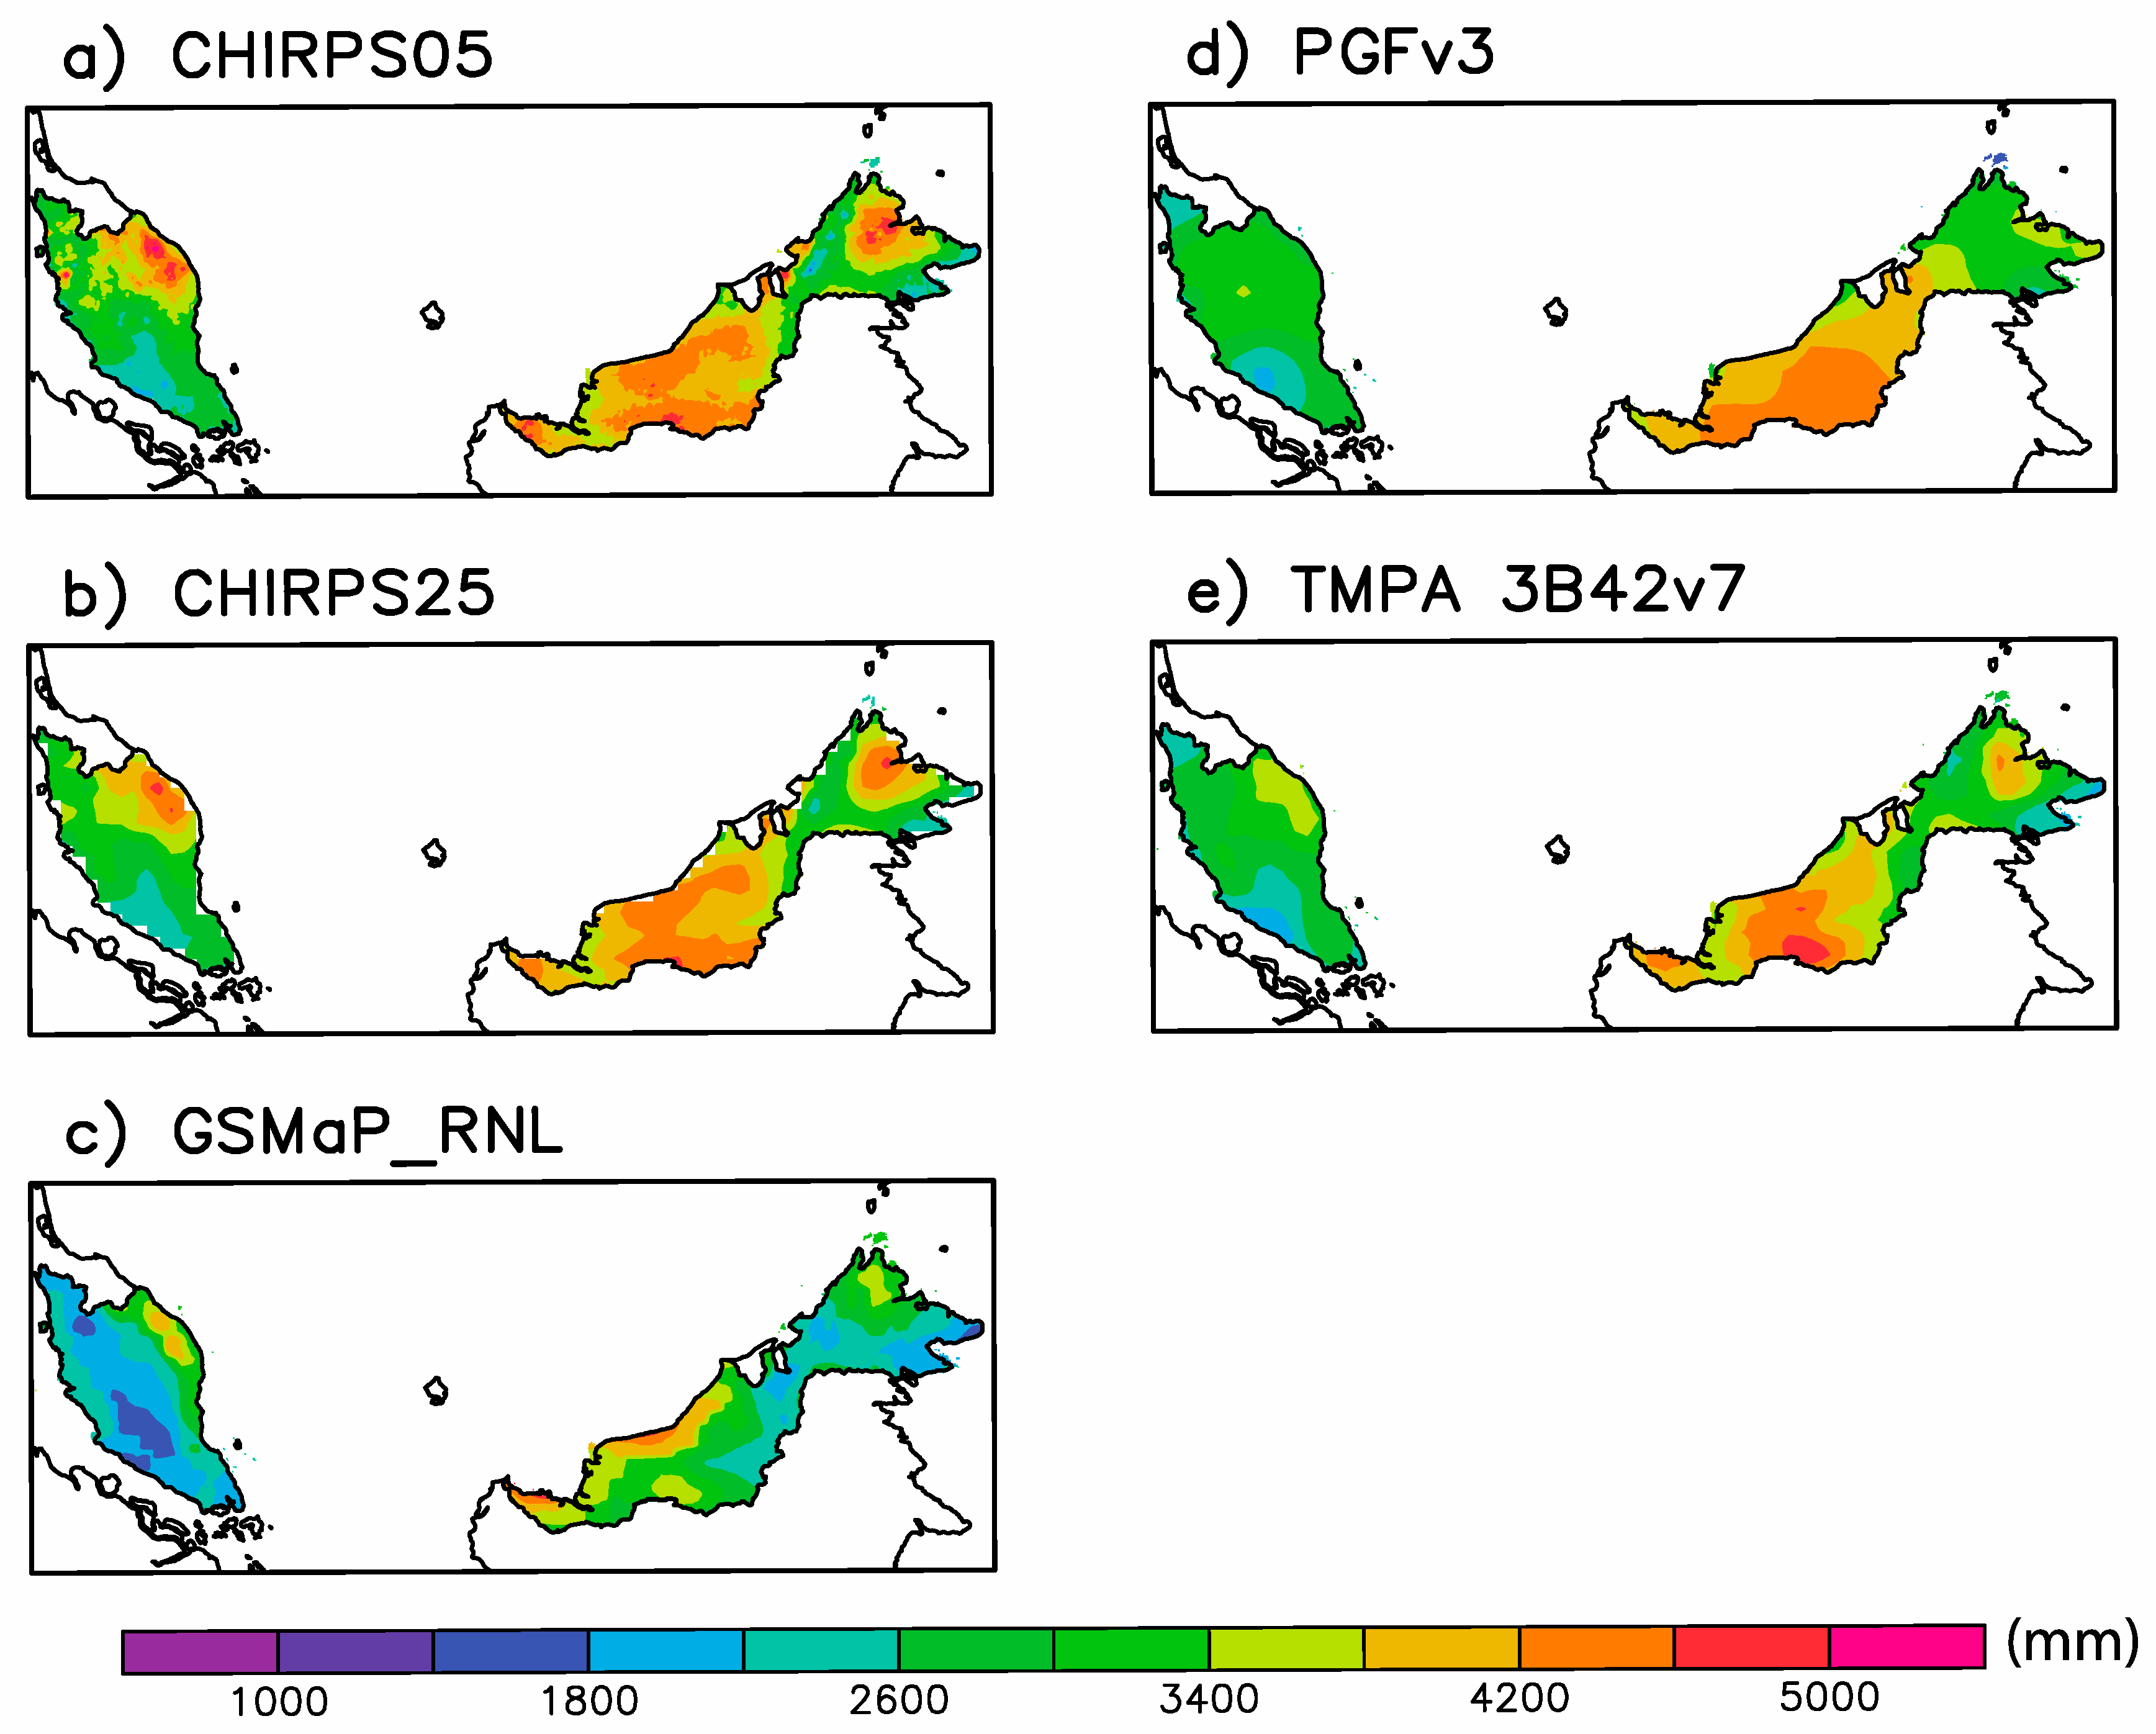
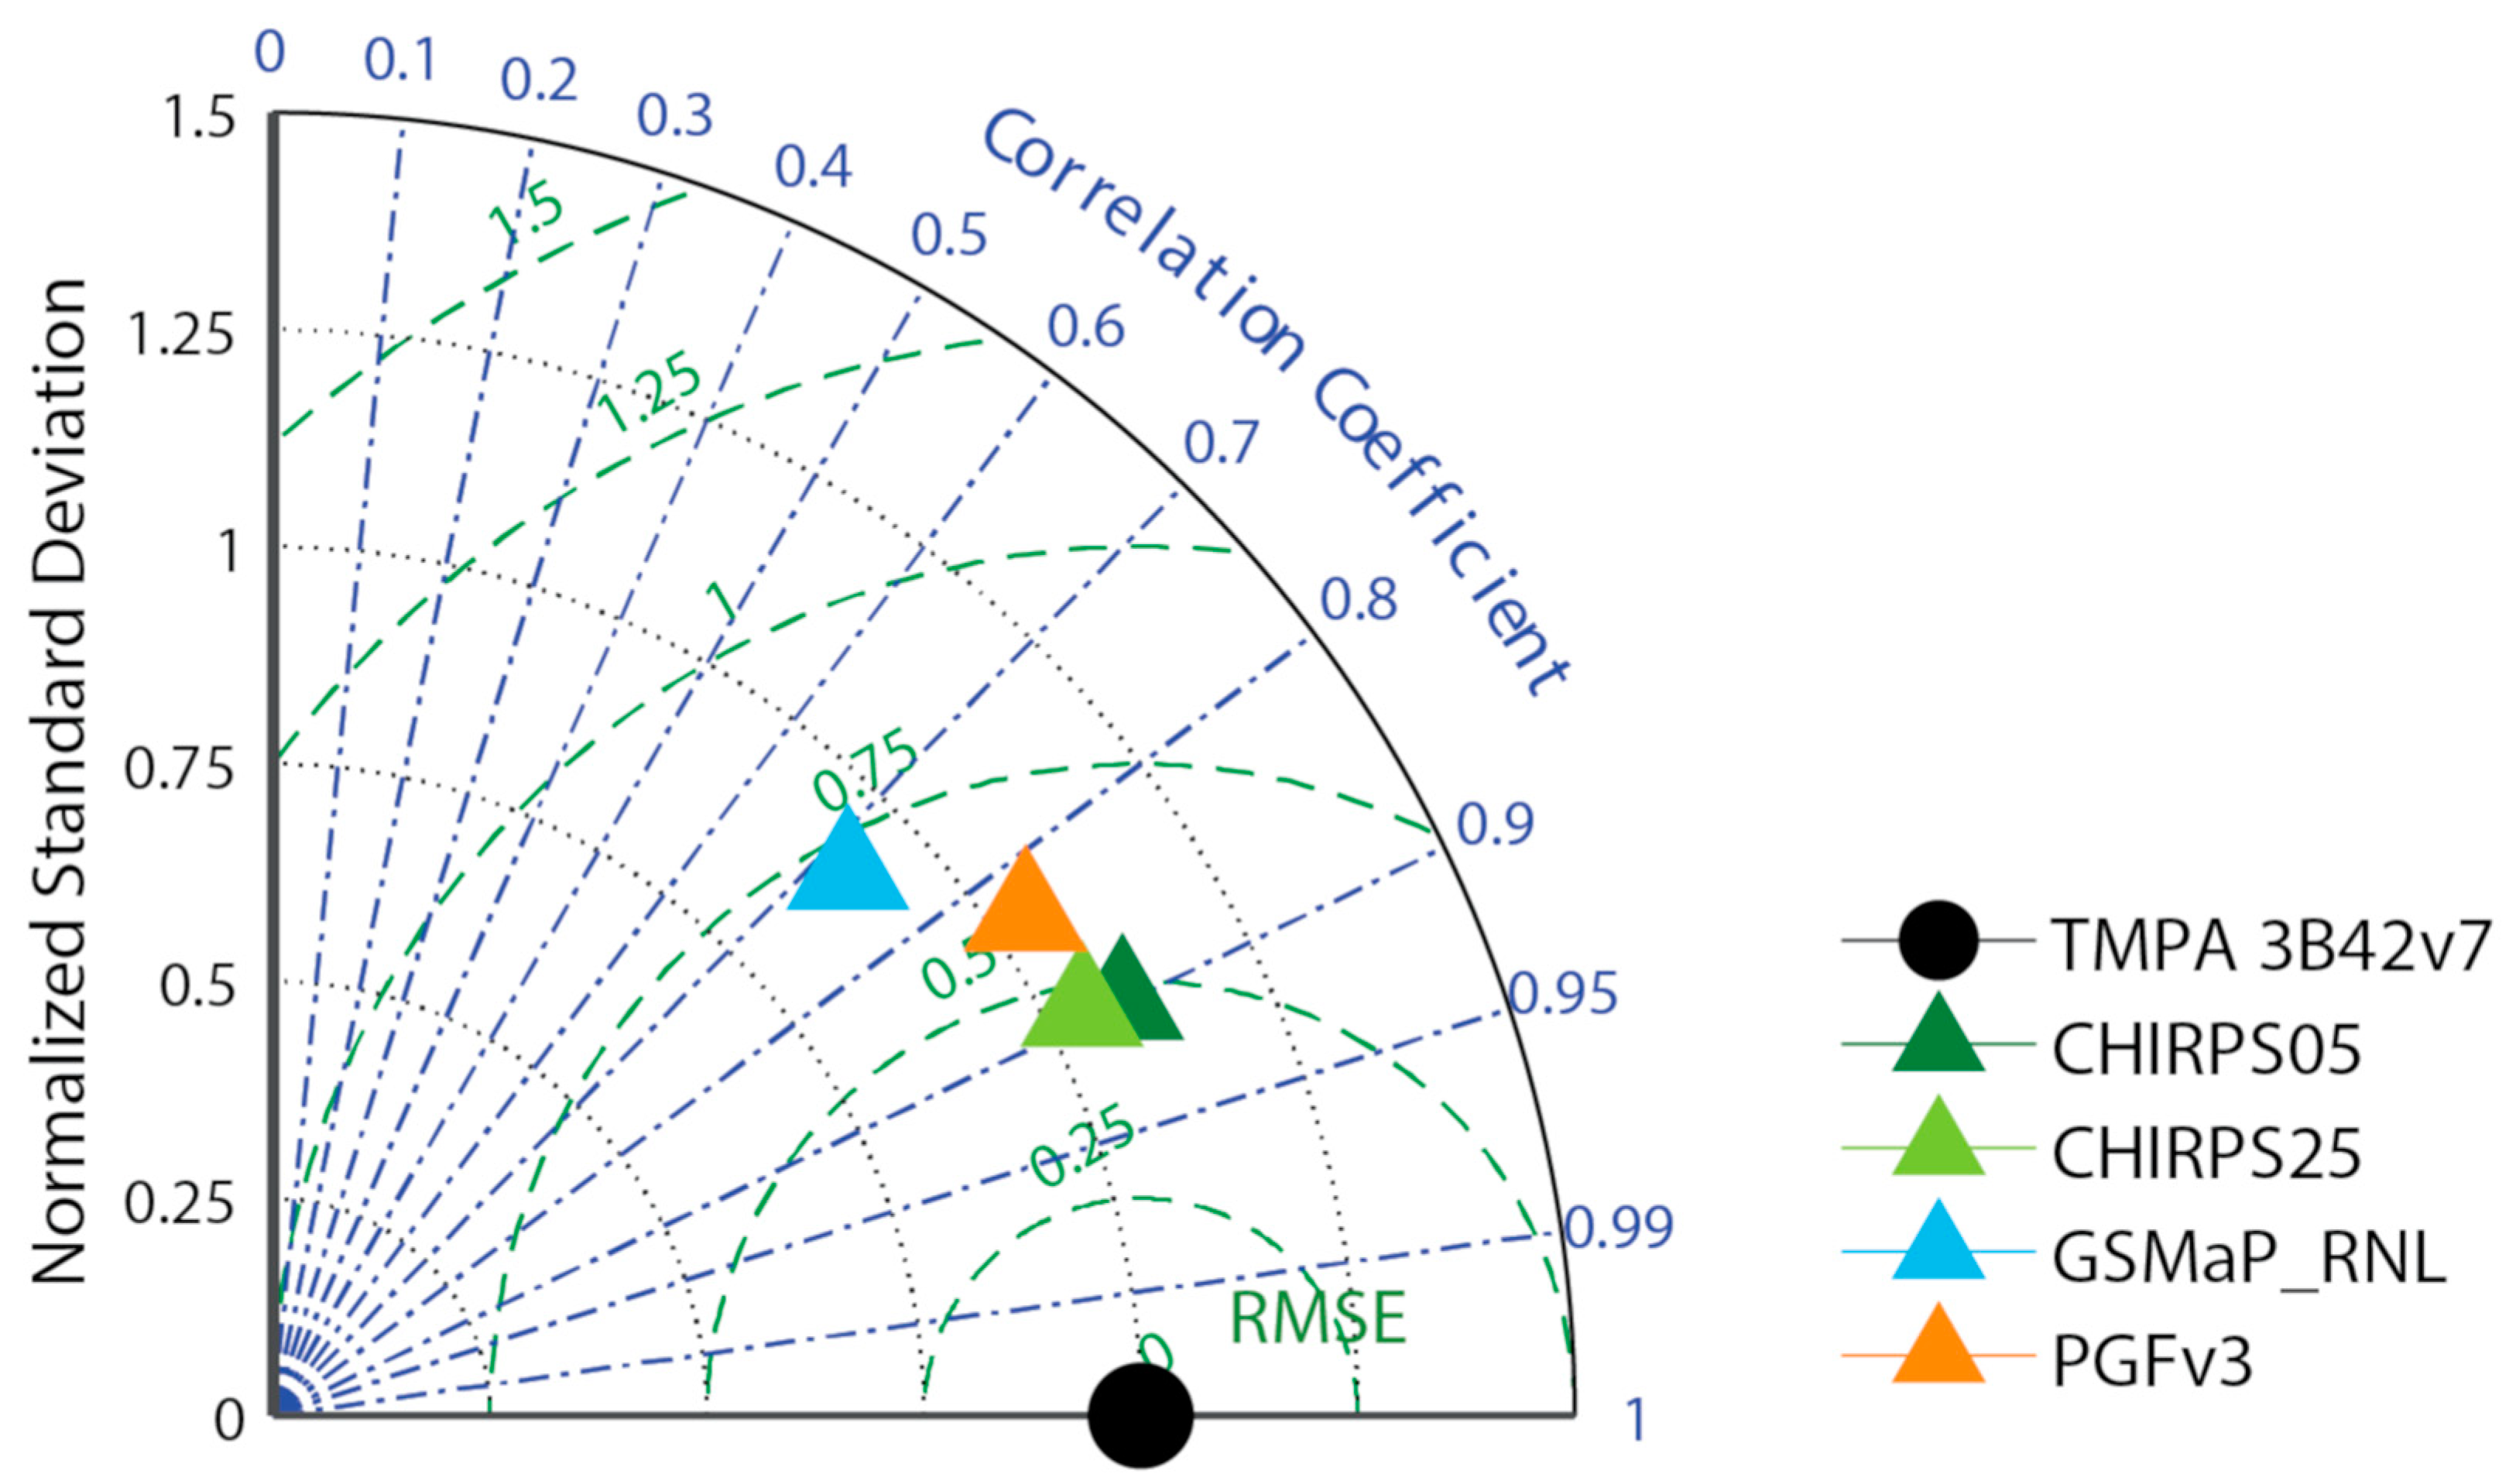
Figure 12 shows the spatial maps of annual rainfall of all products. It appears that the spatial rainfall distribution of TMPA 3B42v7 correlates well with topography with indication of precipitation gradient, both in Peninsular Malaysia and East Malaysia. While similar features are also indicated in CHIRPS and GSMaP_RNL in Peninsular Malaysia, much weak gradient can be seen in PGFv3. Nevertheless, the annual rainfall of GSMaP_RL in WPM and MPM is lower compared with TMPA 3B42v7. In SEM of East Malaysia, the precipitation gradient of GSMaP_RNL appears to be reversed to that of TMPA 3B42v7. In fact, the area of maximum rainfall of TMPA 3B42v7 in SEM was not replicated in GSMaP_RNL. In addition, similar to WPM and MPM, GSMaP_RNL underestimated TMPA 3B42v7 rainfall in northeastern SEM and southern NEM. These differences may be caused by the input data in the products. Using TMPA 3B42v7 as a reference dataset, a Taylor Diagram can be used to provide measures of similarity (in terms of both spatial RMSE and correlation values) among other products (Figure 13). In terms of correlations, both CHRIPS products have the highest values (0.9) followed by PGFv3 (0.84) and GSMaP (0.73). However, based on RMSE, GSMaP_RNL shows the smallest value although GSMaP_RNL tended to underestimate the rain gauge data (Table 4) as well as TMPA 3B42v7.

6. Conclusions

In this study, evaluation of the performance and reliability of five gridded datasets, namely CHIRPS05, CHIRPS25, PGFv3, GSMaP_RNL and TMPA 3B42v7, in approximating rain gauge station observations were conducted. The comparison was assessed for categorical score on daily data and statistical measures for monthly and seasonal timescales from 2008 to 2012. The findings of this study can be summarized as follows:
  • Overall, TMPA 3B42v7 was considered the best product for daily, monthly and seasonal precipitation comparison with rain gauge data based on both the categorical and statistical scores. CHIRPS05 performed slightly better than CHIRPS25 in monthly data, while CHIRPS25 was better at daily precipitation. The GSMaP_RNL had slightly better daily performance compared to TMPA 3B42v7, despite its tendency to underestimate monthly rainfall. Meanwhile, the PGFv3 had the lowest performance in most temporal assessment.
  • Overall, the wet season (DJF) had higher correlations than the dry season (JJA). However, the dry season recorded lower RMSE and has a better bias than the wet season. Therefore, gridded precipitation performs better over sub-regions that receive higher annual precipitation such as NPM and EPM, as well as East Malaysia. Meanwhile, gridded products perform the worst at MPM due to its highly complex terrain. The TMPA 3B42v7 performed consistently well in all regions. The PGFv3 performed rather poorly over EPM but showed high correlation in East Malaysia regions. Meanwhile, GSMaP_RNL performed worst with high underestimation in most regions.
  • For rain detection ability, CHIRPS25 recorded highest Probability of Detection (POD) value followed by TMPA 3B42v7 that recorded low False Alarm Ratio (FAR) and high Critical Success Index (CSI). Meanwhile, GSMaP_RNL showed reasonably good FAR and CSI scores behind TMPA 3B42v7 as well as fair score in POD. PGFv3 showed the poorest score in rain detection ability.
  • Most of the gridded precipitation datasets had a tendency to underestimate no rain (< 1mm/day). For light rain (1–2 mm/day), different gridded datasets show different frequencies with CHIRPS05, and PGFv3 had more than 5% underestimation. In general, all products tended to overestimate from low moderate rain to low heavy rain (2–5 mm/day; 20–50 mm/day). However, all products performed reasonably well for high heavy rain (20–50 mm/day) and slight underestimation for rain above 50 mm/day. Interestingly, the PGFv3 recorded underestimation by more than 5% for 1–2 mm/day and 2–5 mm/day, while having overestimation by 9.5% for 5–10 mm/day and 21% for 10–20 mm/day rainfall categories. Overall, TMPA 3B42v7 and GSMaP_RNL were able to detect extreme events, while other products tended to underestimate.
  • Based on overall performance, TMPA 3B42v7 can be considered as the most appropriate gridded product for climate and meteorological study in Malaysia.

Author Contributions

A.B.A., F.T. and L.J. designed the framework of this study, completed the data collection; A.B.A. and J.X.C. performed the analyses; the manuscript was prepared by A.B.A. and revised by F.T. and L.J.; M.L.T. and J.X.C. provided some useful suggestions. All authors have read and agreed to the published version of the manuscript.

Funding

This research was funded by Universiti Kebangsaan Malaysia, grant number DIP-2017-008.

Acknowledgments

We acknowledge the contribution of the Malaysian Meteorological Department for providing rain gauge data.

Conflicts of Interest

The authors declare no conflict of interest.

Appendix A

Table A1. Location and elevation of 41 rain gauge stations across Malaysia.
Station IDStation NameLatitude (°)Longitude (°)Elevation (m)
Northern Peninsular Malaysia (NPM)
41529Perai5.35100.401.5
48600Pulau Langkawi6.3399.736.4
48601Bayan Lepas5.30100.272.8
48602Butterworth5.47100.382.8
48603Alor Setar6.20100.403.9
48604Chuping6.48100.2721.7
Eastern Peninsular Malaysia (EPM)
48615Kota Bharu6.17102.284.6
48616Kuala Krai5.53102.2068.3
48617Gong Kedak5.80102.486.0
48618Kuala Terengganu Airport5.38103.105.2
48619K. K. Terengganu5.33103.1335.1
48657Kuantan3.78103.2215.3
Middle Peninsular Malaysia (MPM)
48631K. Tanah Rata4.47101.381471.6
48632Cameron Highlands4.47101.371545.0
48642Batu Embun3.97102.3559.5
48649Muadzam Shah3.05103.0833.3
48653Temerloh3.47102.3839.1
Western Peninsular Malaysia (WPM)
48620Sitiawan4.22100.707.0
48623Lubok Merbau4.80100.9077.5
48625Ipoh4.57101.1040.1
48647Subang3.12101.5516.5
48648Petaling Jaya3.10101.6560.8
48650KLIA Sepang2.73101.7016.3
Southern Peninsular Malaysia (SPM)
48665Malacca2.27102.258.5
48670Batu Pahat1.87102.986.3
48672Kluang2.02103.3288.1
48674Mersing2.45103.8343.6
48679Senai1.63103.6737.8
Northern East Malaysia (NEM)
96471Kota Kinabalu5.93116.052.3
96477Kudat6.92116.833.5
96481Tawau4.30118.1217.0
96491Sandakan5.90118.0710.3
96465Labuan5.30115.2529.3
Southern East Malaysia (SEM)
96412Mulu4.05114.8226.2
96413Kuching1.48110.3321.7
96418Sri Aman1.22111.459.6
96421Sibu2.25111.9730.9
96441Bintulu3.20113.0323.1
96449Miri4.33113.9817.0
96450Limbang4.80115.003.6
96420Kapit2.00112.9235.0

References

  1. Yang, Y.; Tang, G.; Lei, X.; Hong, Y.; Yang, N. Can satellite precipitation products estimate probable maximum precipitation: A comparative investigation with gauge data in the Dadu River basin. Remote Sens. 2018, 10, 41. [Google Scholar] [CrossRef] [Green Version]
  2. Hou, A.Y.; Kakar, R.K.; Neeck, S.; Azarbarzin, A.A.; Kummerow, C.D.; Kojima, M.; Oki, R.; Nakamura, K.; Iguchi, T. The global precipitation measurement mission. Bull. Am. Meteorol. Soc. 2014, 95, 701–722. [Google Scholar] [CrossRef]
  3. Ebert, E.E.; Janowial, J.E.; Kidd, C. Comparison of Near-Real-Time Precipitation estimates from satellite observations and numerical models. Am. Meteorol. Soc. 2007, 47–64. [Google Scholar] [CrossRef] [Green Version]
  4. Kidd, C.; Huffman, G. Global precipitation measurement. Meteorol. Appl. 2011, 18, 334–353. [Google Scholar] [CrossRef]
  5. Turk, J.; Bauer, P. The International Precipitation Working Group and its role in the improvement of quantitative precipitation measurements. Bull. Am. Meteorol. Soc. 2006, 87, 643–647. [Google Scholar] [CrossRef] [Green Version]
  6. Juneng, L.; Tangang, F.; Chung, J.X.; Ngai, S.T.; Tay, T.W.; Narisma, G.; Cruz, F.; Phan-Van, T.; Ngo-Duc, T.; Santisirisomboon, J.; et al. Sensitivity of Southeast Asia rainfall simulations to cumulus and air-sea flux parameterizations in RegCM4. Clim. Res. 2016, 69, 59–77. [Google Scholar] [CrossRef]
  7. Huffman, G.J.; Bolvin, D.T.; Nelkin, E.J.; Wolff, D.B.; Adler, R.F.; Gu, G.; Hong, Y.; Bowman, K.P.; Stocker, E.F. The TRMM Multisatellite Precipitation Analysis (TMPA): Quasi-Global, Multiyear, Combined-Sensor Precipitation Estimates at Fine Scales. J. Hydrometeorol. 2007, 8, 38–55. [Google Scholar] [CrossRef]
  8. Adler, R.F.; Huffman, G.J.; Chang, A.; Ferraro, R.; Xie, P.-P.; Janowiak, J.; Rudolf, B.; Schneider, U.; Curtis, S.; Bolvin, D.; et al. The Version-2 Global Precipitation Climatology Project (GPCP) Monthly Precipitation Analysis (1979–Present). J. Hydrometeorol. 2003, 4, 1147–1167. [Google Scholar] [CrossRef]
  9. Ashouri, H.; Hsu, K.L.; Sorooshian, S.; Braithwaite, D.K.; Knapp, K.R.; Cecil, L.D.; Nelson, B.R.; Prat, O.P. PERSIANN-CDR: Daily precipitation climate data record from multisatellite observations for hydrological and climate studies. Bull. Am. Meteorol. Soc. 2015, 96, 69–83. [Google Scholar] [CrossRef] [Green Version]
  10. Joyce, R.J.; Janowiak, J.E.; Arkin, P.A.; Xie, P. CMORPH: A Method that Produces Global Precipitation Estimates from Passive Microwave and Infrared Data at High Spatial and Temporal Resolution. J. Hydrometeorol. 2004, 5, 487–503. [Google Scholar] [CrossRef]
  11. Yatagai, A.; Kamiguchi, K.; Arakawa, O.; Hamada, A.; Yasutomi, N.; Kitoh, A. Aphrodite constructing a long-term daily gridded precipitation dataset for Asia based on a dense network of rain gauges. Bull. Am. Meteorol. Soc. 2012, 93, 1401–1415. [Google Scholar] [CrossRef]
  12. Varikoden, H.; Samah, A.A.; Babu, C.A. Spatial and temporal characteristics of rain intensity in the peninsular Malaysia using TRMM rain rate. J. Hydrol. 2010, 387, 312–319. [Google Scholar] [CrossRef] [Green Version]
  13. Semire, F.A.; Mohd-mokhtar, R.; Ismail, W.; Mohamad, N.; Mandeep, J.S. Ground validation of space-borne satellite rainfall products in Malaysia. Adv. Sp. Res. 2012, 50, 1241–1249. [Google Scholar] [CrossRef]
  14. Tan, M.L.; Ibrahim, A.L.; Duan, Z.; Cracknell, A.P.; Chaplot, V. Evaluation of Six High-Resolution Satellite and Ground-Based Precipitation Products over Malaysia. Remote Sens. 2015, 7, 1504–1528. [Google Scholar] [CrossRef] [Green Version]
  15. Tan, M.L.; Santo, H. Comparison of GPM IMERG, TMPA 3B42 and PERSIANN-CDR satellite precipitation products over Malaysia. Atmos. Res. 2018, 202, 63–76. [Google Scholar] [CrossRef]
  16. Soo, E.Z.X.; Jaafar, W.Z.W.; Lai, S.H.; Islam, T.; Srivastava, P. Evaluation of satellite precipitation products for extreme flood events: Case study in Peninsular Malaysia. J. Water Clim. Chang. 2018, 10, 1–22. [Google Scholar] [CrossRef]
  17. Tangang, F.T.; Juneng, L.; Salimun, E.; Sei, K.M.; Le, L.J.; Muhamad, H. Climate change and variability over Malaysia: Gaps in science and research information. Sains Malaysiana 2012, 41, 1355–1366. [Google Scholar]
  18. Funk, C.; Peterson, P.; Landsfeld, M.; Pedreros, D.; Verdin, J.; Shukla, S.; Husak, G.; Rowland, J.; Harrison, L.; Hoell, A.; et al. The climate hazards infrared precipitation with stations — a new environmental record for monitoring extremes. Sci. Data 2015, 2, 1–21. [Google Scholar] [CrossRef] [Green Version]
  19. Sheffield, J.; Goteti, G.; Wood, E.F. Development of a 50-Year High-Resolution Global Dataset of Meteorological Forcings for Land Surface Modeling. J. Clim. 2006, 19, 3088–3111. [Google Scholar] [CrossRef] [Green Version]
  20. Kubota, T.; Hashizume, H.; Shige, S.; Okamoto, K.; Aonashi, K.; Takahashi, N.; Ushio, T.; Kachi, M. Global precipitation map using satelliteborne microwave radiometers by the GSMaP project: Production and validation. Int. Geosci. Remote Sens. Symp. 2007, 45, 2259–2275. [Google Scholar] [CrossRef]
  21. Bayissa, Y.; Tadesse, T.; Demisse, G.; Shiferaw, A. Evaluation of Satellite-Based Rainfall Estimates and Application to Monitor Meteorological Drought for the Upper Blue Nile Basin, Ethiopia. Remote Sens. 2017, 9, 669. [Google Scholar] [CrossRef] [Green Version]
  22. Tesfaye, G.; Tadesse, T.; Gessesse, B.; Dinku, T. Validation of new satellite rainfall products over the Upper Blue Nile. Atmos. Meas. Tech. 2017, 11, 1–24. [Google Scholar]
  23. Bai, L.; Shi, C.; Li, L.; Yang, Y.; Wu, J. Accuracy of CHIRPS satellite-rainfall products over mainland China. Remote Sens. 2018, 10, 362. [Google Scholar] [CrossRef] [Green Version]
  24. Nogueira, S.M.C.; Moreira, M.A.; Volpato, M.M.L. Evaluating precipitation estimates from Eta, TRMM and CHRIPS data in the south-southeast region of Minas Gerais state-Brazil. Remote Sens. 2018, 10, 1–16. [Google Scholar]
  25. Javier, F.; Trejo, P.; Civil, D.D.I.; Llanos, U.D.L.; Zamora, E.; Carlos, S.; Peñaloza-murillo, M.A.; Moreno, M.A.; Farías, A. Intercomparison of improved satellite rainfall estimation with CHIRPS gridded product and rain gauge data over Venezuela. Atmósfera 2016, 29, 323–342. [Google Scholar]
  26. Duan, Z.; Liu, J.; Tuo, Y.; Chiogna, G.; Disse, M. Evaluation of eight high spatial resolution gridded precipitation products in Adige Basin (Italy) at multiple temporal and spatial scales. Sci. Total Environ. 2016, 573, 1536–1553. [Google Scholar] [CrossRef] [Green Version]
  27. Guo, H.; Bao, A.; Liu, T.; Ndayisaba, F.; He, D.; Kurban, A.; De Maeyer, P. Meteorological drought analysis in the Lower Mekong Basin using satellite-based long-term CHIRPS product. Sustainability 2017, 9, 901. [Google Scholar] [CrossRef] [Green Version]
  28. Setiawan, A.M.; Koesmaryono, Y.; Faqih, A.; Gunawan, D. Observed and blended gauge-satellite precipitation estimates perspective on meteorological drought intensity over South Sulawesi, Indonesia. In Proceedings of the IOP Conference Series: Earth and Environmetal Science, Bali, Indonesia, 25–27 October 2016. [Google Scholar]
  29. Gao, F.; Zhang, Y.; Ren, X.; Yao, Y.; Hao, Z.; Cai, W. Evaluation of CHIRPS and its application for drought monitoring over the Haihe River Basin, China. Nat. Hazards 2018, 92, 155–172. [Google Scholar] [CrossRef]
  30. Ning, S.; Song, F.; Udmale, P.; Jin, J.; Thapa, B.R.; Ishidaira, H. Error Analysis and Evaluation of the Latest GSMap and IMERG Precipitation Products over Eastern China. Adv. Meteorol. 2017, 2017, 1–16. [Google Scholar] [CrossRef] [Green Version]
  31. Saber, M.; Yilmaz, K.K. Evaluation and bias correction of satellite-based rainfall estimates for modelling flash floods over the Mediterranean region: Application to Karpuz River Basin, Turkey. Water (Switzerland) 2018, 10, 657. [Google Scholar] [CrossRef] [Green Version]
  32. Hur, J.; Raghavan, S.V.; Nguyen, N.S.; Liong, S. Evaluation of High-Resolution Satellite Rainfall Data Over Singapore. Procedia Eng. 2016, 154, 158–167. [Google Scholar] [CrossRef] [Green Version]
  33. Tangang, F.T.; Juneng, L.; Salimun, E.; Vinayachandran, P.N.; Seng, Y.K.; Reason, C.J.C.; Behera, S.K.; Yasunari, T. On the roles of the northeast cold surge, the Borneo vortex, the - Julian Oscillation, and the Indian Ocean Dipole during the extreme 2006//2007 flood in southern Peninsular Malaysia. Geophys. Res. Lett. 2008, 35, 1–6. [Google Scholar] [CrossRef]
  34. Jamaluddin, A.F.; Tangang, F.; Chung, J.X.; Juneng, L.; Sasaki, H.; Takayabu, I. Investigating the mechanisms of diurnal rainfall variability over Peninsular Malaysia using the non-hydrostatic regional climate model. Meteorol. Atmos. Phys. 2018, 130, 611–633. [Google Scholar] [CrossRef]
  35. Chin, R.J.; Lai, S.H.; Chang, K.B.; Othman, F.; Jaafar, W.Z.W. Analysis of rainfall events over Peninsular Malaysia. Weather 2016, 71, 118–123. [Google Scholar] [CrossRef] [Green Version]
  36. Hai, O.S.; Samah, A.A.; Chenoli, S.N.; Subramaniam, K.; Mazuki, M.Y.A. Extreme rainstorms that caused devastating flooding across the east coast of Peninsular Malaysia during November and December 2014. Weather Forecast. 2017, 32, 849–872. [Google Scholar] [CrossRef]
  37. World Meteorological Organization. Guide to Climatological Practices; World Meteorological Organization: Geneva, Switzerland, 2011; ISBN 978-92-63-10100-6. [Google Scholar]
  38. Suhaila, J.; Jemain, A.A. Investigating the impacts of adjoining wet days on the distribution of daily rainfall amounts in Peninsular Malaysia. J. Hydrol. 2009, 368, 17–25. [Google Scholar] [CrossRef]
  39. Aonashi, K.; Awaka, J.; Hirose, M.; Kozu, T.; Kubota, T.; Liu, G.; Shige, S.; Kida, S.; Seto, S.; Takahashi, N.; et al. GSMaP Passive Microwave Precipitation Retrieval Algorithm: Algorithm Description and Validation. J. Meteorol. Soc. Japan 2009, 87A, 119–136. [Google Scholar] [CrossRef] [Green Version]
  40. Ushio, T.; Sasahige, K.; Kubota, T.; Shige, S.; Okamoto, K.; Aonashi, K.; Inuoe, T.; Takahashi, N.; Iguchi, T.; Kachi, M.; et al. A Kalman Filter Approach to the Global Satellite Mapping of Precipitation (GSMaP) from Combined Passive Microwave and Infrared Radiometric Data. J. Meteorol. Soc. Japan 2009, 87A, 137–151. [Google Scholar] [CrossRef] [Green Version]
  41. Chaney, N.W.; Sheffield, J.; Villarini, G.; Wood, E.F. Development of a high-resolution gridded daily meteorological dataset over sub-Saharan Africa: Spatial analysis of trends in climate extremes. J. Clim. 2014, 27, 5815–5835. [Google Scholar] [CrossRef]
  42. Huffman, G.J.; Bolvin, D.T. TRMM and Other Data Precipitation Data Set Documentation. Available online: https://pmm.nasa.gov/sites/default/files/document_files/3B42_3B43_doc_V7_180426.pdf (accessed on 15 August 2018).
  43. Jolliffe, I.T.; Stephenson, D.B. Forecast Verification A Pratictioner’s Guide in Atmospheric Science; John Wiley & Sons: Hoboken, NJ, USA, 2003. [Google Scholar]
  44. Tan, M.L.; Samat, N.; Chan, N.W.; Roy, R. Hydro-meteorological assessment of three GPM Satellite Precipitation Products in the Kelantan River Basin, Malaysia. Remote Sens. 2018, 10, 1011. [Google Scholar] [CrossRef] [Green Version]
  45. Wang, W.; Lu, H.; Zhao, T.; Jiang, L.; Shi, J. Evaluation and Comparison of Daily Rainfall From Latest GPM and TRMM Products Over the Mekong River Basin. IEEE J. Sel. Top. Appl. Earth Obs. Remote Sens. 2017, 10, 2540–2549. [Google Scholar] [CrossRef]
  46. World Meteorological Organization. Guide to Meteorological Instruments and Methods of Observation; World Meteorological Organization: Geneva, Switzerland, 2008; ISBN 978-92-63-100085. [Google Scholar]
  47. Varikoden, H.; Preethi, B.; Samah, A.A.; Babu, C.A. Seasonal variation of rainfall characteristics in different intensity classes over Peninsular Malaysia. J. Hydrol. 2011, 404, 99–108. [Google Scholar] [CrossRef]
  48. Wei, G.; Lü, H.; Crow, W.T.; Zhu, Y.; Wang, J.; Su, J. Evaluation of satellite-based precipitation products from IMERG V04A and V03D, CMORPH and TMPA with gauged rainfall in three climatologic zones in China. Remote Sens. 2018, 10, 30. [Google Scholar] [CrossRef] [Green Version]
  49. Hu, Q.; Li, Z.; Wang, L.; Huang, Y.; Wang, Y.; Li, L. Rainfall spatial estimations: A review from spatial interpolation to multi-source data merging. Water 2019, 11, 579. [Google Scholar] [CrossRef] [Green Version]
  50. Zad, S.N.M.; Zulkafli, Z.; Muharram, F.M. Satellite rainfall (TRMM 3B42-V7) performance assessment and adjustment over Pahang river basin, Malaysia. Remote Sens. 2018, 10, 1–24. [Google Scholar]
  51. Domenikiotis, C.; Spiliotopoulos, M.; Galakou, E.; Dalezios, N.R. Assessment of the Cold Cloud Duration (CCD) Methodology for Rainfall Estimation in Central Greece. In Proceedings of the Geographical Information Systems and Remote Sensing: Environmental Applications, Volos, Greece, 7–9 November 2003; pp. 185–194. [Google Scholar]
  52. Brands, S.; Gutiérrez, J.M.; Herrera, S.; Cofiño, A.S. On the use of reanalysis data for downscaling. J. Clim. 2012, 25, 2517–2526. [Google Scholar] [CrossRef] [Green Version]
Figure 1. Rain gauge locations in Peninsular Malaysia and East Malaysia indicated by triangles. The location of station in mountainous region is denoted with green triangles, while the blue triangles indicate stations affected by the 2006/2007 flood event.
Remotesensing 12 00613 g001
Figure 2. The 2-D histogram of total monthly rainfall station data compared to: (a) CHIRPS05, (b) CHIRPS25, (c) GSMaP_RNL, (d) PGFv3 and (e) TMPA 3B42v7. The right scale in the y-axis indicates count of points.
Remotesensing 12 00613 g002
Figure 3. Values of statistical measures of CHIRPS05, CHIRPS25, GSMaP_RNL, PGFv3 and TMPA 3B42v7: (a) Pearson Correlation Coefficient, r, (b) Root Mean Squared Error, RMSE, (c) Bias, B for each month for seven sub-regions in Malaysia.
Remotesensing 12 00613 g003
Figure 4. Performance measures of CHIRPS05, CHIRPS25, GSMaP_RNL, PGFv3 and TRMM according to seven sub-regions based on monthly data. (a) Correlation, r, (b) Root Mean Squared Error, RMSE, (c) Bias.
Remotesensing 12 00613 g004
Figure 5. Monthly categorical performance scores of CHIRPS05, CHIRPS25, GSMaP_RNL, PGFv3 and TMPA 3B42v7 based on daily data: (a) POD, (b) FAR, (c) CSI.
Remotesensing 12 00613 g005
Figure 6. The overall performance scores of gridded precipitation products according to sub-regions based on daily data: (a) POD, (b) FAR, (c) CSI.
Remotesensing 12 00613 g006
Figure 7. The daily precipitation distribution for different intensity classes over Malaysia from 2008 to 2012 between station data and five gridded precipitation products.
Remotesensing 12 00613 g007
Figure 8. Time series of daily rainfall for six rain gauge stations during the 2006/2007 flood event.
Remotesensing 12 00613 g008
Figure 9. Scatter plot of TMPA 3B42v7 for five rain gauge locations in Middle Peninsular Malaysia (MPM).
Remotesensing 12 00613 g009
Figure 10. Scatter plot of PGFv3 for six rain gauge locations in East Peninsular Malaysia (EPM) on November.
Remotesensing 12 00613 g010
Figure 11. Same as Figure 10, but for TMPA 3B42v7.
Remotesensing 12 00613 g011
Figure 12. The spatial distribution of annual rainfall of all products. (a) CHIRPS05, (b) CHIRPS25, (c) GSMaP_RNL, (d) PGFv3, (e) TMPA 3B42v7.
Remotesensing 12 00613 g012
Figure 13. Taylor diagram of all gridded rainfall products using TMPA 3B42v7 as a reference dataset.
Remotesensing 12 00613 g013
Table 1. Summary of five gridded precipitation products evaluated in this study including input data and related satellite sensors.
DatasetsInput Data & SensorsPeriodSpatial/Finest Temporal ResolutionCoverage
CHIRPS05CHIRPS-CHPclim, NOAA/TMPA-IR(CCD), gauge1981–Present0.05°/Daily50°N–50°S
CHIRPS251981–Present0.25°/Daily50°N–50°S
GSMaP_RNLTRMM-TMI, Aqua-AMSR-E, DMSP-SSMI, CPC(NOAA)-IR, JRA-552000–20140.10°/1-Hourly60°N–60°S
PGFv3NCEP-NCAR reanalysis, CRU TS2.0, GPCP, TRMM RT, gauge1948–20160.25°/3-Hourly90°N–90°S
TMPA 3B42v7TRMM-TCI, TRMM-TMI, DMSP-SSMI, DMSP-SSMIS, ASMR-E, NOAA-AMSU, NOAA/MetOp-A-MHS, IR, Gauge1998–Present0.25°/3-Hourly50°N–50°S
Table 2. Statistical measures (Gi, rain gauge measurement; Ḡi, mean rain gauge measurement; Si, gridded rainfall estimate; S ¯ i , mean gridded rainfall estimate; and n, number of data pairs).
NameFormulaPerfect Score
Pearson Correlation Coefficient, r ( G i   G ¯ i ) ( S i   S ¯ i ) ( G i   G ¯ i ) 2 ( S i   S ¯ i ) 2 1
Root Mean Squared Error, RMSE 1 n ( S i G i ) 2 0
Relative Bias, Bias S i G i 1 0
Table 3. Categorical performance measures for comparing station and gridded precipitation data.
NameFormulaPerfect Score
Probability of detection, POD A A + C 1
False Alarm Ratio, FAR B A + B 0
Critical Success Index, CSI A A + B + C 1
Table 4. Summary of statistical measures for five monthly gridded precipitation datasets. The best values for each statistical indicator are shown in bold.
DatasetrRMSE (mm/mon)Bias
CHIRPS050.8398.010.06
CHIRPS250.82100.700.08
GSMaP_RNL0.76117.56−0.11
PGFv30.62138.400.03
TMPA 3B42v70.8784.910.02
Table 5. Seasonal values of statistical measures of CHIRPS05, CHIRPS25, GSMaP_RNL, PGFv3 and TMPA 3B42v7. The best values for each indicator are in bold.
CHIRPS05CHIRPS25GSMaP_RNLPGFv3TMPA 3B42v7
DJFr0.640.620.580.570.72
RMSE (mm/mon)93.8398.17113.81119.6679.87
Bias0.180.25−0.090.310.18
MAMr0.580.580.390.590.66
RMSE (mm/mon)86.2188.97109.9591.8176.53
Bias0.100.13−0.100.150.09
JJAr0.590.590.490.640.69
RMSE (mm/mon)69.0570.1787.7763.0262.48
Bias0.060.08−0.150.080.00
SONr0.530.520.520.460.66
RMSE (mm/mon)94.7997.52104.53122.4883.30
Bias0.100.130.050.010.06
Table 6. Categorical performance scores of daily precipitations: POD (Probability of Detection), False Alarm Ratio (FAR), and Critical Success Index (CSI). The best values for each result statistical indicator are in bold.
DatasetPODFARCSI
CHIRPS050.780.400.51
CHIRPS250.860.420.53
GSMaP_RNL0.780.320.57
PGFv30.720.450.45
TMPA 3B42v70.800.310.59
Table 7. Performance measures of CHIRPS05, CHIRPS25, GSMaP_RNL, PGFv3 and TMPA 3B42v7 in affected stations during flood event 2006/2007. The best values are in bold.
STATION ID/NAME CHIRPS05CHIRPS25GSMaP_RNLPGFv3TMPA 3B42v7
48679/Senair0.710.680.670.400.86
RMSE (mm/mon)91.3391.4868.64101.7847.66
Bias−0.48−0.47−0.13−0.61−0.01
48672/Kluangr0.530.590.860.380.93
RMSE (mm/mon)86.8983.4243.9395.4538.66
Bias−0.49−0.44−0.13−0.680.04
48670/Batu Pahatr0.780.800.910.340.95
RMSE (mm/mon)33.9033.8338.4442.5829.59
Bias−0.15−0.180.75−0.420.56
48674/Mersingr0.740.810.840.050.71
RMSE (mm/mon)63.0262.9665.4090.7461.60
Bias−0.36-0.38−0.57−0.62−0.22
48649/Muadzam Shahr0.610.690.810.430.87
RMSE (mm/mon)59.3857.5547.6873.3634.55
Bias−0.29−0.29−0.37−0.66−0.15
48657/Kuantanr0.660.800.890.870.90
RMSE (mm/mon)45.5338.2244.4940.6326.79
Bias−0.16−0.05−0.62−0.51−0.20

