Article

Regional Level Data Server for Fire Hazard Evaluation and Fuel Treatments Planning

by
Goran Krsnik
1,*,
Eduard Busquets Olivé
1,
Míriam Piqué Nicolau
2,
Asier Larrañaga
3,
Adrián Cardil
1,4,5,
Jordi García-Gonzalo
2 and
José Ramón González Olabarría
2
1
Forest Science and Technology Centre of Catalonia (CTFC), Ctra. Sant Llorenç de Morunys, Km 2, 25280 Solsona (Lleida), Spain
2
JRU CTFC-AGROTECNIO, Ctra. Sant Llorenç de Morunys, Km 2, 25280 Solsona (Lleida), Spain
3
Bombers-GRAF, Fire Department, Government of Catalonia, Ctra. Universitat Autònoma s/n, 08290 Cerdanyola del Vallès (Barcelona), Spain
4
School of Agrifood and Forestry Science and Engineering, University of Lleida, Av. de l’Alcalde Rovira Roure, 191, 25198 Solsona (Lleida), Spain
5
Tecnosylva, Calle Nicostrato Vela s/n, 24009 León, Spain
*
Author to whom correspondence should be addressed.
Remote Sens. 2020, 12(24), 4124; https://doi.org/10.3390/rs12244124
Submission received: 3 November 2020 / Revised: 13 December 2020 / Accepted: 16 December 2020 / Published: 17 December 2020
(This article belongs to the Special Issue LiDAR Remote Sensing of Forest Resources and Wildland Fires)

Abstract

:
Both fire risk assessment and management of wildfire prevention strategies require different sources of data to represent the complex geospatial interaction that exists between environmental variables in the most accurate way possible. In this sense, geospatial analysis tools and remote sensing data offer new opportunities for estimating fire risk and optimizing wildfire prevention planning. Herein, we presented a conceptual design of a server that contained most variables required for predicting fire behavior at a regional level. For that purpose, an innovative and elaborated fuel modelling process and parameterization of all needed environmental and climatic variables were implemented in order to enable to more precisely define fuel characteristics and potential fire behaviors under different meteorological scenarios. The server, open to be used by scientists and technicians, is expected to be the steppingstone for an integrated tool to support decision-making regarding prevention and management of forest fires in Catalonia.

Graphical Abstract

1. Introduction

The use of spatial explicit tools that support management decisions is becoming a common practice to mitigate the negative impact of wildfires [1,2,3,4]. As in any type of decision, when planning fire prevention strategies and assessing fire risk, a set of criteria and their importance has to be set in accordance with the problem’s specific requirements. The risk values, potential post-fire recovery of the ecosystem, and the candidate management options are basic information sources that usually are considered when planning preventive measure. Still, there is a criterion that always requires consideration when planning mitigation actions, i.e., the potential behavior of fire. The probability of fire occurrence over a period of time, the expected spread and intensity of single events, or the accompanying severity, defines how prone an area is to be affected by fires. Moreover, it helps anticipate the impact of those fires on the natural resources and human made infrastructures. Therefore, having at the disposition of researchers and technicians a server with all the information required to evaluate fuel hazards and fire behaviors should be used to decide and apply management actions that aim to mitigate the negative impact of wildfires on human and environmental resources [5].
New remote sensing tools have provided a new capacity to assess the state of the forest over large areas. The use of satellite multispectral images and airborne LIDAR (Laser Imaging Detection and Ranging) has implemented an important step ahead to gather spatial information on the structure of vegetation [6,7,8,9,10] and canopy characteristics [7,9,11], distribution of fuel types [7], and their temporal changes due to forest management and forest disturbances [12,13,14]. Fire risk evaluation has taken advantage of these tools, both to support decisions at strategic [15,16,17] and tactical level [18], especially if the data precision/resolution is appropriate. In this sense, Rodriguez and Silva et al. [19] proposed a methodology for determining operational priorities for fire prevention and suppression activities, Salis et al. [20] modelled the effects of fuel treatments on the potential fire spread and behavior. Alcasena et al. [21] and Salis et al. [22] analyzed the fire exposure of highly valued resources and assets. Riley et al. [23] suggested a model-based framework to evaluate alternative wildfire suppression strategies. González-Olabarría et al. [24] identified areas where fuel management had to be implemented to support suppression efforts.
Fire simulation and modelling allows for the estimation of fire behavior and spread in complex fire environments [25,26], considering different inputs such as ignition location, elevation, fuels, canopy characteristics, weather, and fuel moisture. Different modelling approaches allow for the application of outputs in many ways. This allows one to plan and conduct prescribed fires by analyzing temporal windows to reach specific purposes depending on fire behavior [27], assess the effectiveness of fuel treatments [20,28], evaluate fire behavior for all the cells in a landscape [29,30], asses direct hazard and risk [31,32], estimate burn probabilities [33,34], or analyze fire exposure [21]. Although fire simulations can be focused on specific fires, either in the past or happening in real-time [35,36], the use of simulation outputs for tactical or strategic management planning requires fuel moisture and weather scenarios adjusted to the historical data of areas with an homogenous fire regime [32,37,38,39,40].
Fires are the main cause of forest damage in the Mediterranean region. Apart from ending up with serious environmental and ecologic damage, they generate an important economic loss. Therefore, in these regions, they are perceived by the public as the main environmental problem, especially amid climate change. Having available actualized data on forest fuel characteristics and evaluation of potential fire risk via simulation of fire behavior are required steps on the way towards successful decision-making regarding fire prevention and suppression. Moreover, developing an open server, where maps of all variables are required to simulate fires, including elevation, fuels, canopy characteristics, and weather scenarios. Further, they provide a harmonized and easy to apply framework for many technicians and researchers working on fire-related topics, with the additional advantage of comparability between results that can hardly be achieved if the baseline information is generated independently and based on different methodologies. In this sense, the LANDFIRE (LF) Program in the United States began the process of providing consistent national biological/ecological inventory data [41] with an increased concern about the number, severity, and size of wildfires. LF provides the current state of vegetation, fuels, and fire regimes at a national scale, and the data have become a critical piece of wildfire modelling, research, planning, and operational support for fire management [41].
Although several studies on forest fires characterization and modelling have been implemented across Southern Europe, and specifically in Catalonia [42,43,44,45,46,47], an exhaustive research with a strong geospatial component that could define fuel models and fire behavior, has not yet been conducted. For this purpose, two methodologically different datasets have been developed: (1) data related to the biophysical environmental characteristics and (2) data related to potential fire weather conditions. The first dataset provides a set of georeferenced variables from different datasets, on the state and arrangement of fuels, that helps to simulate forest fires, its behavior. It also evaluates fire hazard across landscapes even if fires are not simulated. The second dataset corresponds to the climatic conditions required to simulate relevant historical fires or fires under extreme weather conditions. In this manuscript, we presented the methodology to generate all information required to assess fire hazards and simulate fire behavior, combining multiple datasets from biophysical variables to allometric functions, meteorological records, and readjustments based on expert knowledge. The resulting database is presented as an evolving server that will be further developed to explore preventive measures at a regional level.

2. Materials and Methods

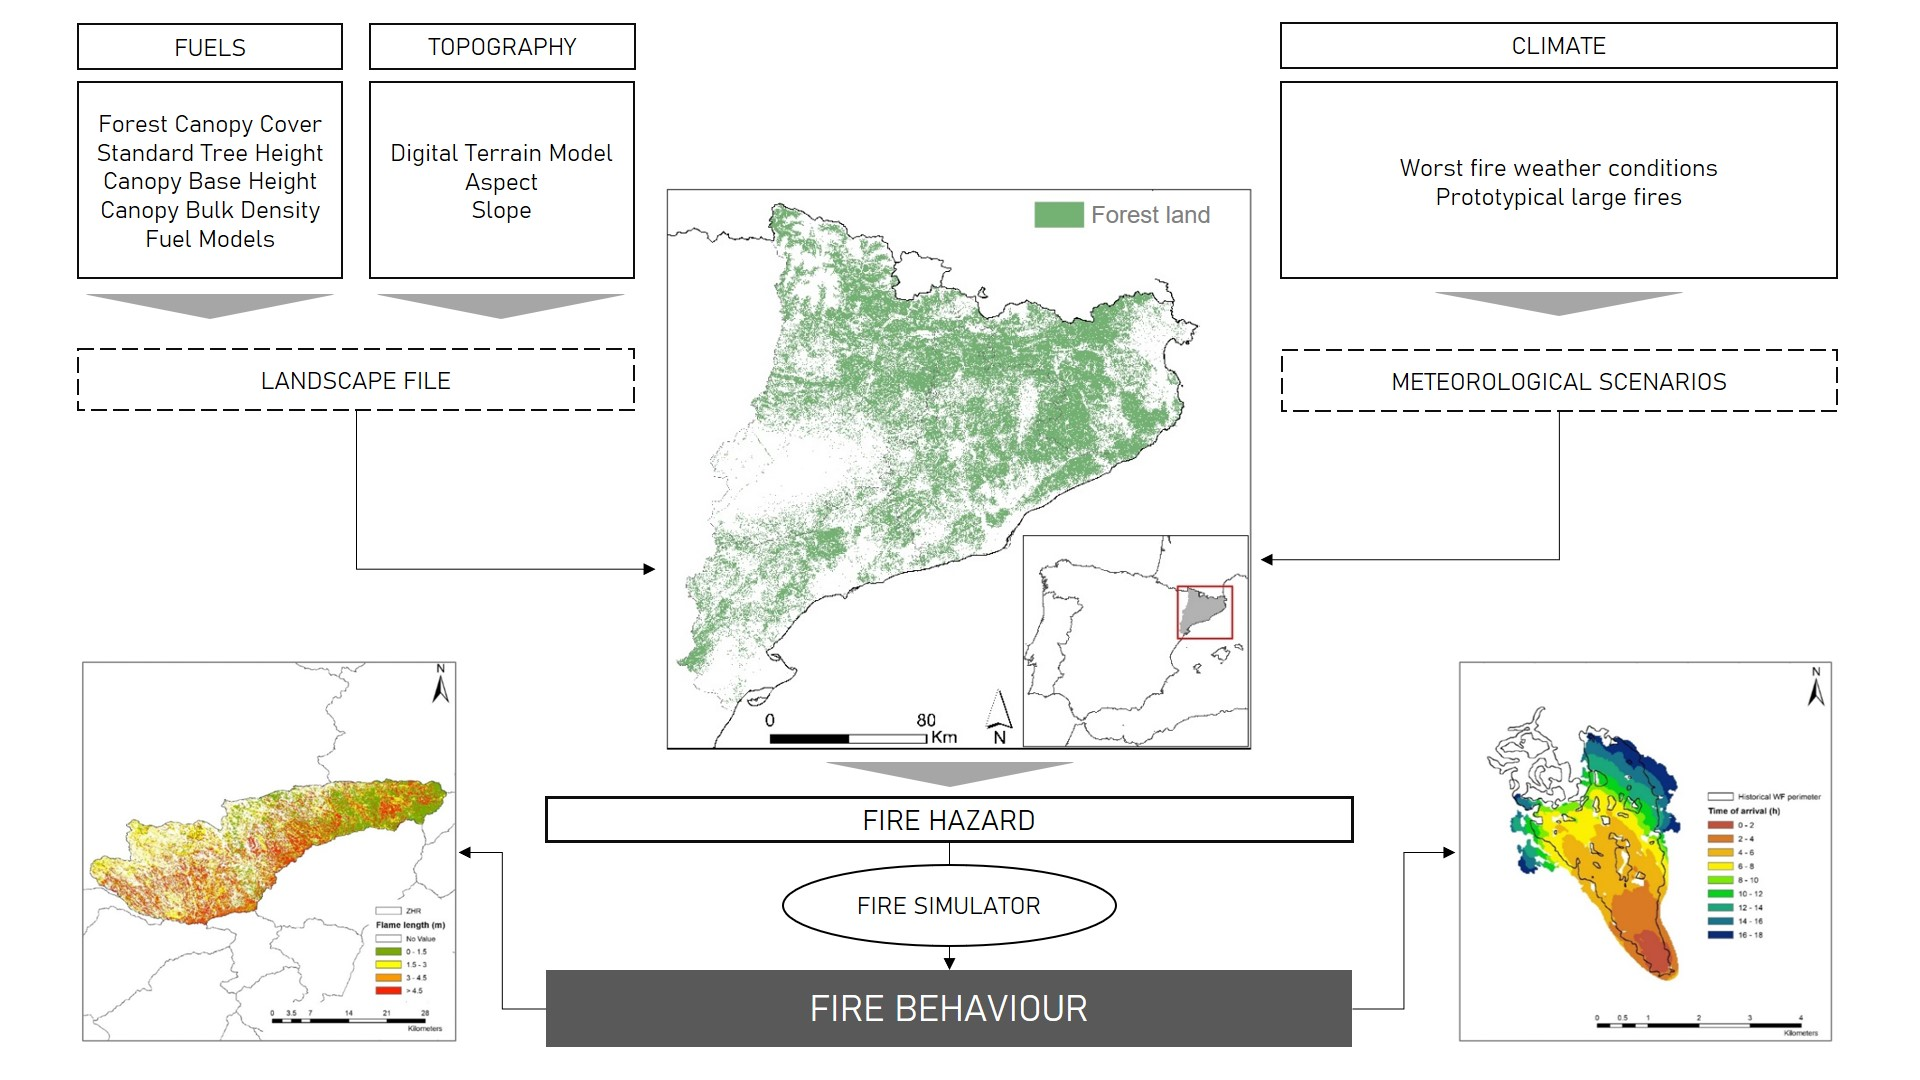
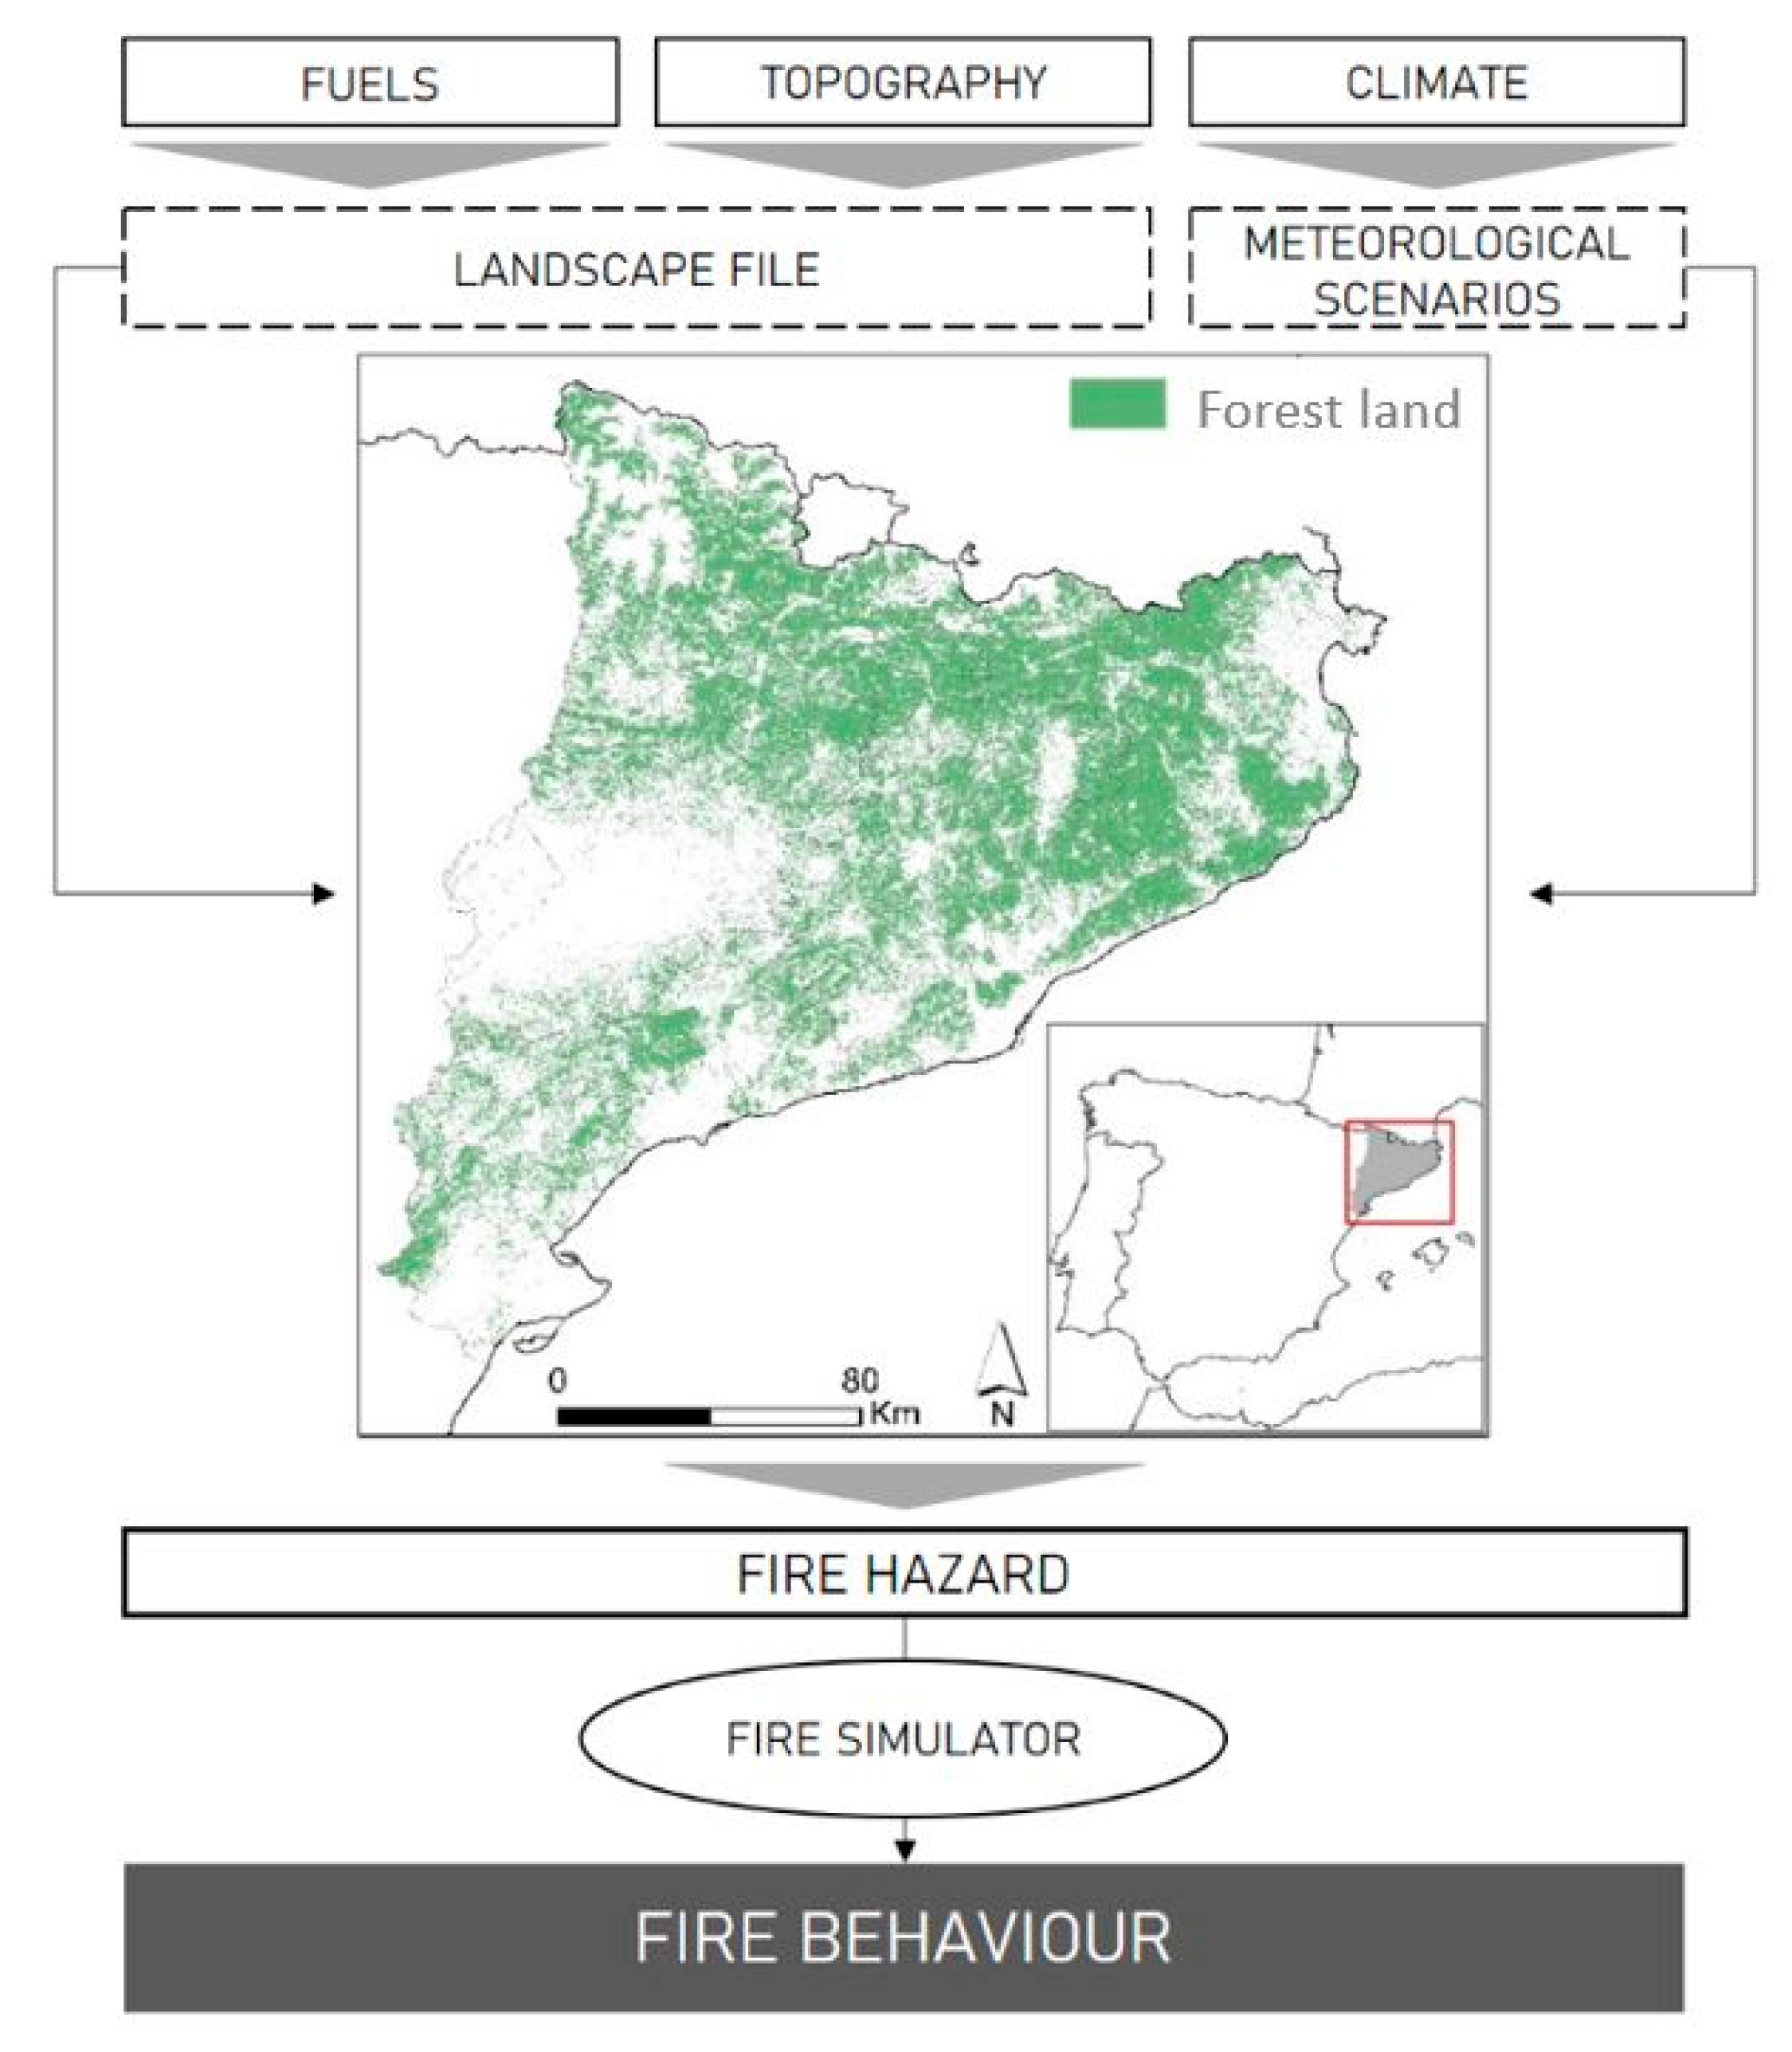
2.1. Study Site and Methodological Approach

Our study was performed in the autonomous community of Catalonia, which is located in the northeastern part of Spain. According to the Land Cover Map of Catalonia, 42% of the approximate 32,000 km2 of the Catalan territory is classified as wooded forest area [48]. Around 75% of forests is privately owned, and due to high level of fragmentation of the land holdings, developing and implementing adequate forest management plans is still a challenge in the region [49]. The most dominant species regarding stocking are Pinus sylvestris, Pinus halepensis, and Quercus ilex [50]. According to the Köppen climate classification [51], the biggest part of Catalonia corresponds to the temperate climate type (C climates); Csa (Hot-summer Mediterranean climate) is the dominant one. Nevertheless, in the northernmost part of the study area (the Pyrenees and Pre-Pyrenees zones), D climates (mostly Dsb and Dsc) are also common. Finally, in the western part of the study area, dry climates (BSk) can be found [52].
During the last 33 years, 21,686 forest fires have been detected across Catalonia, with about 265,000 ha of forest area burned [53]. Thus, forest fire risk management is crucial in order to find efficient ways of minimizing fire damages [54]. Therefore, it is necessary to dispose of an accurate and continuous spatial database, bearing in mind all specific parameters that have a strong influence on fire behavior modelling (Figure 1). However, oversimplifications regarding the compositional variability of Mediterranean forests should be avoided. For example, forest type classification data and species is crucial as it frames relations between structural features that are captured through remote sensing means and others that need to be defined through allometric parametrization. Furthermore, the combination of forest typologies and fuel arrangement also frames the potential forest management alternatives that can be implemented.
Variables representing the landscape and meteorological scenario data represents the base for each fire simulation; therefore, the initial aim was to unite and organize these datasets in order to be used by fire simulators and evaluate fire behavior characteristics. Generation process of both datasets encompasses the workflow where data, obtained from different databases, underwent several transformations, parametrizations, and geospatial analysis, depending on the nature of the data, initial data type, and data characteristics required by the simulators. A certain amount of data was already freely available and ready to be used. Other datasets, nevertheless, needed to be parameterized and estimated by implementing different spatial modelling processes.

2.2. Fire Hazard Evaluation

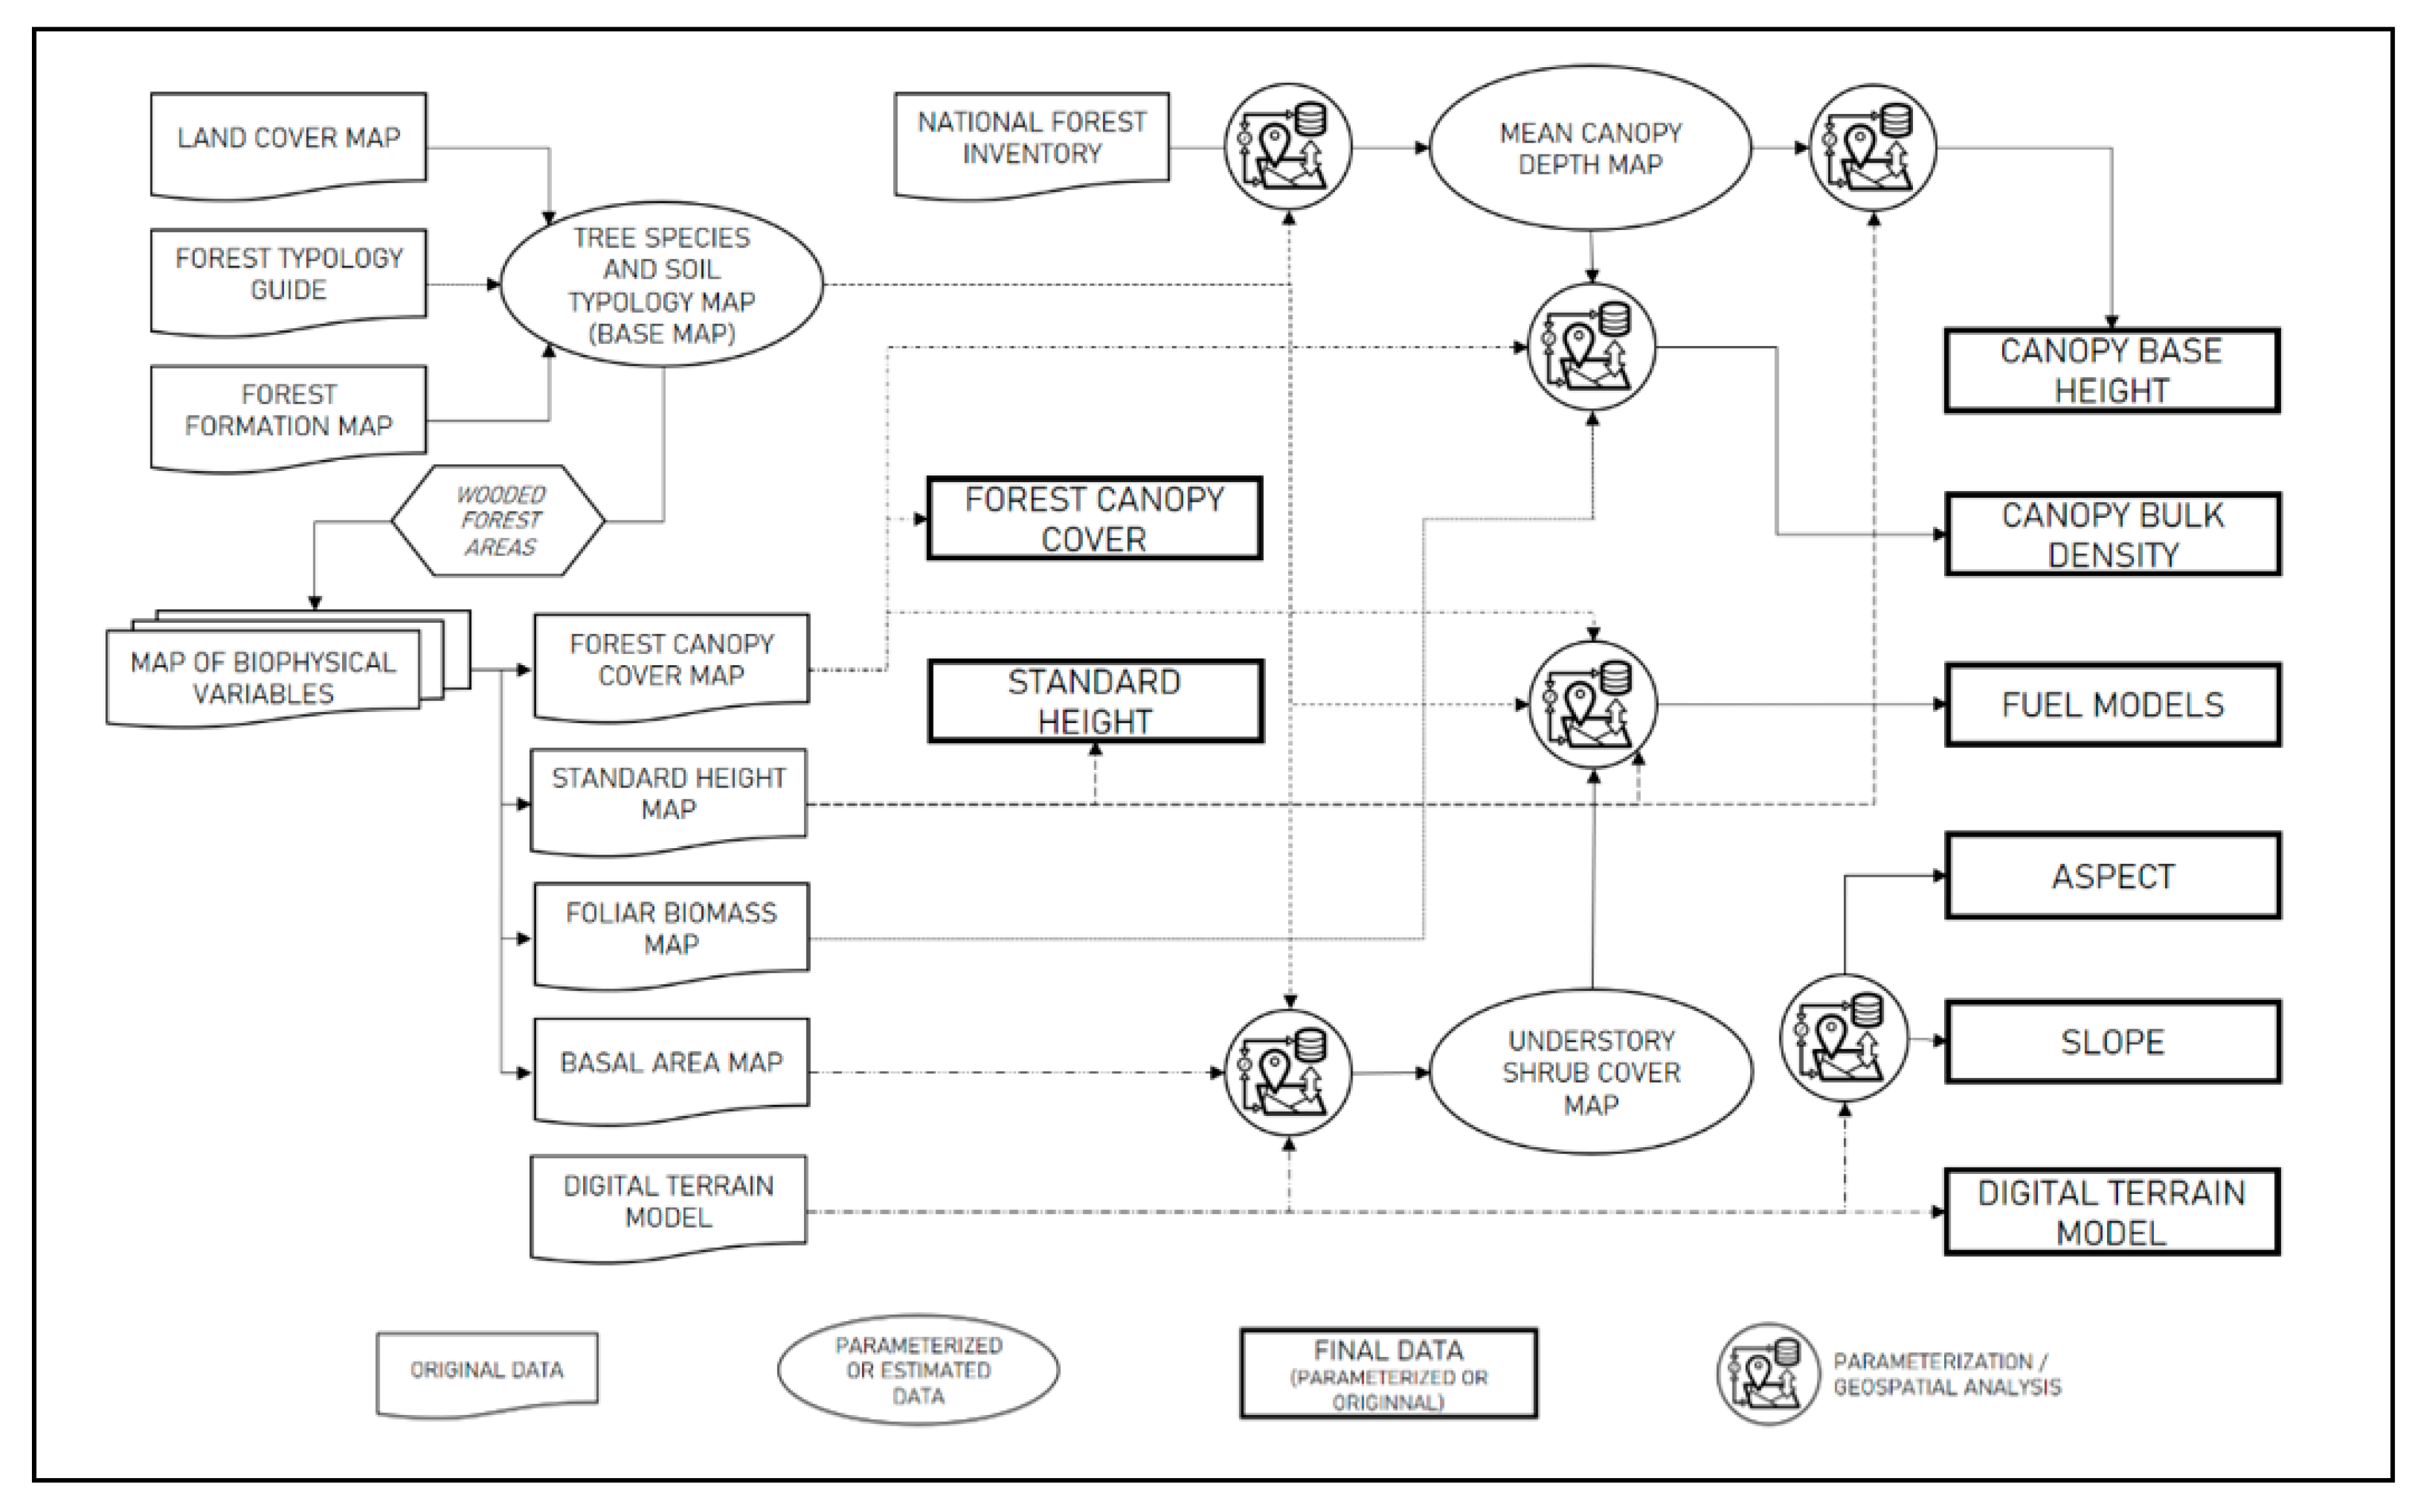
2.2.1. Fuel Mapping and Landscape File Generation

By defining a set of georeferenced variables—such as elevation, slope, aspect, fuel model, canopy cover, canopy height, canopy base height, and canopy bulk density—it is possible to anticipate fire behavior once the weather conditions are set. Those georeferenced variables can be compiled into a landscape file (LCP) and used as an input in the most commonly used fire simulation software packages [55]. Therefore, to create the spatial frame of our server, it was required to estimate the 8 variables that conform into a LCP (Table 1).
With the aim to define fuel models and parameters that describe forest fire hazards, a forest typology analysis was conducted. This was done in order to improve the modelling process of the variables representing the landscape file, according to each of the tree species presented in the study area. Secondly, it facilitated the forest management decision-making process, as management prescriptions should adapt to the ecological and operational requirements of each species and typology. For this purpose, we used the Forest Formation Map of Catalonia [56] to represent stands with at least 20% of forest coverage and the Land Cover Map of Catalonia [48] to represent areas without a significant forest cover, such as urban/agricultural areas, meadows, or shrub lands.
Apart from that, for the generation of the LCP, four main data sources were used: (I) Map of Biophysical Variables of Catalonia (MBVC) obtained with LiDAR-based technology [57], (II) the 4th National Forest Inventory (NFI4) [58], (III) the Forest Typology Guide of Catalonia (FTGC) [59] (IV), and Digital Terrain Model (DTM) [60]. MBVC is a dataset consisting of 8 rasters containing modelled information on structural characteristics of Catalan forests. Two of these variables (i.e., Forest Canopy Cover and Standard Height) were implemented into the LCP, with minor corrections but without any significant transformation needed. Three other data rasters (i.e., foliar biomass, basal area, and aerial biomass) were used in calculations to obtain other LCP variables. Canopy base height (CBH), canopy bulk density (CBD), and fuel models (FM) were parameterized and calculated, employing different combinations of available data. The last one also requires the Understory Shrub Cover Model to be implemented. All of the allometric parametrizations made for wooded forest areas were applied on a sp. composition basis based on the indications from the Forest Formation Map of Catalonia and the FTGC; the models were defined and implemented separately for each tree species including parameters obtained from the NFI4, where needed. Finally, a raster Digital Terrain Model was directly included into the LCP; it was employed into the Understory Shrub Cover Model calculation and used to obtain Slope and Aspect variables of the LCP using geospatial processing tools. The workflow and complete parameterization model is shown in Figure 2.

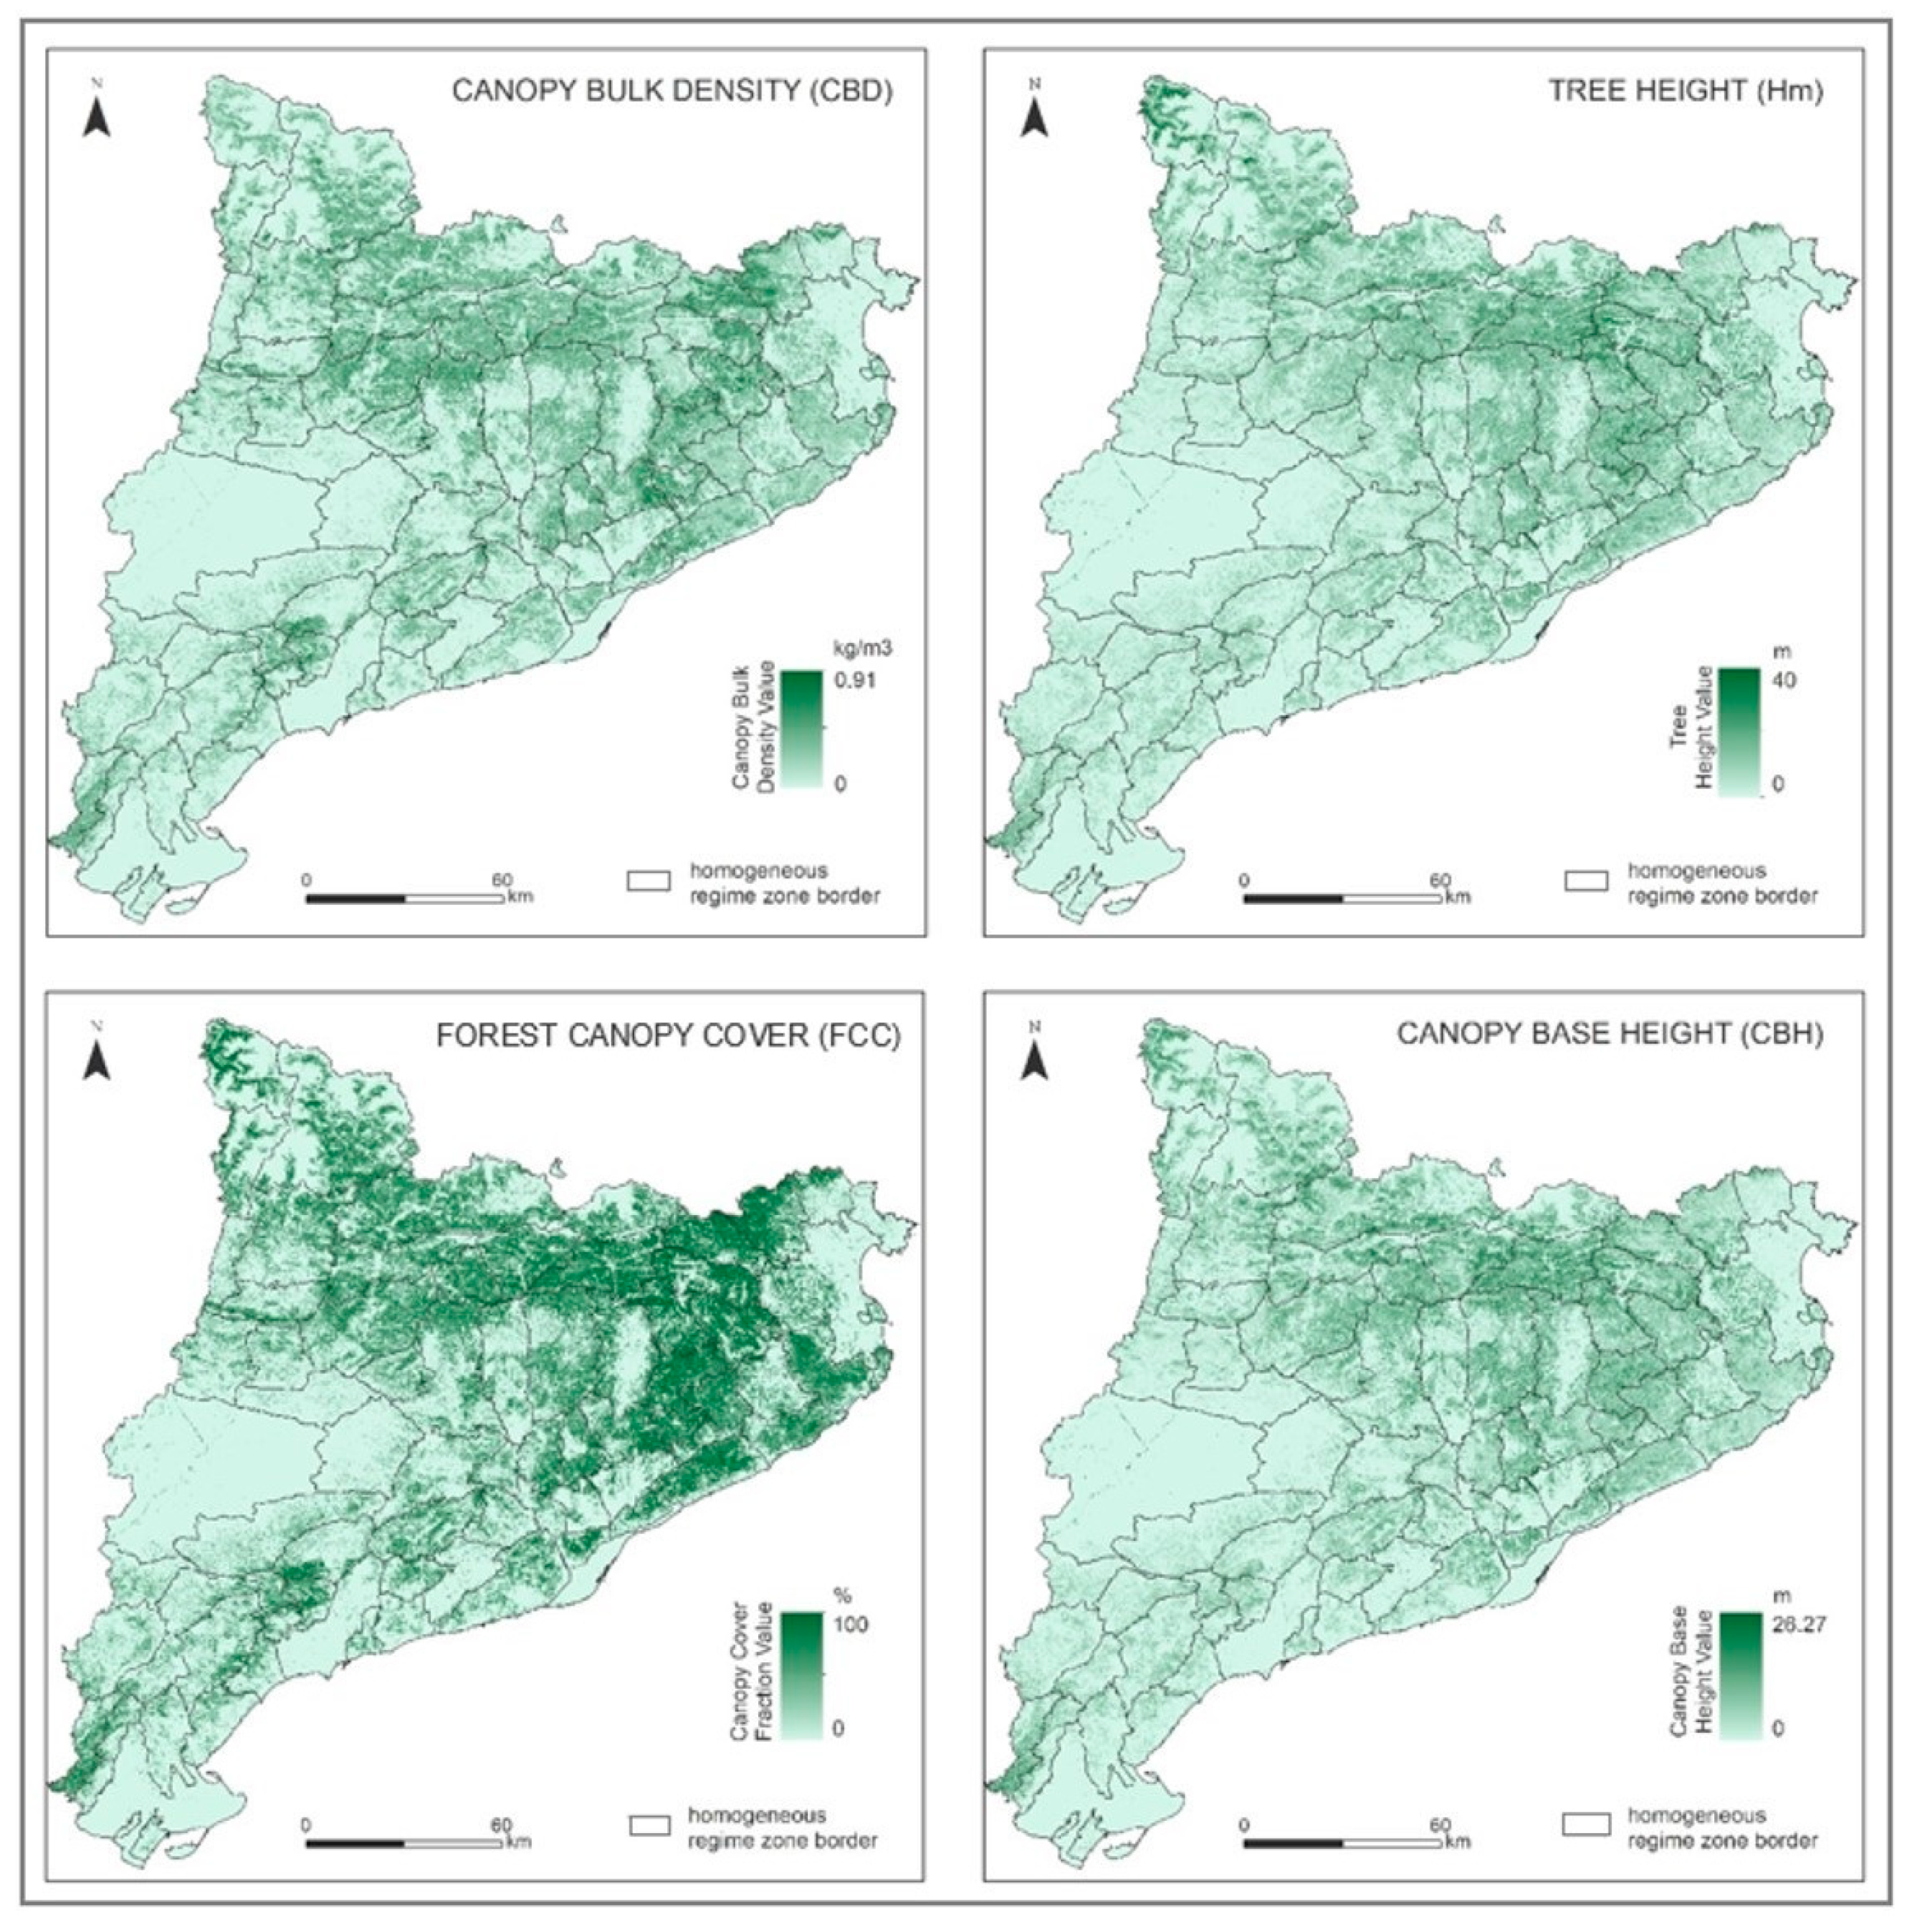
Calculation of Canopy Base Height Variable

CBH is an indicator for the vertical fuel continuity and refers to the lowest height above the ground at which there is sufficient canopy fuel to vertically propagate fire [61]. We have calculated CBH for each of the species contained in the FTGC within the study area using the following formula:
CBH = HmHc
where: Hm is LiDAR based standard height; Hc is mean canopy depth obtained based on two models:
if Hm > 5 m: Hc = β0 + (β1 × Hm)
if Hm <= 5 m: Hc = β1 × Hm
values for β0 and β1 were constant varying depending on dominant tree species (Appendix A).

Calculation of Canopy Bulk Density Variable

CBD is the canopy biomass fuel load available in each unit of canopy volume [61]. In order to compute CBD, we consider that the available canopy fuel equals to the foliar load provided by LiDAR estimates; therefore, the formula we used is:
CBD = FB/V
where: FB is foliar biomass; V is canopy volume.
Canopy volume data was computed on a pixel level considering that each pixel represents one tree. In order to make the model more realistic, we assumed that each tree crown has a spheroidal shape which leads to equation:
V s p h e r o i d   =     4 π r 2 H c 6
where: Hc is canopy depth (Hc = HmCBH); r is radius of the crown in horizontal projection.
Nevertheless, since each pixel does not represent the FCC of 100%, the value of this variable was introduced into the equation as a reducing factor in order to readjust the crown volume at pixel level. A tree representing the volume of one pixel has been denominated as a “super tree”. Therefore:
V s u p e r   t r e e =   F C C   ×   4 π 24   ×   V p i x e l
Vpixel = c2 × Hc = 202 × Hc
FCC = forest canopy cover; c = pixel size; Hc = HmCBH.

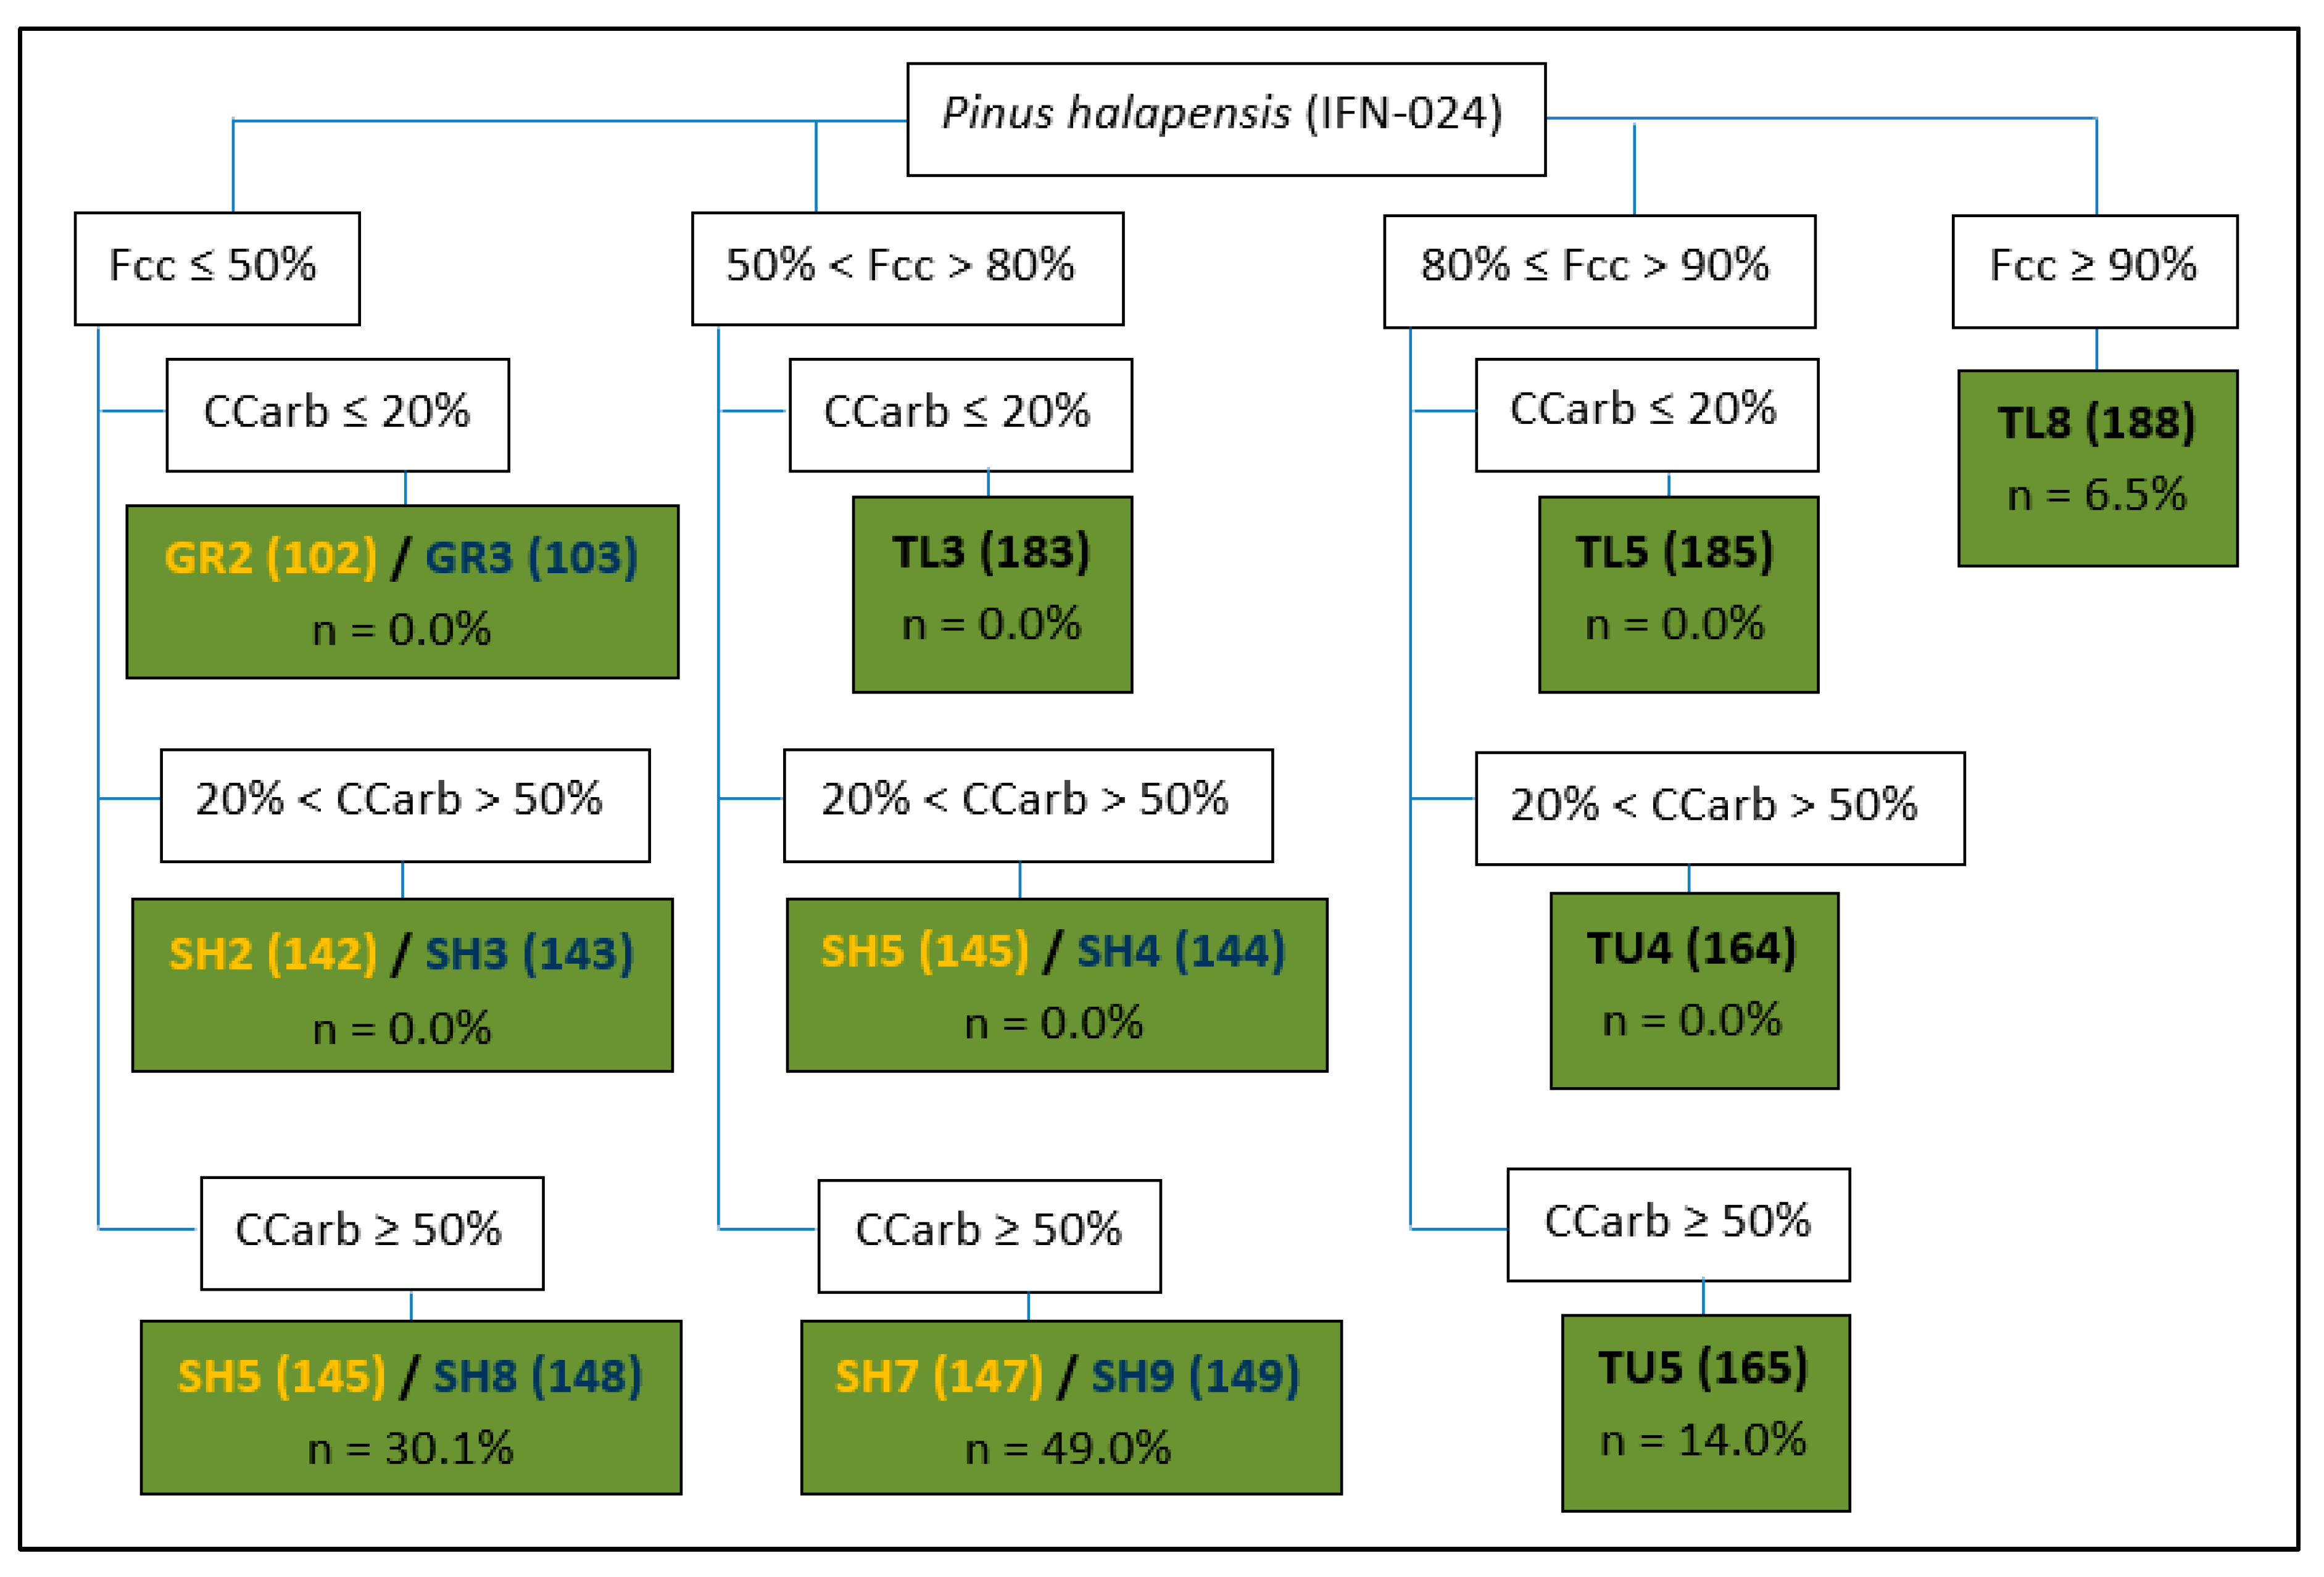
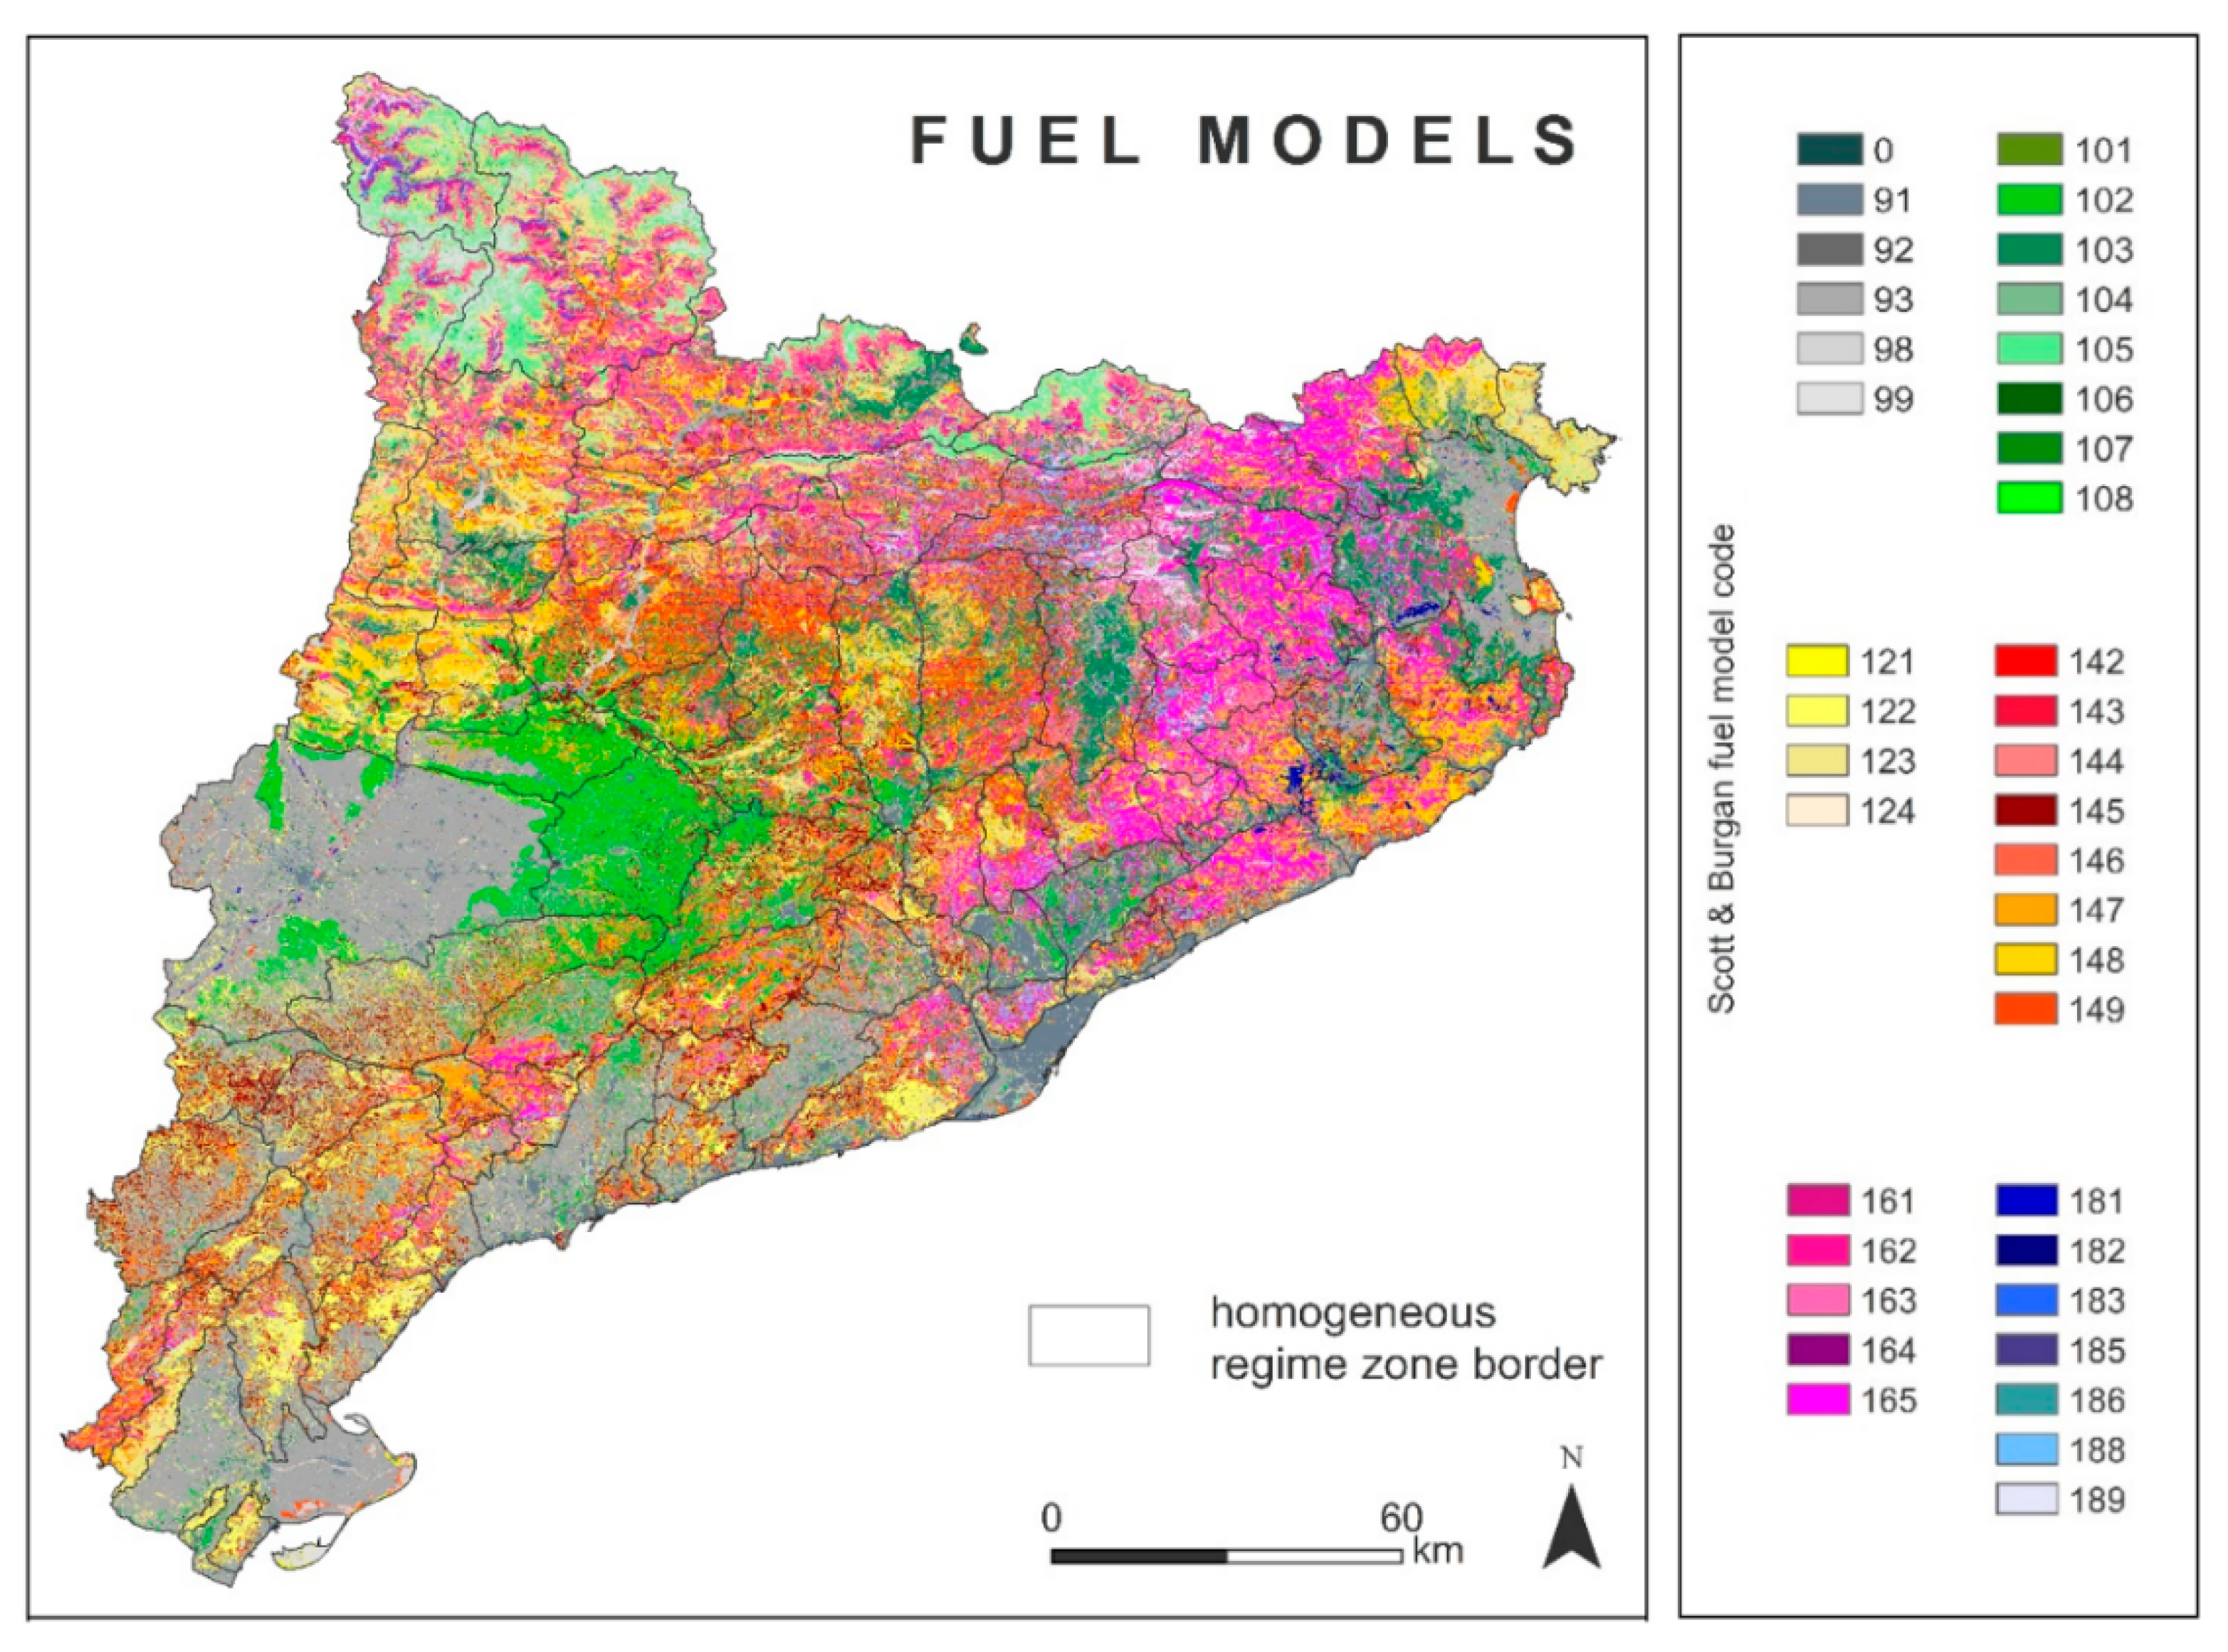
Fuel Models Assignation

Fuel models (FM) are a set of fuel bed inputs needed by a particular fire behavior [62]. They are used to denote physical fuel characteristics representing diverse fire environments. Several models have been used over the time to represent these spatial processes [25,62,63,64]. Mainly upgrading the algorithm sets, the Anderson’s 13 models [64] have been in extensive use until recently. Nevertheless, in agreement with the experts from the Forestry Action Group (GRAF, Fire Department of the Government of Catalonia), it was finally decided to use models created by Scott and Burgan [62] since they provide the most accurate results for our study purposes and better represent the compositional and climatic seasonal variability of the region.
The creation and denomination of the fuel models was conducted for each pixel of the study area after creating an algorithm highly dependent on tree species, mean vegetation height, forest canopy cover, understory shrub cover, and climatic zones. These were supervised and adjusted by experts in order to match both the description of fuel model [62] and the experience from the GRAF experts regarding representability and observed fire behavior.
To estimate the understory shrub cover needed for the fuel model generation, models created by Coll et al. [49] were implemented. They permitted us to calculate a maximum shrub cover per stand based on dominant tree species, topographic elevation, and basal area. Nevertheless, since the number of species contained in the Forest Typology Guide of Catalonia exceeded the number of models, all species were grouped based on their resemblance.
Regarding humidity, Scott and Burgan’s [62] methodology differed fuel models as follows: (a) dry areas, with a water deficit in summer months; and (b) humid areas, without a water deficit. According to the local climatic features, it was decided that areas with more than 150 mm of accumulated precipitation during the summer season are considered as humid areas, while zones with less than 150 mm of precipitation are considered as dry areas [65]. This zonification, consequently, has a strong influence on algorithm generation.
In order to facilitate fuel model assignation, vegetation types were organized into 5 groups according to the fuel load characteristics. One or more fuel types were assigned to each group (Table 2). Each fuel type is defined by the vegetation kind that is to be considered as the primary fire carrier in the area, and contains several fuel models based on detailed fuel load features. Fuel models are differentiated by code and number, and are defined by the unique algorithm [62].
Furthermore, tree stratum fuel models were generated following the Forest Typology Guide of Catalonia classification by aggregating tree species present in the study area in 11 groups, according to their spatial representativeness and similarity, and in terms of their ecological and structural features. For each of the 11 forest types, a set of fuel models were assigned depending on the observed and predicted forest canopy and understory shrub coverage values, aiming to reach the maximum similarity to the Scott and Burgan [62] models, both in terms of structural description and potential fire behavior. For this purpose, thresholds were set with the participation of the experts from the GRAF. An example of the algorithm applied for Pinus halepensis is shown in Figure 3, while all other used models are shown in Supplementary Materials.

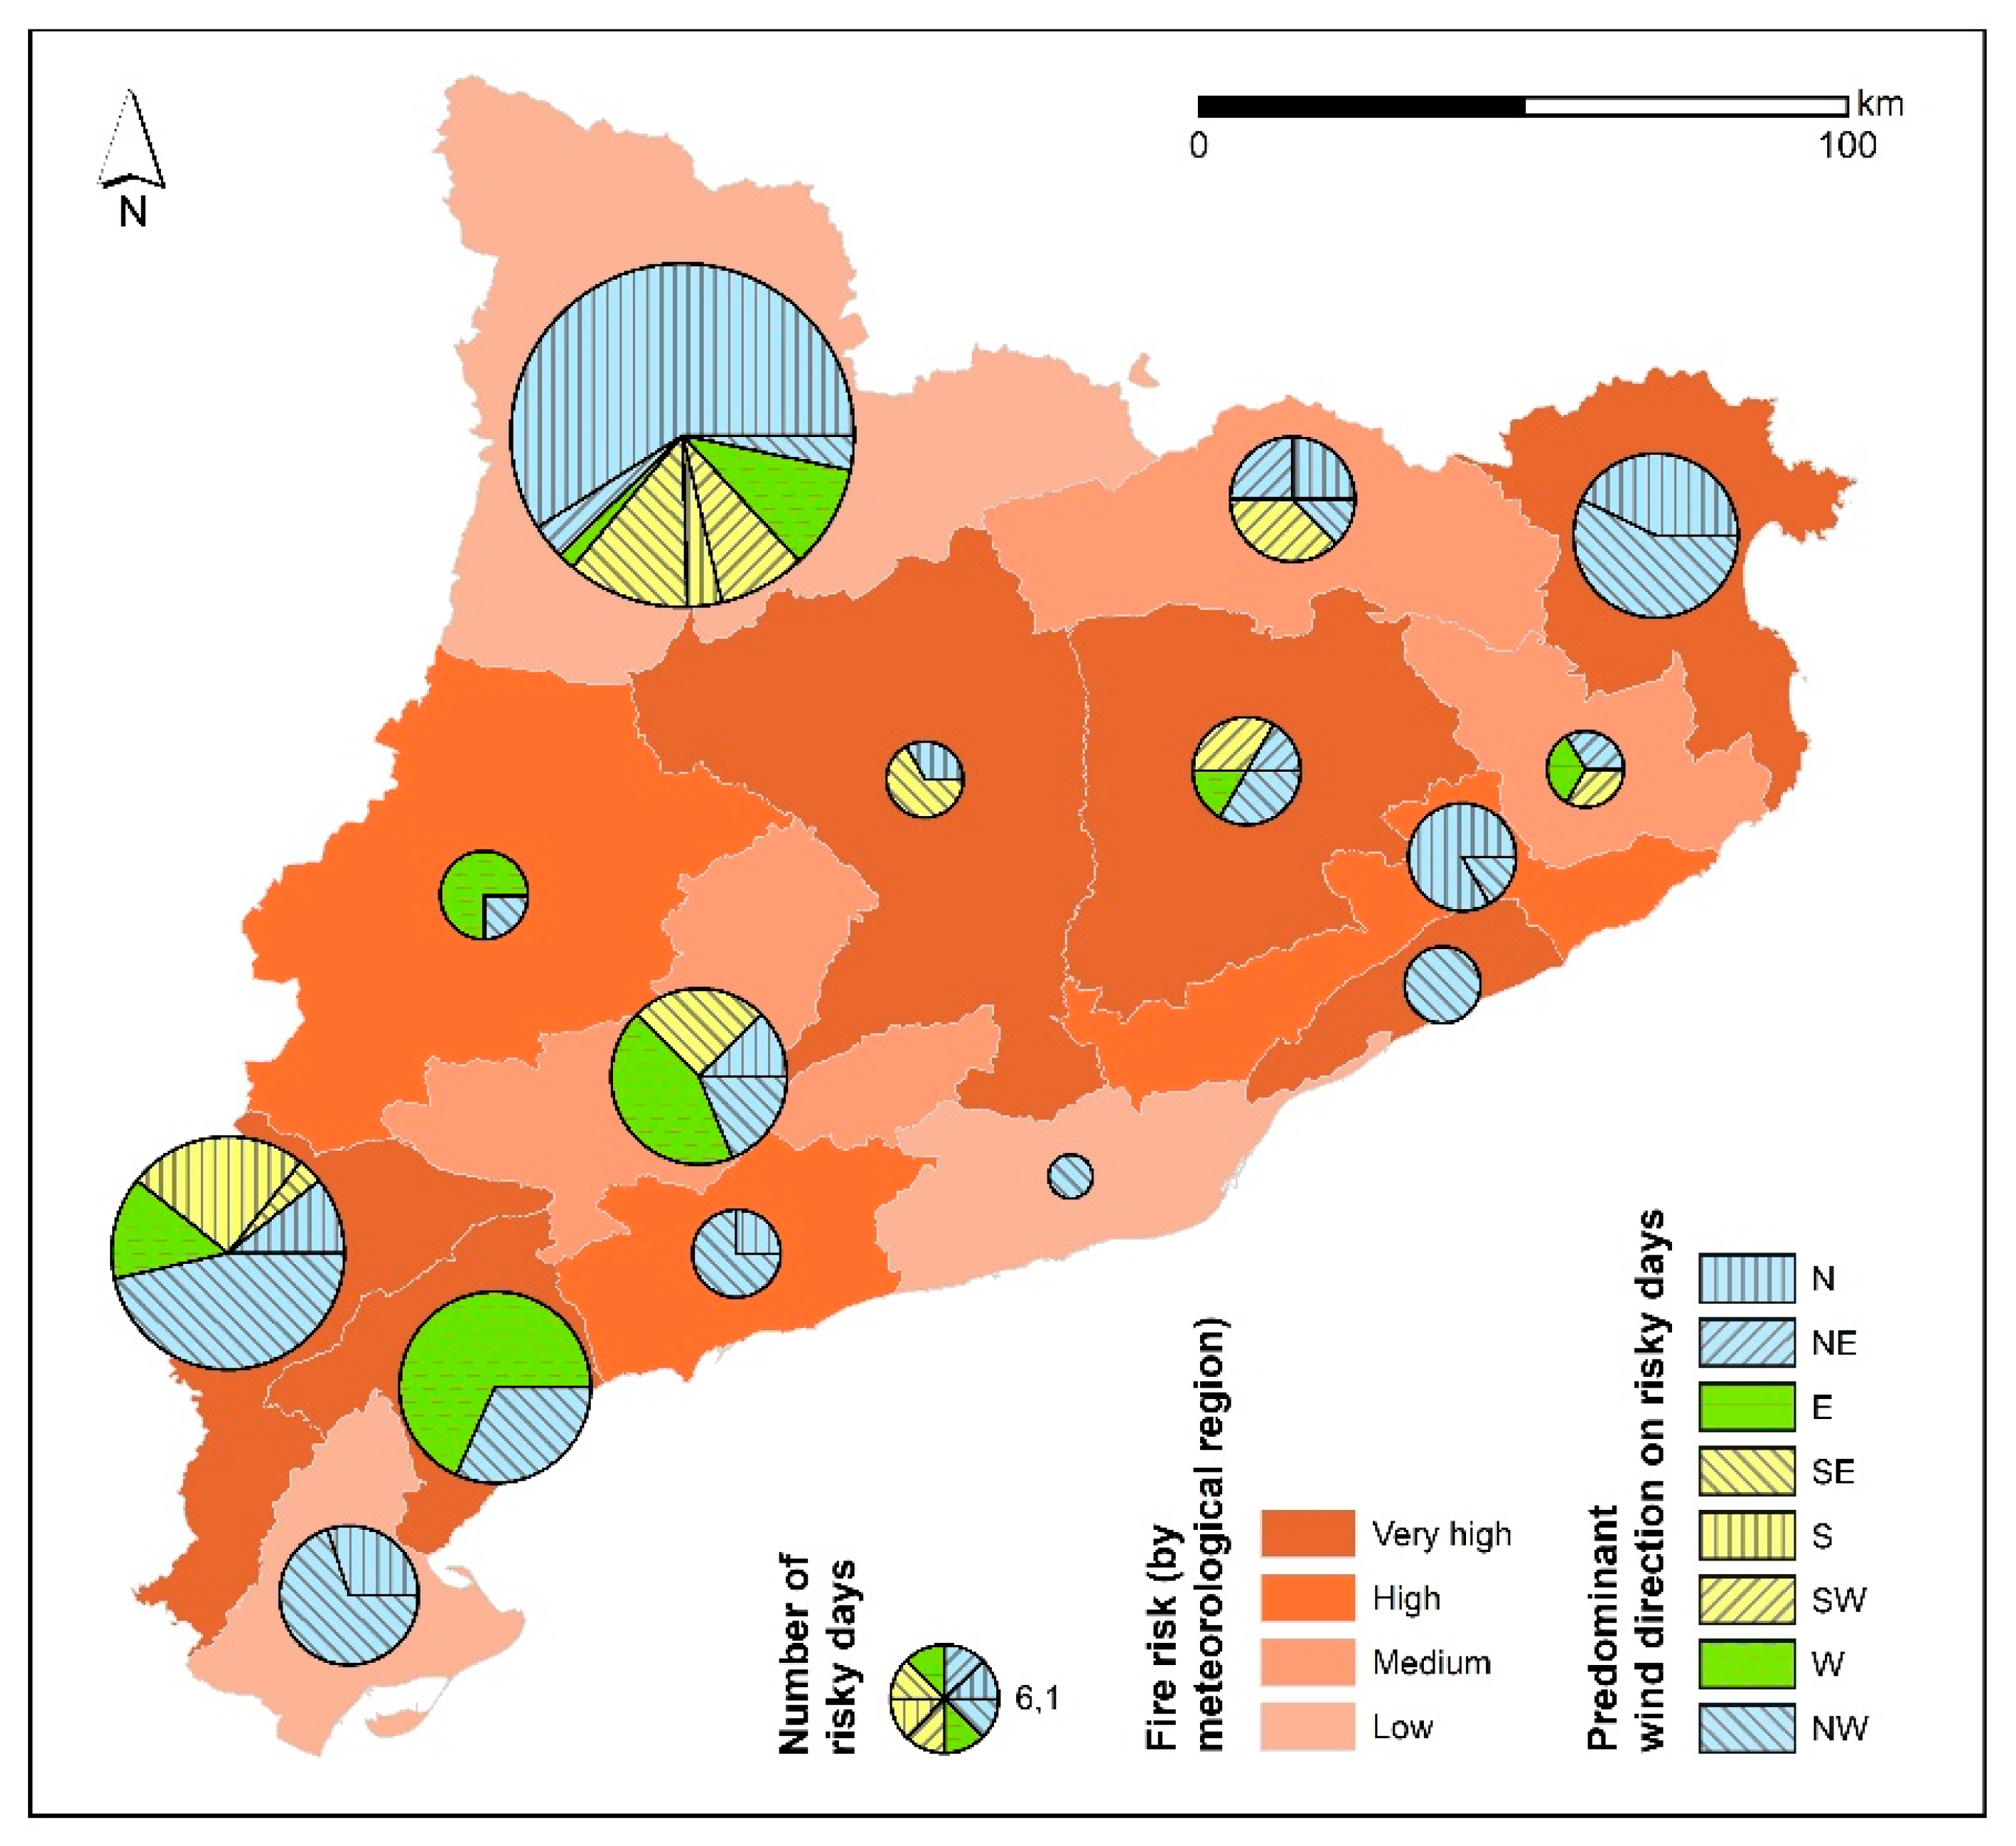
2.2.2. Generation of Meteorological Scenarios

Meteorological scenarios were generated using 20 years of historical climatic data (until 2018) for the study area, using statistical analysis and combining expert knowledge from the Forest Fire Prevention Service, SPIF (Government of Catalonia) and the GRAF [66]. In order to generate meteorological scenarios, the historical climate datasets were analyzed for each of 15 meteorological regions (Figure 4) that were defined based on homogeneous synoptic characteristics and Zones of Homogeneous Fire Regime (ZHR). The ZHR are parts of the territory that present homogeneity in terms of orography, vegetation, wind regime, fire rotation, and fire type characteristics [46,59].
Within the meteorological scenarios dataset, two types of scenarios can be defined: (1) those based on data for the worst fire weather conditions and (2) those based on a reference fire that occurred in the past, which represents a large fire prototypical of an ZHR, according to its propagation patterns and synoptic conditions [46,67].
The methodological base for the generation of the worst weather condition scenarios was a designation of the critical days for forest fire risk based on a combination of percentiles from different meteorological variables: (1) relative humidity (RH), (2) temperature (T), and (3) wind speed (WS). Four different combinations of percentiles (p) were established to define critical days: (1) p < 5 RH + p > 95 T; (2) p < 5 RH + p > 95 WS; (3) p < 10 RH + p > 90 T + p > 90 WS; (4) p < 10 RH + p > 99 WS. Once identified, all synoptic situations and their occurrence probabilities based on meteorological records from days that met previously mentioned requirements, and meteorological scenarios were created.
For each of the 15 meteorological regions, one reference fire was chosen by the GRAF experts and data on the registered weather conditions was provided. However, this was only if the fire occurred more than 20 years ago, due to data availability for some of the meteorological stations.

3. Results

3.1. Geodatabase and Modelled Maps
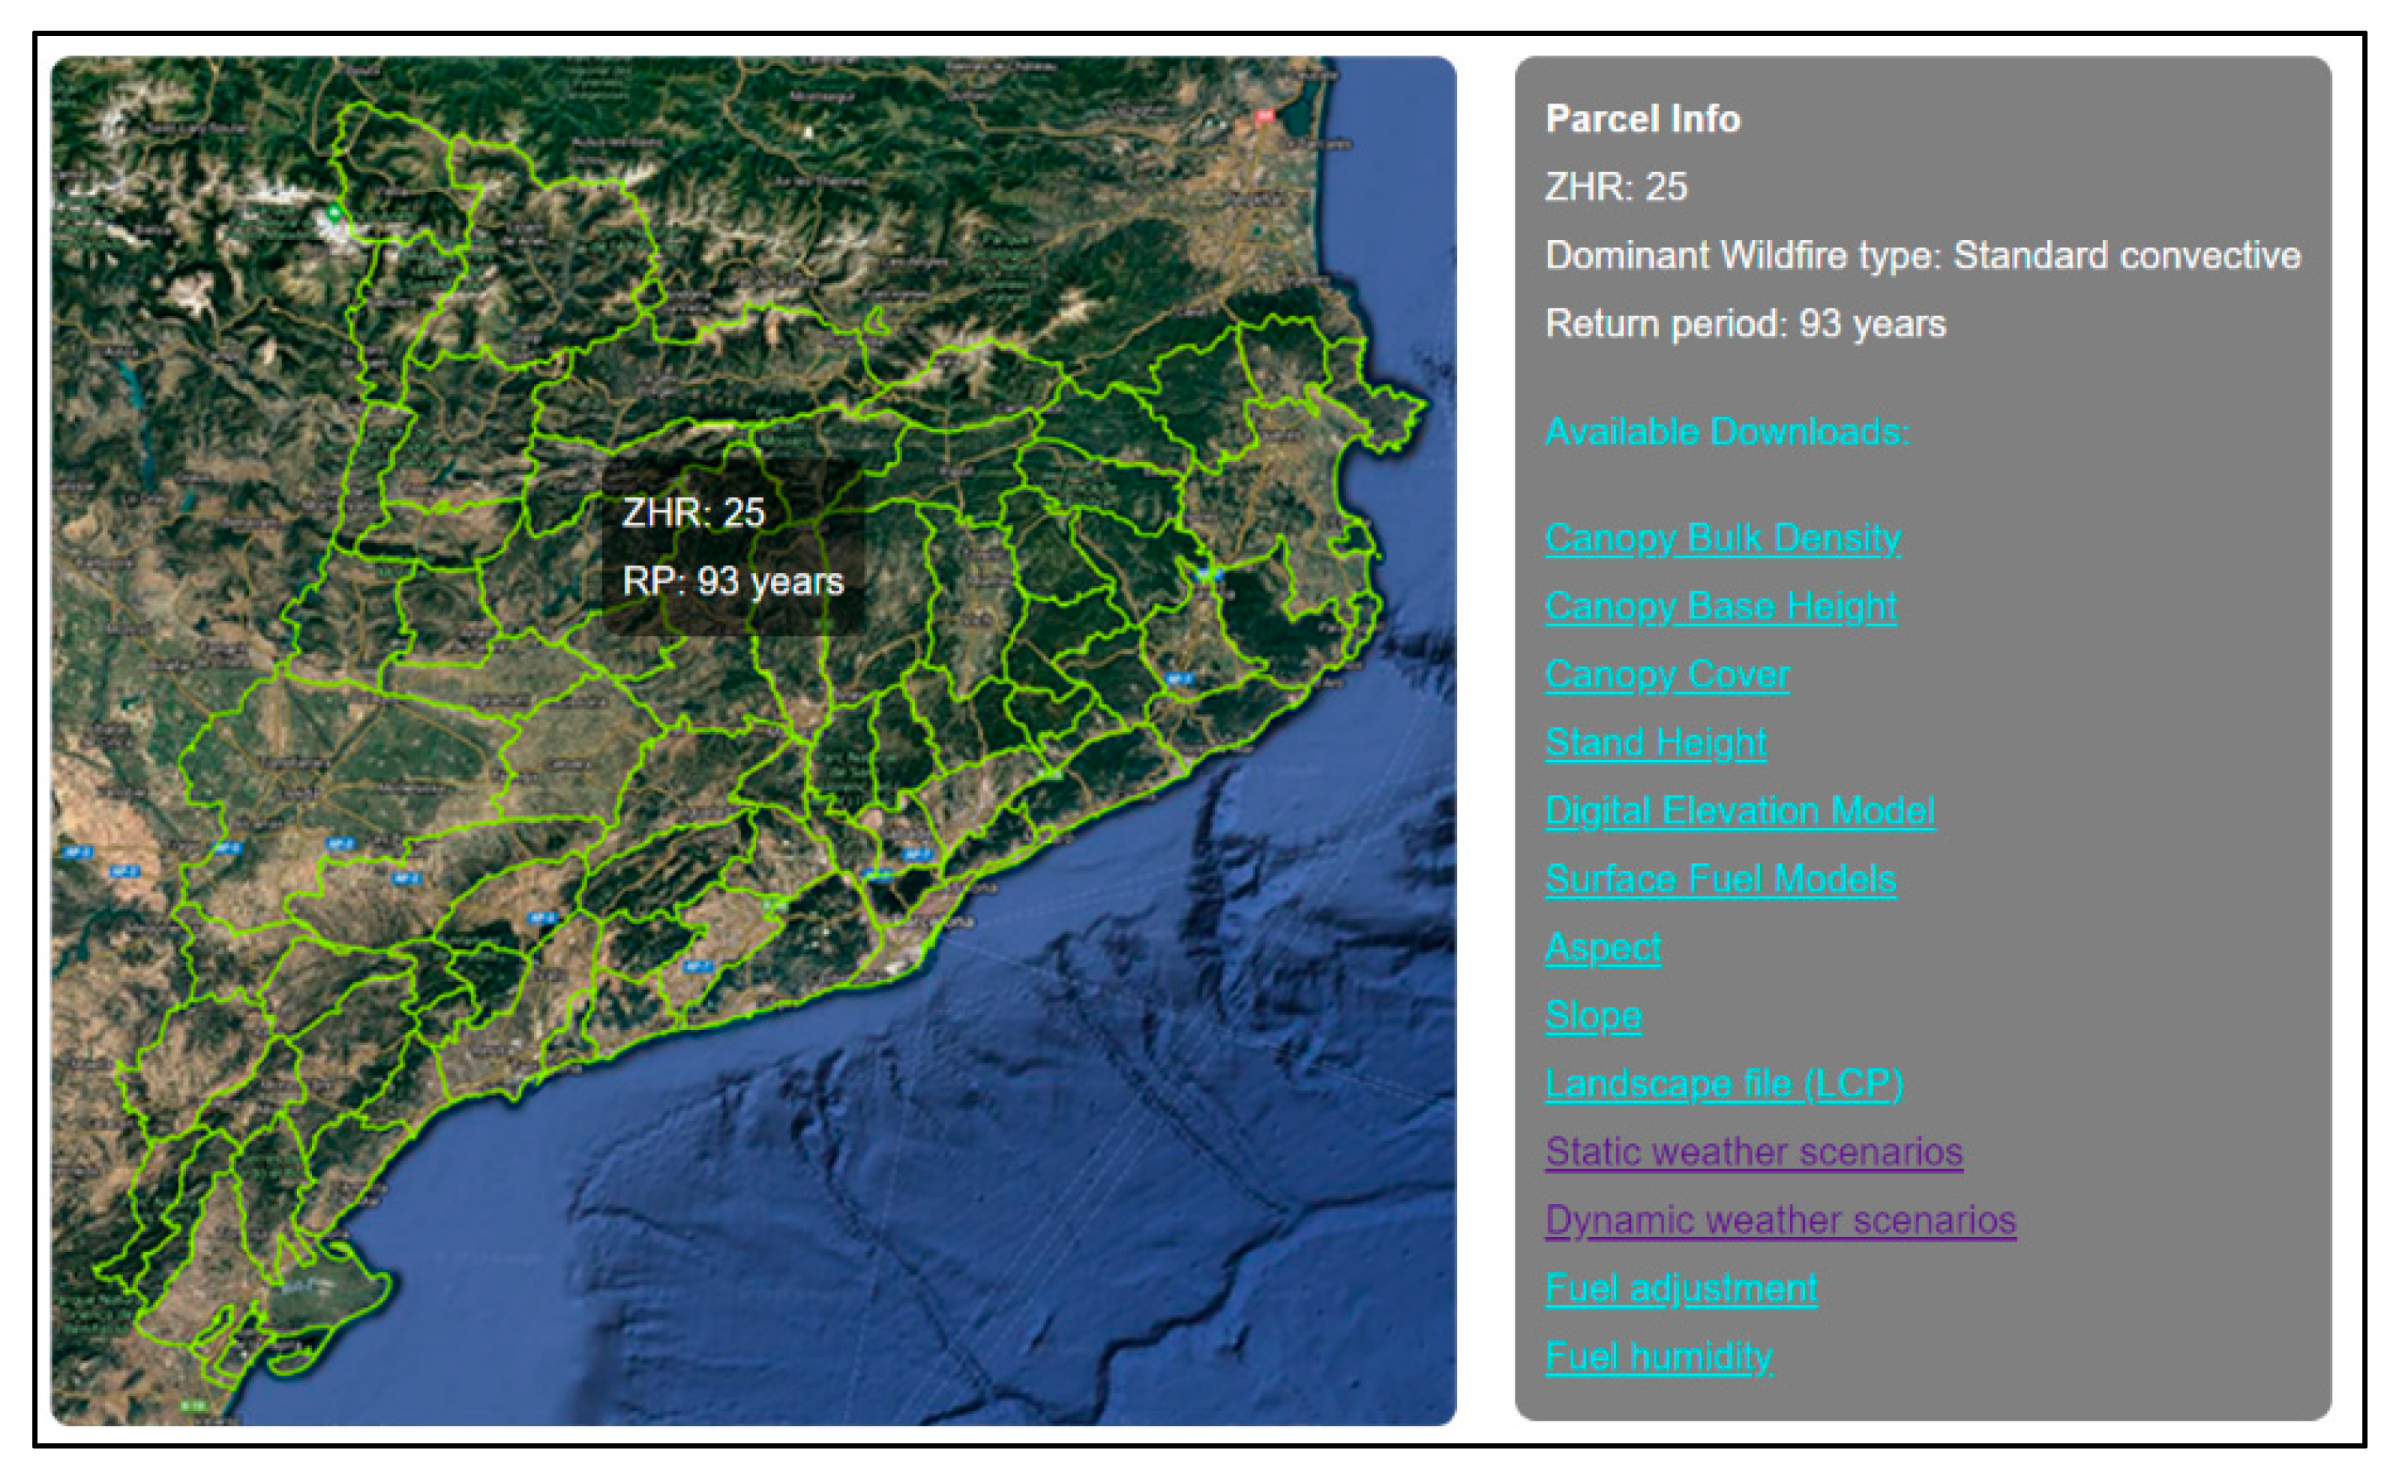
Georeferenced data on biophysical environmental characteristics (FCC, SH, CBD, CBH), topographic features (DTM, SL, ASP), and fuel models were obtained as the first step of the project (Figure 5 and Figure 6). These variables are available in georaster format with a spatial resolution of 20 m. Moreover, the meteorological scenarios dataset, contained in data tables and associated spatially to each meteorological region, was generated.

3.2. Data Server

In order to make these data freely accessible to all potential users, an open data server called PREVINCAT.cat was created (Figure 7), which contains all required variables for fire modelling at the regional level. This allows one to run fire simulations across any forest landscape in Catalonia. Therefore, the server compiles maps and information on: (1) LCP variables needed for the forest fire simulation (Table 1; Figure 5 and Figure 6) that are downloadable separately, as well as a precompiled LCP consisted of a multi-layer raster file containing descriptive information about terrain and fuels in order to be used as a base to run spatial explicit fire simulations; (2) data on meteorological scenarios, the worst weather condition data, and the reference forest fire data, both of which are available in two different formats: static meteorological scenarios data (average of an hourly data of the days identified as risky) and dynamic meteorological scenarios data (hour by hour data from the risky days that can be used in dynamic fire spread simulators); (3) fuel adjustment data needed for an simulator functionality and precise results obtaining [68]; (4) fuel humidity models according to Scott and Burgan’s [62] methodology.
All the cartography contained on the server can be downloaded in ASCII format, UTM 31N ETRS89 Datum coordinate system. Data is spatially fragmented and available for download based on ZHR regionalization. By pairing biophysical and climatic data at the same spatial level and using a relevant regionalization frame, we wanted to represent how fire behaves according to the specific regime defined by unique interrelation of spatial variables in certain areas. This type of data provision enables an implementation of different climate scenarios in forest fire behavior simulation for each zone, obtaining better analysis adjustment according to the local geographic and biophysical characteristics.

4. Data Use and Future Development

Data provided on the server can be used in different stages and on different levels of forest management. First of all, biophysical and topographic variables can be directly used to analyze and evaluate potential fire hazards at a regional level.
Secondly, data on the PREVINCAT.cat server is provided and organized to be used in different fire simulation tools. These simulators can provide complete information on potential fire behavior, such as spread rate, fire line intensity, or flame length. Moreover, fire growth and spread under constant weather and fuel moisture conditions can be simulated. Depending on software capabilities, temporal variations in fire behaviors according to different weather scenarios provided within the server dataset can be incorporated in simulations, too. For example, static meteorological scenario data can be used in static fire spread simulators, such as FlamMap [55], with the objective to foresee the potential fire behavior across the whole landscape. However, dynamic meteorological scenario data can be used in dynamic fire spread simulators such as FARSITE [70] or WildfireAnalyst [71], with the objective to predict the fire spread pattern given a single or multiple fire initiation points (Figure 8).
The fact that all the data is organized and available on ZHR level permits one to run simulations, design theoretical fires, create virtual extreme conditions, or recreate historical fires at a regional level, while also taking into account the spatial variability on weather conditions to attain better predictions.
Finally, both data and the server are meant to be used by firefighters and other professionals working in the field of fire prevention and suppression. We were guided by the idea of providing relevant information on all the variables needed, both in the case of an occurring fire and management options to reduce fire risk.
Therefore, the server and information that it encloses is part of an evolving project aimed at providing data and information that would help professionals manage fire prevention and suppression strategies. Following this line, plans and ideas for future development of the server are already defined. From a theoretical point of view, the server is divided into different modules (Figure 9). Module 1 and Module 2 are finished and available to be used. They represent the data and functionalities presented in this paper. On the other hand, Module 3 and Module 4 are currently under development. Module 3 focuses on defining where fuel management actions should be prioritized according to various decision criteria. For this purpose, additional data on selected criteria (exposure, accessibility, etc.) will be uploaded into the server and, through a participatory process, their influence on the defined goal will be parametrized, and their relative importance provided. Finally, the priority across the region will be estimated through multi-criteria decision analysis methods. Once the priorities are defined, Module 4 will select areas, generally forest stands, and forest management actions that better reduce priority levels, considering economic and surface constrains. This goal will be achieved by using mathematical optimization methods.
It should be mentioned that the project and its results have a strong multidisciplinary component, and not only due to the necessity of compiling and managing heterogeneous data sources. Participatory processes and expert modelling play a major role in this project, i.e., the final users of the server strongly participated in its creation, goal definition, and modelling from the early beginning. Since the original idea was to create a server that could be used both by scientists and professionals working in the field of fire suppression and prevention, and in order to get to know all the needs and, consequently, the benefits that the server would provide to the potential users, we wanted to establish a functional collaboration between these two ambits. The methodology and the nature of the resulting data was defined according to the needs of the professionals from the field, mostly firefighters from the regional governing institutions that are highly familiarized with the topic. We ensured that the methodological approach was valid and results were accordingly applicable to our study area, successfully accomplishing the main objective of the project.

5. Conclusions

This study presents an innovative and elaborated fuel modelling process to define fuel characteristics and potential fire behavior under different meteorological scenarios. In order to store all the data and models developed, as well as all required variables to run fire simulations at a regional scale in Catalonia, an open free server (i.e., PREVINCAT.cat) was developed. It offers three products: landscape files, meteorological scenarios, and some fire perimeters of historical wildfires. This data is primarily destined to be used to assess potential fire behavior with different fire spread simulators. The server is logically structured in order to meet the user requirements and can be used both by scientists and fire management practitioners. All the data is subdivided according to the Zones of Homogeneous Fire Regime, which are considered as a relevant planning frames to guide the forestry policy regarding fire prevention and suppression. The presented results are part of an ongoing project that considers a strategic plan to set management priority areas, through MCDA means, and a tactical plan where specific management actions will be selected using mathematical optimization methods.

Supplementary Materials

The following are available online at https://www.mdpi.com/2072-4292/12/24/4124/s1.

Author Contributions

J.R.G.O., M.P.N., J.G.-G., and E.B.O. participated on the conceptualization of the project; G.K. and E.B.O. implemented most of the data management; A.L. supervised and selected the rules for fuel model identification; G.K., A.C., and J.R.G.O. wrote the initial draft. All authors participated in the editing process of the manuscript. All authors have read and agreed to the published version of the manuscript.

Funding

This research was funded by the Departament d’Agricultura, Ramaderia, Pesca i Alimentació, of the Generalitat de Catalunya. Goran Krsnik acknowledges funding from AGAUR though the scholarship FI_B2 00147. J Garcia Gonzalo and JR Gonzalez Olabarria received funding from Spanish Ministry of Economy and Business (MINECO) and from Agency for the Research Centre of Catalonia (CERCA Programme/Generalitat de Catalunya).

Acknowledgments

We would like to thank to all if the collaborators and experts who participated in this project: Marc Castellnou (UT-GRAF, DGPEISGRAF, Generalitat de Catalunya), Carlos San Román (Servei de Gestió Forestal, Generalitat de Catalunya), Carles Furriol (Servei de Gestió Forestal, Generalitat de Catalunya), Esteve Canyameres and José A. Terés (Servei de Prevenció d’Incendis Forestals, Generalitat de Catalunya), and Irina Cristal (FBS).

Conflicts of Interest

The authors declare no conflict of interest.

Appendix A

Table A1. Equations for Mean Canopy Depth (Hc) calculation for each species in the study area.
IFN4 CodeTree SpecieMean Canopy Depth (Hc, m)
024Pinus halepensisHm > 5 m → Hc = 1.106 + (0.421 × Hm)Hm < 5 m → Hc = 0.421 × Hm
021Pinus sylvestrisHm > 5 m → Hc = 1.201 + (0.391 × Hm)Hm < 5 m → Hc = 0.391 × Hm
045Quercus ilex ilexHm > 5 m → Hc = −0.328 + (0.640 × Hm)Hm < 5 m → Hc = 0.640 × Hm
025Pinus nigraHm > 5 m → Hc = 0.432 + (0.426 × Hm)Hm < 5 m → Hc = 0.426 × Hm
049Quercus ilex ballotaHm > 5 m → Hc = −0.328 + (0.640 × Hm)Hm < 5 m → Hc = 0.640 × Hm
022Pinus uncinataHm > 5 m → Hc = 1.401 + (0.476 × Hm)Hm < 5 m → Hc = 0.476 × Hm
046Quercus suberHm > 5 m → Hc = −0.328 + (0.640 × Hm)Hm < 5 m → Hc = 0.640 × Hm
243Quercus humilisHm > 5 m → Hc = −0.429 + (0.629 × Hm)Hm < 5 m → Hc = 0.629 × Hm
050Riverbank forestsHm > 5 m → Hc = 2.121 + (0.375 × Hm)Hm < 5 m → Hc = 0.375 × Hm
044Quercus fagineaHm > 5 m → Hc = 0.348 + (0.326 × Hm)Hm < 5 m → Hc = 0.326 × Hm
023Pinus pineaHm > 5 m → Hc = 0.265 + (0.465 × Hm)Hm < 5 m → Hc = 0.465 × Hm
071Fagus sylvaticaHm > 5 m → Hc = −0.428 + (0.667 × Hm)Hm < 5 m → Hc = 0.667 × Hm
042Quercus petraeaHm > 5 m → Hc = −0.688 + (0.624 × Hm)Hm < 5 m → Hc = 0.624 × Hm
026Pinus pinasterHm > 5 m → Hc = 1.750 + (0.321 × Hm)Hm < 5 m → Hc = 0.321 × Hm
031Abies albaHm > 5 m → Hc = −0.040 + (0.708 × Hm)Hm < 5 m → Hc = 0.708 × Hm
072Castanea SativaHm > 5 m → Hc = −0.131 + (0.592 × Hm)Hm < 5 m → Hc = 0.592 × Hm
051Populus sp.Hm > 5 m → Hc = −1.609 + (0.769 × Hm)Hm < 5 m → Hc = 0.769 × Hm
373Betula pendulaHm > 5 m → Hc = −0.455 + (0.653 × Hm)Hm < 5 m → Hc = 0.653 × Hm
041Quercus roburHm > 5 m → Hc = −0.688 + (0.624 × Hm)Hm < 5 m → Hc = 0.624 × Hm
255Fraxinus excelsiorHm > 5 m → Hc = 2.121 + (0.375 × Hm)Hm < 5 m → Hc = 0.375 × Hm
061Eucalyptus sp.Hm > 5 m → Hc = −0.131 + (0.592 × Hm)Hm < 5 m → Hc = 0.592 × Hm
079Platanus x hybridaHm > 5 m → Hc = 1.391 + (0.443 × Hm)Hm < 5 m → Hc = 0.443 × Hm
028Pinus radiataHm > 10 m → Hc = 3.279 + (0.444 × Hm)Hm < 10 m → Hc = 0.444 × Hm
034Pseudotsuga menziesiiHm > 10 m → Hc = 6.247 + (0.250 × Hm)Hm < 10 m → Hc = 0.250 × Hm
047Quercus canariensisHm > 5 m → Hc = −1.166 + (0.885 × Hm)Hm < 5 m → Hc = 0.885 × Hm
043Quercus pyrenaicaHm > 5 m → Hc = −1.166 + (0.885 × Hm)Hm < 5 m → Hc = 0.885 × Hm
035Larix sp.Hm > 10 m → Hc = 6.247 + (0.250 × Hm)Hm < 10 m → Hc = 0.250 × Hm
917Cedrus sp.Hm > 10 m → Hc = 6.247 + (0.250 × Hm)Hm < 10 m → Hc = 0.250 × Hm
033Picea sp.Hm > 10 m → Hc = 6.247 + (0.250 × Hm)Hm < 10 m → Hc = 0.250 × Hm

References

  1. Calkin, D.E.; Thompson, M.P.; Finney, M.A.; Hyde, K.D. A real-time risk-assessment tool supporting wildland fire decision-making. J. For. 2011, 109, 274–280. [Google Scholar] [CrossRef]
  2. Thompson, M.P.; Calkin, D.E.; Finney, M.A.; Gebert, K.M.; Hand, M.S. A Risk-Based Approach to Wildland Fire Budgetary Planning. For. Sci. 2013, 59, 63–77. [Google Scholar] [CrossRef] [Green Version]
  3. González-Olabarría, J.R.; Rodríguez, F.; Fernández-Landa, A.; Mola-Yudego, B. Mapping fire risk in the Model Forest of Urbión (Spain) based on airborne LiDAR measurements. For. Ecol. Manag. 2012, 282, 149–156. [Google Scholar] [CrossRef]
  4. Ramirez, J.; Monedero, S.; Silva, C.A.; Cardil, A. Stochastic decision trigger modelling to assess the probability of wildland fire impact. Sci. Total Environ. 2019, 694, 133505. [Google Scholar] [CrossRef] [PubMed]
  5. Price, O.F.; Gordon, C.E. The potential for LiDAR technology to map fire fuel hazard over large areas of Australian forest. J. Environ. Manag. 2016, 181, 663–673. [Google Scholar] [CrossRef] [PubMed]
  6. Riaño, D.; Chuvieco, E.; Ustin, S.L.; Salas, J.; Rodríguez-Pérez, J.R.; Ribeiro, L.M.; Viegas, D.X.; Moreno, J.M.; Fernández, H. Estimation of shrub height for fuel-type mapping combining airborne LiDAR and simultaneous color infrared ortho imaging. Int. J. Wildland Fire 2007, 16, 341–348. [Google Scholar] [CrossRef] [Green Version]
  7. Arellano-Pérez, S.; Castedo-Dorado, F.; López-Sánchez, C.; González-Ferreiro, E.; Yang, Z.; Díaz-Varela, R.; Álvarez-González, J.; Vega, J.; Ruiz-González, A. Potential of Sentinel-2A Data to Model Surface and Canopy Fuel Characteristics in Relation to Crown Fire Hazard. Remote Sens. 2018, 10, 1645. [Google Scholar] [CrossRef] [Green Version]
  8. Bottalico, F.; Chirici, G.; Giannini, R.; Mele, S.; Mura, M.; Puxeddu, M.; McRoberts, R.E.; Valbuena, R.; Travaglini, D. Modeling Mediterranean forest structure using airborne laser scanning data. Int. J. Appl. Earth Obs. Geoinf. 2017, 57, 145–153. [Google Scholar] [CrossRef]
  9. Riaño, D.; Meier, E.; Allgöwer, B.; Chuvieco, E.; Ustin, S.L. Modeling airborne laser scanning data for the spatial generation of critical forest parameters in fire behavior modeling. Remote Sens. Environ. 2003, 86, 177–186. [Google Scholar] [CrossRef]
  10. Valbuena, R.; Maltamo, M.; Packalen, P. Classification of forest development stages from national low-density lidar datasets: A comparison of machine learning methods. Revista Teledetección 2016, S.I., 15–25. [Google Scholar] [CrossRef] [Green Version]
  11. Riaño, D.; Chuvieco, E.; Condés, S.; González-Matesanz, J.; Ustin, S.L. Generation of crown bulk density for Pinus sylvestris L. from lidar. Remote Sens. Environ. 2004, 92, 345–352. [Google Scholar] [CrossRef]
  12. González-Olabarría, J.R.; Pukkala, T. Integrating fire risk considerations in landscape-level forest planning. For. Ecol. Manag. 2011, 261, 278–287. [Google Scholar] [CrossRef]
  13. De Almeida, D.R.A.; Nelson, B.W.; Schietti, J.; Gorgens, E.B.; Resende, A.F.; Stark, S.C.; Valbuena, R. Contrasting fire damage and fire susceptibility between seasonally flooded forest and upland forest in the Central Amazon using portable profiling LiDAR. Remote Sens. Environ. 2016, 184, 153–160. [Google Scholar] [CrossRef]
  14. Miller, J.D.; Yool, S.R. Mapping forest post-fire canopy consumption in several overstory types using multi-temporal Landsat TM and ETM data. Remote Sens. Environ. 2002, 82, 481–496. [Google Scholar] [CrossRef]
  15. Peterson, D.L.; Littell, J.S. Appendix 2: Risk-Based Framework and Risk Case Studies. Risk Assessment for Wildfire in the Western United States. In Effects of Climatic Variability and Change on Forest Ecosystems: A Comprehensive Science Synthesis for the U.S. Forest Sector; Vose, J.M., Peterson, D.L., Patel-Weynand, T., Eds.; General Technical Report PNW-GTR-870; U.S. Department of Agriculture, Forest Service, Pacific Northwest Research Station: Portland, OR, USA, 2012; pp. 249–252. [Google Scholar]
  16. Calkin, D.E.; Cohen, J.D.; Finney, M.A.; Thompson, M.P. How risk management can prevent future wildfire disasters in the wildland-urban interface. Proc. Natl. Acad. Sci. USA 2014, 111, 746–751. [Google Scholar] [CrossRef] [PubMed] [Green Version]
  17. Thompson, M.; Lauer, C.; Calkin, D.; Rieck, J.; Stonesifer, C.; Hand, M. Wildfire Response Performance Measurement: Current and Future Directions. Fire 2018, 1, 21. [Google Scholar] [CrossRef] [Green Version]
  18. Scott, J.H.; Thompson, M.P.; Calkin, D.E. A Wildfire Risk Assessment Framework for Land and Resource Management; General Technical Report RMRS-GTR-315; U.S. Department of Agriculture, Forest Service, Rocky Mountain Research Station: Fort Collins, CO, USA, 2013. [Google Scholar]
  19. Rodríguez y Silva, F.; Molina Martínez, J.R.; González-Cabán, A. A methodology for determining operational priorities for prevention and suppression of wildland fires. Int. J. Wildland Fire 2014, 23, 544–554. [Google Scholar] [CrossRef]
  20. Salis, M.; Del Giudice, L.; Arca, B.; Ager, A.A.; Alcasena-Urdiroz, F.; Lozano, O.; Bacciu, V.; Spano, D.; Duce, P. Modeling the effects of different fuel treatment mosaics on wildfire spread and behavior in a Mediterranean agro-pastoral area. J. Environ. Manag. 2018, 212, 490–505. [Google Scholar] [CrossRef]
  21. Alcasena, F.J.; Salis, M.; Vega-García, C. A fire modeling approach to assess wildfire exposure of valued resources in central Navarra, Spain. Eur. J. For. Res. 2016, 135, 87–107. [Google Scholar] [CrossRef] [Green Version]
  22. Salis, M.; Ager, A.A.; Arca, B.; Finney, M.A.; Bacciu, V.; Duce, P.; Spano, D. Assessing exposure of human and ecological values to wildfire in Sardinia, Italy. Int. J. Wildland Fire 2013, 22, 549–565. [Google Scholar] [CrossRef]
  23. Riley, K.; Thompson, M.; Scott, J.; Gilbertson-Day, J. A Model-Based Framework to Evaluate Alternative Wildfire Suppression Strategies. Resources 2018, 7, 4. [Google Scholar] [CrossRef] [Green Version]
  24. Gonzalez-Olabarria, J.R.; Reynolds, K.M.; Larrañaga, A.; Garcia-Gonzalo, J.; Busquets, E.; Pique, M. Strategic and tactical planning to improve suppression efforts against large forest fires in the Catalonia region of Spain. For. Ecol. Manag. 2019, 432, 612–622. [Google Scholar] [CrossRef]
  25. Albini, F. Estimating Wildfire Behavior and Effects; General Technical Report INT-30; USDA Forest Service, Intermountain Forest and Range Experiment Station: Ogden, UT, USA, 1976; 92p. [Google Scholar]
  26. Finney, M. Fire growth using minimum travel time methods. Can. J. For. Res. 2002, 32, 1420–1424. [Google Scholar] [CrossRef]
  27. Andrews, P. Current status and future needs of the BehavePlus Fire Modeling System. Int. J. Wildland Fire 2014, 23, 21–33. [Google Scholar] [CrossRef] [Green Version]
  28. Anderson, K.; Englefield, P.; Little, J.; Gerhard Reuter, M. An approach to operational forest fire growth predictions for Canada. Int. J. Wildland Fire 2009, 18, 893–905. [Google Scholar] [CrossRef]
  29. Pettinari, M.L.; Chuvieco, E. Fire Behavior Simulation from Global Fuel and Climatic Information. Forests 2017, 8, 179. [Google Scholar] [CrossRef] [Green Version]
  30. Roccaforte, J.P.; Fulé, P.Z.; Covington, W.W. Landscape-scale changes in canopy fuels and potential fire behaviour following ponderosa pine restoration treatments. Int. J. Wildland Fire. 2008, 17, 293–303. [Google Scholar] [CrossRef]
  31. Finney, M.A.; McHugh, C.W.; Grenfell, I.C.; Riley, K.L.; Short, K.C. A simulation of probabilistic wildfire risk components for the continental United States. Stoch. Environ. Res. Risk Assess. 2011, 25, 973–1000. [Google Scholar] [CrossRef] [Green Version]
  32. Finney, M.A.; Grenfell, I.C.; McHugh, C.W.; Seli, R.C.; Trethewey, D.; Stratton, R.D.; Brittain, S. A Method for Ensemble Wildland Fire Simulation. Environ. Model. Assess. 2011, 16, 153–167. [Google Scholar] [CrossRef]
  33. Finney, M.A.; Mchugh, C.W.; Grenfell, I.; Riley, K.L. Continental-scale simulation of burn probabilities, flame lengths, and fire size distribution for the United States. In Proceedings of the VI International Conference on Forest Fire Research, Coiambra, Portugal, 15–18 November 2010; Viegas, D.X., Ed.; Univeristy of Coiambra: Coiambra, Portugal, 2010; pp. 15–18. [Google Scholar]
  34. Ye, T.; Wang, Y.; Guo, Z.; Li, Y. Factor contribution to fire occurrence, size, & burn probability in a subtropical coniferous forest in East China. PLoS ONE 2017, 12, 1–18. [Google Scholar] [CrossRef] [Green Version]
  35. Monedero, S.; Ramirez, J.; Molina-Terrén, D.; Cardil, A. Simulating wildfires backwards in time from the final fire perimeter in point-functional fire models. Environ. Model. Softw. 2017, 92, 163–168. [Google Scholar] [CrossRef]
  36. Ramirez, J.; Monedero, S.; Buckley, D. New approaches in fire simulations analysis with Wildfire Analyst. In Proceedings of the 5th International Wildland Fire Conference, Sun City, South Africa, 9–13 May 2011. [Google Scholar]
  37. Duane, A.; Aquilué, N.; Gil-Tena, A.; Brotons, L. Integrating fire spread patterns in fire modelling at landscape scale. Environ. Model. Softw. 2016, 86, 219–231. [Google Scholar] [CrossRef]
  38. Cardil, A.; Merenciano, D.; Molina-Terrén, D. Wildland fire typologies and extreme temperatures in NE Spain. iForest Biogeosci. For. 2016, 10, 9–14. [Google Scholar] [CrossRef] [Green Version]
  39. Parisien, M.A.; Miller, C.; Parks, S.A.; DeLancey, E.R.; Robinne, F.N.; Flannigan, M.D. The spatially varying influence of humans on fire probability in North America. Environ. Res. Lett. 2016, 11, 075005. [Google Scholar] [CrossRef] [Green Version]
  40. Garcia, M.; Riaño, D.; Yebra, M.; Salas, F.J.; Cardil, A.; Monedero, S.; Ramirez, J.; Martín, M.P.; Vilar, L.; Gajardo, J.; et al. A Live Fuel Moisture Content product from medium spatial resolution Landsat TM satellite time series ready for implementation in fire behavior models. Remote Sens. 2020, 12, 1714. [Google Scholar] [CrossRef]
  41. Rollins, M.G. LANDFIRE: A nationally consistent vegetation, wildland fire, and fuel assessment. Int. J. Wildland Fire 2009, 18, 235–249. [Google Scholar] [CrossRef] [Green Version]
  42. González, J.R.; Pukkala, T. Characterization of forest fires in Catalonia (north-east Spain). Eur. J. For. Res. 2007, 126, 421–429. [Google Scholar] [CrossRef]
  43. González, J.R.; Palahí, M.; Trasobares, A.; Pukkala, T. A probability model for forest stands in Catalonia (north-east Spain). Ann. For. Sci. 2006, 63, 169–176. [Google Scholar] [CrossRef]
  44. Díaz-Delgado, R.; Lloret, F.; Pons, X. Spatial patterns of fire occurrence in Catalonia, NE, Spain. Landsc. Ecol. 2004, 19, 731–745. [Google Scholar] [CrossRef] [Green Version]
  45. Díaz-Delgado, R.; Pons, X. Spatial patterns of forest fires in Catalonia (NE of Spain) along the period 1975–1995: Analysis of vegetation recovery after fire. For. Ecol. Manag. 2001, 147, 67–74. [Google Scholar] [CrossRef]
  46. Castellnou, M.; Pagés, J.; Larrañaga, A.; Piqué, M. Mapa de Risc D’incendi Tipus de Catalunya (Map of Wildfires in Catalonia Using Fire Types Concept); GRAF-Bombers; Ministry of Home Affairs, Generalitat of Catalonia and Forest Science and Technology Centre of Catalonia: Barcelona, Spain, 2010. [Google Scholar]
  47. Badia-Perpinyà, A.; Pallares-Barbera, M. Spatial distribution of ignitions in Mediterranean periurban and rural areas: The case of Catalonia. Int. J. Wildland Fire 2006, 15, 187–196. [Google Scholar] [CrossRef]
  48. Centre de Recerca Ecològica i Aplicacions Forestals. Mapa de Cobertes del Sòl de Catalunya v4 (Land Cover Map of Catalonia v4); CREAF, Ministry of Agriculture, Livestock, Fisheries and Food, Ministry of Home Affairs and Ministry of Territory and Sustainibility, Generalitat of Catalonia: Barcelona, Spain, 2009. [Google Scholar]
  49. Coll, L.; González-Olabarria, J.R.; Mola-Yudego, B.; Pukkala, T.; Messier, C. Predicting understory maximum shrubs cover using altitude and overstory basal area in different Mediterranean forests. Eur. J. Forest Res. 2011, 130, 55–65. [Google Scholar] [CrossRef] [Green Version]
  50. MAGRAMA (Ministerio de Agricultura, Pesca y Alimentación). Tercer Inventario Forestal Nacional (The Third National Forest Inventory); Ministry of Agriculture, Fisheries and Food: Madrid, Spain, 2007. [Google Scholar]
  51. Köppen, W. Das Geographische System der Klimate. Handbuch der Klimatologie; Köppen, W., Geiger, R., Eds.; Verlag von Gebrüder Borntraeger: Berlin, Germany, 1936; Volume 1, Part C; pp. 1–44. [Google Scholar]
  52. Iberian Climate Atlas. Available online: https://www.aemet.es/es/conocermas/recursos_en_linea/publicaciones_y_estudios/publicaciones/detalles/Atlas-climatologico (accessed on 2 August 2020).
  53. SPIF (Servei de Prevenció d’Incendis Forestals). Nombre D’incendis i Superficie Cremada per Anys. Període: 1986–2019 (Number of Fires and Burned Area per Years. Period: 1986–2019); Forest Fires Prevention Service, Ministry of Agriculture, Livestock, Fisheries and Food, Generalitat of Catalonia: Barcelona, Spain, 2020. [Google Scholar]
  54. González Olabarría, J.R.; Pukkala, T.; Palahi, M. Optimising the management of Pinus sylvestris L. stand under risk of fire in Catalonia (north-east of Spain). Ann. For. Sci. 2005, 62, 493–501. [Google Scholar] [CrossRef] [Green Version]
  55. Finney, M.A. An Overview of FlamMap Fire Modeling Capabilities. In Fuels Management—How to Measure Success: Conference Proceedings, Portland, OR, USA, 28–30 March 2006; Andrews, P.L., Butler, B.W., Eds.; Proceedings RMRS-P-41; U.S. Department of Agriculture, Forest Service, Rocky Mountain Research Station: Fort Collins, CO, USA, 2006; pp. 213–220. [Google Scholar]
  56. Vericat, P.; Piqué, M.; Koua, O.; Pla, M. Mapa de Formacions Forestals Pures i Mixtes de Catalunya a Partir del Mapa Forestal de España 1:50,000 Digitalitzat (Map of Pure and Mixed Forest Formations of Catalonia Based on the Digitalized Forest Map of Spain 1:50,000); Forest Science and Technology Centre of Catalonia (CTFC): Solsona, Spain, 2010. [Google Scholar]
  57. ICGC (Institut Cartogràfic i Geològic de Catalunya). Mapa de Variables Biofísiques de L’arbrat de Catalunya (Map of Biophysical Variables of Wooded Forest Areas of Catalonia); Cartographic and Geological Institut of Catalonia, Ministry of Agriculture, Livestock, Fisheries and Food and Ministry of Territory and Sustainibility, Generalitat of Catalonia: Barcelona, Spain, 2016. [Google Scholar]
  58. MAGRAMA (Ministerio de Agricultura, Pesca y Alimentación). Cuarto Inventario Forestal Nacional (The Fourth National Forest Inventory); Ministry of Agriculture, Fisheries and Food: Madrid, Spain, 2017. [Google Scholar]
  59. Piqué, M.; Vericat, P.; Cervera, T.; Baiges, T.; Farriol, R. Tipologies Forestals Arbrades. In Orientacions de Gestió Forestal Sostenible per a Catalunya (ORGEST) (Typologies of Wooded Forest Areas. Orientacions of Sustainable Forest Management in Catalonia); Ministry of Agriculture, Livestock, Fisheries and Food, Generalitat of Catalonia: Barcelona, Spain, 2011. [Google Scholar]
  60. ICGC (Institut Cartogràfic i Geològic de Catalunya). Cartographic and Geological Institute of Catalonia, Ministry of Agriculture, Livestock, Fisheries and Food and Ministry of Territory and Sustainability, Generalitat of Catalonia. Available online: https://www.icgc.cat/Descarregues/Elevacions (accessed on 13 October 2020).
  61. Scott, J.H.; Reinhardt, E.D. Assessing Crown Fire Potential by Linking Models of Surface and Crown Fire Behavior; USDA Forest Service: Fort Collins, CO, USA, 2001. [Google Scholar]
  62. Scott, J.H.; Burgan, R.E. Standard Fire Behavior Fuel Models: A Comprehensive Set for Use with Rothermel’s Surface Fire Spread Model; USDA Forest Service, Rocky Mountain Research Station: Fort Collins, CO, USA, 2005. [Google Scholar]
  63. Rothermel, R.C. A Mathematical Model for Predicting Fire Spread in Wildland Fuels; Research Paper INT-115; U.S. Department of Agriculture, Intermountain Forest and Range Experiment Station: Ogden, UT, USA, 1972; 40p. [Google Scholar]
  64. Anderson, H.E. Aids to Determining Fuel Models for Estimating Fire Behavior; General Technical Report INT-122; U.S. Department of Agriculture, Forest Service, Intermountain Forest and Range Experiment Station: Ogden, UT, USA, 1982; 22p. [Google Scholar]
  65. Ninyerola, M.; Pons, X.; Roure, J.M. Atlas Climático Digital de la Península Ibérica. Metodología y Aplicaciones en Bioclimatología y Geobotánica; Universidad Autónoma de Barcelona: Cerdanyola del Vallès, Spain, 2005. [Google Scholar]
  66. Servei Meteorològic de Catalunya (Meteorological Service of Catalonia). Available online: https://www.meteo.cat/observacions/xema (accessed on 24 March 2018).
  67. Duane, A.; Piqué, M.; Castellnou, M.; Brotons, L. Predictive modelling of fire occurrences from different fire spread patterns in Mediterranean landscapes. Int. J. Wildland Fire 2005, 24, 407–418. [Google Scholar] [CrossRef]
  68. Cardil, A.; Monedero, S.; Silva, C.A.; Ramirez, J. Adjusting the rate of spread of fire simulations in real-time. Ecol. Model. 2019, 395, 39–44. [Google Scholar] [CrossRef]
  69. PREVINCAT. Available online: http://previncat.ctfc.cat/ (accessed on 13 October 2020).
  70. Finney, M.A. FARSITE: Fire Area Simulator-Model Development and Evaluation; Research Paper RMRS-RP-4, Revised 2004; U.S. Department of Agriculture, Forest Service, Rocky Mountain Research Station: Ogden, UT, USA, 1998; 47p. [Google Scholar]
  71. WildfireAnalyst. Available online: https://tecnosylva.es/wildfire-analyst (accessed on 13 October 2020).
Figure 1. Schematic diagram of the conceptual design of the project.
Remotesensing 12 04124 g001
Figure 2. Schematic diagram of the landscape file (LCP) generation workflow.
Remotesensing 12 04124 g002
Figure 3. Algorithm used for assignation of the Scott and Burgan [62] model to stand populated by Pinus halepensis; Fcc = Forest Canopy Cover; CCarb = Understory Shrub Cover; yellow color = model assigned if the pixel is located within the dry area; blue color = model assigned if the pixel is located within the humid area; black color = model assigned regardless of the area; n = representativeness of the model (% in the total area covered by species).
Remotesensing 12 04124 g003
Figure 4. Meteorological regions of Catalonia and characteristic synoptic situations, defined by the frequency of the predominant wind directions during high risk days. The spatial frame of these regions being the basis for the assessment of meteorological data.
Remotesensing 12 04124 g004
Figure 5. Fuel models map of Catalonia, according to Scott and Burgan [62].
Remotesensing 12 04124 g005
Figure 6. Biophysical variables of wooded forest areas in Catalonia contained in the landscape file of PREVINCAT.cat.
Remotesensing 12 04124 g006
Figure 7. Interface of PREVINCAT server with all available data layers spatially structured by 77 Zones of Homogeneous Fire Regime (ZHR) [69].
Remotesensing 12 04124 g007
Figure 8. Examples of fire behavior outputs from fire simulation tools (left: flame length obtained from FlamMap; right: reconstruction of an historical fire and time of arrival using FARSITE) in two different areas of Catalonia using the PREVINCAT.cat database.
Remotesensing 12 04124 g008
Figure 9. Theoretical organization of the PREVINCAT.cat server.
Remotesensing 12 04124 g009
Table 1. List of variables used to generate the landscape file (LCP).
VariableUnitData Processing
Forest canopy cover (FCC)%Original data, not processed
Standard height (SH)metersOriginal data, not processed
Canopy base height (CBH)metersParameterized and (geospatially) modelled
Canopy bulk density (CBD)kg/m3Parameterized and (geospatially) modelled
Fuel models (FM)CategoriesParameterized and (geospatially) modelled
Digital Terrain Model (DTM)metersOriginal data, not processed
Slope (SL)%Geospatially transformed
Aspect (ASP)degreesGeospatially transformed
Table 2. Correspondence between vegetation type (basic fuel models) and Scott and Burgan’s models [63].
Vegetation TypesFuel Type by Scott and Burgan [63]
Wooded forest areaSlash-Blowdown (SB), Timber Litter (TL), Timber Litter (TL)
Regenerated forestShrub (SH)
ScrublandGrass-Shrub (GS), Shrub (SH)
GrasslandGrass (GR)
Non-burnableNon-burnable (NB)
Publisher’s Note: MDPI stays neutral with regard to jurisdictional claims in published maps and institutional affiliations.

