Article

An Artificial Neural Network to Infer the Mediterranean 3D Chlorophyll-a and Temperature Fields from Remote Sensing Observations

by
Michela Sammartino
1,*,
Bruno Buongiorno Nardelli
2,
Salvatore Marullo
1,3 and
Rosalia Santoleri
1
1
Istituto di Scienze Marine, Consiglio Nazionale delle Ricerche (ISMAR-CNR), 00133 Rome, Italy
2
Istituto di Scienze Marine, Consiglio Nazionale delle Ricerche (ISMAR-CNR), 80133 Naples, Italy
3
Agenzia Nazionale per le Nuove Tecnologie, l′Energia e lo Sviluppo Economico Sostenibile (ENEA), Centro Ricerche Frascati, 00044 Frascati, Italy
*
Author to whom correspondence should be addressed.
Remote Sens. 2020, 12(24), 4123; https://doi.org/10.3390/rs12244123
Submission received: 26 October 2020 / Revised: 10 December 2020 / Accepted: 11 December 2020 / Published: 17 December 2020
(This article belongs to the Section Ocean Remote Sensing)

Abstract

:
Remote sensing data provide a huge number of sea surface observations, but cannot give direct information on deeper ocean layers, which can only be provided by sparse in situ data. The combination of measurements collected by satellite and in situ sensors represents one of the most effective strategies to improve our knowledge of the interior structure of the ocean ecosystems. In this work, we describe a Multi-Layer-Perceptron (MLP) network designed to reconstruct the 3D fields of ocean temperature and chlorophyll-a concentration, two variables of primary importance for many upper-ocean bio-physical processes. Artificial neural networks can efficiently model eventual non-linear relationships among input variables, and the choice of the predictors is thus crucial to build an accurate model. Here, concurrent temperature and chlorophyll-a in situ profiles and several different combinations of satellite-derived surface predictors are used to identify the optimal model configuration, focusing on the Mediterranean Sea. The lowest errors are obtained when taking in input surface chlorophyll-a, temperature, and altimeter-derived absolute dynamic topography and surface geostrophic velocity components. Network training and test validations give comparable results, significantly improving with respect to Mediterranean climatological data (MEDATLAS). 3D fields are then also reconstructed from full basin 2D satellite monthly climatologies (1998–2015) and resulting 3D seasonal patterns are analyzed. The method accurately infers the vertical shape of temperature and chlorophyll-a profiles and their spatial and temporal variability. It thus represents an effective tool to overcome the in-situ data sparseness and the limits of satellite observations, also potentially suitable for the initialization and validation of bio-geophysical models.

Graphical Abstract

1. Introduction

In recent years, the assessment and monitoring of the marine environmental status has received ever-growing attention, due to the potentially critical impact of ongoing natural and human-induced changes on related ecosystem functioning and services. A deeper understanding of marine ecosystem evolution and dynamics, however, would require 3D observations of key essential ocean variables at different temporal and spatial scales and much wider and regular coverage than presently achievable.
Indeed, most of the existing data, especially those providing biological/bio-optical/bio-chemical parameters, are collected by in situ sampling either through coastal monitoring programs and time-limited oceanographic cruises, or by fixed platform, as moored buoys, and by autonomous instruments, such as Biogeochemical Argo (BGC-Argo) [1,2,3,4,5,6]. These data are eventually able to provide accurate descriptions of local conditions along the water column, but they are clearly not sufficient to describe the processes occurring over the wide range of temporal and spatial scales involved/affected by undergoing changes [7].
On the other hand, the space-time coverage and accuracy of surface observations from satellite platforms has been continuously improving [8,9,10]. Remotely-sensed measurements have significantly changed our way to investigate marine ecosystem dynamics: the retrieval of chlorophyll-a concentration (hereafter chlorophyll) from ocean color measurements, used as a proxy of biomass, revolutionized our understanding of the biological-physical interactions and opened new possibilities for quantitative assessments of basin scale variations [11,12,13]. Nevertheless, one important limit of the remote sensing data is that they sense only the surface layer and are not able to observe properties at depth. In fact, the detection capability of satellite observations depends on the band and measurement principle considered. For ocean color data, the measured signals result from the interaction of light with the water constituents, decreasing exponentially with depth. The attenuation coefficient, modulated by the presence of phytoplankton pigments, non-algal particles (NAP), and colored dissolved organic matter (CDOM) [14], determines the depth of the euphotic zone (Zeu) (defined as the depth where 99% of the surface light is attenuated), limiting the amount of energy available for the photosynthesis. Satellite observations can only reveal the signals integrated between the surface and the first optical depth, thus sensing even shallower layers [15].
As such, most of the variability of marine bio-physical variables remains unobserved. Noteworthy, the synergic use of satellite and in situ data already proved as an effective way to exploit the advantages of both, using satellite data to complement the accuracy of punctual in situ observation for a description of ocean’s vertical structure at higher spatial and frequency resolution, either at regional and global scales. The quantitative extrapolation of essential ocean variables from surface to deeper layers can be pursued with several techniques, which span from purely empirical models to more recent machine learning approaches. For physical variables, as temperature and salinity, different empirical methodologies have been proposed. Some of them include (multi)linear regression models [16,17,18,19,20,21,22,23], as, e.g., in Jeong et al. [23], where the subsurface temperature is inferred by exploiting its high correlation with surface fields, Coupled Pattern Reconstruction [20], Empirical Orthogonal Function reconstruction, [21,24,25] and Gravest Empirical Modes [26], where empirical mode decompositions are used. As a counterpart, for biological variables (e.g., chlorophyll concentration), Morel and Berthon [27] and Uitz et al. [28] proposed empirical parametrizations for the vertical biomass retrieval in different surface trophic regimes.
Nevertheless, these types of inversion models can often come across erroneous estimates, due to the complexity and non-linearity of the system, especially in those areas characterized by non-trivial vertical stratification and small-scale phenomena, that can easily determine different vertical profile shapes corresponding to the same surface observation of a single variable.
More recently, investigations on the potential use of artificial intelligence (AI) tools to address this challenge have shown promising results. For ocean physical applications (at local and global scales), they include: the combination of a pre-clustering process and the use of a neural network to determine e.g., the Subsurface Temperature Anomaly (STA) using Sea Surface Temperature (SST), Sea Surface Height (SSH) and surface wind observation [29]; the use of self-organizing map (SOM) applied on SST, SSH and Sea Surface Salinity (SSS) data from Argo gridded monthly anomaly datasets in order to infer the STA [30]; the application of support vector machine on satellite SST, SSH and SSS anomalies for the estimation of the STA in the Indian Ocean [31], at global scale, the use of an extreme gradient boosting (XGBoost) for the STA retrieval from surface observations [32]; the use of a multi-layer network or multilayer convolutional long- and short-term memory (M-convLSTM) to predict directly the subsurface temperature field from surface data [33,34], the use of SST, (SSS) and Absolute Dynamic Topography (ADT) to predict hydrographic profiles and related uncertainties through a deep LSTM combined with a dropout strategy [35].
Chlorophyll vertical reconstruction with machine learning was first carried out by Richardson [36], who tested an unsupervised neural network to characterize the vertical shape of chlorophyll from satellite data and the estimation of primary production in the coastal Benguela upwelling system. A similar unsupervised network, combined with Hidden Markov Models, is proposed in [37], while a cascade neural network, trained with a quasi-Newton method, is presented in [38]. Conversely, supervised neural networks were applied in [39,40,41,42] to provide primary production estimates. Similar supervised approaches, based on Multi-Layer-Perceptron (MLP), were implemented in two works [43,44] aimed to reconstruct the vertical bio-optical and bio-geochemical variables from Bio-Argo data combined with satellite measurements, still requiring concurrent vertical observations of physical variables. Sauzède et al. [45] proposed a network for the retrieval of water-column nutrients from satellite and BCG-Argo measurements. Similarly, a Bayesian approach has been proposed to augment in situ observations by inferring vertical profiles of variables that are not directly measured [46].
All these works exploit two key points: the high frequency and coverage of satellite observations and the power of AI to reveal non-linear relations [47]. In fact, considering the complexity of marine ecosystems and the reduced number of observed environmental and biological variables, the capability of machine learning techniques to recognize the implicit relationship between specific variables, without imposing a priori models, allows to overcome some of these limitations, which would result impossible to solve through poorly constrained deterministic models [47].
In this work, we develop and test a new model to directly project chlorophyll and temperature surface data at depth, based on a deep feedforward network. The proposed model, focused on the Mediterranean Sea, extends previous developments described in [48]. As detailed in the following sections, it represents a major evolution with respect to our previous work, because:
(1)
it introduces a different network architecture (different input vector definition, different network depth, different optimization algorithm);
(2)
it introduces a new set of input variables (with dedicated sensitivity tests): Absolute Dynamic Topography and U & V geostrophic velocities;
(3)
both training and prediction are effectively based on satellite data and not on in situ surface values;
(4)
for the first time, the technique is applied to retrieve and analyze full 3D monthly climatological fields in the Mediterranean Sea.
Specifically, we propose a regional model to jointly infer the vertical chlorophyll and temperature fields at once. A two-hidden-layer feedforward neural network is employed and trained directly on satellite data and not anymore on in situ surface values. Here, we focus on the Mediterranean Sea, which is characterized by very complex bio-geochemical processes and physical dynamics (and interactions among them), that make the prediction of the ocean interior structure from surface observations a real challenge. Results of the reconstruction are validated against in situ data over fully independent matchup points, significantly improving with respect to climatologies. The network is successively applied to reconstruct and analyze the Mediterranean seasonal climatologies of 3D chlorophyll fields.

2. Materials and Methods

Artificial neural networks require a training and test dataset to verify not only model performances but also to assess their ability to generalize the unseen data. Here, a Multi-Layer-Perceptron (MLP) is used for the concurrent retrieval of the subsurface chlorophyll and temperature profiles from satellite observations plus some ancillary information. Specifically, the network training and test were based on a matchup database where each record includes surface (satellite plus latitude, longitude and date) variables and in situ vertical profiles when simultaneously available.
In the following sections, we provide: a description of the in situ and satellite datasets used; details on MLP, the pre- and post-processing of the input/output data; a description of the network implementation and its training.

2.1. In Situ Database and Quality Control

The in situ database includes all concurrent profiles of temperature and chlorophyll collected during 20 oceanographic cruises carried out in the Mediterranean Sea from 1998 to 2015 (same as in [48]). Most of these data were acquired and processed by the GOS group (Global Ocean Satellite monitoring and marine ecosystem studies) of the Institute of Marine Sciences (ISMAR) of Rome of the Italian National Research Council (CNR).
More in detail, the chlorophyll profiles were acquired with a fluorometer and then calibrated with bottle samples that were concurrently sampled in each cruise.
All data passed the quality controls based on SeaDataNet standards (see quality control manual at https://www.seadatanet.org/Standards/Data-Quality-Control) and further requirements stated for the specific goal of this work. The same procedure adopted in [48] was applied on either in situ chlorophyll and temperature profiles and included the following points:
  • Visual check (to guarantee the consistency of the database);
  • Check of the first acquisition depth (accepted if ranging between 3 and 4 m to avoid any noise on the first acquired measure);
  • Check of missing points along the profiles: a specific-case evaluation was done observing each sample. The profile showing too many missing points were discarded, otherwise they were linearly interpolated.
  • Check maximum acquisition depth: only those profiles with a depth greater or equal to 150 m were included.
The quality control procedure selected 1213 over 2710 profiles suitable for the subsequent MLP development. From this data-pool, about 30% was randomly extracted and used for testing the network performance, as an independent dataset, once implemented the network (Figure 1).

2.2. Matchup Satellite Database

The network, here proposed, takes as inputs different surface remote sensing variables.
All Mediterranean satellite observations used in this work were downloaded from Copernicus Marine Environment Monitoring Service (CMEMS) (https://marine.copernicus.eu/) and cover the time window from 1998 to 2015.
Satellite daily chlorophyll (ChlSAT) maps are regional products interpolated (L4) at 1 km of resolution from the merging of multi sensor data (SeaWiFS, MODIS-Aqua, NPP-VIIRS). The chlorophyll field is computed by applying two algorithms regionalized for the Mediterranean Sea and diversified for water types: the MedOC4 [49] applied for open waters (Case1) and AD4 [50] for the optically complex waters (Case2). The membership of each pixel to the different water types is determined by comparing its satellite spectrum to the average water type spectral signature obtained from the MedOC4 [49] and the CoASTS [51] in situ databases, respectively. The processing of intermediate pixels between Case1 and Case2 follows the [52] methods. Finally, the interpolation procedure is based on the DINEOF algorithm described in [53].
The Mediterranean Sea Surface Temperature (SST) products are produced by the CNR starting from the reprocessed Pathfinder V5.3 (PFV53) AVHRR data covering the 1982–2018 period and combined them with a bias-corrected version of the CMEMS NRT L4 data up to 2017 to provide a consistent time series of interpolated (L4) field at a resolution of 0.0417° × 0.0417°. The interpolation is pursued through an Optimal Interpolation algorithm (for more details about this product see the Quality Information Document; http://marine.copernicus.eu/documents/QUID/CMEMS-SST-QUID-010-021-022.pdf and [54,55,56]).
The Absolute Dynamic Topography (ADT) and absolute geostrophic currents (zonal and meridian components, U & V respectively) are additional variables included in the altimeter satellite gridded data of Sea Level Anomalies (SLA) available in the CMEMS web-portal, produced by the production unit of SL-CLS of Toulouse in France. The ADT is the instantaneous height above the Geoid and it is obtained from the sum of the SLAN and MDTN (Mean Dynamic Topography, [57], where N, here, is the mean reference period (1993–2012). The ADT is a delayed time optimally interpolated product at a resolution of 0.125° × 0.125° processed by the DUACS multimission altimeter data processing system and coming from the merging of different altimeter missions (for more details about the processing see the Quality Information Document at https://resources.marine.copernicus.eu/documents/QUID/CMEMS-SL-QUID-008-032-062.pdf or http://duacs.cls.fr). The absolute geostrophic currents are obtained by the SLA and ADT product, above mentioned.
The value for each satellite matchups was obtained by computing the median value of the cloud free pixel within a 3 × 3 box, for a total number of 1213 matchups.

2.3. Multi-Layer-Perceptron (MLP)

In this work, a Multi-Layer-Perceptron (MLP), [58,59] is developed starting from the nntool of MATLAB® version 9.7 (R2019b) [60]. The MLP consists of a series of layers connected to each other from the input to the final output, through one or more hidden layers. Each layer contains the computing elements (neurons or nodes) characterized by a non-linear activation function and connected to the subsequent layer with weighted edges.
More specifically, the network used in this work is a Feedforward Neural Networks which can be employed for any kind of input/output mapping [61]. During the training, the weights are iteratively adjusted following the minimization of a cost function as the quadratic error between the observed and predicted outputs [44]. This iterative process continues until a minimum is reached, through the technique of error backpropagation [59,62]. In our network, the training is performed by applying the Scaled Conjugate Gradient backpropagation (SCG). This is an optimization method based on conjugate directions but with no line search at each iteration. By using a step size scaling mechanism, this method resulted to be faster than other second order algorithms [63].

2.4. Data Pre-and Post-Processing

The candidate input variables selected for the concurrent prediction of chlorophyll and temperature at different depths (here represented by the pressure levels) are the following: the depth, latitude, longitude, day of the year, the satellite SST, ChlSAT, ADT and U & V components of geostrophic currents retrieved from satellite topography. Differing from [48], here, three new satellite-derived variables have been included and different configurations have been tested.
The choice of the co-predictors is related to the nature of the examined problems and to the limited number of variables available to characterize the ocean state. In our model, the time variable (day of the year) and geographical coordinates (latitude and longitude) are expected to account for the seasonal evolution of the examined parameters and for the spatial variability represented by the different bio-geographies of the Mediterranean Sea [64]. Moreover, ADT, U & V components provide information of the surface ocean dynamics, and might thus help to better retrieve vertical stratification and related environmental conditions. Zonal and meridional surface currents can have an impact on surface chlorophyll distribution in terms of horizontal advective processes and correlated nutrient transport, while the ADT, coupled to the SST, provides information on the steric variations that can be related to modifications of the internal density structure (e.g., [65,66,67,68]). All these predictors were tested together with ChlSAT to optimize the MLP performance in the Mediterranean Sea.
The entire dataset was randomly divided in two subsets: one for the training and internal validation (70% of total) and the remaining (about 30% of the total) for the independent test of the MLP performance.
Before the training, the ChlSAT and in situ vertical chlorophyll were log-10 transformed. Additionally, to take advantage of the annual cycle, the sampling date was projected on circular coordinates as follows:
d a y 1 = c o s ( 2 π ( d a y   o f   t h e   y e a r / 365 ) )
d a y 2 = s i n ( 2 π ( d a y   o f   t h e   y e a r / 365 ) ) ;
Then, all inputs (except day1 and day2) were standardized by applying a z-score transformation as follow:
z ( x i ) = ( x i μ ) σ
where the μ and σ are respectively the mean and standard deviation for each co-predictor of the training dataset, while x i is a generic i- input value.
The z-score transformation is a linear normalization of the inputs, widely employed in the MLP development, arranging the inputs and the target outputs within similar ranges of values [69,70]. At the same time, the log-10 transformation adopted for the chlorophyll concentrations is strictly related to the natural distribution of this variable in the Mediterranean Sea, which can vary from very small concentration as e.g., 0.01 mgm−3 up to values even considerably higher than 10 mgm−3.
Obviously, once completed the MLP training, the outputs were converted into original values applying the z-score inverse formula based on reference μ and σ of training targets.

2.5. MLP Training

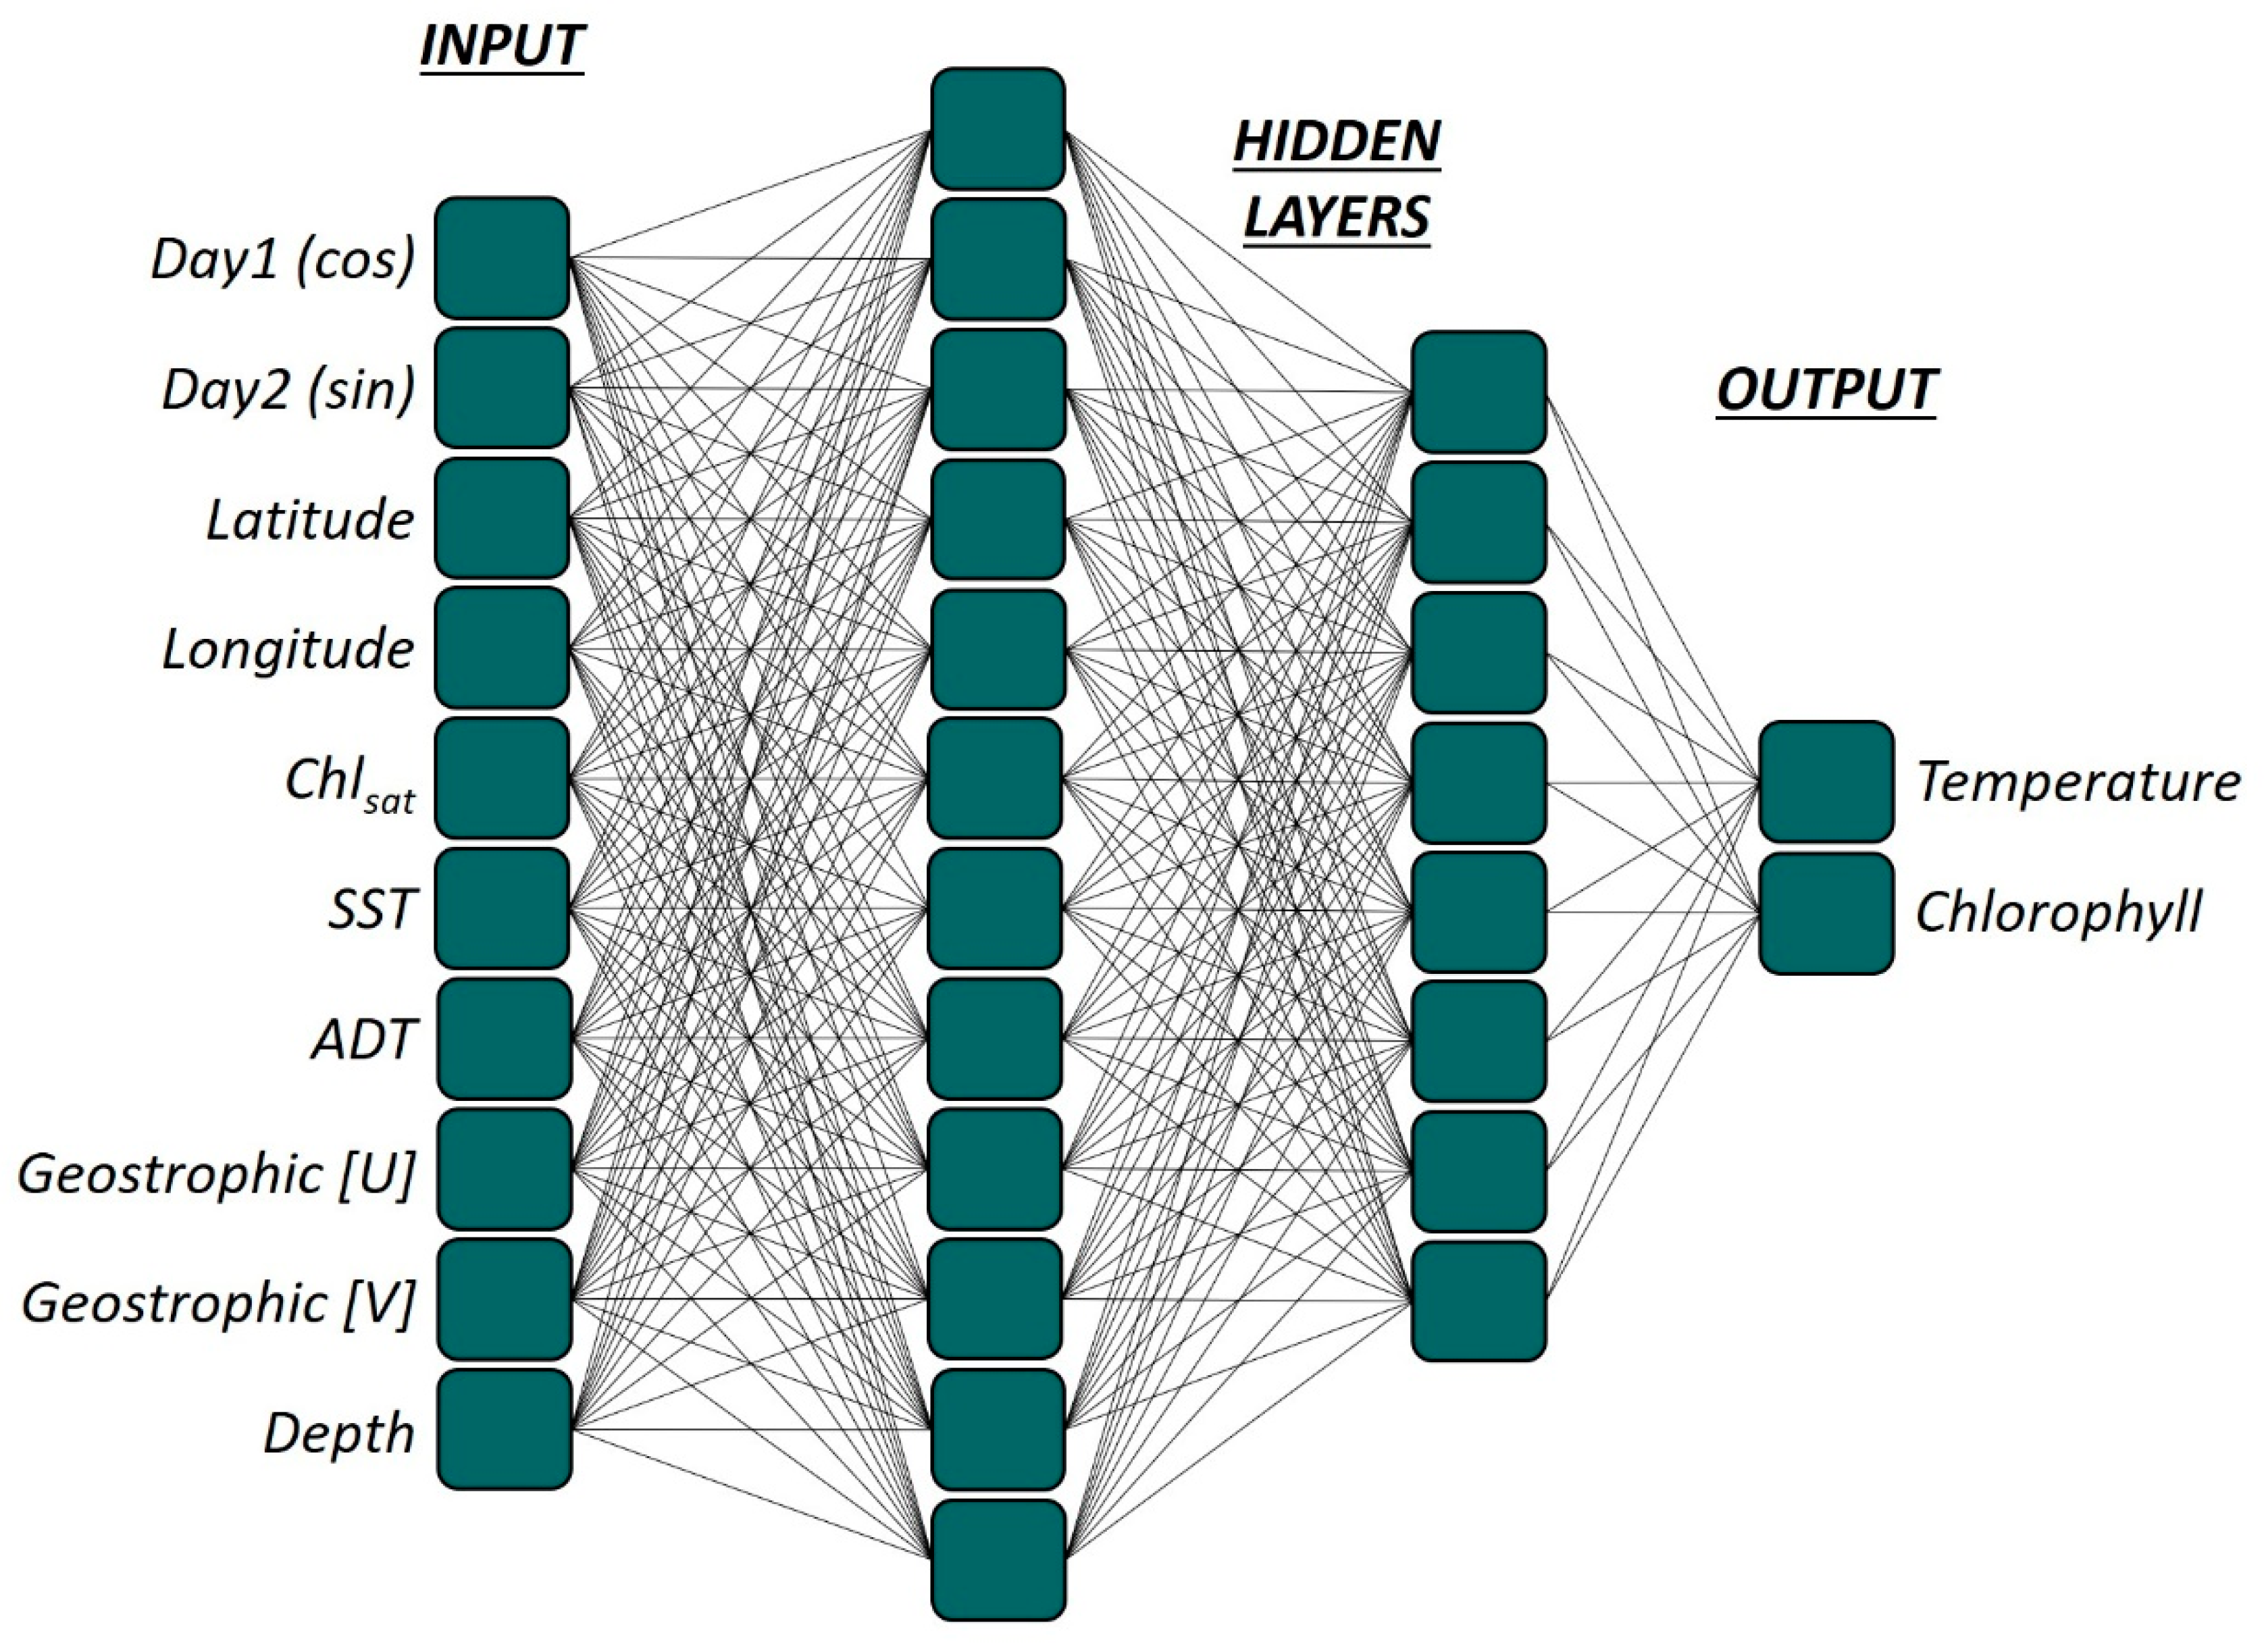
The structure of the network was defined on the base of different tests using one or two hidden layers, with a number of neurons varying between 5 and 36. To choose the final configuration, other hyper-parameters were varied: the number of valid fails before stopping the training (early stopping in the following), the application or not of regularization strategies, the use of a linear or hyperbolic tangent sigmoid as transfer function of the output layer and different number of epochs (e.g., varying from 1000 to 8000). After several trials, the architecture with minimum error on the test set and minimum number of neurons was selected as optimal. The structure of the network was thus set to (10-12-8-2) (Figure 2), which means one input layer with 10 inputs, two hidden layers with 12 and 8 nodes, respectively, and one output layer including the two output variables (chlorophyll and temperature). The transfer function chosen for both hidden layers was a hyperbolic tangent sigmoid, while a linear function was applied for the output layer. During the training phase the targets were scaled between a [−1, 1] interval. This choice ensures an equal treatment of the predictions and training targets in the cost function, without favoring the targets with the largest value ranges. Finally, to improve the model generalization, the entire training dataset was replicated to ensure a more balanced selection of those profiles less represented in the dataset [71].
In order to improve the network generalization, the training was carried out following the so called early stopping criterion: during the training phase, the dataset is randomly divided in two additional subsets: the first is properly the training set (80%) which is used for computing the gradient and updating the weights and biases, while the second is called validation set (20%) and it is used for an internal validation of the network and leading its learning. In fact, when the error computed on the entire validation set starts to increase and deviates from the mean-square error (MSE) computed on the whole training set, that’s still decreasing, the learning phase is stopped and the weights at the minimum of the validation error are saved; in our training the number of validation fails was set to 1. This means that the training was stopped at the first divergence between the validation and training MSE, respectively. This technique is widely used to avoid as much as possible the overfitting [47,58].
To further improve the generalization of the network, an additional method was adopted, the so-called regularization [70]. This is based on the modification of the performance function (usually represented by the MSE computed on the training set), by adding a term that consists of the mean of the sum of squares of the network weights and biases:
m s e r e g = γ m s w + ( 1 γ ) m s e
with γ representing the performance ratio, a regularization parameter that defines the penalty imposed to the weights and biases, and   m s w = 1 n J ˙ = 1 n w j 2   defining the mean of the sum of the squared weights and biases ( w j ) . The regularization effect forces the network to adopt smoother weights. This modified MSE, in addition to the normalization of the outputs within the interval [−1, 1], enables to have smaller weights and biases and thus prevent the overfit [60]. In our case, the performance ratio was set to 0.01, after several tests with values in the range between 0.001 and 2.

3. Results

3.1. MLP Performance Evaluation and Input Sensitivity Analysis

The MLP performance was assessed on the test set by comparing the predicted chlorophyll and temperature deep values with the in situ ones. As described before, the test set represents 30% of the total database (364 stations accounting for 53,872 single depth individual data values). The inputs were standardized and processed as done during the training (according to the reference values of μ and σ ), and then passed to the network. The outputs were then transformed by applying the inverse formula of the z-score scaling, according to the reference μ and σ of targets of training dataset. The metrics used for this analysis are reported in the following Table 1:

3.1.1. Chlorophyll Assessment

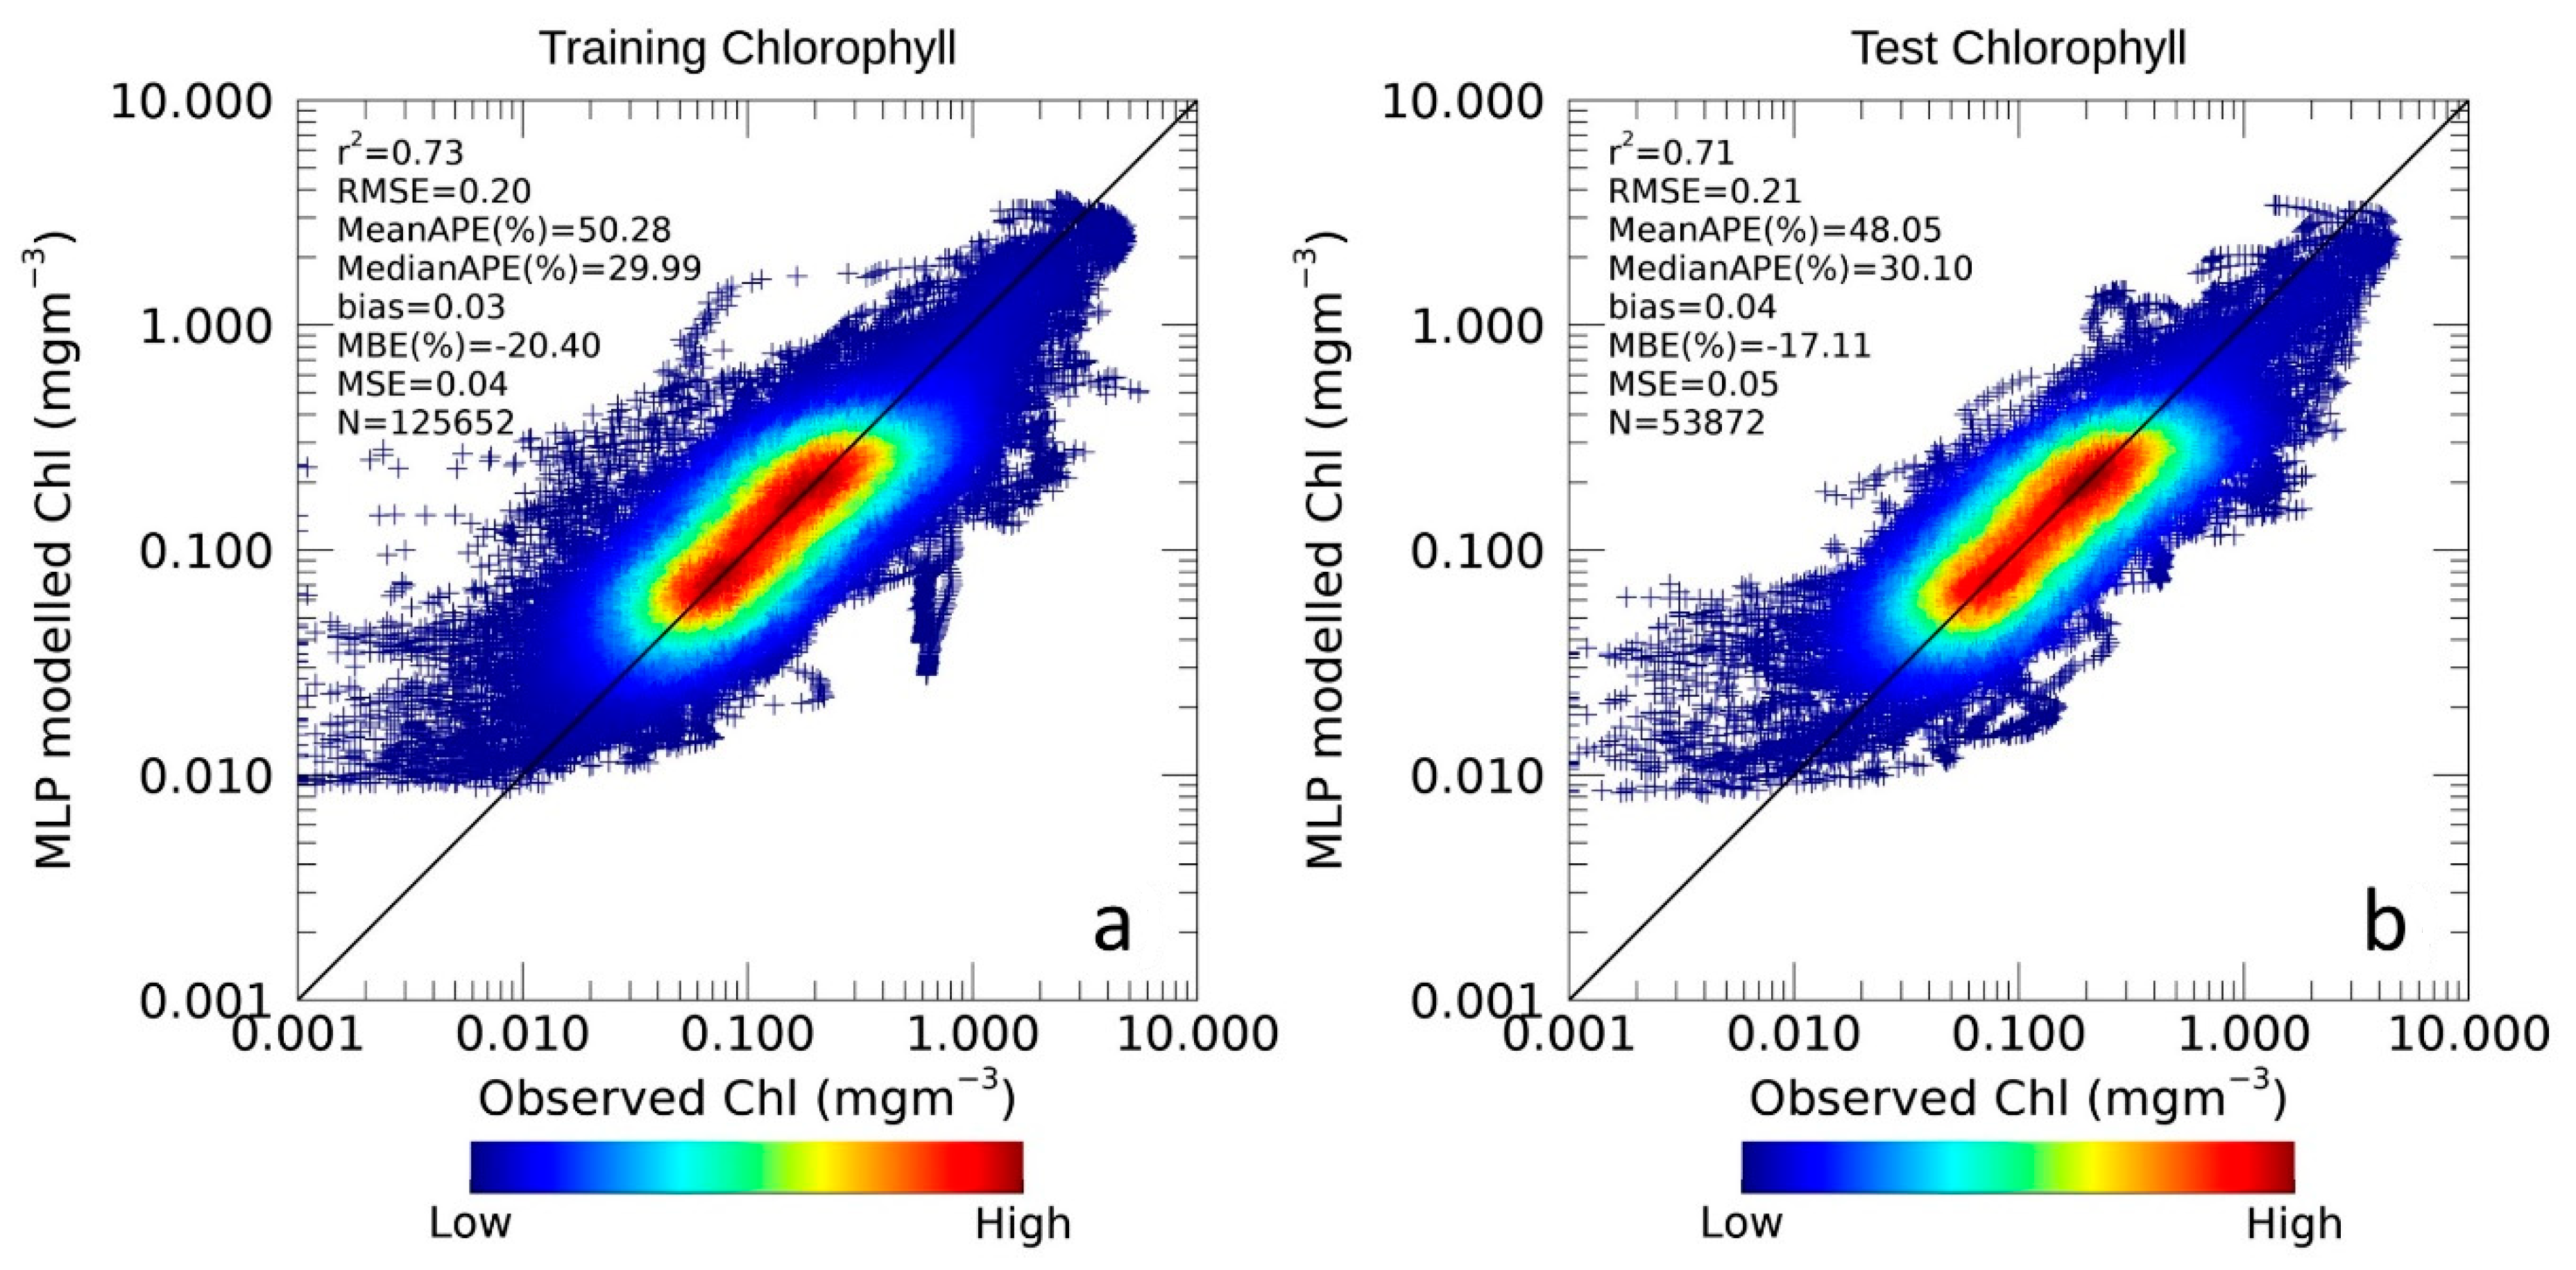
Figure 3 shows the density scatterplots and statistics of the comparison between the observed and predicted chlorophyll values on training (Figure 3a) and test (Figure 3b) dataset, respectively.
The MLP predicts the target chlorophyll values with a good accuracy. The statistic on each panel is comparable for both datasets, suggesting the network is no-overfitting during the learning phase. The determination coefficient is high in both cases (training, r2 = 0.73; test, r2 = 0.71), while the RMSE is relatively low with values of 0.20 mgm−3 for training and 0.21 mgm−3 for the test, indicating the good fit of the model on the observed data and the closeness of the predictions to the real data. The biases (training, MBE = 0.03 mgm−3 and test, MBE = 0.04 mgm−3) are also low, while the negative values of the MBE% (training, MBE% = −20% and test, MBE% = −17%) suggests an over-all overestimation of the MLP with respect to the targets. This is also observable in the scatterplots of Figure 3 where, for lowest chlorophyll concentrations, the MLP tends to overestimate the observed data, showing a reduced prediction variability with respect to the targets.
Figure 3 shows that most of the data fall along the 1:1 line, with a reduced scatter. The performance of this network improves with respect to the shallower network set-up in [48], that was trained on in situ data alone. In fact, the test validation statistics show a clear advantage of the new network architecture: the determination coefficient (r2 = 0.71) is higher than r2 = 0.69 of [48], and the relative percentage errors (MBE% = 17%; MeanAPE% = 48%; MedianAPE% = 30%) and RMSE = 0.21 mgm−3 are also lower (MBE% = 28%; MeanAPE%= 57%; MedianAPE% = 34%; RMSE = 0.26 mgm−3). Furthermore, even if the test set used is not exactly the same in the two models, the comparison between both reconstructions based on satellite surface data and the in situ profiles also highlights an improvement in terms of r2 (0.71 against 0.63 of [48]) and RMSE (0.21 mgm−3 against 0.23 mgm−3 of [48]).
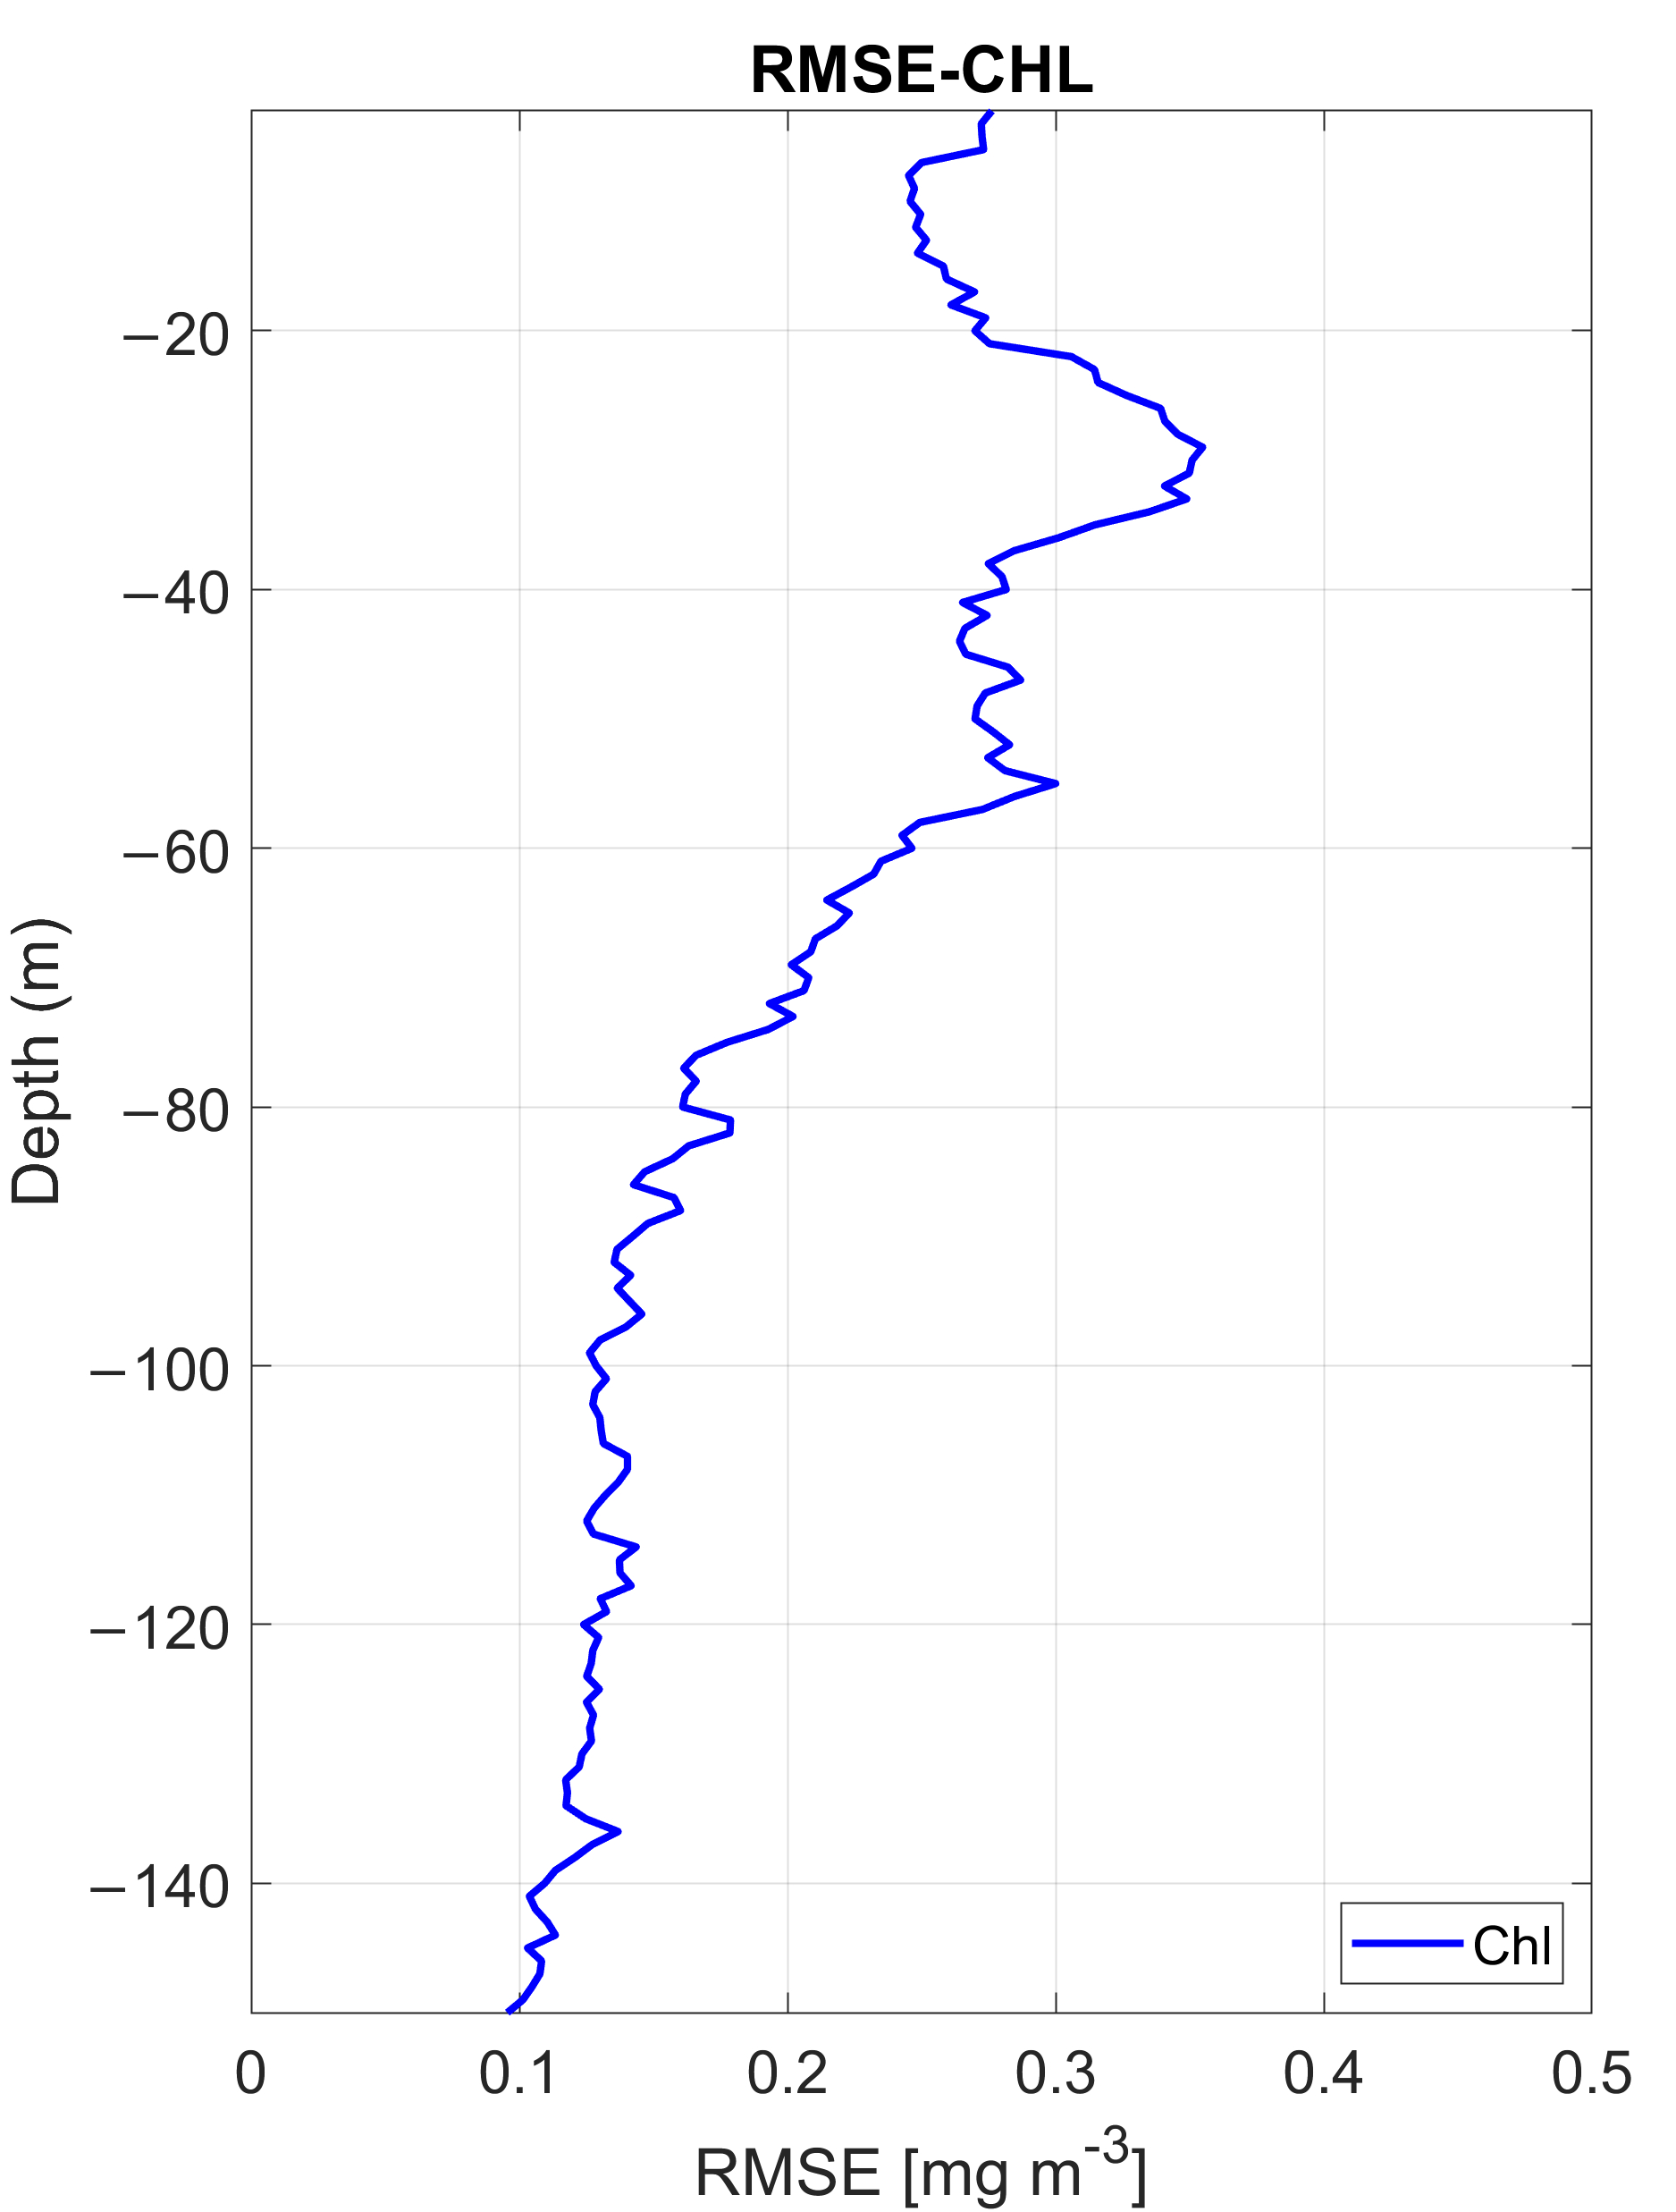
Figure 4 shows RMSE profile computed on the test set as a function of depth. The higher errors (RMSE = 0.35 mgm−3) are observed between 20 m and 60 m, which corresponds to the portion of the water-column where major chlorophyll variations occur, mostly driven by the evolution of the Deep Chlorophyll Maximum (DCM). DCM occurrence is determined by the complex dynamics of light, temperature and nutrients availability within the euphotic layer [72]. This increment of the errors at the DCM depths is reduced when observing the MBE% profile (not shown), where, being relative, the errors are impacted not only by the DCM variability but also by higher chlorophyll concentrations. On the contrary, the errors noticeably decrease close to zero (RMSE = 0.1 mgm−3) towards deeper layers, reflecting the lower chlorophyll variability and concentrations far from the surface [3].
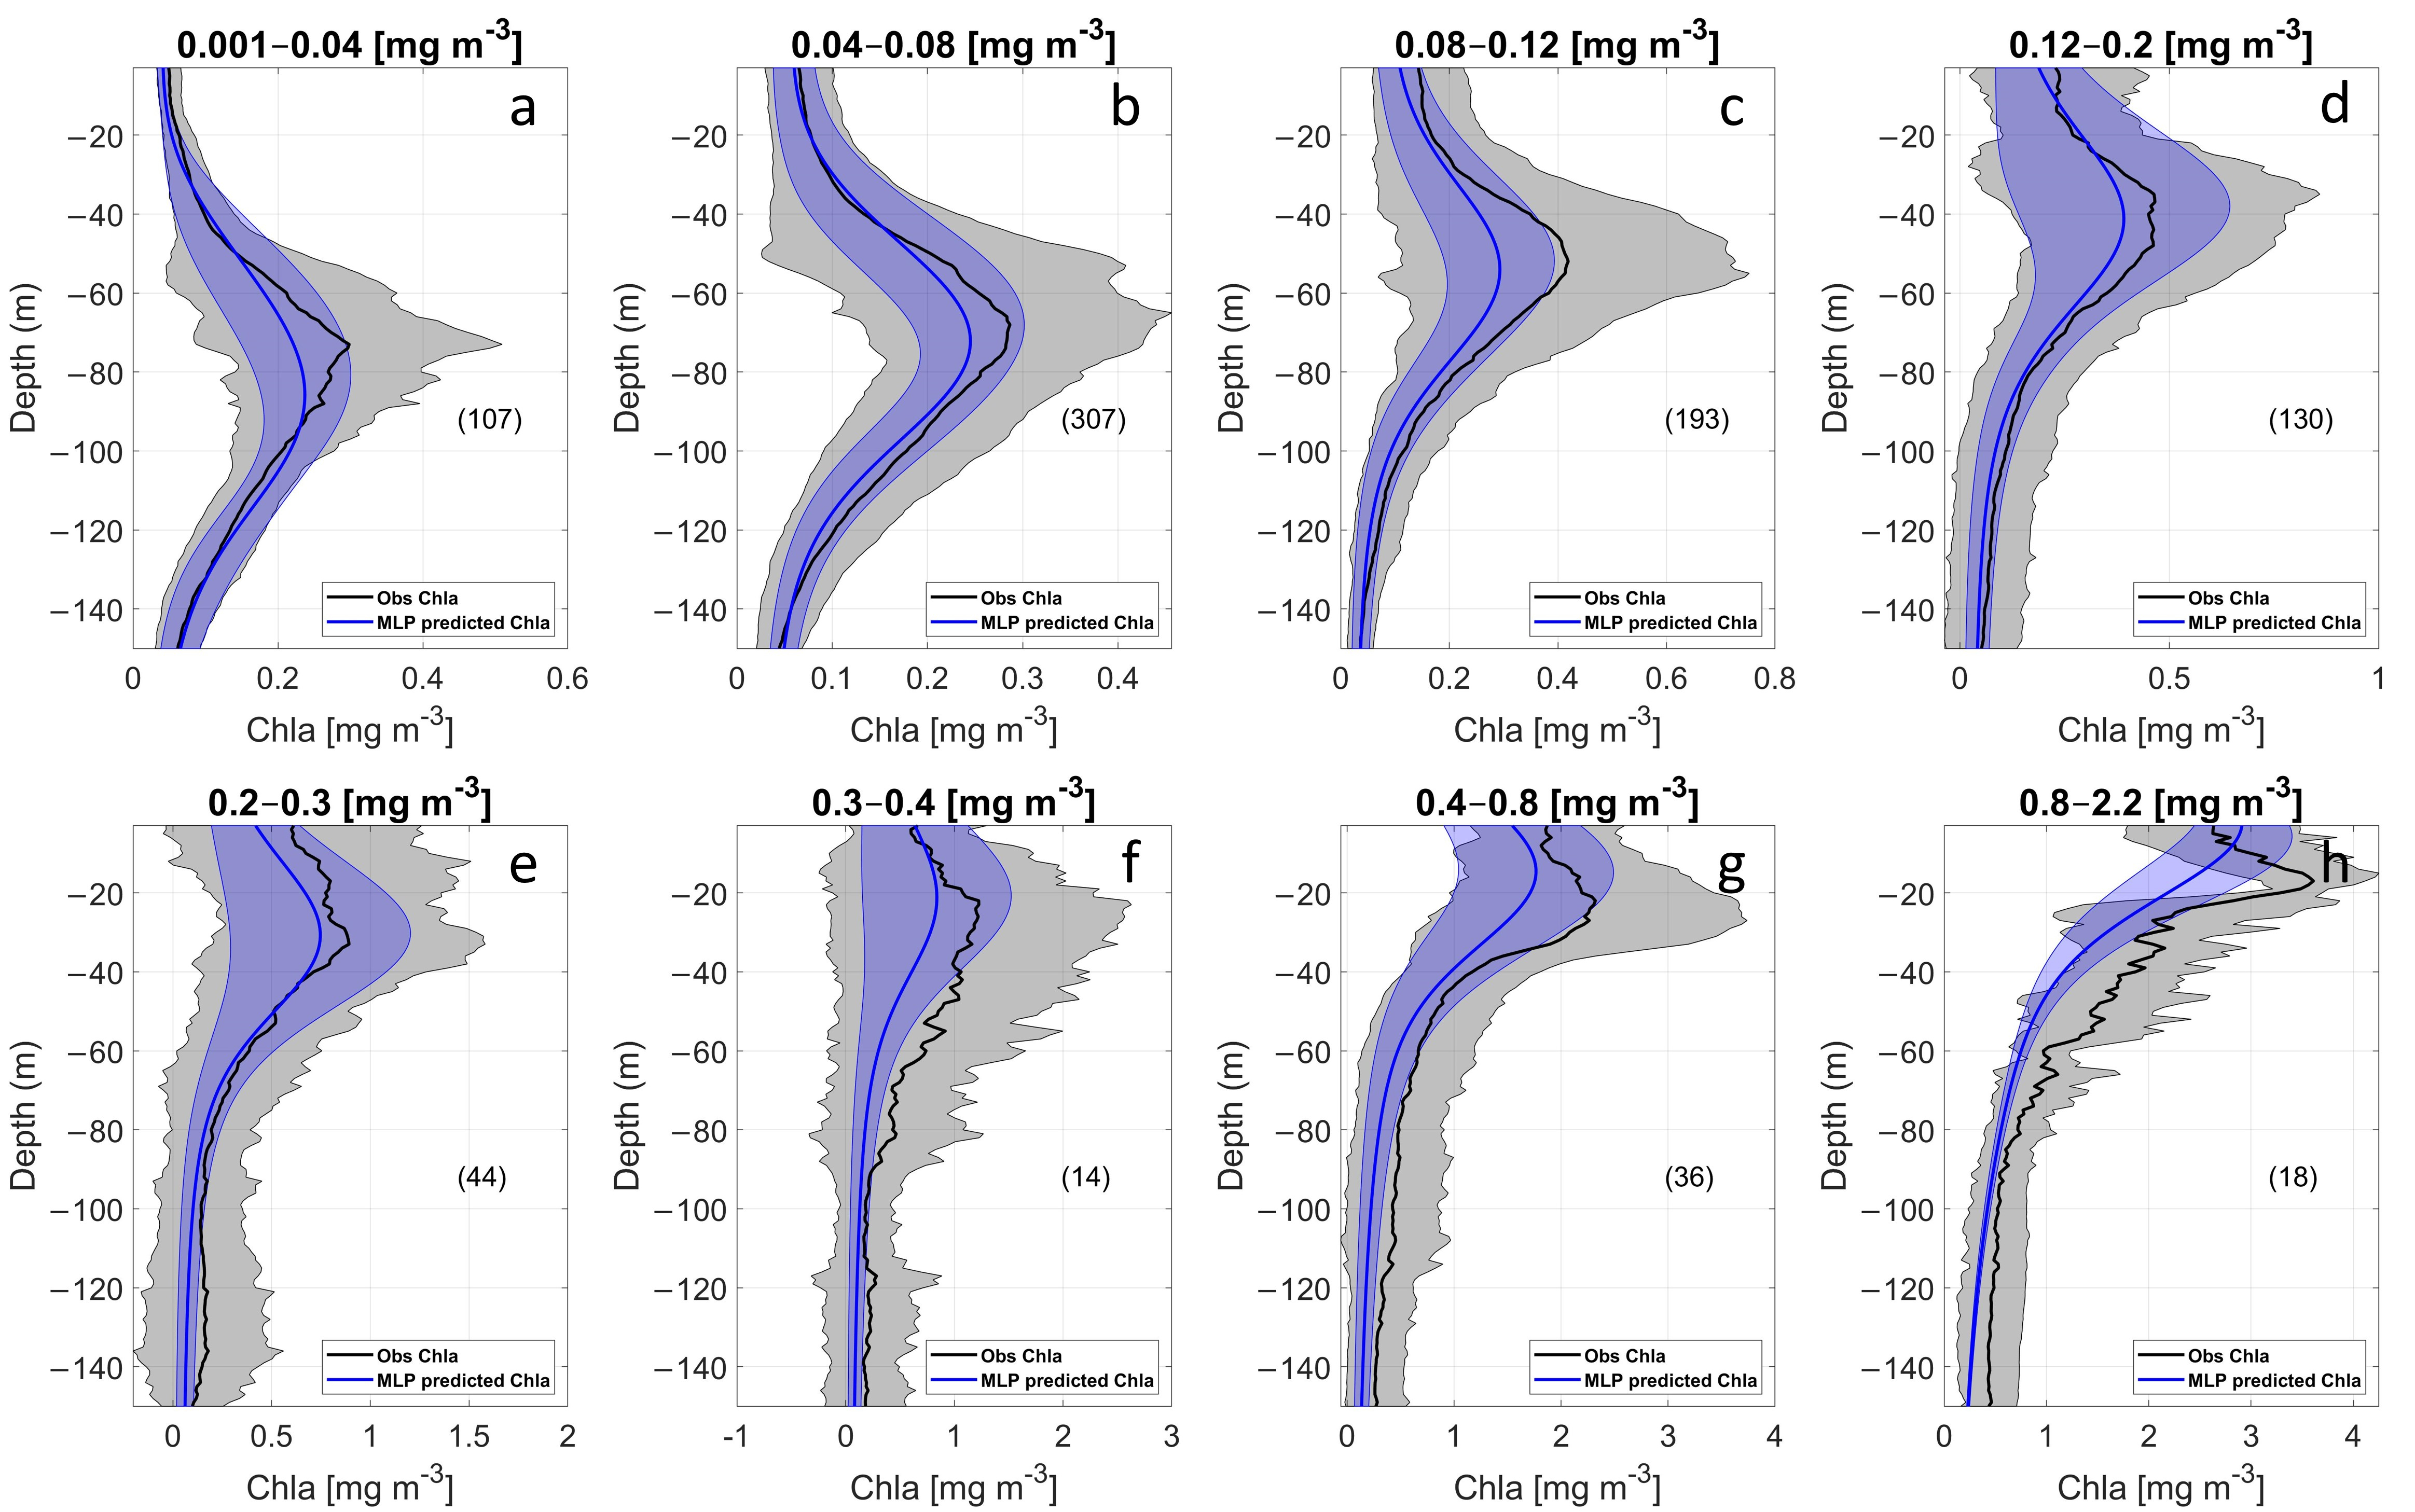
In order to summarize the capability to predict subsurface chlorophyll shape from surface data, all in situ and their corresponding MLP profiles were grouped according to different satellite surface biomass ranges (following [28,43]) and then compared. As done in [48], all the profiles falling within a specific surface biomass class were averaged, and the mean profile and standard deviation of observations (black line and shaded grey area in Figure 5) were compared with those of simulated data (blue line and blue shaded area in Figure 5).
There is a notable agreement between modelled profiles and observations, remarkably evident for some specific surface categories, as e.g., in low ranges of 0.001–0.04 mgm−3 and 0.04–0.08 mgm−3 (Figure 5a,b) and other classes of higher surface concentrations as in 0.12–0.2 mgm−3 and 0.2–0.3 mgm−3 (Figure 5d,e). The predicted profiles with their standard deviations are overlapped on real data in most of the cases, especially at shallower and deeper depths than those of the DCM.
The MLP performance is reduced for highest surface concentrations where the predicted profile appears smoother than the observed one (Figure 5h). However, the MLP forecast correctly recognizes the biomass peak position along the water-column for all classes, though its magnitude can, in some cases, be underestimated.

3.1.2. Temperature Assessment

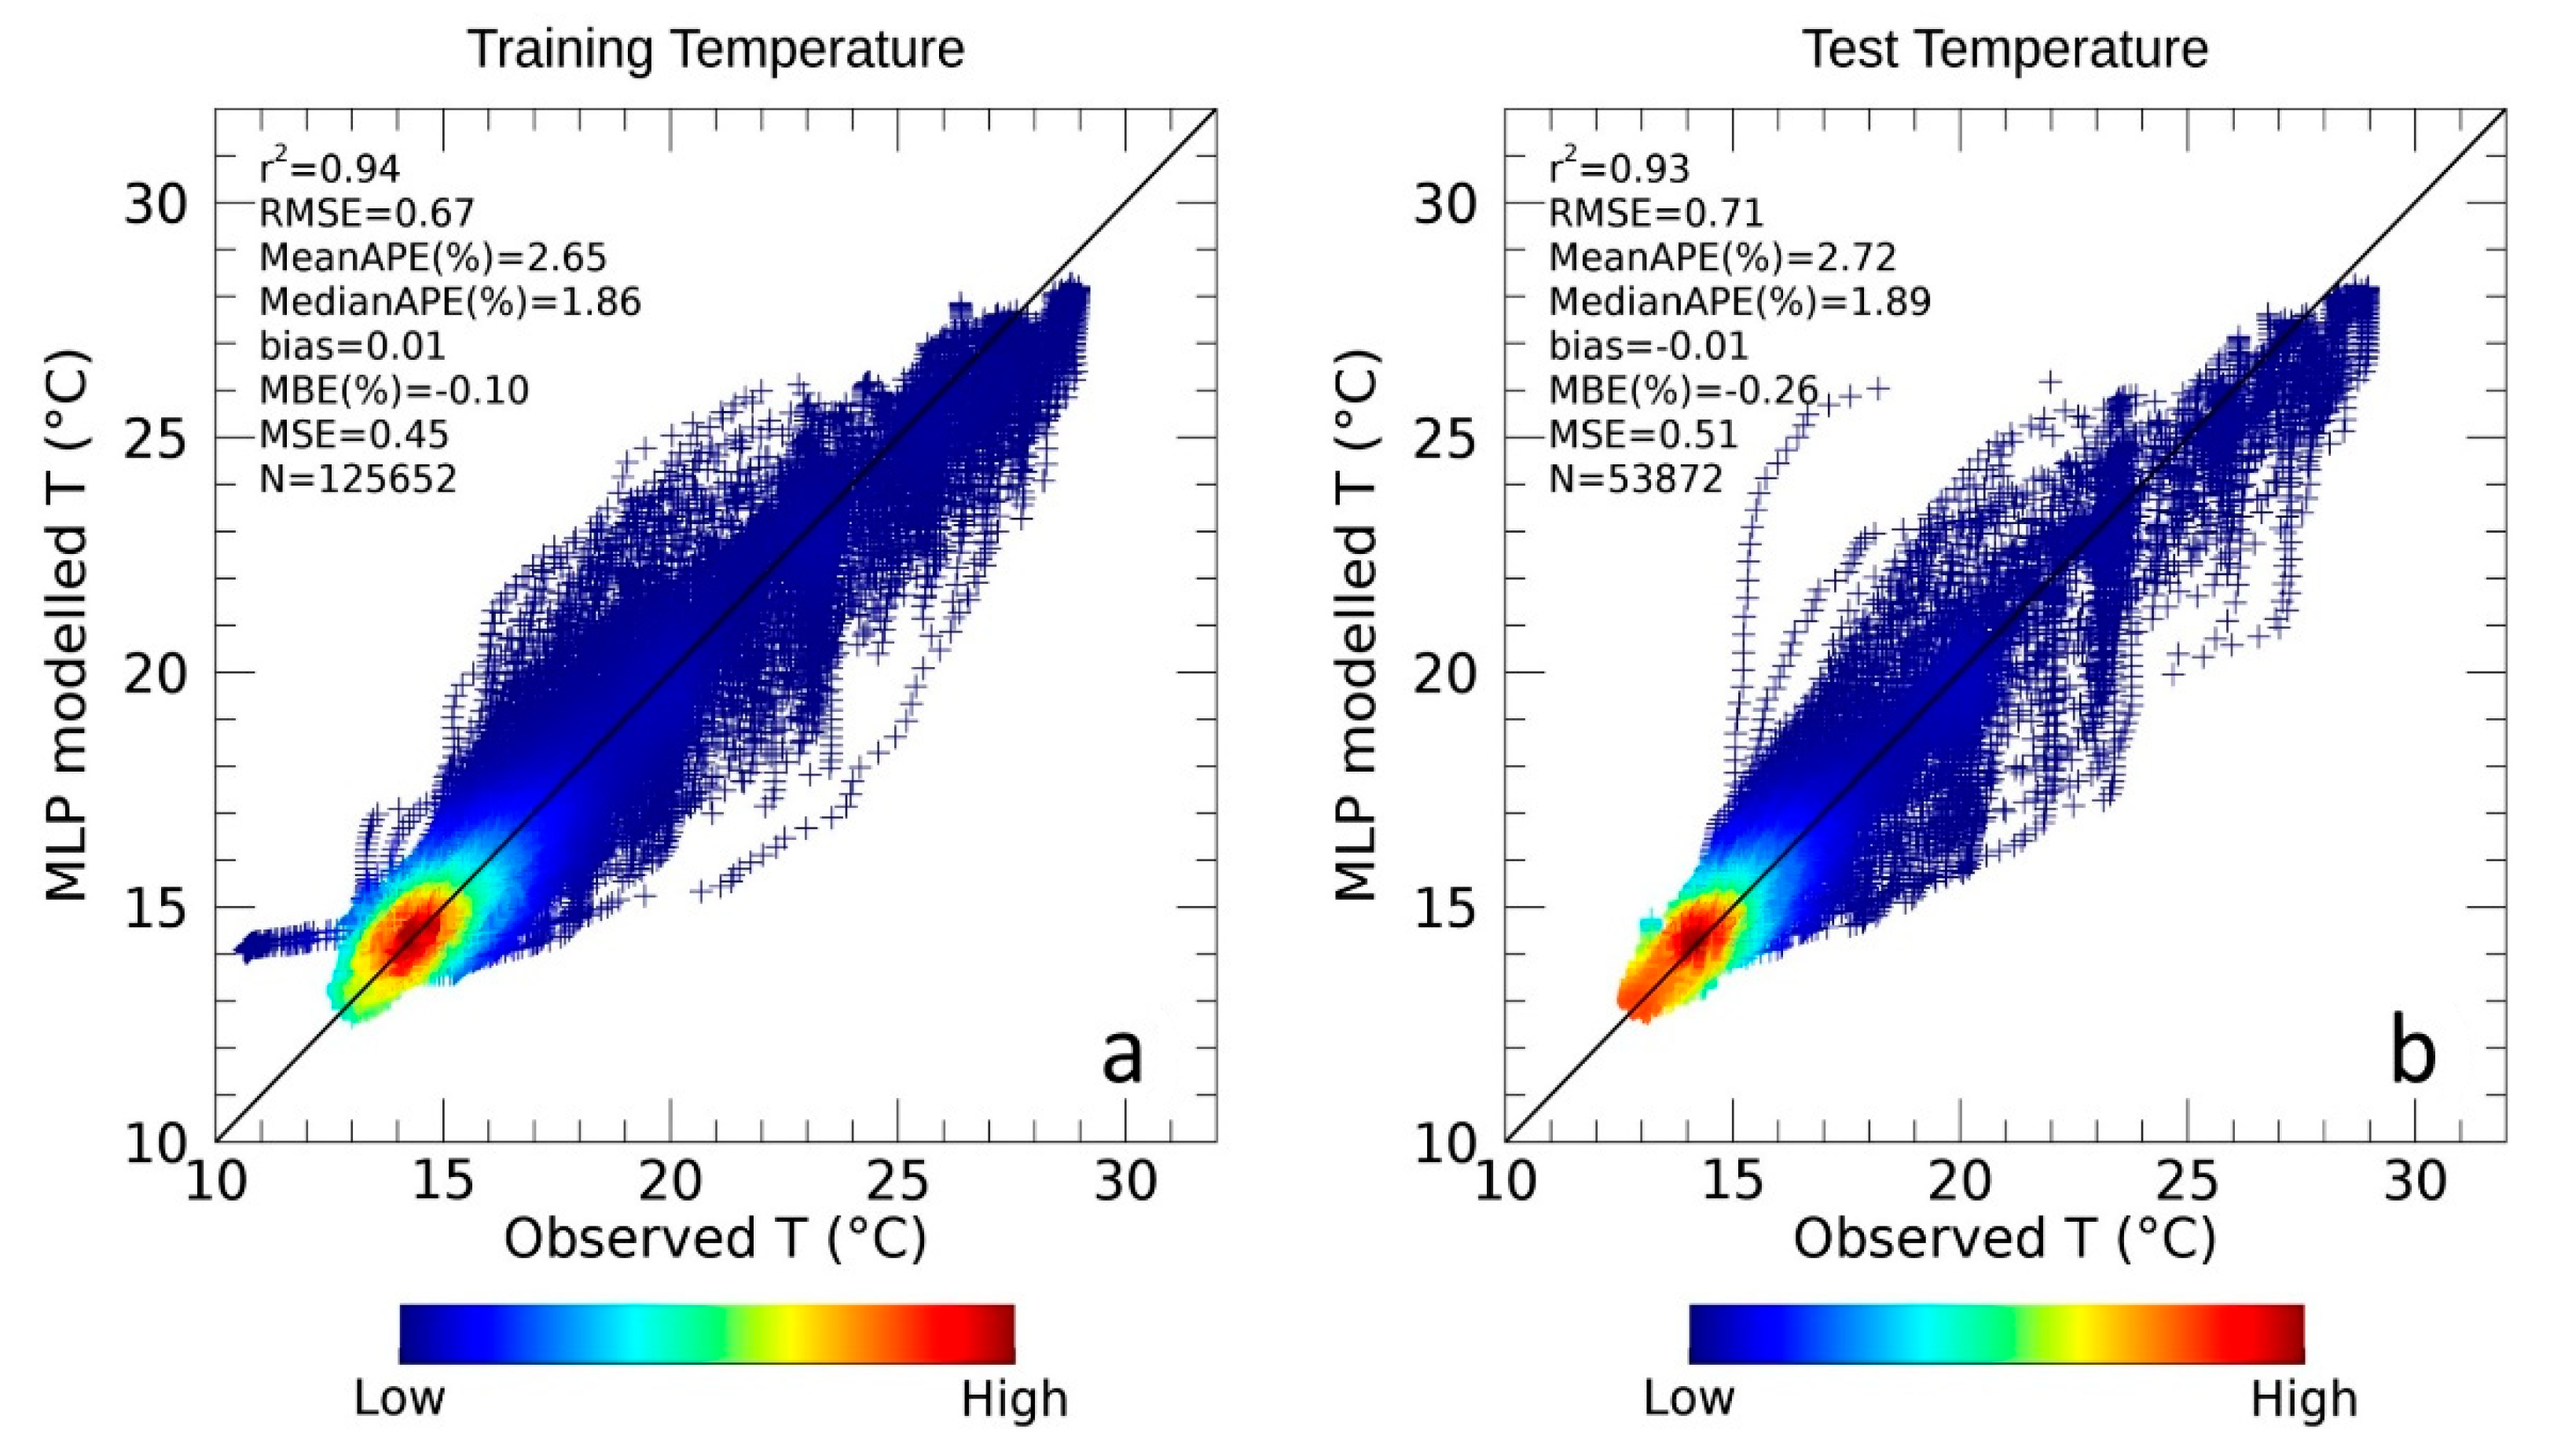
Figure 6 shows the density scatter plots and statistics of the comparison between the observed and predicted temperature values on training and test dataset.
As for chlorophyll, the MLP performances on temperature are promising. The MLP displays an MBE of 0.01 °C for training and −0.01 °C for the test and the MedianAPE = 1.9%, which, being less sensitive to the outliers, results lower than the MeanAPE = 2.7%.
Both determination coefficients are high (training, r2 = 0.94; test, r2 = 0.93), while the RMSE of 0.67 °C for training and of 0.71 °C for the test, partly suffers from the scatter observable in Figure 6. The data cloud fit closely the 1:1 line for the entire temperature ranges, with an increase of the scatter for intermediate temperature intervals (Figure 6, 20–26 °C). Also, for temperature, the training and test errors are comparable, once more suggesting that the network is not overfitting.
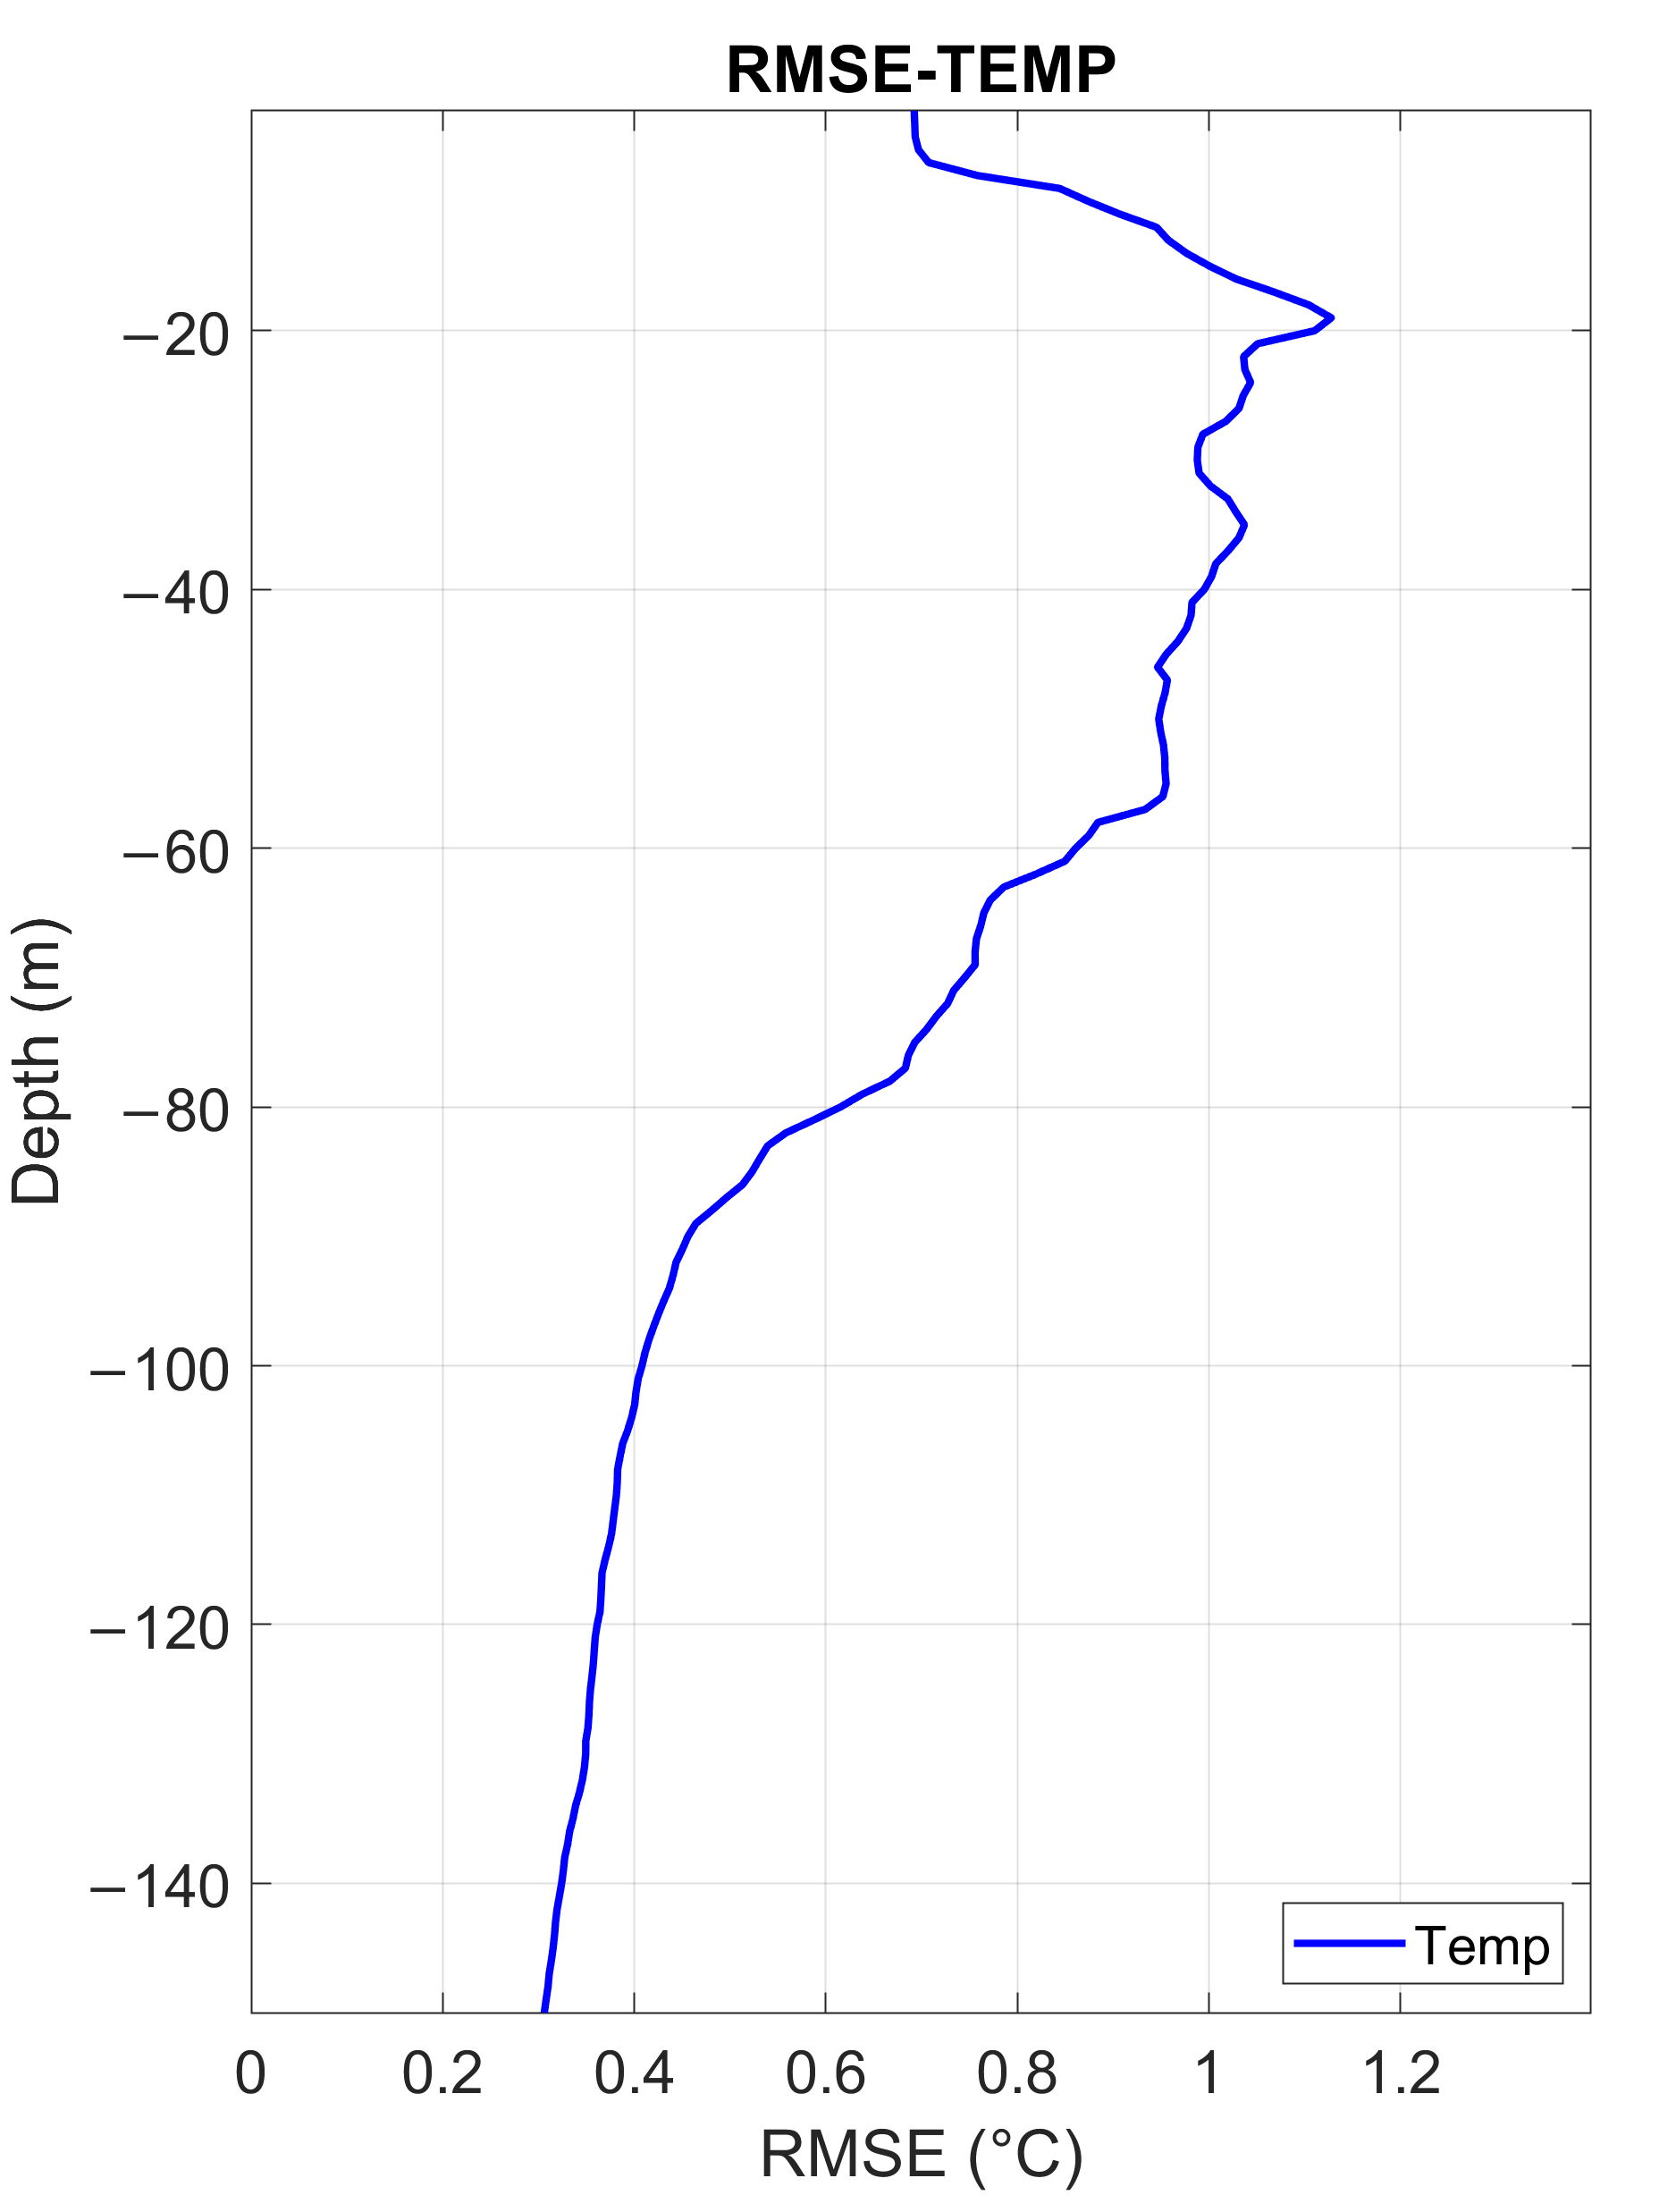
Figure 7 provides the RMSE profile computed on the test set at different depths. At surface, the RMSE is 0.7 °C. The error peaks are observed at ~ 19–20 m attaining values of RMSE = 1.13 °C. Then, the error decreases, quite constantly, down to 80 m, reaching very low values (RMSE = 0.3 °C) at bottom layers (about 150 m). The curve shows the maximum variability between 20 m and 80 m, where usually the mixed-layer depth (MLD) has significant variations, clearly impacting also the DCM position.
Comparing the statistical results obtained from the MLP temperature validation with those shown in other works is not trivial, as most of them refer to global reconstructions or different specific regional oceans (e.g., North Atlantic, Southern Ocean), only few of which are focused on the Mediterranean basin, and also in those cases limited to specific sub-basins and fixed locations (e.g., [20,21]). Overall, most reconstructions show a RMSE close to our (0.7 °C) with values spanning in the range between 0.45 and 1.2 °C [35,73,74,75]. Along the vertical, our MLP errors show similar shape and values of the same order of magnitude of those obtained for different seasons in [75].
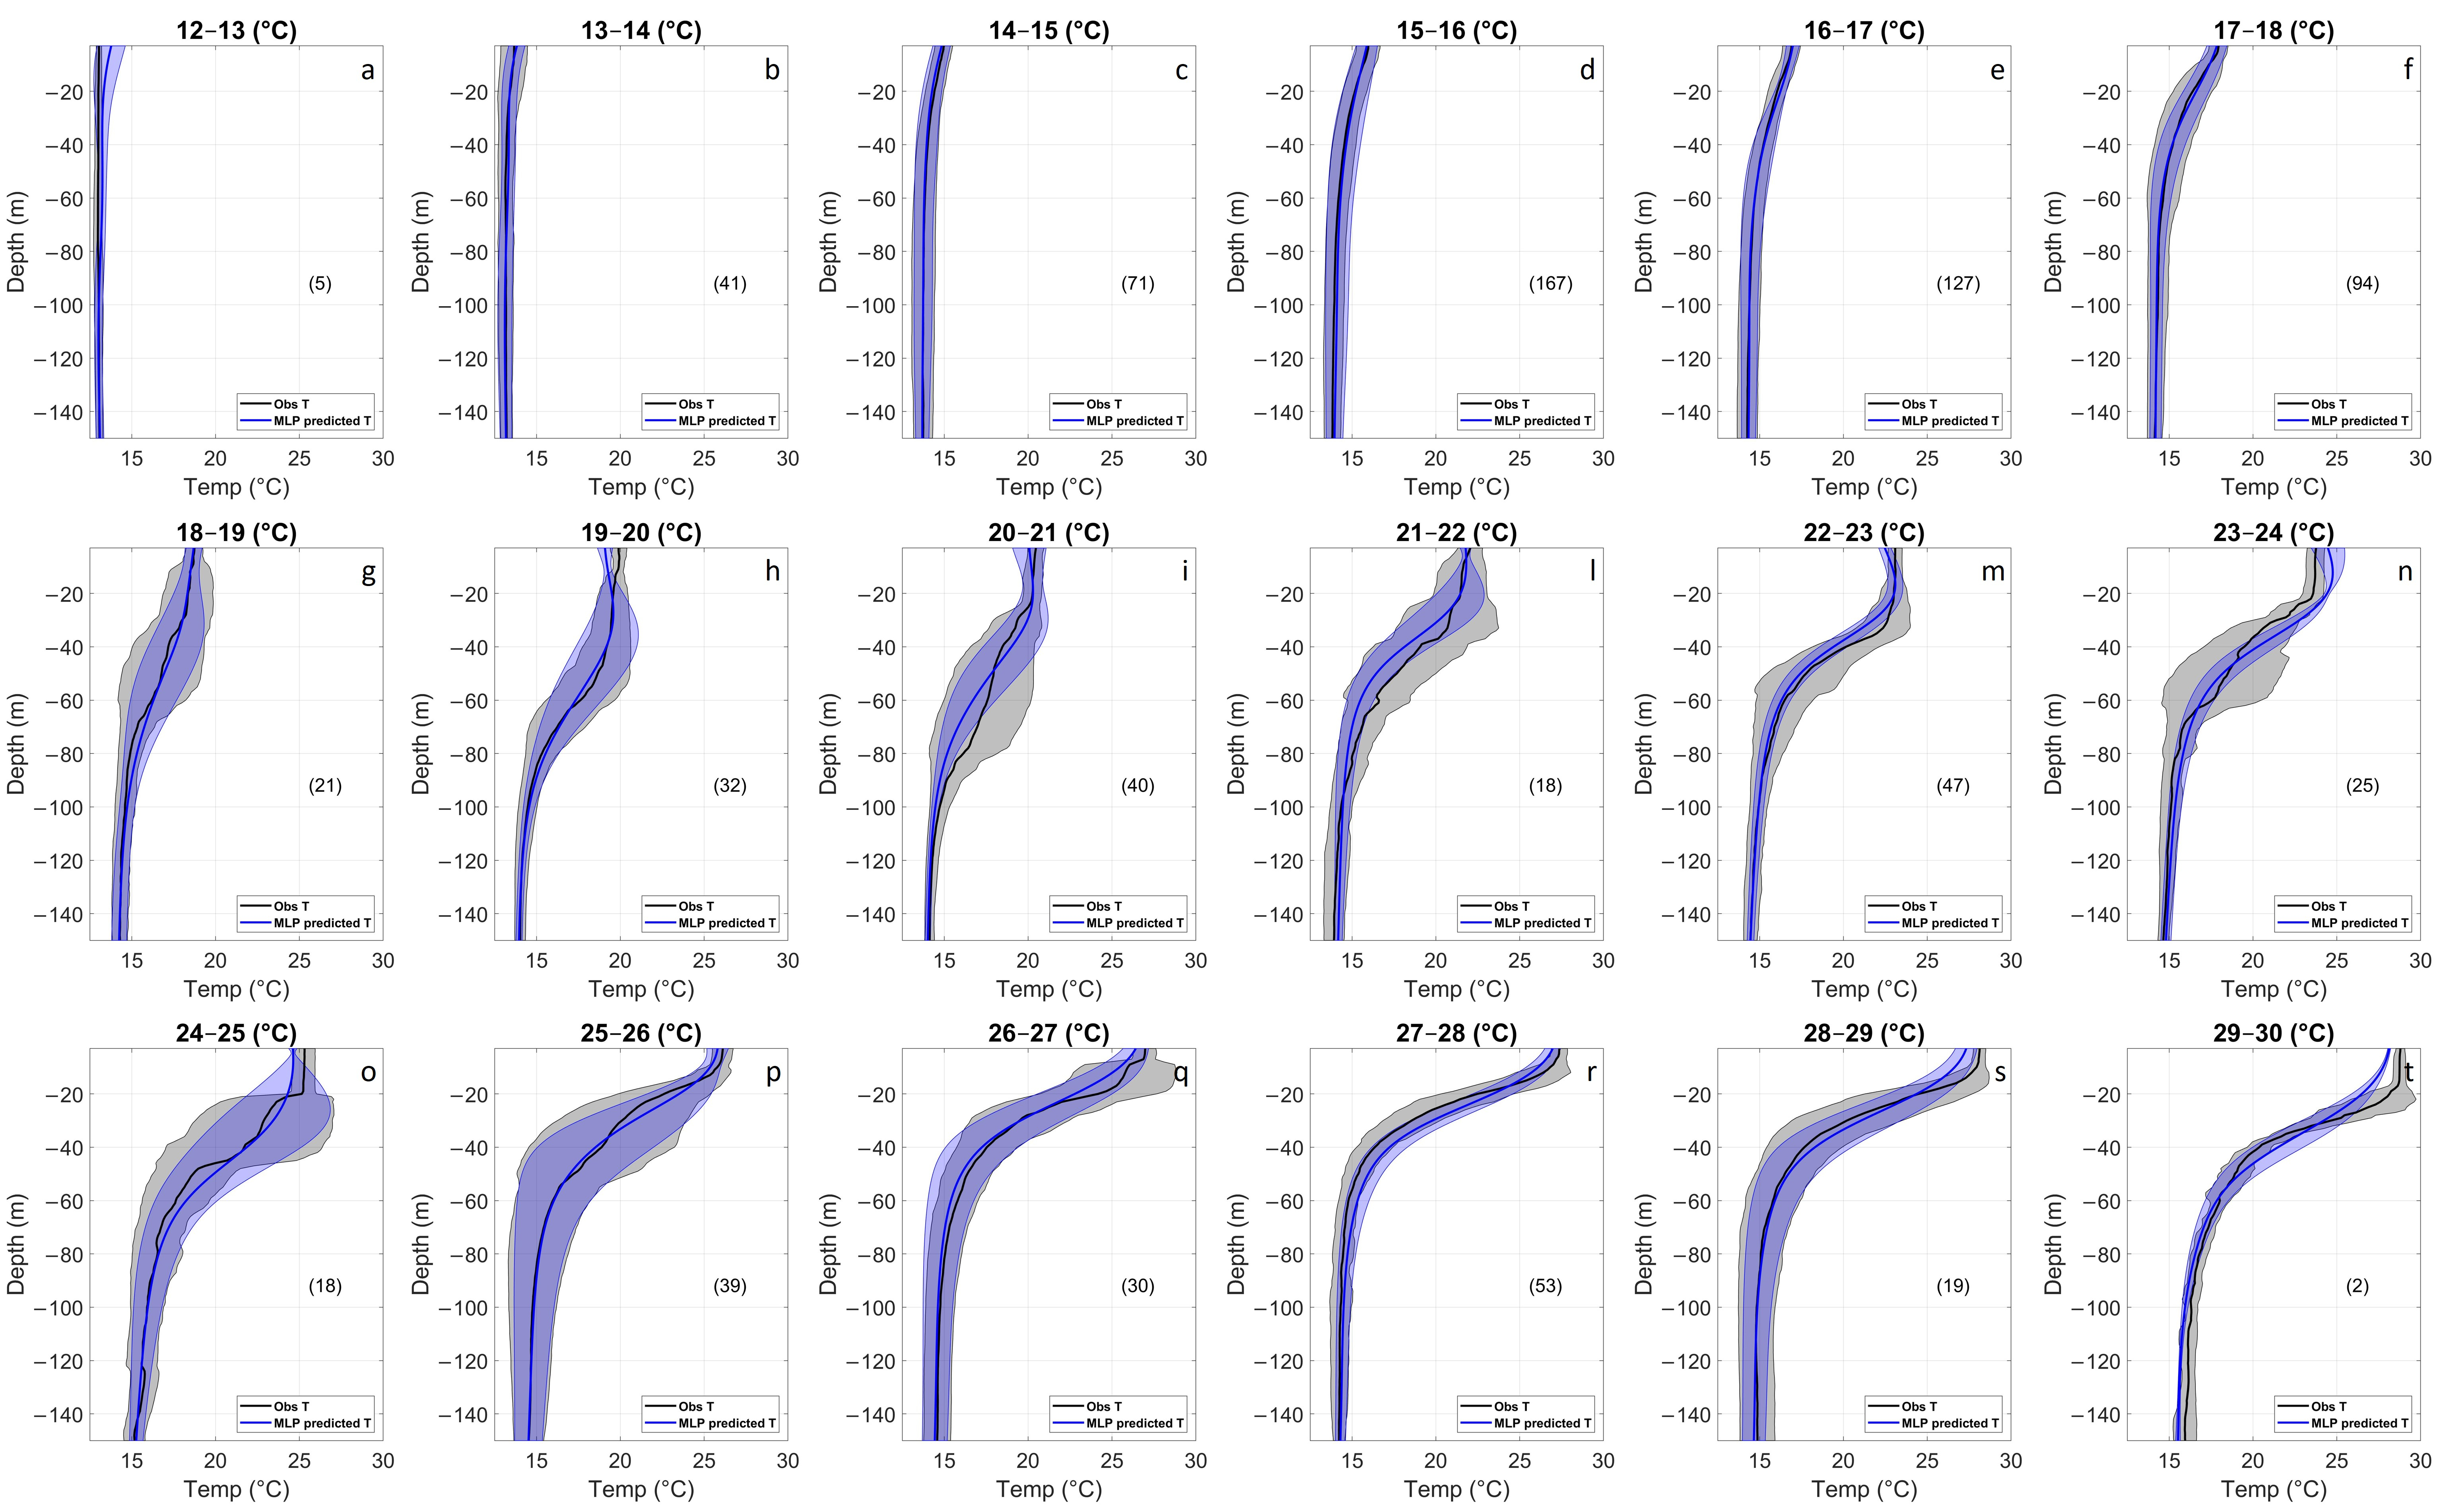
As for chlorophyll, in situ and simulated profiles were divided in different classes and averaged to compare the mean profile shape of observations (black line in Figure 8) with those predicted by the network (blue line Figure 8). The classification was based on an incremental step of 1 °C, resulting in 18 different surface categories.
The comparison of MLP outputs with observations is very good in almost all surface temperature ranges. The best MLP performance is observed in cases of low temperatures (e.g., from 12 °C to 18 °C, Figure 8a–f), usually associated with a homogenous and mixed water column. An overlap of the two profiles is observed for all classes down 100 m depth, where the field becomes more stable. There is a slight discrepancy in the first meters of the class 12–13 °C (Figure 8a) which is probably due to the number of profiles available in the training set for this type of surface temperature interval. The same divergence is observed for higher temperature classes (23–25 °C and 28–30 °C, Figure 8n,o,s,t) as a result of two possible causes: the wide variability of the field in these temperature ranges, also suggested by the large standard deviation (represented by the shaded area in Figure 8o,p,t), and the relatively low number of observations available in that range. For higher surface temperatures, for which the presence of a thermocline is more evident, the MLP is able to recognize the depth level where the temperature discontinuity occurs. The magnitude of the thermocline is accurately predicted for most of the classes, with the exception of those referred to 23–25 °C (Figure 8n,o) in correspondence of higher standard deviation. As expected, profiles with a more evident thermocline correspond to higher surface temperatures (28–30 °C, Figure 8q–t), crossing a wide temperature range from 26 to 27 °C in surface to 14–15 °C at 150 m with an inflection point, usually, at about 20 m of depth. For most of the classes the predicted surface value and the observed one are very close, with some exceptions for classes that are less represented in our dataset, such as, e.g., 29–30 °C (Figure 8t).

3.1.3. Sensitivity Analysis of Inputs in the MLP Performance

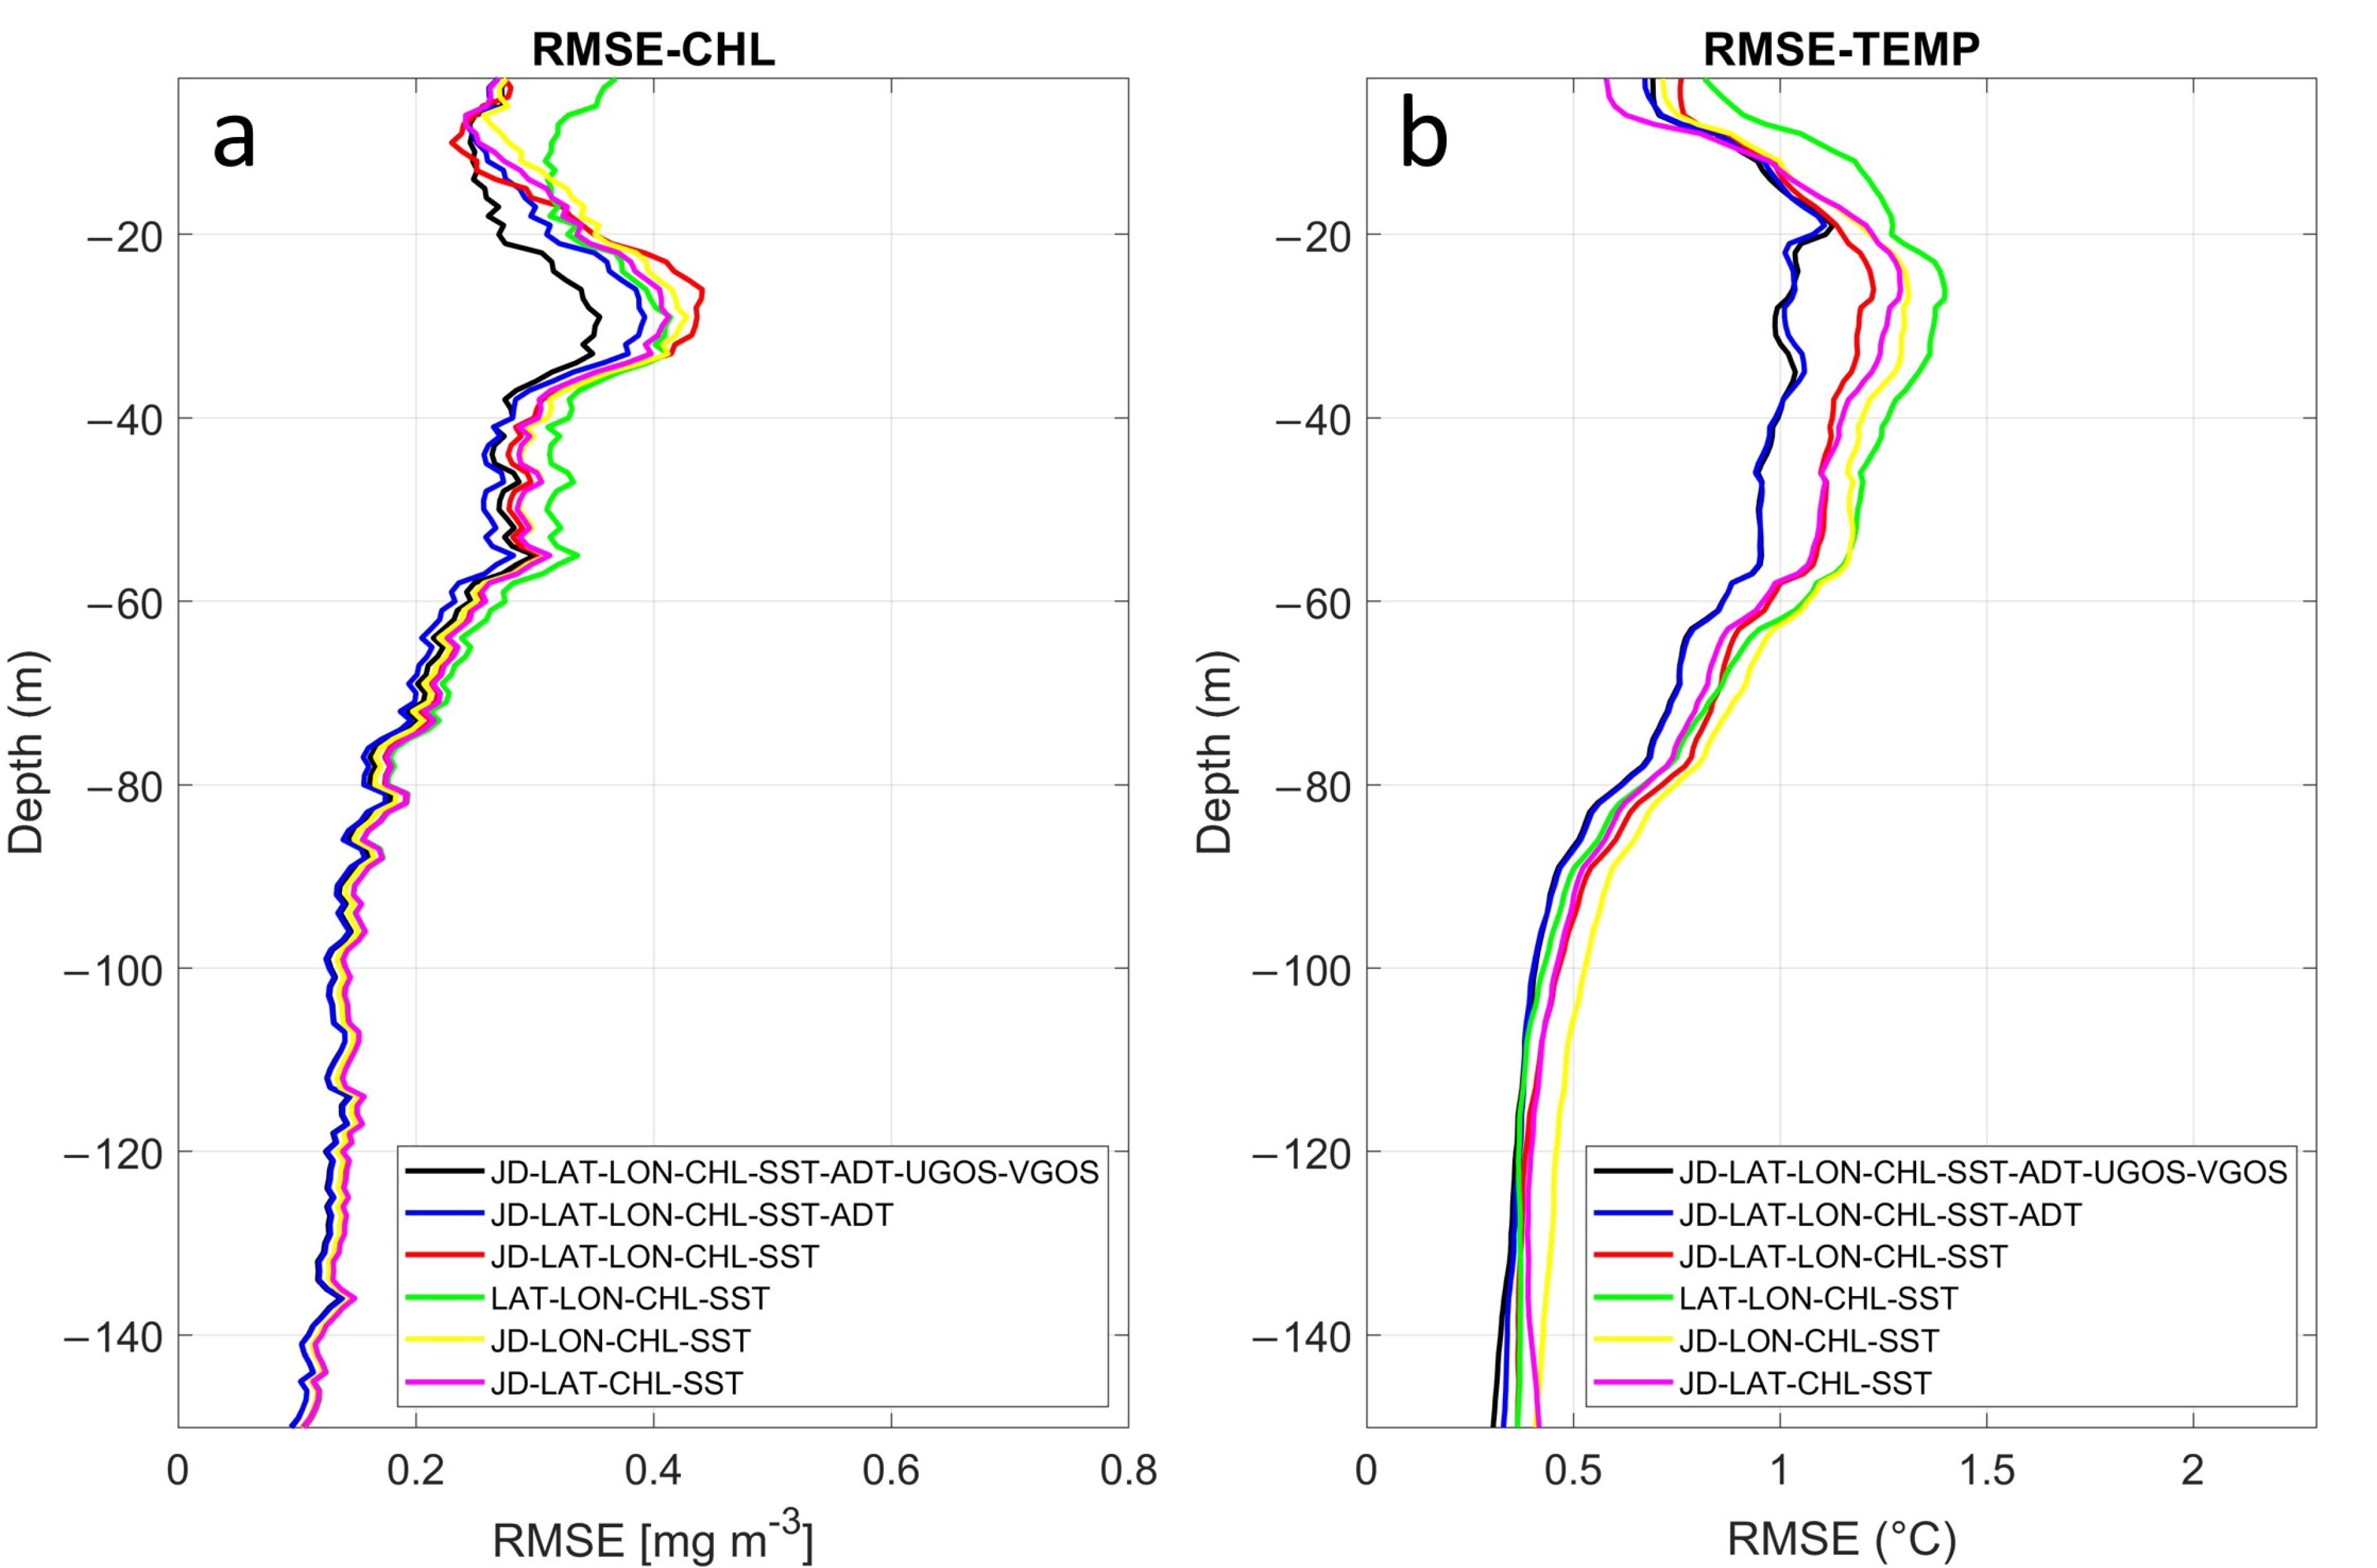
In order to evaluate the impact of each MLP predictor and define the optimal network architecture, several tests were carried out on different combinations of input surface data (see Table 2).
Figure 9 shows the chlorophyll and temperature RMSE profiles with different colors identifying each input combination. For both variables, the curve with lowest RMSE is that corresponding to the configuration of the network, which uses all co-predictors. It is followed by the blue line where the two components (U & V) of geostrophic currents are neglected. However, a slight divergence of dark and blue line is observable in the case of the chlorophyll predictions (Figure 9a), which is not so evident in the temperature retrieval (Figure 9b), suggesting a higher sensitivity of the vertical biomass structure to the geostrophic currents. For both variables, the addition of the ADT determines a strong impact and reduction of the errors, with a RMSE that decreases from 0.44 mgm−3 to 0.35 mgm−3 and 1.4 °C to 1.13 °C for chlorophyll and temperature, respectively (see red line in Figure 9a,b). The second most influencing variable is the day of the year (green line, in Figure 9a,b), which better captures the signals characterized by a clear annual periodicity [65]. As expected, its impact is evident for the temperature and less for chlorophyll. In fact, Mediterranean Sea surface temperature variability is dominated by a marked annual cycle (e.g., [56]). This signal, though in conjunction with other physical forcing, clearly modulates the vertical stratification and mixing of the water column, directly impacting also the interior temperature structure. Finally, latitude and longitude inputs seem to have the same impact on both predicted variables, with some exceptions for latitude exclusion in temperature modelling that determines a higher RMSE either at surface and bottom layers (yellow line, Figure 9b). As expected, the model sensitivity to the use of different inputs is high from surface to 60 m for both variables and then decreases for chlorophyll, as represented by the closeness of the colored curves in Figure 9a. This is linked to the nature of the two predicted variables: the chlorophyll usually shows larger variations in the first 60 m of the water column, all over the basin, accounting for the limited light-penetration depth and nutrient availability; while, it decreases in concentrations and variability toward the bottom [3,48]. On contrary, the temperature can be strongly variable down to the bottom, reflecting many other physical processes beyond large scale surface heat exchanges, that clearly affect the different areas of the basin (e.g., main currents’ instabilities, (sub)mesoscale features, deep water formation events [76]).

4. Comparison with MEDATLAS Climatology

In this section, an assessment of the MLP performance is carried out comparing predicted 3D fields to the MEDATLAS seasonal and monthly climatologies [77,78]. As a reference database of Mediterranean and Black Sea regions, the MEDATLAS climatology is widely used for the approximation and definition of the vertical profiles of several bio-physical ocean variables at monthly mean and seasonal scales. This database originated from the cooperation of Mediterranean bordering countries within the context of the MEDAR/MEDATLAS-II project, and it is based on the collection and aggregation of multi-disciplinary, in situ hydrographic and bio-chemical measurements ([77], http://modb.oce.ulg.ac.be/backup/medar/contribution.html).
Differing from [48], where an annual climatology was used as reference for the assessment of the vertical chlorophyll estimation, here, seasonal and monthly means were used for the MLP chlorophyll and temperature comparison, respectively. The assessment was carried out on the test set.
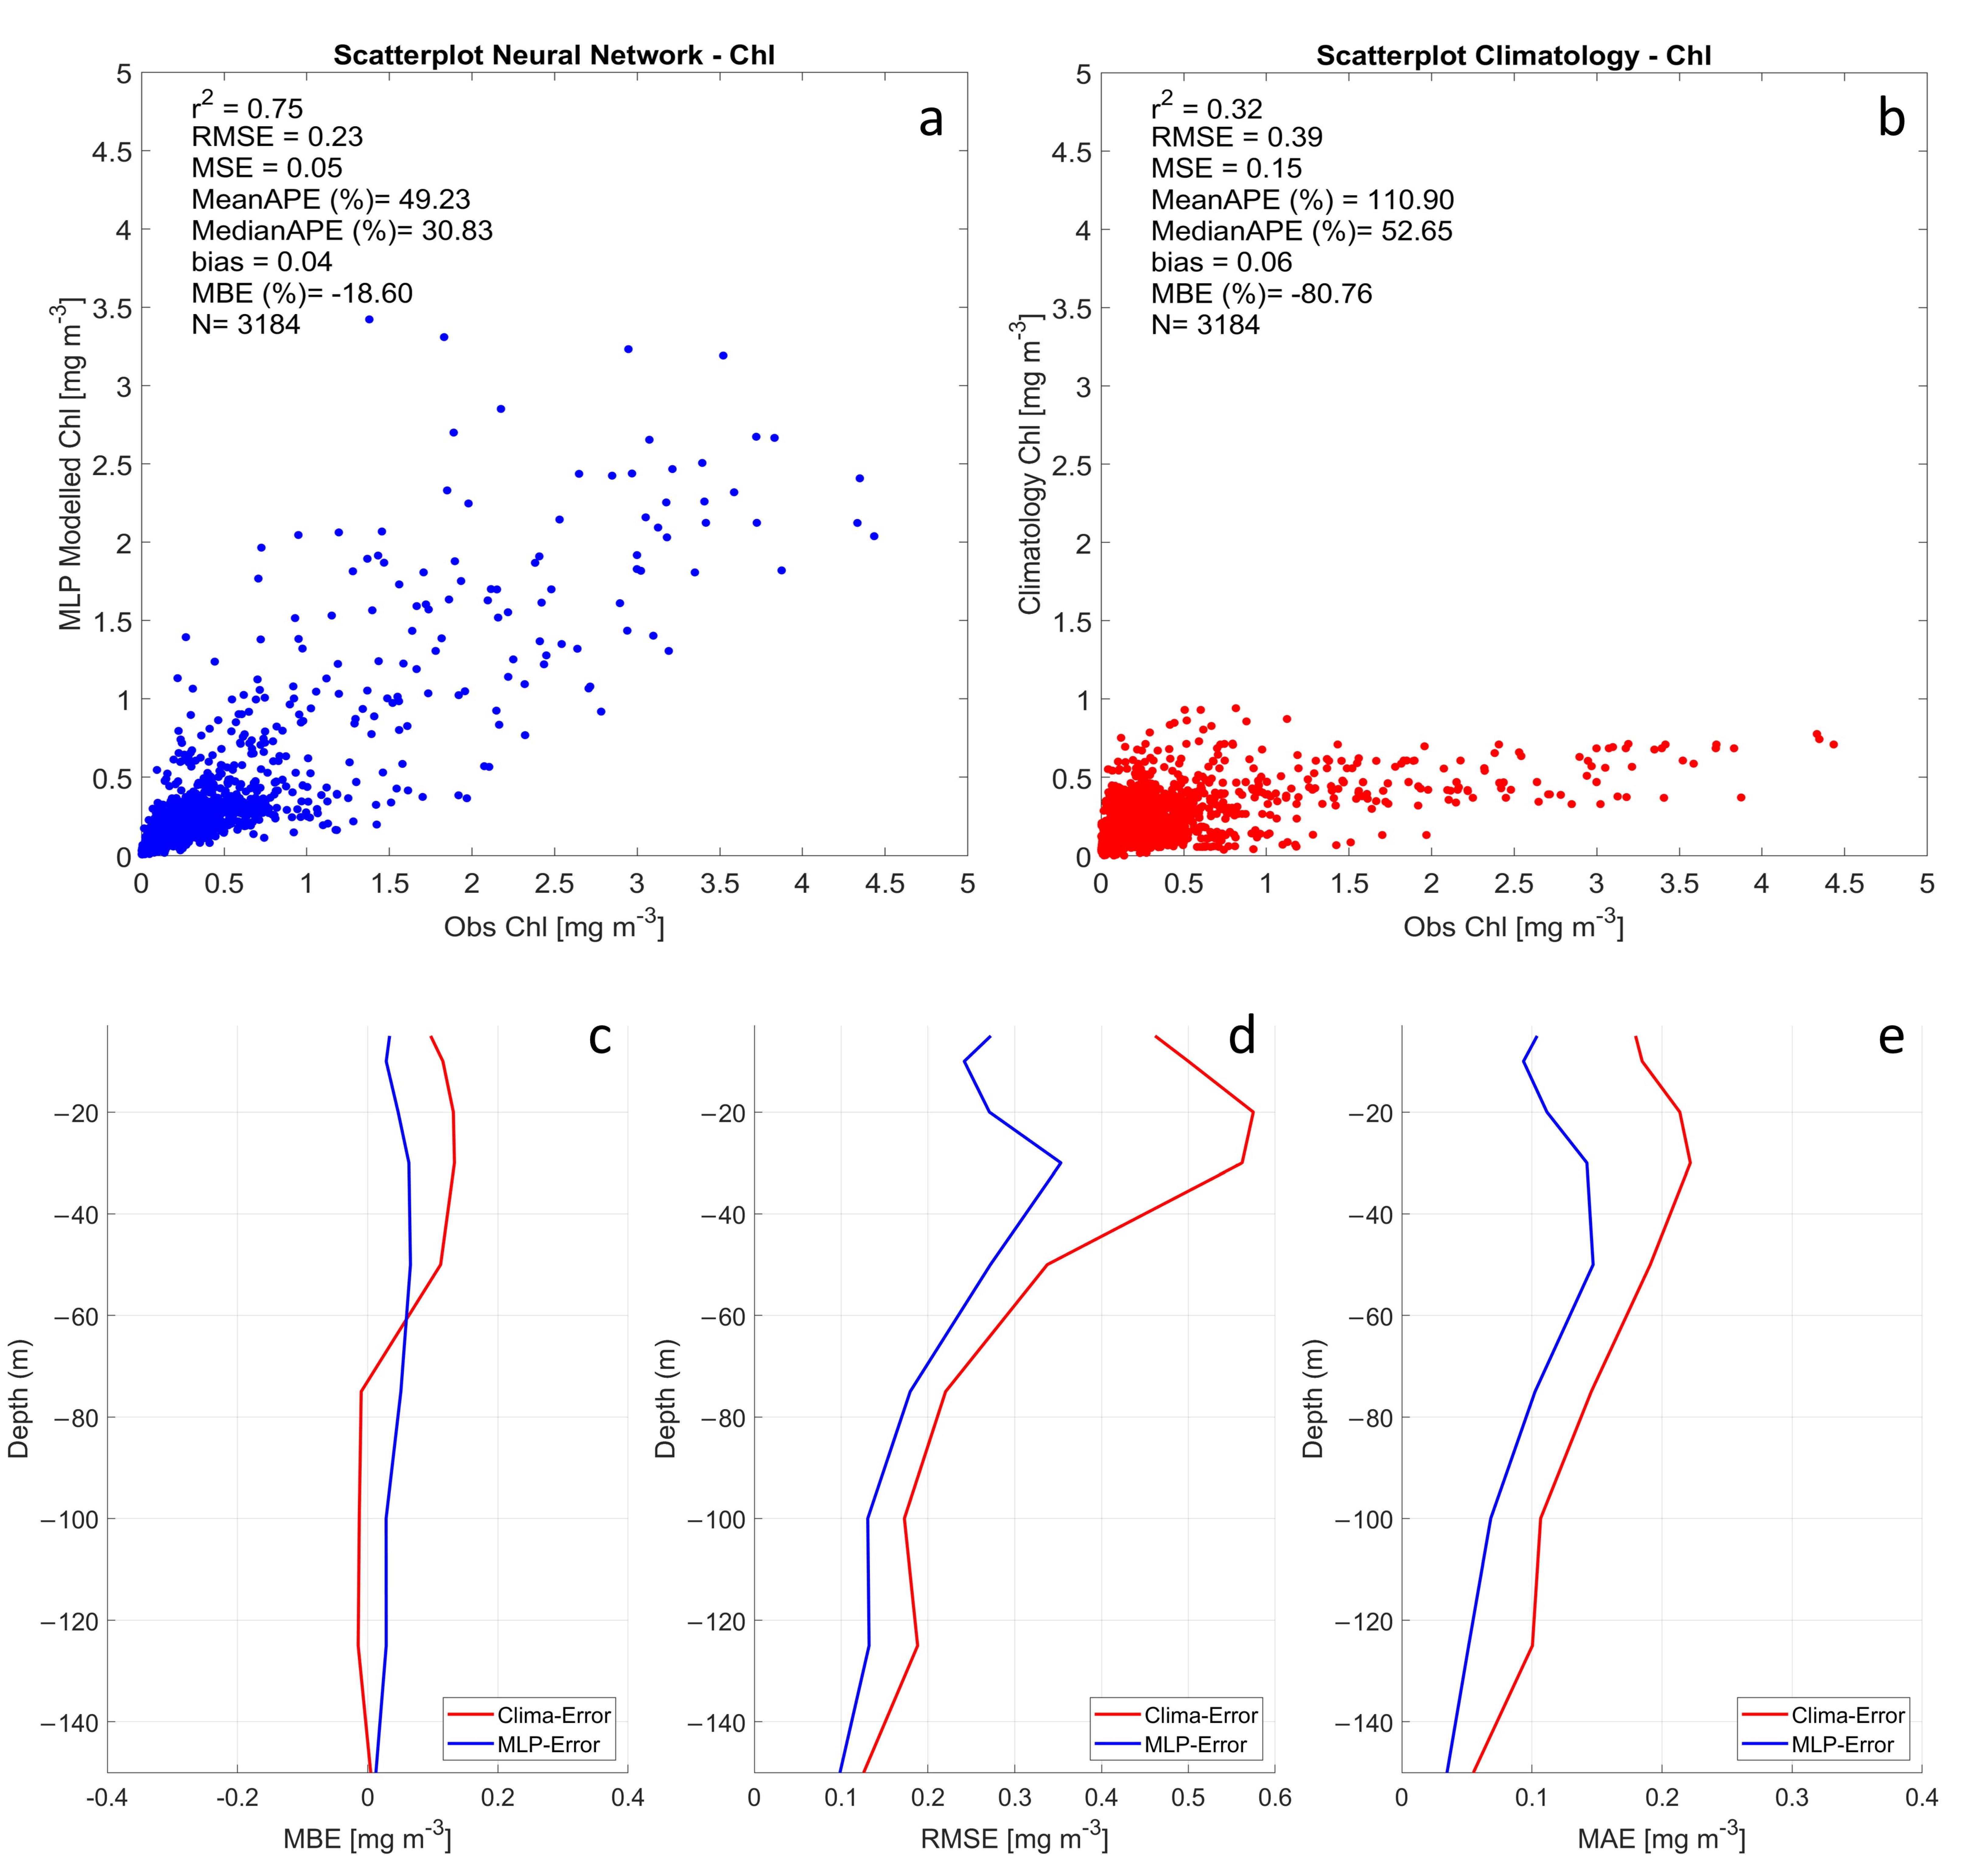
The results of chlorophyll comparison are given in Figure 10. The determination coefficient is r2 = 0.75 for MLP and r2 = 0.32 for climatology, while the RMSE is 0.23 mgm−3 and 0.39 mgm−3, respectively. The higher accuracy against observed values of the MLP than climatology is also noticeable from the scatterplot in Figure 10a,b where the scatter of the data cloud is reduced for the MLP predictions with respect to climatological estimates.
Generally, all the statistical parameters result in a better accordance of the MLP with the observations with respect to the climatology. This is particularly true for the MeanAPE% which registered a value (MeanAPE% = 49%) one order of magnitude lower than that obtained for climatology (MeanAPE% = 111%). Same behavior can be observed also in terms of vertical variation (Figure 10c,d,f,) with some exception over 80 m for the MBE curve, where the climatological error is closer to zero with respect to MLP.
The RMSE curve shows an MLP error (0.35 mgm−3) notably lower than climatology, which may exceed 0.58 mgm−3 (Figure 10d). Similar results are found for the MAE (Figure 10e), whose magnitude and shape are very close to those described in [48]. The other MLP statistics and those obtained in [48] are very similar too, even if a direct comparison is hindered by the random selection of stations in the test set and the use in this work of seasonal and monthly means, instead of an annual climatology. As expected, for both datasets, the higher errors occur between surface and 50–60 m of depth, reflecting the strong chlorophyll variability and the large variation of the DCM magnitude and position in this portion of water-column. For RMSE and MAE (Figure 10d,e), the two lines converge to lower errors at the bottom layer.
The results of MLP temperature and climatology comparison are given in Figure 11. A determination coefficient of r2 = 0.95 and r2 = 0.92 is found for MLP and climatology, respectively. Nevertheless, observing all the other statistical parameters, the climatology clearly shows less accurate results. The RMSE and MeanAPE are 1.13 °C and 4.1% against those of 0.75 °C and 2.8% of the MLP. The MBE displays the most evident difference, which is 0.3 °C for climatology against the −2 × 10⁻⁴ °C for the MLP.
In Figure 11c, the MBE line highlights a significant improvement of the MLP with respect to climatology between 0 and 75 m, attaining surface values of MBE = 0.22 °C for MLP vs. MBE = 1.03 °C for climatology.
For the RMSE (Figure 11d), the climatology shows values over 1.5 °C against the 1.2 °C of the MLP, with maximum errors at the surface (RMSE = 1.6 °C), where the temperature pattern can vary more rapidly. The divergence among the errors of MLP and climatology continues up to 80 m of depth and then decreases towards deeper layers (Figure 11c–e).
The comparison with MEDATLAS demonstrates that the climatology fails to resolve the finer spatial and temporal scales as those retrieved with the MLP. In fact, our MLP matches the real observations with significantly higher accuracy, representing an effective alternative to climatology to overcome the discontinuity and sparseness of the in-situ observations of temperature and chlorophyll.

5. MLP Application on Satellite Data at Basin Scale

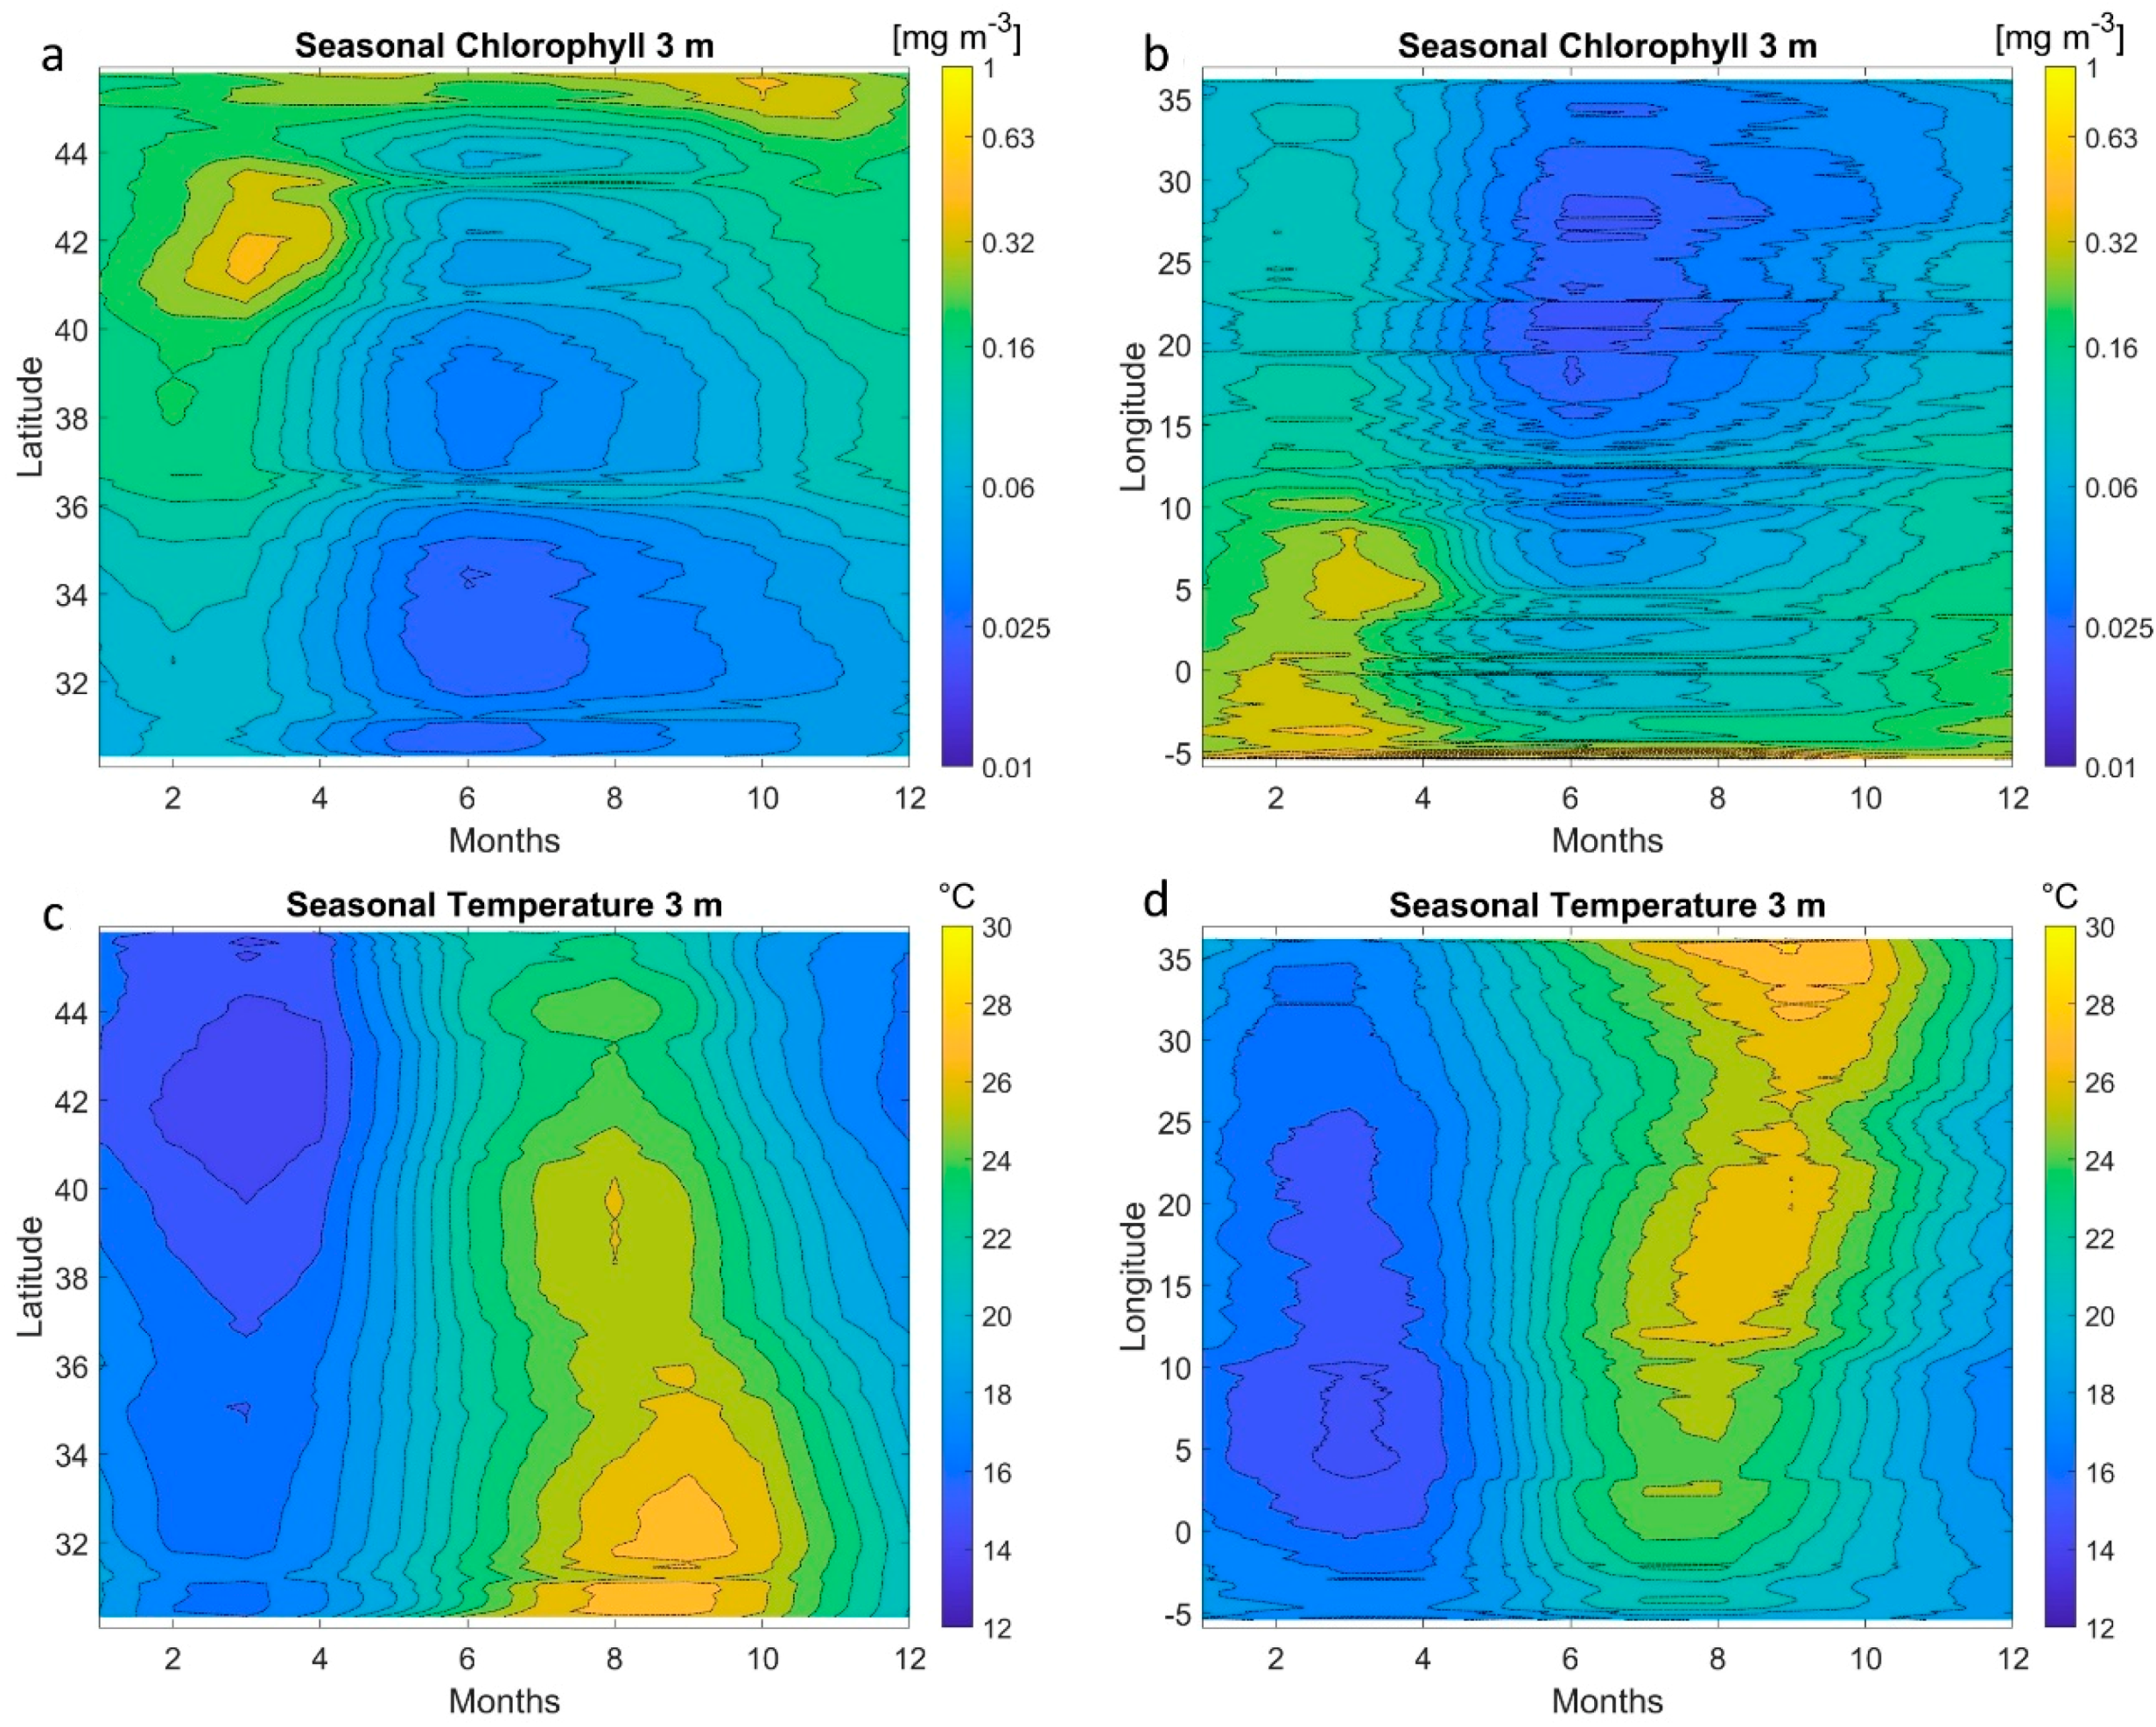
In this section, an example of the MLP reconstruction obtained from a satellite climatology is given. Figure 12 shows the MLP basin prediction of the chlorophyll and temperature fields at 3 m of depth. More in detail, the left side represents the monthly longitudinal mean (Figure 12a,c), while the right side shows the corresponding monthly latitudinal mean (Figure 12b,d).
The analysis of the images highlights a good consistency of the surface MLP prediction with the well-known pattern of both variables in the Mediterranean Sea. From a latitudinal point of view (Figure 12a), maxima chlorophyll values are observed at high latitudes (40–44°N) in March and April, when usually large phytoplankton blooms occur and become visible from space [3,64]. This chlorophyll pattern is consistent with that of temperature, which, according to the winter deepening of the mixed layer depth [76], shows the lowest values at the same higher latitudes (40–44°N, Figure 12c). As a mirror, the temperature pattern shows a gradual increase from April to November, along all latitudes (Figure 12c). In fact, according to the warming of surface layers towards the Eastern basin, maxima values are observed from August to September at low latitude (30–36°N, Figure 12c) and high longitudes (30–35°E, Figure 12d) [56,79]. At surface and latitude over than 44.5°N (Figure 12a), the chlorophyll concentrations remain high for all the year, maybe reflecting the influence in the longitudinal average of the more productive coastal waters, as e.g., North Adriatic Sea, that usually shows intraseasonal high biomass levels, observable also from satellite [80]. At Alboràn Sea and Algerian Basin longitudes (from −6°E to 10°E, Figure 12b), the chlorophyll shows high values in winter-early April (from January until April), a decrease in summer (from June to September) and again a slight increase in autumn. This behavior is in accordance with other works [3,81] and is strictly related to the particular dynamic of this area. Nevertheless, the high chlorophyll values registered in summer at very low longitudes (lower than −5°E, Figure 12b) suggest a bias in the MLP prediction in this basin, maybe due to the absence of in situ data useful for the training and the complex hydrodynamics that occur in the Alboràn Sea.
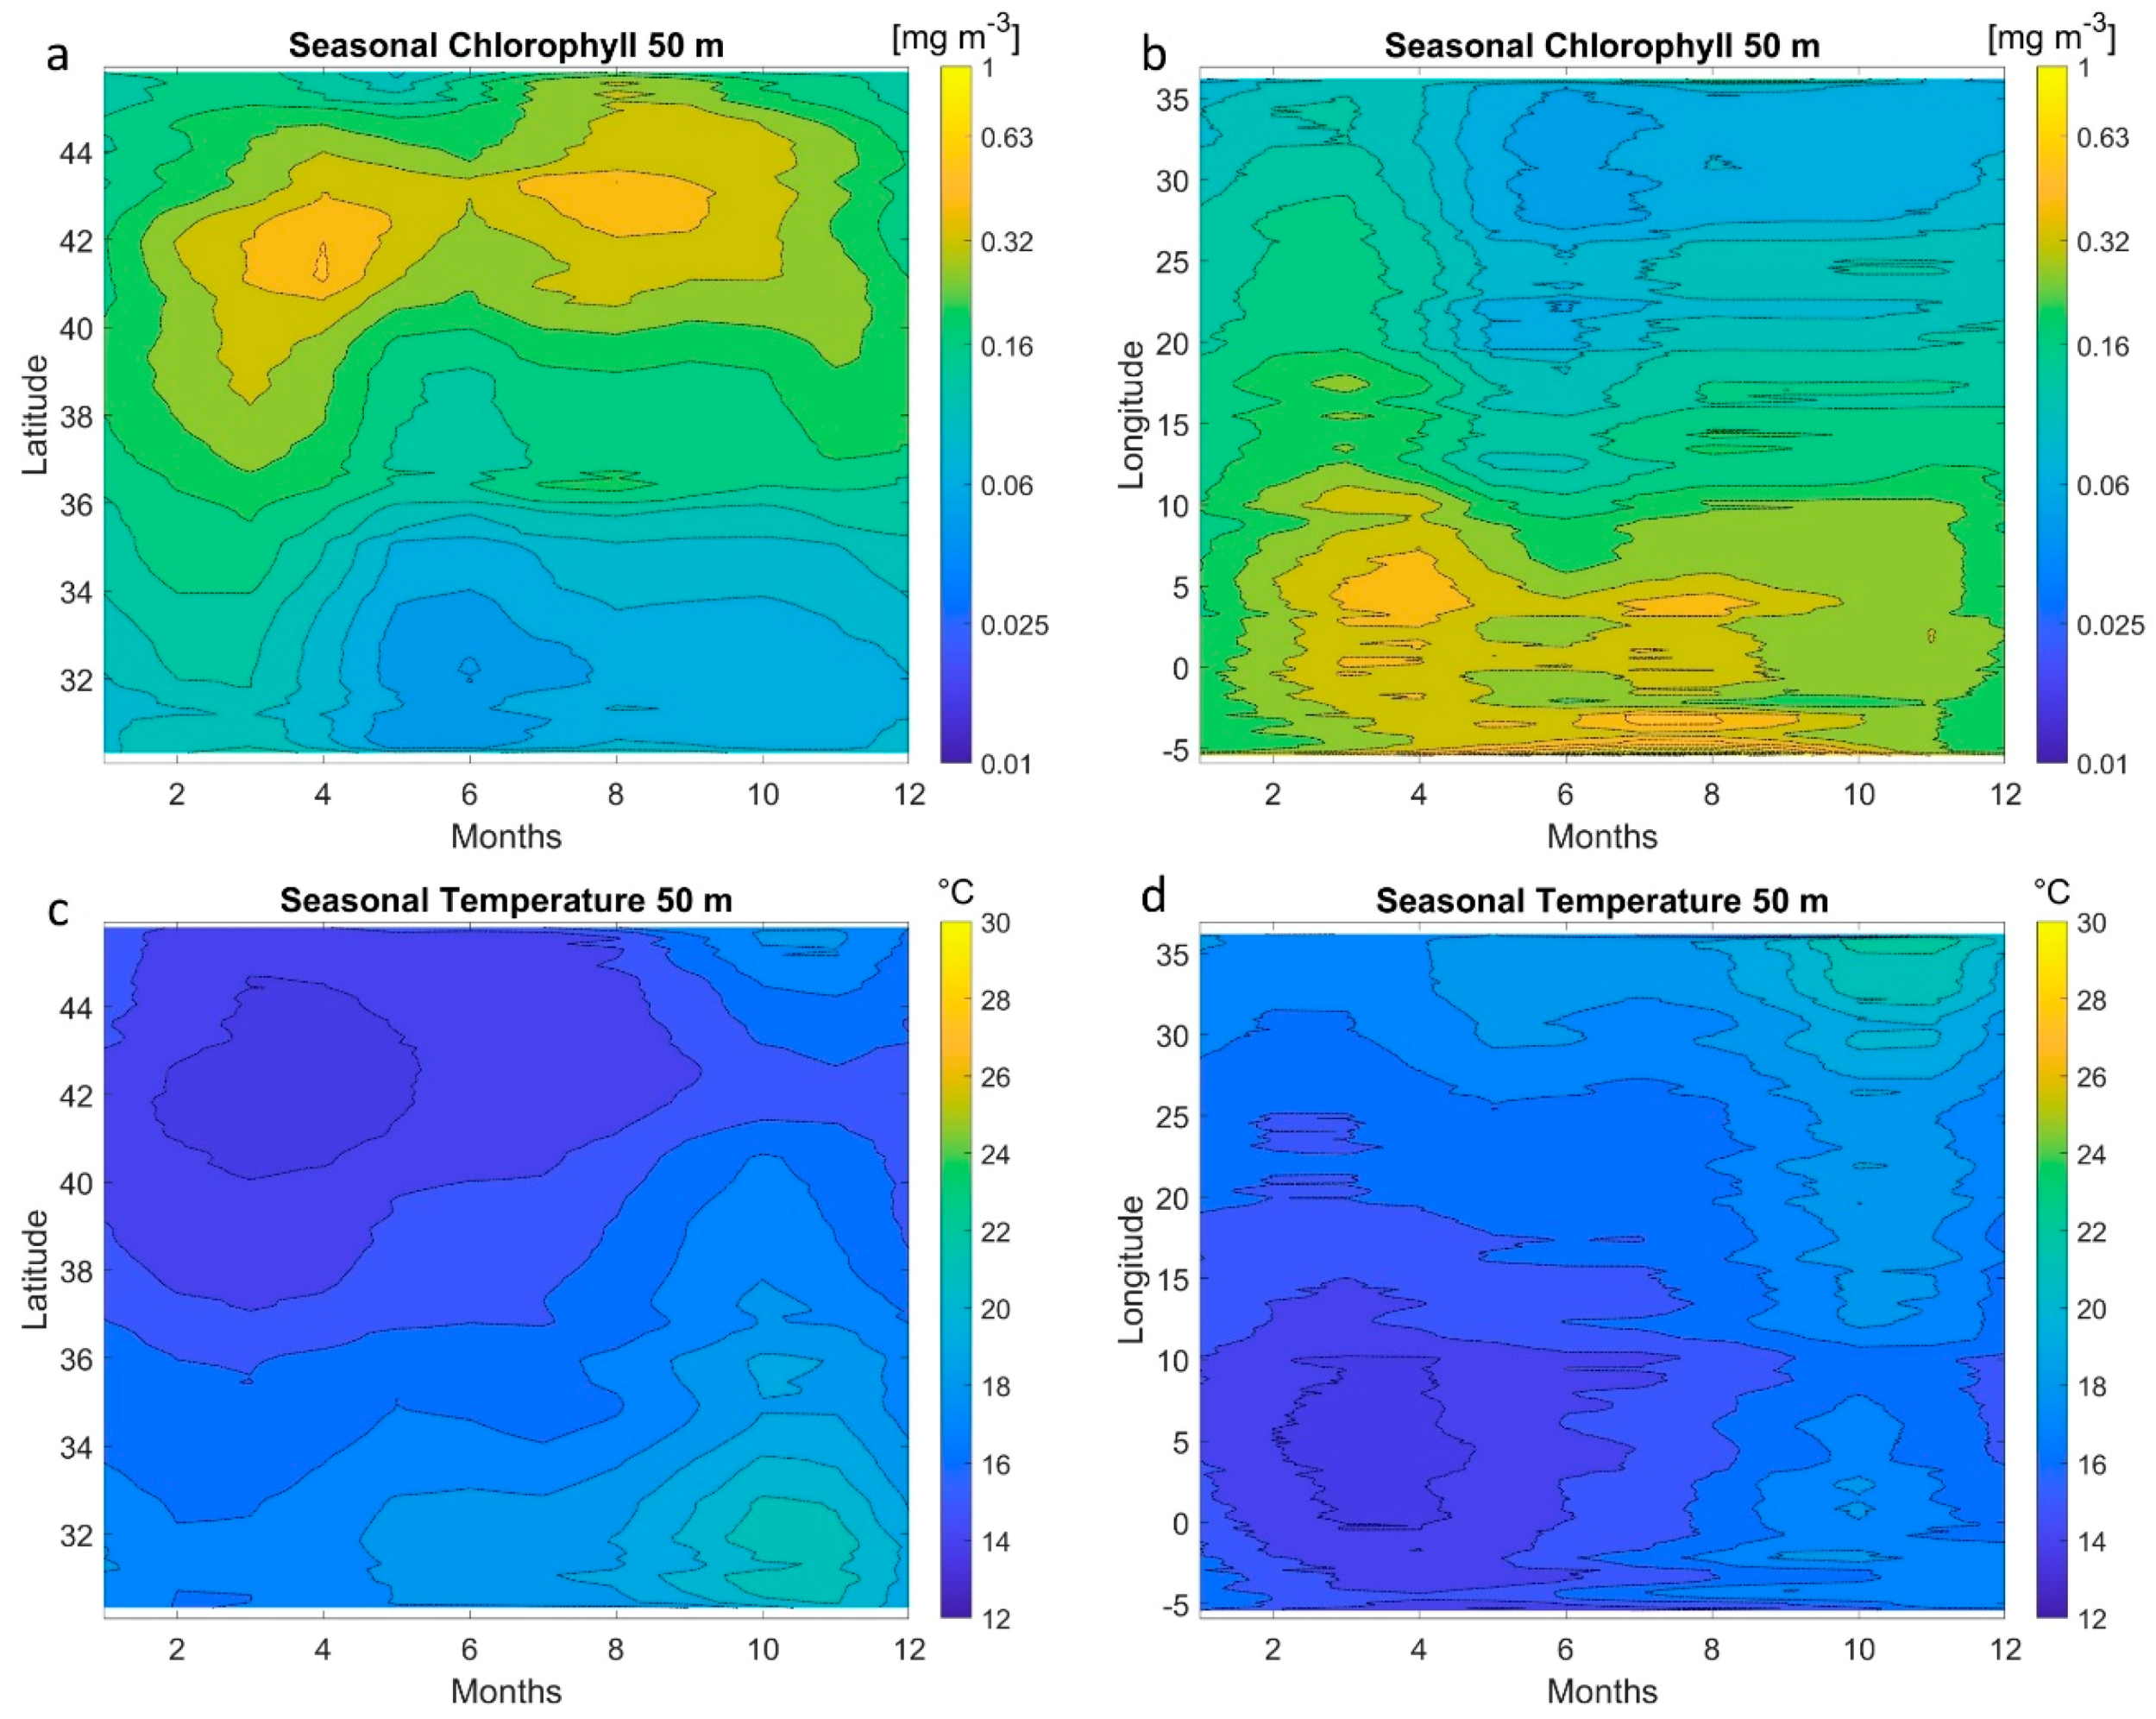
Figure 13 gives the MLP reconstruction of temperature and chlorophyll at 50 m of depth. For chlorophyll, the most evident pattern is a decreasing concentration gradient from North to South, with minima at latitudes lower than 36°N, especially in the months from May to October (Figure 13a). As a counterpart, the temperature shows low values in winter early-spring in those areas of vertical dynamic as that of the North-Western Mediterranean Sea (40–44.5°N, Figure 12c; Figure 13c), where a seasonal thermocline is absent in this period, allowing the uplift of nutrients from the bottom layers. At basin scale, at this depth (50 m), the chlorophyll resulted unbalanced, with higher concentration in the western basin than in the eastern. In fact, as described also in [3], the vertical position of the DCM varies toward the Eastern side, reaching depths higher than ~ 70 m, and therefore, becoming less observable at 50 m. This pattern is furthermore highlighted by the chlorophyll discontinuity at 20°E in Figure 13b and Figure 12b and relates to the nature of Levantine basin that shows a deeper DCM along the year with respect to the more productive areas as that of South-Western and North-Western [3,82].
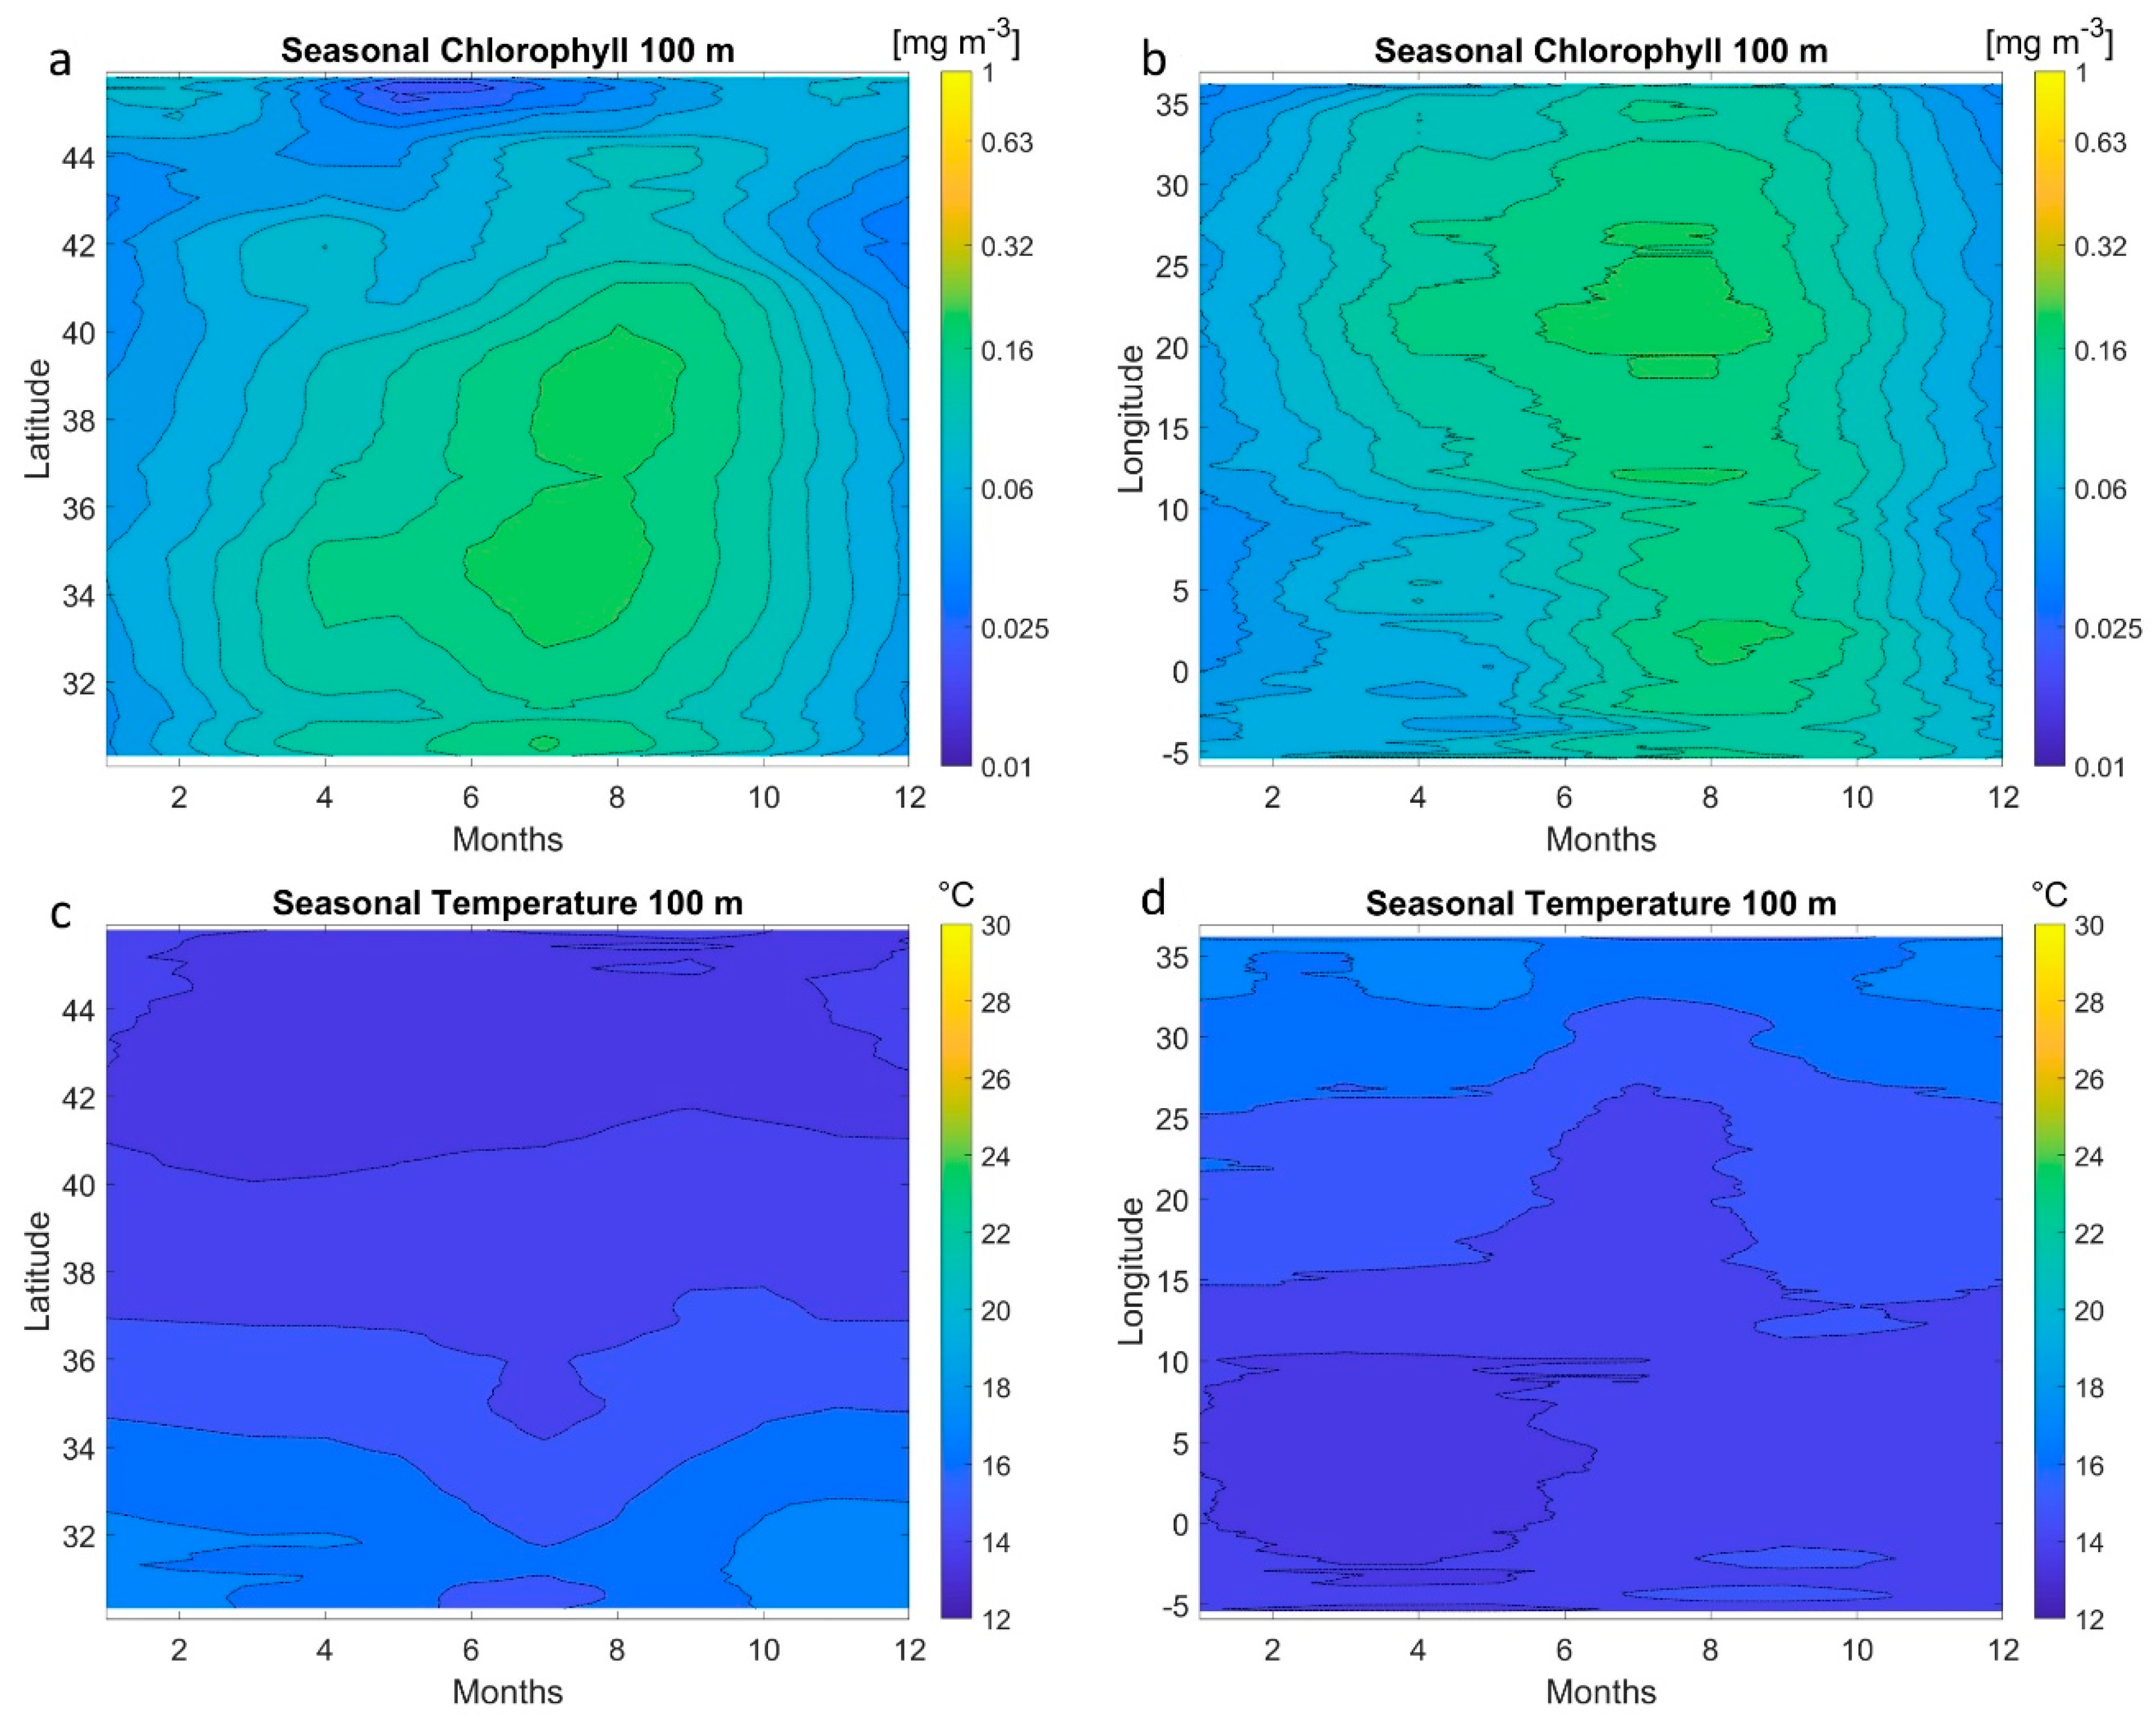
Last study case is reported in Figure 14 that shows the MLP chlorophyll and temperature reconstruction at 100 m of depth. Here, both temperature and chlorophyll patterns are very smooth with slight increase of chlorophyll concentrations in summer (Figure 14a). As described in [3,83], from spring to summer, the DCM remain constrained in a narrow band at ~ 100 m along the longitudinal gradient, with a small increase in the Eastern basin, as highlighted by the higher values at 20°E onward observable in panel b of Figure 14.
The results of this reconstruction figure out a promising capability of the network to recreate the principal patterns of both variables. The analysis has demonstrated how these models can embed the seasonal variation at basin and sub-basin scales, just using only surface information.

6. Discussion

The evolution of chlorophyll concentration and temperature 3D fields are expected to be strictly linked, both reflecting the changes driven by ongoing global warming. Phytoplankton is a key player in the marine food webs and monitoring its dynamics is crucial for ecosystem functioning and services assessment [84]. Phytoplankton photosynthetic activity occurs via intracellular pigment as chlorophyll and the dynamics of photosynthetic cells respond to fluctuations of temperature, upper ocean turbulence and nutrient availability [85]. Indeed, climate changes acting on these environmental factors can lead to modifications in the phytoplankton community structure and dynamics, both directly, i.e., through physiology and species interactions, and indirectly, i.e., by modifying water column stratification and nutrients and light availability. The increase of temperature in the water column may affect the organism physiology but also modifies the stratification of the euphotic zone. More stratified waters reduce the mixing in the column limiting the nutrient supply at surface and, thus modulating the algal biomass content, commonly approximated by the chlorophyll concentration [86]. Therefore, retrieving 3D chlorophyll and temperature distribution is key to better monitor phytoplankton blooms, representing a hot spot for primary production, of high relevance for the understanding of ecosystem functioning, fisheries, bio-geochemical cycle dynamics and ocean acidification processes.
As such, accurate estimations of surface and deeper ocean thermal properties become crucial for the understanding of the mechanisms of cause/effect that relate the biomass with the physical processes (vertical motion, horizontal transport, and mixing). Moreover, the modelling of subsurface and deeper ocean temperature allows to better describe the important role which the temperature and other related physical variables (salinity and water density) have in coastal processes, heat exchange, air-sea interaction and climate change [87]. The synergic analysis of different marine environmental variables can lead to an improvement in the understanding of physical and biological interactions in the upper marine layers and their evolution over time and space. In recent years, different techniques have been proposed to exploit the relationship between the sea surface and subsurface parameters to reconstruct the interior structure of the oceans, based on empirical or advanced statistics. Machine learning methods are also emerging as fast and suitable techniques to find a solution to this kind of problems [87].
In fact, even within a complex system as the Mediterranean Sea, neural network models as the one presented here proved able to map the latent relationships between vertical chlorophyll profiles and proper combinations of surface variables (ChlSAT, SST, ADT, U & V). These results further highlight the utility of such approaches, especially for regional cases, where the ecological dynamics can be very complex.
The error statistics of our MLP predictions are better for the 3D temperature field than for chlorophyll (see MBE%; MeanAPE% and MedianAPE% in Figure 3 and Figure 6). This is easily explained by the complex ecological and biological processes that modulate phytoplankton abundance throughout the water column (e.g., grazing), which cannot be predicted by (relatively) simple environmental data. Nevertheless, a further improvement of our work can be expected by including new satellite-derived data (such as sea surface salinity) as additional predictors in the MLP network, as soon as sufficiently accurate products will become available at regional scale.
As a future work, it would be also very interesting to carry out an intercomparison between the performance of our model and that obtained following other machine learning approaches in the prediction of 3D Mediterranean chlorophyll and temperature structure from regional surface observations.

7. Conclusions

Accurate monitoring of the 3D ocean state is a crucial requirement for marine environment preservation and climate change impact assessment. The use of satellite sensors has notably improved the frequency and resolution of surface ocean observations. However, these measurements are only representative of the surface layers, and cannot provide direct information on the variability of several ocean variables along the water-column. On the contrary, field activities provide accurate vertical estimates, but with low time and spatial coverage. For this reason, the combination of satellite and in situ observations to extrapolate information on the deeper layers through artificial intelligence tools/deep learning approaches is expected to play a key role in the next future.
In this work, we propose a machine learning approach to reconstruct the 3D fields of ocean temperature and chlorophyll concentration in the Mediterranean Sea, starting from surface measurements only. A novel deep Multi-Layer-Perceptron (MLP) network is applied to satellite data to concurrently infer the subsurface structure of these two variables. The model was validated against independent in situ test dataset. The relative errors demonstrated significant improvements in the temperature reconstruction (MBE% = −0.26%, and MeanAPE = 2.72%), but also better predictions for chlorophyll (MBE% = −17 and MeanAPE = 48%). Along the water column, a maximum RMSE of 1.2 °C for temperature and 0.4 mgm−3 for chlorophyll was found within the range of about 10–60 m depth, namely where the highest variability is observed in both variables. The results of the temperature model validation agreed with most of similar approaches applied on other ocean/seas [20,75]. The statistics and general fit of chlorophyll validation on test set data demonstrated an improvement with respect to that already obtained in [48], with an r2 = 0.71 and MeanAPE = 48% against the r2 = 0.69 and MeanAPE = 57% of the network trained on in situ surface values and showed in [48].
Aiming to understand the influence of each co-predictor in the 3D vertical reconstruction and optimize the network architecture, a careful sensitivity analysis was carried out. The configuration of the network that includes all the input variables (day of the year, Lat, Lon, ChlSAT, SST, ADT and geostrophic U & V) showed the lowest RMSE, both for chlorophyll and temperature. ADT had the strongest impact on the prediction of both variables, as an indirect proxy for the thermocline dynamics, followed by the day of the year, which, as expected, resulted of particular importance for temperature vertical shape.
MLP clearly outperformed MEDATLAS climatology when compared to fully independent test data. This suggests that, for an analysis of processes occurring at finer spatial and temporal scales, the use of our model would provide much better predictions, embedding the wide basin and sub-basin variability of the temperature and chlorophyll, at surface and at deeper layers. This was also supported by the analysis of the MLP application to satellite monthly climatology over 18 years, reliably reconstructing the main patterns of both variables in the basin, both at the surface and along the water column. The predicted 3D fields of chlorophyll showed higher chlorophyll concentrations in those areas characterized by an intense vertical mixing e.g., Gulf of Lion and coastal ones, with an Eastward decrease in surface and a consequent deepening of the DCM. Conversely, the modelled temperature showed lower temperature in winter in the Western basin, with a homogenous vertical pattern and a more pronounced thermocline in summer season in the Eastern basin. The capability of our network to recognize the DCM and thermocline position for the several surface trophic and thermal regimes in different seasons, highlighted its suitability to integrate the high variability of the temperature and chlorophyll vertical fields and its responsiveness to the complex subsurface dynamic of the Mediterranean basin.
Machine learning techniques applied to satellite estimates demonstrate huge and still only minimally exploited potentialities, both as predictive models and to better initialize and validate numerical bio-geophysical models. Indeed, even if a continuous effort is still required for the collection of accurate in situ data at even higher spatial and temporal scales, artificial neural network represent a valid alternative to provide an estimated profile where in situ sampling are missing or difficult.
As a future perspective, it will be of a great interest to test additional predictors, for instance, directly ingesting radiances instead of satellite chlorophyll, or including input from sea surface salinity satellite products. Future works could also extend this approach to the modelling of other ocean bio-chemical and physical variables (e.g., particulate organic carbon, salinity etc.). This will be possible once improved/new satellite products will be developed at regional scale, allowing to develop a cost-effective method to fill the gap of information between the 2D and 3D ocean systems.

Author Contributions

Conceptualization, M.S., B.B.N., S.M. and R.S.; methodology, M.S., B.B.N.; formal analysis, M.S.; funding acquisition, R.S.; investigation, M.S., B.B.N.; resources, R.S.; software, M.S.; supervision, B.B.N., S.M. and R.S.; validation, M.S.; visualization, M.S.; writing—original draft preparation, M.S.; writing—review and editing, M.S., B.B.N., S.M. and R.S. All authors have read and agreed to the published version of the manuscript.

Funding

This research was partially supported by the Copernicus Marine Environment Monitoring Service (CMEMS)—Ocean Colour Thematic Assembling Center Project (Grant number 77-CMEMS-TAC-OC).

Acknowledgments

The authors would like to thank all people involved in the collection and distribution of the in situ data used in this work. We are very grateful to the project MEDAR/MEDATLAS for the important contribution to the Mediterranean databases and for their free access. We acknowledge the CMEMS project for the distribution of free remote sensing data used in this work. M. Sammartino would to thank Michele Scardi for introducing, guiding and teaching her the machine learning techniques applied to the ecology and for always having supported her with his scientific knowledge. M. Sammartino thanks Marco Bellacicco for the fruitful review and comments that improved the final version of this paper. She also thanks the research group of the GOS of the Italian CNR, in particular Simone Colella, for his technical support and the helpful advices. We also thank Marco Bracaglia, Annalisa Di Cicco, Francesca Elisa Leonelli and Chiara Marullo for their useful discussions and suggestions.

Conflicts of Interest

The authors declare no conflict of interest. The funders had no role in the design of the study; in the collection, analyses, or interpretation of data; in the writing of the manuscript, or in the decision to publish the results.

References

  1. Aksamit, N.O.; Sapsis, T.; Haller, G. Machine-Learning Mesoscale and Submesoscale Surface Dynamics from Lagrangian Ocean Drifter Trajectories. J. Phys. Oceanogr. 2020, 50, 1179–1196. [Google Scholar] [CrossRef]
  2. Claustre, H.; Johnson, K.S.; Takeshita, Y. Observing the Global Ocean with Biogeochemical-Argo. Annu. Rev. Mar. Sci. 2020, 12, 23–48. [Google Scholar] [CrossRef] [PubMed]
  3. Lavigne, H.; Dortenzio, F.; D’Alcalà, M.R.; Claustre, H.; Sauzède, R.; Gacic, M. On the vertical distribution of the chlorophyll a concentration in the Mediterranean Sea: A basin-scale and seasonal approach. Biogeosciences 2015, 12, 5021–5039. [Google Scholar] [CrossRef] [Green Version]
  4. Le Traon, P.Y.; Reppucci, A.; Fanjul, E.A.; Aouf, L.; Behrens, A.; Belmonte, M.; Bentamy, A.; Bertino, L.; Brando, V.E.; Kreiner, M.B.; et al. From Observation to Information and Users: The Copernicus Marine Service Perspective. Front. Mar. Sci. 2019, 6, 234. [Google Scholar] [CrossRef] [Green Version]
  5. Nittis, K.; Tziavos, C.; Bozzano, R.; Cardin, V.; Thanos, Y.; Petihakis, G.; Schiano, M.E.; Zanon, F. The M3A Multi-Sensor Buoy Network of the Mediterranean Sea. Ocean Sci. 2007, 3, 229–243. [Google Scholar] [CrossRef] [Green Version]
  6. Poulin, P.-M.; Bussani, A.; Gerin, R.; Jungwirth, R.; Mauri, E.; Menna, M.; Notarstefano, G.; Poulain, P. Mediterranean Surface Currents Measured with Drifters: From Basin to Subinertial Scales. Oceanography 2013, 26, 38–47. [Google Scholar] [CrossRef] [Green Version]
  7. Von Schuckmann, K.; Le Traon, P.-Y.; Smith, N.; Pascual, A.; Djavidnia, S.; Gattuso, J.-P.; Grégoire, M.; Nolan, G.; Aaboe, S.; Aguiar, E.; et al. Copernicus Marine Service Ocean State Report, Issue 3. J. Oper. Oceanogr. 2019, 12, S1–S123. [Google Scholar] [CrossRef]
  8. Devi, G.K.; Ganasri, B.; Dwarakish, G. Applications of Remote Sensing in Satellite Oceanography: A Review. Aquat. Procedia 2015, 4, 579–584. [Google Scholar] [CrossRef]
  9. Robinson, I.S. Measuring the Oceans from Space: The Principles and Methods of Satellite Oceanography; Springer: Chichester, UK, 2004; p. 670. [Google Scholar]
  10. Robinson, I.S. Discovering the Ocean from Space: The Unique Applications of Satellite Oceanography; Springer: Chichester, UK, 2010; p. 638. [Google Scholar]
  11. Chavez, F.P.; Messié, M.; Pennington, J.T. Marine Primary Production in Relation to Climate Variability and Change. Annu. Rev. Mar. Sci. 2011, 3, 227–260. [Google Scholar] [CrossRef] [Green Version]
  12. Groom, S.; Sathyendranath, S.; Ban, Y.; Bernard, S.; Brewin, R.; Brotas, V.; Brockmann, C.; Chauhan, P.; Choi, J.-K.; Chuprin, A.; et al. Satellite Ocean Colour: Current Status and Future Perspective. Front. Mar. Sci. 2019, 6, 485. [Google Scholar] [CrossRef] [Green Version]
  13. Volpe, G.; Buongiorno Nardelli, B.; Cipollini, P.; Santoleri, R.; Robinson, I.S. Seasonal to interannual phytoplankton response to physical processes in the Mediterranean Sea from satellite observations. Remote Sens. Environ. 2012, 117, 223–235. [Google Scholar] [CrossRef]
  14. Werdell, P.J.; McKinna, L.I.W.; Boss, E.; Ackleson, S.G.; Craig, S.E.; Gregg, W.W.; Lee, Z.; Maritorena, S.; Roesler, C.S.; Rousseaux, C.S.; et al. An overview of approaches and challenges for retrieving marine inherent optical properties from ocean color remote sensing. Prog. Oceanogr. 2018, 160, 186–212. [Google Scholar] [CrossRef]
  15. Gordon, H.R.; McCluney, W.R. Estimation of the Depth of Sunlight Penetration in the Sea for Remote Sensing. Appl. Opt. 1975, 14, 413–416. [Google Scholar] [CrossRef]
  16. Carnes, M.R.; Teague, W.J.; Mitchell, J.L. Inference of Subsurface Thermohaline Structure from Fields Measurable by Satellite. J. Atmos. Ocean. Technol. 1994, 11, 551–566. [Google Scholar] [CrossRef] [Green Version]
  17. Fox, D.; Barron, C.; Carnes, M.; Booda, M.; Peggion, G.; Van Gurley, J. The Modular Ocean Data Assimilation System. Oceanography 2002, 15, 22–28. [Google Scholar] [CrossRef]
  18. Fox, D.N.; Teague, W.; Barron, C.N.; Carnes, M.R.; Lee, C.M. The Modular Ocean Data Assimilation System (MODAS). J. Atmos. Ocean. Technol. 2002, 19, 240–252. [Google Scholar] [CrossRef]
  19. Guinehut, S.; Le Traon, P.; Larnicol, G.; Philipps, S. Combining Argo and remote-sensing data to estimate the ocean three-dimensional temperature fields—A first approach based on simulated observations. J. Mar. Syst. 2004, 46, 85–98. [Google Scholar] [CrossRef]
  20. Buongiorno Nardelli, B.; Santoleri, R. Reconstructing Synthetic Profiles from Surface Data. J. Atmos. Ocean. Technol. 2004, 21, 693–703. [Google Scholar] [CrossRef]
  21. Buongiorno Nardelli, B.; Santoleri, R. Methods for the Reconstruction of Vertical Profiles from Surface Data: Multivariate Analyses, Residual GEM, and Variable Temporal Signals in the North Pacific Ocean. J. Atmos. Ocean. Technol. 2005, 22, 1762–1781. [Google Scholar] [CrossRef]
  22. Guinder, V.; Molinero, J. Climate Change Effects on Marine Phytoplankton. In Marine Ecology in a Changing World; Informa UK Limited: London, UK, 2013; pp. 68–90. [Google Scholar]
  23. Jeong, Y.; Hwang, J.; Park, J.; Jang, C.J.; Jo, Y.-H. Reconstructed 3-D Ocean Temperature Derived from Remotely Sensed Sea Surface Measurements for Mixed Layer Depth Analysis. Remote Sens. 2019, 11, 3018. [Google Scholar] [CrossRef] [Green Version]
  24. Maes, C.; Behringer, D.; Reynolds, R.W.; Ji, M. Retrospective Analysis of the Salinity Variability in the Western Tropical Pacific Ocean Using an Indirect Minimization Approach. J. Atmospheric Ocean. Technol. 2000, 17, 512–524. [Google Scholar] [CrossRef]
  25. Buongiorno Nardelli, B. Vortex waves and vertical motion in a mesoscale cyclonic eddy. J. Geophys. Res. Oceans 2013, 118, 5609–5624. [Google Scholar] [CrossRef]
  26. Hutchinson, K.; Swart, S.; Meijers, A.; Ansorge, I.; Speich, S. Decadal-scale thermohaline variability in the Atlantic sector of the Southern Ocean. J. Geophys. Res. Oceans 2016, 121, 3171–3189. [Google Scholar] [CrossRef] [Green Version]
  27. Morel, A.; Berthon, J.-F. Surface pigments, algal biomass profiles, and potential production of the euphotic layer: Relationships reinvestigated in view of remote-sensing applications. Limnol. Oceanogr. 1989, 34, 1545–1562. [Google Scholar] [CrossRef] [Green Version]
  28. Uitz, J.; Claustre, H.; Morel, A.; Hooker, S.B. Vertical distribution of phytoplankton communities in open ocean: An assessment based on surface chlorophyll. J. Geophys. Res. Space Phys. 2006, 111, 111. [Google Scholar] [CrossRef]
  29. Lu, W.; Su, H.; Yang, X.; Yan, X.-H. Subsurface temperature estimation from remote sensing data using a clustering-neural network method. Remote Sens. Environ. 2019, 229, 213–222. [Google Scholar] [CrossRef]
  30. Wu, X.; Yan, X.-H.; Jo, Y.-H.; Liu, W.T. Estimation of Subsurface Temperature Anomaly in the North Atlantic Using a Self-Organizing Map Neural Network. J. Atmospheric Ocean. Technol. 2012, 29, 1675–1688. [Google Scholar] [CrossRef]
  31. Su, H.; Wu, X.; Yan, X.-H.; Kidwell, A. Estimation of subsurface temperature anomaly in the Indian Ocean during recent global surface warming hiatus from satellite measurements: A support vector machine approach. Remote Sens. Environ. 2015, 160, 63–71. [Google Scholar] [CrossRef]
  32. Su, H.; Yang, X.; Lu, W.; Yan, X.-H. Estimating Subsurface Thermohaline Structure of the Global Ocean Using Surface Remote Sensing Observations. Remote Sens. 2019, 11, 1598. [Google Scholar] [CrossRef] [Green Version]
  33. Ali, M.M.; Swain, D.; A Weller, R. Estimation of ocean subsurface thermal structure from surface parameters: A neural network approach. Geophys. Res. Lett. 2004, 31, 20308. [Google Scholar] [CrossRef] [Green Version]
  34. Zhang, K.; Geng, X.; Yan, X.-H. Prediction of 3-D Ocean Temperature by Multilayer Convolutional LSTM. IEEE Geosci. Remote Sens. Lett. 2020, 17, 1303–1307. [Google Scholar] [CrossRef]
  35. Buongiorno Nardelli, B. A Deep Learning Network to Retrieve Ocean Hydrographic Profiles from Combined Satellite and In Situ Measurements. Remote Sens. 2020, 12, 3151. [Google Scholar] [CrossRef]
  36. Richardson, A.J.; Pfaff, M.C.; Field, J.G.; Silulwane, N.F.; Shillington, F.A. Identifying characteristic chlorophyll a profiles in the coastal domain using an artificial neural network. J. Plankton Res. 2002, 24, 1289–1303. [Google Scholar] [CrossRef]
  37. Charantonis, A.; Badran, F.; Thiria, S. Retrieving the evolution of vertical profiles of Chlorophyll-a from satellite observations using Hidden Markov Models and Self-Organizing Topological Maps. Remote Sens. Environ. 2015, 163, 229–239. [Google Scholar] [CrossRef]
  38. Dall Cortivo, F.; Chalhoub, E.S.; Velho, H.F.C.; Kampel, M. Chlorophyll Profile Estimation in Ocean Waters by a Set of Artificial Neural Networks. Comput. Assist. Methods Eng. Sci. 2015, 22, 63–88. [Google Scholar]
  39. Mattei, F.; Franceschini, S.; Scardi, M. A depth-resolved artificial neural network model of marine phytoplankton primary production. Ecol. Model. 2018, 382, 51–62. [Google Scholar] [CrossRef]
  40. Mattei, F.; Scardi, M. Embedding ecological knowledge into artificial neural network training: A marine phytoplankton primary production model case study. Ecol. Model. 2020, 421, 108985. [Google Scholar] [CrossRef]
  41. Scardi, M. Artificial Neural Networks as Empirical Models of Phytoplankton Production. Mar. Ecol. Prog. Ser. 1996, 139, 289–299. [Google Scholar] [CrossRef] [Green Version]
  42. Scardi, M. Neural network applications in coastal ecological modeling. In Elsevier Oceanography Series; Elsevier BV: Amsterdam, The Netherlands, 2003; pp. 505–532. [Google Scholar]
  43. Sauzède, R.; Claustre, H.; Jamet, C.; Uitz, J.; Ras, J.; Mignot, A.; D’Ortenzio, F. Retrieving the vertical distribution of chlorophyll a concentration and phytoplankton community composition from in situ fluorescence profiles: A method based on a neural network with potential for global-scale applications. J. Geophys. Res. Oceans 2015, 120, 451–470. [Google Scholar] [CrossRef]
  44. Sauzède, R.; Claustre, H.; Uitz, J.; Jamet, C.; Dall’Olmo, G.; D’Ortenzio, F.; Gentili, B.; Poteau, A.; Schmechtig, C. A neural network-based method for merging ocean color and Argo data to extend surface bio-optical properties to depth: Retrieval of the particulate backscattering coefficient. J. Geophys. Res. Oceans 2016, 121, 2552–2571. [Google Scholar] [CrossRef] [Green Version]
  45. Sauzède, R.; Bittig, H.C.; Claustre, H.; De Fommervault, O.P.; Gattuso, J.-P.; Legendre, L.; Johnson, K.S. Estimates of Water-Column Nutrient Concentrations and Carbonate System Parameters in the Global Ocean: A Novel Approach Based on Neural Networks. Front. Mar. Sci. 2017, 4, 128. [Google Scholar] [CrossRef]
  46. Bittig, H.C.; Steinhoff, T.; Claustre, H.; Fiedler, B.; Williams, N.L.; Sauzède, R.; Körtzinger, A.; Gattuso, J.-P. An Alternative to Static Climatologies: Robust Estimation of Open Ocean CO2 Variables and Nutrient Concentrations From T, S, and O2 Data Using Bayesian Neural Networks. Front. Mar. Sci. 2018, 5, 328. [Google Scholar] [CrossRef]
  47. Lek, S.; Guégan, J.-F. Artificial Neuronal Networks: Application to Ecology and Evolution; Springer Science and Business Media LLC: Berlin/Heidelberg, Germany, 2000; p. 262. [Google Scholar]
  48. Sammartino, M.; Marullo, S.; Santoleri, R.; Scardi, M. Modelling the Vertical Distribution of Phytoplankton Biomass in the Mediterranean Sea from Satellite Data: A Neural Network Approach. Remote Sens. 2018, 10, 1666. [Google Scholar] [CrossRef] [Green Version]
  49. Volpe, G.; Santoleri, R.; Vellucci, V.; D’Alcalà, M.R.; Marullo, S.; D’Ortenzio, F. The colour of the Mediterranean Sea: Global versus regional bio-optical algorithms evaluation and implication for satellite chlorophyll estimates. Remote Sens. Environ. 2007, 107, 625–638. [Google Scholar] [CrossRef]
  50. D’Alimonte, D.; Zibordi, G. Phytoplankton determination in an optically complex coastal region using a multilayer perceptron neural network. IEEE Trans. Geosci. Remote Sens. 2003, 41, 2861–2868. [Google Scholar] [CrossRef]
  51. Berthon, J.-F.; Zibordi, G.; Doyle, J.-P.; Grossi, S.; van der Linde, D.; Targa, C. Coastal Atmosphere and Sea Time Series (CoASTS): Data analysis. In NASA Technical Memorandum 2002- 206892; Hooker, S.B., Firestone, E.R., Eds.; NASA-GSFC: Greenbelt, MD, USA, 2002; Volume 20, pp. 1–25. [Google Scholar]
  52. D’Alimonte, D.; Melin, F.; Zibordi, G.; Berthon, J.-F. Use of the novelty detection technique to identify the range of applicability of empirical ocean color algorithms. IEEE Trans. Geosci. Remote Sens. 2003, 41, 2833–2843. [Google Scholar] [CrossRef]
  53. Volpe, G.; Colella, S.; Forneris, V.; Tronconi, C.; Santoleri, R. The Mediterranean Ocean Colour Observing System—System development and product validation. Ocean Sci. 2012, 8, 869–883. [Google Scholar] [CrossRef] [Green Version]
  54. Buongiorno Nardelli, B.; Tronconi, C.; Pisano, A.; Santoleri, R. High and Ultra-High resolution processing of satellite Sea Surface Temperature data over Southern European Seas in the framework of MyOcean project. Remote Sens. Environ. 2013, 129, 1–16. [Google Scholar] [CrossRef]
  55. Pisano, A.; Buongiorno Nardelli, B.; Tronconi, C.; Santoleri, R. The new Mediterranean optimally interpolated pathfinder AVHRR SST Dataset (1982–2012). Remote Sens. Environ. 2016, 176, 107–116. [Google Scholar] [CrossRef]
  56. Pisano, A.; Marullo, S.; Artale, V.; Falcini, F.; Yang, C.; Leonelli, F.E.; Santoleri, R.; Buongiorno Nardelli, B. New Evidence of Mediterranean Climate Change and Variability from Sea Surface Temperature Observations. Remote Sens. 2020, 12, 132. [Google Scholar] [CrossRef] [Green Version]
  57. Rio, M.H.; Pascual, A.; Poulain, P.-M.; Menna, M.; Barceló-Llull, B.; Tintore, J. Computation of a new mean dynamic topography for the Mediterranean Sea from model outputs, altimeter measurements and oceanographic in situ data. Ocean Sci. 2014, 10, 731–744. [Google Scholar] [CrossRef] [Green Version]
  58. Bishop, C.M. Pattern Recognition and Machine Learning; Springer: New York, NY, USA, 2006. [Google Scholar]
  59. Rumelhart, D.E.; Hinton, G.E.; Williams, R.J. Learning representations by back-propagating errors. Nat. Cell Biol. 1986, 323, 533–536. [Google Scholar] [CrossRef]
  60. Beale, M.H.; Hagan, M.T.; Demuth, H.B. Neural Network Toolbox. User Guide MathWorks 2010, 2, 77–81. [Google Scholar]
  61. Hagan, M.T.; Demuth, H.B.; Beale, M.H. Neural Network Design, 2nd ed.; Oklahoma State University: Stillwater, OK, USA, 2002; p. 1012. [Google Scholar]
  62. Werbos, P.; John, P. Beyond Regression: New Tools for Prediction and Analysis in the Behavioral Sciences; Harvard University: Cambridge, MA, USA, 1974. [Google Scholar]
  63. Møller, M.F. A scaled conjugate gradient algorithm for fast supervised learning. Neural Netw. 1993, 6, 525–533. [Google Scholar] [CrossRef]
  64. D’Ortenzio, F.; D’Alcalà, M.R. On the trophic regimes of the Mediterranean Sea: A satellite analysis. Biogeosciences 2009, 6, 139–148. [Google Scholar] [CrossRef] [Green Version]
  65. Martinez, E.; Gorgues, T.; Lengaigne, M.; Fontana, C.; Sauzède, R.; Menkes, C.; Uitz, J.; Di Lorenzo, E.; Fablet, R. Reconstructing Global Chlorophyll-a Variations Using a Non-linear Statistical Approach. Front. Mar. Sci. 2020, 7, 464. [Google Scholar] [CrossRef]
  66. Buongiorno Nardelli, B.; Larnicol, G.; D’Acunzo, E.; Santoleri, R.; Marullo, S.; Le Traon, P.Y. Near Real Time SLA and SST products during 2-years of MFS pilot project: Processing, analysis of the variability and of the coupled patterns. Ann. Geophys. 2003, 21, 103–121. [Google Scholar] [CrossRef] [Green Version]
  67. Radenac, M.-H.; Léger, F.; Singh, A.; Delcroix, T. Sea surface chlorophyll signature in the tropical Pacific during eastern and central Pacific ENSO events. J. Geophys. Res. Space Phys. 2012, 117, 1–15. [Google Scholar] [CrossRef] [Green Version]
  68. Wilson, C.; Adamec, D. Correlations between surface chlorophyll and sea surface height in the tropical Pacific during the 1997-1999 El Niño-Southern Oscillation event. J. Geophys. Res. Space Phys. 2001, 106, 31175–31188. [Google Scholar] [CrossRef]
  69. D’Alimonte, D.; Zibordi, G.; Berthon, J.F.; Canuti, E.; Kajiyama, T. Bio-Optical Algorithms for European Seas: Performance and Applicability of Neural-Net Inversion Schemes. In Technical Report JRC66326, JRC-IES Scientific and Technical Reports; Joint research Centre: Ispra, Italy, 2011; p. 59. [Google Scholar]
  70. Kajiyama, T.; D’Alimonte, D.; Cunha, J.C. Performance prediction of ocean color Monte Carlo simulations using multi-layer perceptron neural networks. Procedia Comput. Sci. 2011, 4, 2186–2195. [Google Scholar] [CrossRef] [Green Version]
  71. Thessen, A. Adoption of Machine Learning Techniques in Ecology and Earth Science. One Ecosyst. 2016, 1, e8621. [Google Scholar] [CrossRef]
  72. Marañón, E.; Van Wambeke, F.; Uitz, J.; Boss, E.S.; Pérez-Lorenzo, M.; Dinasquet, J.; Haëntjens, N.; Dimier, C.; Taillandier, V. Deep Maxima of Phytoplankton Biomass, Primary Production and Bacterial Production in the Mediterranean Sea during Late Spring. Biogeosci. Discuss. 2020, 2020, 1–28. [Google Scholar]
  73. Chu, P.C.; Fan, C.; Liu, W.T. Determination of Vertical Thermal Structure from Sea Surface Temperature. J. Atmos. Ocean. Technol. 2000, 17, 971–979. [Google Scholar] [CrossRef] [Green Version]
  74. Meijers, A.J.S.; Bindoff, N.L.; Rintoul, S.R. Estimating the Four-Dimensional Structure of the Southern Ocean Using Satellite Altimetry. J. Atmos. Ocean. Technol. 2011, 28, 548–568. [Google Scholar] [CrossRef]
  75. Zhao, N.; Han, Z. A Simulation Model of Seawater Vertical Temperature by Using Back-Propagation Neural Network. Pol. Marit. Res. 2015, 22, 82–88. [Google Scholar] [CrossRef]
  76. Houpert, L.; Testor, P.; De Madron, X.D.; Somot, S.; Ortenzio, F.D.; Estournel, C.; Lavigne, H. Seasonal cycle of the mixed layer, the seasonal thermocline and the upper-ocean heat storage rate in the Mediterranean Sea derived from observations. Prog. Oceanogr. 2015, 132, 333–352. [Google Scholar] [CrossRef]
  77. Maillard, C.; Fichaut, M.; Maudire, G.; Coatanoan, C.; Balopoulos, E.; Iona, A.; Lykiardopoulos, A.; Karagevrekis, P. A Mediterranean and Black Sea Oceanographic Database and Network. Boll. Geof. Teor. Appl. 2005, 46, 329–343. [Google Scholar]
  78. Manca, B.; Burca, M.; Giorgetti, A.; Coatanoan, C.; Garcia, M.-J.; Iona, A. Physical and biochemical averaged vertical profiles in the Mediterranean regions: An important tool to trace the climatology of water masses and to validate incoming data from operational oceanography. J. Mar. Syst. 2004, 48, 83–116. [Google Scholar] [CrossRef]
  79. Shaltout, M.; Omstedt, A. Recent sea surface temperature trends and future scenarios for the Mediterranean Sea. Oceanology 2014, 56, 411–443. [Google Scholar] [CrossRef] [Green Version]
  80. Sammartino, M.; Di Cicco, A.; Marullo, S.; Santoleri, R. Spatio-temporal variability of micro-, nano- and pico-phytoplankton in the Mediterranean Sea from satellite ocean colour data of SeaWiFS. Ocean Sci. 2015, 11, 759–778. [Google Scholar] [CrossRef] [Green Version]
  81. Lazzari, P.; Solidoro, C.; Ibello, V.; Salon, S.; Teruzzi, A.; Beranger, K.; Colella, S.; Crise, A. Seasonal and inter-annual variability of plankton chlorophyll and primary production in the Mediterranean Sea: A modelling approach. Biogeosciences 2012, 9, 217–233. [Google Scholar] [CrossRef] [Green Version]
  82. Barbieux, M.; Uitz, J.; Gentili, B.; Pasqueron de Fommervault, O.; Mignot, A.; Poteau, A.; Schmechtig, C.; Taillandier, V.; Leymarie, E.; Penkerc’h, C.; et al. Bio-Optical Characterization of Subsurface Chlorophyll Maxima in the Mediterranean Sea from a Biogeochemical-Argo Float Database. Biogeosciences 2019, 16, 1321–1342. [Google Scholar] [CrossRef] [Green Version]
  83. Macias, D.; Stips, A.; Garcia-Gorriz, E. The relevance of deep chlorophyll maximum in the open Mediterranean Sea evaluated through 3D hydrodynamic-biogeochemical coupled simulations. Ecol. Model. 2014, 281, 26–37. [Google Scholar] [CrossRef]
  84. Righetti, D.; Vogt, M.; Gruber, N.; Psomas, A.; Zimmermann, N.E. Global pattern of phytoplankton diversity driven by temperature and environmental variability. Sci. Adv. 2019, 5, eaau6253. [Google Scholar] [CrossRef] [PubMed] [Green Version]
  85. Lévy, M.; Jahn, O.; Dutkiewicz, S.; Follows, M.J.; D’Ovidio, F. The dynamical landscape of marine phytoplankton diversity. J. R. Soc. Interface 2015, 12, 20150481. [Google Scholar] [CrossRef] [PubMed]
  86. Dunstan, P.K.; Foster, S.D.; King, E.; Risbey, J.; O’Kane, T.J.; Monselesan, D.; Hobday, A.J.; Hartog, J.R.; Thompson, P.A. Global patterns of change and variation in sea surface temperature and chlorophyll a. Sci. Rep. 2018, 8, 1–9. [Google Scholar] [CrossRef] [Green Version]
  87. Akbari, E.; Alavipanah, S.K.; Jeihouni, M.; Hajeb, M.; Haase, D.; Alavipanah, S. A Review of Ocean/Sea Subsurface Water Temperature Studies from Remote Sensing and Non-Remote Sensing Methods. Water 2017, 9, 936. [Google Scholar] [CrossRef] [Green Version]
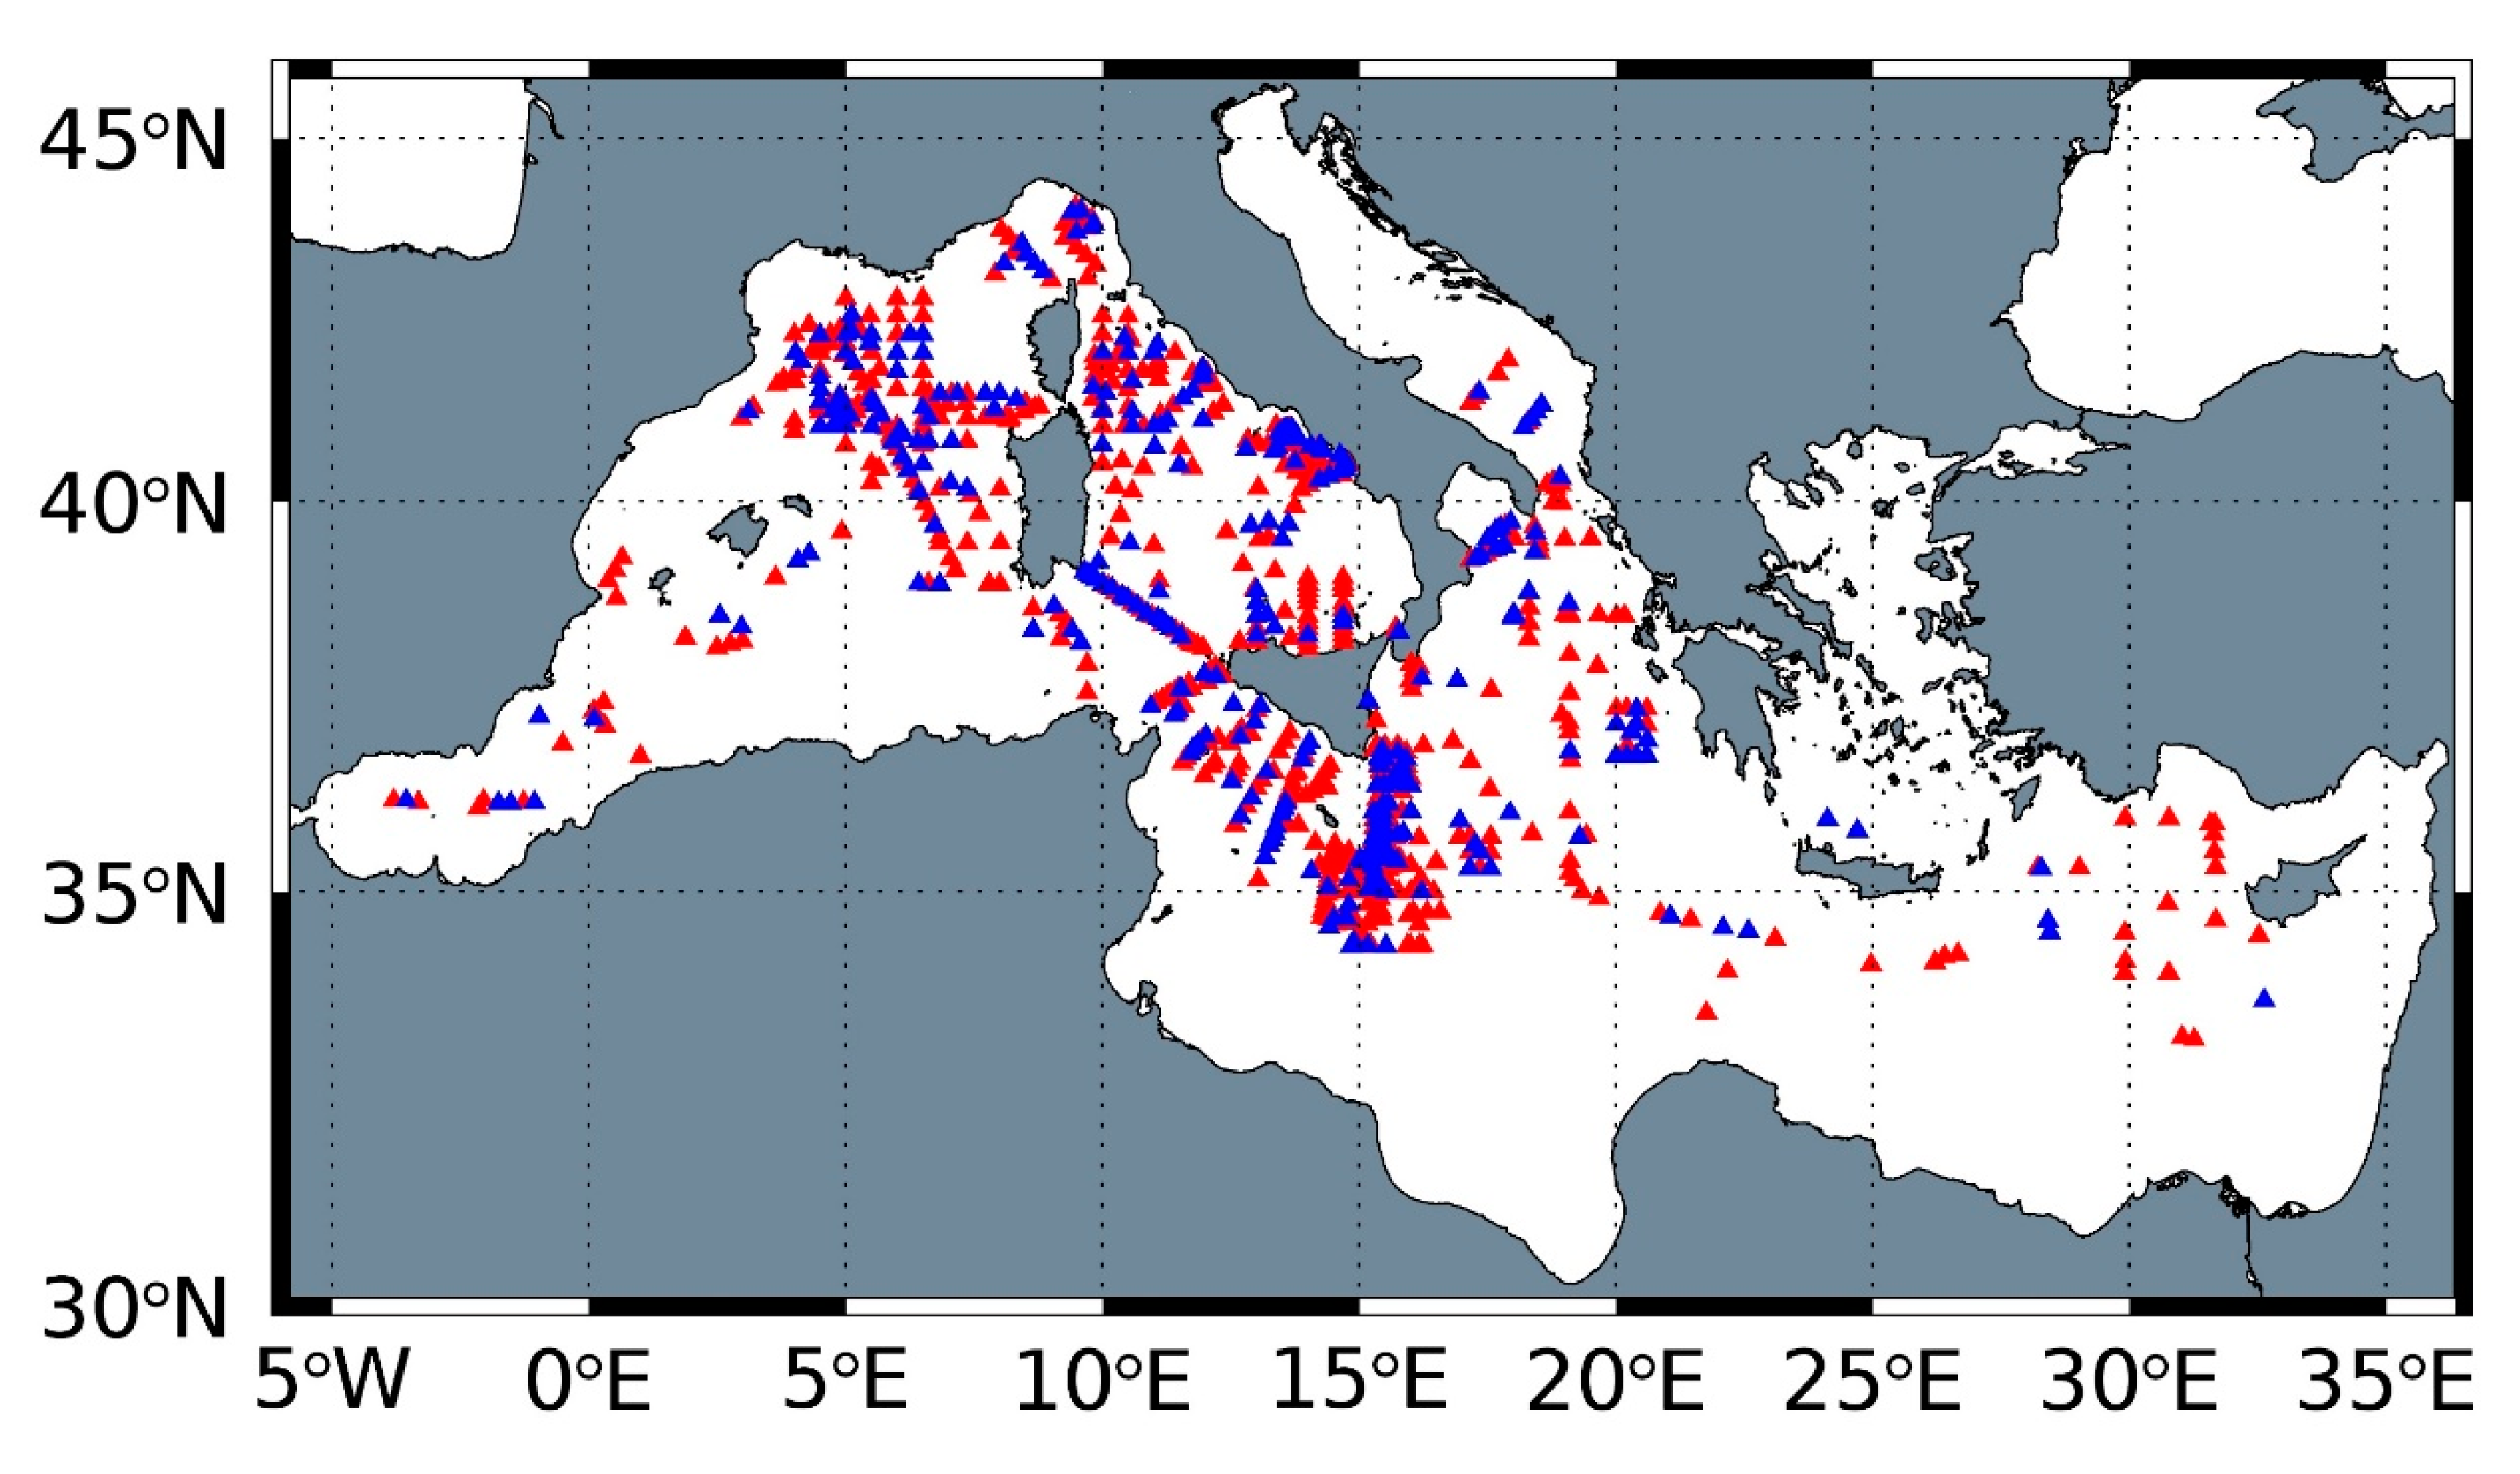
Figure 1. Spatial distribution of the stations used for the training set (red triangle, ~70% of the total stations) and test set (blue triangle, corresponding to ~30% of the total stations). The selection between training and test stations was random.
Remotesensing 12 04123 g001
Figure 2. Multi-Layer-Perceptron architecture with two hidden layers and two outputs (10-12-8-2).
Remotesensing 12 04123 g002
Figure 3. Training (a) and test (b) results for the MLP chlorophyll predictions. The density scatterplot shows the observed (on x-axis) vs. the MLP predicted values (on y-axis) and their respective statistics. The graphical visualization of the data is in log-scale, while the statistics is computed on linear values. In black, the 1:1 bisector.
Remotesensing 12 04123 g003
Figure 4. Chlorophyll RMSE profile computed on the test set as a function of depth.
Remotesensing 12 04123 g004
Figure 5. (ah) Comparison of the mean profiles of the observed (black line) and MLP (blue line) chlorophyll values modelled from surface satellite data and grouped according to different surface trophic classes (in bold at the top of each panel). For each panel the black line is computed averaging all the observed profiles falling within specific surface chlorophyll class. The blue line is obtained from the average of all MLP corresponding profiles. The shaded areas represent their respective standard deviations. The number in brackets refers to frequency of training observed profiles for each surface trophic class. These results are referred to the test dataset.
Remotesensing 12 04123 g005
Figure 6. Training (a) and test (b) results for the MLP temperature predictions. The density scatterplot shows the observed (on x-axis) vs. the MLP predicted values (on y-axis) and their respective statistics. In black, the 1:1 bisector.
Remotesensing 12 04123 g006
Figure 7. Temperature RMSE profile computed on the test set as a function of depth.
Remotesensing 12 04123 g007
Figure 8. (ai, lt) Comparison of the mean profiles of the observed (black line) and MLP (blue line) temperature values modelled from surface satellite data and grouped according to different surface temperature classes (in bold at the top of each panel). For each panel the black line is computed averaging all the observed profiles falling within specific surface temperature class. The blue line is obtained from the average of all MLP corresponding profiles. The shaded areas represent their respective standard deviations. The number in brackets refers to frequency of training observed profiles for each surface trophic class. These results are referred to the test dataset.
Remotesensing 12 04123 g008
Figure 9. Sensitivity analysis results for the test dataset. Left panel (a) shows chlorophyll RMSE as a function of the depth, resulting from the use of different input combinations; the right panel (b) shows the same for temperature. The multiple inputs combinations are colored and reported in the legend.
Remotesensing 12 04123 g009
Figure 10. Results of the chlorophyll comparison between the MLP performance (in blue) and MEDATLAS climatology (in red) on test set. In the upper left panel (a), a scatterplot of the observed values (on x-axis) vs. MLP predictions (on y-axis) is shown (blue dots). As a counterpart (red dots), the upper right panel (b) shows the scatterplot of the comparison between the observed values (on x-axis) and climatology (on y-axis). The relative statistics is given in each panel, with N as the number of available data for the matchups database. Bottom panels show the MBE (c), RMSE (d) and the MAE (e) in function of depth for the MLP (blue line) and climatology (red line) comparison. For chlorophyll the reference MEDATLAS climatology is the seasonal one.
Remotesensing 12 04123 g010
Figure 11. Results of the temperature comparison between the MLP performance (in blue) and MEDATLAS climatology (in red) on test set. In the upper left panel (a), a scatterplot of the observed values (on x-axis) vs. MLP predictions (on y-axis) is shown (blue dots). As a counterpart (red dots), the upper right panel (b) shows the scatterplot of the comparison between the observed values (on x-axis) and climatology (on y-axis). The relative statistics is given in each panel, with N as the number of available data for the matchups database. Bottom panels show the MBE (c), RMSE (d) and the MAE (e) in function of depth for the MLP (blue line) and climatology (red line) comparison. For temperature the reference MEDATLAS climatology is the monthly mean one.
Remotesensing 12 04123 g011
Figure 12. An example of MLP basin reconstruction from monthly satellite data at 3 m of depth. On the left panels a contour plot of the longitudinal chlorophyll (a) and temperature (c) means along the year (on x-axis) is shown. On the right, a corresponding contour plot of latitudinal chlorophyll (b) and temperature (d) means is provided.
Remotesensing 12 04123 g012
Figure 13. An example of MLP basin reconstruction from monthly satellite data at 50 m of depth. On the left panels a contour plot of the longitudinal chlorophyll (a) and temperature (c) means along the year (on x-axis) is shown. On the right, a corresponding contour plot of latitudinal chlorophyll (b) and temperature (d) means is provided.
Remotesensing 12 04123 g013
Figure 14. An example of MLP basin reconstruction from monthly satellite data at 100 m of depth. On the left panels a contour plot of the longitudinal chlorophyll (a) and temperature (c) means along the year (on x-axis) is shown. On the right, a corresponding contour plot of latitudinal chlorophyll (b) and temperature (d) means is provided.
Remotesensing 12 04123 g014
Table 1. Reference statistical parameters employed for the assessment of the Multi-Layer-Perceptron (MLP) performance with respect to the observed data. N is the number of observations and x is the observed value.
Determination Coefficient r 2 = ( i ( x i x ¯ ) ( M o d e l i M o d e l ¯ ) i ( x i x ¯ ) 2 i ( M o d e l i M o d e l ¯ ) 2 ) 2
Root Mean Squared Error R M S E = 1 N i = 1 N ( x i M o d e l i ) 2
Mean Squared Error M S E = 1 N i = 1 N ( x i M o d e l i ) 2
Mean Bias Error M B E = 1 N i = 1 N ( x i M o d e l i )
Mean Absolute Percentage Error M e a n A P E = 1 N i = 1 N | ( x i M o d e l i x i ) | × 100
Median Absolute Percentage Error M e d i a n A P E = m e d i a n   | ( x i M o d e l i x i ) | × 100
Percent Mean Bias Error M B E % = 1 N i = 1 N ( x i M o d e l i x i ) × 100
Mean Absolute Error M A E = 1 N i = 1 N | x i M o d e l i |
Table 2. Different combination of co-predictors used in the sensitivity analysis of inputs in the MLP performance.
DepthChlSATSSTDay of the YearLatLonADTGeostrophic U&V
TEST 1
TEST 2
TEST 3
TEST 4
TEST 5
TEST 6
Publisher’s Note: MDPI stays neutral with regard to jurisdictional claims in published maps and institutional affiliations.