Abstract
A large part of the archaeological remains still to be discovered and excavated are not in remote and depopulated areas of the earth but are often beneath urban centres that have buried them with centuries of debris and later constructions. Excavating in these contexts is much more complex than digging in rural or sparsely inhabited areas because of the constraints imposed by existing buildings and infrastructure. It should also be considered that within an urbanised area, any archaeological remains are concentrated in the subsoil of the historic centre, which is, therefore, often surmounted by buildings that are more recent than the remains but historical as well, and thus, of considerable value and vulnerability. For this reason, an archaeological excavation in an urban area must be preceded by a real feasibility study, where the potential risks for the structures above are minimised and accurately quantified. In many situations, as in the case under study, the discovery of a small segment of a structure is the only clue to reconstruct the development of the remaining part still to be excavated, which may stretch tens or hundreds of metres away from the measurable part. As a consequence, an error of a few centimetres in the survey of the excavated part can lead to errors of metres in estimating the positions of the far parts still to be excavated, and this, in many cases, as in the one under study, must absolutely be avoided. In practice, high-precision geomatic surveys, in support of the archaeological and historical interpretation of the observable structures, will help to establish the exact locations to possibly continue the excavations, helping the accurate planning of the excavation itself. Here, we have shown how the various techniques, compared to each other, have made it possible to reconstruct the location of a short stretch (less than 7 m) of the Emperor Augustus’ Sundial, the only currently visible evidence of a scientific instrument of imposing dimensions (tens of metres in length and height) that served to define some of the characteristics of the calendar that we still use today. The portion of the sundial currently observable, according to the most reliable hypotheses, is located approximately at one end of a structure and extends for several tens of metres. The accurate positioning of the observable parts in a geodetic reference system will enable to identify with certainty the possible areas in which excavation may continue and will also allow to accurately reconstruct the principle of operation of the sundial through an approach that could be defined as “reverse engineering” of the scientific instrument itself. The aim of this work is to study and thus define the combination and integration of existing geomatic techniques for this specific field of application.
1. Introduction
Some of the most important archaeological remains in the world are found underground in urban centres with a high population density where the succession of demolitions and reconstructions in subsequent periods has caused the progressive burial of archaeological remains. For example, in the centre of Rome, a specific rule of the Papal State imposed for centuries determined that new buildings had to be built on Roman foundations where possible, and over the centuries this has further complicated the present investigation and recovery of Roman structures. This stratification of building on buildings of different eras has, however, not only occurred in Rome or Italy but also in many other European and non-European countries, such as Egypt, Peru and Mexico, to name but a few; therefore, specific procedures are of great interest. These procedures could allow for "surgical" interventions as circumscribed and limited as possible in urban areas. This field of study, which starts from the analysis and comparison of existing technologies and methodologies, could lead to the definition of methods and/or specifications of any dedicated devices.
This paper illustrates the methodologies by which, with an integrated use of Geomatics techniques, it is possible to reconstruct the orientation and the absolute position in a global datum of poorly lit and difficult to access hypogeum spaces. The techniques are illustrated and discussed in general, analysing and evaluating the obtainable accuracy. Reference is then made to a case of application consisting of the survey of a portion of the so-called “Augustus sundial” in the subsoil of Rome.
There are two specific purposes of the sundial relief:
- To support with great geometric accuracy the evaluation of the feasibility of continuing the excavations, considering that a mere 5 mm inaccuracy in the positions of the visible points (that presently stretches for around seven metres) can lead to an uncertainty of about 0.4 m in the most distant part still to be discovered, which would be tens of metres from the part already excavated, so lower accuracy could be inadequate;
- To allow the reconstruction of the observable geometric characteristics of the sundial in order to evaluate the possibility of a rigorous mathematical and astronomical reconstruction of the sundial’s functioning during a subsequent phase of research.
More generally, the aim of this research is to evaluate various geomatic techniques for this specific field of application, among which the comparison between laser scanning techniques (more consolidated) and photogrammetric techniques based on the more recent and less consolidated “structure from motion” (SFM) approach that is of particular interest [1].
The survey of an archaeological artifact such as the Sundial of Augustus, with its historical, archaeological and scientific importance unique in the world and in history, requires results that are at least as accurate as those that were used in its realisation. The task is obviously much more complex today, since the sundial itself is no longer on the walking surface of an unbuilt area, as it was at the time of its realisation, but about seven metres below the current ground level in a densely urbanised area [2,3].
The problem of georeferencing archaeological sites in an absolute reference system, for the purpose of reconstructing important parameters such as the orientation of roads or construction axes with respect to the north, is normally dealt with through GNSS measures for the framing phase, then integrated for the detail survey by other geomatics techniques (e.g., total stations, digital photogrammetry or TLS—Terrestrial Laser Scanning) [4,5,6]. Other methodologies could be used, such as handheld mobile laser [7,8], but the achievable accuracy cannot be adequate to our aim.
For the GNSS geodetic network, the quality of which is decisive because it is the first phase of the survey, relative positioning measurements are carried out with respect to external framing networks [9] and/or local known points, performed with post-processing or real time techniques, depending on the degree of accuracy to be achieved.
The detailed survey can be performed using several techniques to obtain precise and reliable results. In this work two different approaches were carried out and compared; moreover, the final results can be integrated [10,11,12]. The TLS has the capacity to scan and map the environment in a significantly shorter time, especially if compared to the traditional archaeological survey techniques [13,14]. On the other hand, photogrammetry is widely used for modelling and documenting large and complex archaeological sites [15,16], even when located in critical situations such as in underground [17] and underwater environments [18].
The connection to external reference networks and known vertices is relatively easy when the archaeological site is outdoors, with a good visibility of the satellites and the possibility of carrying out GNSS measurements directly on the site. The operations are considerably more complex when the site is made up of underground compartments, in which GNSS measurements cannot be performed directly. In these cases, it is necessary to provide a two-level framing network: a GNSS geodetic network of absolute georeferencing outside, and a secondary network measured with topographic instruments (e.g., total stations) to connect the underground spaces to the GNSS external framing network [19].
If the underground-external connection is long and complex, due to the conformation of the underground spaces to be surveyed and the other rooms and corridors that give access to them, the geodetic network structured on two levels will be necessarily very complex. Such a complex network, often comprising a large number of vertices, requires a very careful design and execution in order to limit the propagation of measurement errors, which can lead to insufficient accuracy for the survey purposes [20].
The article will first describe the historical, cultural and scientific importance of the Augustus Sundial, after which the two survey campaigns and the specific methodologies used will be described and the estimated error parameters will be presented; the surveys will then be compared with each other and the final deviations described.
Uniqueness and Historic Introduction of the Site
This important archaeological element, linked to the Roman identity and its classical past, was built in the area of Campus Martius in 9 B.C., the area chosen for the construction of most of the urban plans of the imperial age [21]. Historically an unhealthy swamp, often subject to the Tiber flooding or used for military exercises and electoral rallies, Campus Martius quickly became the privileged area for new monuments celebrating the apotheosis of emperors and their families [22]. Augustus’ mausoleum, the Ara Pacis and the solar meridian together with the obelisk, formed a monumental complex with rather a great symbolic value for those times (Strab. V 3.8).
The solar meridian should have proved the validity of the edict that Augustus himself promulgated to remedy the disastrous state of the Roman calendar. The Numan calendar was the first Roman calendar we have certain sources of. It was a lunisolar calendar that did not follow the Sun nor the Moon and it lost, on average, one day each year [23]. Moreover, due to the incorrect application of the intercalations, whose management was entrusted to the Pontifex Maximus, in 46 B.C. it anticipated the solar year by 90 days, a whole season. Caesar achieved the realignment by adding 67 days to the Numan intercalation. The annus confusionis, as 46 B.C. was renamed, was, therefore, composed of 15 months, for a total of 445 days (Suet. Iul. 40.1).
Caesar then opted for a solar calendar, the Annus Iulianus, composed of 365 days which were divided into 12 conventional months. To link the new calendar to the tropical year, whose duration had been estimated by Egyptian astronomers to be 365 days and 1/4, it was decided to intercalate one day every four years. With the doubling of February 24, the dies bis sextus—which gave the leap year its name—was obtained [24].
Despite the simplicity of this solution the Pontifex Maximus, which was already responsible for the ruin of the Numan calendar, it misinterpreted the Julian reform: the leap day was added every three years instead of four years. The error lasted from 45 to 9 B.C., the year of Augustus’s solution: during this time there were 12 three-year intercalations, instead of nine four-year intercalations, which caused the loss of three days [24].
In Rome, the mistake was noticed, but they could only solve the problem after 36 years. For an ideal revision, they were in fact waiting for a year in which the “three-year intercalation”, which was mistakenly used until then, would match with the “four-year intercalation”, the solution provided by Caesar. The concomitance occurred three times: in 33 B.C. during the fratricidal war between Antonio and Octavian, when Lepidus, the third triumvirus accused of double-dealing, was exiled with the title of Pontifex Maximus. He still held this function in 21 B.C., when Augustus already controlled Roman politics. The perfect time to intervene in the calendar occurred in 9 B.C. because, with the death of Lepidus three years earlier, the title of Pontifex Maximus passed into the hands of Augustus, who now cumulated both political and religious powers. Legitimised by the sacred investiture, Augustus promulgated an edict that corrected the erroneous application of the Julian reform. He ordered the suspension of the leap year intercalations three times, a solution that guaranteed the recovery of the three lost days. The leap day was omitted in 5 and 1 B.C., then in 4 A.D.: with the intercalation of 8 A.D., the Julian reform finally came into effect [23].
Roman mathematicians had the task of devising a new type of instrument that would demonstrate to the world the reliability of the Augustan edict. In Naturalis historia, Pliny describes that on the solar meridian built in the Campus Martius, the shadow cast by an obelisk would indicate the succession of days, settling in correspondence of each single rule at noon each day. The shadow would eventually attest its return to the same point after a leap cycle. It would reach its maximum length at the winter solstice, when the Sun assumes, compared to the other half-days of the year, the least possible declination. On the contrary, it would gradually shorten, becoming the shortest at noon of the summer solstice (Plin. NH. XXXVI 72-73).
In addition to this, Pliny refers that the sundial unexpectedly stopped working just a few years after it was built, perhaps due to an earthquake or a flood of the Tiber. In any case it would seem that Pliny did not see the sundial himself, because he does not know the reason why it stopped working. Heslin suggests that the sundial floor, found covered with a waterproof layer of earthenware, began to serve as a water cistern [25].
As for the obelisk described by Pliny and used as a gnomon, it was brought to Rome in 10 B.C., together with a second obelisk, now visible in Piazza del Popolo (Rome). Moved from its original site, Heliopolis (Egypt), the obelisk had been carved from a red granite block almost 22 m high, at the behest of Pharaoh Psamtic II, in the VI century B.C. Once transported in Rome, its base was enriched by two identical inscriptions that highlight Augustus’ devotion to the figure of the Sun god. On its top, a metal sphere was placed to direct the shadows on the correct rule of the solar meridian. After Pliny’s testimony, it is believed that the obelisk fell in 1084, following the days of sacking that the Norman troops, led by Robert Guiscard, perpetrated in the streets of Rome.
Starting from the modern age, both the sundial and the obelisk are linked to the history of the religious complex of San Lorenzo in Lucina. From some notes left by Antonio Lelio we have knowledge that the obelisk was first glimpsed in 1512 in the house of a barber during the realisation of a sewer. In 1587, following the request made by Sixtus V for an archaeological investigation, Vacca and Lauro reported that the obelisk had been broken into several pieces and ruined by fire. In 1748, taking advantage of the demolition of some houses overlooking Largo dell’Impresa, Benedict XIV finally ordered the recovering of the obelisk. In order not to lose the memory of the place where it was found, a marble plaque was affixed above the portal of the new building. On that occasion, the architect Tommaso De Marchis made a detailed description of the monolith. The report is useful to reconstruct the obelisk height from the ground, without the metal gnomon, and its original position. The obelisk was restored with the pieces of the Antonine column; then, it was raised and placed in the square of Montecitorio in 1792.
The history of the solar meridian finds is different. Many scholars of the 16th century (reinterpreted and spread a bad transcription of some notes written by a student of the humanist Pomponio Leto in 1484. This misunderstanding fuelled for centuries the theory of the existence of a great sundial that would have marked the daily hours and whose floor would have extended for most of the Campus Martius. Giovan Battista De Rossi, a 19th century archaeologist, found and published the original version of the Pomponians’ notes and dismantled the theory of the big sundial. According to him, the student did not glimpse the floor of the solar meridian beneath the residence of the chaplains but far from the church and in the further south of the religious complex [26].
The part of the solar meridian we know today is due to the efforts of Edmund Buchner, president of the Deutschen Archaeologischen Instituts. In 1976, he suggested the possibility that the obelisk once acted as a gnomon for a vast horologium, despite the evidence offered by De Rossi [27]. Buchner undertook several archaeological investigations that led to positive results in 1979. A section of marble floor, with a sundial line and bronze letters, came to light at a depth of about six metres from the street level, at number 48 in Via di Campo Marzio. The pavement is composed of large square stones, it is 5.4 m wide and it extends for a maximum length of 7.5 m. Subsequent excavations, as well as the uncovered section of meridian itself, offer no clues about the possibility that it was part of a larger structure used for measuring the daily hours. The floor is, in fact, crossed throughout its length by a bronze line, placed in a south-north direction, interspersed with 28 rules [28]. As described by Pliny in Naturalis historia, each of these rules concretises a couple of days that the shadow would indicate on the way back and forth, between the summer solstice and the winter solstice.
The floor is enriched with inscriptions in ancient Greek: on the eastern side, where the notches indicated the daily progress of the shadow until the winter solstice, it is possible to read the zodiac signs Leo, [ΛΕ]ΩΝ (Leon), and Virgo, ΠAΡΘ[ΕΝOΣ] (Partenos). On the western side of the sundial line there are the zodiac signs Aries [ΚΡΙ]OΣ (Krios) and Taurus ΤAΥΡ[OΣ] (Tauros). It is assumed that the double distance between the two solstices was not only divided into 360 parts, each one corresponding to 1° ecliptic, but also into 12 sections of 30° or 30 notches each, representing the constellations of the Zodiac [29].
Two other inscriptions complete the section: the first, ΕΤHΣΙAΙ ΠAΥOΝΤAΙ (ethesiai pauontai), divides the signs of Leo and Virgo and indicates the period of the year when the ethesies, which are periodic winds that blow towards the end of July, cease; the second inscription, ΘΕΡOΥΣ AΡΧH (therous arke), identifies the point at the beginning of the summer, towards the end of Taurus, in late May. Auber links these inscriptions to the parapegmata, astro-meteorological calendars widespread in ancient Greece, which indicated different periods of the year through easily observable celestial and meteorological phenomena [30]. In one parapegmata in particular, the one made by the Greek astronomer Euctemon between the fifth and fourth century B.C., two sentences exactly coincide with the indications found on the sundial of Augustus: the end of the ethesii winds, with an advance of 12° of ecliptic and therefore 12 rules, and the beginning of the summer, with an advance of 2° of ecliptic.
2. Materials and Methods
In the present case, the survey of the underground cavity in which a section of the sundial is visible was carried out using a combination of satellite and terrestrial techniques due to the complexity of the site. The measures were repeated two times, in January 2017 and April 2018.
The methodological criteria for the execution of the measures and the processing of the resulting data, which can be assumed as a reference for a survey context as that described in the introduction, are presented in the following section.
2.1. GNSS Network
To provide coherent and comparable results with official cartography and astronomical data, the survey has to be referred to an absolute global datum. In Italy, the datum currently officially adopted for the mapping and surveys of public administrations (and consequently the de facto standard) is the ETRF2000 realisation of the ETRS89 datum, referring to the conventional date of 1 January 2008 (epoch 2008.0).
In order to insert the local GNSS network in that datum, it is necessary to connect the survey to several points whose coordinates are known in ETRF2000. In the present case, four permanent stations of the Lazio Region GNSS network were used (Figure 1a), the characteristics of which are summarised in Table 1 [31]. These points can be assumed to have an accuracy less than 1 cm in the ETRF2000 datum [32].
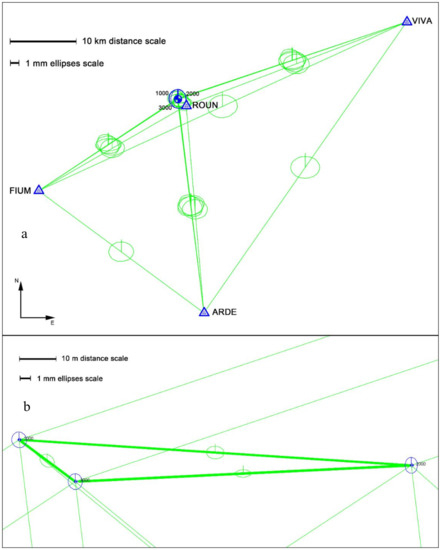
Figure 1.
Reference network (Lazio GNSS permanent stations, ETRF2000) (a), detail of the local GNSS network (Rome, Piazza del Parlamento) (b).

Table 1.
GNSS permanent stations utilised for the ETRF2000 datum connection.
In the Piazza del Parlamento, the closest site to the Augustus sundial which, has a good satellite visibility, a local GNSS network (Figure 1b) was measured, consisting of three stations (1000, 2000 and 3000), in which three GPS + GLONASS dual frequency geodetic receivers (two Topcon GR-5 and one Topcon Legacy GGD with Legant-E antenna) have been placed. In this local network, the receivers were kept on acquisition for over 4 h in static mode, with a sampling interval of 5 s and a 15° cut-off angle.
The vertices of the network (GNSS and total station, see Section 2.2) were materialised on the ground with markers. For each measurement session, a tripod was placed on each vertex; the tripods were not moved until the end of all measures. On each tripod was mounted a Leica/Wild precision tribrach (forced centring device), mounting on it alternatively a GNSS receiver, a total station or a precision target. Therefore, the horizontal and vertical centring accuracy in the network (GNSS and total station) can be estimated at about ±1 mm.
A post-processing calculation was then carried out on the acquired data with Topcon Tools software (version 8.2.3), computing the local network separately and together with the external network including the 4 stations of the Lazio GNSS network (ETRF2000), which were finally assumed as fixed. Figure 1 and Figure 2 show the final configuration of the external segment and of the internal/underground segment of the network.
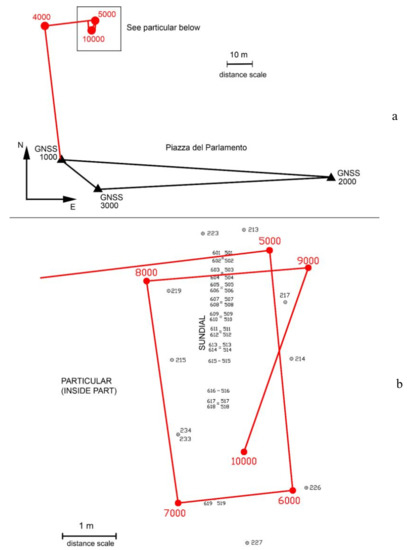
Figure 2.
Topographic three-dimensional (3D) network: general layout (a) and detail of the internal/underground part (b).
From the post-processing calculation and the subsequent least squares adjustment, the three GNSS vertices in Piazza del Parlamento (Parliament’s square) have been determined in the ETRF2000 datum (Figure 2a). For the horizontal coordinates, slightly over 1 mm were obtained; for the vertical coordinates, standard ellipses were obtained with semiaxes with a height of about 2 mm. Such uncertainty regions can be derived by the variance-covariance matrix of the adjusted coordinates of the local geodetic network [33].
In addition to the solution described above, two more have been developed: a second solution considering only the closest permanent station (ROUN), and a third considering all four Lazio stations but assuming only ROUN as fixed. The differences between the coordinates obtained from the three different solutions are very small (1–2 mm), so the first solution with the four permanent stations all constrained was taken as final.
The altimetric positions obtained for the vertices 1000, 2000 and 3000 are ellipsoidal heights in the ETRF2000 datum. To convert them to orthometric heights, the ITALGEO2005 national geoid model was utilised, interpolating the grid files provided by the Italian Military Geographical Institute. From this model, the mean geoid height in Piazza del Parlamento was 48.11 m (Figure 3).
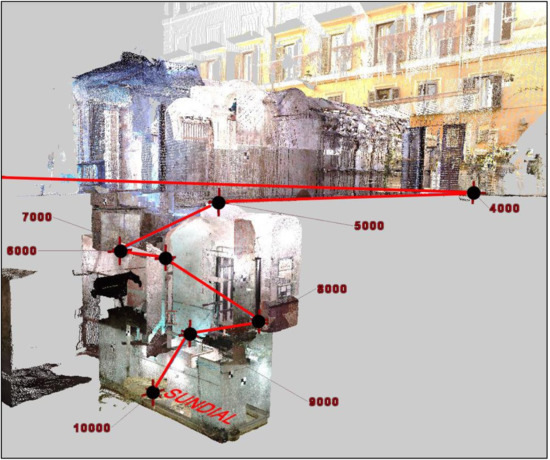
Figure 3.
Perspective view of the internal/underground part of the local geodetic network superimposed to LIDAR survey.
2.2. Local Geodetic Network
To connect the GNSS network measured in Piazza del Parlamento to the underground room where the remains of the sundial emerge, a three-dimensional local geodetic network was created (Figure 2a). It is a three-dimensional traverse that includes 10 vertices and has been measured twice, back and forth.
The vertices of this network are located as follows:
- 1000, 2000 and 3000 in Piazza del Parlamento (coincident with three GNSS stations).
- 4000 in front of the entrance to the building including the sundial (Via di Campo Marzio).
- 5000, 6000, 7000, 8000, 9000 and 10,000 inside the building (10,000 in the sundial room).
- The instrument used is a Leica TS06 total station, with the following specifications:
- Angular accuracy (ISO 17123-3) ± 2″ (0.6 mgon)
- Distance accuracy (ISO 17123-4) ± (1.5 mm + 2 ppm) on reflector prism± (2.0 mm + 2 ppm) on opaque surfaces
A planimetric scheme of the topographic network (enlarged for the internal part) is shown in Figure 2a.
The sundial room is located about 7 m underground with respect to external areas (Via di Campo Marzio, building entrance). To reach it from outside, the only possible path is through some narrow corridors and stairs going down. Thus, the network has a marked three-dimensionality, which is better visible in a perspective representation (Figure 3).
A network with such a particular conformation, characterised by short and sloped legs, involves special operative problems. In particular, a very high accuracy in centring is required, and the collimation targets must be of a type suitable for short distances. For this reason, Leica GMP101 mini prisms and Wild precision collimation targets GFZ11 were used.
The measurements on the 10-vertices network (traverse) were performed twice in both directions (back and forth). All total station measurements (horizontal/vertical angle, distance) were repeated three times in the straight position and three times in the reverse position of the instrument.
The GNSS vertices (1000, 2000 and 3000) were assumed as known and fixed on the coordinates resulting from the computation described at paragraph 2.1 (ETRF2000, UTM33N projection). The traverse adjustment was performed in two distinct modes:
a—back and forth measures assumed as independent, processing a continuous traverse (stations were given different names in the back and forth path);
b—all measures adjusted together (stations were given the same names in the back and forth path).
The coordinate differences between the two computations described above are summarised in Table 2.

Table 2.
Differences between adjustments modes a and b, values in metres.
The network adjustment has provided ellipse semiaxes of less than 1 cm: the detail referring to the solution b (assumed as final) is shown in Table 3. The unavoidable propagation of errors proceeding from the GNSS vertices to the underground spaces is visible; however, the uncertainty parameters are contained within 1 cm for the most distant points.

Table 3.
Traverse adjustment (solution b): standard ellipses, values in metres and degrees.
From the stations 4000 to 10,000, a suitable number of targets (checkerboard opaque plates) were measured; such points are used for the orientation of the subsequent surveys (TLS and digital photogrammetry).
From station 10,000 in the underground room were directly measured the points of intersection between the longitudinal metal band of the sundial and its transversal notches (Figure 2b). These measures were executed on both sides of the band, in order to be able to compute the sundial axis coordinates by a mean of two points on its sides.
After the computation sequence described above, all points (network vertices, targets, sundial axis) were determined in the ETRF2000 datum, UTM33N projection, and orthometric heights.
2.3. TLS Survey
A laser scanner survey was performed in the sundial room and in the parts of the building along the three-dimensional (3D) traverse path. The scans were performed with a FARO Focus 3D X130 phase-difference laser scanner [34]. The average density of the TLS measured points in the sundial compartment, due to the short instrument–object distances, is very high (mean distance between contiguous points of about 1.5 mm), giving a very detailed representation in the form of a high-density point cloud.
In total, 12 scans (4 of which were repeated in the 2018 survey) were performed from different positions, proceeding from the outside of the building (near station 4000) down to the underground compartment, including the sundial remains.
The laser scanner data processing was performed with the Leica Cyclone version 9.1 software. The point clouds obtained from the individual scans were joined to one point cloud (Figure 4 and Figure 5). The relative orientation between the point clouds was performed by means of an adequate number of targets (opaque plaques with a checkerboard pattern) and a set of six calibrated spheres of 145 mm in diameter. The target and sphere layout was organised so that between a scan and the adjacent one there were at least four targets and three spheres in common.
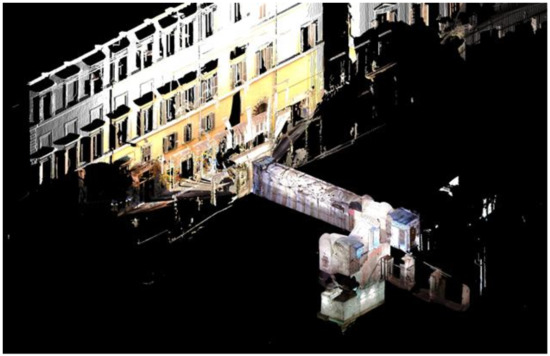
Figure 4.
Assembled point cloud, perspective view.
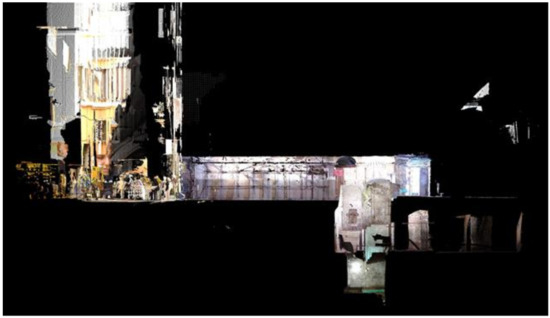
Figure 5.
Assembled point cloud, section view.
The absolute orientation of the assembled point cloud was obtained by means of the three-dimensional coordinates of the targets, known from the previous phases of the survey (see Section 2 and Section 3) in the ETRF2000 datum. Thus, the TLS survey results georeferenced in the ETRF2000 datum (UTM33N coordinates and orthometric heights).
The scans produced a three-dimensional model of the inner space including the visible part of the sundial (Figure 6). On this 3D model, the points of intersection between the longitudinal metal band of the sundial and the transversal notches have been measured, similarly to what had been done directly with the total station.
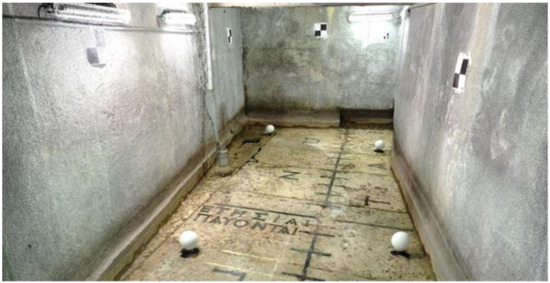
Figure 6.
View of the point cloud in the sundial underground room.
An evaluation of the accuracy of the laser scanner survey, and of the congruence between it and the topographic and GNSS measurements, can be obtained from the values of the absolute orientation residuals on the target coordinates, assumed as known. The results are presented in Table 4: the maximum residual on the target used for the orientation (marked with “On” in the table) is about 4 mm; for the control target (marked with “Off”, not used for the orientation) the maximum value is 13 mm.

Table 4.
Absolute orientation residuals on targets, values in metres.
Table 5 shows the differences between the coordinates of the band axis points obtained from the direct survey (total station) and from the measures on the 3D TLS model. The differences are less than 5 mm, in good agreement with the accuracies of the methods described above.

Table 5.
Sundial metal band survey: coordinates differences (total station vs. TLS), values in metres.
2.4. Photogrammetric Survey
Beside the laser scans, a photogrammetric survey was carried out in the sundial room; this survey was performed by a NIKON D800E full frame calibrated camera equipped with a lens of 20 mm nominal focal length [35]. The photogrammetric project consists of 161 images taken, keeping the focus locked at a constant distance. The calibration procedure was carried out using a circular coded target calibration test-field, holding the same focus length of the survey [36]. All the images were oriented by means of the software Agisoft Metashape version 1.5.0, obtaining a maximum re-projection error of 1.1 pixel and an RMS (Root Mean Square) of 0.16 pixel. The scaling process was handled using some targets, measured by a total station, and by a high precision steel calibrated scale bar of 800 mm (±0.05 mm). Specifically, four targets have been used as GCPs (Ground Control Points), with the aim to contain the deformations of the photogrammetric model; such deformations were estimated by means of two other targets used as CPs (Check Points) [37]. The maximum errors obtained on GCPs and CPs have been 3 mm and 8 mm respectively, while the error on the calibrated scale bar has been 0.5 mm; after that, the bundle block adjustment procedure was completed.
Once the photogrammetric model was correctly scaled, the image matching process was executed with the aim to obtain a dense cloud point: a different density can be attained from this procedure, according to the purpose of the survey. In this work, low quality was chosen for the building of dense cloud points: a total of 6.5 million points were obtained, corresponding to a density of two points per millimetre, more than sufficient for the survey purpose.
Ground control point and check point coordinates used for the photogrammetric survey were expressed in a local reference system. At a later time, the total station survey has been linked to ETRF 2000-RDN reference system described in Section 2. (GNSS network).
The obtained 3D dense point cloud is shown in Figure 7.
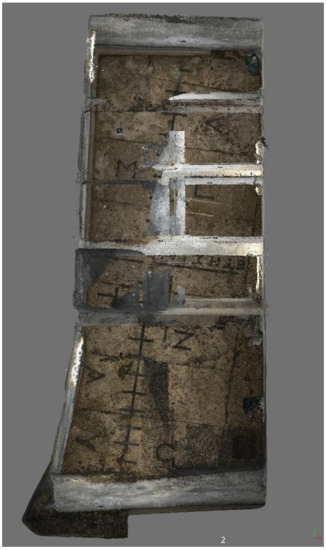
Figure 7.
Dense point cloud obtained by photogrammetric survey.
3. Results
The comparison between the two 3D models obtained with laser scanner and photogrammetry was performed by CloudCompare software using seven pairs of homologous points [38]; such points have been selected on the walls and on the floor, where there was no noise in the laser point cloud caused by the presence of small pools of water that wrongly reflected laser signal.
The results of the comparison performed between the two 3D models after the registration phase do not reveal significant differences for the two point clouds; even with other registration options such as ICP with or without scale factor, the RMS on the relative distances is 0.007 m (Figure 8).
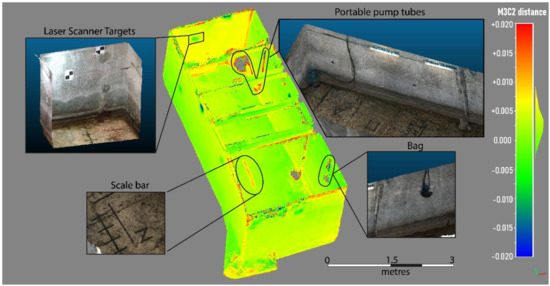
Figure 8.
Comparison between two point clouds.
In all cases, the only differences highlighted are mostly due to temporary items present during the surveys:
- The calibrated scale bar used for photogrammetric survey.
- The targets placed on the walls during laser scanner survey.
- The tubes of the portable pump used for drying the floor from groundwater during laser scanner survey.
- A bag hung on the eastern wall.
Both 3D models have generated a digital orthophoto of the floor, where it is possible to determine the coordinates of the mark points relative to the gnomon shadow projected by the sun in the different days of the year. Such coordinates can be compared with those obtained by the total station (Figure 9).
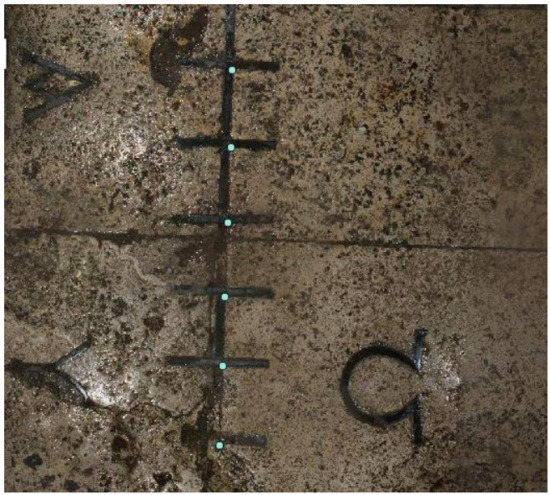
Figure 9.
Detail of points measured on the sundial track.
4. Discussion
As we explained in the introduction, the expected results of this work were twofold: the correct survey of the sundial site and the comparative evaluation of various techniques in the specific field of application. For this second task, particular attention has been given to the comparison between the most consolidated laser scanning techniques and those based on photogrammetry with the SFM approach more recent and less investigated.
The survey of the sundial allowed to obtain accuracies that will guarantee the reconstruction of the positions of the parts still to be excavated with accuracies from decimetric to submetric, which are sufficient to adequately design the feasibility of the excavation. In particular, it will be very interesting to verify whether some of the buildings in the area have based their foundations on the base of the sundial itself at the time of construction, as some alignments still observable today would suggest. Such overlapping, if verified, would make the excavation of some segments of the sundial very complex technically and probably impossible.
As far as the comparison between the geomatic methodologies used is concerned, it has been verified that the greatest accuracy is provided by a polygonal supported by temporary points surveyed immediately afterwards with double frequency GNSS receivers, because the materialisation of the ground points with topographic markers does not guarantee sufficient accuracy of the framing points. On the other hand, in the historical centre of a city of art, it is not possible to monumentalise control points with the classic forced centring pillars. The comparison between TLS and photogrammetry with the SFM approach shows that they are equivalent, both having pros (speed of execution and processing of clouds for TLS and easy survey and low-cost equipment for photogrammetry) and cons (high cost of instrumentation and logistic complication for TLS and longer processing phase for photogrammetry).
5. Conclusions and Further Developments
This work has shown how geomatic techniques, from the most consolidated to the most modern ones, can be a support for the planning of excavations in urban areas. The comparison between the various surveys lead to compare them reciprocally and also absolutely, considering that many of the surveys have been fully repeated using different settings.
During the first survey, the GNSS framing network, constrained by the presence of buildings, showed error ellipses on the single points of 1–2 mm. The total station survey, based on the same GNSS points, showed an accuracy with maximum deviations of one centimetre. Finally, the comparison of the laser scanning survey (always based on the same GNSS points) with the points measured with the Total Station showed millimetric differences. In the second survey, performed only by photogrammetry, the precision and accuracy were evaluated in 3 and 5 mm, respectively.
The comparison between the results of the first and second survey in terms of the point cloud is between 2.5 and 5 mm.
These results allow to estimate errors of a maximum of one centimetre for these types of reliefs, which, on the one hand, show a great achievable accuracy, while on the other hand, could be considered barely sufficient considering the original accuracy with which the sundial was built.
It must also be considered that even small errors on the measurement of the short distance (less than 7 m) currently observable can lead to much larger errors in the reconstruction of position and size of the entire sundial.
In the coming months, the results of this research will allow to define with greater accuracy the positions of any other portion of the sundial (if still existing) and to verify or rebut with greater certainty the various hypotheses on the functioning of the sundial itself. In fact, the position and the height of the obelisk will be obtained considering the distances among such marks together with celestial coordinates of the sun at the epoch of the sundial construction. This will be the task of a future paper still to be published.
Author Contributions
Conceptualization, V.B., R.B., S.D.P., F.G., M.O., F.R., A.S., G.T., S.T. and M.B.; Supervision, V.B., R.B., S.D.P., F.G., M.O., F.R., A.S., G.T. and S.T.; Methodology, V.B., R.B., S.D.P., F.G., M.O., F.R., A.S., G.T., S.T.; Investigation, V.B., R.B., S.D.P., F.G., M.O., F.R., A.S., G.T. and S.T.; Writing—Review and editing, V.B., R.B., S.D.P., F.G., M.O., F.R., A.S., G.T. and S.T. All authors have read and agreed to the published version of the manuscript.
Funding
This research was partially financed by the Sapienza University of Rome with grant number: RP116154CAB03C80.
Acknowledgments
The authors would like to thank Felicia Vatore and Eng. Felicia Monti for their kind help during the measurement campaigns.
Conflicts of Interest
The authors declare no conflict of interest.
References
- Ullman, S. The interpretation of structure from motion. Proc. R. Soc. Lond. B 1979, 203, 405–426. [Google Scholar] [CrossRef] [PubMed]
- Baiocchi, V.; Barbarella, M.; D’Alessio, M.T.; Lelo, K.; Troisi, S. The sundial of Augustus and its survey: Unresolved issues and possible solutions. Acta Geod. Geophys. 2016, 51, 527–540. [Google Scholar] [CrossRef]
- Albèri Auber, P. Reconstructing Augustus’ Montecitorio obelisk: A gnomonist’s point of view. In The Horologium of Augustus: Debate and Context; Haselberger, L., Ed.; Journal of Roman Archaeology: Portsmouth, RI, USA, 2014; pp. 62–76. [Google Scholar]
- Guarnieri, A.; Vettore, A.; Camarda, M.; Costantino, D. Automatic registration of large range datasets with spin-images. J. Cult. Herit. 2011, 12, 476–484. [Google Scholar] [CrossRef]
- McPherron, S.J.P. Artifact orientations and site formation processes from total station proveniences. J. Archaeol. Sci. 2005, 32, 1003–1014. [Google Scholar] [CrossRef]
- Dibble, H.L. Measurement of artifact provenience with an electronic theodolite. J. Field Archaeol. 1987, 14, 249–254. [Google Scholar]
- Masiero, A.; Fissore, F.; Guarnieri, A.; Pirotti, F.; Visintini, D.; Vettore, A. Performance Evaluation of Two Indoor Mapping Systems: Low-Cost UWB-Aided Photogrammetry and Backpack Laser Scanning. Appl. Sci. 2018, 8, 416. [Google Scholar] [CrossRef]
- Kersten, T.P.; Lindstaedt, M.; Starosta, D. Comparative geometrical accuracy investigations of hand-held 3D scanning systems—An update. Int. Arch. Photogramm. Remote Sens. Spatial Inf. Sci. 2018, 42, 507–514. [Google Scholar] [CrossRef]
- Barbarella, M. Digital technology and geodetic infrastructures in Italian cartography. Citta e Storia 2014, 9, 91–110. [Google Scholar]
- McPherron, S.J.; Dibble, H.L.; Goldberg, P. Z. Geoarchaeology 2005, 20, 243–262. [Google Scholar] [CrossRef]
- Nex, F.; Rinaudo, F. LiDAR or Photogrammetry? Integration is the answer. Ital. J. Remote Sens. 2011, 43, 107–121. [Google Scholar] [CrossRef]
- Baltsavias, E.P. A comparison between photogrammetry and laser scanning. ISPRS J. Photogramm. Remote Sens. 1999, 54, 83–94. [Google Scholar] [CrossRef]
- Albrecht, C.M.; Fisher, C.; Freitag, M.; Hamann, H.F.; Pankanti, S.; Pezzutti, F.; Rossi, F. Learning and Recognizing Archeological Features from LiDAR Data. In Proceedings of the 2019 IEEE International Conference on Big Data (Big Data), Los Angeles, CA, USA, 9–12 December 2019; pp. 5630–5636. [Google Scholar]
- Grussenmeyer, P.; Alby, E.; Assali, P.; Poitevin, V.; Hullo, J.F.; Smigiel, E. Accurate Documentation in Cultural Heritage by merging TLS and high resolution photogrammetric data. In Proceedings of the SPIE—The International Society for Optical Engineering, Munich, Germany, 23–26 May 2011; p. 8085. [Google Scholar] [CrossRef]
- Guidi, G.; Russo, M.; Ercoli, S.; Remondino, F.; Rizzi, A.; Menna, F. A multi-resolution methodology for the 3D modeling of large and complex archeological areas. Int. J. Archit. Comput. 2019, 7, 39–55. [Google Scholar] [CrossRef]
- Pavelka, K.; Šedina, J.K., Jr. Combined precise documentation and virtual reconstruction of Prophet Nahum shrine in Alqosh, Iraq. ISPRS-Int. Arch. Photogramm. Remote Sens. Spatial Inf. Sci. 2019, 42, 909–913. [Google Scholar] [CrossRef]
- Alessandri, L.; Baiocchi, V.; Del Pizzo, S.; Di Ciaccio, F.; Onori, M.; Rolfo, M.F.; Troisi, S. A flexible and swift approach for 3D image–based survey in a cave. Appl. Geomat. 2020. [Google Scholar] [CrossRef]
- Skarlatos, D.; Menna, F.; Nocerino, E.; Agrafiotis, P. Precision potential of underwater networks for archaeological excavation through trilateration and photogrammetry. Int. Arch. Photogramm. Remote Sens. Spatial Inf. Sci. 2019, 42, 175–180. [Google Scholar] [CrossRef]
- Matracchi, P.; Radicioni, F.; Stoppini, A.; Tosi, G. The cathedral of s. Lorenzo in Perugia and the hypogeal spaces. Geomatic techniques for spatial investigations aimed at the knowledge and interpretation of the origin of the transept. ISPRS Ann. Photogramm. Remote Sens. Spat. Inf. Sci. 2019, 42, 849–856. [Google Scholar] [CrossRef]
- Troisi, S.; Baiocchi, V.; Del Pizzo, S.; Giannone, F. A prompt methodology to georeference complex hypogea environments. Int. Arch. Photogramm. Remote Sens. Spat. Inf. Sci. 2019, 42, 639–644. [Google Scholar] [CrossRef]
- Coarelli, F. Il Campo Marzio occidentale. Storia e topografia. MEFRA 1977, 89, 842–843. [Google Scholar] [CrossRef]
- La Rocca, E. Augustus’ Solar Meridian and the Augustan Urban Program in the northern Campus Martius: Attempt at a holistic view. Horol. Augustus Debate Context JRA 2014, 99, 121–165. [Google Scholar]
- Polverini, L. Il calendario giuliano. In L’ultimo Cesare; Urso, G., Ed.; L’Erma di Bretschneider: Roma, Italy, 2000; pp. 245–258. [Google Scholar]
- Polverini, L. Augusto e il controllo del tempo. In Studi Su Augusto. In Occasione Del XX Centenario Della Morte; Negri, G., Valvo, A.G., Eds.; Giappichelli Editore: Torino, Italy, 2016; pp. 95–113. [Google Scholar]
- Heslin, P. Augustus, Domitian and the So-called Horologium Augusti. J. Roman Stud. 2007, 97, 16–17. [Google Scholar] [CrossRef][Green Version]
- De Rossi, G.B. Note di topografia romana, in Studi e documenti di Storia e Diritto, Pubblicazione periodica dell’Accademia di Conferenze Storico-Giuridiche; Tipografia della Pace: Roma, Italy, 1882; pp. 59–60. [Google Scholar]
- Buchner, E. Solarium Augusti und Ara Pacis; Römische Mitteilungen: Berlin, Germany, 1976; p. 345. [Google Scholar]
- Leonhardt, G. Horologium and Mausoleum Augusti: An overview of the fieldwork (1979–1997) and the existing documentation. Horol. Augustus Debate Context JRA 2014, 99, 101–106. [Google Scholar]
- Schütz, M. The Horologium on the Campus Martius reconsidered. Horol. Augustus Debate Context JRA 2014, 24, 43–51. [Google Scholar]
- Ing. Paolo Albéri Auber. Available online: https://www.ingauber-meridiane.it/ (accessed on 17 November 2020).
- Portale Della Rete GNSS Regione Lazio. Available online: http://gnss-regionelazio.dyndns.org/Spiderweb/frmIndex.aspx (accessed on 17 November 2020).
- Radicioni, F.; Stoppini, A. Umbria’s new multi-constellation GNSS network. GeoMedia 2019, 23, 6–11. [Google Scholar]
- Leick, A. Statistics in Least Square Adjustment. In GPS Satellite Surveying; John Wiley & Sons: Hoboken, NJ, USA, 1990; pp. 105–126. ISBN 978047181990-5. [Google Scholar]
- Radicioni, F.; Matracchi, P.; Brigante, R.; Brozzi, A.; Cecconi, M.; Stoppini, A.; Tosi, G. The Tempio della Consolazione in Todi: Integrated geomatic techniques for a monument description including structural damage evolution in time. In Proceedings of the ISPRS-The International Archives of the Photogrammetry, Remote Sensing and Spatial Information Sciences, Melbourne, Australia, 27 October 2017; pp. 433–440. [Google Scholar] [CrossRef]
- Baiocchi, V.; Barbarella, M.; Del Pizzo, S.; Giannone, F.; Troisi, S.; Piccaro, C.; Marcantonio, D. Augusto’s sundial: Image-based modeling for reverse engeneering purposes. Int. Arch. Photogramm. Remote Sens. Spatial Inf. Sci. 2017, 42, 63–69. [Google Scholar] [CrossRef]
- Fraser, C.S. Digital camera self-calibration. ISPRS J. Photogramm. Remote Sens. 1997, 52, 149–159. [Google Scholar] [CrossRef]
- Baiocchi, V.; Giannone, F.; Monti, F.; Vatore, F. ACYOTB Plugin: Tool for Accurate Orthorectification in Open-Source Environments. ISPRS Int. J. Geo-Inf. 2020, 9, 11. [Google Scholar] [CrossRef]
- Lague, D.; Brodu, N.; Leroux, J. Accurate 3D comparison of complex topography with terrestrial laser scanner: Application to the Rangitikei canyon (N-Z). ISPRS J. Photogramm. Remote Sens. 2013, 82, 10–26. [Google Scholar] [CrossRef]
Publisher’s Note: MDPI stays neutral with regard to jurisdictional claims in published maps and institutional affiliations. |
© 2020 by the authors. Licensee MDPI, Basel, Switzerland. This article is an open access article distributed under the terms and conditions of the Creative Commons Attribution (CC BY) license (http://creativecommons.org/licenses/by/4.0/).