1. Introduction
Space-borne interferometric synthetic aperture radar has the ability to detect subtle surface deformations with wide coverage and high resolution; thus, it has been widely used in a range of geophysical applications, such as earthquakes, landslides, subsidence, and other natural or man-made hazards [
1]. To overcome the limitations of temporal–spatial decorrelation and atmospheric effects in conventional interferometric synthetic aperture radar (InSAR) processing, multi-temporal InSAR (MT-InSAR) techniques, especially permanent scatterer interferometry (PSI) [
2,
3] and the small baseline method (SBAS) [
4], have been developed by using the time series analysis of a stack of interferograms. These advanced processing algorithms [
5] have achieved great success in obtaining ground deformation with high precision on the regional scale [
6,
7,
8,
9], and have made InSAR one of the most important remote sensing tools for risk prevention and monitoring.
With the rapid development of InSAR techniques, a large number of SAR satellite systems have been launched over the past few decades, including ERS-1/2, ENVISAT ASAR, Radarsat-2, TerraSAR-X, Cosmos-skyMed, ALOS-2/PALSAR-2, and Sentinel-1. The fast growth of SAR achieved with different bands and resolutions provided by these sensors has greatly facilitated InSAR data source accessibility. Among them, the C-band Sentinel-1 mission with medium resolution was originally designed for large-scale interferometric applications. The Sentinel-1 SAR data with Interferometric Wide Swath (IW) acquisition mode is characterized by its 250 km-wide swath, global coverage, and short revisit time (6 or 12 days) [
10,
11,
12]. Moreover, the European Space Agency (ESA) has adopted a complete, free, and open-access policy for all Sentinel-1 datasets [
13]. Thus, these abundant SAR images have greatly promoted the InSAR ground deformation monitoring from the regional to national scale.
Many researchers have exploited the large amount of InSAR data for wide areas and long time series investigations in recent years, and these successful applications have shown that the potential of InSAR large-scale deformation monitoring is promising. In 2015, funded by the Italian Ministry of the Environment, Costantini et al. [
14] first carried out national-scale InSAR research and processed all the ERS and ENVISAT SAR scenes to generate deformation results for the entire Italian territory. Haghighi et al. [
15] studied large-scale Sentinel-1 interferometry over Germany and assessed the perspective of national-scale deformation analysis. Shamshiri et al. [
16] generated large-scale Sentinel-1 interferograms over Norway by concatenating consecutive frames along the specific orbit and studied the tropospheric correction for the interferograms by using nationwide Global Navigation Satellite System (GNSS) measurements. Raspini et al. [
17] developed an automatic Sentinel-1 InSAR processing system for deformation generation and risk evaluation, and the software system was applied in disaster monitoring for the Tuscany region.
Many open-source software packages have been widely used for Sentinel-1 InSAR processing, including SNAP [
18], GMTSAR [
19], STAMPS [
20], GIANT [
21], MintPy [
22], etc. Some researchers have also developed their own InSAR processing systems based on the combination of these software packages [
23]. However, effectively exploiting the massive volume of Sentinel-1 data over wide areas has posed a great challenge for these InSAR tools. Currently, Sentinel-1 provides approximately 10 TB of SAR products per day [
24], and time series SAR images are more than 1 TB in size per scene. Moreover, the total volume of national-scale SAR archives has reached the PB level. The surge in InSAR data volume has caused not only a demand for more storage devices and computing resources, but also a drastic increase in processing burden and complexity. In this sense, the InSAR data nowadays can be regarded as remote sensing big data. To address the InSAR big data problem, modern advanced high-performance computing (HPC) infrastructure, such as cloud and cluster computing, has been employed to improve the efficiency of InSAR processing [
25,
26,
27,
28]. As conventional InSAR algorithms were originally developed for sequential processing, some parallel computing-based methods, such as the Parallel Small BAseline Subset (P-SBAS) [
29,
30], have been proposed to better-exploit the cloud computing environment. The results have demonstrated the feasibility and effectiveness of parallel computing in InSAR large-scale deformation monitoring.
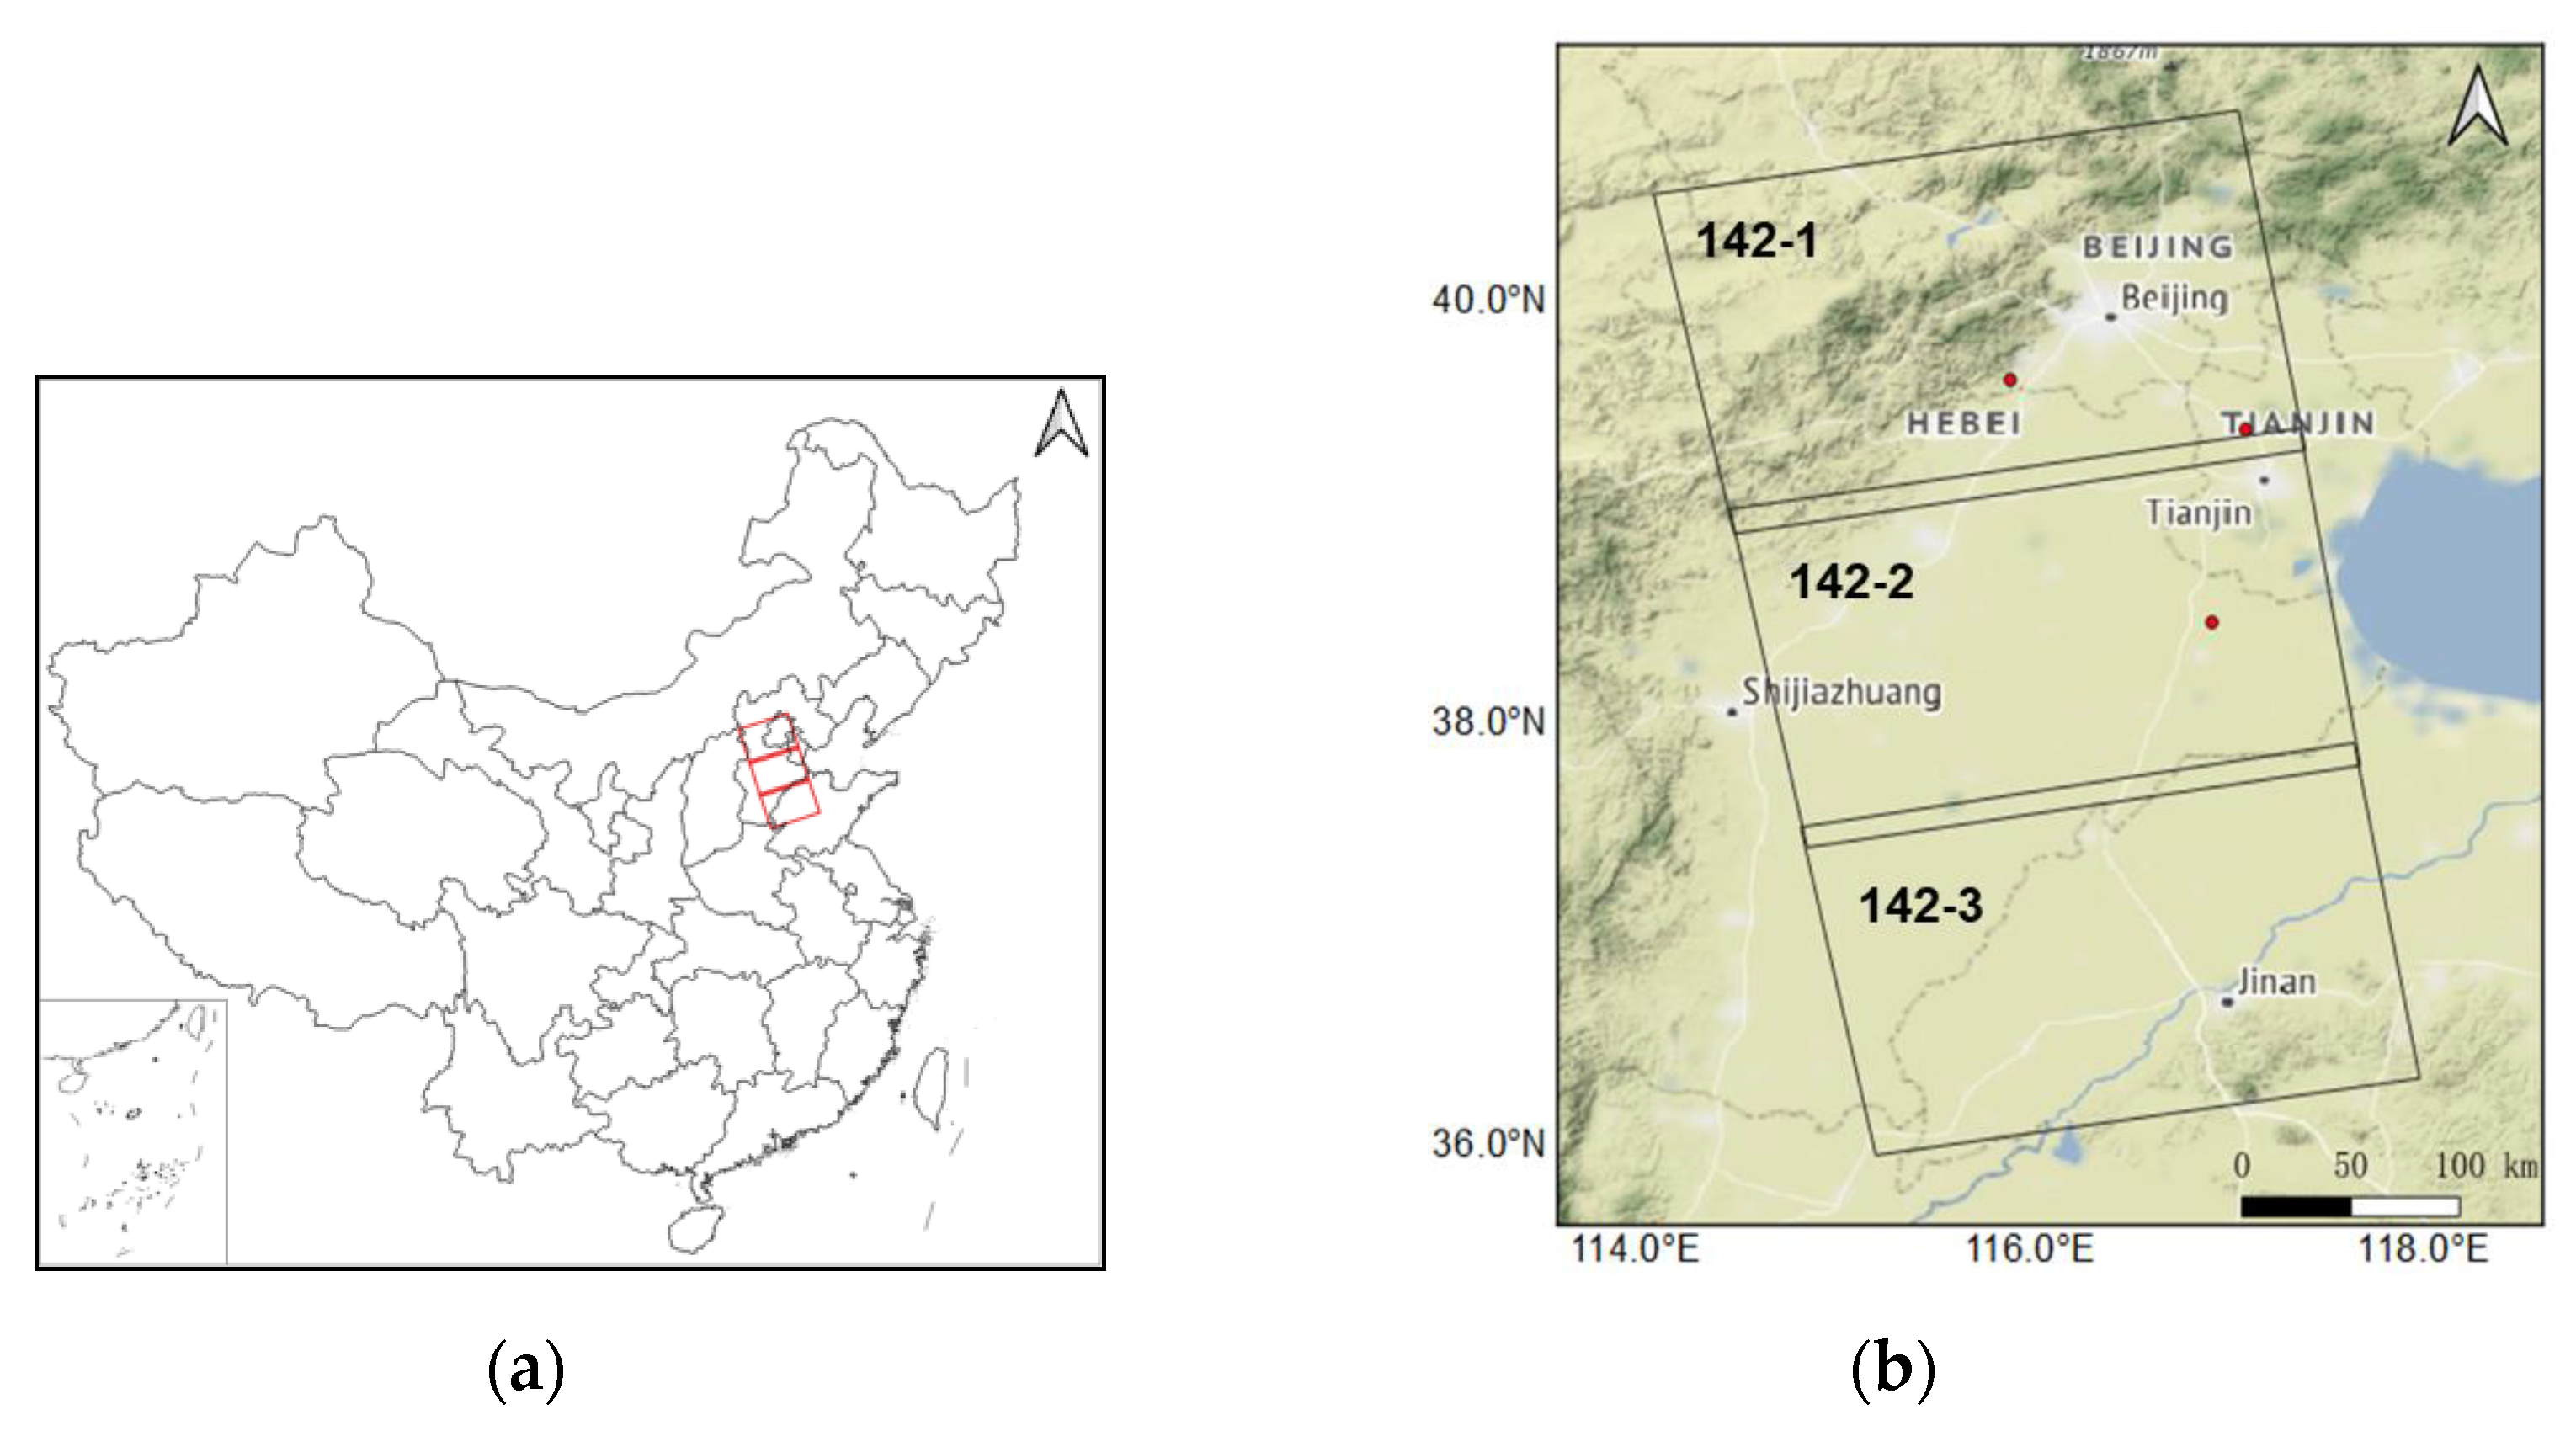
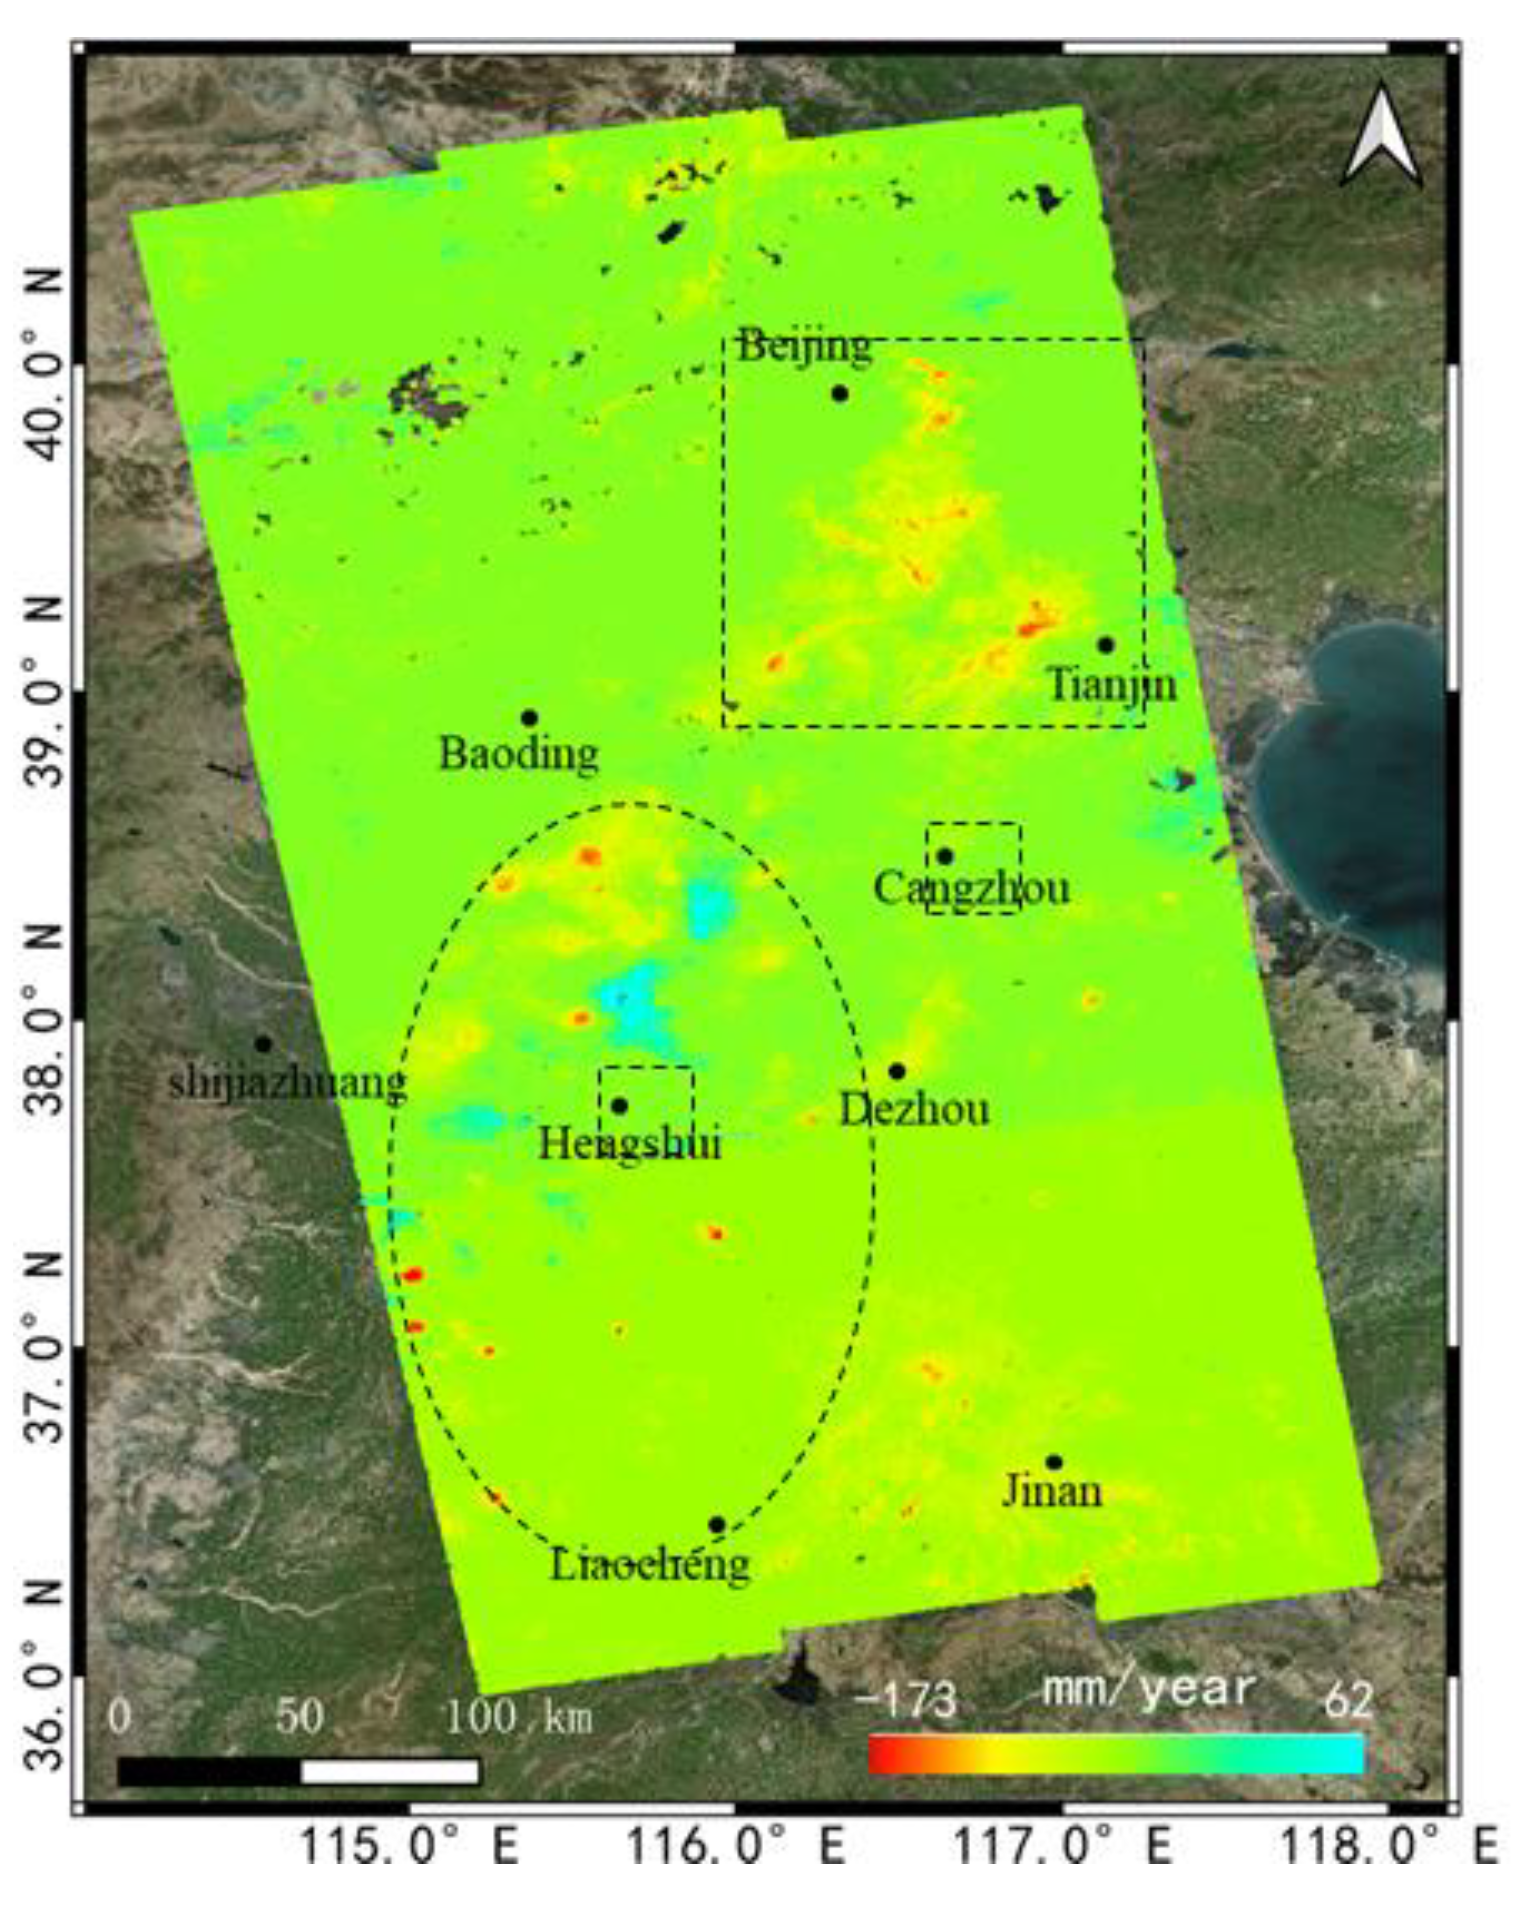
China has experienced strong subsidence and natural hazards over a long time period, and a fast and effective geodetic tool for mapping national ground deformation is of great significance for government planning and risk management. Meanwhile, the lack of a high-performance computing environment-based MT-InSAR processing platform has greatly limited large-scale InSAR applications in China. In this work, we focus on an algorithmic parallelism design for the Sentinel-1 MT-InSAR method to take full advantage of parallel processing resources in cloud computing or distributed computing infrastructure, and a novel parallel-based MT-InSAR method, namely parallel computing-based coherent scatterer InSAR (P-CSInSAR), has been proposed in this work. Based on the different data and algorithmic structures used during the processing stages, parallelization strategies with multiple levels have been adopted in the workflow to optimize parallel processing efficiency. In addition, the processing chain of P-CSInSAR is highly automatic and can perform the task from raw data conversion to displacement time series generation without any human interaction. The performance of the P-CSInSAR method has been tested on a real Sentinel-1 dataset over the North China Plain, acquired from September 2018 to March 2020. The accuracy of the estimated deformation results has been validated by GPS measurements, and the parallel computing efficiency of the proposed method has been evaluated. By developing the high-performance InSAR big data processing platform for the Sentinel-1 SAR dataset, we can realize the capability of routinely monitoring the widespread subsidence in the North China Plain and other city clusters in China, which will be very helpful for local governments in urban planning and policy making.
This paper is organized as follows. In
Section 2, we describe the workflow of the proposed P-CSInSAR method and its parallelization strategies. In
Section 3, the P-CSInSAR method is applied in a real case on the North China Plain, and the performance and accuracy of the proposed method are addressed. Finally, in
Section 4, the conclusion and future developments of the present work are discussed.
2. Methodology
Developing an efficient parallel computational model for the Sentinel-1 MT-InSAR method is very challenging, as several aspects, such as load balancing, communication, and data dependencies, should be properly taken into account throughout the processing chain. The MT-InSAR method requires several processing steps, and the algorithms are faced upward with different data structures during the processing stages. Moreover, the sequential implementation of the MT-InSAR method has a strong dependency between different algorithm steps, and massive input/output (I/O) operations are performed during the processing. Therefore, to obtain a parallel solution for the MT-InSAR method with high efficiency and scalability, we should carefully design the parallel algorithm and organize the sequence of the MT-InSAR processing steps to minimize disk access, minimize interprocess communication, and maximize the usage of the CPU.
Through an analysis of the workflow and features of the Sentinel-1 MT-InSAR method, the parallelizability for each algorithm step has been studied. For specific algorithms deemed suitable for parallelization, the appropriate parallel strategies are selected. For instance, Sentienl-1 burst data are separated as independent images; thus, the processing for burst images can be naturally parallelized on the burst level. For those algorithms that cannot be directly implemented in parallel form, we should exploit the potential of data independency in the processing, and decompose the algorithm into the parallelizable and nonparallelizable parts; thus, the former will be executed in parallel. For example, in the time series analysis, image data can be divided into different blocks, while the calculation for these blocks is the parallelizable part, and the results fusion for blocks is the nonparallelizable part. By adopting the parallelism at different levels during the course of the processing, we can maximize the parallelization for the overall processing chain.
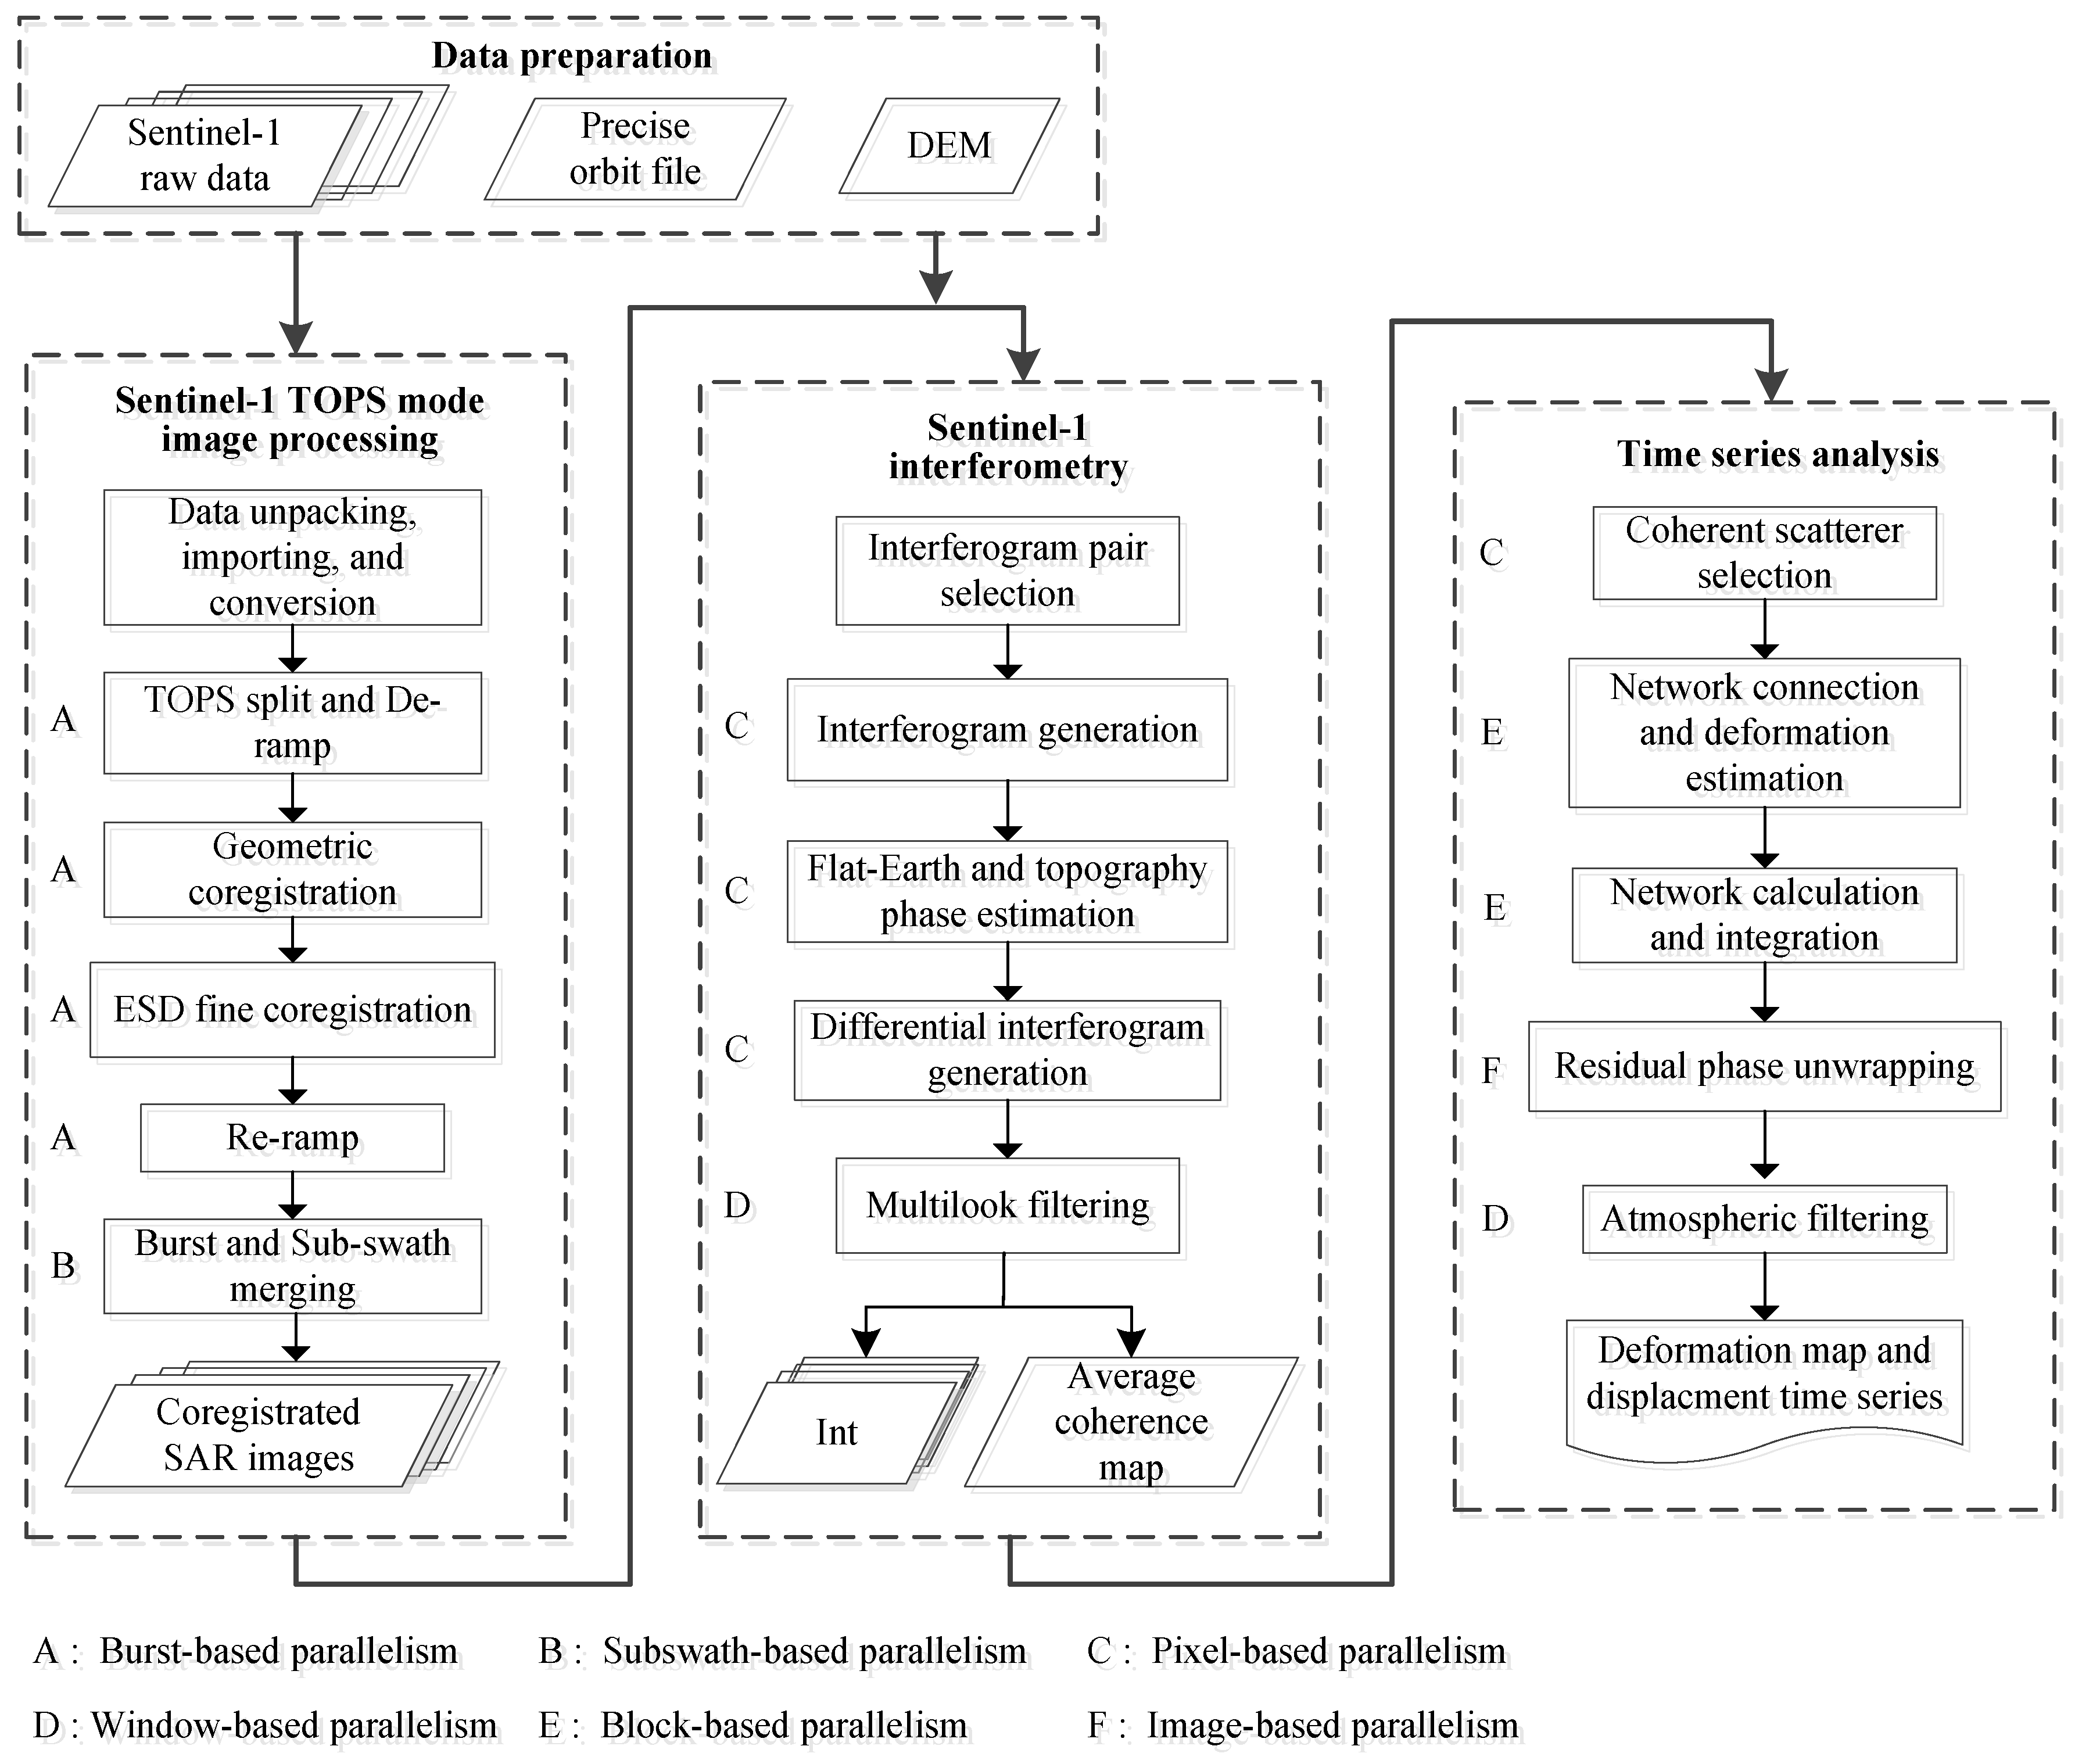
Based on above considerations, the framework of the proposed P-CSInSAR algorithm is mainly divided into three parts: Sentinel-1 Terrain Observation with Progressive Scans (TOPS)-mode image processing, Sentinel-1 interferometry, and time series analysis, as shown in
Figure 1. We first provide an overview of the P-CSInSAR algorithm, and the detailed description is provided in
Section 2.1,
Section 2.2 and
Section 2.3. The algorithm starts with preparation of the Sentinel-1 raw images, Digital Elevation Model (DEM), and the precise orbit files. After Sentinel-1 TOPS-mode image processing, a series of coregistrated SAR images and their parameter files are produced. Then, during Sentinel-1 interferometry, multilook interferograms with small baselines are generated, and the flat-Earth and topography phase are removed. Finally, through time series analysis, the deformation rate and displacement time series are obtained, and the output files can be exported into text, GeoTIFF, or shapefile formats. A large amount of intermediate results will save to the disk storage, and the program will delete some unused files if necessary. Moreover, the processing pipeline is written in Python and Bash scripts with predefined parameters, and can automatically generate deformation results from the raw Sentinel-1 data without any extra interaction work.
2.1. Sentinel-1 TOPS-Mode Image Processing
2.1.1. Algorithm Steps for Sentinel-1 TOPS-Mode Image Processing
In this part, the processing steps mainly include image coregistration and mosaicking. Unlike other SAR images, Sentinel-1 SLC (single look complex) data in IW mode use the Terrain Observation with Progressive Scans (TOPS) to achieve wide-swath coverage [
31]. A TOPS-mode SAR image consists of three individual subswath files (IW1, IW2, and IW3), where each subswath contains a series of burst files (at least nine). There are overlapping areas between the consecutive bursts and subswaths, and there are invalid data in the black regions of burst images. Due to the azimuth antenna steering, Sentinel-1 SLC data have a stricter requirement for image coregistration, which demands a coregistration accuracy of 0.001 samples, and a small mis-coregistration will introduce an unwanted phase ramp into interferograms among adjacent bursts.
Assuming N Sentinel-1 SAR images of the same scene acquired at times , these SLC images are first unpacked from the raw zip files and subjected to data format conversion. Then, the precise orbit files are applied to update the orbit parameters, which are then used in the geometric coregistration. Through TOPS split processing, all burst images are extracted from each subswath image file and stored into separate burst image files. Sentinel-1 image coregistration is then performed on these burst images. However, due to the azimuth antenna steering, the deramping phase must be removed from the burst data prior to image resampling operation, while after image coregistration, the coregistrated burst images are compensated for the deramping phase. Thus, the deramping phase is estimated by the Doppler centroid frequency, and then stored in the disk to be used in the deramp step and reramp step. SAR image coregistration transforms all the slave images to the master reference geometry, and the good coregistration is vital to generating correct interferograms, especially for Sentinel-1 images. To achieve high coregistration accuracy, a two-step method, the initial coregistration and fine coregistration, is widely used in Sentinel-1 image processing.
Geometric coregistration is used as the first-order coregistration by the use of precise orbit state vectors and an external DEM. This method transforms the pixel from SAR coordinates to Cartesian reference coordinates based on the range-Doppler (RD) equations, and the range and azimuth offsets between the master and slave images can be estimated. Then, slave image resampling and interpolation are performed by using the sinc kernel. Geometric coregistration does not rely on SAR image coherence, and its accuracy greatly benefits from the precise orbit file of Sentinel-1. The processing step is performed on all the burst data for each master–slave image pair at full spatial resolution; thus, the process requires intensive memory and I/O access, and is one of the most time-consuming steps during Sentinel-1 image TOPS-mode processing.
After the initial coregistration, the enhanced spectral diversity (ESD) method [
32] is applied to further correct the residual azimuth coregistration errors. The algorithm exploits the phase difference in the overlapping area among adjacent bursts, and uses the difference phase to retrieve the azimuth offset. First, the ESD phase is calculated by the double difference for every overlapping area, and the ESD phase for Burst
i and
j can be given as follows:
where
m and
s refer to the master and slave images, respectively. The relation between the
ESD phase and azimuth offset
can be given as follows:
where
is the Doppler frequency difference in the overlap areas between two bursts, and
is the azimuth sampling frequency. Thus, we can obtain the azimuth offset
based on Equations (1) and (2). The ESD algorithm is implemented on all the master–slave pairs. To reduce the potential temporal decorrelation effect of some pairs, a joint time series coregistration for redundant image pairs [
33] is used to obtain more accurate offsets. In this work, the following pairs are selected for ESD calculation, as shown in
Figure 2.
The ESD algorithm is implemented on the above-selected pairs, and the estimated azimuth offsets
are obtained. Thus, the azimuth offsets relative to the master image can be calculated by using the least squares method:
where
is the system matrix defining the relation between the different offsets. By using this redundant offset calculation approach, we can obtain more accurate and reliable coregistrated images.
After image coregistration and reramp processing, these burst images will mosaic together in the burst and subswath merging step. Then, the whole coregistrated time series of SLC images are obtained, which can be used in the following interferometry steps. The burst and subswath merging step is the most memory-intensive step because the entire image data with the original resolution must be read into memory.
2.1.2. Parallelization Strategies for Sentinel-1 TOPS-Mode Image Processing
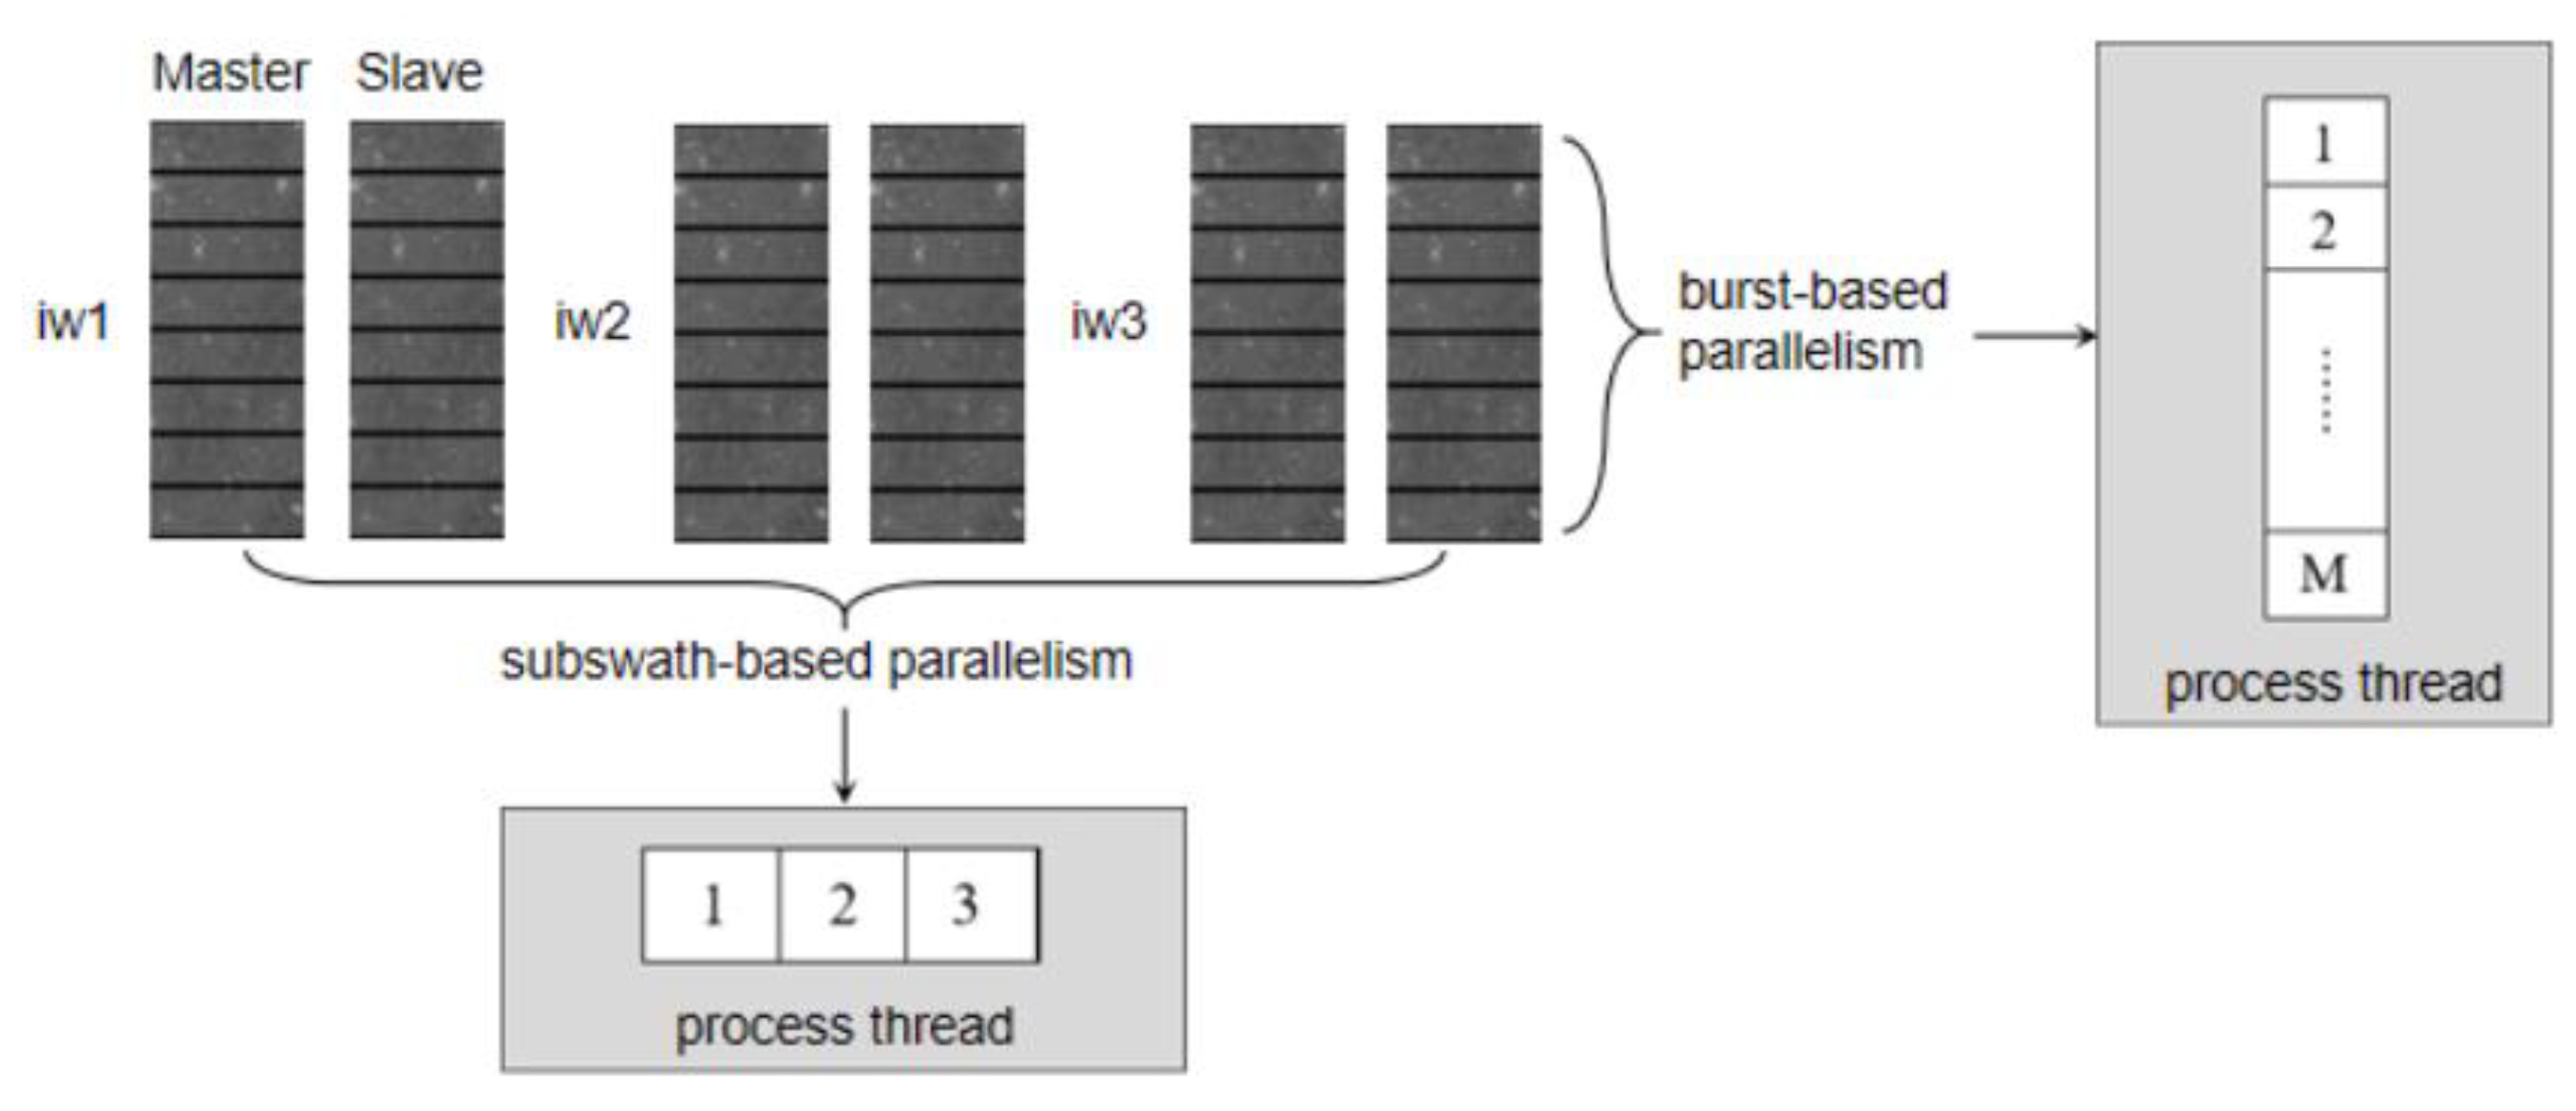
Although the Sentinel-1 TOPS-mode has caused some problems to the SAR image coregistration, its unique subswath and burst structure has provided good opportunities for parallelizing the processing algorithms. The parallelization strategies for this step are straightforward, and the data-center parallel approach is adopted, whereby a series of process threads apply the same operation on the different data.
From the previous algorithm description, the burst and subswath data are separated as the independent image files after the TOPS split step. Then, deramp, geometric coregistration, ESD coregistration, and reramp algorithms are all implemented on these burst images, while burst and subswath merging is performed on the three subswath images. Moreover, both the burst and subswath files are almost the same in size. Thus, the algorithms during this processing can be easily parallelized without having to consider the problem of data dependency or load unbalancing, leading to these algorithms being executed in parallel on different burst or subswath images, which can be intrinsically distributed to multiple process threads, as shown in
Figure 3.
During this stage, the algorithms process the image data with its original spatial resolution, and they are the most memory- and storage-intensive steps in the whole processing chain. In addition, the output intermediate results are almost three times the size of the unpacked raw Sentinel-1 images, and these massive I/O operations put excessive pressure on the hard disk at the beginning and the end of each algorithm step, especially for parallel processing. Thus, the speed of disk access has become a major limitation in parallel efficiency improvement for Sentinel-1 image TOPS-mode processing.
2.2. Sentinel-1 Interferometry
2.2.1. Algorithm Steps for Sentinel-1 Interferometry
This part aims to generate small baseline multilook interferograms and an average coherence map for time series analysis. The processing steps mainly include interferometric pair selection, interferometry processing, removing flat-Earth and topography phases (differential interferometry processing), and multilook filtering.
First, the interferometric pairs with short temporal and spatial baselines are selected according to the given threshold. As Sentinel-1 is characterized by its small baseline, the selected interferometric pairs by the threshold are still too numerous for later processing. To search the optimally connected baseline network, we estimate the coherence for all interferometric pair candidates by randomly selecting several blocks from the image and calculating the average coherence of these blocks. To ensure the accuracy of coherence estimation, the block size should not be too small (no less than 16 × 16), and the block size in our experiment is 64 × 64. Thus, the interferometric pairs with higher coherence are obtained.
Then, we generate the interferograms by complex conjugate calculation in the interferometry processing for all the interferometric pairs. The external DEM is used to model and remove the flat-Earth and topography phase contributions to generate the differential interferograms. Multilook filtering is the spatial complex average for differential interferograms used to reduce the decorrelation noise and generate the spatial coherence map. To downsample the size of the processing data, 10 and 2 (or 20 and 4) looks in range and azimuth directions, respectively, are typically used in InSAR processing.
To save disk storage and reduce I/O operations, complex image processing for interferometry, differential interferometry, and multilook filtering can be combined without the need to output intermediate results. In addition, some interferometry-related parameters (spatial baseline, slant range, etc.) at each range sample and azimuth line for all the interferometric pairs are also calculated in this part.
2.2.2. Parallelization Strategies for Sentinel-1 Interferometry
In the interferometric pair selection step, parallel computing can be naturally applied to the independent selected blocks to calculate the coherence. Thus, we mainly focus on parallelization for subsequent interferometry and multilook filtering processing.
These algorithms are mainly divided into two groups, as shown in
Figure 4. One is operated on the pixel basis, such as interferometry, flat-Earth and topography estimation, differential interferometry, and interferometric parameter calculation. The pixel calculations are independent of each other, and access to data from other pixels is not required. The other is computed on the window basis, which requires operation on a local region of the image, such as multilook filtering. The window processing also has no dependencies on each other in the calculation. Both types of algorithms are local operators with a good separation of neighboring units.
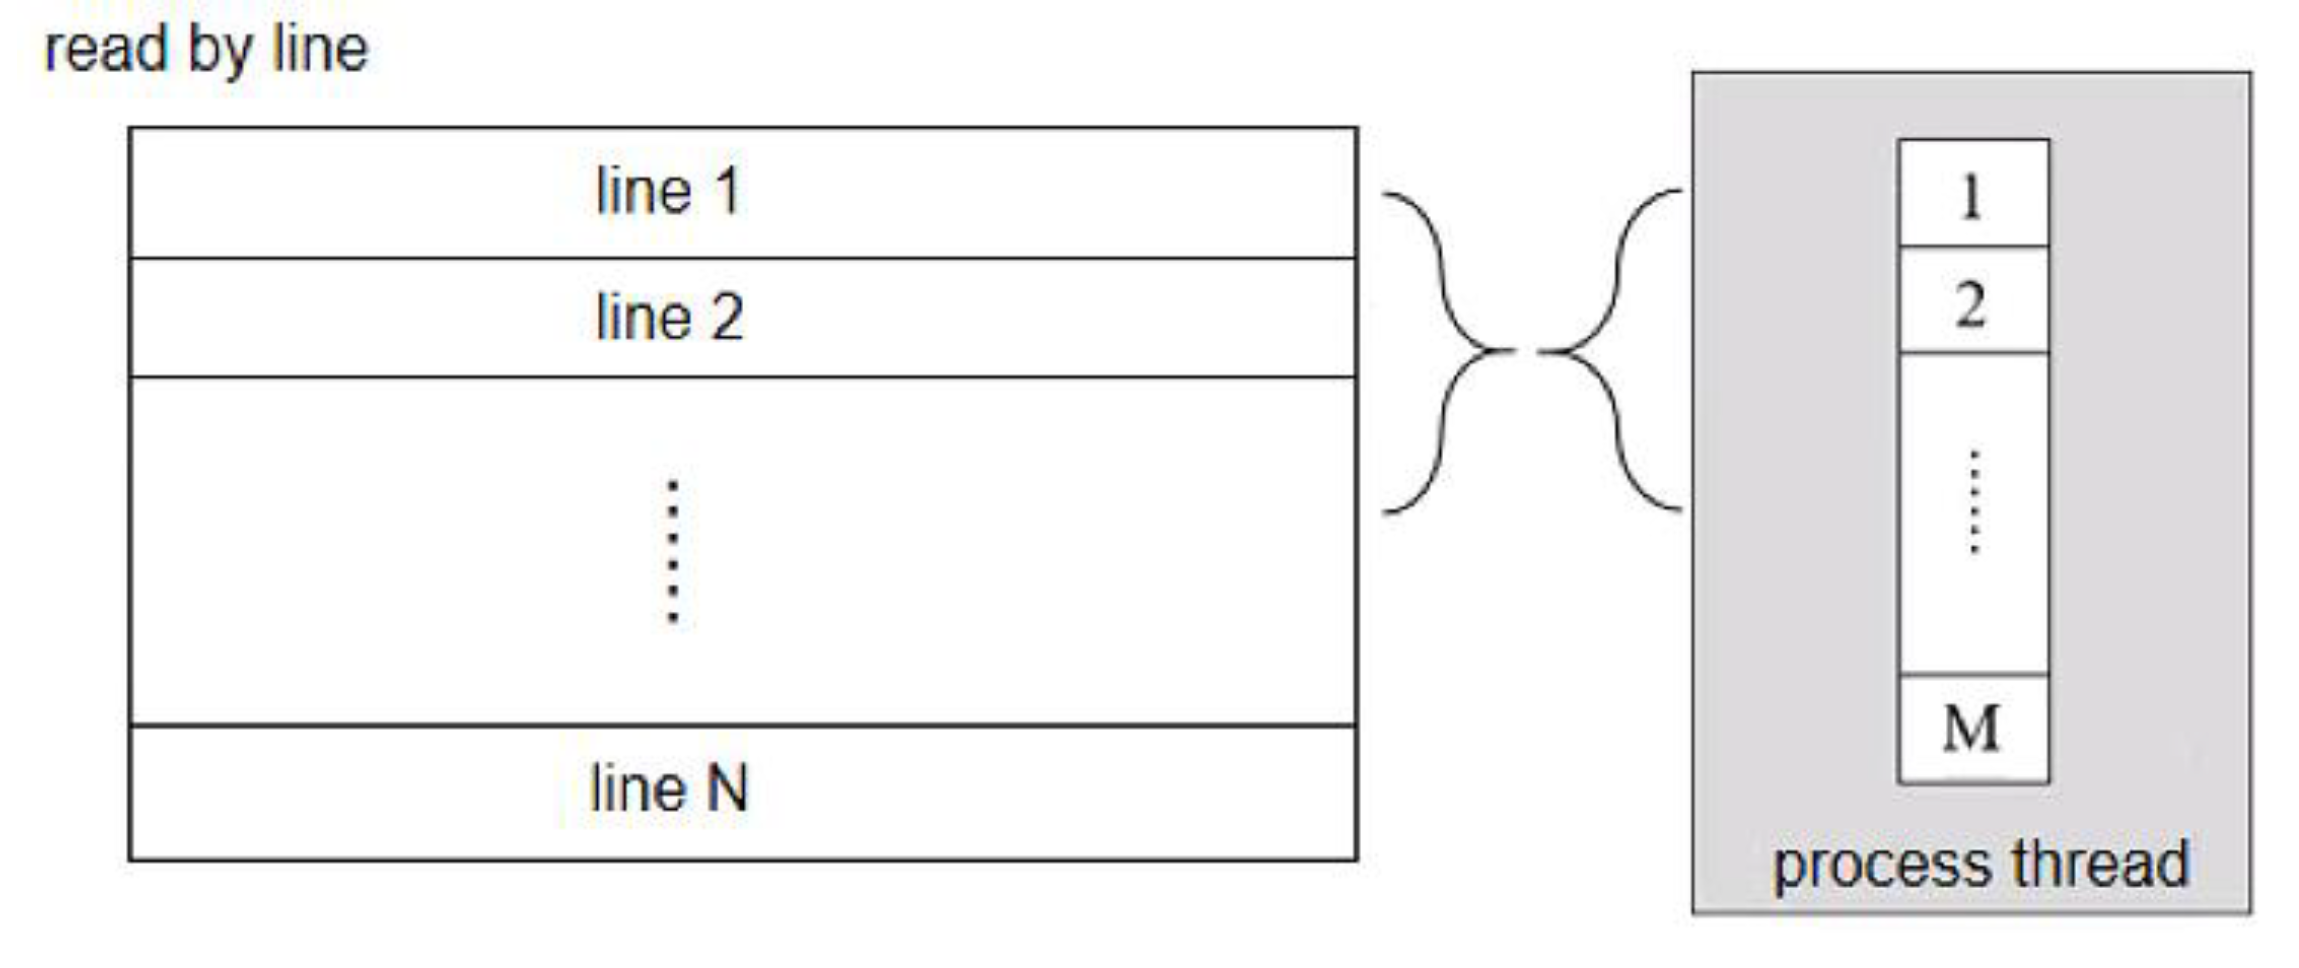
Therefore, algorithm parallelization for Sentinel-1 interferometry processing requires little effort to partition the processing data, and parallel computing can either be performed pixel by pixel, or block by block after dividing the image into different blocks. To make use of file reading, parallelism on the image line level is adopted. The SAR image files are read by line, and these lines of data are then distributed to the different process threads, as shown in
Figure 5.
The algorithm computations are not complex in Sentinel-1 interferometry processing, but they require intensive I/O operations due to the large number of interferograms and interferometry-related parameter files. Thus, the speed of disk access may influence the computing time of this processing step.
2.3. Time Series Analysis
2.3.1. Algorithm Steps for Time Series Analysis
This part carries out the time series analysis of the interferometric phase for the coherent scatterers, and estimates the deformation results from wrapped interferograms. This processing stage mainly includes coherent scatterer selection, deformation parameter estimation, network integration, residual phase unwrapping, and atmospheric filtering.
The high-coherent-scatterer candidates are identified by the average coherence map based on the given threshold, and the interferometric phase and interferometric parameters for these coherent scatterers are extracted from the corresponding files. Then, the following steps are performed on the sparse pixels with less memory and storage consumption. Coherent scatterers are first connected with the Delaunay triangulation network, and the atmospheric phase is mitigated through the double-phase difference of the adjacent pixel at the same arc. Deformation and residual height parameter estimation is performed on all the arcs of the triangulation network through time series analysis of the wrapped phase.
For the double-differential phase
for Arc
i–
j, after removing the atmospheric phase, the residual topography phase
, deformation phase
, and noise
are remained. The residual topography phase and deformation phase are usually modeled as the known functions of the temporal baseline
and spatial perpendicular baseline
, respectively. Thus, the double-differential phase can be given as follows:
where
and
are the estimated deformation rate and height parameters, respectively.
is the deformation model, and usually the polynomial or seasonal model.
is the height-to-phase conversion factor. As
is the wrapped phase and cannot be directly calculated by matrix inversion, the parameters are estimated by the following optimization method:
where
is the temporal coherence and
is the interferogram number. The optimal parameters
and
can be obtained by searching in the solution space with various optimization techniques [
34]. At the same time, some poorly estimated arc results will be rejected from the network if the temporal coherence
is below the given threshold. Finally, the reliable coherent scatters are selected in this step.
After estimating the deformation and height parameters for all the arcs in the network, the differential results are integrated by the network adjustment. To improve the inversion results of the adjustment matrix with the least squares solution, a weighted ridge-estimator is adopted to obtain more robust results by adding a regularization constraint, given as follows:
where
is the adjustment matrix that defines the relation of the arcs.
is the weighted matrix, and the diagonal elements are the temporal coherence for the arcs;
is a positive constant of the ridge-estimator parameter;
is the differential results of the estimated deformation rate or height for every arc; and
is the final estimated result with respect to the reference pixel. Thus, the linear deformation rate and residual height results can be obtained from Equation (6).
Then, a series of residual phases are acquired by subtracting the estimated linear deformation and height phase from the differential phase, and the phase unwrapping is then used to retrieve the integer phase ambiguity for residual interferograms before estimating the atmospheric and nonlinear deformation phase. This process is performed by applying a two-dimensional spatial minimum cost flow (MCF) phase unwrapping algorithm [
35], which is one of the most demanding steps in time series analysis. The unwrapped residual interferograms
for the selected small baseline interferometric pairs are obtained after unwrapping processing, and they can be expressed by the following function:
where
is the residual-phase time series with respect to the first acquisition time
, and
is the system matrix that defines the relation of the interferometric pairs. The solution for
can be seen as an L2-norm minimizing problem. The singular value decomposition (SVD) method is implemented to solve this minimizing model by decomposing the system matrix
as
, while the system matrix is common for all coherent scatterers. Thus, the residual-phase time series relative to the first acquisition time
are acquired in this step.
To estimate and remove the atmospheric phase contribution from the residual phase time series, the atmospheric filtering is performed based on the spatial–temporal characteristics of the atmospheric phase. The atmospheric phase time series can be estimated by temporal high-pass filtering and spatial low-pass filtering . Thus, removing the atmospheric phase from the residual-phase time series and the final displacement time series can be obtained. Once all the frames have been processed, mosaicking of the results is carried out to generate the deformation results for the entire study regions by employing the overlapping regions among different frames or by integrating the GPS measurements.
2.3.2. Parallelization Strategies for Time Series Analysis
From the above processing steps, we can see that multiple types of algorithms are involved in the time series analysis, including the temporal dimension algorithm (deformation estimation step), spatial dimension algorithm (network integration and phase unwrapping step), and temporal–spatial hybrid dimension algorithm (atmospheric filtering step). Thus, very different parallelization strategies are adopted to address these different algorithmic structures.
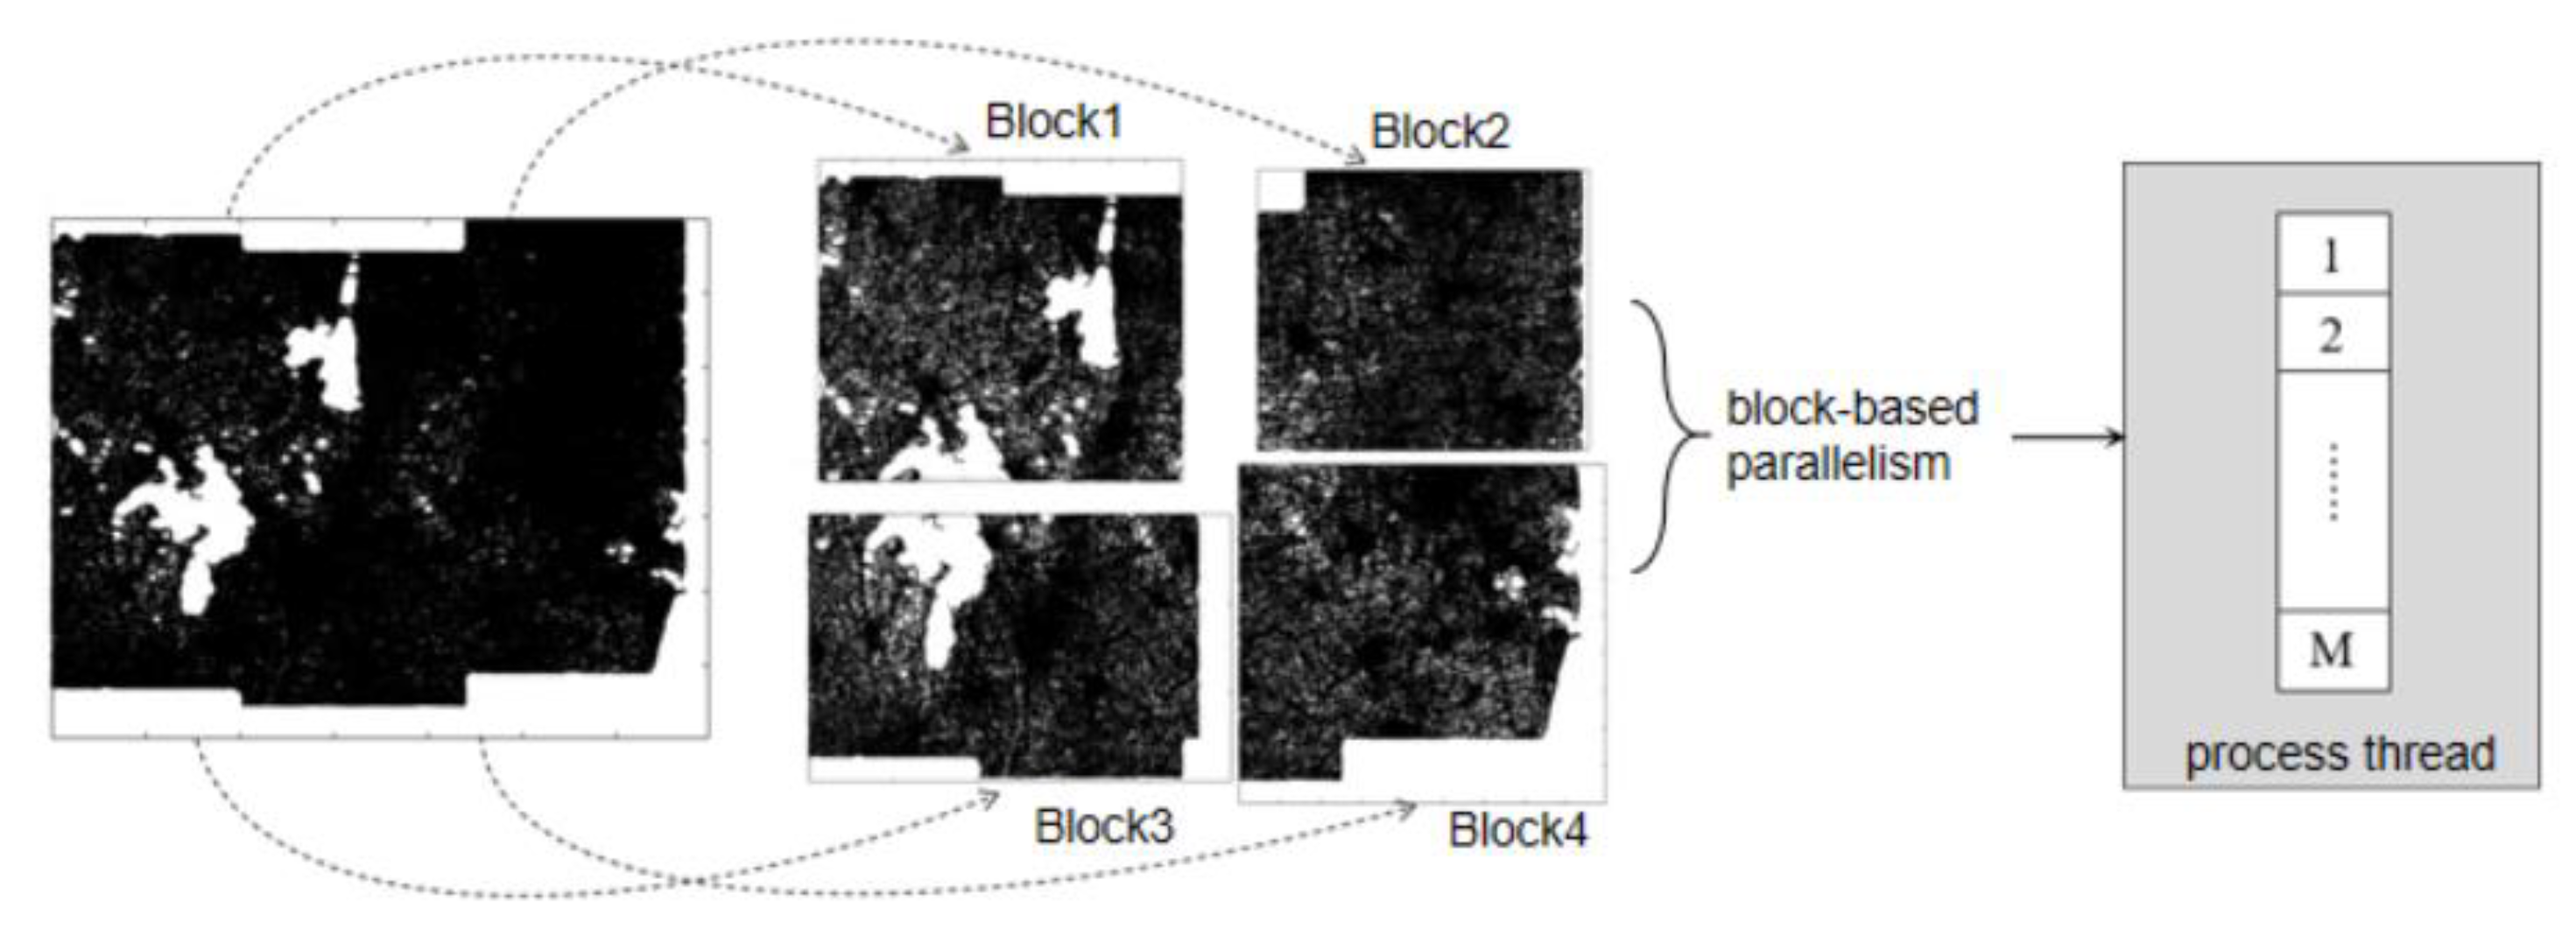
The conventional process of directly connecting millions of coherent scatterers with a triangulation network will lead to solving a large-scale matrix in network integration; thus, the computation in this step is of low efficiency. To reduce the computing scale and optimize the network calculation, parallelization is realized by splitting the image into different blocks, and block-level parallelism is adopted in this step. The image is split based on the density of the coherent scatterer to balance the computing load; thus, a series of unequal-sized blocks are obtained. As a result, the original network is replaced by several small-scale networks, which means that the large-scale matrix is decomposed into a series of submatrices. In addition, the calculations for these small submatrices can run in parallel on the different process threads, as shown in
Figure 6. In this way, the computational efficiency of network integration can be greatly improved.
After establishing the network, the deformation estimation can be carried out for the wrapped phase of all arcs on the temporal domain. As the calculations among different arcs are independent of each other, the arc-based parallelization strategy is adopted in this stage, and the deformation estimation for these arcs runs in parallel on the different process threads.
The next step is phase unwrapping for residual interferograms. The MCF phase unwrapping algorithm is a global optimization method, and the different parts of the image have strong dependencies under the global constraint. To avoid potential unwrapping errors by improper image partitioning, the task-parallel method is adopted by distributing the wrapped residual images to the different process threads, and the MCF algorithm operates on these process threads in parallel to complete all the tasks, as shown in
Figure 7.
Then, the unwrapped residual interferograms follow up with SVD calculation, which is conducted for each coherent scatterer in the temporal domain independently; thus, its parallelization strategy is very similar to the Sentinel-1 interferometry by parallel computing on a pixel basis. The final step is atmospheric filtering, which consists of two-step spatial and temporal operations. The temporal operation is the same for SVD calculation as a pixel operator in the temporal domain and the pixel-level parallelism is adopted, while the spatial filtering can use the window-based parallel computing method with parallelism similar to the multilook filtering.
Time series analysis is one of the most complicated steps in Sentinel InSAR processing due to the temporal–spatial three-dimensional structure data, and the time consumption in this step is close to that of Sentinel-1 image coregistration. Moreover, the time series analysis step deals with sparse pixels and has smaller I/O operation and storage requirements than the previous steps.
4. Conclusions
Due to the increasing interest in large-scale InSAR applications in recent years, we present a novel parallel computing-based P-CSInSAR method to tackle the challenge of massive Sentinel-1 InSAR data processing.
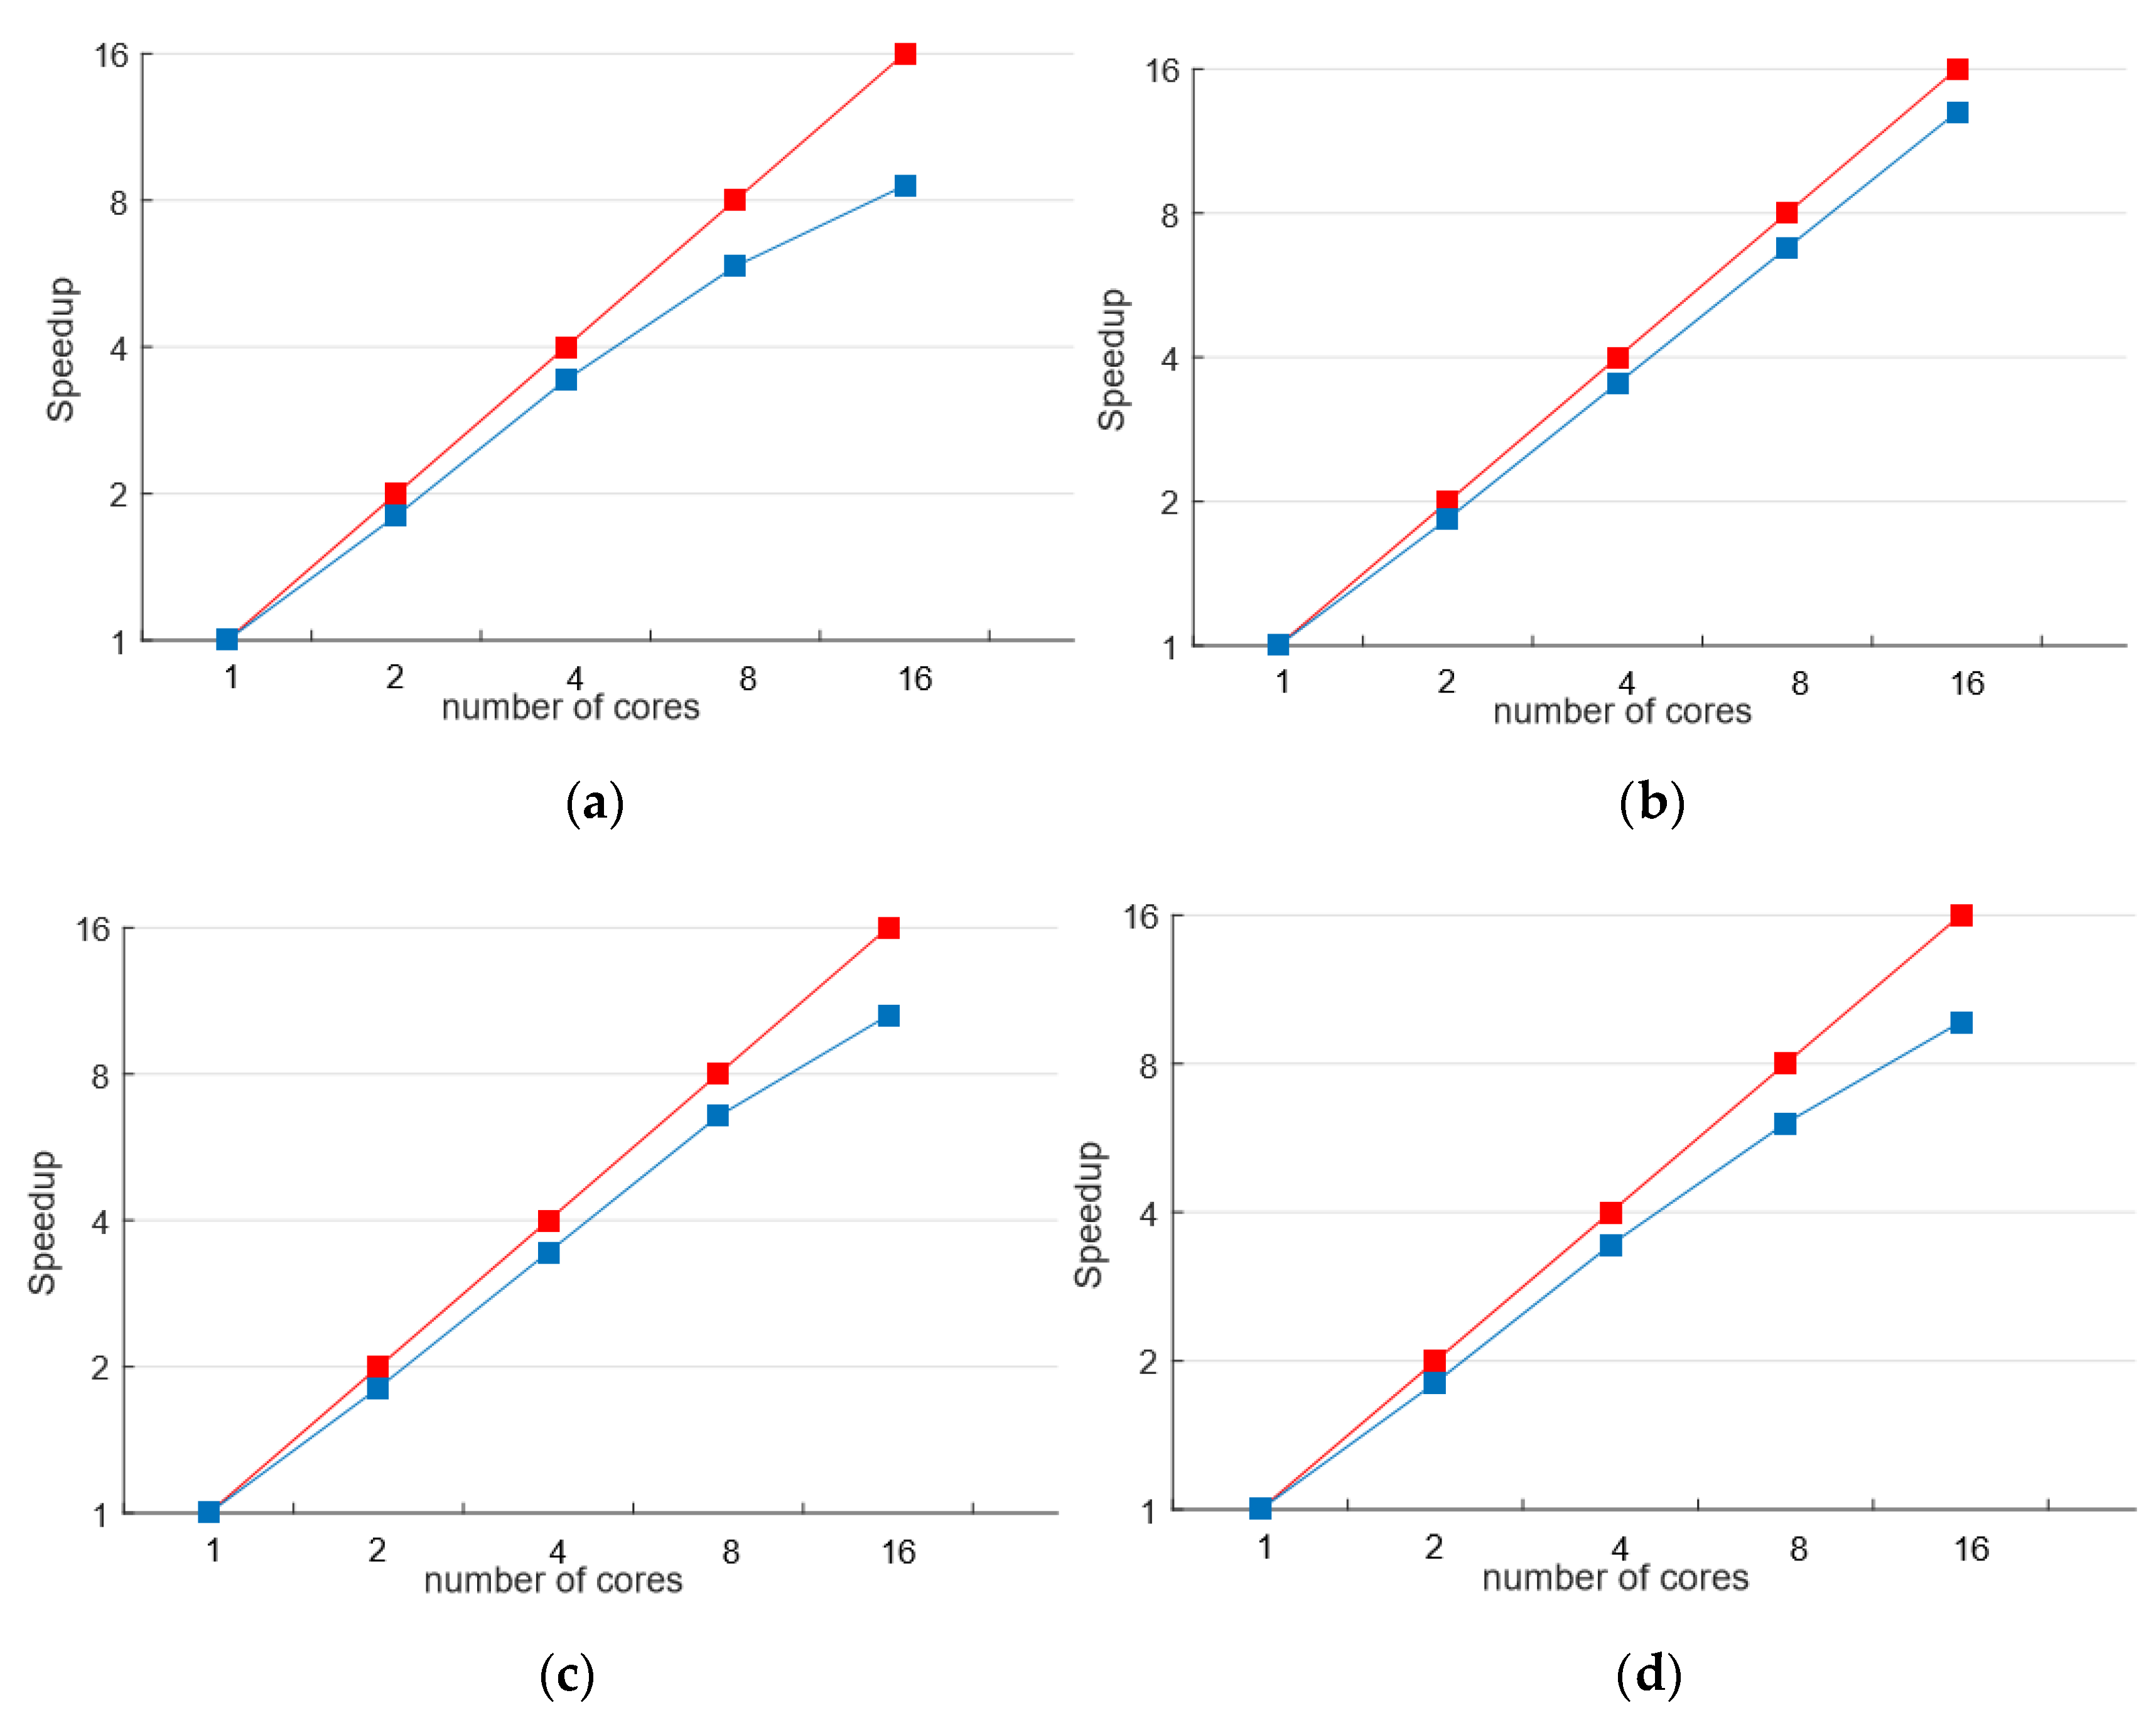
In this work, we first introduce the conventional MT-InSAR algorithms, and then analyze their algorithm parallelizability for the whole processing chain. By adopting flexible parallelization strategies based on different data or algorithmic structures, P-CSInSAR has achieved high parallelization efficiency.
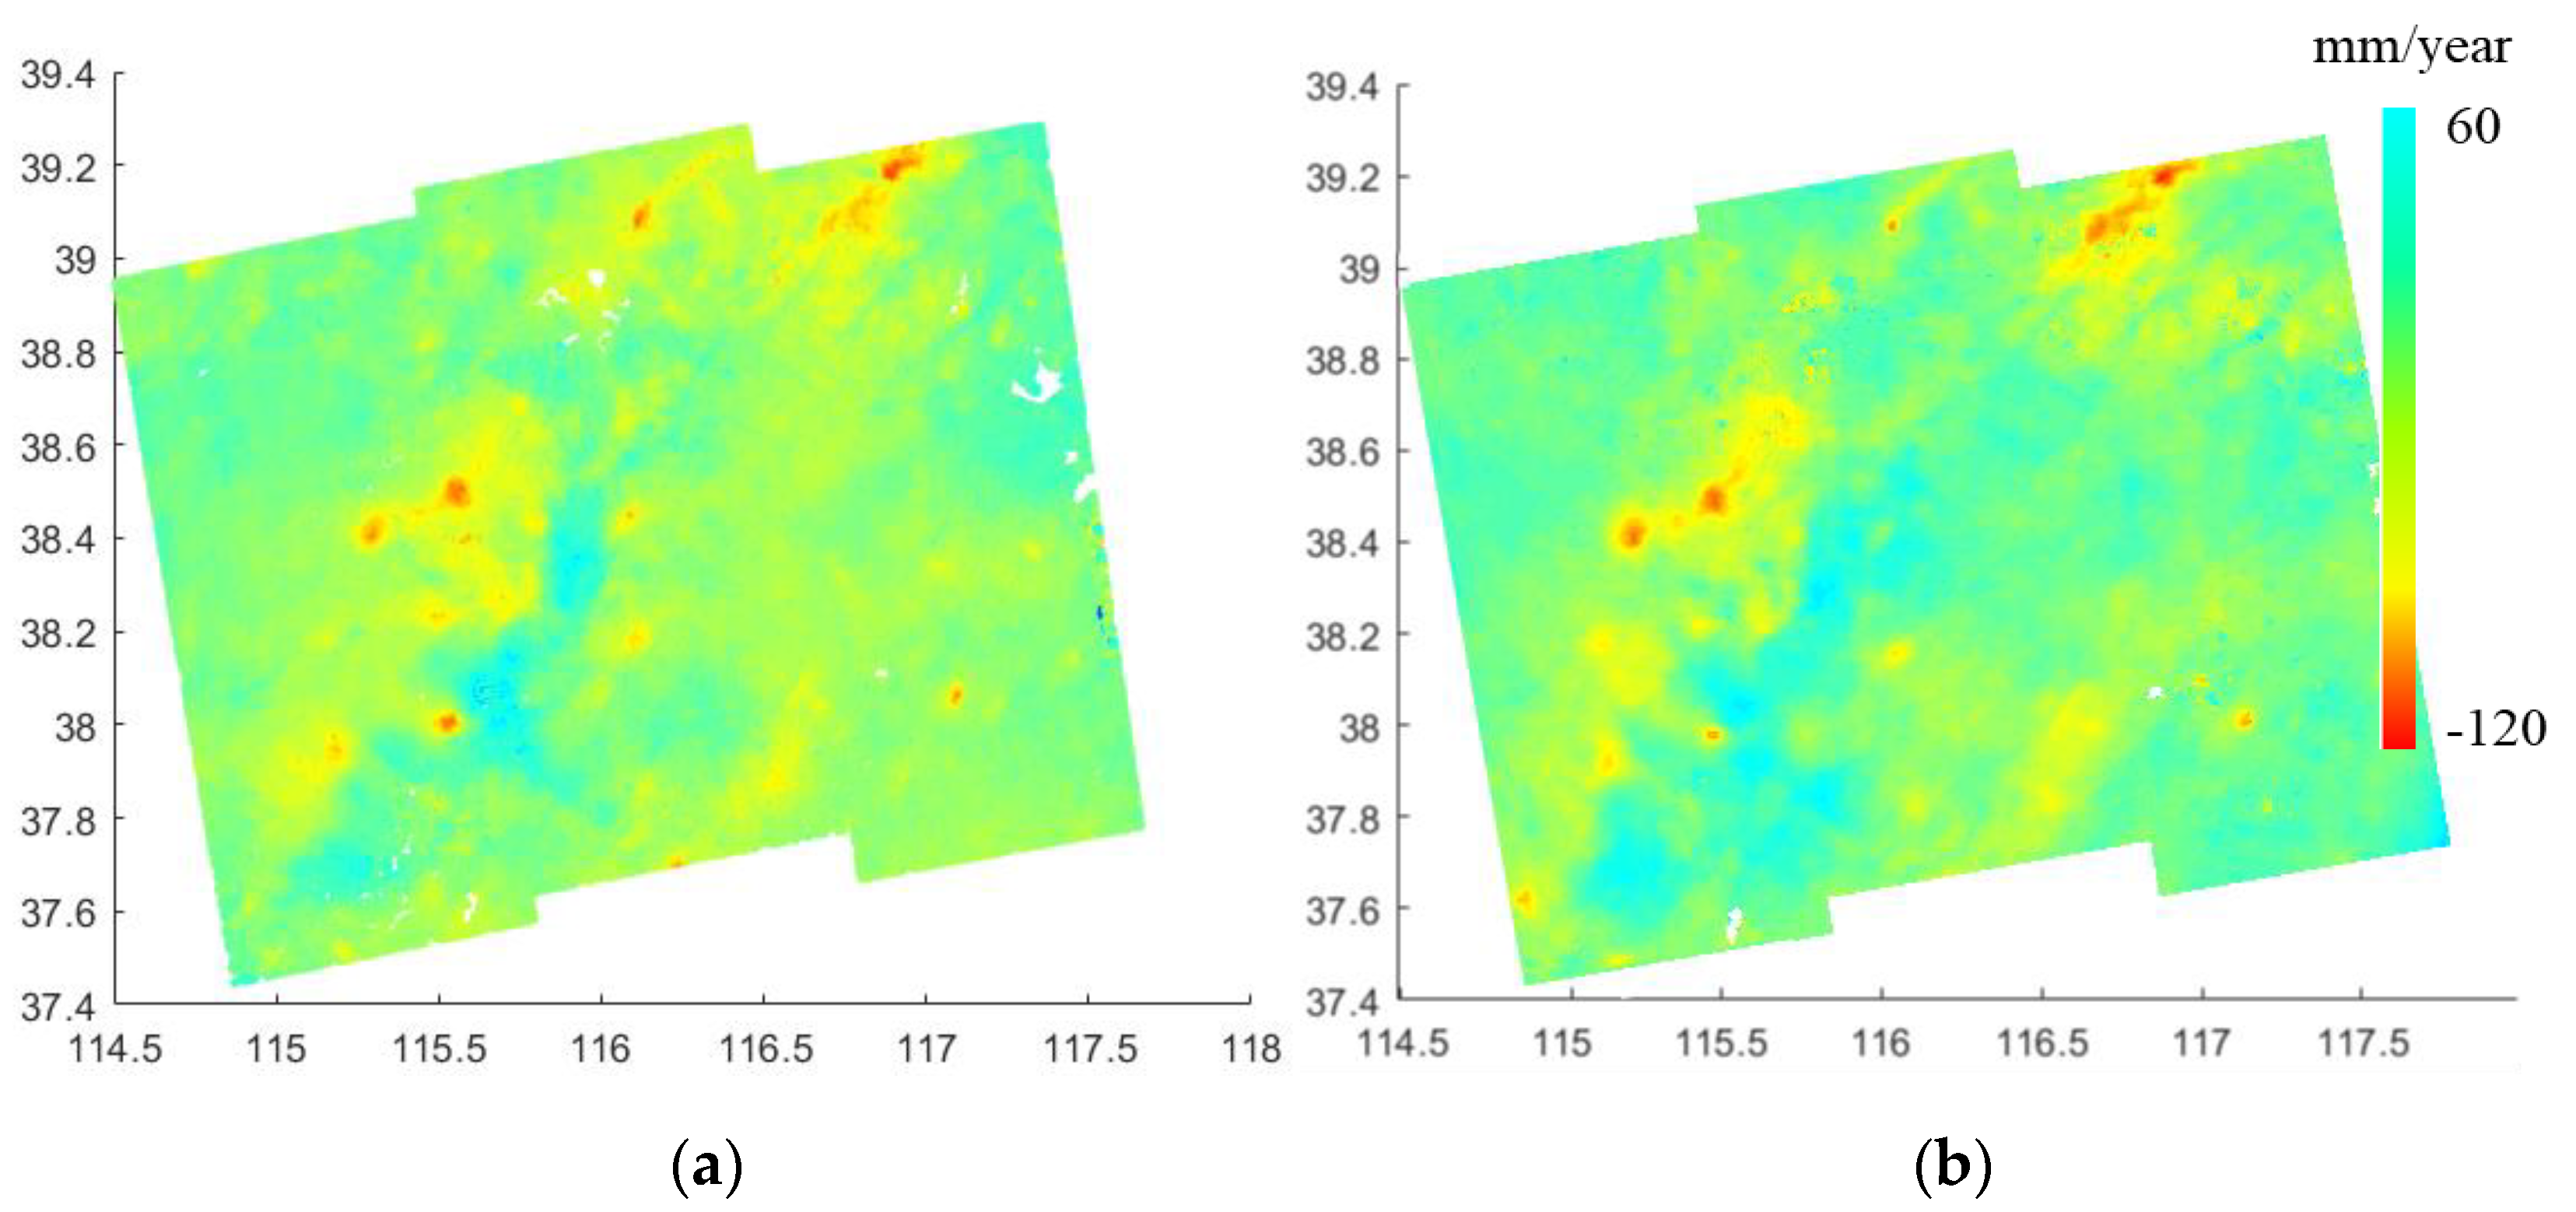
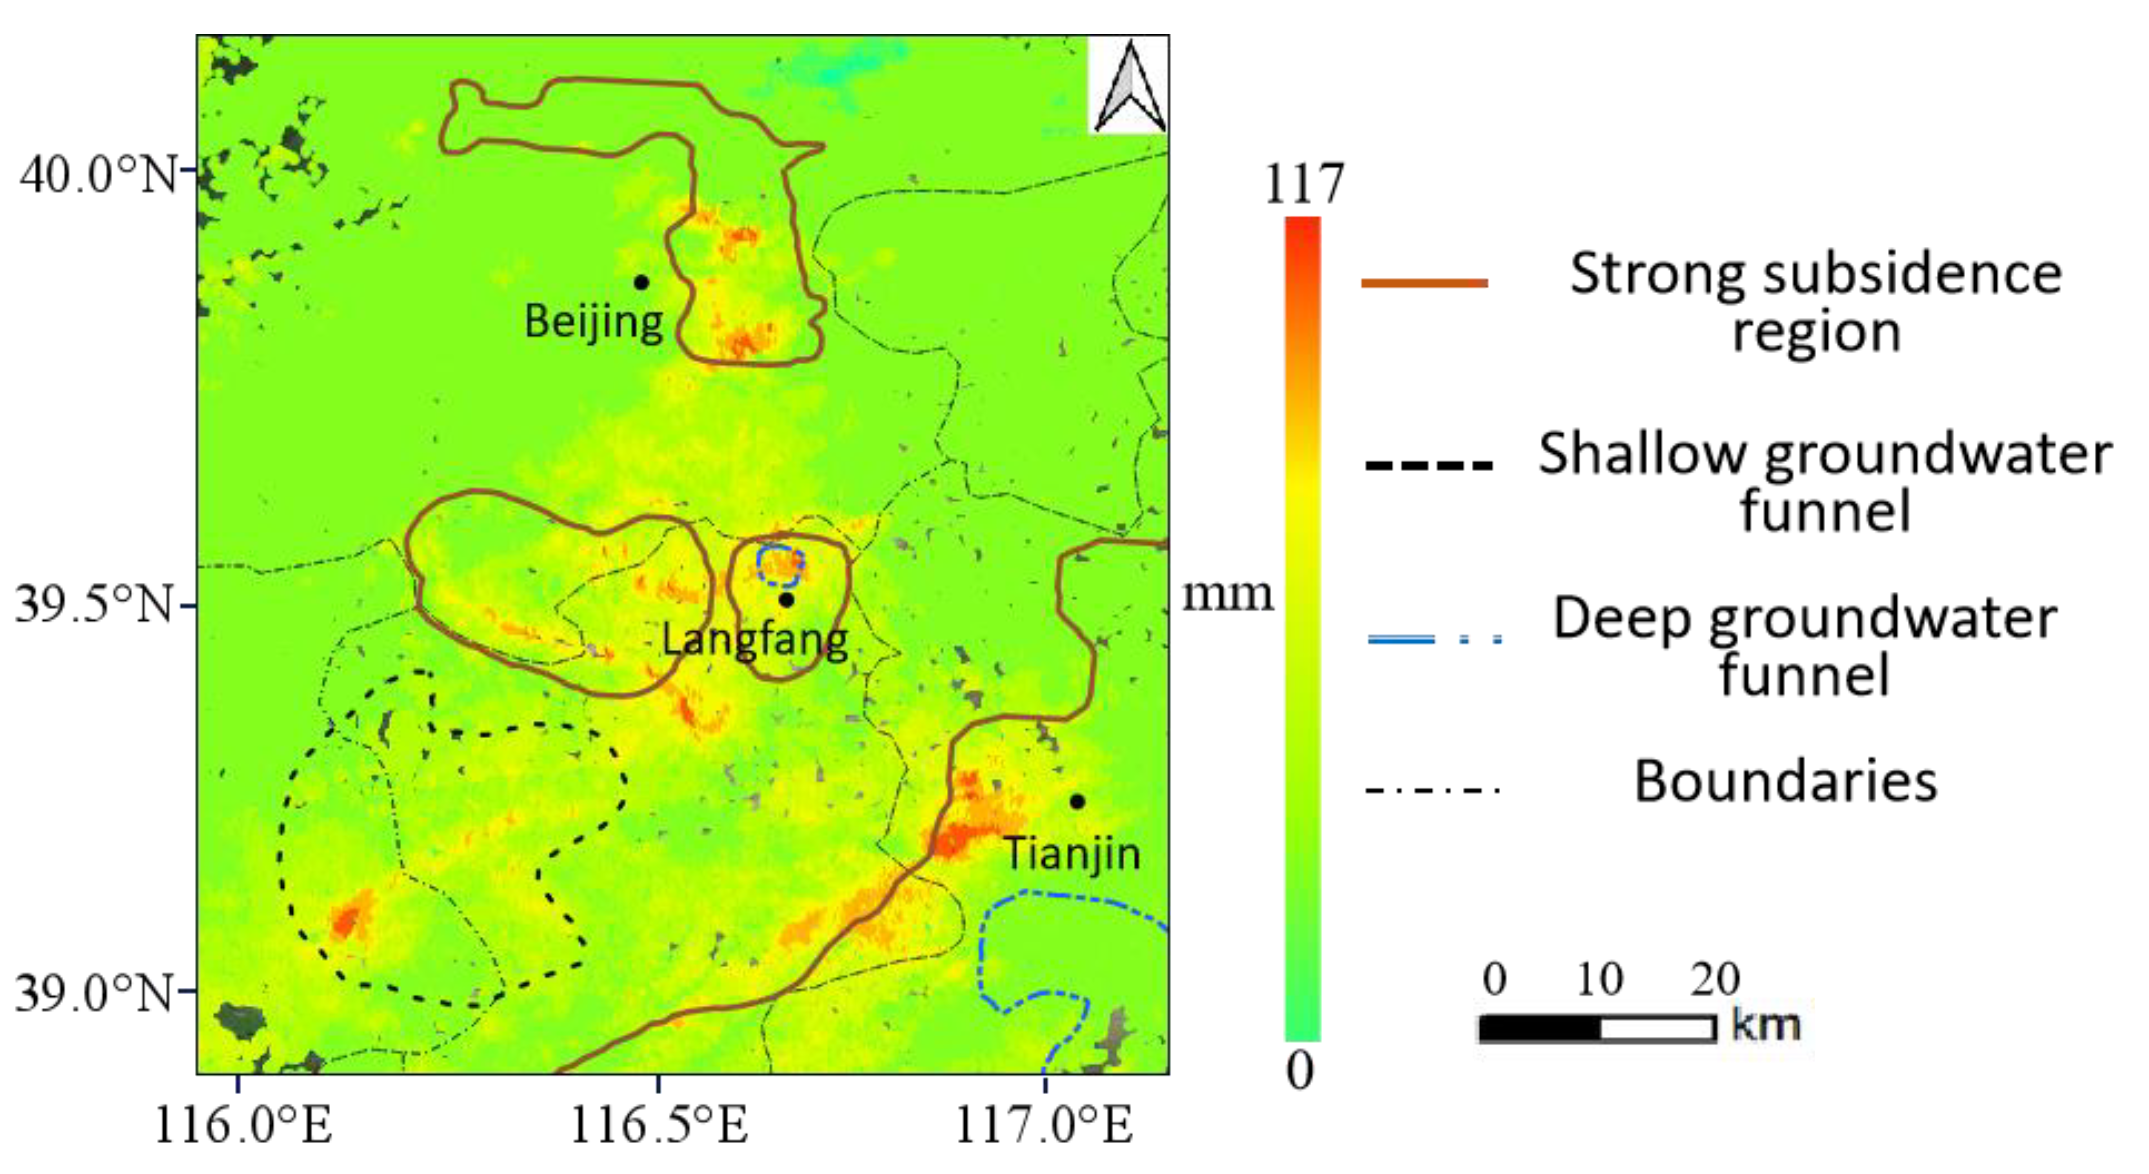
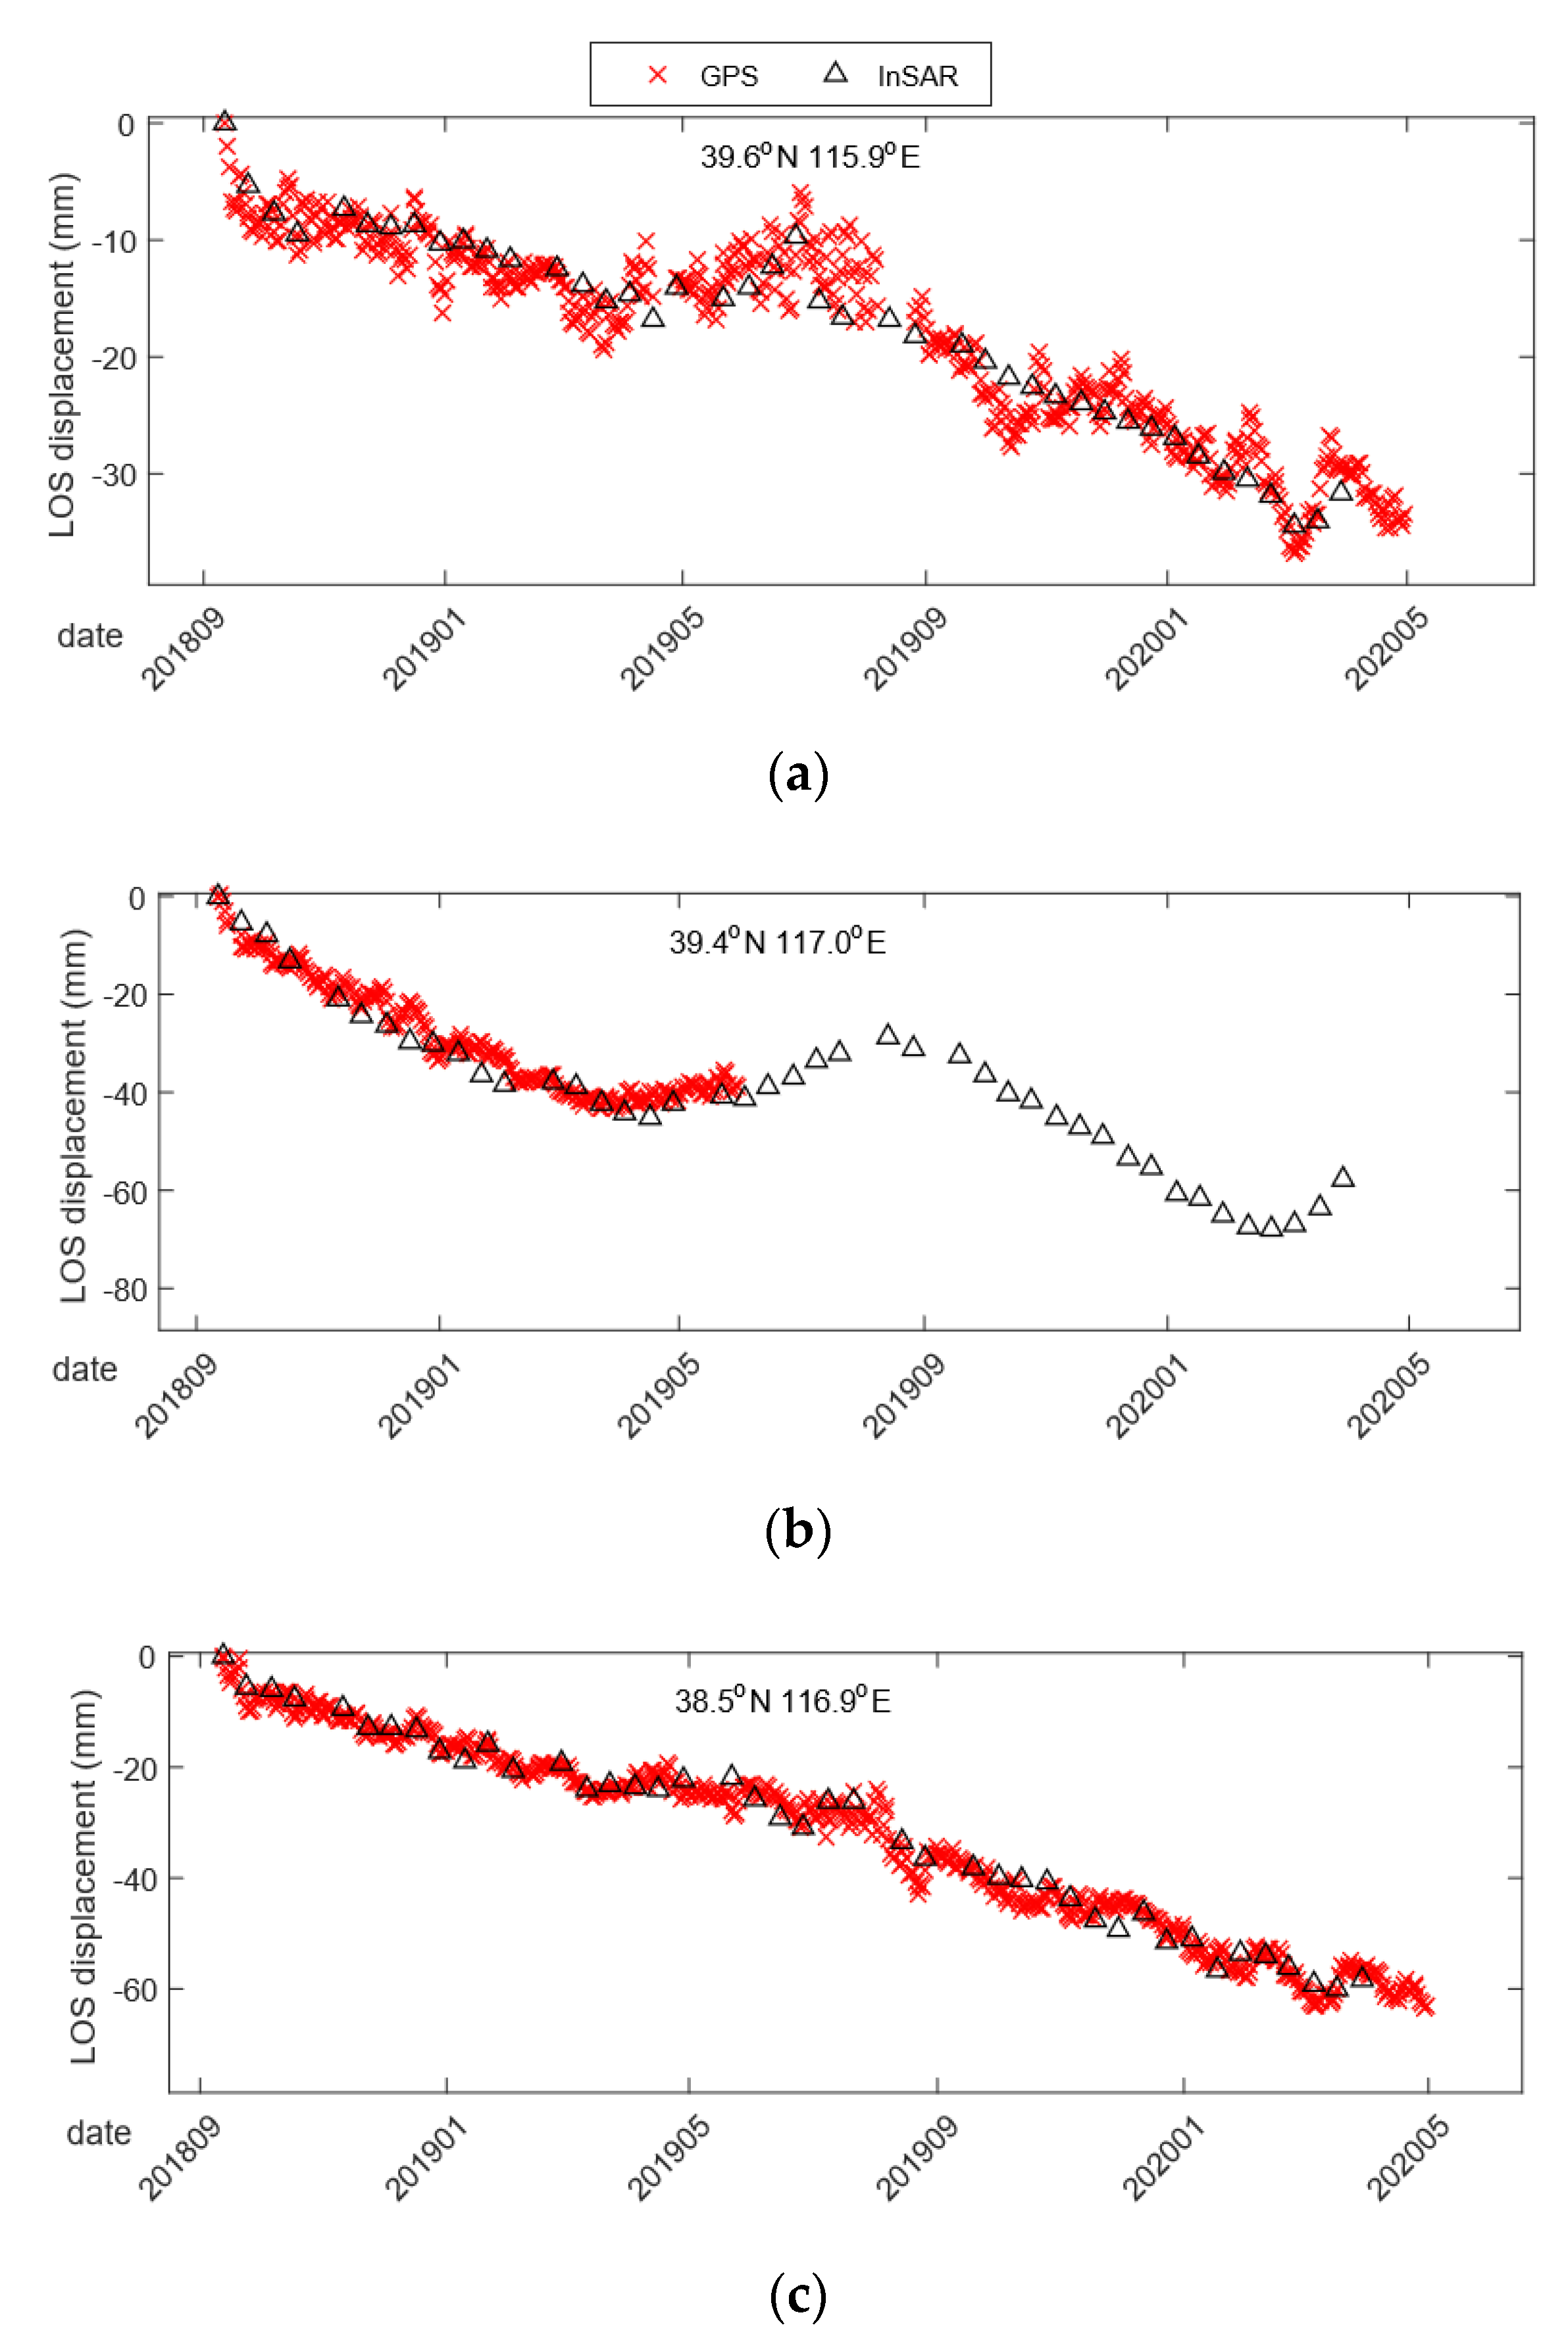
To validate the effectiveness and accuracy of the proposed method, P-CSInSAR has been tested on the real Sentinel-1 data over the North China Plain with three frames of Sentinel-1 images in the same track. Compared with the results over the second frame dataset by open-source software packages, the P-CSInSAR method can obtain the same deformation pattern as the other software, while it outperforms the latter on the processing time with 14 h relative to one week, which has reduced much of the time and human cost. Moreover, the results processed by P-CSInSAR for the three frames of Sentinel-1 data are in good agreement with the geodetic measurements, and the mean standard deviation of GNSS and InSAR time series are less than 0.8 cm. These experimental results demonstrate that P-CSInSAR has not only obtained deformation results with high accuracy, but also has high efficiency and scalability, which can provide practical and effective technical means for local governments in urban planning and disaster monitoring.
However, the proposed P-CSInSAR method cannot perform multi-task parallel processing, and has to finish different frames of Sentinel-1 data processing sequentially. Moreover, the parallelism of some algorithms is limited by data structures, and cannot achieve higher parallelization efficiency, such as the SAR image coregistration algorithm. Future work will migrate P-CSInSAR to cloud computing or supercomputing environments, and both multi-node and multi-thread programming will be employed to further improve the efficiency of large-scale Sentinel-1 InSAR processing. Some computationally intensive tasks in the P-CSInSAR method will be decomposed into subproblems and completed in different nodes by task scheduling. In addition, to better-exploit the computing resources of HPC, the processing steps of P-CSInSAR will be redesigned to reduce the I/O operation by eliminating the storage need for some intermediate results. This novel HPC-based InSAR big data processing platform will be applied in the routine monitoring widespread subsidence in the North China Plain and other national-scale geodynamic process investigations.
