Abstract
Detailed information about tree species composition is critical to forest managers and ecologists. In this study, we used Sentinel-2 imagery in combination with a canopy height model (CHM) derived from airborne laser scanning (ALS) to map individual tree crowns and identify them to species level. Our study area covered 140 km2 of a mainly mixed temperate forest in the Veluwe area in The Netherlands. Ground truth data on tree species were acquired for 2460 trees. Tree crowns were automatically delineated from the CHM model. We identified the delineated tree crowns to species and phylum level (angiosperm vs. gymnosperm) using a random forest (RF) classification. The RF model used multitemporal spectral variables from Sentinel-2 and crown structural variables from the CHM and was validated using an independent dataset. Different combinations of variables were tested. After feature reduction from 25 to 15 features, the RF model identified tree crowns with an overall accuracy of 78.5% (Kappa value 0.75) for tree species and 84.5% (Kappa value 0.73) for tree phyla whilst using the combination of all variables. Adding crown structural and multitemporal spectral information improved the RF classification compared to using only a Sentinel image from one season as input data. The producer’s accuracies varied between 43.8% for Norway spruce (Picea abies) to 95.3% for Douglas fir (Pseudotsuga menziesii). The RF model was extrapolated to generate a tree species map over a study area (140 km2). The map showed high abundances of common oak (Quercus robur; 35.5%) and Scots pine (Pinus sylvestris; 22.8%) and low abundances of Norway spruce (Picea abies; 1.7%) and Douglas fir (Pseudotsuga menziesii; 2.8%). Our results indicate a high potential for individual tree classification based on Sentinel-2 imagery and automatically derived tree crowns from canopy height models.
1. Introduction
Spatially explicit information about tree species distribution and other forest parameters, such as height, crown cover, and biomass, are valuable for various ecological applications, the parametrization of land surface models, and forest management. Forests regulate climate and biogeochemical cycles and represent an important terrestrial carbon reservoir [1]. As a result of climate change, Europe will likely experience higher temperatures and more frequent and severe droughts in the future [2]. The combination of increased heat and drought may lead to higher fire risk in Mediterranean Europe but also in temperate and boreal ecosystems in Europe [3]. Fire spread and severity depend largely on fuel flammability, which in forest ecosystems is among other factors dependent on the dominant tree species. Different tree species vary in crown openness, wood moisture content, and litter flammability, factors driving fuel flammability, and fire behaviour in forests [4,5]. Knowing the tree species distribution in a particular area is thus helpful for forest fire prevention and management. Besides the use of detailed tree species distribution maps in forest fire prevention, such maps would be useful for other ecological applications and fields, for example, sustainable forest management, which aims to conserve biological diversity in forests [6], as well as close-to-nature forest management, in which monospecific plantations are transformed to heterogeneous mixed-species stands that more closely resemble natural forests [7]. However, the sheer number of trees present in a particular forest limits the manual identification and classification of individual trees in detailed maps and asks for an automated approach.
Remote sensing is particularly useful for data acquisition needed for large scale forest monitoring, since it enables the acquisition of data over large areas at a high level of detail with a synoptic view. In this way, remote sensing has the potential to complement field inventories [8].
For the classification of individual trees at the species level, both high spatial and high spectral resolution data are desired [9,10]. Tree species and forest types classifications have used remote sensing datasets with different spectral resolutions [11,12,13,14,15]. Multispectral data are nowadays widely and freely available and have shown potential for classification of tree species and forest types at individual tree level, e.g., [10,11,12,13,14,15,16,17,18,19]. These studies, however, require manual delineation of individual tree crowns, which is quite labour-intensive and thus cannot be easily applied over large areas [20].
Species classification at individual tree level can be challenging due to the fact that the spectral signature retrieved from trees is, amongst others, influenced by its biochemical properties, canopy structure, forest maturity, and acquisition conditions [21]. The spectral signature that satellites measure is composed of the combination of reflectance from tree crown, tree crown shadows, illuminated and shadowed parts of tree crowns, and from the understory, e.g., soil, herbaceous vegetation, and litter [22]. The understory reflectance thus has an effect on the identification of tree species in open forests when pixel classification is used [11]. Object-based classification, which in this case is the classification of individual tree crowns as separate objects, minimizes the spectral mixture of tree and understory reflectance by grouping pixels that belong to the same tree crown [22,23,24,25]. For each tree crown, spectral and crown structural information, the latter describing the geometrical properties of a tree crown, can be extracted and included in classification algorithms [12].
To classify tree species, both parametric and non-parametric classification algorithms have been used [7,12,22]; parametric algorithms include maximum likelihood and Bayesian methods [11]. Non-parametric classifiers do not make any assumptions about the shape of the model function. The non-parametric classifier random forest (RF) is robust against noise, and the setup is simple when compared to other non-parametric methods [26,27]. Previous studies have applied the RF model to classify tree species using multispectral satellite data [28] or crown structural data derived from airborne laser scanning (ALS) data as explanatory variables or features in the model. Furthermore, RF models have previously been used on crown structural and spectral data combined in a single classification [29,30], which has shown to improve the classification accuracy [31] compared to using only structural data. Another potential layer of information that could be utilized in an RF or similar model is the phenological variation between tree species. In temperate forests, biophysical and structural properties of the tree canopy change with the changing seasons as a result of flowering, leaf-onset, and, in winter, deciduous trees by leaf senescence. These phenological changes vary widely among different tree species [32], and species variation can be captured with multitemporal imagery [15,33,34].
The aim of our study is to develop a new method to automatically map tree crowns and to classify those crowns to species level using multitemporal Sentinel-2 imagery from four consecutive seasons (autumn 2018–summer 2019) and crown structural variables derived from ALS data. To the best of our knowledge, we are the first to combine fully automatic tree crown segmentation with a tree species classification model in a single method. We applied our method to map individual trees in a mixed temperate forest area in The Netherlands and classified these trees at species and phylum level (angiosperm vs. gymnosperm).
2. Materials and Methods
2.1. Study Area
The study area is situated in the Veluwe, the largest contiguous forest in The Netherlands (52°11′–52°24′ N, 5°71′–5°92′ E, WGS84). Our study area covers the central part of the Veluwe and is located west of the town Apeldoorn and north of the Nationaal Park De Hoge Veluwe. The Netherlands have a temperate oceanic climate with an average annual precipitation of 832.5 mm and average air temperature of 14.1 °C [35].
The Veluwe is characterized by the presence of push moraines and other glacial geomorphological landscape elements. The landscape was formed during the second last glacial, the Saale glaciation (300—130 kyr BP). In the last ice age, the Weichselian glaciation (115—11.7 kyr BP), aeolian coversands were deposited. Due to deforestation and subsequent overgrazing since the 12th century, more than half of the Veluwe was converted from forest to open heathlands and drift sands by the 19th century [36]. As the soil in these areas deteriorated and the heathlands largely lost their agricultural use by the end of the 19th century, large tracts of unproductive heathland were planted with mostly coniferous tree species. Scots pine (Pinus sylvestris) was planted in poor heathland areas, while on more fertile soils, forests of broadleaved trees and Douglas fir (Pseudotsuga menziesii) were preferred [37]. The eight most common species in our study area were found to be European beech (Fagus sylvatica), Douglas fir (Pseudotsuga menziesii), Japanese larch (Larix kaempferi), northern red oak (Quercus rubra), Scots pine (Pinus sylvestris), silver birch (Betula pendula), Norway spruce (Picea abies), and common oak (Quercus robur) (Appendix A Figure A1 and Figure A2).
Our study area covers approximately 140 km2 of broadleaved, coniferous, and mixed forests, large unvegetated drift sands areas, and heathlands, but also anthropogenic structures such as buildings and roads (Figure 1).
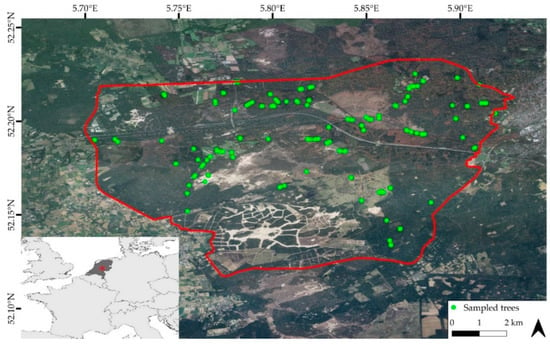
Figure 1.
Location of the study area (inside the red line) in The Netherlands. The green dots show the location of the sampled trees and are plotted over airborne imagery from 2018, acquired from Publieke Dienstverlening Op de Kaart (PDOK).
2.2. Field Data
Two field surveys of 12 days were conducted, one in May 2019 and a subsequent survey in December 2019 (Figure 1). Trees were measured separately (n = 1743) and in plots (n = 479). The location of sample sites was selected based on the vegetation structure and the species composition being representative for the larger study area and by bike accessibility. In total, 17 plots of 30 by 30 m were established and measured in May 2019. The plots were located in heterogeneous forest stands located more than 3 m away from roads and distributed over the entire study area (Figure 1). For each individual tree, the location of the trees was logged using a Trimble Geo 7X Handheld Data Collector (1–100 cm accuracy), which used more than 50 independent and differentially corrected GPS recordings to determine the final position. The horizontal position of the samples had a final average uncertainty of 0.5–1 m. Furthermore, for each tree, the diameter at breast height (DBH, range 1.9–129.9 cm) was measured using a measuring tape. Finally, the average crown width was determined as the average of four perpendicular radii of the tree branches. The length of the four radii were assessed by visually determining the crown extent and then measuring the distance between the maximum crown extent and the tree trunk with a Bosch laser PLR 50 C (±2 mm accuracy). The tree crown area (range: 1.1–352.9 m2) was then calculated from these data as the surface of an ellipse (crown area = π ∗ a ∗ b; in which a and b are the mean of the two largest and two smallest radii, respectively).
The number of trees per plot ranged between 13 and 53, with an average of 27 trees. During the field campaign in May 2019, we sampled 268 individual trees and collected data of 26 different tree species. The number of trees per species are shown in Table 1. The samples of the eight most common species were used for the classification on tree species level. All 26 species were used for the classification on phylum, angiosperm or gymnosperm, level.

Table 1.
Inventory data of trees and anthropogenic features (n = 2460).
In December 2019, two days of additional field data collection were carried out to survey another 1475 individual trees of the eight most common species (Table 1). The location of homogeneous stands was determined by aerial photograph interpretation. During this survey, only the tree species and location were determined.
To exclude anthropogenic features from the tree species and phylum analysis, polygons overlapping houses, roads, or other human made features were identified as anthropogenic features (n = 238). This classification was based on the interpretation of Sentinel-2 imagery.
2.3. Digital Elevation Model and Pre-Processing
We used the national digital elevation model (DEM) of The Netherlands (Actueel Hoogtebestand Nederland, AHN) to construct a canopy height model (CHM) for the study area. The AHN is a collaboration between the regional water authorities, provinces, and Directorate-General for Public Works and Water Management that has resulted in an ALS derived high resolution DEM of The Netherlands over multiple years [38]. The ALS acquisition flights over our study area were carried out between December and March 2017/2018, when winter deciduous trees do not have leaves.
The recording resulted in a point cloud, which was calibrated and classified by the Directorate-General for Public Works and Water Management, leading to two different datasets. The digital terrain model (DTM) consists of points that were classified as ground level. For every pixel of 50 cm by 50 cm, the value that represents the centre of the cell was calculated with the squared inverse distance weighting method. The other dataset is the digital surface model (DSM). This dataset contains points that do not represent the ground level but instead vegetation or buildings [39]. Both the DTM and the DSM were freely downloaded from the portal of Publieke Dienstverlening Op de Kaart (PDOK). Eleven tiles that were recorded in 2018 covered the entire study area. The error in height was 5 cm, and the horizontal resolution was 50 cm. The average point density was 6–10 points per m2. For cells with no data, we calculated the height values using inverse distance weighting [40] within a search radius of 60 m for the DTM and 160 m for the DSM. The CHM was constructed as the difference between the DSM and the DTM, thereby representing the actual height of the tree crowns at the same resolution of the DTM (Figure 2).
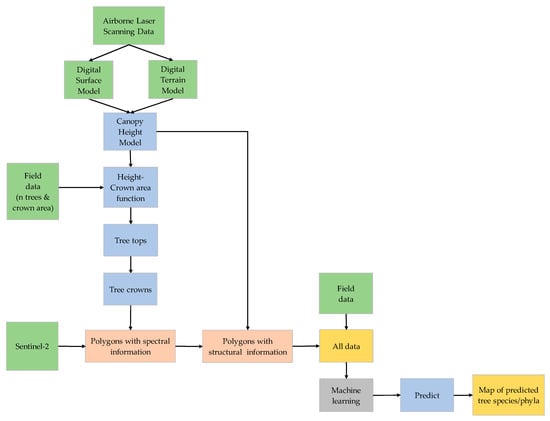
Figure 2.
Flowchart showing the methodology.
2.4. Satellite Imagery and Pre-Processing
The spectral information of the individual tree crowns was extracted from Sentinel-2 imagery. The Sentinel-2 satellite program is part of Copernicus, an Earth observation program of the European Union. Sentinel-2 consists of two satellites that have a sun-synchronous polar orbit at 786 km altitude. Both satellites carry a multi-spectral instrument (MSI) with 13 spectral bands, covering the visible (VIS), the near infra-red (NIR), and the short wave infra-red (SWIR) at different spatial resolutions ranging from 10 to 60 m. The MSI is a passive, optical push-broom sensor with a swath width of 290 km. This results in a short revisit time of around five days, increasing the chance to get cloud free images [41].
For image selection, we used two criteria, (1) images should be free of any cloud/haze cover in the study area, and (2) image acquisition time should be close to the date of the field data collection. The Sentinel images used were from 18 September 2018, 17 November 2018, 21 April 2019, and 26 August 2019 to enable the detection of phenological changes. We assumed that no significant changes in forest cover had taken place between the different acquisition dates.
The Sentinel-2 10 m resolution bands were downloaded via the external Semi-Automatic Classification Plugin (SCP, version 6.4.0.2) within Quantum GIS (QGIS, version 3.6.3). We included the blue (band 2, 490 nm), the green (band 3, 560 nm), the red (band 4, 665 nm), and the near infrared (band 8, 842 nm) bands (Table 2). Subsequently, the Dark Object Subtraction 1 (DOS1) atmospheric correction within the SCP was performed on all images [42]. A total of 16 images, 4 bands for each date, were clipped to the extent of the research area and subsequently stacked. The geographic coordinate system used during the analysis was set to EPSG:28992—Amersfoort/RD New—Projected.

Table 2.
Characteristics of Sentinel-2 satellite data used in this study.
2.5. Delineation of Tree Crowns
For tree species and phylum classification, we applied an object-based approach using automatically delineated tree crowns as spatial polygons (Figure 2). The data processing and analyses were performed in R (version 3.6.0) and QGIS (version 3.6.3). The classification models were used to predict the species and phyla of all trees present in the entire study area.
We applied the method described by Popescu and Wyne [43] to detect tree tops and delineate tree crowns. In the CHM, tree tops were detected using the R-package lidR (version 2.0.3) [44]. This function applies a variable window technique with a local maximum (LM) filter. A pixel is identified as a local maximum when its neighbouring pixels have a lower height value [45]. The LM filter has a circular or a square search window. The former was used in this study, since a circular window is a better approximation of a tree crown compared to a square [43]. The search window size should be adjusted to a size that corresponds to the tree crown present on the CHM. The algorithm from lidR records the height of each pixel and calculates the search window size for the local maximum filter based on a predefined function that describes the relationship between tree height and crown area. The R-package ForestTools (version 0.2.0) [46] was applied to delineate tree crowns from the tree top data and the CHM. This function implements a watershed segmentation to outline crowns from a CHM. It extends a region from the highest point, as long as the neighbouring pixels have a lower height value [47].
The field-estimated crown area data allowed us to fit a tree crown area–height relationship to prescribe the search window size for the LM filter. We tested both linear (Crown area = a + b ∗ Height) and quadratic functions (Crown area = a + b ∗ Height2), in which a and b represent the intercept and the slope of the relationship, respectively. The tree crown area–height relationship that best described our data was:
First, the root mean square error (RMSE) was calculated for the number of trees in each plot. The number of trees measured in the field were compared to the number of trees derived from the LM filter, for which a and b parameters were modified. The values of a and b of both the linear and the quadratic function that gave the lowest RMSE in the grid-search were chosen. The RMSE results with the different variables are shown in Appendix A Figure A3 and Table A1 and Table A2. The linear function 1.2 + 0.3 ∗ Height resulted in a RMSE value of 11.47 trees. The RMSE value of the function 3.1 + 0.0091 ∗ Height2 was 10.65 trees.
Second, the field-measured crown area was compared with the crown area derived from the automatically delineated tree crowns. The measured tree and the nearest derived tree top were coupled using distance matrix. This matrix measures the distance between the GPS location of the trees measured in the field and the coordinates of the derived tree tops. The RMSE of the tree crowns of the eight most common species are tabulated in Appendix A Table A3. The function that gave the lowest RMSE for tree crowns was the linear function, which was chosen to delineate all tree tops and crowns in the study area, for which we applied a minimum threshold of 2 m tree height and 2 m2 crown area.
2.6. Crown Structural and Spectral Information
For each delineated tree crown, we extracted several crown structural features from the CHM. These included minimum, maximum, sum, mean, median, standard deviation, range, and variance of tree height and crown projected surface area.
From the Sentinel-2 imagery, the mean spectral values for all downloaded bands were extracted to the delineated tree crowns using the R-package velox (version 0.2.0) [48]. Centroids from the Sentinel-2 pixels that overlapped with the tree crowns were averaged for each individual crown. For small tree crowns that did not intersect with any Sentinel-2 pixel centroid, the spectral values of the nearest pixel centroid were assigned.
The location of the trees measured in the field were connected to the nearest centre of a delineated tree crown by using a distance matrix. The nearest distance ranged between 0.1 m and 16.8 m, and the mean distance was 2.4 m. Trees with a nearest distance larger than 6 m were excluded from the analysis. The mean crown area for those trees was 30.7 m2 (SD = 20.1 m2).
Delineated tree crowns sometimes covered multiple sampled trees, and those trees were connected to the same centre of the crown. In this case, we assigned the field-measured tree with the most similar crown area as from the delineated tree crown to this crown. This procedure slightly reduced the sample size (Table 3).

Table 3.
Data (n = 1922) used in the random forest classification. The eight most common species and the anthropogenic features class were used into the species classification; the phylum classification included all classes.
2.7. Random Forest Classification
The random forest (RF) model, a non-parametric algorithm, has previously shown to perform well in tree species and group classifications [26]. The RF model consists of an ensemble of decision trees. Each tree is constructed by taking an individual bootstrap sample randomly from the original training dataset. The tree consists of multiple nodes. At each node, the data are split according to the features, for instance, the maximum height or the value of a spectral band. At each node, a subset of features is randomly selected. The best-splitting feature is determined by the Gini criterion and subsequently chosen.
The classification error is estimated by using the samples that are not present in the bootstrap sample (out-of-bag data, OOB). The samples in the OOB dataset are classified by the corresponding decision tree. For each sample in the original dataset, the majority vote in classification outcomes of the decision trees is compared to the true label. This gives an estimate of the misclassification rate.
The explanatory power of the input variables is calculated by the mean decrease in accuracy (MDA) and the mean decrease in Gini (MDG). The MDA of a variable is assessed by randomly converting the values of the variable for the OOB data, while values of the other variables are kept constant. The misclassification rate is compared with the randomly commuted rate, resulting in the importance of the variable. The decreases in the splitting criterion Gini are summarised and normalized by the number of trees in the forest to calculate the MDG of a variable [49].
In this study, we performed classifications based on different combinations of crown structural and spectral features. We tested the classification suitability of the following combinations of features: (1) both the crown structural variables and the spectral data from four seasons; (2) only the spectral data from four seasons; (3) only the crown structural variables; and (4) the crown structural variables in combination with spectral data from only one season.
We used the R-package randomForest (version 4.6.14) [49,50] for tree species and phylum classification. The RF model requires two parameters: (1) the number of input variables randomly split at each node, and (2) the number of classification trees or bootstrap iterations. The number of split variables (mtry) was optimised, which searches the optimal value of mtry compared to the OOB error. The number of trees (ntree) was set to 500. Using the VSURF R-package (version 1.1.0) [51,52] and the established mtry and ntree values, we selected uncorrelated and most relevant variables from the dataset. The data for each sampled tree species and anthropogenic features were randomly split; two thirds of each class were used to train the RF model on all classification combinations and levels. The remaining one third of the data were used to validate the RF model and to calculate the classification accuracies. The classification accuracies were based on the label (species or phylum) the delineated tree crown should have had based on field observations and what it was predicted to be by the RF model. Finally, for each automatically delineated tree crown in the entire research area, we predicted its species and phylum using the best performing RF model.
3. Results
3.1. Model Performance
We found that the highest classification accuracies were obtained by the RF model that combined both the crown structural and the multitemporal spectral features (Table 4). The all variables classification on tree species level (AVS) used 15 out of 25 possible variables (Appendix A Table A4) and showed the highest accuracy, 78.5% (Kappa value 0.75), of all models. Without anthropogenic features, the classification accuracy was 74.9% (Kappa value 0.70). On tree phylum level, all models showed higher accuracies compared to the classification of tree species (Table 4). The highest accuracy, 84.5% (Kappa value 0.72), was also obtained when all spectral and crown structural variables (AVP) were used by the RF model. The accuracy was 82.9% (Kappa value 0.63) when anthropogenic features were excluded from the accuracy assessment.

Table 4.
Accuracy and Kappa values of classifications based on different combinations of variables, for both tree species and tree phylum level.
The classification based on only crown structural variables (species crown structure variables (StVS) and phylum crown structure variables (StVP)) resulted in the lowest accuracies for the species and the phylum classifications, while the classification using only spectral variables (species spectral variables (SpVS) and phylum spectral variables (SpVP)) resulted in a slightly lower accuracy compared to the species all variables (AVS) and the phylum all variables (AVP). Of the models that used bands from only one Sentinel-2 image, the highest accuracy for species classification was obtained from the summer image (species summer image (SuIS)), and for phylum classification from the spring image (phylum spring image (SpIP)).
We evaluated the RF model prediction accuracy on different ranges of tree crown area, which were obtained for each delineated tree crown from the CHM. The number of trees per species for every crown area class is shown in Figure 3a. Some tree species predominantly had small crown areas, for instance, common oak (Quercus robur) and silver birch (Betula pendula). In Figure 3b, the classification accuracy as a function of crown area class is plotted on species and phylum levels. While classification accuracies slightly varied over different crown area classes, we could not detect a clear relationship between crown area and classification accuracy.
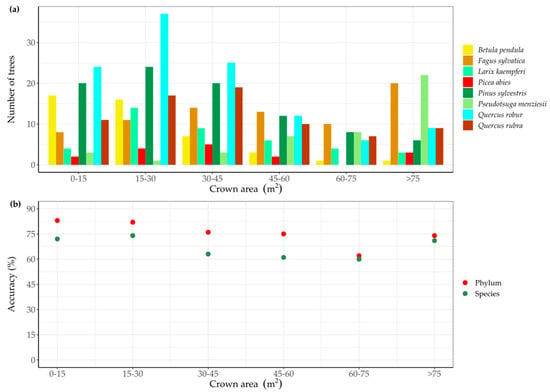
Figure 3.
The number of trees per tree species for different tree crown area classes in validation data (a) and the classification accuracy in function of tree crown area class on both species and phylum levels (b).
The mean spectral reflectance of the eight common tree species and the two tree phyla are presented in Appendix A Figure A4 and Figure A5. Some species showed spectral overlap, such as the Japanese larch (Larix kaempferi) with the Norway spruce (Picea abies). The results showed higher reflectance values in the near infrared band (B08) for angiosperm trees compared to gymnosperm trees. European beech (Fagus sylvatica) and northern red oak (Quercus rubra) showed the highest near infrared reflectance values. The values of all bands used in this study differed mostly for the bands from autumn and winter and less for the band from the spring images.
3.2. Object-Based Classification of Tree Species
The confusion matrix in Figure 4 summarizes the results for the classification of the eight most common tree species and anthropogenic features. The classification was based on the model that used all variables (AVS). The misclassifications mostly occurred between common oak (Quercus robur), Scots pine (Pinus Sylvestris), and silver birch (Betula pendula). Species with the highest relative classification accuracies were Douglas fir (Pseudotsuga menziesii; 95.3%), northern red oak (Quercus rubra; 82.2%), and European beech (Fagus sylvatica; 81.8%). The lowest relative classification accuracies occurred for Norway spruce (Picea abies; 43.8%) and Japanese larch (Larix kaempferi; 55%).
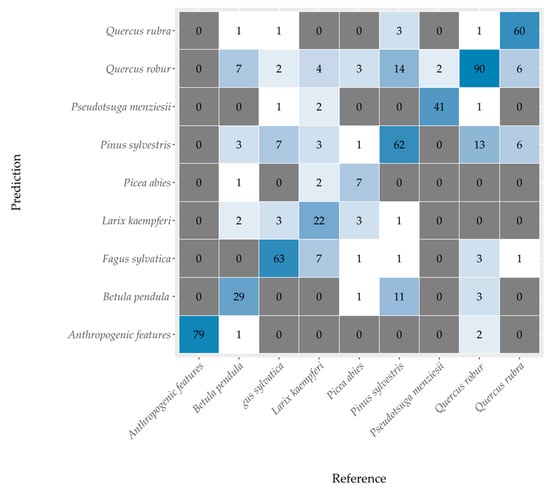
Figure 4.
Confusion matrix of the random forest performed on all variables on tree species level (accuracy 78.5% and Kappa value 0.75). Anthropogenic features were also included in the evaluation.
The variable importance plot (Figure 5) indicates that the important variable was the red (B04) band from the spring image, followed by the red (B04) band from the winter period. The variable height range had the highest MDG value.
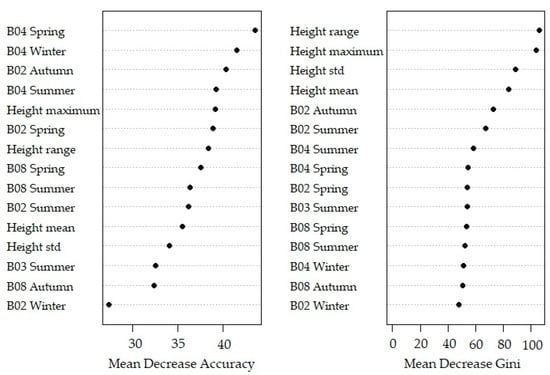
Figure 5.
Variable importance plot of the random forest of all variables on species level.
3.3. Object-Based Classification of Tree Phyla
The results of the classification accuracy of the tree phylum model using all variables (AVP) are presented in Figure 6. Of the 343 angiosperm trees, 29 trees were misclassified as gymnosperm trees (8.5%) and two as anthropogenic features (0.6%). Gymnosperm trees were only misclassified as angiosperm trees for 69 out of 218 tree crowns (31.2%). Scots pine had the highest contributions in the misclassifications; 41 out of 69 misclassified tree crowns were Scots pines (59.4%). The variable with the highest MDA was the median tree height (Figure 7).
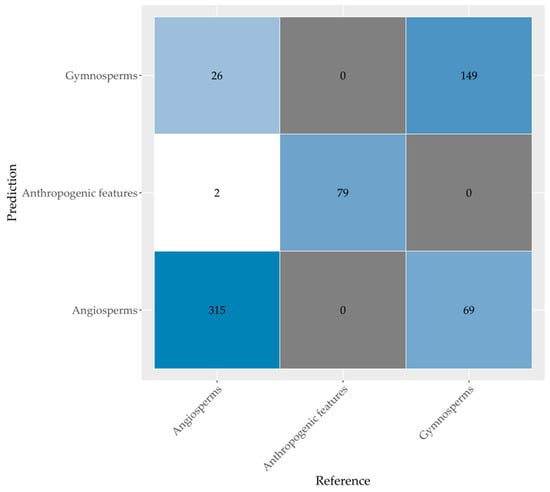
Figure 6.
Confusion matrix of the random forest performed on all variables on tree phylum level (accuracy 84.5% and Kappa value 0.73). Anthropogenic features were also included in the evaluation.
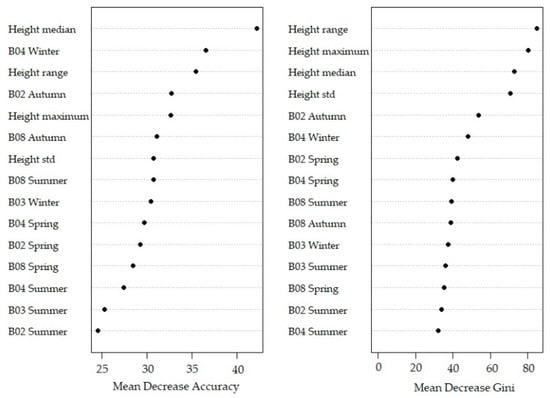
Figure 7.
Variable importance plot of the random forest of all variables on phylum level.
3.4. Extrapolation Over the Entire Study Area
The AVS and the AVG classification models were used to identify all delineated tree crowns in the study area to species and phylum levels (Figure 8). First, the individual tree crown polygons were delineated on the CHM using a variable window filter, the size of which was determined by the tree crown area–height relationship (Figure 8a). The crown structural features were calculated from the CHM. Then, the spectral information was extracted for each delineated tree crown from the Sentinel-2 imagery (Figure 8b). The spectral and the crown structural information combined were used to construct a RF classification model with the field samples. This model was subsequently applied to predict the tree species (Figure 8c) and the tree phylum (Figure 8d) for each delineated tree crown. The tree species prediction was based on the eight most common tree species and included anthropogenic features. We used all 26 sampled species in the tree phylum prediction (Table 3).
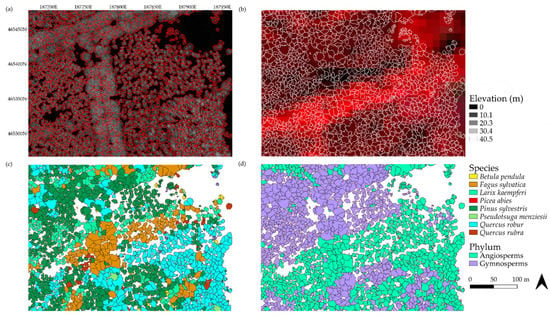
Figure 8.
Different steps of our method visualised for a region within the study area. In figure (a), the delineated tree crowns are plotted over the canopy height model, in figure (b), the delineated crowns are plotted over a false colour composite (composed of near infra-red (NIR), red, and green bands) of the Sentinel-2 image from August 2019. Figure (c) shows the tree species classification result for the all variables model (AVS), and (d) for the tree phylum classification (AVP). Species and phyla were predicted with the random forest model using selected spectral and crown structural variables.
The total number of the eight most common tree species in the study area is tabulated in Table 5. The tree species with the highest number of trees and highest tree density were common oak (Quercus robur; 63.5 trees/ha), Scots pine (Pinus sylvestris; 40.7 trees/ha), and silver birch (Betula pendula; 36.0 tree/ha). Norway spruce (Picea abies; 3.0 trees/ha) and Douglas fir (Pseudotsuga menziesii; 4.9 trees/ha) were less common. The tree density in the study area was, on average, 178.8 trees per hectare.

Table 5.
The number of trees and density of the eight most common tree species on the Veluwe. The numbers are based on the prediction which combined the multitemporal Sentinel-2 spectral data with the ALS-derived crown structural variables.
4. Discussion
Here, we demonstrate the high potential of integrating spectral and structural data to automatically delineate individual tree crowns and subsequently classify these crowns to the species level. Our method enables the development of detailed tree species distribution maps over large areas on the condition that high resolution elevation data for these areas are available.
4.1. Detection of Tree Tops and Segmentation of Tree Crowns
The aim of this study was to develop a tree species classification method that could be easily upscaled and applied on a nationwide level. In our study, the automatic segmentation of tree crowns was performed by applying a local maximum filter with a variable window size in combination with a watershed algorithm [53] over a canopy height model. We derived the function prescribing the window size by fitting a relationship between field measured crown area and CHM derived tree height. This approach resulted in relatively low errors in estimation of the crown area in the gymnosperm trees (e.g., Scots pine: 31.7 m2) and the silver birch (RMSE: 27.9 m2) and relatively high errors in the estimation of crown area in other angiosperm trees (e.g., European beech: 67.0 m2). The LM filter performed very well in the detection of tree tops of trees with a single well-defined apex, such as most gymnosperm trees [43]. The detection of tree tops was more challenging for most angiosperm trees, as large variations in the crown topography are typical, resulting in a single crown having several smaller local maxima. Consequently, a single individual tree could be overly segmented into several connected tree crowns. This logically resulted in the underestimation of tree crown area and the overestimation of individual trees per unit of ground surface area. Another challenge in crown delineation was the detection of relatively small or covered trees. It was difficult to separate tree crowns in a dense forest with a homogenous canopy [45]. Accordingly, the number of trees may be underestimated since a delineated tree crown can cover several trees.
Some field-measured trees, 26 in total, were removed from the dataset, as the distance between the field-measured tree and the centre of the delineated tree crown exceeded 6 m. The mean field measured crown area of those trees was 30.7 m2. The relatively small crown area of the omitted trees suggests that the detectability of trees increases with crown area. This can be explained as short and small crown area trees have a higher probability of being covered by larger neighbouring trees, hampering the detection of some small trees in the CHM. The detection of tree crowns in our LM filter may thus perform better in forest stands occupied by mainly large and mature trees.
Other techniques to delineate tree crowns exist, which include point cloud-based methods to derive vertical and horizontal characteristics of forests [20,54,55]. These methods, however, are only applied in studies focussing on the structural characteristics of a forest [56,57], and to our knowledge have not yet been applied in studies with a focus on tree species classification. Previous studies on tree species classification used manually segmented individual tree crowns, e.g., [17,19]. Manual tree crown delineation cannot be upscaled over large areas, as it is highly labour-intensive [20,58]. In this study, we overcame this problem by developing an automated tree species classification method.
4.2. Variable Combinations
The highest classification accuracies were obtained by the RF models that used both spectral and crown structural variables (AVS and AVP). The overall accuracies were 78.5% (Kappa value 0.75) for tree species and 84.5% (Kappa value 0.73) for tree phyla. For the classifications at both species and phylum level, models only leveraging spectral information consistently outperformed models that only included structural information. However, overall accuracy was the highest when spectral and structural information were combined in a single classifier.
The classification model combining spectral data for all seasons resulted in higher accuracies compared to those that used the spectral bands from an image captured in only one season. The power of the RF model thus increased by using multitemporal spectral dataset. In studies conducted in boreal regions with angiosperm trees and gymnosperm trees, similar results regarding the use of multitemporal imagery have been reported [14,33,59]. Persson et al. [18] classified trees in homogenous plots with Sentinel-2 data in Sweden. The authors reported an overall accuracy of 88.2% (Kappa value 0.84) and showed that gymnosperm trees can be more easily separated from angiosperm trees with a multitemporal dataset. In their study, the May (spring) image resulted in the highest accuracy of all seasons, which the authors attributed to the fact that phenological variation between species is highest in late spring. In our study, the highest accuracy was obtained with the August (summer) image for species classification and with the April (spring) image for phylum classification. In spring and autumn, the phenological variation between tree species should be the highest due to leaf onset and senescence, respectively [60]. Using only the September (autumn) image resulted in a classification model with the second lowest accuracy of all models used in our study (Table 4). This may be due to the fact that the timing of the image may not have fully captured the period of leaf senescence. Indeed, a visual inspection of the Sentinel-2 imagery from September 2018 did not show large colour variations of the canopy for different trees species.
Including crown structural variables in the RF model also improved the overall classification accuracies. Similar results were reported with both multispectral imagery [61] and hyperspectral imagery [30,62,63]. Jones et al. [64] showed that mapping accuracy increased for species that are dominated by a distinct growth stage, as it is characterized by ALS-derived information. In that study, the accuracies also improved for classes with similar spectral properties but different mean canopy heights [13,64].
4.3. Classification of Tree Species and Phyla
On tree species level, the classes with the highest user’s accuracies were Douglas fir (Pseudotsuga menziesii), northern red oak (Quercus rubra), and European beech (Fagus sylvatica). Scots pine (Pinus sylvestris), common oak (Quercus robur), and silver birch (Betula pendula) were relatively often misclassified as one another. This was probably due to the fact that these species often occurred together in a single forest stand, thus the spectral signature of a tree from one species influenced the spectral signature of a neighbouring tree from another species in the relatively large Sentinel-2 pixels (10 m). Furthermore, next to the potential spatial overlap, spectral can also contribute to misclassifications of tree species, as, for example, was observed with the high similarity of the spectral signature of Japanese larch (Larix kaempefri) and Norway spruce (Picea abies) (Figure A4). The angiosperm trees showed higher reflectance values in the near infrared band compared to gymnosperm trees, and the values differed mostly for autumn and winter images (Figure A4). Similar results in spectral reflectance and variability in classification accuracies are also reported by Immitzer et al. [7] and are contributed to spectral overlap. Finally, in areas with an open canopy, the reflectance of soil and undergrowth might also be present in the spectral signature of single tree crowns [11]. For example, the silver birch (Betula pendula) individuals in our dataset were often found as solitary trees on the open heathlands. The spectral signal of the birch trees might therefore be influenced by the spectral reflectance of the heather that is present in the Sentinel-2 pixel covering these individual crowns.
To limit the “mixing” of the spectral signal in single tree crowns, our study only employed the Sentinel-2 bands with a 10 m spatial resolution: blue, green, red, and NIR bands. The importance of the Sentinel-2 red edge bands with 20 m spatial resolution for tree species classification has been pointed out in previous studies [7,18,65]. However, spectral mixing in the coarser Sentinel-2 red edge pixels has been found to offset the added information in the red edge, resulting in a lower classification accuracy compared to classification accuracies based on only the 10 m resolution bands [17]. Therefore, in this study, the red edge bands were not included in the analysis.
The spatial resolution of Sentinel-2 imagery was significantly lower compared to the 0.5 m spatial resolution of the CHM. This discrepancy could limit the accuracy of the RF models, as a Sentinel-2 pixel can cover multiple individual trees as well as soil and undergrowth. It can be expected that larger tree crowns are more accurately classified as they cover more complete Sentinel-2 pixels and therefore should show a spectral signature that is less influenced by inference from neighbouring trees and undergrowth. However, we found that classification accuracies did not improve or decrease with increasing crown area (Figure 3). This suggests that species and phylum prediction of trees with relatively large crowns is not necessarily more accurate. We note that the lack of a trend may also partly be explained by the unequal distribution of the number of trees per species over the crown area classes. Improvements in classification accuracy would be possible by using higher resolution spectral data, such as airborne acquisitions. This imagery, however, would be expensive to acquire, in contrast to the freely available Sentinel-2 imagery.
Despite potential improvements in prediction accuracy that could follow from including higher resolution multispectral data, our study demonstrated relatively high classification accuracies for the most common tree species in our study area. The results were comparable to another tree classification study [30], although comparison to other studies is difficult since studies were conducted with different imagery and methods for different tree species and numbers and in other geographical areas. Our approach likely performs well in ecosystems with relatively low tree density and diversity, such as temperate and boreal forests and savanna ecosystems. In dense and diverse ecosystems, such as tropical forests, our method may have difficulties in delineating individual tree crowns and separating the spectral signals of individual trees [66]. To our knowledge, we were the first to combine an automatic tree crown delineation algorithm with a species classification routine based on high resolution ALS derived structural data and multitemporal Sentinel-2 imagery. Furthermore, in contrast to many earlier studies, we applied this object-oriented method to mixed forest stands. In summary, our approach performed well for classifying tree species and phyla in a temperate forest in The Netherlands, even obtaining relatively high classification accuracies of 78.5% (Kappa value 0.75) for tree species and 84.5% (Kappa value 0.73) for tree phyla.
5. Conclusions
In this study, we developed a novel method to automatically delineate individual tree crowns and subsequently classify these crowns to the species level using freely available Sentinel-2 satellite imagery and ALS data. Using this method, we created a detailed tree species distribution map of eight dominant tree species for a 140 km2 mixed temperate forest in the Veluwe, The Netherlands. Trees were sampled in heterogeneous field plots or as individual trees, resulting in a sample size of 2460 trees. We delineated tree crowns automatically from a constructed canopy height model on which tree tops were detected with a local maximum filter. The local maximum filter used a linear tree crown area–height relationship fitted from our field data, and tree crowns were delineated using a watershed segmentation. The local maximum filter and the watershed segmentation performed well for gymnosperm trees but experienced difficulties with large angiosperm trees with a complex crown structure. The automatic crown delineation method was also not able to detect small understory trees beneath a closed canopy.
We used reference data in an object-based random forest model, and the results were validated with an independent dataset. Different combinations of feature sets were tested. The features included spectral variables of the 10 m resolution bands of Sentinel-2 images and crown structural variables calculated from the ALS derived canopy height model dataset. Sentinel-2 imagery was acquired for 18 September 2018, 17 November 2018, 21 April 2019, and 26 August 2019 to cover phenological changes. After variable reduction, the model obtained the highest accuracies for the classification with spectral and crown structural variables combined (78.5%, Kappa value 0.75 for tree species; and 85.5%, Kappa value 0.73 for tree phyla). Adding phenological and crown structural information thus improved classification results. Still, misclassifications occurred, probably due to mixing of understory reflectance, clustered trees from different species due to the coarse resolution of Sentinel-2 imagery, and unequal distribution of samples over the classes.
We extrapolated the RF models over the entire 140 km2 study area to generate tree species and tree phyla maps of individual trees. These maps of detailed tree species distributions can be a highly valuable tool for forest management, ecological surveys, and forest fire management. Our classification models can also be extended to other forest areas that are characterised by the presence of the same species and by a comparable forest structure.
Author Contributions
This article is based on the master’s research project written by V.P. at VU Amsterdam. V.P. collected the field data, pre-processed the data, developed the methodology, validated and interpreted the results, and wrote the article. T.J. conceived and designed the analysis, co-developed the methodology, and supported with the collection of field data. S.V. provided materials for field data, co-developed the methodology, enabled the collaboration between the institutions collection, and supervised the research. N.B. discussed and provided information about the study area in the Veluwe. S.V., T.J., and N.B. have critically reviewed and commented on the article. All authors have read and agreed to the published version of the manuscript.
Funding
T.J. was funded by The Netherlands Earth System Science Centre (NESSC), financially supported by the Ministry of Education, Culture and Science (OCW; grant 024.002.001).
Acknowledgments
We would like to thank Constantijn Kok, from Veiligheidsregio Noord en Oost Gelderland, Apeldoorn, for enabling access to the study area and providing information about the Veluwe.
Conflicts of Interest
The authors declare no conflict of interest.
Appendix A
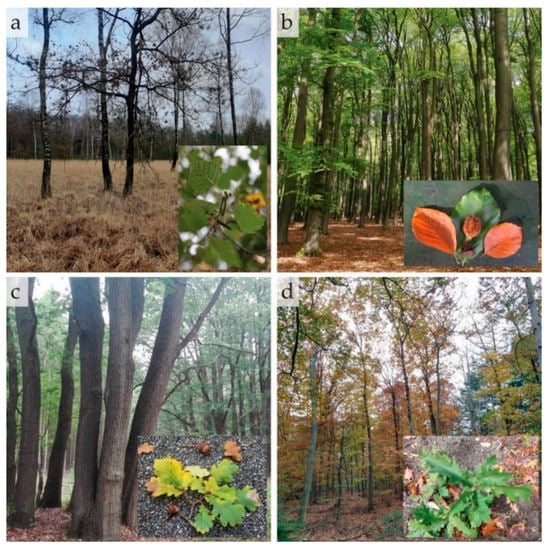
Figure A1.
The general habitat appearance and foliage of the four angiosperm tree species used in the analysis with (a) silver birch (Betula pendula), (b) European beech (Fagus sylvatica), (c) common oak (Quercus robur), and (d) northern red oak (Quercus rubra). All photographs were made by the authors.
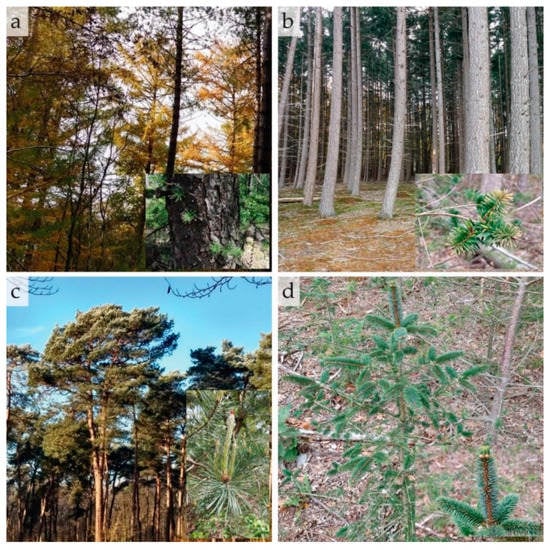
Figure A2.
The general habitat appearance and foliage of the four gymnosperm tree species used in the analysis with (a) Japanese larch (Larix kaempferi), (b) Norway spruce (Picea abies), (c) Scots pine (Pinus sylvestris), and (d) Douglas fir (Pseudotsuga menziesii). All photographs were made by the authors.
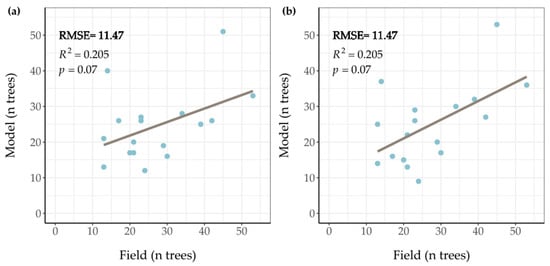
Figure A3.
Scatterplots and regression lines comparing the number of measured trees in the field with the number of trees from the model per plot. Plot (a) is a comparison for the linear function 1.2 + 0.3 ∗ Height and plot (b) is the comparison for the quadratic function 3.1 + 0.0091 ∗ Height2.

Table A1.
Root mean square error (RMSE) of the number of trees measured in the field against the number of trees from the model. The RMSE is calculated to optimize the tree crown area–height relationship. The table shows the RMSE for the linear function y = a + b ∗ Height. The rows indicate the parameter a and the columns parameter b. The RMSE is the most optimal with the function Crown area = 1.2 + 0.3 ∗ Height.
| a | b | ||||
|---|---|---|---|---|---|
| 0.1 | 0.2 | 0.3 | 0.4 | 0.5 | |
| 1.1 | 132.3 | 31.1 | 11.8 | 15.3 | 19.2 |
| 1.2 | 113.5 | 27.8 | 11.5 | 15.8 | 19.7 |
| 1.3 | 101.4 | 24.0 | 11.6 | 16.3 | 20.3 |
| 1.4 | 89.3 | 21.3 | 12.2 | 16.5 | 20.7 |
| 1.5 | 78.3 | 18.3 | 12.4 | 16.8 | 20.8 |

Table A2.
RMSE of the number of trees measured in the field against the number of trees from the model. The table shows the RMSE for the quadratic function y = a + b ∗ Height2. The rows indicate the parameter a and the columns parameter b. The RMSE is the most optimal with the function Crown area = 3.1 + 0.0091∗ Height2.
| a | b | ||||
|---|---|---|---|---|---|
| 0.0091 | 0.0092 | 0.0093 | 0.0094 | 0.0095 | |
| 2.5 | 16.1 | 15.9 | 15.5 | 15.2 | 15.1 |
| 2.6 | 14.2 | 14.1 | 13.9 | 13.6 | 13.6 |
| 2.7 | 12.8 | 12.7 | 12.3 | 12.2 | 12.3 |
| 2.8 | 12.3 | 12.3 | 12.0 | 11.8 | 11.8 |
| 2.9 | 11.4 | 11.4 | 11.4 | 11.3 | 11.2 |
| 3 | 10.9 | 10.8 | 10.8 | 10.9 | 11.0 |
| 3.1 | 10.6 | 10.8 | 10.9 | 11.1 | 11.1 |
| 3.2 | 11.0 | 11.1 | 11.2 | 11.2 | 11.2 |
| 3.3 | 11.5 | 11.5 | 11.6 | 12.0 | 12.0 |
| 3.4 | 11.8 | 12.0 | 12.0 | 12.0 | 12.0 |

Table A3.
The RMSE of predicted tree crown area (m2) as a linear or quadratic function of tree height (H). The table contains the RMSE values for the eight most common tree species on the Veluwe. The RMSE is calculated to determine whether linear or quadratic tree crown area–height relationship fits the data the best. The linear function showed to be the most robust and was therefore chosen.
| Tree Species | Function | |
|---|---|---|
| 1.2 + 0.3 ∗ H | 3.1 + 0.0091 ∗ H2 | |
| Betula pendula | 27.9 | 28.1 |
| Fagus sylvatica | 67.0 | 67.4 |
| Larix kaempferi | 39.9 | 40.9 |
| Picea abies | 27.4 | 27.4 |
| Pinus sylvestris | 31.7 | 29.2 |
| Pseudotsuga menziesii | 49.8 | 52.2 |
| Quercus robur | 48.3 | 48.0 |
| Quercus rubra | 56.6 | 56.6 |
| All species | 54.1 | 54.4 |

Table A4.
The spectral and crown structural variables used in the Random Forest model. The black X’s indicate the selected variables at species level; the blue X’s indicate the ones selected at phylum level.
Table A4.
The spectral and crown structural variables used in the Random Forest model. The black X’s indicate the selected variables at species level; the blue X’s indicate the ones selected at phylum level.
| Description | Feature | Classification | |||||||||||||
|---|---|---|---|---|---|---|---|---|---|---|---|---|---|---|---|
| All Variables | Crown Structural | Spectral | Autumn | Winter | Spring | Summer | |||||||||
| Blue band–September 2018 | B02 Autumn | X | X | X | X | X | X | ||||||||
| Green band–September 2018 | B03 Autumn | X | X | X | X | ||||||||||
| Red band–September 2018 | B04 Autumn | X | X | X | |||||||||||
| NIR band–September 2018 | B08 Autumn | X | X | X | X | X | |||||||||
| Blue band–November 2018 | B02 Winter | X | X | ||||||||||||
| Green band–November 2018 | B03 Winter | X | X | X | X | ||||||||||
| Red band–November 2018 | B04 Winter | X | X | X | X | X | X | ||||||||
| NIR band–November 2018 | B08 Winter | X | X | X | X | ||||||||||
| Blue band–April 2019 | B02 Spring | X | X | X | X | X | X | ||||||||
| Green band–April 2019 | B03 Spring | X | X | ||||||||||||
| Red band–April 2019 | B04 Spring | X | X | X | X | X | X | ||||||||
| NIR band–April 2019 | B08 Spring | X | X | X | X | X | X | ||||||||
| Blue band–August 2019 | B02 Summer | X | X | X | X | X | X | ||||||||
| Green band–August 2019 | B03 Summer | X | X | X | X | X | |||||||||
| Red band–August 2019 | B04 Summer | X | X | X | X | X | X | ||||||||
| NIR band–August 2019 | B08 Summer | X | X | X | X | X | X | ||||||||
| Crown area | Crown area | X | X | ||||||||||||
| Maximum height | Height maximum | X | X | X | X | X | X | X | X | X | X | X | X | ||
| Minimum height | Height minimum | X | X | ||||||||||||
| Mean height | Height mean | X | X | X | X | X | |||||||||
| Median height | Height median | X | X | X | X | X | X | X | X | X | X | X | |||
| Height sum | Height sum | X | X | ||||||||||||
| Standard deviation height | Height std | X | X | X | X | X | X | X | X | X | X | X | |||
| Height range | Height range | X | X | X | X | X | X | X | X | X | X | X | X | ||
| Height variance | Height variance | X | X | X | |||||||||||
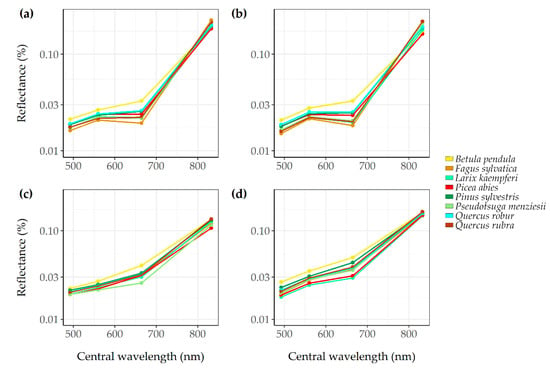
Figure A4.
Mean spectral reflectance of the eight most common tree species on the Veluwe for the blue (B02), green (B03), the red (B04), and the near infrared (B08) Sentinel-2 bands. The spectral reflectance is calculated for each season: summer (a), autumn (b), winter (c), and spring (d).
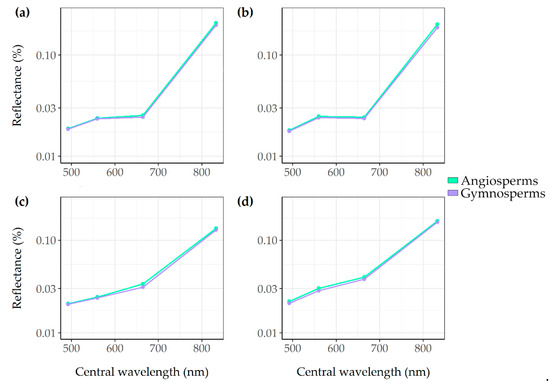
Figure A5.
Mean spectral reflectance of the tree phyla for the blue (B02), green (B03), the red (B04), and the near infrared (B08) Sentinel-2 bands. For each season, the reflectance is calculated: summer (a), autumn (b), winter (c), and spring (d).
References
- Gower, S.T. Patterns and Mechanisms of the Forest Carbon Cycle. Annu. Rev. Environ. Resour. 2003, 28, 169–204. [Google Scholar] [CrossRef]
- Kovats, R.S.; Valentini, R.; Brouwer, L.M.; Georgopoulou, E.; Jacob, D.; Martin, E.; Rounsevell, M.; Soussana, J.-F. Europe. In Climate Change 2014: Impacts, Adaptation, and Vulnerability Part B: Regional Aspects.Contribution of Working Group II to the Fifth Assessment Report of the Intergovernmental Panel on Climate Change; Barros, V.R., Field, C.B., Dokken, D.J., Mastrandrea, M.D., Mach, K.J., Bilir, T.E., Chatterjee, M., Ebi, K.L., Estrada, Y.O., Genova, R.C., et al., Eds.; Cambridge University Press: Cambridge, UK; New York, NY, USA, 2014. [Google Scholar]
- Lindner, M.; Maroschek, M.; Netherer, S.; Kremer, A.; Barbati, A.; Garcia-Gonzalo, J.; Seidl, R.; Delzon, S.; Corona, P.; Kolström, M.; et al. Climate change impacts, adaptive capacity, and vulnerability of European forest ecosystems. For. Ecol. Manag. 2010, 259, 698–709. [Google Scholar] [CrossRef]
- Xanthopoulos, G.; Calfapietra, C.; Fernandes, P. Fire Hazard and Flammability of European Forest Types. In Post-Fire Management and Restoration of Southern European Forests; Moreira, F., Arianoutsou, M., Corona, P., De las Heras, J., Eds.; Managing Forest Ecosystems; Springer Netherlands: Dordrecht, The Netherlands, 2012; Volume 24, pp. 79–92. ISBN 978-94-007-2207-1. [Google Scholar]
- Varner, J.M.; Kane, J.M.; Kreye, J.K.; Engber, E. The Flammability of Forest and Woodland Litter: A Synthesis. Curr. For. Rep. 2015, 1, 91–99. [Google Scholar] [CrossRef]
- Lindenmayer, D.B.; Margules, C.R.; Botkin, D.B. Indicators of Biodiversity for Ecologically Sustainable Forest Management. Conserv. Biol. 2000, 14, 941–950. [Google Scholar] [CrossRef]
- Immitzer, M.; Atzberger, C.; Koukal, T. Tree Species Classification with Random Forest Using Very High Spatial Resolution 8-Band WorldView-2 Satellite Data. Remote Sens. 2012, 4, 2661–2693. [Google Scholar] [CrossRef]
- Roughgarden, J.; Running, S.W.; Matson, P.A. What Does Remote Sensing Do for Ecology? Ecology 1991, 72, 1918–1922. [Google Scholar] [CrossRef]
- Warner, T.A.; Nellis, M.D.; Foody, G.M. Remote Sensing Scale and Data Selection Issues. In The SAGE Handbook of Remote Sensing; SAGE Publications Inc.: London, UK, 2009; pp. 2–17. ISBN 978-1-4129-3616-3. [Google Scholar]
- Larsen, M. Single tree species classification with a hypothetical multi-spectral satellite. Remote Sens. Environ. 2007, 110, 523–532. [Google Scholar] [CrossRef]
- Fassnacht, F.E.; Latifi, H.; Stereńczak, K.; Modzelewska, A.; Lefsky, M.; Waser, L.T.; Straub, C.; Ghosh, A. Review of studies on tree species classification from remotely sensed data. Remote Sens. Environ. 2016, 186, 64–87. [Google Scholar] [CrossRef]
- Maschler, J.; Atzberger, C.; Immitzer, M. Individual Tree Crown Segmentation and Classification of 13 Tree Species Using Airborne Hyperspectral Data. Remote Sens. 2018, 10, 1218. [Google Scholar] [CrossRef]
- Anderson, J.; Plourde, L.; Martin, M.; Braswell, B.; Smith, M.; Dubayah, R.; Hofton, M.; Blair, J. Integrating waveform lidar with hyperspectral imagery for inventory of a northern temperate forest. Remote Sens. Environ. 2008, 112, 1856–1870. [Google Scholar] [CrossRef]
- Hill, R.A.; Wilson, A.K.; George, M.; Hinsley, S.A. Mapping tree species in temperate deciduous woodland using time-series multi-spectral data. Appl. Veg. Sci. 2010, 13, 86–99. [Google Scholar] [CrossRef]
- Sheeren, D.; Fauvel, M.; Josipović, V.; Lopes, M.; Planque, C.; Willm, J.; Dejoux, J.-F. Tree Species Classification in Temperate Forests Using Formosat-2 Satellite Image Time Series. Remote Sens. 2016, 8, 734. [Google Scholar] [CrossRef]
- Liu, Y.; Gong, W.; Hu, X.; Gong, J. Forest Type Identification with Random Forest Using Sentinel-1A, Sentinel-2A, Multi-Temporal Landsat-8 and DEM Data. Remote Sens. 2018, 10, 946. [Google Scholar] [CrossRef]
- Wessel, M.; Brandmeier, M.; Tiede, D. Evaluation of Different Machine Learning Algorithms for Scalable Classification of Tree Types and Tree Species Based on Sentinel-2 Data. Remote Sens. 2018, 10, 1419. [Google Scholar] [CrossRef]
- Persson, M.; Lindberg, E.; Reese, H. Tree Species Classification with Multi-Temporal Sentinel-2 Data. Remote Sens. 2018, 10, 1794. [Google Scholar] [CrossRef]
- Puletti, N.; Chianucci, F.; Castaldi, C. Use of Sentinel-2 for forest classification in Mediterranean environments. Ann. Silv. Res. 2018, 42, 7. [Google Scholar] [CrossRef]
- Zhen, Z.; Quackenbush, L.; Zhang, L. Trends in Automatic Individual Tree Crown Detection and Delineation—Evolution of LiDAR Data. Remote Sens. 2016, 8, 333. [Google Scholar] [CrossRef]
- Asner, G.P. Biophysical and Biochemical Sources of Variability in Canopy Reflectance. Remote Sens. Environ. 1998, 64, 234–253. [Google Scholar] [CrossRef]
- Clark, M.L.; Roberts, D.A. Species-Level Differences in Hyperspectral Metrics among Tropical Rainforest Trees as Determined by a Tree-Based Classifier. Remote Sens. 2012, 4, 1820–1855. [Google Scholar] [CrossRef]
- Dalponte, M.; Orka, H.O.; Gobakken, T.; Gianelle, D.; Naesset, E. Tree Species Classification in Boreal Forests with Hyperspectral Data. IEEE Trans. Geosci. Remote Sens. 2013, 51, 2632–2645. [Google Scholar] [CrossRef]
- Whiteside, T.G.; Boggs, G.S.; Maier, S.W. Comparing object-based and pixel-based classifications for mapping savannas. Int. J. Appl Earth Obs. 2011, 13, 884–893. [Google Scholar] [CrossRef]
- Weih, R.C.; Riggan, N.D. Object-based classification vs. Pixel-based classification: Comparative importance of multi-resolution imagery. ISPRS J. Photogramm. 2013, 38, 6. [Google Scholar]
- Breiman, L. Random Forest. Mach. Learn. 2001, 45, 5–32. [Google Scholar] [CrossRef]
- Rodriguez-Galiano, V.F.; Ghimire, B.; Rogan, J.; Chica-Olmo, M.; Rigol-Sanchez, J.P. An assessment of the effectiveness of a random forest classifier for land-cover classification. ISPRS J. Photogramm. 2012, 67, 93–104. [Google Scholar] [CrossRef]
- Pal, M. Random forest classifier for remote sensing classification. Int. J. Remote Sens. 2005, 26, 217–222. [Google Scholar] [CrossRef]
- Naidoo, L.; Cho, M.A.; Mathieu, R.; Asner, G. Classification of savanna tree species, in the Greater Kruger National Park region, by integrating hyperspectral and LiDAR data in a Random Forest data mining environment. ISPRS J. Photogramm. 2012, 69, 167–179. [Google Scholar] [CrossRef]
- Dalponte, M.; Bruzzone, L.; Gianelle, D. Tree species classification in the Southern Alps based on the fusion of very high geometrical resolution multispectral/hyperspectral images and LiDAR data. Remote Sens. Environ. 2012, 123, 258–270. [Google Scholar] [CrossRef]
- Holmgren, J.; Persson, Å.; Söderman, U. Species identification of individual trees by combining high resolution LiDAR data with multi-spectral images. Int. J. Remote Sens. 2008, 29, 1537–1552. [Google Scholar] [CrossRef]
- Chuine, I.; Beaubien, E.G. Phenology is a major determinant of tree species range. Ecol Lett. 2001, 4, 500–510. [Google Scholar] [CrossRef]
- Zhu, X.; Liu, D. Accurate mapping of forest types using dense seasonal Landsat time-series. ISPRS J. Photogramm. 2014, 96, 1–11. [Google Scholar] [CrossRef]
- Boyd, D.S.; Danson, F.M. Satellite remote sensing of forest resources: Three decades of research development. Prog. Phys. Geogr. 2005, 29, 1–26. [Google Scholar] [CrossRef]
- De Bilt. Langjarige Gemiddelden, Tijdvak 1981–2010; Koninklijk Nederlands Meteorologisch Instituut: Amsterdam, The Netherlands, 2011. [Google Scholar]
- Neefjes, J. Landschapsbiografie van de Veluwe Historisch-Landschappelijke Karakteristieken en hun Ontstaan; Rijksdienst voor het Cultureel Erfgoed & Staatsbosbeheer: Amersfoort, The Netherlands, 2018. [Google Scholar]
- Houte de Lange, S.M. (Ed.) Rapport van het Veluwe-Onderzoek: Een Onderzoek van Natuur, Landschap en Cultuurhistorie ten Behoeve van de Ruimtelijke Ordening en het Recreatiebeleid; Pudoc: Wageningen, The Netherlands, 1977; ISBN 978-90-220-0651-1. [Google Scholar]
- Algemeen Hoogte Bestand Actueel Hoogtebestand Nederland, Geschiedenis. Available online: https://www.ahn.nl/geschiedenis (accessed on 24 May 2020).
- Algemeen Hoogte Bestand Actueel Hoogtebestand Nederland—AHN: The Making of. Available online: https://www.ahn.nl/ahn-making (accessed on 24 May 2020).
- QGIS Fill Nodata. Available online: https://docs.qgis.org/2.8/en/docs/user_manual/processing_algs/gdalogr/gdal_analysis/fillnodata.html (accessed on 24 May 2020).
- Drusch, M.; Del Bello, U.; Carlier, S.; Colin, O.; Fernandez, V.; Gascon, F.; Hoersch, B.; Isola, C.; Laberinti, P.; Martimort, P.; et al. Sentinel-2: ESA’s Optical High-Resolution Mission for GMES Operational Services. Remote Sens. Environ. 2012, 120, 25–36. [Google Scholar] [CrossRef]
- Congedo, L. Semi-Automatic Classification Plugin User Manual. Available online: https://www.researchgate.net/publication/265031337_Semi-Automatic_Classification_Plugin_User_Manual (accessed on 24 May 2020).
- Popescu, S.C.; Wynne, R.H. Seeing the Trees in the Forest: Using Lidar and Multispectral Data Fusion with Local Filtering and Variable Window Size for Estimating Tree Height. Photogramm. Eng. Remote Sens. 2004, 70, 589–604. [Google Scholar] [CrossRef]
- Roussel, J.-R.; Auty, D.; De Boissieu, F.; Sánchez Meador, A.; Jean-François, B. Airborne LiDAR Data Manipulation and Visualization for Forestry Applications. Available online: https://rdrr.io/cran/lidR/ (accessed on 24 May 2020).
- Koch, B.; Heyder, U.; Weinacker, H. Detection of Individual Tree Crowns in Airborne Lidar Data. Photogramm. Eng. Remote Sens. 2006, 72, 357–363. [Google Scholar] [CrossRef]
- Plowright, A.; Roussel, J.-R. Analyzing Remotely Sensed Forest Data. Available online: https://cran.r-project.org/web/packages/ForestTools/ForestTools.pdf (accessed on 24 May 2020).
- Meyer, F.; Beucher, S. Morphological segmentation. J. Vis. Commun. Image R 1990, 1, 21–46. [Google Scholar] [CrossRef]
- Hunziker, P. Fast Raster Manipulation and Extraction. Available online: https://mran.microsoft.com/snapshot/2016-08-28/web/packages/velox/velox.pdf (accessed on 24 May 2020).
- Breiman, L. Manual on Setting Up, Using, and Understanding Random Forests v3. 1; Statistics Department, University of California, Berkeley: Berkeley, CA, USA, 2002. [Google Scholar]
- Breiman, L.; Culter, A.; Liaw, A.; Wiener, M. Breiman and Cutler’s Random Forests for Classification and Regression. Available online: https://cran.r-project.org/web/packages/randomForest/randomForest.pdf (accessed on 24 May 2020).
- Genuer, R.; Poggi, J.-M.; Tuleau-Malot, C. Variable Selection Using Random Forests. Available online: https://cran.r-project.org/web/packages/VSURF/VSURF.pdf (accessed on 24 May 2020).
- Genuer, R.; Poggi, J.-M.; Tuleau-Malot, C. VSURF: An R Package for Variable Selection Using Random Forests. R J. 2015, 7, 19–33. [Google Scholar] [CrossRef]
- Ke, Y.; Quackenbush, L.J. A review of methods for automatic individual tree-crown detection and delineation from passive remote sensing. Int. J. Remote Sens. 2011, 32, 4725–4747. [Google Scholar] [CrossRef]
- Morsdorf, F.; Meier, E.; Kötz, B.; Itten, K.I.; Dobbertin, M.; Allgöwer, B. LIDAR-based geometric reconstruction of boreal type forest stands at single tree level for forest and wildland fire management. Remote Sens. Environ. 2004, 92, 353–362. [Google Scholar] [CrossRef]
- Li, W.; Guo, Q.; Jakubowski, M.K.; Kelly, M. A New Method for Segmenting Individual Trees from the Lidar Point Cloud. Photogramm. Eng. Remote Sens. 2012, 78, 75–84. [Google Scholar] [CrossRef]
- Wang, Y.; Weinacker, H.; Koch, B. A Lidar Point Cloud Based Procedure for Vertical Canopy Structure Analysis And 3D Single Tree Modelling in Forest. Sensors 2008, 8, 3938–3951. [Google Scholar] [CrossRef]
- Liu, J.; Shen, J.; Zhao, R.; Xu, S. Extraction of individual tree crowns from airborne LiDAR data in human settlements. Math. Comput. Model. 2013, 58, 524–535. [Google Scholar] [CrossRef]
- Lee, H.; Slatton, K.C.; Roth, B.E.; Cropper, W.P. Adaptive clustering of airborne LiDAR data to segment individual tree crowns in managed pine forests. Int. J. Remote Sens. 2010, 31, 117–139. [Google Scholar] [CrossRef]
- Wolter, P.; Mladenoff, D.; Host, G.; Crow, T. Improved Forest Classification in the Northern Lake States Using Multi-Temporal Landsat Imagery. Photogramm. Eng. Remote Sens. 1995, 61, 1129–1142. [Google Scholar]
- Schriever, J.; Congalton, R. Evaluating Seasonal Variability as an Aid to Cover-Type Mapping from Landsat Thematic Mapper Data in the Northeast. Photogramm. Eng. Remote Sens. 1995, 61, 321–327. [Google Scholar]
- Ke, Y.; Quackenbush, L.J.; Im, J. Synergistic use of QuickBird multispectral imagery and LIDAR data for object-based forest species classification. Remote Sens. Environ. 2010, 114, 1141–1154. [Google Scholar] [CrossRef]
- Dalponte, M.; Bruzzone, L.; Gianelle, D. Fusion of Hyperspectral and LIDAR Remote Sensing Data for Classification of Complex Forest Areas. IEEE Trans. Geosci. Remote Sens. 2008, 46, 1416–1427. [Google Scholar] [CrossRef]
- Fang, F.; McNeil, B.E.; Warner, T.A.; Maxwell, A.E. Combining high spatial resolution multi-temporal satellite data with leaf-on LiDAR to enhance tree species discrimination at the crown level. Int. J. Remote Sens. 2018, 39, 9054–9072. [Google Scholar] [CrossRef]
- Jones, T.G.; Coops, N.C.; Sharma, T. Assessing the utility of airborne hyperspectral and LiDAR data for species distribution mapping in the coastal Pacific Northwest, Canada. Remote Sens. Environ. 2010, 114, 2841–2852. [Google Scholar] [CrossRef]
- Immitzer, M.; Vuolo, F.; Atzberger, C. First Experience with Sentinel-2 Data for Crop and Tree Species Classifications in Central Europe. Remote Sens. 2016, 8, 166. [Google Scholar] [CrossRef]
- Brandt, M.; Tucker, C.J.; Kariryaa, A.; Rasmussen, K.; Abel, C.; Small, J.; Chave, J.; Rasmussen, L.V.; Hiernaux, P.; Diouf, A.A.; et al. An Unexpectedly Large Count of Trees in the West African Sahara and Sahel. Nature 2020. [Google Scholar] [CrossRef]
Publisher’s Note: MDPI stays neutral with regard to jurisdictional claims in published maps and institutional affiliations. |
© 2020 by the authors. Licensee MDPI, Basel, Switzerland. This article is an open access article distributed under the terms and conditions of the Creative Commons Attribution (CC BY) license (http://creativecommons.org/licenses/by/4.0/).