Article

Monitoring Bark Beetle Forest Damage in Central Europe. A Remote Sensing Approach Validated with Field Data

by
Angel Fernandez-Carrillo
1,*,
Zdeněk Patočka
2,
Lumír Dobrovolný
3,
Antonio Franco-Nieto
1 and
Beatriz Revilla-Romero
1
1
Remote Sensing and Geospatial Analytics Division, GMV, Isaac Newton 11, P.T.M. Tres Cantos, E-28760 Madrid, Spain
2
Department of Forest Management and Applied Geoinformatics, Faculty of Forestry and Wood Technology, Mendel University in Brno, 613 00 Brno, Czech Republic
3
University Forest Enterprise Masaryk Forest Křtiny, Mendel University in Brno, 613 00 Brno, Czech Republic
*
Author to whom correspondence should be addressed.
Remote Sens. 2020, 12(21), 3634; https://doi.org/10.3390/rs12213634
Submission received: 9 October 2020 / Revised: 29 October 2020 / Accepted: 30 October 2020 / Published: 5 November 2020

Abstract

:
Over the last decades, climate change has triggered an increase in the frequency of spruce bark beetle (Ips typographus L.) in Central Europe. More than 50% of forests in the Czech Republic are seriously threatened by this pest, leading to high ecological and economic losses. The exponential increase of bark beetle infestation hinders the implementation of costly field campaigns to prevent and mitigate its effects. Remote sensing may help to overcome such limitations as it provides frequent and spatially continuous data on vegetation condition. Using Sentinel-2 images as main input, two models have been developed to test the ability of this data source to map bark beetle damage and severity. All models were based on a change detection approach, and required the generation of previous forest mask and dominant species maps. The first damage mapping model was developed for 2019 and 2020, and it was based on bi-temporal regressions in spruce areas to estimate forest vitality and bark beetle damage. A second model was developed for 2020 considering all forest area, but excluding clear-cuts and completely dead areas, in order to map only changes in stands dominated by alive trees. The three products were validated with in situ data. All the maps showed high accuracies (acc > 0.80). Accuracy was higher than 0.95 and F1-score was higher than 0.88 for areas with high severity, with omission errors under 0.09 in all cases. This confirmed the ability of all the models to detect bark beetle attack at the last phases. Areas with no damage or low severity showed more complex results. The no damage category yielded greater commission errors and relative bias (CEs = 0.30–0.42, relB = 0.42–0.51). The similar results obtained for 2020 leaving out clear-cuts and dead trees proved that the proposed methods could be used to help forest managers fight bark beetle pests. These biotic damage products based on Sentinel-2 can be set up for any location to derive regular forest vitality maps and inform of early damage.

Graphical Abstract

1. Introduction

In the last three centuries, the forests in the Czech Republic have changed dramatically. Triggered by economic reasons, natural mixed forests were replaced by even-aged spruce or pine monocultures. The spruce currently accounts for 49.2% of stands and pine does for 15.9% [1]. These stands are less stable and more threatened by abiotic factors (e.g., drought, wind, snow, glazed frost) and, more recently, by anthropogenic influences (e.g., air pollution) as well [2]. Over the last years, decrease of forest vitality, growth under stress, and greater susceptibility to spruce bark beetle (Ips typographus L.) infestation are being caused by global climate change, especially long-term droughts with extremely high temperatures in the vegetative period [2]. The common harvested volume per year in the Czech Republic is about 15 million m3 in total and around 1 million m3 of this amount is infested by insects. However, in the last 5 years, a rapid increase in wood infested by insects (WII) has been registered: 2015—16.1 million m3 of harvested wood (2.3 million m3 of WII); 2016—17. 6 million m3 (4.4 million m3 of WII); 2017—19.3 million m3 (5.8 million m3 of WII); 2018—25.6 million m3 (13 million m3 of WII); and 2019—32.5 million m3 (22.8 million m3 of WII, and 66,000 ha of damaged forests) [3]. For 2020, the estimate is ranking between 40 and 60 million m3 of WII [4].
Permanent monitoring, early identification, and harvesting of affected trees are essential in forest protection. Although areas under bark beetle infestation can be easily determined through field work, there are currently no standard field methods in the Czech Republic for early identification of areas affected by outbreaks [5]. The situation becomes more serious as the infested area increases, hindering the possibility of collecting enough data. Moreover, conventional ground methods are time consuming and, in the case of large damaged area, they are usually expensive and not efficient, as they require the assessment of individual trees (e.g., recording the concentration of red-brown dust in bark crevices, holes or marks in the bark, and peeling the bark for more precise determination of infestation stage) in large regions [6]. This lack of control can contribute to an increase in bark beetle population levels with an increasingly negative impact on mortality and loss of forest yield. The increase of outbreaks in periods of extreme drought predicted in the context of climate change [7] could translate into a significant increase in the conditions for the spread of this pest [8,9,10,11]. Hence, more effective plans to control the pests are urgently needed. More specifically, in Central Europe, the area prone to be affected by pests such as bark beetle is growing [12,13,14]; therefore, the need for monitoring large areas is steadily increasing, thus hindering the design and implementation of field campaigns.
Remote sensing data are useful for detecting and monitoring areas infested by bark beetles [15,16,17], as they provide global, spatially continuous, and periodic data on vegetation condition [8]. Remote sensing data can also contribute to reduce costs associated with field campaigns, as there are a large number of freely available data sources with global coverage and regular revisit times (e.g., Landsat and Sentinel programmes).
Trees infested by bark beetle (Figure 1) go through three phases: (1) the green attack stage, when the tree needles remain green; (2) the red attack, when needles turn progressively from green to yellow and reddish tones; and (3) the grey attack, when dead needles fall and the bare tree stands grey [12,18]. Dead trees (i.e., in red or grey attack phases) are clearly visible using a wide range of satellite images [15]. Most studies have used multispectral high resolution data as main input [19,20,21,22], reaching accuracies around 90% for tree mortality (i.e., red and grey attack) detection associated with bark beetle infestation [20,23]. The results have been similar in studies that used very high resolution images (i.e., <1 m) [24,25]. Special interest has been given those studies based on very high resolution hyperspectral images [5,26,27,28,29], which have yielded accuracies close to 90% for bark beetle detection at red or grey attack phases. Synthetic Aperture Radar (SAR) data have also been tested to detect tree mortality induced by bark beetle [17], reaching mapping accuracies between 55% and 88% [30].
While detection at red and grey phases is valuable for assessing environmental and economic losses caused by bark beetles, it is not effective to stop the spread, as insects have already completed their lifecycle. Early alert systems are needed to curb the spread as well as to help foresters know the factors facilitating bark beetle attack [22]. The effects of bark beetle on leaf properties affect reflectance in the near-infrared (NIR) and shortwave infrared (SWIR) spectral domains (i.e., 730–1370 nm) [18], which are represented within Sentinel-2 and Landsat spectral bands. The use of satellite imagery to detect bark beetle infestation at green attack phase has not yielded satisfactory results in most cases [5,19,22,28]. Nevertheless, some correlation between forest health and later bark beetle attack have been reported, using both optical [5,19] and L-band SAR data [30]. Approaches based on multi-temporal vegetation indices have proven to be the most effective to detect bark beetle effects at the green attack phase. The correlation between satellite-derived vegetation indices and areas affected by bark beetle at early stages has been tested with Sentinel-2 and Landsat-8 [22] and Landsat-5 images [19]. These studies have proven that changes in photosynthetic activity, vegetation water content, and leaf area index (LAI) are correlated with bark beetle infestation at green attack phase, especially with Sentinel-2, yielding a user’s accuracy of 67% for green attack mapping.
Since 1986, a regular forest health assessment has been performed in the Czech Republic using the systematic network of the International Cooperative Programme on Assessment and Monitoring of Air Pollution Effects in Forests (ICP Forests). This network is based on core monitoring sites of 16 × 16 km and selected areas of 8 × 8 km, with a total of 306 areas. At altitudes from 150 m to 1100 m, approximately 11,000 trees are evaluated every year, representing 28 species of trees in different age classes. In addition to ground-based evaluation, Landsat-5 satellite images have been used since the mid-1980s, allowing a uniform systematic evaluation unbiased by a subjective factor in ground visual assessment [31]. Since 2016, satellite images from the Sentinel-2 satellites have been analysed at one-year intervals. Only cloudless images of the Czech Republic are used, selected during the phenological summer (i.e., June to August). Leaf area index (LAI) maps are derived from Sentinel-2 images, which have been validated with LAI ground surveys and defoliation values from ICP Forests data. The health status of the stands is assessed on the basis of LAI changes, which significantly correlate with defoliation in the selected time interval [32,33]. For more detailed mapping of bark beetle outbreaks at higher spatial resolution and more frequent updating, a monitoring system to detect salvage cutting and standing dead wood using Planet images has been used since 2018 in the Czech Republic. The following main layers are used to build this system: (1) Areas dominated by spruce and higher than 12 m. The forest tree map is created by the classification of Sentinel-2 images, performed on the basis of the spectral response of tree species in different phenological phases using training data collected during the National Forest Inventory (NFI) ground survey. The Planet system also uses a digital surface model (DSM) derived from aerial images taken in 2016 and 2017. The DSM is normalized using digital terrain model derived from airborne laser scanning to obtain a canopy height model. (2) Map of LAI decrease, which detects either the clear-cuts or dead wood. Normalized difference vegetation index (NDVI) images at 3 m spatial resolution and two additional categories are detected: standing dead forest and newly established clear-cuts. These categories are distinguished based on the Triangular Greenness Index (TGI) [34].
Different Czech institutions are also conducting research into the use of multispectral and hyperspectral cameras carried by unmanned aerial vehicles (UAVs) [25,35,36]. These systems can provide images at local scales almost anytime with very high spatial resolution, which allows the evaluation of health at the level of individual trees. The disadvantage of UAVs compared with high resolution satellites such as Sentinel-2 or Landsat is the cost of data acquisition and the complexity of data processing, although this disadvantage is gradually disappearing with the development of cloud computing. Another shortcoming is that most multispectral cameras are used in UAV-based studies, which allow the calculation of only a few vegetation indices (e.g., NDVI or Normalized Difference Red Edge Index-NDRE) [37]. Hyperspectral cameras are more expensive, and data processing is more complicated. In contrast, Sentinel-2 provides free, easy to process data with a short revisit time, thus allowing more regular estimates about vegetation status.
In this study, a multi-temporal regression-based change detection method is proposed to map areas affected by bark beetle with different degree of severity at 10 m spatial resolution. Moreover, a comparison is carried out between forest vitality estimates and field records of forest damage caused by Ips typographus L. infestation.
The aim of this study is to test a methodology for the automatic mapping of bark beetle-induced damage using Sentinel-2 images. The specific objectives of this work are (a) to evaluate the performance of the damage detection algorithm, (b) to study the feasibility of discriminating areas affected with different intensity or level of mortality, and (c) to assess the influence of possible clear-cuts not related to bark beetle in the final damage maps.

2. Study Area and Data

2.1. Study Area

The study site was located in a forest area owned by Mendel University in Brno and managed by the University Forest Enterprise (UFE), in Křtiny, Czech Republic (49.170°N, 16.440°E. Figure 2). This property covers around 10,000 ha of forest stands. Mixed forests are prevailing where the proportion is 38% of conifers (19% spruce, 8% pine, 8% larch, and others) and 62% of broadleaves (33% beech, 15% oak, 8% hornbeam, and others). Altitude ranges between 200 and 570 m. Mean annual rainfall is 610 mm and mean annual temperature is 7.5 C. UFE forest management is focused on close-to-nature methods, using minimum clear-cuts and a high share of natural regeneration.
In the Czech Republic, salvage cutting has increased dramatically in the last three years. Figure 3 shows the total wood production in millions of cubic meters. Table 1 shows salvage cutting volume at the UFE forest.
A total of 32.58 million cubic meters of raw wood was harvested in the forests of the Czech Republic in 2019, which means a further increase of 6.89 million m3 compared with the previous year. The salvage cutting of 30.94 million m3 of wood contributed significantly to this volume. The share of salvage cutting in 2019 was 95%. Thus, the initial conditions for planned forest management continued to deteriorate. In terms of the composition of harvesting by tree species, the volume of coniferous wood harvested increased by 7.1 million m3 compared with 2018 to a total of 31.31 million m3. The share of coniferous wood harvesting in total harvesting was approximately 96%. The proportion of deciduous and coniferous wood harvesting is due to salvage cutting, especially the wood infested by bark beetle (Figure 4).
In 2019, 20.7 million m3 of harvested spruce wood infested by bark beetle was registered in the Czech Republic, which represents an increase compared with 2018 by more than 70%, when approximately 12 million m3 was recorded (2017—5.34 million m3) (Figure 5). Harvested wood in 2019 was practically exclusively infested with European spruce bark beetle (Ips typographus L.), which is usually accompanied by six-toothed spruce bark beetle (Pityogenes chalcographus L.) and double-spined bark beetle (Ips duplicatus Sahlberg), especially in northern and central Moravia and Silesia, but locally often elsewhere.
The massive spruce infestation with bark beetles has been triggered by higher average temperatures and lower precipitation over the last five years compared with the long-term normal. Extreme drought prevailed, especially in 2015 and 2018 (Figure 6).

2.2. Sentinel-2 Satellite Images

In this study, we used Sentinel-2 images provided by Copernicus Open Access Hub to detect bark beetle damage. These images were acquired in format Level-2A (bottom of atmosphere reflectance). Sentinel-2 L2A images are generated by applying atmospheric and topographic correction algorithms to the Level-1C (top of atmosphere reflectance) images [40]. In order to focus the change detection in areas prone to be attacked by the spruce bark beetle, forest/non-forest and dominant species maps were produced for the study area (Figure 7). These first maps were also developed using Sentinel-2 images (Table 2).
Different Sentinel-2 bands (Table 3), vegetation indices, and texture indices were used for each process. The whole process, summarised in Figure 7, is explained in the subsequent sections.

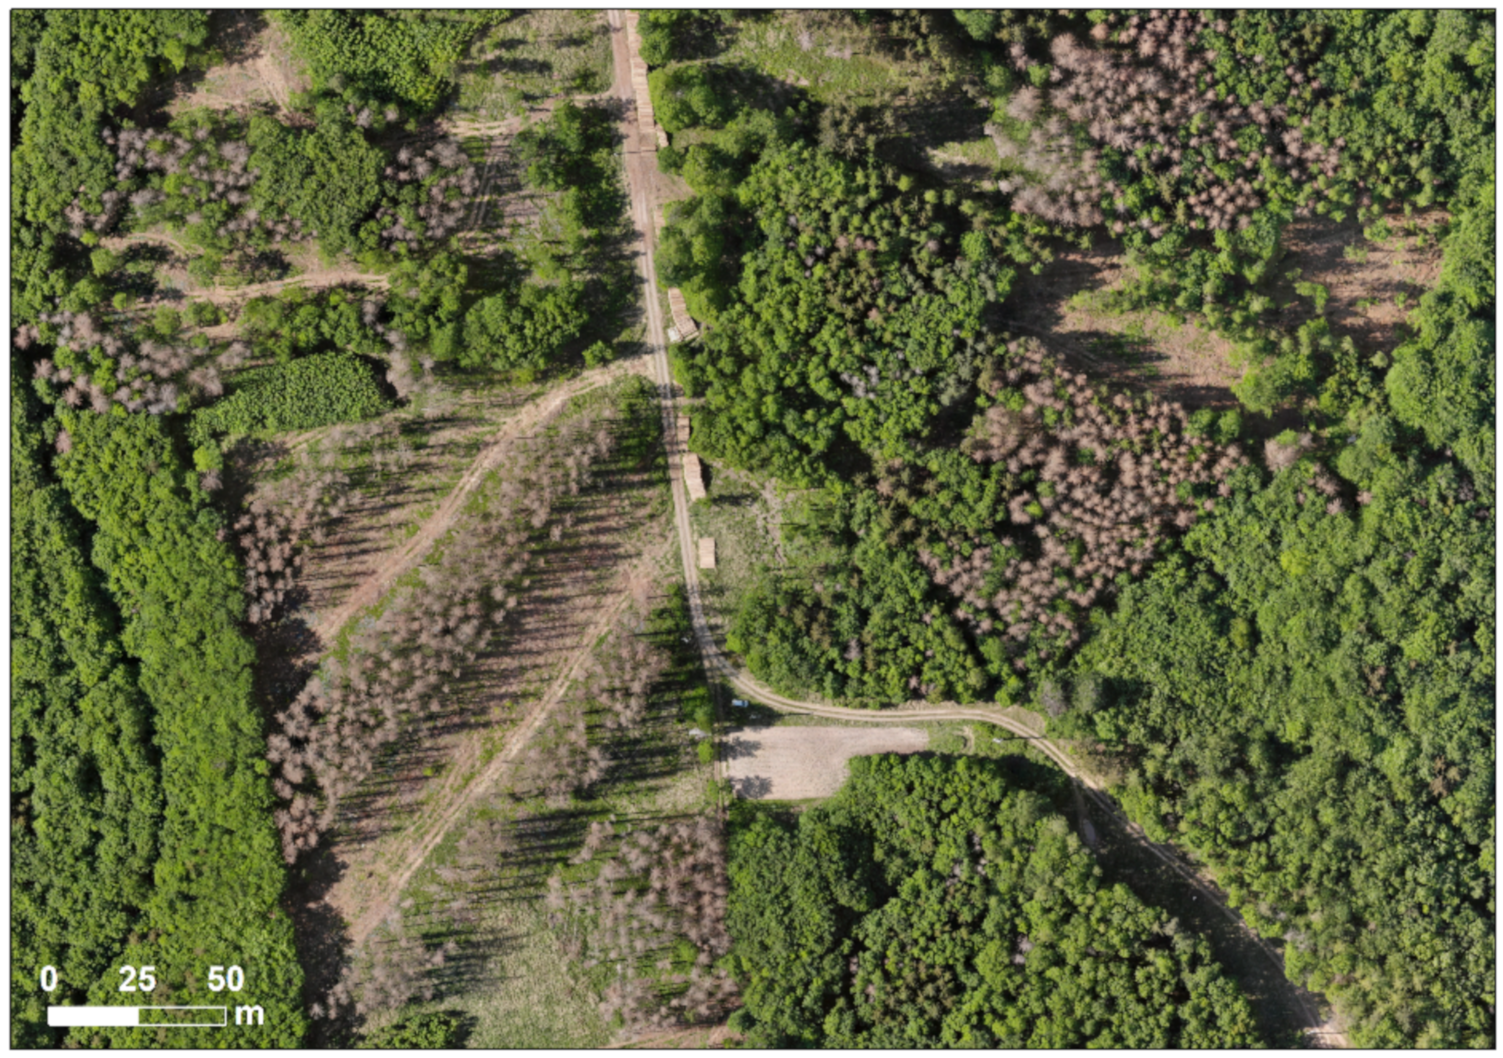
2.3. Ground Truth Data

Records of salvage cutting and records of clear-cuts were used to build the ground truth dataset, together with a forest stand map derived from forest management plan (valid for the period 2013–2022). The records were collected continuously by foresters for the needs of the forest enterprise and state forest administration, and contained the ID of forest stands, month and year of the cutting, volume, type of cutting, cause, and area. A detailed explanation of ground truth generation can be found in Section 3.4.

3. Methods

Two algorithms were developed to map bark beetle damage: biotic damage A (BDA) and biotic damage B (BDB), considering as damage any negative deviation from the standard development of the forest (i.e., clear decrease of forest health). Both algorithms work by detecting changes between two dates. The BDA algorithm included masking Sentinel-2 surface reflectance images to areas dominated by spruce in the starting date of the pair. Hence, any area with dead trees or clear-cuts might be detected as bark beetle damage. In the case of BDB, satellite images were masked to the whole forest area in the final date of the pair (not in the initial one). Thus, all dead trees and clear-cuts could not be classified as damaged areas by the BDB algorithm. The objective of the difference between BDA and BDB was to test the ability of the algorithms to detect damage in non-cut areas and with most of the trees still alive. This allowed us to assess the true performance of our approach to detect the effects caused by bark beetle, as BDB leaves out possible over-detection caused by clear-cuts. Three different layers were ultimately developed (Table 2, Figure 7 Step 4): (1) the BDA layer using 2019 imagery (BDA19), (2) the BDA layer using 2020 imagery (BDA20), and (3) the BDB layer using 2020 imagery (BDB20) to map only changes in stands dominated by alive trees. The algorithms for BDA19 and BDA20 were identical, the only difference being the dates of the input imagery (2018–2019 and 2019–2020, respectively). The common steps for producing all damage maps from Sentinel-2 images are summarised in the flowchart (Figure 7) and explained in detail in the following subsections.

3.1. Forest/Non-Forest Classification

To derive any of the damage detection layers explained above (Figure 7, Step 4.), we first apply a classification algorithm to discard all the pixels belonging to non-forest cover (Figure 7, Step 2.1.) [41,42]. To represent phenological variations in the forest canopy, two Sentinel-2 images were used, one for winter and one for summer (Table 2). Green, red, NIR, and SWIR bands were selected. SWIR bands, originally at 20 m spatial resolution, were resampled to the resolution of the other bands, 10 m. Normalized difference vegetation index (NDVI, Equation (1)) [43] and modified soil adjusted vegetation index (MSAVI, Equation (2)) [44,45] were computed together with two texture indices: homogeneity (Equation (3)) and entropy (Equation (4)) [46]. A supervised classification method based on random forest algorithm [47] was used to classify pixels in forest and non-forest categories with the selected Sentinel-2 bands and the vegetation and texture indices as input. The output of the classification was a binary forest/non-forest map of the study area at 10 m spatial resolution. A validation protocol was specifically designed to carry out an independent validation of the forest mask [42], based on a stratified random sampling strategy. According to this validation, the forest mask had an accuracy of 0.97 for the study area in 2018. This process was repeated to update the forest mask to 2019 and 2020.
N D V I =   N I R R e d N I R + R e d
M S A V I =   2 · N I R + 1 2 · N I R + 1 2 8   · N I R R e d 2
H o m o g e n e i t y = i = 0 n 1 j = 0 n 1 P i , j i j 2
E n t r o p y =   i = 0 n 1 j = 0 n 1 P i , j log P i ,   j
where n is the number of grey levels and P(i, j) defines the entries of the grey-level co-occurrence matrix.

3.2. Species Identification

The next step (Figure 7, Step 2.2.) was to identify the areas dominated by spruce (i.e., those that are prone to be attacked by the Ips typographus L.), for which a dominant tree species classification was carried out [48]. The bi-temporal Sentinel-2 bands and indices used in previous steps were masked with the forest/non-forest map, selecting only the forest pixels. A random forest model was trained with polygons containing the main tree species present in the area, namely, Carpinus betulus L., Fagus sylvatica L., Larix decidua Mill., Picea abies (L.) Karst., Pinus Sylvestris L., and Quercus robur L. Training samples were obtained joining forest stands with information from the local forest management plan. For each of the species considered, stands with an abundance of 70% or higher were pre-selected. Finally, the smaller stands that actually contain the specific tree species were selected for training.
The species attacked by Ips typographus L. (i.e, Picea abies (L.) Karst) were classified with an accuracy of 0.91 in 2018 according to the cross-validation performed during the model training. This dominant species map was produced for 2018, 2019, and 2020, as it was made with the forest mask.

3.3. Anomaly Detection and Damage Detection

Once spruce areas were clearly delimited for each year, a new method (Figure 7, Step 3) was proposed to map the bark beetle damage suffered by the spruce forests during a year (i.e., between a pair of dates). The first step was to compute vegetation indices able to represent vegetation condition for the two dates (t0 and t1 for each year, in Table 2). Based on the literature review about the effects of bark beetle [49], the following vegetation indices were computed for each date: NDVI (Equation (1)), MSAVI (Equation (2)), normalized difference moisture index (NDMI, Equation (5)), and green leaf area index (LAIgreen, Equation (6)) [50,51].
N D M I =   S W I R 1 N I R S W I R 1 + N I R
L A I g r e e n =   6.753   ·   R E 1 R e d R E 1 + R e d
NDVI and SAVI are direct indicators of plant greenness and photosynthetic activity, NDMI is an indicator of vegetation water content, and LAIgreen is an estimate of the proportion of green leaves per area. As defoliation is one of the main effects caused by bark beetles [15], LAI has been considered as one of the key variables in this study. Moreover, we proposed the use of Sentinel-2-derived LAIgreen, as it considers only the area of green leaves, not only being an indicator of defoliation, but also of leaf browning [50,51].
To derive the BDA19 and BDA20 products, vegetation indices were masked with the spruce polygons identified in the dominant tree species map. For each index, a bi-temporal ordinary least squares (OLS) regression was carried out in order to model the typical behaviour of spruce forest patches between t0 and t1. The first index was used as the independent variable, and the second one as the dependent variable in each regression. The results were images of estimated NDVI, MSAVI, NDMI, and LAIgreen for t1 based on the average trend of spruce forests in the studied period. An error image was computed for each index using the estimated and real values of the indices in t1. These images show the deviations from the expected condition of healthy spruce masses, as it was assumed that regression would be adjusted to healthy forests and disturbed areas would appear as deviations from that ideal status. Hence, these error images showed estimates of temporal decrease or increase of photosynthetic activity, vegetation water content, and number of green leaves.
In order to obtain a single image of vegetation vitality changes (Figure 7, Step 4.1.), all error images were standardised (i.e., pixel values expressing differences between real and estimated indices were converted to z-scores). Z-scores (Equation (7)) represent the number of standard deviations between a value and the population mean.
z =   x   μ σ
where μ is the mean of the population and σ is the standard deviation of the population.
The mean of all the standardised images was computed to obtain a single image of average changes in vegetation vitality. Pixel values in this image may be interpreted as mean standard deviations from expected NDVI, MSAVI, NDMI, and LAIgreen of undisturbed spruce forest. Finally, these vitality changes were reclassified (Figure 7, Step 4.2.) to obtain a categorical map of bark beetle damage (Figure 7, final outputs, Step 4.3.), using the following rule based on z-scores: 0–1 no damage, 1–2 minor damage, 2–3 moderate damage, and >3 severe damage.

3.4. Ground Truth Data and Validation

To validate the damage products, a ground truth dataset was generated through a field campaign. An equalized stratified random sampling was used for data collection. As field works are costly, a limit of 200 points per product was established. To stratify the samples, 50 random points were generated per class and product, obtaining 200 points per product and 600 in total.
The collected records containing the ID of forest stands, month and year of the cutting, volume, type of cutting, cause, and area were joined to the forest stand map using the forest stand ID. Different classes of forest stands representing the degree and year of damage were created using the actual vitality of the stands based on the information of the records. This modified forest stand map was used to decide to which class each point belongs in terms of actual damage. This decision was made based on the occurrence of damage in the given forest stand, not on the occurrence on the exact position of the point, as the records were focused only at the level of the given forest stand. As dead trees with inactive bark beetle are no longer harvested in 2019 and 2020, in the case of doubt (no record of harvesting, but occurrence of damage detected), a field evaluation was also performed.
An accuracy assessment was carried out based on the analysis of the confusion matrix derived from the damage maps and ground truth points. The overall accuracy was computed for each product. In order to obtain performance metrics per class, each class was binarised against the rest, considering as positive the category of interest and negative the sum of all other classes. The following performance metrics were computed per product and damage category: accuracy (Equation (8)), precision (Equation (9)), recall (Equation (10)), F1-score (Equation (11)), omission error (Equation (12)), commission error (Equation (13)), and relative bias (Equation (14)) [42].
a c c . =   T r u e   p o s i t i v e   + T r u e   n e g a t i v e s a m p l e   s i z e   n
p r e c . = T r u e   p o s i t i v e T r u e   p o s i t i v e + F a l s e   p o s i t i v e
r e c . = T r u e   p o s i t i v e T r u e   p o s i t i v e + F a l s e   n e g a t i v e
F 1 s c o r e =   2 · T r u e   p o s i t i v e 2   · T r u e   P o s i t i v e + F a l s e   p o s i t i v e + F a l s e   n e g a t i v e  
O E   =   F a l s e   n e g a t i v e T r u e   p o s i t i v e + F a l s e   n e g a t i v e
C E =   F a l s e   p o s i t i v e T r u e   p o s i t i v e   + F a l s e   p o s i t i v e
r e l B =   F a l s e   p o s i t i v e F a l s e   n e g a t i v e T r u e   p o s i t i v e + F a l s e   n e g a t i v e
As an additional exercise, each point of the ground truth dataset was characterised with the vitality value of the corresponding year. The objective of this procedure was to study the statistical robustness of each class and detect possible overlaps or other inconsistences across the categories defined in the final maps.

4. Results

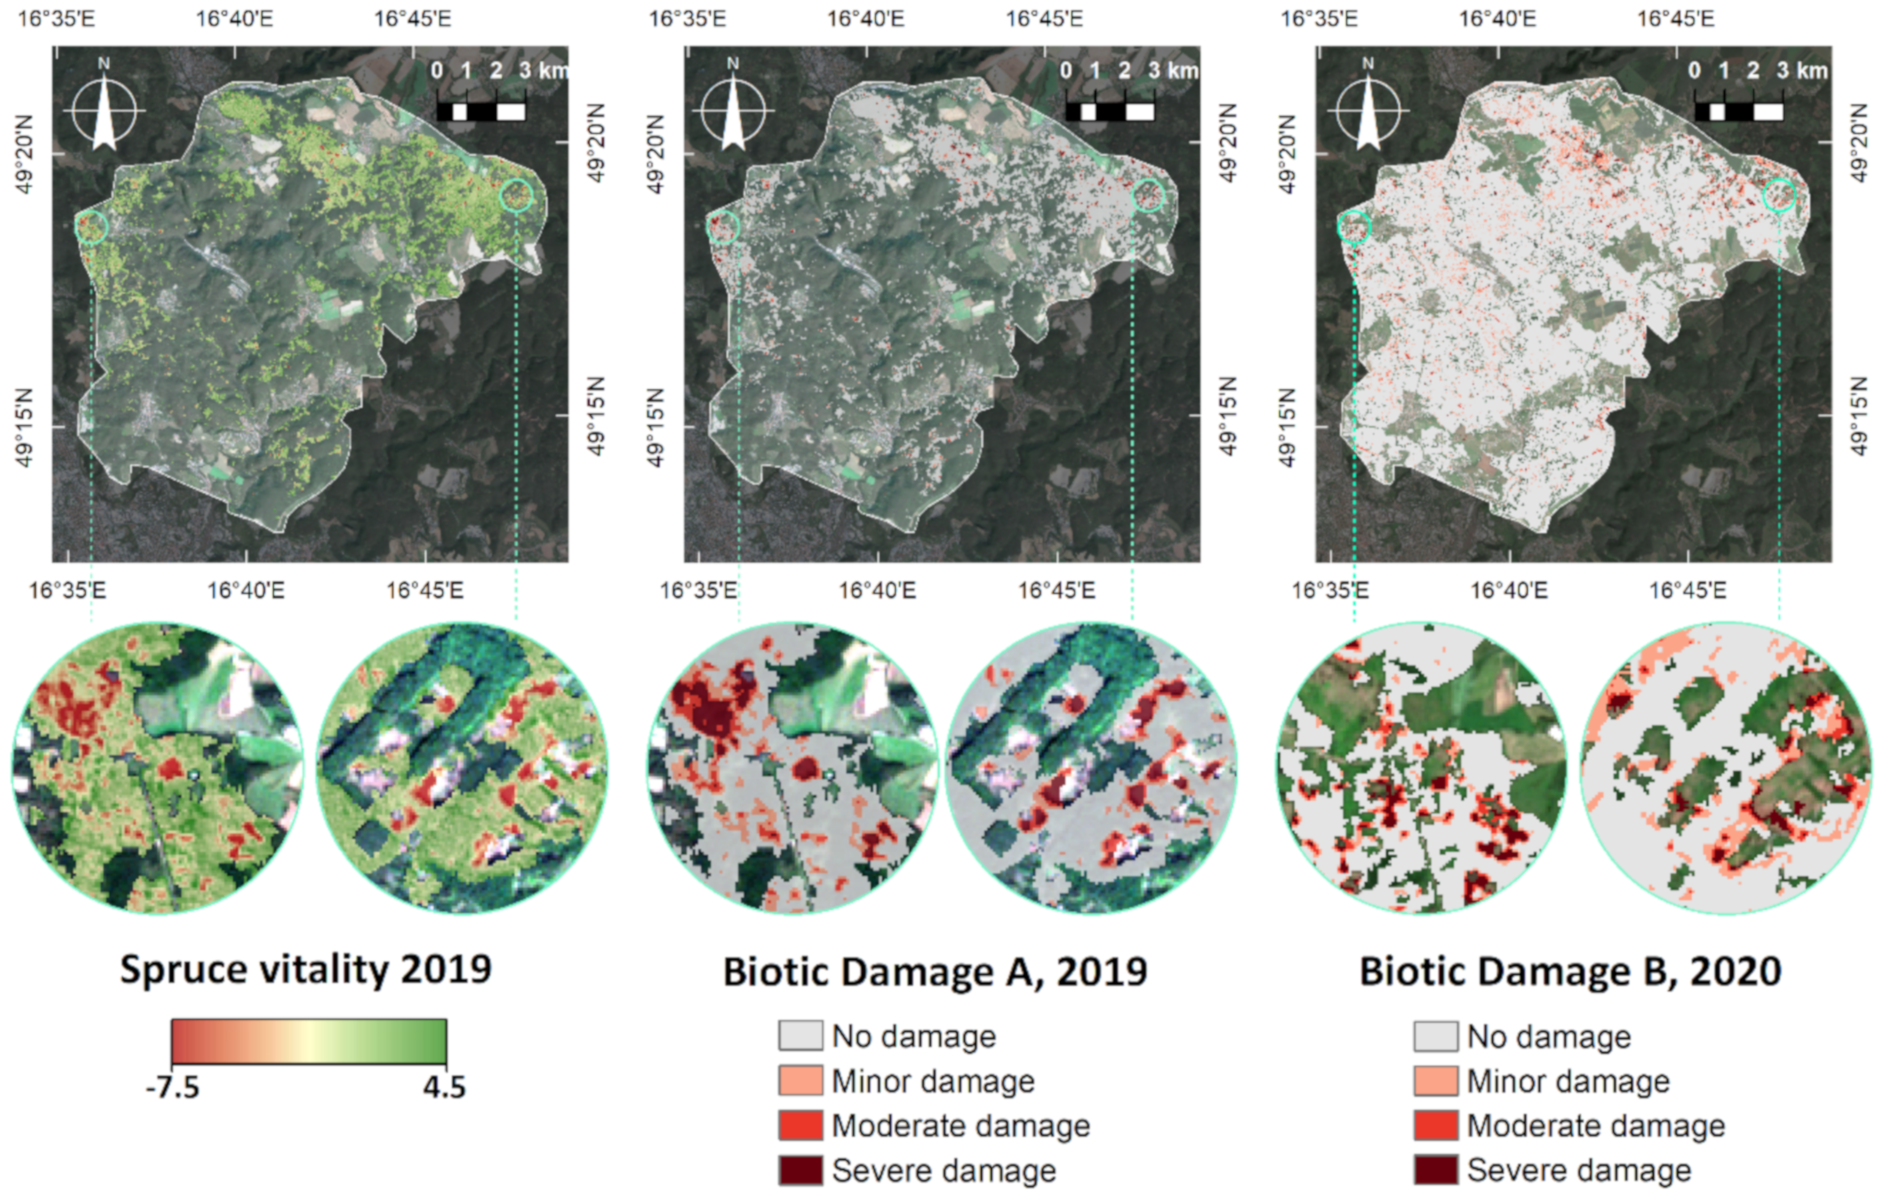
4.1. Bark Beetle Damage Maps

The BDA product was developed for 2019 (Figure 8) and 2020, while the BDB was produced only for 2020. Each product had two outputs: (1) a continuous map representing changes in forest vitality (Figure 8, left panel) and (2) a categorical map showing the areas of biotic damage (Figure 8, right panel), excluding cut areas for the BDB20 map.

4.2. Validation Results

The three categorical maps were validated following the methods explained in Section 3.4. Confusion matrices (Figure 9) show that the algorithm performed as expected, as errors were low compared with the agreement between the classification maps and ground truth. Errors seemed to be slightly higher for the BDB20 product.
Overall accuracies were higher than 0.80 for all products (accBDA19 = 0.90, accBDA20 = 0.85, accBDB20 = 0.81). Metrics per class (Table 4) confirmed the good performance of the algorithms. BDA products showed a similar performance for different years, with accuracies increasing with the severity of the attack. Accuracy and F1-score were higher for the severe damage class (acc19 = 0.98, F1-19 = 0.96, acc20 = 0.95, F1-20 = 0.88), thus confirming that most affected areas were easier to detect. Nevertheless, cut areas might have influenced this result as they were classified into the severe damage class. On the other hand, the no damage class yielded lower accuracy and F1-score (acc19 = 0.90, F1-19 = 0.83, acc20 = 0.86, F1-20 = 0.76). The BDA20 product showed slightly worse results for all classes (accno-damage = 0.81, F1no-damage = 0.70, accsevere-damage = 0.96, F1severe-damage = 0.90).
Error metrics showed similar behaviour, being higher for BDB20 and lower for BDA19. Commission errors ranged from 0.08 (BDA19, severe damage) to 0.26 (BDB20, minor and moderate damage) and were higher than omission errors in all damage classes. The negative relative bias in these categories confirmed that the algorithm tends to over-estimate damaged areas, although values are not greater than 0.22. Omission errors were in general very low, between 0.00 and 0.08 for all damage classes in the three maps. The high recall in these classes (0.93–1.00) confirmed that the algorithms are able to detect affected areas, missing a small proportion of positive cases. On the other hand, omission errors were significantly higher than commission errors in the no damage class, leading to high positive relative bias ranging from 0.46 to 0.56. This was another signal of over-estimation of damaged areas.
Box plots of forest vitality per class (Figure 10) confirmed the clear correlation between the actual areas attacked by the bark beetle and the decrease of forest vitality, measured as a standardised mean of changes in NDVI, MSAVI, NDMI, and LAIgreen. The interquartile range (IQR) represents the data dispersion and is calculated with the difference between 75th and 25th percentiles. IQR is greater in no damage (IQRBDA19 = 1.49, IQRBDA20 = 2.22, and IQRBDB20 = 2.63) than in the rest of the categories for the three products analysed. The overlap between categories decreases with the increase of severity, with moderate and severe damage not overlapping any other class in the three products. Outliers are present in the no damage, minor damage, and moderate damage categories, with severe damage being the only class without outliers in the three maps. This confirms that areas with severe damage are easier to detect and identify than the other classes, as inferred from performance metrics (Table 4).
Analysing the three products separately, some differences were noted. Overlap of no damage and minor damage between the 25th and 75th percentiles was clearer in the BDB20 product. In this product, there was also overlapping between no damage and moderate damage. However, the severe damage class was clearly discriminated from no damage and minor damage. This behaviour might suggest that a more precise discrimination could be achieved by reducing the number of classes.

5. Discussion

The results showed that the biotic damage algorithm worked consistently in different years. However, accuracy decreased by 5% between BDA19 and BDA20, while in these years, the proportion of spruce detected as damaged was very similar (7.2% and 7.4% of the total spruce area, respectively). Hence, although the results for both years were similar regarding performance metrics, a longer time series analysis would be needed to study the robustness of the method across time and quantify typical inter-annual variations. In the case of BDB20 (i.e., similar to BDA20, but considering areas dominated by alive trees of any species at the end of 2020, not only spruce areas), the lower accuracy (accHD20 = 0.81) may be explained by two main factors. Firstly, this product considers only alive trees, and minor and moderate changes have greater weight than severe changes compared with the other products. Hence, the overall metrics tend to be lower in those products where complex intermediate classes are more frequent than extremes that are easier to identify. Secondly, all species are considered within the BDB product, and not only spruce, subtle changes in areas dominated by deciduous species, which are also more sensitive to climate variations (e.g., drought), might have led to a greater confusion between the no damage and damage classes, as shown in the confusion matrices (Figure 9). However, the accuracy of the BDB map was high and, more importantly, it confirmed that the high accuracy obtained for the first two products was not due to the detection of cut areas, thus damage caused by bark beetle was clearly detected in most cases.
The three models presented higher commission than omission and negative relative bias in all damage classes, suggesting a certain degree of over-estimation of damaged areas, as confirmed by higher recall and lower precision. Assuming that a precise balance between commission and omission errors was hard to achieve, we prioritised the commission of damaged areas, as the aim of the products is to help forest managers to optimise the control of the pest. Although this led to high positive bias in the no damage class (i.e., there was a relatively high omission), accuracy and F1 were still high for this category. For BDB20, the no damage class presented the worst results with a recall of 0.58 and an omission error of 0.42. This confirmed that further improvements should be made to avoid the confusion between bark beetle damage and minor changes in forest vitality caused by other factors across the different forest types present in the study area. Different solutions might be applied in order to balance the errors of the no damage category, such as adding more spectral indices or change the temporal windows. Time series could allow carrying out the damage assessment using a combination of shorter periods, thus minimising the possible influence of slow changes in vegetation cover.
The results clearly showed that the minor damage class was often confused with no damage, as the limit between small regular changes in vegetation condition and small, but anomalous changes is hard to define. This suggests that the models would improve significantly if the no damage category was removed. Nevertheless, we decided to leave this class because it might be directly related to green-attack detection [22], which would be essential to design an early detection system [52].
The approach proposed in this article may improve previous attempts to detect bark beetle infestation with Sentinel-2 data. The ability of Sentinel-2 for this purpose has been tested by different authors with variable results. Abdullah et al. [22] reported a user’s accuracy of 67% (i.e., agreement between pixels detected as infestation and ground truth) and a producer’s accuracy of 71% for green attack detection, while our user’s accuracies were not lower than 74% and our producer’s accuracies not lower than 95% (CE = 0.26 and OE = 0.05 in the worst model, BDB20) for the minor damage category, which, as stated before, might correspond to green attack. Moreover, our approach was validated with field data, while Abdullah et al. [22] derived ground truth information from the visual analysis of aerial photography, which might have added a certain level of uncertainty into the accuracy assessment. Both studies coincide in the affirmation that changes in photosynthetic activity, green leaves, and humidity triggered by bark beetle can be detected from early infestation stages using multispectral Sentinel-2 data. The relationship between LAI maps derived from Sentinel-2 and defoliation caused by bark beetle infestation has also been confirmed by Barka et al. [33] (r2 = 0.58). An advantage of the methods proposed in this study compared with the previously mentioned ones is that it does not require training data to detect bark beetle infestation, as the algorithms used unsupervised methods based on a statistical change detection approach. Zimmermann and Hoffmann [23] used a change detection approach to detect areas affected by Ips typographus in Germany and Switzerland. Although they obtained low commission errors for the positive class (CE = 0.03–0.12 versus CE = 0.08–0.26 of our algorithm), omission errors were substantially higher than in our study (OE = 0.48–0.60 versus OE = 0.00–0.08), leading to a high bias in the final results.
Regarding very high resolution, Worldview-2 showed potential to discriminate green attack from healthy trees [53]. However, the spectral differences were so small that the accuracy of random forest classification and logistic regression did not exceed 70%. RapidEye data have been used to map green attack, nearly equivalent to our minor severity class, reaching a kappa coefficient of 0.51 [54]. In comparison with these studies, our performance metrics yielded higher values, with an accuracy of 93% for the worst model. Nevertheless, it must be noted that the spatial resolutions of multispectral Worldview-2 (1.84 m at nadir) and RapidEye (6.5 m at nadir) allow the detection of smaller groups or even individual trees when compared with Sentinel-2. Although bark beetle damage mapping has been carried out using UAV very high resolution imagery with promising results [24,27,28,29], they rely on planned flights, which usually require high costs and cannot be repeated frequently. The value of using Sentinel-2 data is the free cost of imagery at relatively high spatial resolution (10 m), but mainly the revisit time [15] of 2–3 days at mid-latitudes. Relatively high performance metrics have also been reported using SAR data, with accuracies of 0.65–0.88 for L-band data [30] and kappa of 0.23 for green attack detection using X-band [55]. However, SAR-based detections were highly dependent on local environmental conditions [30]. The combination of very high resolution multispectral RapidEye and TerraSAR-X data yielded a kappa coefficient of 0.74, considerably improving the results based solely on optical and SAR data [55]. The results shown in this study are likely to improve if SAR data (e.g., Sentinel-1) are included in the models.
Using remote sensing products, we also need to consider that tree damage stages do not always correspond to the colour changes in the crown. In extreme cases, it occurs that the tree bark is totally peeled, the bark beetle has completed its development and flew out, while the crown is still green. This fact complicates the damage assessment with remote sensing optically derived products.
The next point of discussion focused on the local expertise of how the products developed in this study overcome some of the limitations of other datasets currently provided at the national level, as is the case of Czech Republic. Czech Hydrometeorological Institute provides a map of the sums of effective temperatures above 7.5 °C, knowing that the population dynamics of bark beetle are significantly affected by the weather, especially air temperatures, which determine the swarming and the number of generations. As the bark beetle swarms when temperatures above 7.5 °C sum up to 540 °C [56], this temperature map is intended to help forest managers in planning and prevention activities by estimating swarming dates. Even when the temperatures map is somewhat useful for managing spruce forests, there are other factors affecting the ecology of bark beetle that are not considered within this map. Moreover, it does not have the intention of being used for damage assessment purposes.
Next, also based on local expert knowledge, we assessed the monitoring system for the detection of salvage cutting and standing dead wood using Planet images established in the Czech Republic since 2018 (see Section 1) in comparison with the products produced and validated here. The Planet-based dataset is updated four times a year [57]. Although this product is useful to control dead trees and subsequent clear-cuts caused by bark beetle, it does not provide any information about the status of trees in intermediate infestation phases (i.e., it is equivalent to a binary classification detecting only dead trees). Contrarily, our bark beetle damage maps provide insights on the level of affection of different areas, even those dominated by trees that are still alive, as proven with BDB20. This suggests that the proposed method is able to improve Planet-based very high resolution maps by providing estimates of areas under red and green attack phase. Moreover, the costs of maps based on Sentinel-2 is lower because of the free availability of imagery. Nevertheless, the methods proposed here are limited to mapping relatively large areas, as the spatial resolution of 10 m does not allow detecting single trees affected by bark beetles. Hence, it is necessary that several trees within the pixel present enough spectral change to be detected as anomalous. The same limitation was found by other authors [23], still making these kind of methods useful for intermediate landscape scales.
Further research is still to be made on the field of bark beetle attack forecasting models, which are being highly demanded by forest managers [52]. Although the methods proposed here could be used for short-term forecasting because of their ability to detect areas with minor damage that might be in the first infestation stages, there is no evidence of a clear correlation between these areas and green attack phase. Moreover, future models should include climate data as input in order to perform mid-term forecasts allowing to mitigate the negative effects of this pest before its complete development.

6. Conclusions

In this study, a method was proposed to map bark beetle damage from satellite imagery. Using Sentinel-2 images as input, two multi-temporal regression models were built to detect and map the severity of bark beetle outbreaks on spruce forests in the Czech Republic at 10 m spatial resolution. The first model (BDA) was applied to map the damage occurred in years 2019 and 2020. The second model (BDB) was applied to map the bark beetle damage in 2020, in order to map only changes in stands dominated by alive trees. Both products were validated using a ground truth dataset generated through a field campaign and forest management plans. Different performance metrics were computed to assess the quality and errors of the three maps produced. Finally, forest vitality used to develop the biotic damage layers was compared against ground truth to study the overlaps between classes.
All products showed good performance, with accuracies higher than 0.80. The severe damage class yielded the best performance metrics in all products (acc > 0.95, F1 > 0.88), while the no damage yielded the worse metrics (acc > 0.81, F1 > 0.70). Commission errors were higher than omission errors in all positive damage classes, leading to a high relative bias in the no damage class (relB = 0.42–0.46). BDA products showed slightly better results than BDB (accBDA19 = 0.90, accBDA20 = 0.85, accBDB20 = 0.81) because of the easier identification of areas with clear-cuts or dominated by dead trees. However, the performance metrics yielded by BDB proved that the algorithm was able to identify areas affected with low severity unaffected by dead trees or clear-cuts, suggesting that some areas were correctly mapped at red and green attack phases. Changes in forest vitality grouped by ground truth classes confirmed that pixels were easier to classify in the correct class for the severe and moderate damage classes. Contrarily, the existing overlap of vitality values between classes of no damage and minor damage highlighted the difficulty of clearly discriminating infested areas with subtle signals of decay.
Comparing the proposed methods and outputs with the datasets currently used in the Czech Republic for bark beetle damage mapping, the products presented several advantages. Firstly, the cost is relatively low as it is based on freely available Sentinel-2 images. Secondly, the biotic damage maps provide information about damage intensity, suggesting that it might be used not only for damage assessment, but also to help forest managers in planning their prevention and mitigation activities. Biotic damage products can be set up for any location to monitor the forest vitality to derive regular maps as needed, for example, every month. Nevertheless, the presented methods are not valid to identify individual affected trees given their spatial resolution. Future research should be carried out to confirm the detection at the green attack phase and complement the existing studies with forecasting products.

Author Contributions

Conceptualization, A.F.-C. and Z.P.; Methodology, A.F.-C., Z.P., and L.D.; Software, A.F.-C.; Validation, Z.P., L.D., and A.F.-C.; Formal Analysis, A.F.-C.; Investigation, A.F.-C., Z.P., and L.D.; Resources, GMV and UFE; Data Curation, A.F.-C.; Writing—Original Draft Preparation, A.F.-C., Z.P., B.R.-R., and A.F.-N.; Writing—Review and Editing, B.R.-R.; Visualization, A.F.-N.; Supervision, B.R.-R.; Project Administration, MSF; Funding Acquisition, MSF. All authors have read and agreed to the published version of the manuscript.

Funding

This research was funded by European Union’s Horizon 2020 research and innovation programme, under grant agreement 776045.

Conflicts of Interest

The authors declare no conflict of interest.

References

  1. Forest Managent Institute of the Czech Republic. Information on the State of Forests from the Comprehensive Forest Management Plans for 2019. Available online: http://www.uhul.cz/ke-stazeni/informace-o-lese/slhp (accessed on 26 October 2020).
  2. Zahradník, P.; Zahradníková, M. Salvage felling in the Czech Republic‘s forests during the last twenty years. Cent. Eur. For. J. 2019, 65, 12–20. [Google Scholar] [CrossRef]
  3. Czech Statistical Office. Reports of Czech Republic Statistical Office from Forestry Sector. Available online: https://www.czso.cz/csu/czso/forestry-2019 (accessed on 28 August 2020).
  4. Ebner, G. Up to 60 million m3 of Bark Beetle Damage This Year. Available online: https://www.timber-online.net/rundholz/2020/02/up-to-60-million-m--of-bark-beetle-damage-this-year.html (accessed on 24 August 2020).
  5. Lausch, A.; Heurich, M.; Gordalla, D.; Dobner, H.-J.; Gwillym-Margianto, S.; Salbach, C. Forecasting potential bark beetle outbreaks based on spruce forest vitality using hyperspectral remote-sensing techniques at different scales. For. Ecol. Manag. 2013, 308, 76–89. [Google Scholar] [CrossRef]
  6. Schlyter, F.; Birgersson, G.; Byers, J.A.; Löfqvist, J.; Bergström, G. Field response of spruce bark beetle, Ips typographus, to aggregation pheromone candidates. J. Chem. Ecol. 1987, 13, 701–716. [Google Scholar] [CrossRef] [PubMed] [Green Version]
  7. Biedermann, P.H.W.; Müller, J.; Grégoire, J.-C.; Gruppe, A.; Hagge, J.; Hammerbacher, A.; Hofstetter, R.W.; Kandasamy, D.; Kolarik, M.; Kostovcik, M.; et al. Bark Beetle Population Dynamics in the Anthropocene: Challenges and Solutions. Trends Ecol. Evol. 2019, 34, 914–924. [Google Scholar] [CrossRef] [Green Version]
  8. Trumbore, S.; Brando, P.; Hartmann, H. Forest health and global change. Science 2015, 349, 814–818. [Google Scholar] [CrossRef] [Green Version]
  9. Jönsson, A.M.; Appelberg, G.; Harding, S.; Bärring, L. Spatio-temporal impact of climate change on the activity and voltinism of the spruce bark beetle, Ips typographus. Glob. Chang. Biol. 2009, 15, 486–499. [Google Scholar] [CrossRef]
  10. Seidl, R.; Rammer, W.; Jäger, D.; Lexer, M.J. Impact of bark beetle (Ips typographus L.) disturbance on timber production and carbon sequestration in different management strategies under climate change. For. Ecol. Manag. 2008, 256, 209–220. [Google Scholar] [CrossRef]
  11. Seidl, R.; Rammer, W. Climate change amplifies the interactions between wind and bark beetle disturbances in forest landscapes. Landsc. Ecol. 2017, 32, 1485–1498. [Google Scholar] [CrossRef] [Green Version]
  12. Wermelinger, B. Ecology and management of the spruce bark beetle Ips typographus—A review of recent research. For. Ecol. Manag. 2004, 202, 67–82. [Google Scholar] [CrossRef]
  13. Krejzar, T. Bark Beetle Outbreak in the Czech Republic: Challenges and Solutions. European Network INTEGRATE Seminar on Managing bark Beetle Impacts on Forests. Białowieża, Poland. 2018. Available online: https://informar.eu/sites/default/files/pdf/Presentation%20CZ%20062018.pdf (accessed on 7 October 2020).
  14. Stereńczak, K.; Mielcarek, M.; Kamińska, A.; Kraszewski, B.; Piasecka, Ż.; Miścicki, S.; Heurich, M. Influence of selected habitat and stand factors on bark beetle Ips typographus (L.) outbreak in the Białowieża Forest. For. Ecol. Manag. 2020, 459, 117826. [Google Scholar] [CrossRef]
  15. Hall, R.J.; Castilla, G.; White, J.C.; Cooke, B.J.; Skakun, R.S. Remote sensing of forest pest damage: A review and lessons learned from a Canadian perspective. Can. Entomol. 2016, 148, S296–S356. [Google Scholar] [CrossRef]
  16. Wulder, M.A.; Dymond, C.C.; White, J.C.; Leckie, D.G.; Carroll, A.L. Surveying mountain pine beetle damage of forests: A review of remote sensing opportunities. For. Ecol. Manag. 2006, 221, 27–41. [Google Scholar] [CrossRef]
  17. Hollaus, M.; Vreugdenhil, M. Radar Satellite Imagery for Detecting Bark Beetle Outbreaks in Forests. Curr. For. Rep. 2019, 5, 240–250. [Google Scholar] [CrossRef] [Green Version]
  18. Abdullah, H.; Darvishzadeh, R.; Skidmore, A.K.; Groen, T.A.; Heurich, M. European spruce bark beetle (Ips typographus, L.) green attack affects foliar reflectance and biochemical properties. Int. J. Appl. Earth Obs. Geoinf. 2018, 64, 199–209. [Google Scholar] [CrossRef] [Green Version]
  19. Coops, N.C.; Waring, R.H.; Wulder, M.A.; White, J.C. Prediction and assessment of bark beetle-induced mortality of lodgepole pine using estimates of stand vigor derived from remotely sensed data. Remote Sens. Environ. 2009, 113, 1058–1066. [Google Scholar] [CrossRef]
  20. Meddens, A.J.H.; Hicke, J.A.; Vierling, L.A.; Hudak, A.T. Evaluating methods to detect bark beetle-caused tree mortality using single-date and multi-date Landsat imagery. Remote Sens. Environ. 2013, 132, 49–58. [Google Scholar] [CrossRef]
  21. Meigs, G.W.; Kennedy, R.E.; Cohen, W.B. A Landsat time series approach to characterize bark beetle and defoliator impacts on tree mortality and surface fuels in conifer forests. Remote Sens. Environ. 2011, 115, 3707–3718. [Google Scholar] [CrossRef]
  22. Abdullah, H.; Skidmore, A.K.; Darvishzadeh, R.; Heurich, M. Sentinel-2 accurately maps green-attack stage of European spruce bark beetle (Ips typographus, L.) compared with Landsat-8. Remote Sens. Ecol. Conserv. 2019, 5, 87–106. [Google Scholar] [CrossRef] [Green Version]
  23. Zimmermann, S.; Hoffmann, K. Evaluating the capabilities of Sentinel-2 data for large-area detection of bark beetle infestation in the Central German Uplands. J. Appl. Remote Sens. 2020, 14, 024515. [Google Scholar] [CrossRef]
  24. Safonova, A.; Tabik, S.; Alcaraz-Segura, D.; Rubtsov, A.; Maglinets, Y.; Herrera, F. Detection of Fir Trees (Abies sibirica) Damaged by the Bark Beetle in Unmanned Aerial Vehicle Images with Deep Learning. Remote Sens. 2019, 11, 643. [Google Scholar] [CrossRef] [Green Version]
  25. Klouček, T.; Komárek, J.; Surový, P.; Hrach, K.; Janata, P.; Vašíček, B. The use of UAV mounted sensors for precise detection of bark beetle infestation. Remote Sens. 2019, 11, 1561. [Google Scholar] [CrossRef] [Green Version]
  26. Näsi, R.; Honkavaara, E.; Blomqvist, M.; Lyytikäinen-Saarenmaa, P.; Hakala, T.; Viljanen, N.; Kantola, T.; Holopainen, M. Remote sensing of bark beetle damage in urban forests at individual tree level using a novel hyperspectral camera from UAV and aircraft. Urban For. Urban Green. 2018, 30, 72–83. [Google Scholar] [CrossRef]
  27. Näsi, R.; Honkavaara, E.; Lyytikäinen-Saarenmaa, P.; Blomqvist, M.; Litkey, P.; Hakala, T.; Viljanen, N.; Kantola, T.; Tanhuanpää, T.; Holopainen, M. Using UAV-based photogrammetry and hyperspectral imaging for mapping bark beetle damage at tree-level. Remote Sens. 2015, 7, 15467–15493. [Google Scholar] [CrossRef] [Green Version]
  28. Fassnacht, F.E.; Latifi, H.; Ghosh, A.; Joshi, P.K.; Koch, B. Assessing the potential of hyperspectral imagery to map bark beetle-induced tree mortality. Remote Sens. Environ. 2014, 140, 533–548. [Google Scholar] [CrossRef]
  29. Honkavaara, E.; Näsi, R.; Oliveira, R.; Viljanen, N.; Suomalainen, J.; Khoramshahi, E.; Hakala, T.; Nevalainen, O.; Markelin, L.; Vuorinen, M.; et al. Using multitemporal hyper-and multispectral UAV imaging for detecting bark beetle infestation on norway spruce. Int. Arch. Photogramm. Remote Sens. Spat. Inf. Sci. ISPRS Arch. 2020, 43, 429–434. [Google Scholar] [CrossRef]
  30. Tanase, M.A.; Aponte, C.; Mermoz, S.; Bouvet, A.; Le Toan, T.; Heurich, M. Detection of windthrows and insect outbreaks by L-band SAR: A case study in the Bavarian Forest National Park. Remote Sens. Environ. 2018, 209, 700–711. [Google Scholar] [CrossRef]
  31. Ministry of Agriculture of the Czech Republic. Information on Forests and Forestry in the Czech Republic by 2019. Available online: http://eagri.cz/public/web/file/658587/Zprava_o_stavu_lesa_2019.pdf (accessed on 7 October 2020).
  32. Lukeš, P.; Strejček, R.; Křístek, Š.; Mlčoušek, M. Forest Health Assessment in Czech Republic Using Sentinel-2 Satellite Data. Certified Methodology; Forest Management Institute: Brandýs nad Labem, Czech Republic, 2018; ISBN 978-80-88184-21-8. [Google Scholar]
  33. Barka, I.; Lukeš, P.; Bucha, T.; Hlásny, T.; Strejček, R.; Mlčoušek, M.; Křístek, Š. Remote sensing-based forest health monitoring systems—Case studies from Czechia and Slovakia. Cent. Eur. For. J. 2018, 64, 259–275. [Google Scholar] [CrossRef]
  34. De Ocampo, A.L.P.; Bandala, A.A.; Dadios, E.P. Estimation of Triangular Greenness Index for Unknown PeakWavelength Sensitivity of CMOS-acquired Crop Images. In Proceedings of the 2019 IEEE 11th International Conference on Humanoid, Nanotechnology, Information Technology, Communication and Control, Environment, and Management (HNICEM), Laoag, Philippines, 29 November–1 December 2019; pp. 1–5. [Google Scholar]
  35. Minařík, R.; Langhammer, J. Use of a multispectral UAV photogrammetry for detection and tracking of forest disturbance dynamics. Int. Arch. Photogramm. Remote Sens. Spat. Inf. Sci. 2016, XLI-B8, 711–718. [Google Scholar] [CrossRef] [Green Version]
  36. Brovkina, O.; Cienciala, E.; Surový, P.; Janata, P. Unmanned aerial vehicles (UAV) for assessment of qualitative classification of Norway spruce in temperate forest stands. Geo-Spat. Inf. Sci. 2018, 21, 12–20. [Google Scholar] [CrossRef] [Green Version]
  37. Balková, M.; Bajer, A.; Patočka, Z.; Mikita, T. Visual Exposure of Rock Outcrops in the Context of a Forest Disease Outbreak Simulation Based on a Canopy Height Model and Spectral Information Acquired by an Unmanned Aerial Vehicle. ISPRS Int. J. Geo-Inf. 2020, 9, 325. [Google Scholar] [CrossRef]
  38. Czech Hydrometeorological Institute. Territorial Air Temperature. Available online: http://portal.chmi.cz/historicka-data/pocasi/uzemni-teploty?l=en (accessed on 7 October 2020).
  39. Czech Hydrometeorological Institute. Territorial Precipitation. Available online: http://portal.chmi.cz/historicka-data/pocasi/uzemni-srazky?l=en (accessed on 7 October 2020).
  40. European Space Agency. Sentinel-2 Level-2A Algorithm Theoretical Basis Document; European Space Agency: Paris, France, 2020. [Google Scholar]
  41. Fernandez-Carrillo, A.; de la Fuente, D.; Rivas-Gonzalez, F.W.; Franco-Nieto, A. A Sentinel-2 unsupervised forest mask for European sites. Proc. SPIE 2019, 11156, 111560Y. [Google Scholar]
  42. Fernandez-Carrillo, A.; Franco-Nieto, A.; Pinto-Bañuls, E.; Basarte-Mena, M.; Revilla-Romero, B. Designing a Validation Protocol for Remote Sensing Based Operational Forest Masks Applications. Comparison of Products Across Europe. Remote Sens. 2020, 12, 3159. [Google Scholar] [CrossRef]
  43. Tucker, C.J.; Elgin, J.H.; McMurtrey, J.E.; Fan, C.J. Monitoring corn and soybean crop development with hand-held radiometer spectral data. Remote Sens. Environ. 1979, 8, 237–248. [Google Scholar] [CrossRef]
  44. Huete, A.R. A soil-adjusted vegetation index (SAVI). Remote Sens. Environ. 1988, 25, 295–309. [Google Scholar] [CrossRef]
  45. Qi, J.; Chehbouni, A.; Huete, A.R.; Kerr, Y.H.; Sorooshian, S. A modified soil adjusted vegetation index. Remote Sens. Environ. 1994, 48, 119–126. [Google Scholar] [CrossRef]
  46. Haralick, R.M. Statistical and structural approaches to texture. Proc. IEEE 1979, 67, 786–804. [Google Scholar] [CrossRef]
  47. Breiman, L. Random Forests. Mach. Learn. 2001, 45, 5–32. [Google Scholar] [CrossRef] [Green Version]
  48. Fernandez-Carrillo, A.; de la Fuente, D.; Rivas-Gonzalez, F.W.; Franco-Nieto, A. An automatic Sentinel-2 forest types classification over the Roncal Valley, Navarre: Spain. Proc. SPIE 2019, 11156, 111561N. [Google Scholar]
  49. Havašová, M.; Bucha, T.; Ferenčík, J.; Jakuš, R. Applicability of a vegetation indices-based method to map bark beetle outbreaks in the High Tatra Mountains. Ann. For. Res. 2015, 58, 295–310. [Google Scholar] [CrossRef]
  50. Pasqualotto, N.; Delegido, J.; Van Wittenberghe, S.; Rinaldi, M.; Moreno, J. Multi-Crop Green LAI Estimation with a New Simple Sentinel-2 LAI Index (SeLI). Sensors 2019, 19, 904. [Google Scholar] [CrossRef] [Green Version]
  51. Delegido, J.; Verrelst, J.; Alonso, L.; Moreno, J. Evaluation of sentinel-2 red-edge bands for empirical estimation of green LAI and chlorophyll content. Sensors 2011, 11, 7063–7081. [Google Scholar] [CrossRef] [Green Version]
  52. De Groot, M.; Ogris, N. Short-term forecasting of bark beetle outbreaks on two economically important conifer tree species. For. Ecol. Manag. 2019, 450, 117495. [Google Scholar] [CrossRef]
  53. Immitzer, M.; Atzberger, C. Early detection of bark beetle infestation in Norway spruce (Picea abies, L.) using worldView-2 data frühzeitige erkennung von borkenkä ferbefall an fichten mittels worldView-2 satellitendaten. Photogramm. Fernerkund. Geoinf. 2014, 2014, 351–367. [Google Scholar] [CrossRef]
  54. Marx, A. Detection and classification of bark beetle infestation in pure norway spruce stands with multi-temporal RapidEye imagery and data mining techniques. Photogramm. Fernerkund. Geoinf. 2010, 2010, 243–252. [Google Scholar] [CrossRef]
  55. Ortiz, M.S.; Breidenbach, J.; Kändler, G. Early Detection of Bark Beetle Green Attack Using TerraSAR-X and RapidEye Data. Remote Sens. 2013, 5, 1912–1931. [Google Scholar] [CrossRef] [Green Version]
  56. Czech Hydrometeorological Institute. Weather and Bark Beetle. Available online: https://portal.chmi.cz/aktualni-situace/aktualni-stav-pocasi/ceska-republika/pocasi-a-kurovec (accessed on 8 October 2020).
  57. Hájek, F.; Lukeš, P.; Příhoda, J.; Křístek, Š.; Zahradník, P.; Kantorová, M.; Strejček, R.; Mlčoušek, M. Bark Beetle Map. Available online: https://www.kurovcovamapa.cz/o-projektu (accessed on 8 October 2020).
Figure 1. Trees infested by bark beetles (Ips typographus L.) in the study area. True colour orthophoto with 6 cm spatial resolution captured on 17/05/2020.
Remotesensing 12 03634 g001
Figure 2. Location of study area. Overview maps of the (a) national and (b) regional context. (c) Forest area managed by University Forest Enterprise (UFE).
Remotesensing 12 03634 g002
Figure 3. Progress of the volume of timber harvesting in millions of cubic meters, divided into coniferous and deciduous timber. Source: Ministry of Agriculture of the Czech Republic, 2020 [31].
Remotesensing 12 03634 g003
Figure 4. Progress of the volume of salvage cutting grouped by cause. Source: Ministry of Agriculture of the Czech Republic, 2020 [31].
Remotesensing 12 03634 g004
Figure 5. Recorded volume of infested spruce wood harvested in the years 2005 to 2019. Source: Ministry of Agriculture of the Czech Republic, 2020 [31].
Remotesensing 12 03634 g005
Figure 6. Deviations from the mean temperatures and precipitation (1981–2010) in the period 2000–2020. * Records for 2020 were acquired at the end of August. Source: Czech Hydrometeorological Institute, 2020 [38,39].
Remotesensing 12 03634 g006
Figure 7. General workflow to obtain bark beetle damage from Sentinel-2 images.
Remotesensing 12 03634 g007
Figure 8. Maps of spruce vitality in 2019 (left), BDA19 (middle), and BDB20 (right). Images: Sentinel-2 acquired on 2019-08-29 (Spruce vitality 2019 and BDA19) and 2020-07-01 (BDB0) in true color composition (blue/green/red). BDA, biotic damage A; BDB, biotic damage B.
Remotesensing 12 03634 g008
Figure 9. Confusion matrices of biotic damage (2019) (left), biotic damage (2020) (middle), and biotic damage (2020) excluding pixels of dead trees (right).
Remotesensing 12 03634 g009
Figure 10. Box plots representing changes in vitality per ground truth class for each product.
Remotesensing 12 03634 g010
Table 1. Summary of salvage cutting volumes (m3) per species and year (until 15 July 2020) at the University Forest Enterprise (UFE) forest.
Species201820192020Total
Picea abies30,56459,95833,897124,419
Pinus sylvestris21876735467113,594
Larix decidua42125711160811,531
Fagus sylvatica846516714407452
Abies alba115325635034220
Quercus petraea29610204711786
Fraxinus excelsior93377473943
Pseudotsuga menziesii18426298543
Abies grandis351918234
Quercus robus3315021204
Carpinus betulus6411623203
Other25836971698
Total39,92582,61943,284165,828
Table 2. Sentinel-2 images used to produce each classification map.
ProductTimingForest/Non-ForestDominant SpeciesBiotic Damage
Biotic damage A 2019t02018-03-222018-03-222018-09-10
t12018-08-292018-08-292019-06-30
Biotic damage A 2020t02019-04-012019-04-012019-06-30
t12019-06-302019-06-302020-07-01
Biotic damage B 2020t02020-04-022020-04-022019-06-30
t12020-07-012020-07-012020-07-01
Table 3. Sentinel-2 Level 2A bands. NIR, near-infrared; SWIR, shortwave infrared.
Sentinel-2 BandsCentral Wavelength (nm) *Spatial Resolution (m)
Band 01-Coastal aerosol442.760
Band 02-Blue492.410
Band 03-Green559.810
Band 04-Red664.610
Band 05-Red Edge 1 704.120
Band 06-Red Edge 2740.520
Band 07-Red Edge 3782.820
Band 08-NIR832.810
Band 8A-Narrow NIR864.720
Band 09-Water vapour945.160
Band 10-Cirrus1373.560
Band 11-SWIR 11613.720
Band 12-SWIR 22202.420
* Central wavelength of Sentinel-2A MultiSpectral Instrument (MSI) bands.
Table 4. Performance metrics by product and damage category. BDA, biotic damage A; BDB, biotic damage B; acc., accuracy; prec., precision; rec., recall; CE, commission error; OE, omission error; relB, relative bias.
ProductClassacc.prec.rec.F1CEOErelB
BDA19No damage0.901.000.700.830.000.300.42
Minor damage0.950.801.000.890.200.00−0.20
Moderate damage0.970.861.000.930.140.00−0.14
Severe damage0.980.921.000.960.080.00−0.08
BDA20No damage0.860.940.640.760.060.360.46
Minor damage0.970.861.000.930.140.00−0.14
Moderate damage0.940.800.930.860.200.07−0.14
Severe damage0.950.800.980.880.200.02−0.18
BDB20No damage0.810.900.580.700.100.420.56
Minor damage0.930.740.950.830.260.05−0.22
Moderate damage0.920.740.930.820.260.08−0.20
Severe damage0.960.840.980.900.160.02−0.14
Publisher’s Note: MDPI stays neutral with regard to jurisdictional claims in published maps and institutional affiliations.

