Article

Tropical Cyclone Climatology from Satellite Passive Microwave Measurements

1
Naval Research Laboratory, Monterey, CA 93943, USA
2
Naval Research Laboratory, Washington, DC 20375, USA
*
Author to whom correspondence should be addressed.
Remote Sens. 2020, 12(21), 3610; https://doi.org/10.3390/rs12213610
Submission received: 11 September 2020 / Revised: 22 October 2020 / Accepted: 29 October 2020 / Published: 3 November 2020

Abstract

:
The satellite passive microwave (PMW) sensor brightness temperatures (TBs) of all tropical cyclones (TCs) from 1987–2012 have been carefully calibrated for inter-sensor frequency differences, center position fixing using the Automated Rotational Center Hurricane Eye Retrieval (ARCHER) scheme, and application of the Backus–Gilbert interpolation scheme for better presentation of the TC horizontal structure. With additional storm motion direction and the 200–850 hPa wind shear direction, a unique and comprehensive TC database is created for this study. A reliable and detailed climatology for each TC category is analyzed and discussed. There is significant annual variability of the number of storms at hurricane intensity, but the annual number of all storms is relatively stable. Results based on the analysis of the 89 GHz horizontal polarization TBs over oceans are presented in this study. An eyewall contraction is clearly displayed with an increase in TC intensity. Three composition schemes are applied to present a reliable and detailed TC climatology at each intensity category and its geographic characteristics. The global composition relative to the North direction is not able to lead a realistic structure for an individual TC. Enhanced convection in the down-motion quadrants relative to direction of TC motion is obvious for Cat 1–3 TCs, while Cat 4–5 TCs still have a concentric pattern of convection within 200 km radius. Regional differences are evident for weak storms. Results indicate the direction of TC movement has more impact on weak storms than on Cat 4–5 TCs. A striking feature is that all TCs have a consistent pattern of minimum TBs at 89 GHz in the downshear left quadrant (DSLQ) for the northern hemisphere basins and in the downshear right quadrant (DSRQ) for the southern hemisphere basin, regarding the direction of the 200–850 hPa wind shear. Tropical depression and tropical storm have the minimum TBs in the downshear quadrants. The axis of the minimum TBs is slightly shifted toward the vertical shear direction. There is no geographic variation of storm structure relative to the vertical wind shear direction except over the southern hemisphere which shows a mirror image of the storm structure over the northern hemisphere. This study indicates that regional variation of storm structure relative to storm motion direction is mainly due to differences of the vertical wind shear direction among these basins. Results demonstrate the direction of the 200–850 hPa wind shear plays a critical role in TC structure.

Graphical Abstract

1. Introduction

A tropical cyclone (TC) can be one of the most impactful weather systems, causing catastrophic damages to human lives, society, transportation, properties, etc. [1,2]. For example, hurricane Katrina in 2005, with a maximum wind speed of 280 km hr−1, impacted most of the southeast United States (US), making landfall in the greater New Orleans area. It is the costliest hurricane in US history, killing an estimated 1245–1836 people and causing damages of $149 billion US dollars [3]. TCs can attain very strong wind speeds, greater than 260 km hr−1, and bring heavy precipitation. Most TC damage is caused by the force of its strong wind, storm surge, and flash flooding. Flooding from US landfalling TCs is the leading cause of death related to severe storms [4]. TC rainfall can contribute up to 15% of the total precipitation over a hurricane season in the Carolinas of the United States [5]. To mitigate the potential impact of TCs, appropriate preparations should be taken based on accurate monitoring and predictions of TC intensity, structure and precipitation.
The low earth orbit (LEO) satellite passive microwave (PMW) sensor-based measurements are extremely important in TC monitoring and forecasts because of the PMW sensor’s capability in penetrating clouds to observe TC temperature and humidity profiles and the horizontal structure [6,7,8,9]. The unique horizontal structures of the inner eyewall, outer eyewall, principal convective band and secondary convective band as well as the moat areas are clearly captured by PMW sensors at the 85–91 GHz channels [10,11]. Three types of spiral bands, based on movement, are possible: stationary (non-propagating), apparent propagation (stationary with respect to the TC center), and intrinsic propagation [1]. These special characteristics have been utilized for estimation and prediction of TC intensity and evolution using various approaches, such as Dvorak technique [12], Advanced Dvorak Technique (ADT) [13,14], and satellite consensus [15,16].
TC structure characteristics and evolution are associated with intensification processes [17,18,19,20,21,22,23,24,25]. Both TC intensifying and weakening periods have maximum precipitation in the downshear left quadrant (DSLQ) and up-shear left quadrant (USLQ). The minimum rain area, especially the greater areal coverage of stratiform rainfall, located in the up-shear quadrants, is associated with a TC rapid intensification process. Another indication of a rapid intensifying vortex is a cyclonic rotation of shallow-to-moderate-to-deep precipitation from the downshear right to downshear left to up-shear left quadrants. Lightning activity is often evident in DSLQ in the TC inner core (0–100 km) area and in the downshear right quadrant (DSRQ) in the outer rainband (100–300 km) region [20]. The inner core lightning burst (ICLB) is also linked to TC intensity change. Results show that TCs with ICLB inside the radius of maximum wind (RMW) lead to intensification and weakening with ICLB outside the RMW [21]. Thus, the vertical wind shear direction is critical to TC horizontal structure patterns. These results highlight importance of the azimuthal coverage of precipitation and the radial location of deep convection for TC intensification. In addition, the environmental impacts on TC structures shows regional differences, but are not well investigated using satellite observations [26,27,28,29]. Therefore, a thorough analysis using a long term PMW sensor brightness temperature (TB) TC database will be important to evaluate these results and lead to new insights of TC structure and their geographic variations.
A comprehensive TC database is created with an improved calibration scheme and an advanced interpolation scheme as well as an accurate TC center position from all PMW sensors during 1987–2012 and with TC motion and the 200–850 hPa vertical wind shear information from National Hurricane Center’s Hurricane WRF forecasts used in the statistical hurricane intensity prediction scheme (SHIPS) outputs [30]. Detailed structural features of TCs revealed in this study can provide an improved and accurate climatology of TC structure and how it varies with intensity and geographic basins. Results should benefit evaluations of numerical weather prediction (NWP) model TC simulations and the decision-making efforts to mitigate incoming TC impacts. An accurate TC climatology can also be applied to guide improvements of NWP model skills for better predictions of TC intensity and distribution and to improve understanding of TC intensification processes.

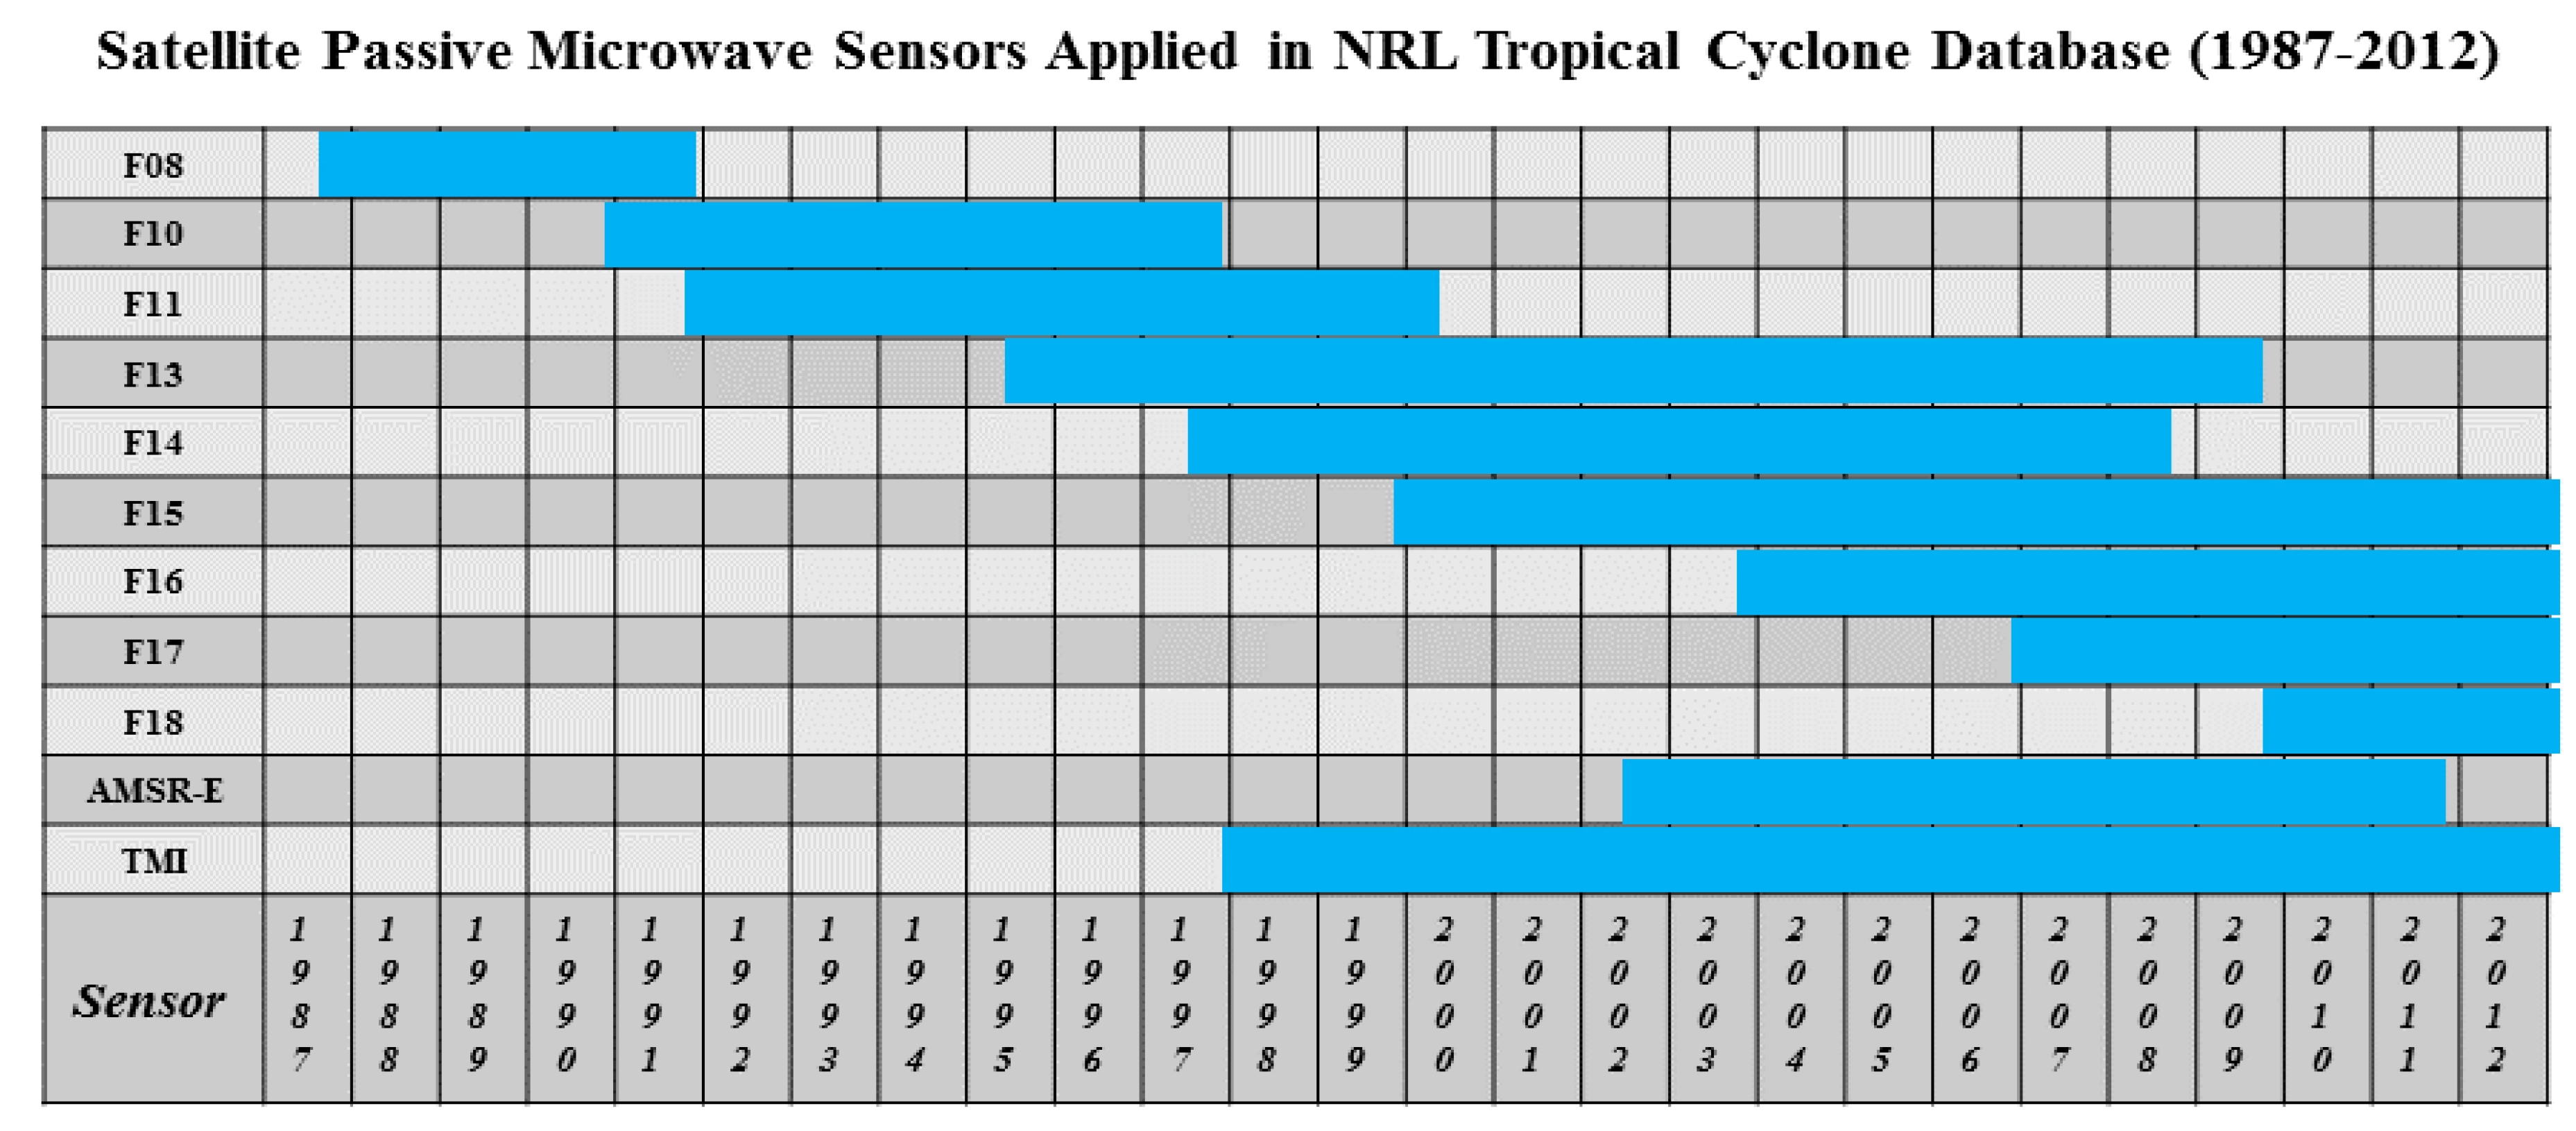
2. Methodology and Datasets

The maximum TB difference due to frequency differences among PMW sensors at 85, 89, and 91 GHz is approximately 15 K. These TB differences have to be corrected in order to have consistent TBs from all PMW sensors for TC applications. Yang et al. [31] developed a physical-based inter-sensor calibration scheme to calibrate Special Sensor Microwave Imager (SSM/I) and Tropical Rainfall Measurement Mission (TRMM) Microwave Imager (TMI) TBs at 85 GHz and Special Sensor Microwave Imager and Sounder (SSMIS) TBs at 91 GHZ into 89 GHz so that all PMW sensors will have consistent TBs at 89 GHz to monitor TC activities. The calibrated TBs are applied for the Naval Research Laboratory (NRL) TC webpage products utilized for near real-time monitoring of global TC activities. Accurate center position is very important to present TC structure. The Automated Rotational Center Hurricane Eye Retrieval (ARCHER) scheme [32,33] is used to fix the TC center positions initiated with the 6-hr TC best track locations. The Backus–Gilbert interpolation scheme [34] is implemented for SSM/I and SSMIS to have better presentations of TC structure. The 200–850 hPa vertical wind shear, defined as the difference of mean wind vector over a concentric zone of 200–800 km radius around a TC center between 200 and 850 hPa, is applied to represent the ambient large scale environmental conditions [30,35,36]. The 6-hr best track information of global TCs from Joint Typhoon Warning Center (JTWC), Central Pacific Hurricane Center (CPHC), and National Hurricane Center (NHC) such as the maximum wind speed, minimum center surface pressure, center positions, and direction of TC movement and 200–850 hPa vertical wind shear are collected with the NRL PMW TBs to create a unique comprehensive TC database during 1987–2012. Since the horizontal polarization is better for presentation of storm horizontal structure features, only 89 GHz at horizontal polarization (H) is utilized for this study. Storms over oceans only captured by PMW sensors are included in the dataset.
PMW sensors and their life cycles during 1987–2012 are displayed in Figure 1. SSM/I was onboard the Defense Meteorological Satellite Program (DMSP) F08, F10, F11, F13, F14, and F15, while SSMIS is on DMSP F16-F18. The Advanced Microwave Scanning Radiometer for Earth Observing System (EOS) (AMSR-E) was onboard the EOS Aqua satellite. TMI was on the NASA TRMM satellite. The overlaps of these satellites provide multiple chances to observe a TC per day during its lifecycle. The TC intensity is classified as five categories based on Saffir–Simpson hurricane wind scale, in addition to tropical depression (TD) and tropical storm (TS) [37,38]. Cat 3–5 TCs are classified as major hurricanes. There are six TC basins: Atlantic (AL), Central Pacific (CP), East Pacific (EP), Indian Ocean (IO), Southern Hemisphere (SH) and West Pacific (WP) [6,36]. A TC is classified into one of the basins depending on its center position. A distribution list of all categorized storms observed by PMW sensors during 1987–2012 can be found in Table 1. The thousands of observations for each storm category, except Cat 5 TCs with 615 samples, provide a solid foundation for a robust analysis of global storm climatology. However, there is a significantly uneven distribution of the observed TCs over the six basins, especially for major hurricanes. The number of observed TCs over CP, EP, and IO is much smaller than other basins, especially over IO where only 17 samples of Cat 5 TCs are available.
The consistent TBs at 89 GHz are interpolated at 0.01° × 0.01° spatial resolution and extracted over a 12° × 12° area over the TC center. A polar coordinate system is then adapted to better represent the TC intensity and structure. This system has a radius of 500 km with resolution of 1 km and azimuthal angles of 360° with a resolution of 0.5°. The polar system is ideal for TC climatology when a composite analysis has to be utilized. In order to study impacts of the TC motion and vertical wind shear on TC structures, TBs in the polar coordinate system are rotated accordingly with directions of the TC movement and the 200–850 hPa wind shear before a composition process is conducted for observations at each storm intensity category, respectively.

3. Results

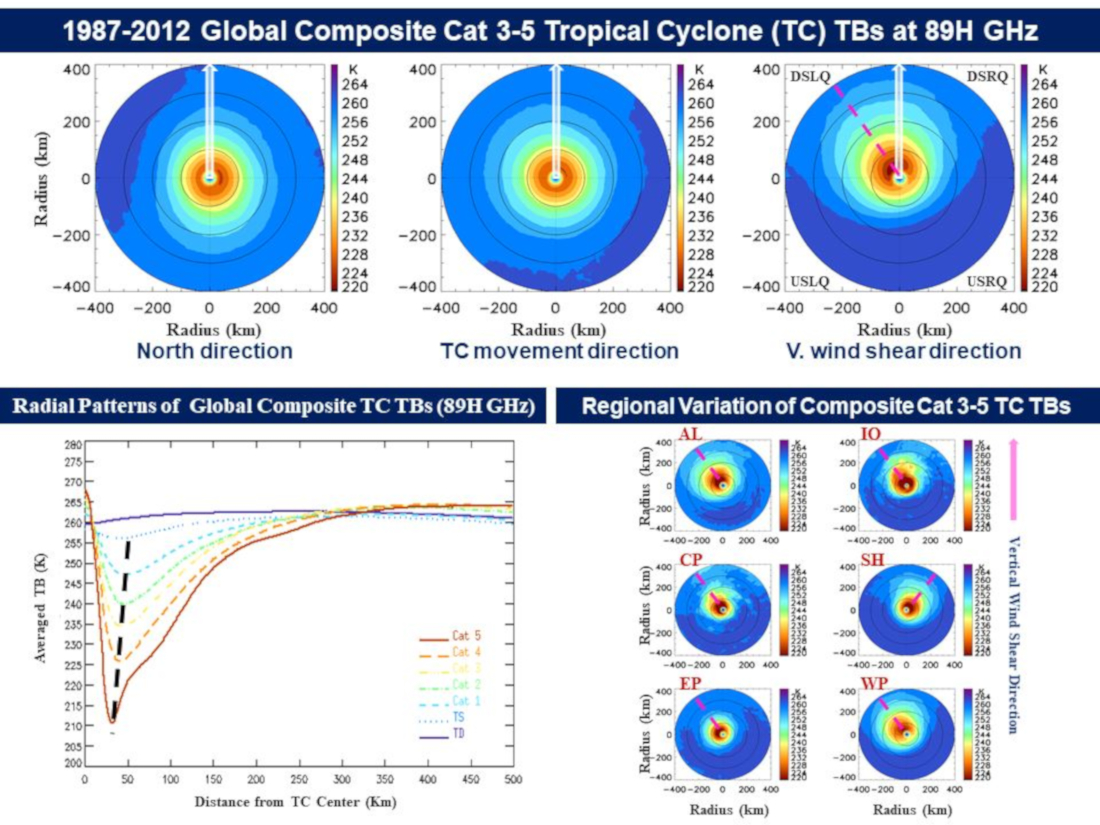
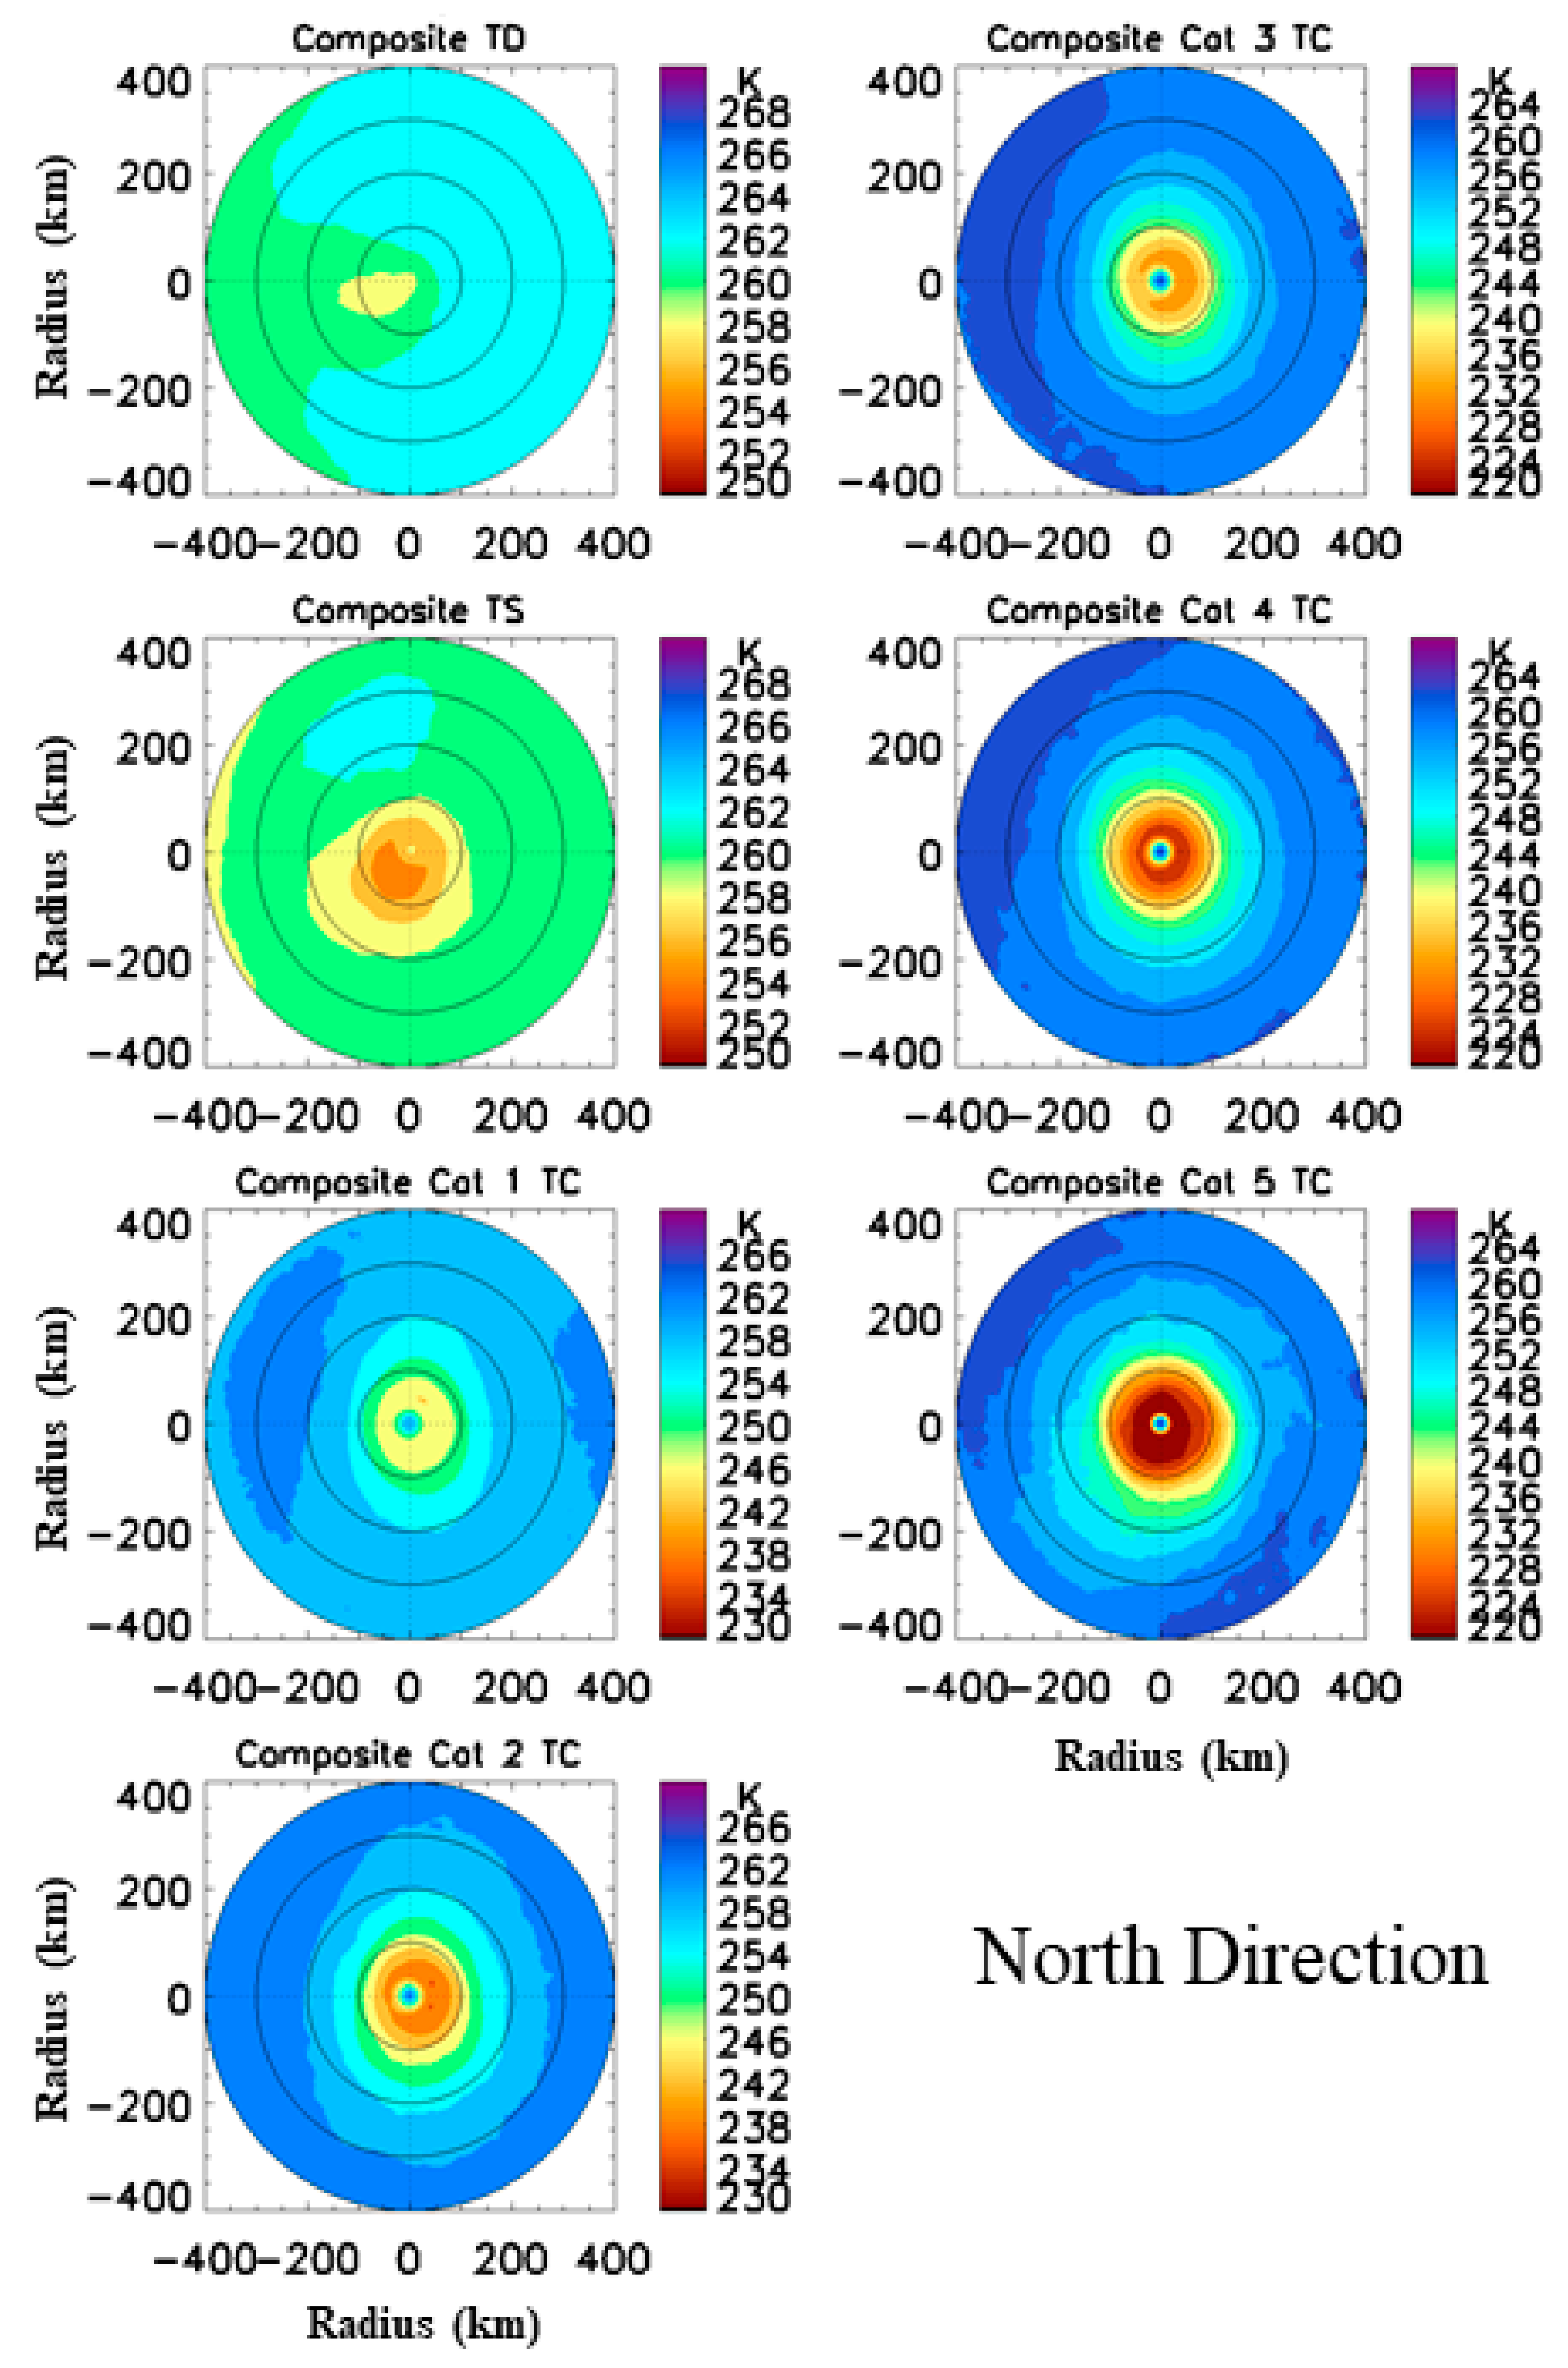
3.1. TC Structure Climatology

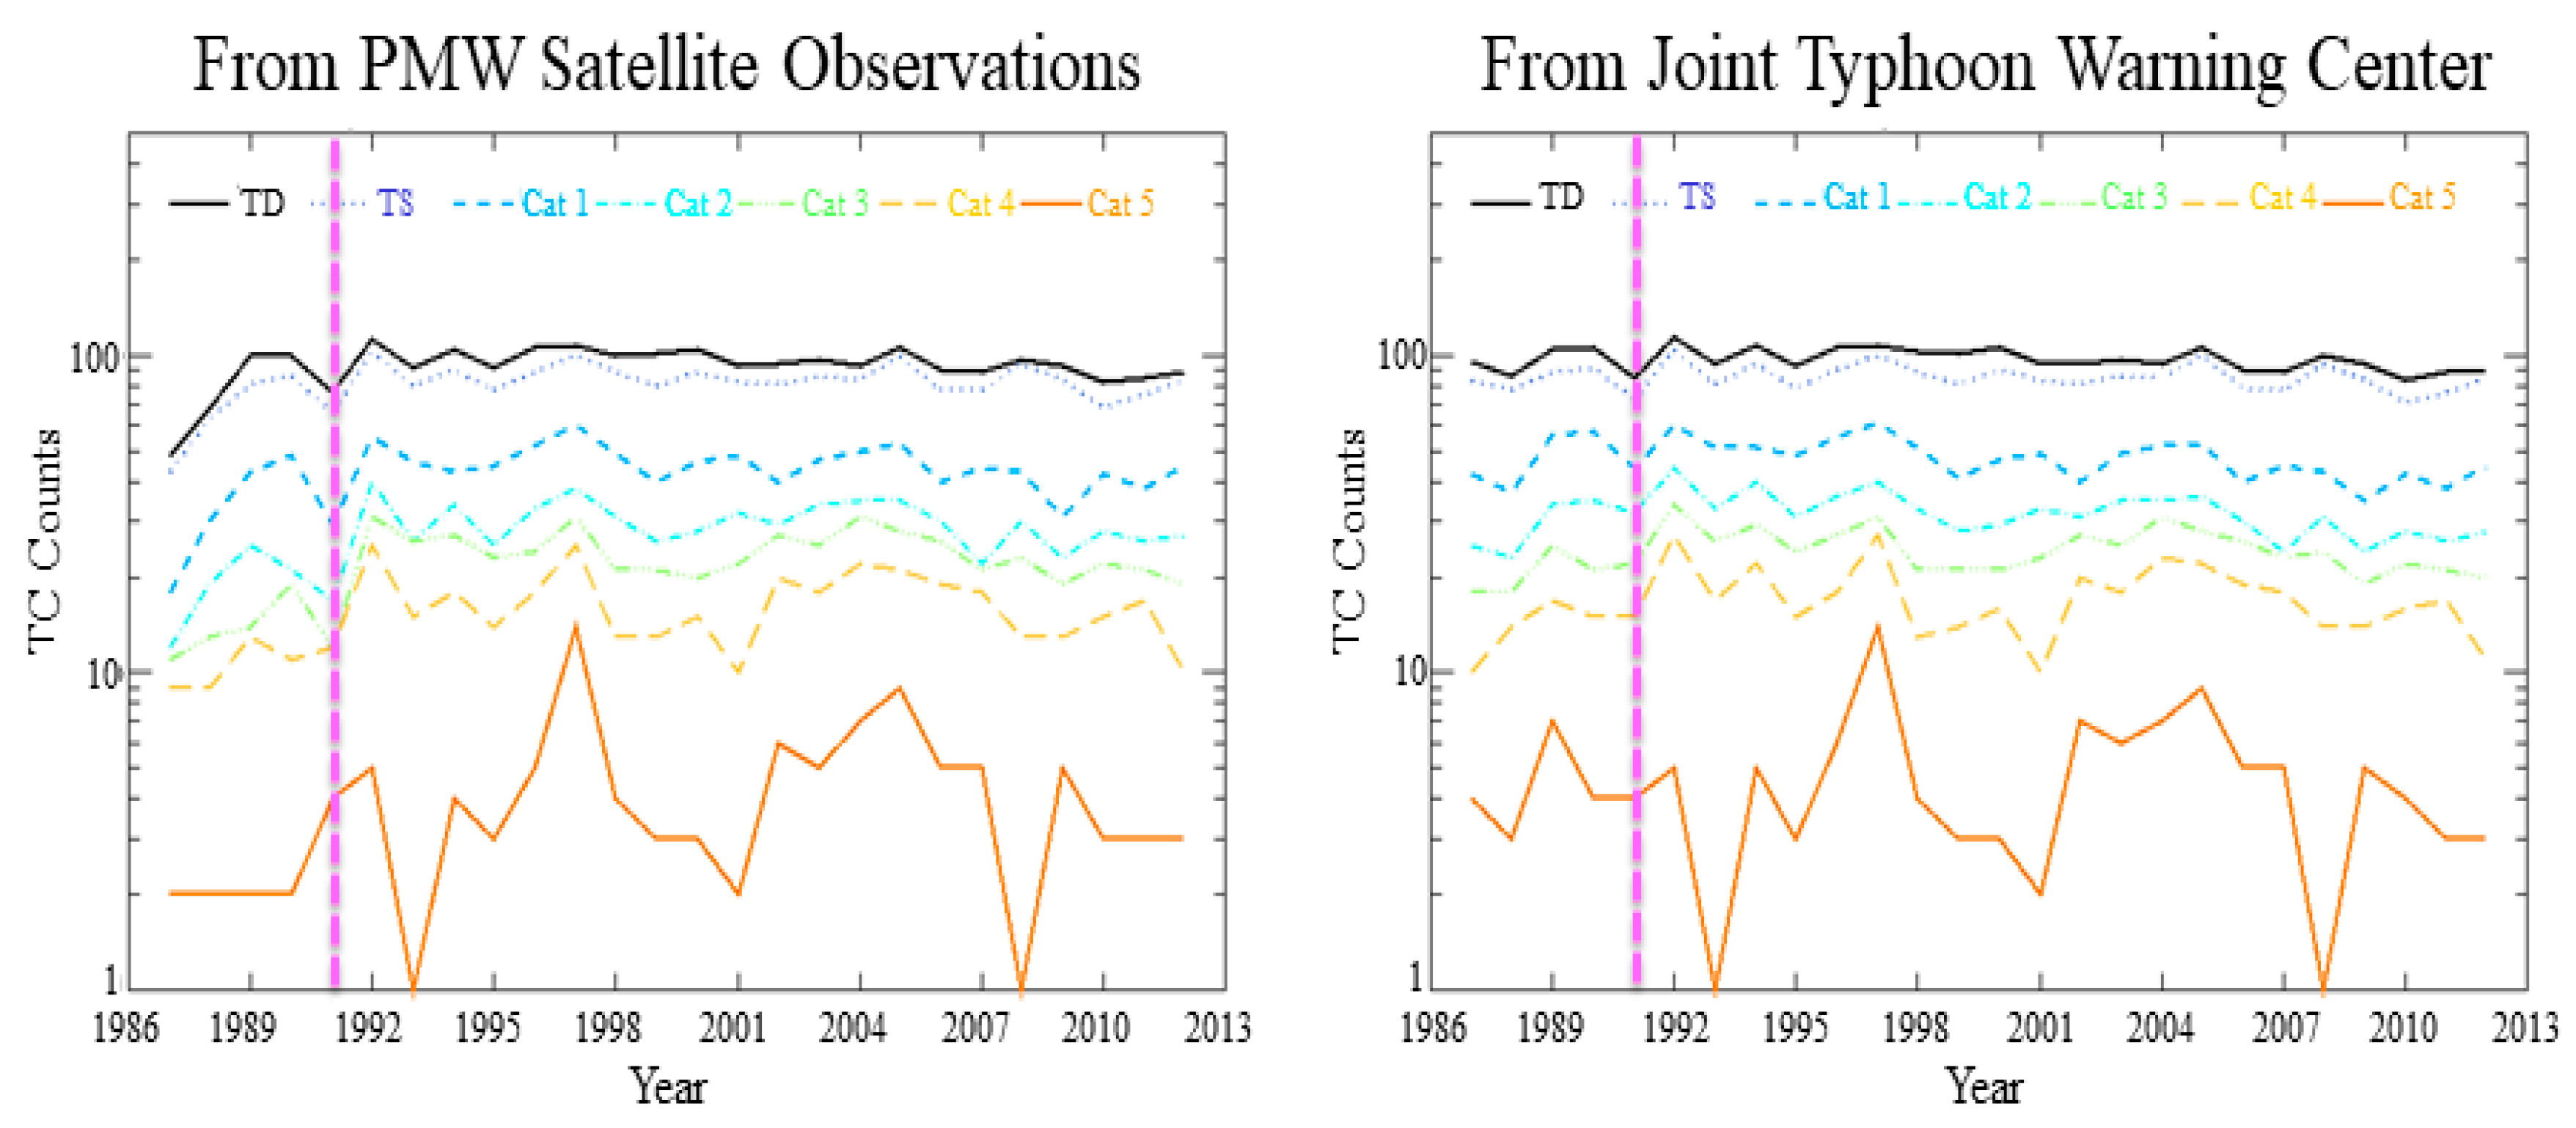
3.1.1. Global TC Annual Variability

Figure 2 shows comparison of annual variation of global storm activities from the PMW sensor measurements and the JTWC best track data during 1987–2012. A close agreement is obvious after 1992. The significantly less observed storms from PMW sensors before 1991 is due to the fact that only F08 was available during that time period. Some storms were missed in 1991 because only F08 and F10 sensors were available. The evidence is clear that there is a significantly annual variability of TCs, especially for major hurricanes. Twelve Cat 5 TCs were observed in 1997 while one observed Cat 5 TC in 1993 and 2008. However, the total number of annual storms is relatively stable around 100 with a small annual variation. It is also worth noting there is no obvious trend on the number of annual storms.

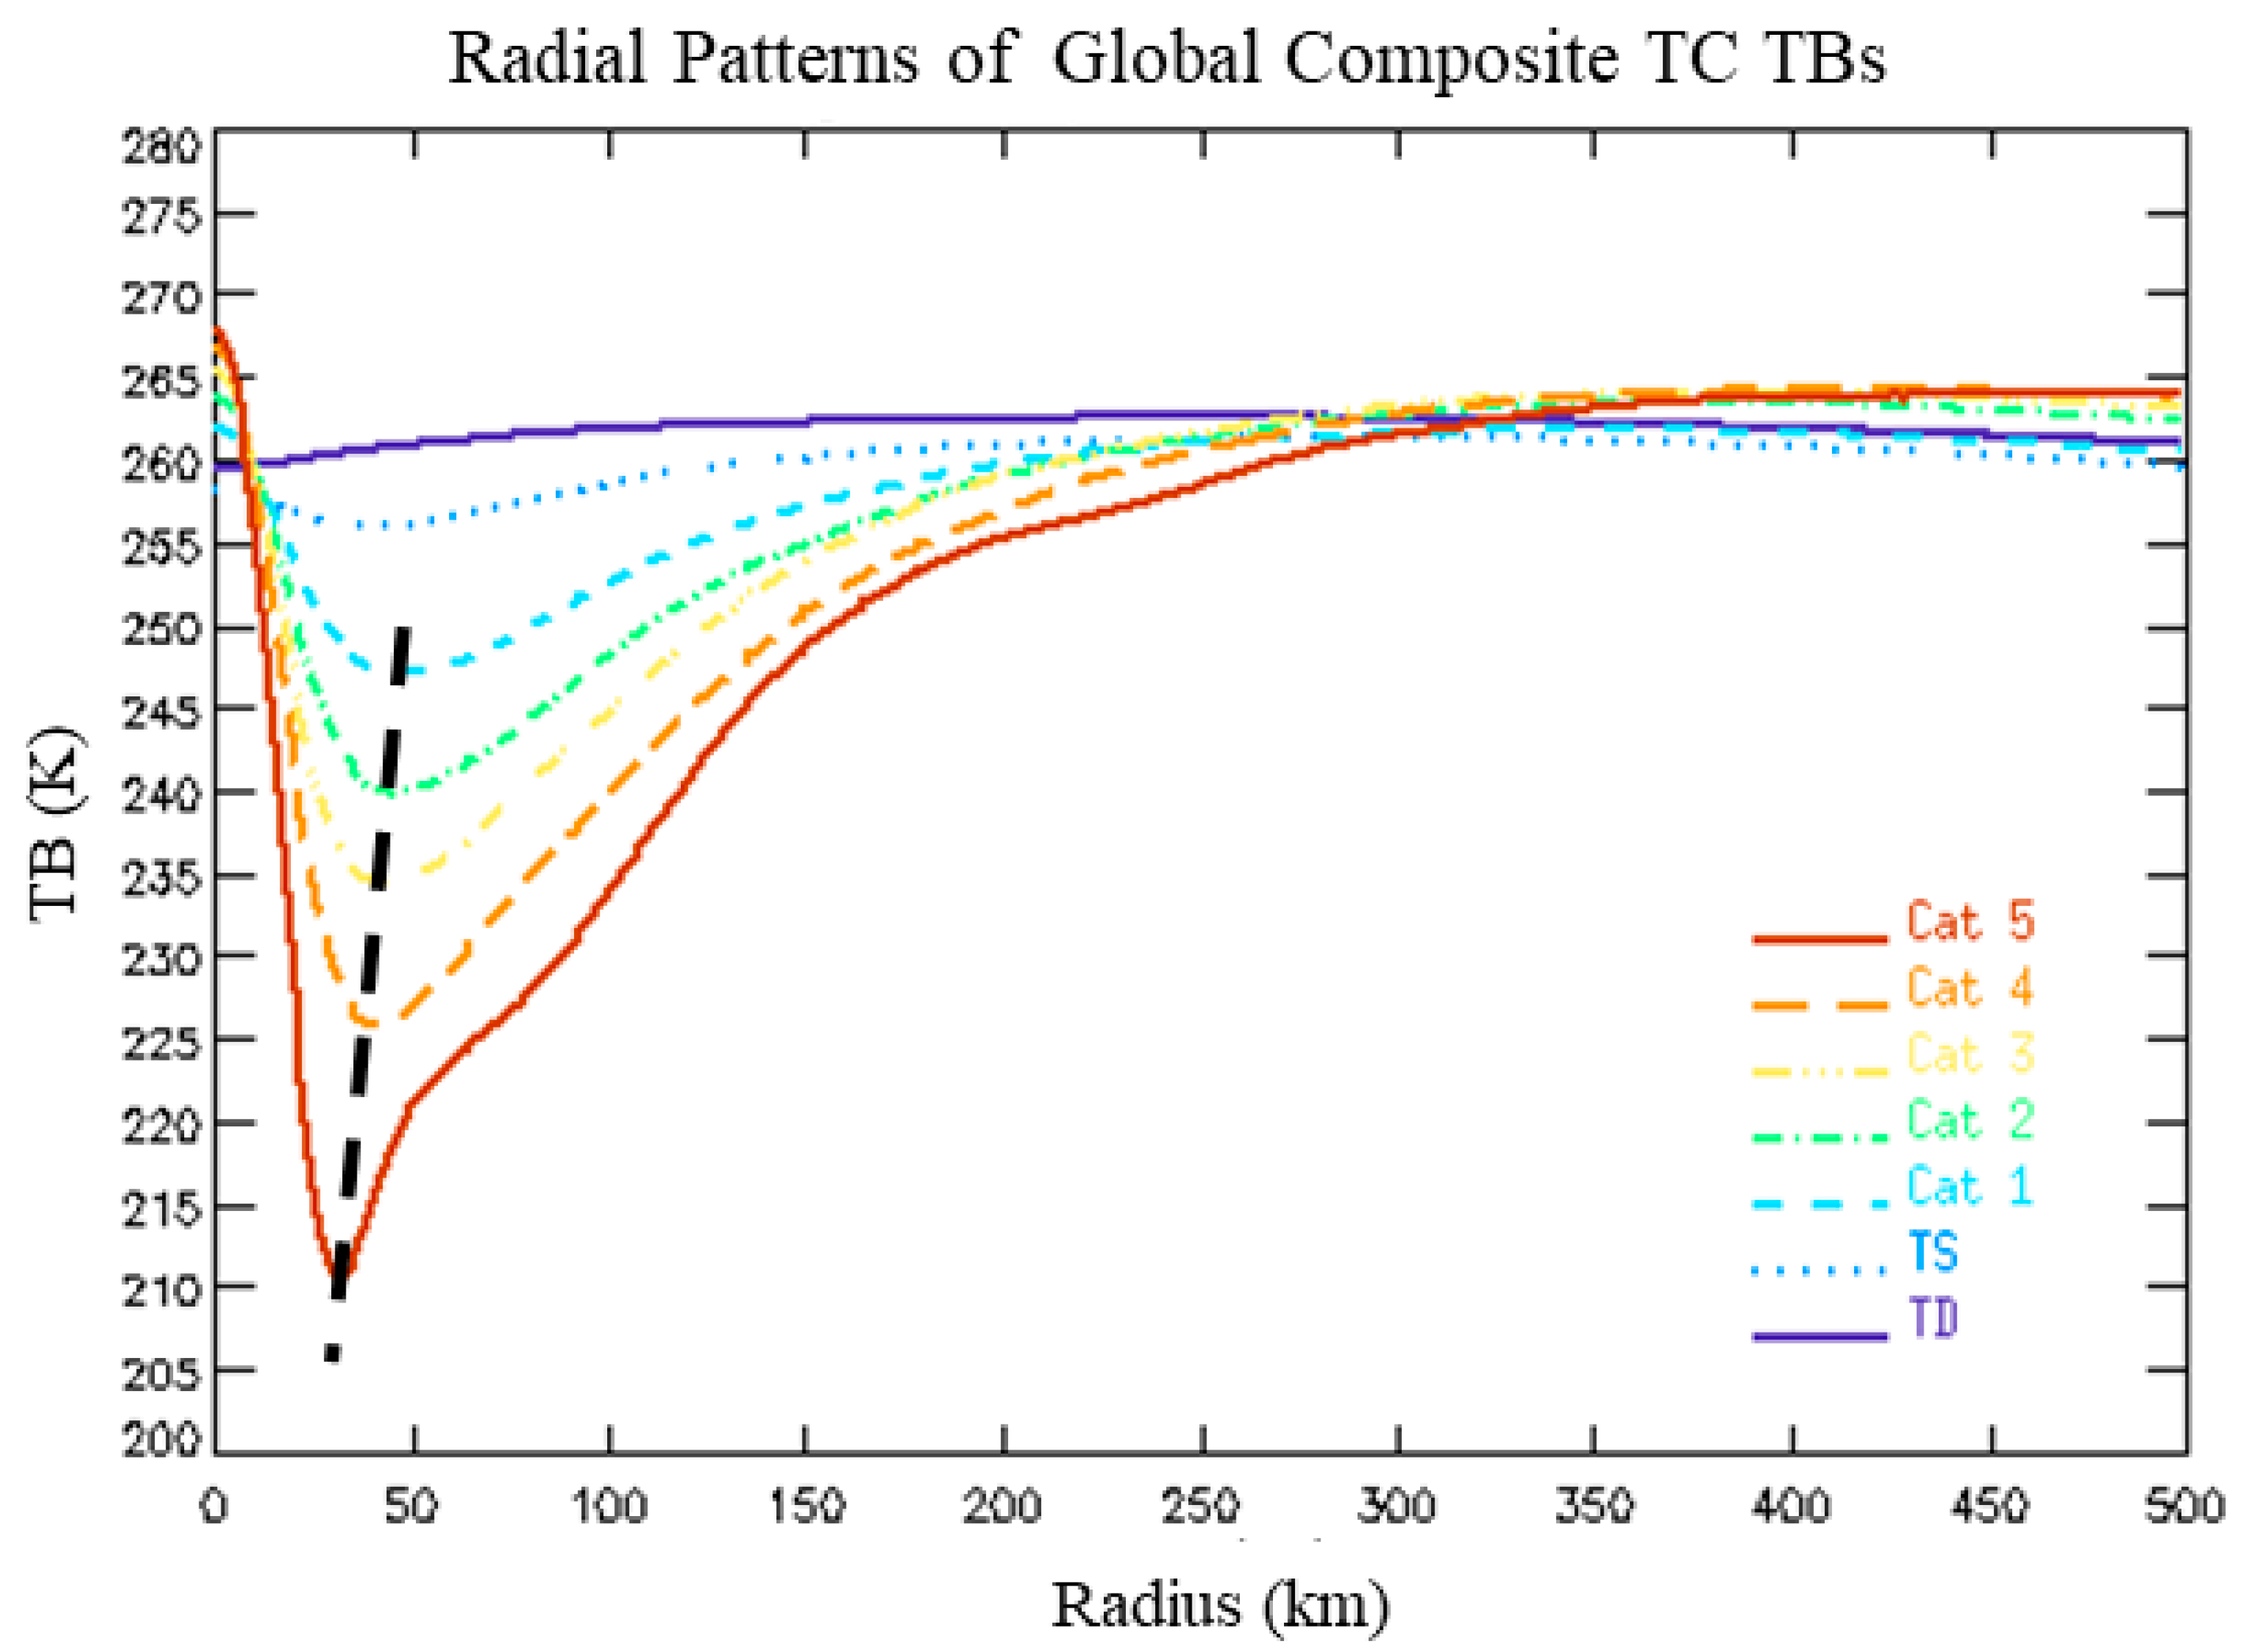
3.1.2. Global TC Structure

Radial patterns of the azimuthally-averaged PMW TBs at 89H GHz for a polar coordinate system are shown in Figure 3 for global composite storms in 1987–2012 at each intensity category. The depressed values of TBs at 89 GHz is due to the scattering effect of ice particles from deep convections; therefore, the minimum TB position is an indication of the TC eyewall location. The heavy dashed line is a connection of these minimum TBs for Cat 1–5 TCs. The eyewall of Cat 5 TCs has a radius of 30 km while 50 km for Cat 1 TCs. A slight tilting of the heavy dashed line indicates an eyewall contraction with increase of TC intensity. A TB depression is not obvious near the TD center position because its convection is weak which has a small scattering effect. Another reason is that the TD convection is not well organized so that its center position is not accurately identified. A TB depression around radius of 50 km is evident with a very small amplitude for TS due to less convection intensity and less well-defined eyewall than seen in stronger TCs.
Composition of a large sample of observed TCs from PMW sensors is the best way to present an accurate climatology of TC structure. Figure 4 displays distributions of the composite TBs at 89H GHz relative to the North direction for each storm intensity category during 1987–2012. The prominent feature for Cat 1–5 TCs is the consistent concentric pattern of TBs, which is easily understandable because of the TC consistent eyewall and spiral convections. A decrease of TB amplitudes near eyewall associated with increase of TC intensity is evident. The concentric pattern is not clear for TS and TD.
It is well-known that a TC presents a unique asymmetric distribution of spiral convections. The composition analysis for global storms in Figure 4 will not lead to a realistic structure for an individual TC, but results demonstrate the composition process is correctly conducted. Published literature indicates that distribution of strong convection is impacted by TC motion, intensity variability, and especially the vertical wind shear of a TC’s ambient condition [28,29,39,40,41,42,43]. A recent study of TC precipitation climatology shows that the maximum TC rainfall is located in the down-motion quadrants with direction of the TC movement and in DSLQ with direction of the 200–850 hPa vertical wind shear [44]. Therefore, we will analyze impacts of the large scale environmental conditions on TC structure.

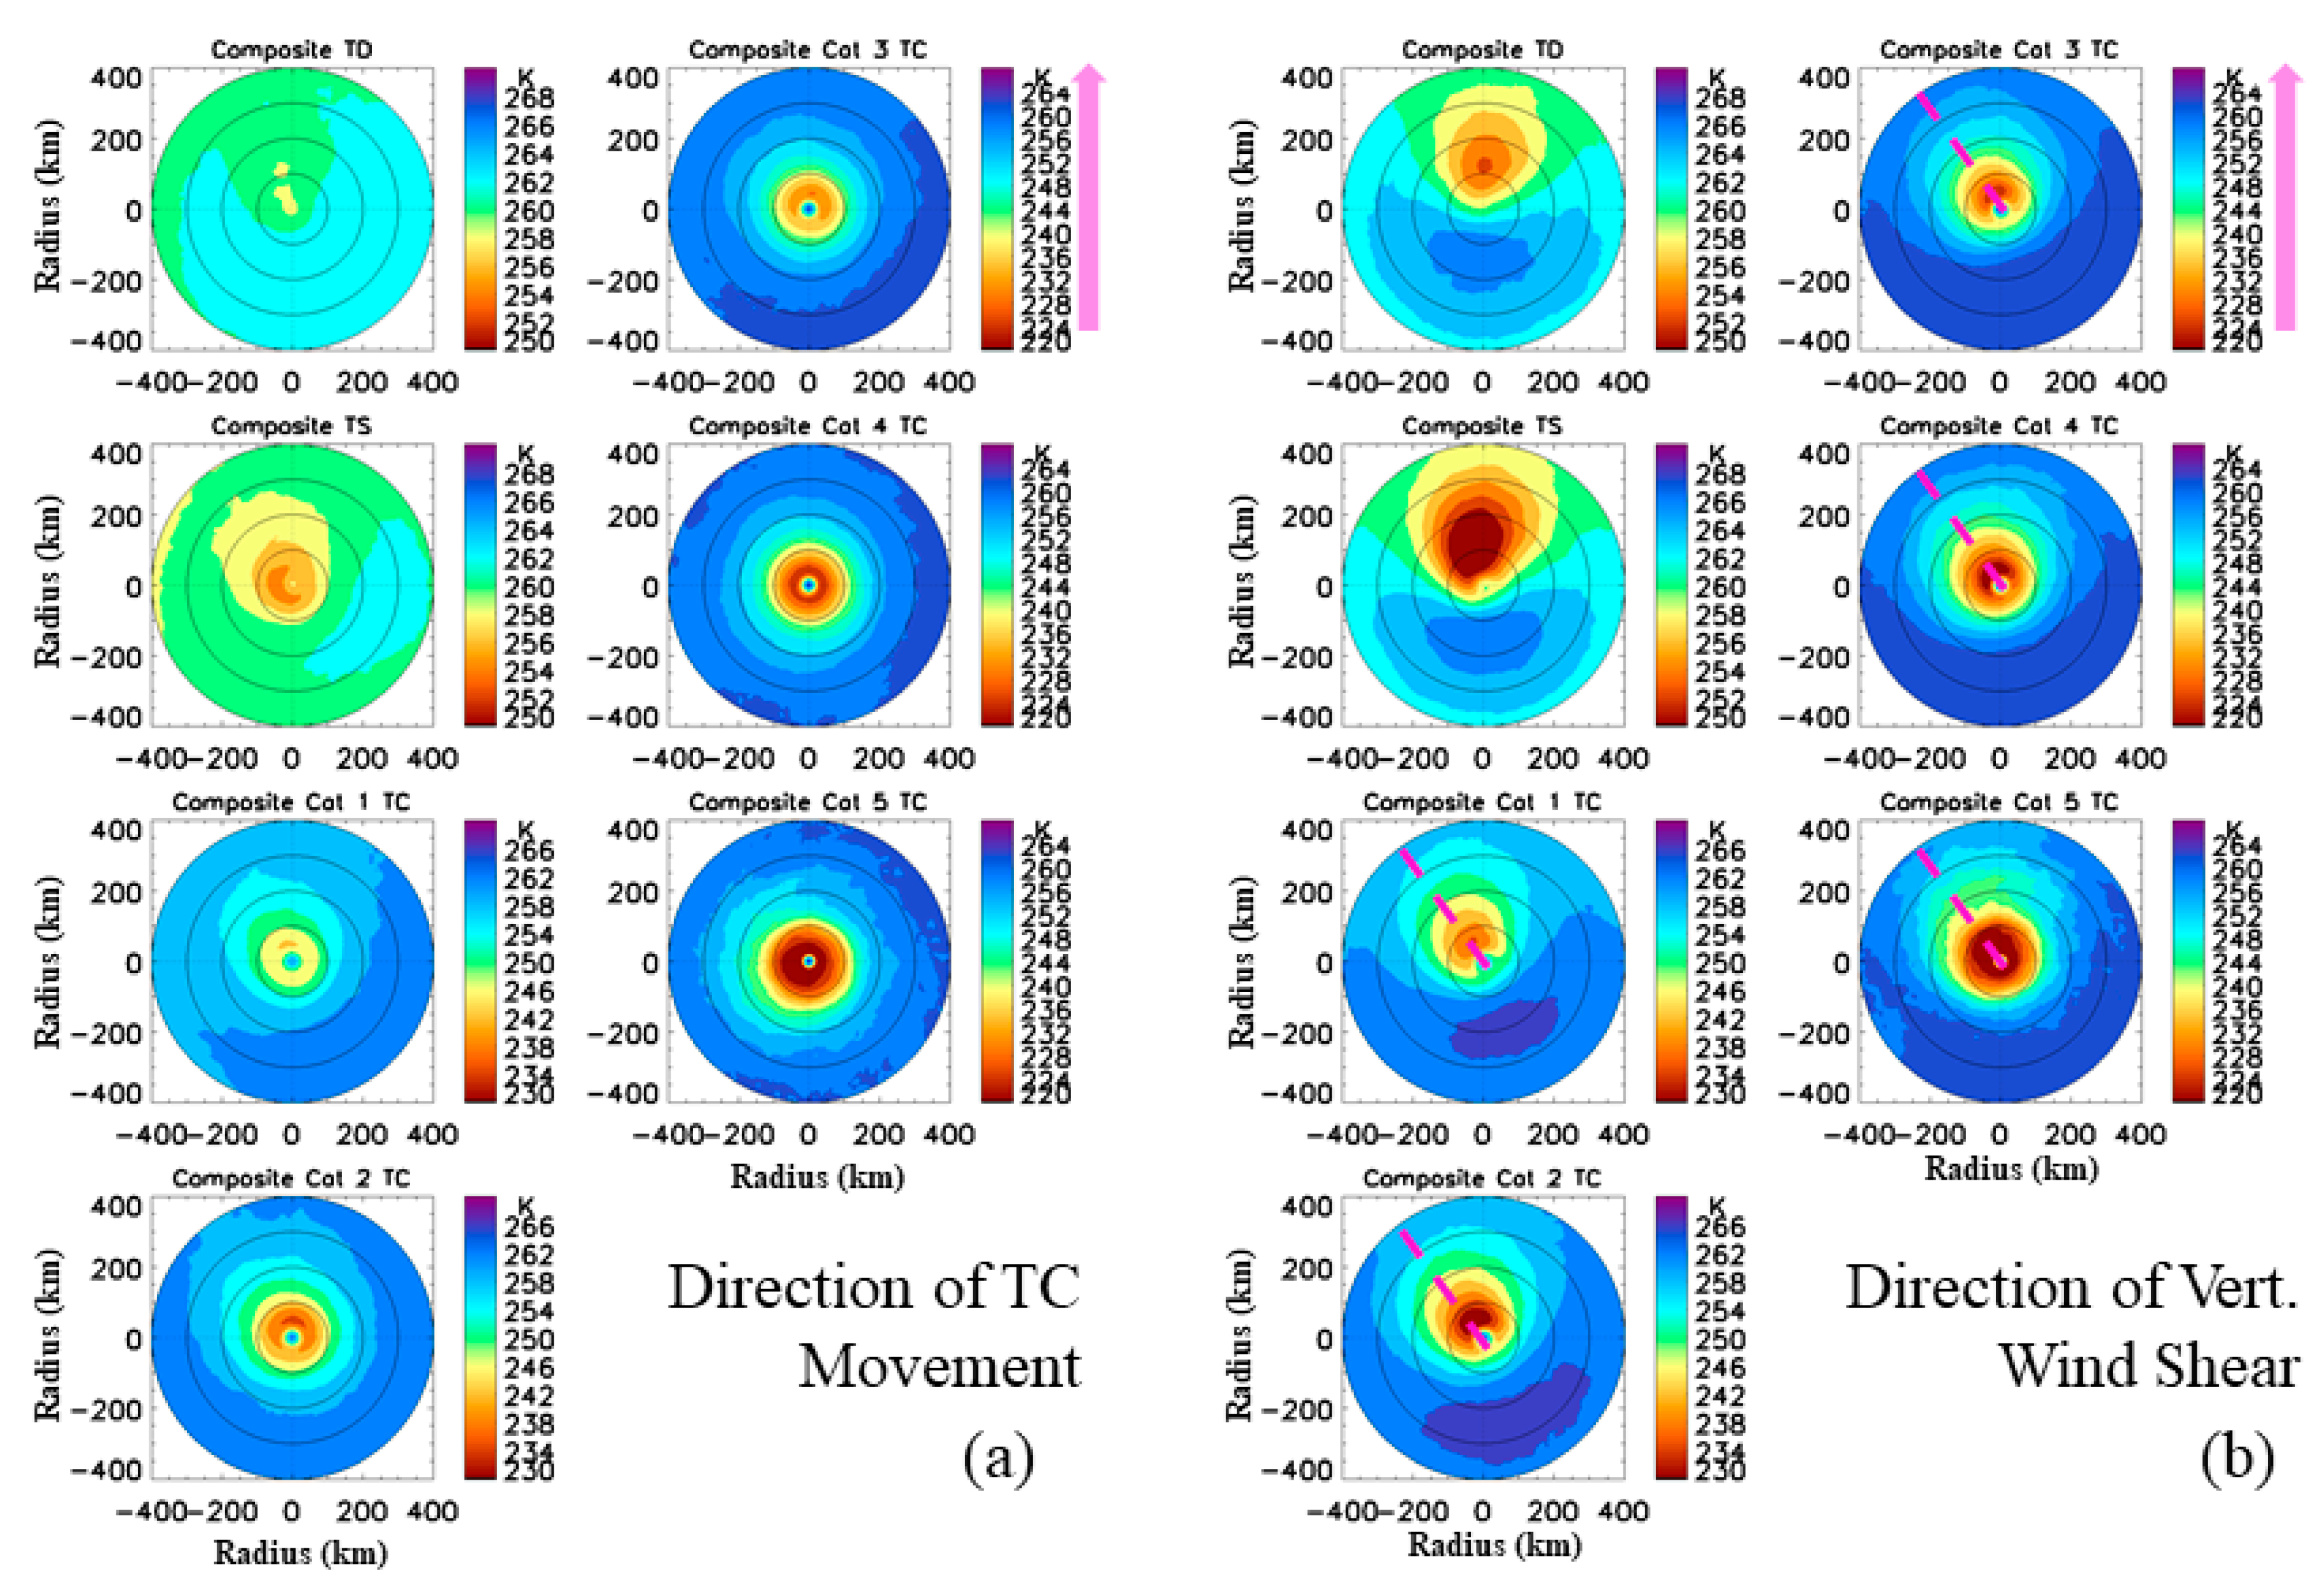
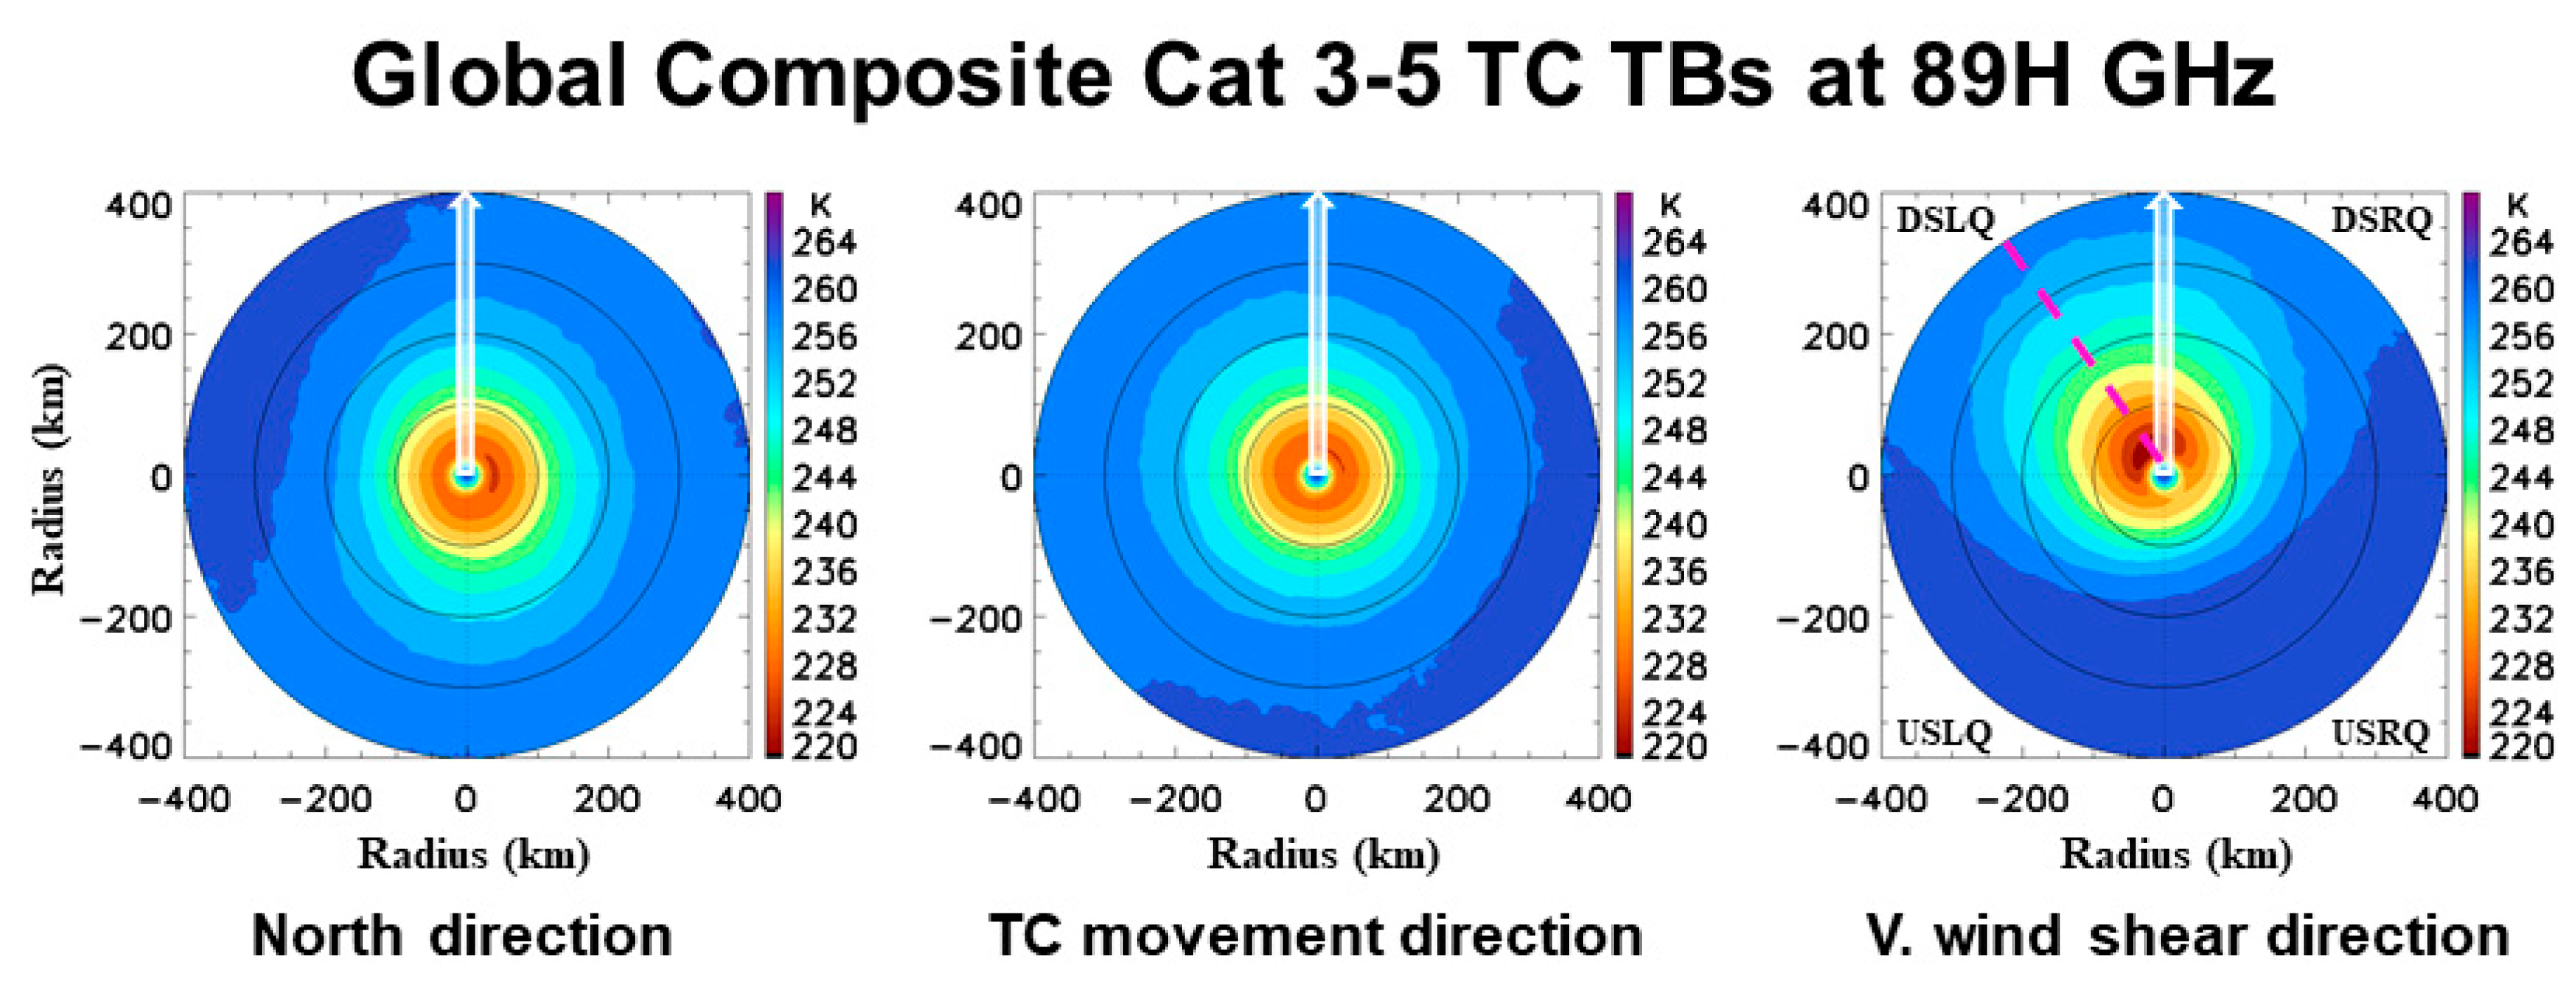
3.1.3. Environmental Impact on TC Structure

Distributions of the composite TBs at 89H GHz for all global storm categories with regards to direction of TC movement are displayed in Figure 5a. The relative low TBs are associated with strong convection and mostly located in the down-motion left quadrant (DMLQ) for TD and TS and in the down-motion quadrants for Cat 1–3 TCs. The strong convection in the down-motion quadrants indicates convergence caused by the storm movement plays an important role on convection enhancement ahead of its motion. However, the concentric pattern is still a dominant feature for storms of higher intensity (Cat 4–5 TCs). It indicates that effect of the TC movement is not able to overtake impact on structure of the thermodynamic processes which generate a strong vortex for Cat 4–5 TCs.
By same token, distributions of TBs at 89H GHz with regard to direction of the 200–850 hPa wind shear for all storm intensity categories are given by Figure 5b. The consistent distribution pattern for Cat 1–5 TCs is a distinct feature, i.e., the minimum TBs are always located in DSLQ. However, the minimum TBs are located in the down-motion quadrants for TD and TS. The minimum TBs decrease with an increase of TC intensity is expected due to strong convection which is always correlated with magnitude of higher intensity TCs. Results demonstrate that the direction of the 200–850 hPa wind shear plays a critical role in the distribution of TC convection.
To minimize potential uncertainties associated with limited samples in each category of the Cat 3–5 TCs, Figure 6 presents a distribution comparison of the global composite TBs for major hurricanes between three different composition methods. The combination of major hurricanes in 1987–2012 leads to a more reliable distribution of TC structure than each category of the Cat 3–5 TCs because of more samples involved in the composition process. The classic composition with the North direction shown in the left panel displays an expected concentric pattern of the minimum TBs near the eyewall. Regarding direction of the TC movement, although the concentric pattern is still a dominant feature, a slight forward shift of the minimum TBs is visible. This feature is due to the mixed results from the down-motion quadrants for Cat 3 TC convections and a concentric pattern for Cat 4–5 TC convection. The right panel presents a distinct distribution pattern from the others. The minimum TBs are clearly concentrated in DSLQ with a minimum axis slightly shifted to direction of the 200–850 hPa wind shear. Results from analysis of the major hurricane structure further confirms the findings from Figure 5, except for a clear and smooth distribution pattern. Direction of the 200–850 hPa wind shear is the key factor in affecting distributions of the TC convection, i.e., convection is climatologically favored in DSLQ with a maximum axis slightly shifted to the shear direction, and in downshear quadrants for TD and TS. Direction of the TC movement also plays a more important role in weak storms (TD, TS, and Cat 1–2 TCs) than in major hurricanes. These features are consistent with locations of TC heavy precipitation [25,28,29,44].
More studies are still needed to explain why direction of the vertical wind shear plays a critical role in distribution of strong TC convection. Black et al. [45] suggested that the rapidly rotating tangential winds near the TC strong convections create a maximum vertical motion in DSLQ which lead to the minimum TBs at 89 GHz and the maximum rainfall there. Nevertheless, a consistent pattern of the minimum TB distributions at 89H GHz with regard to direction of the 200–850 hPa wind shear from the reliable TC database provide valuable information on storm structure to mitigate impacts of approaching storms when the large scale environmental condition is available.

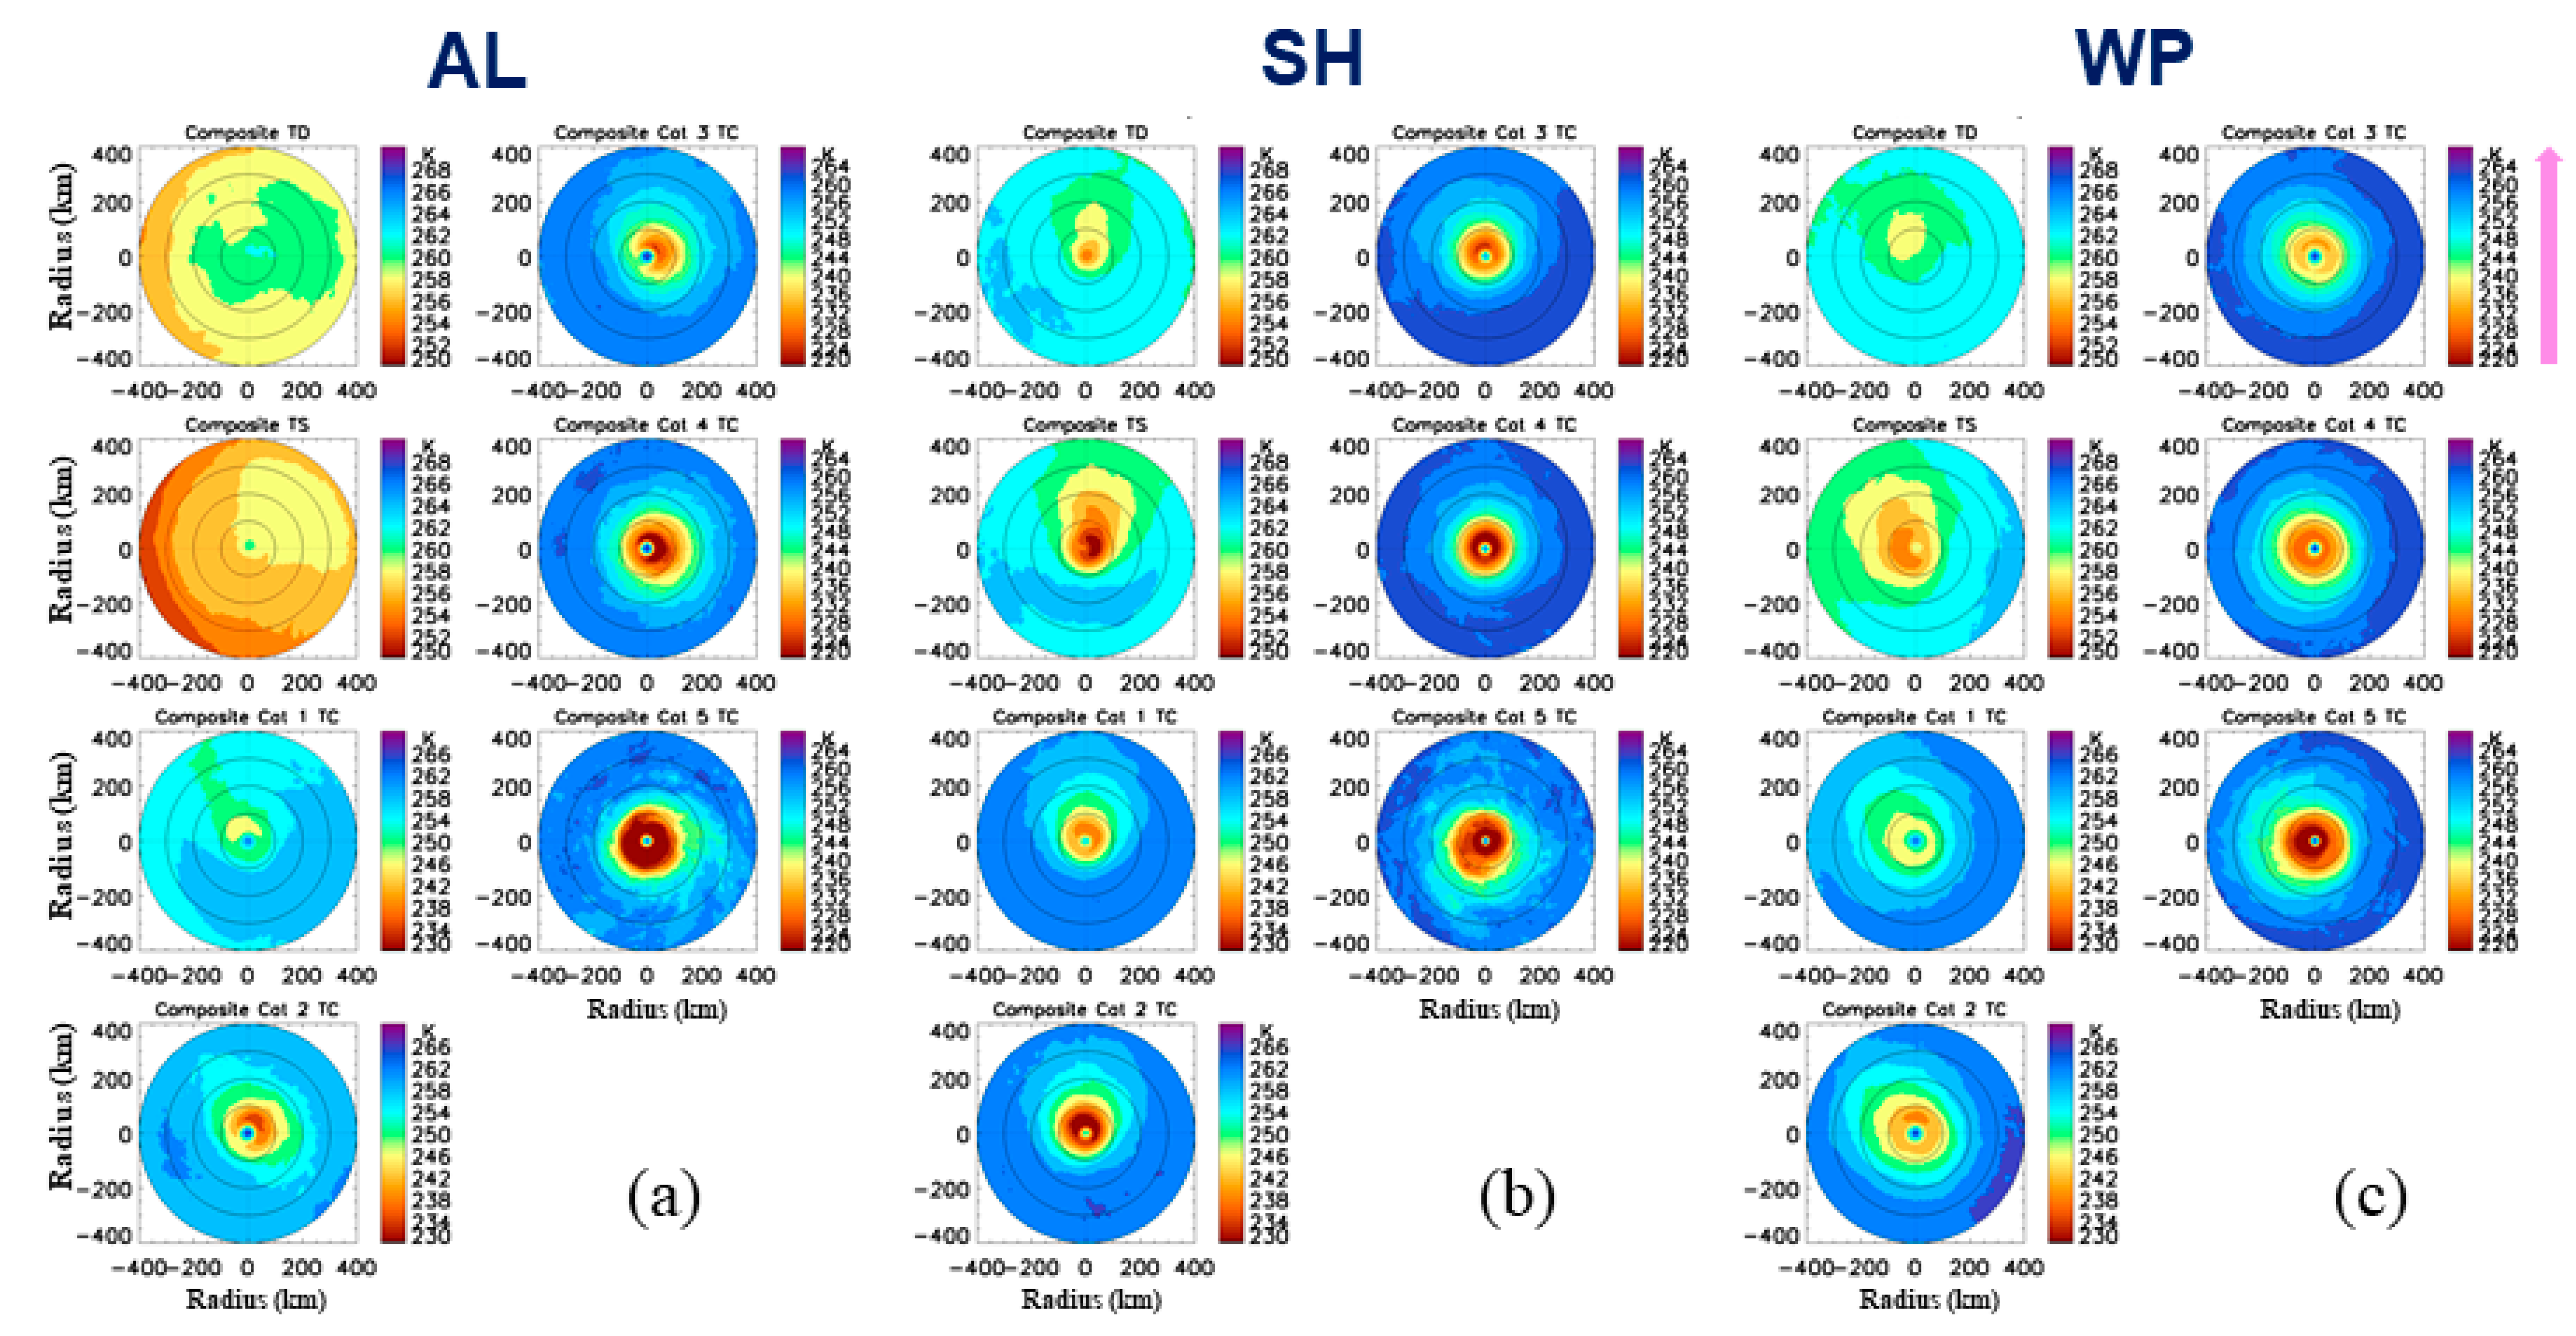
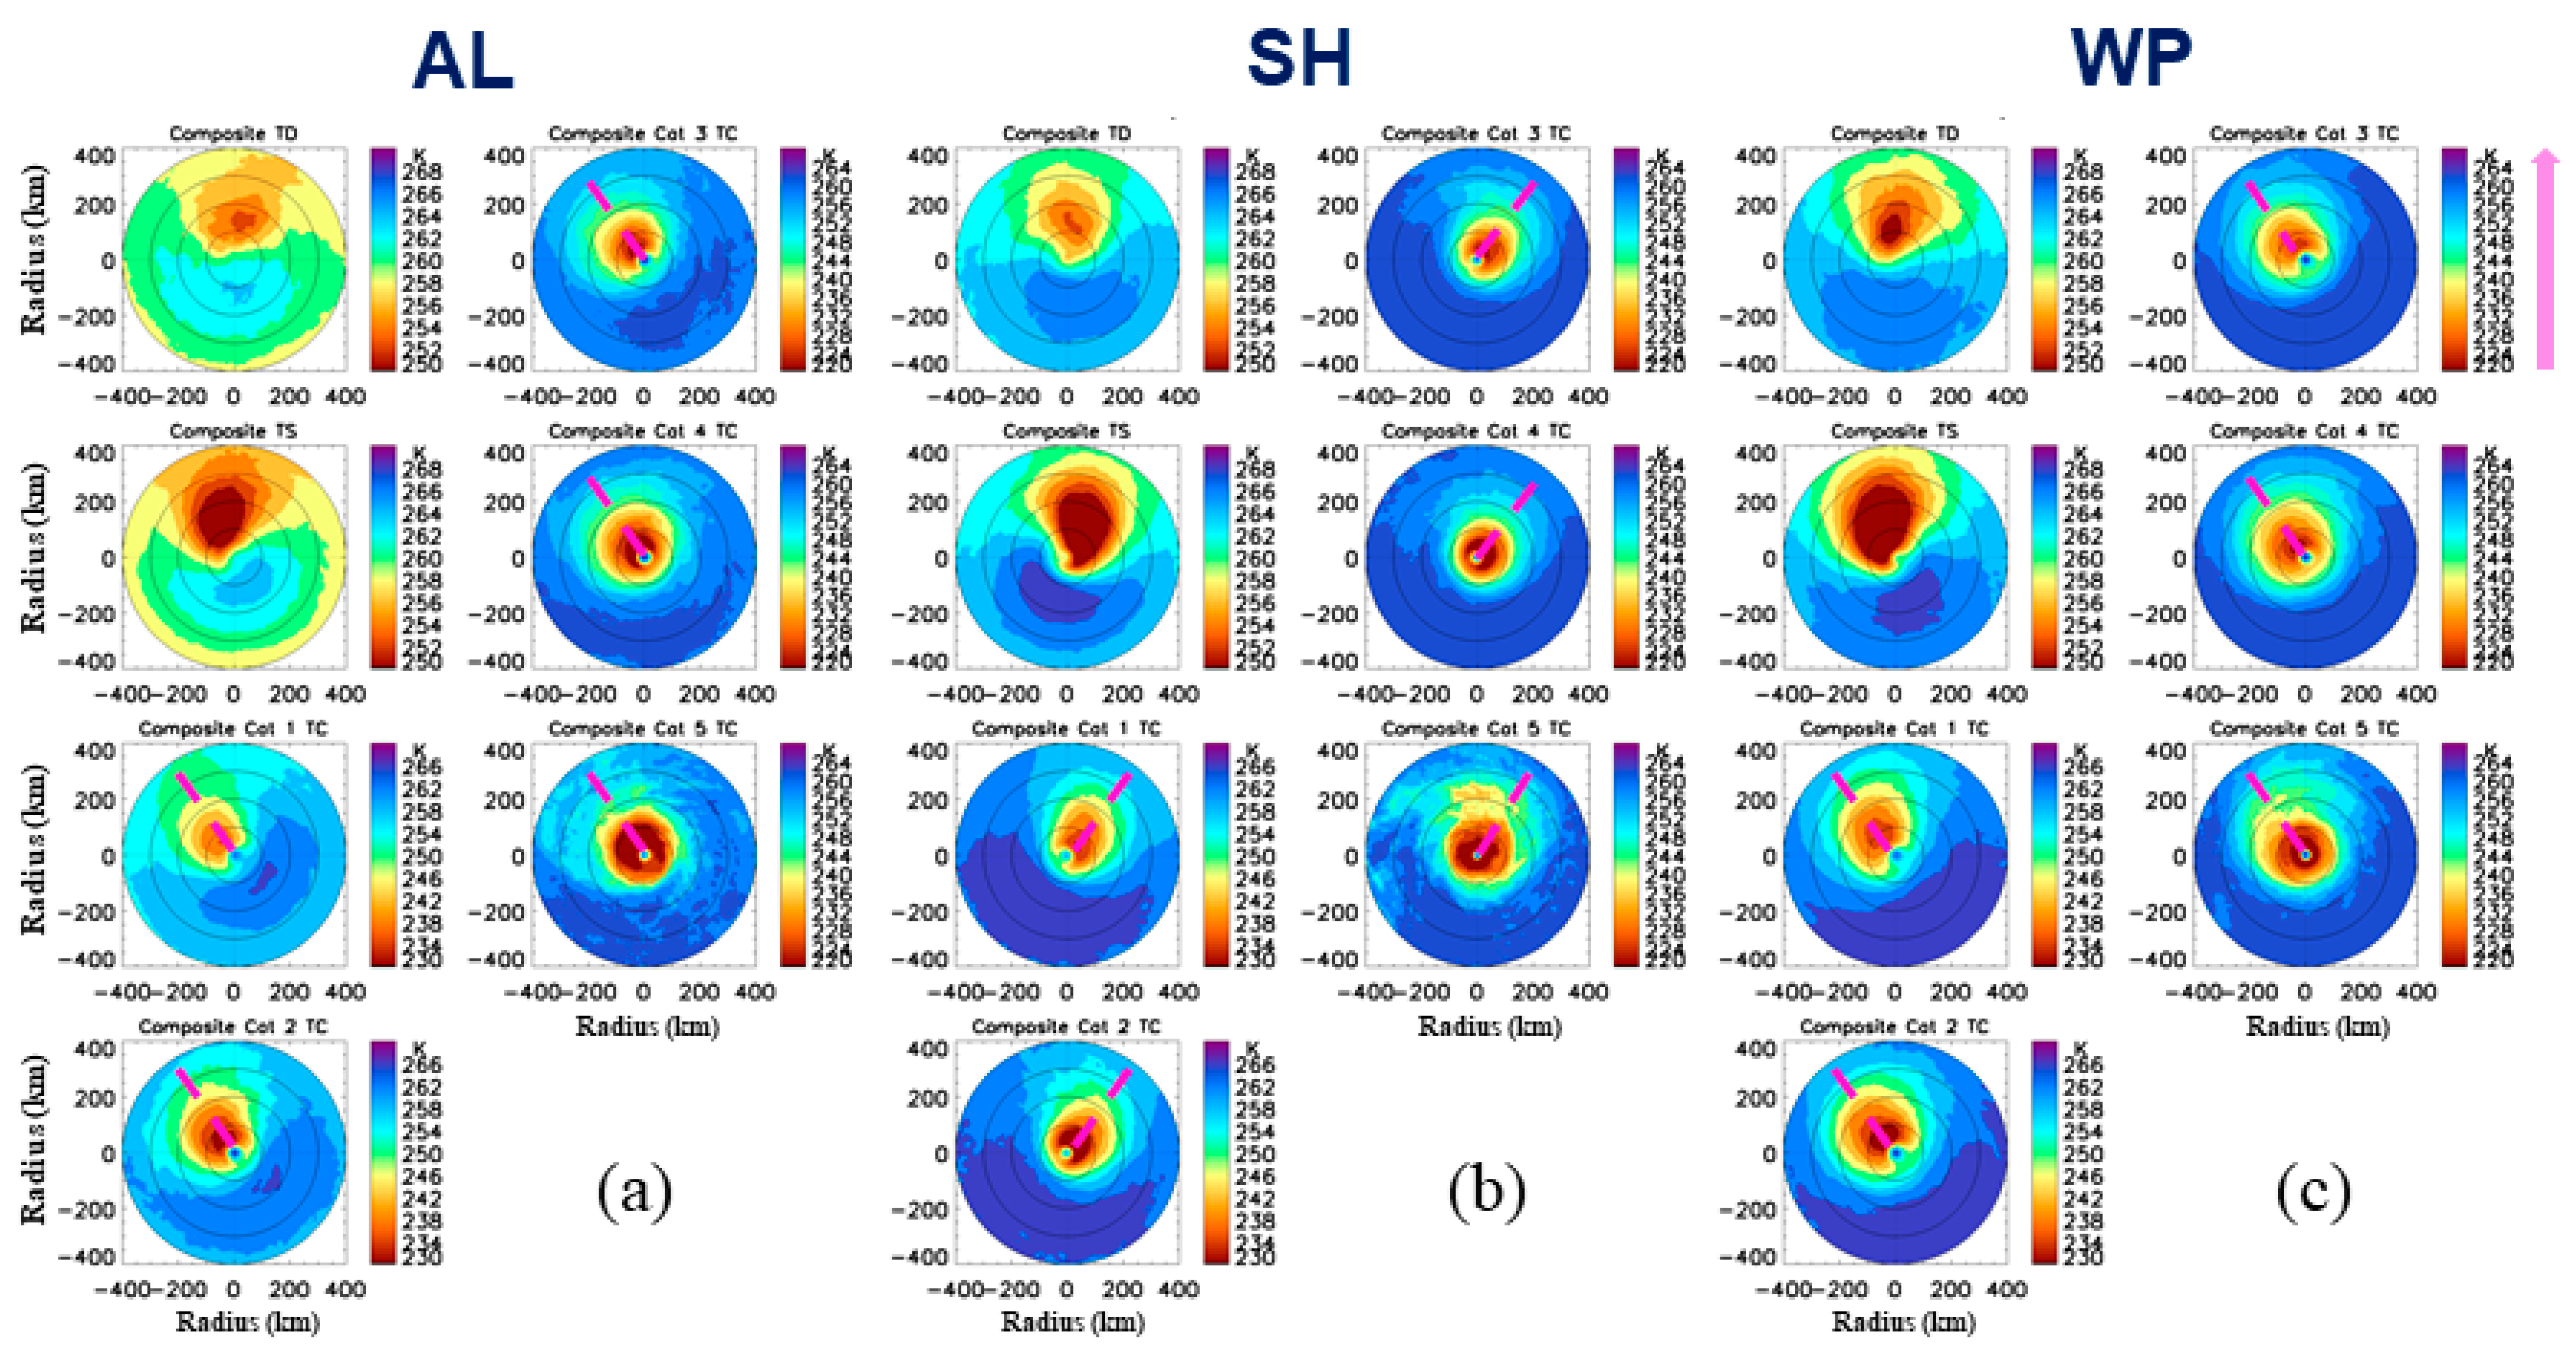
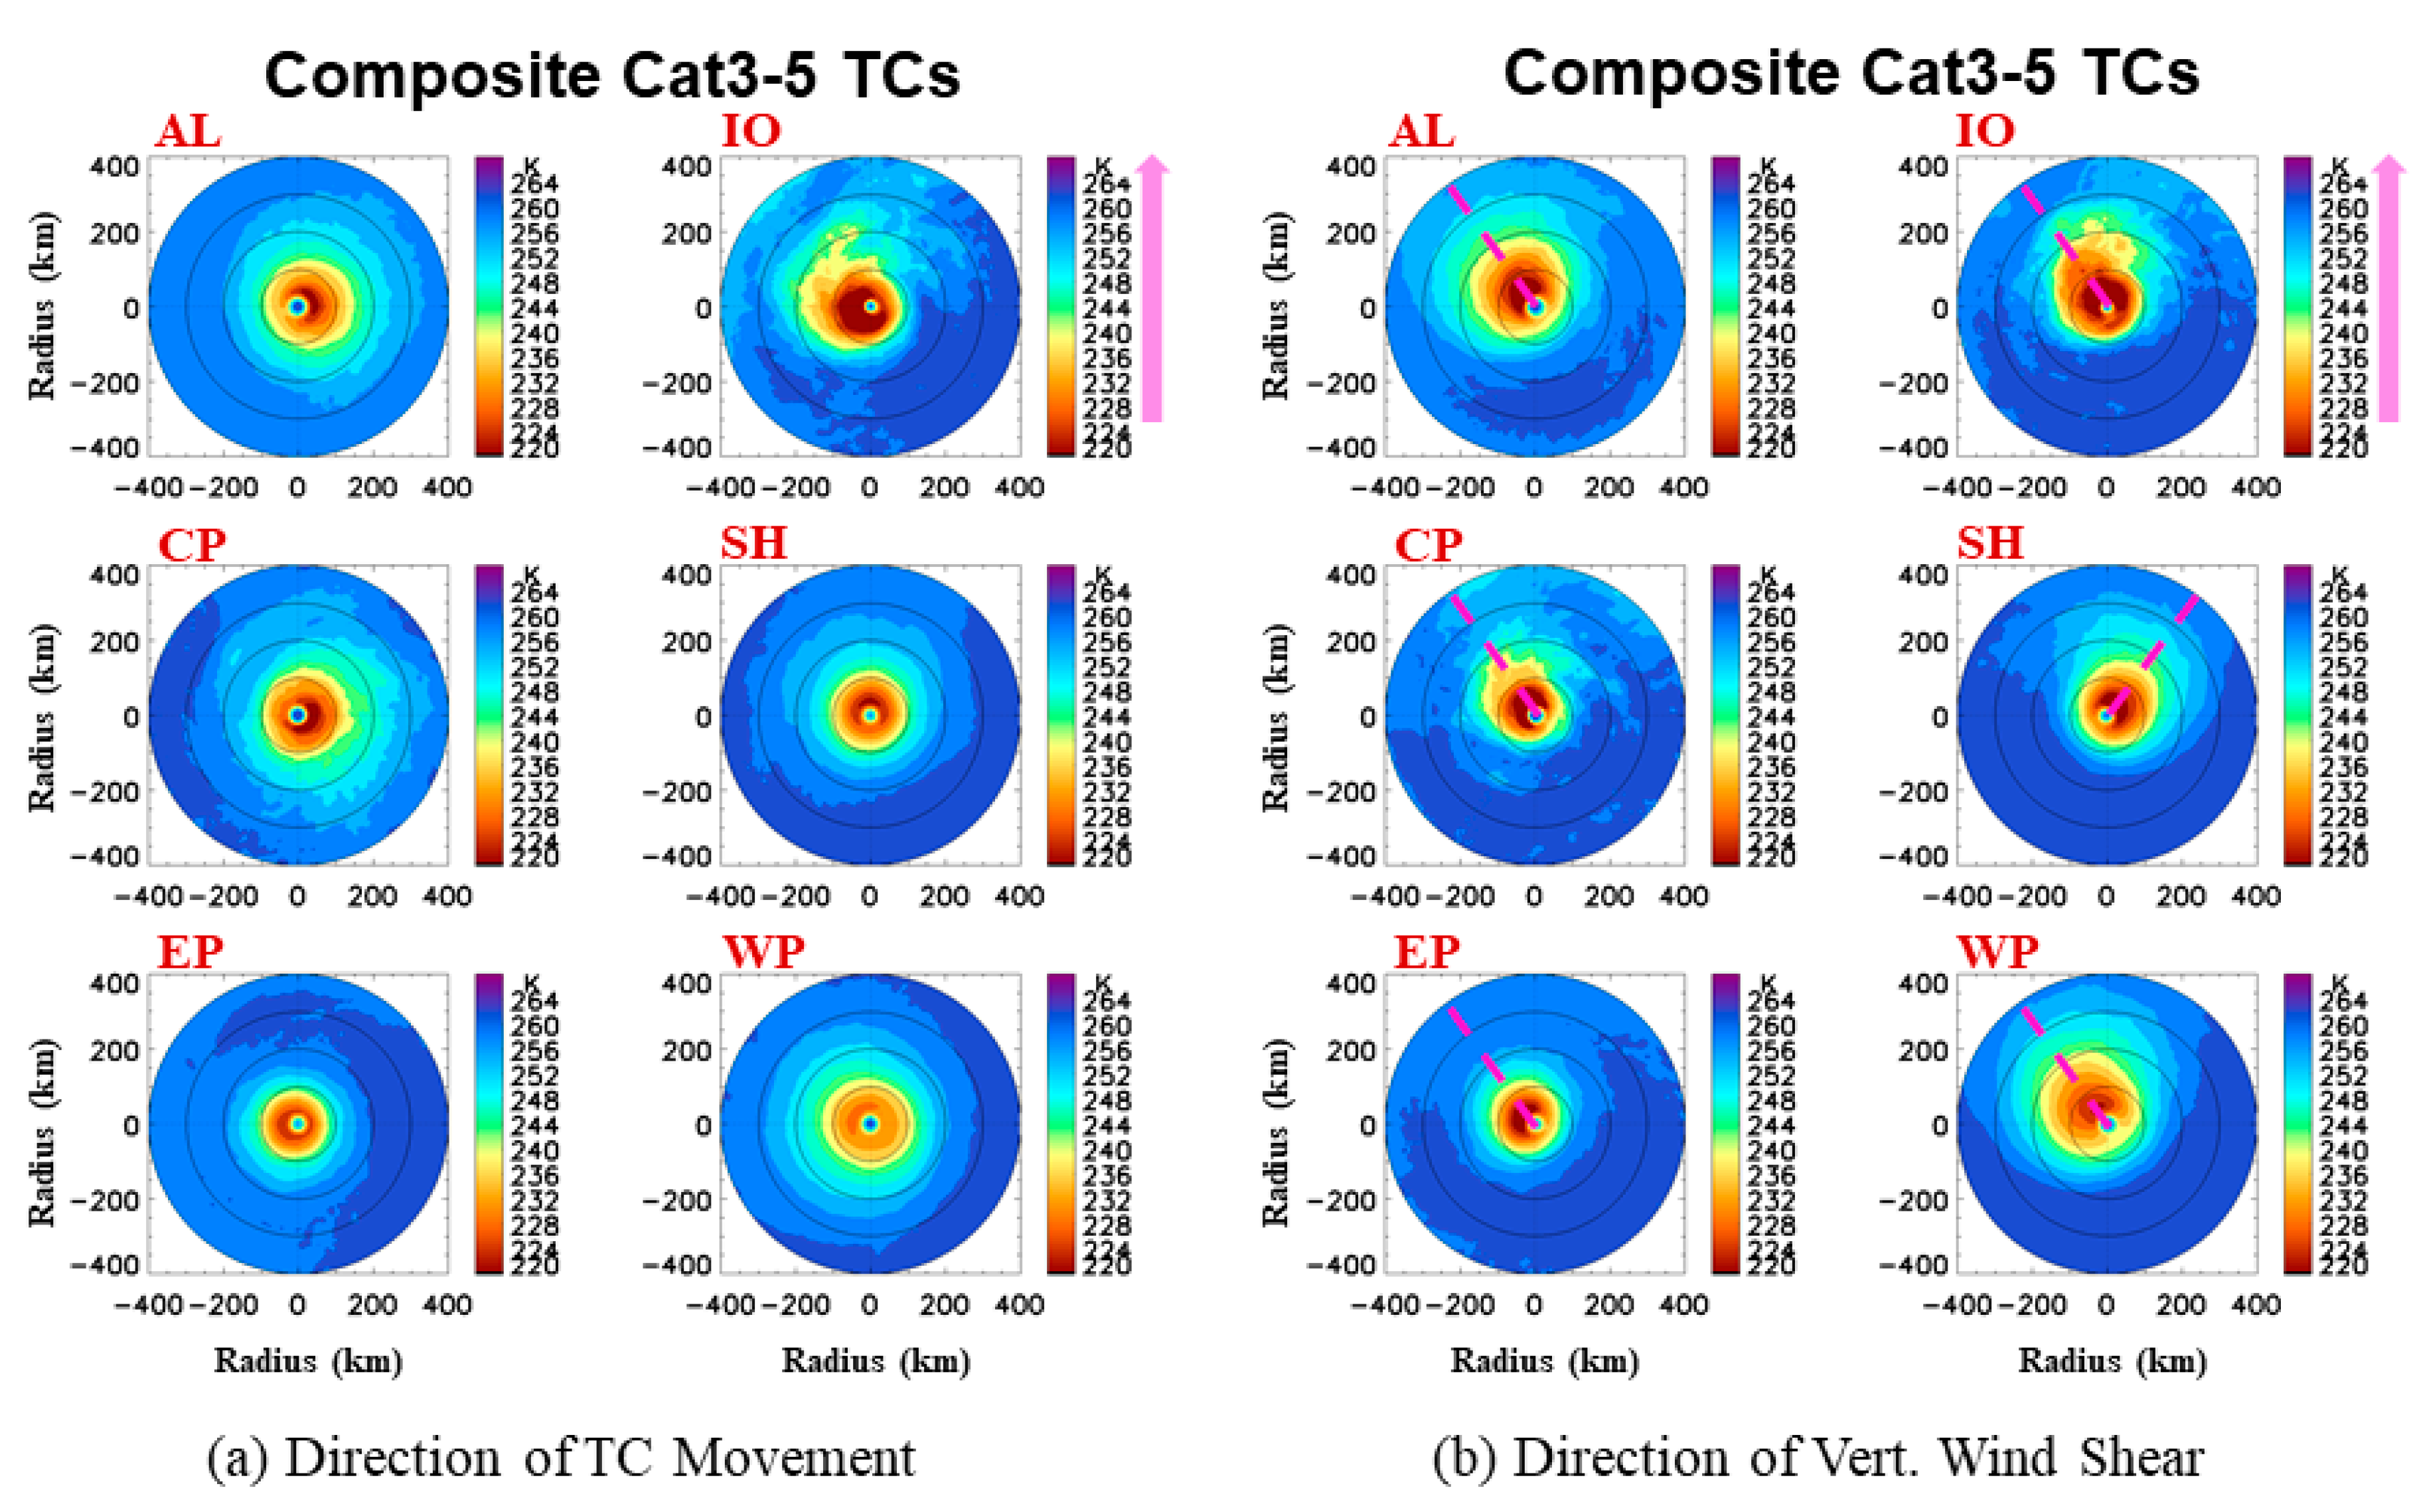
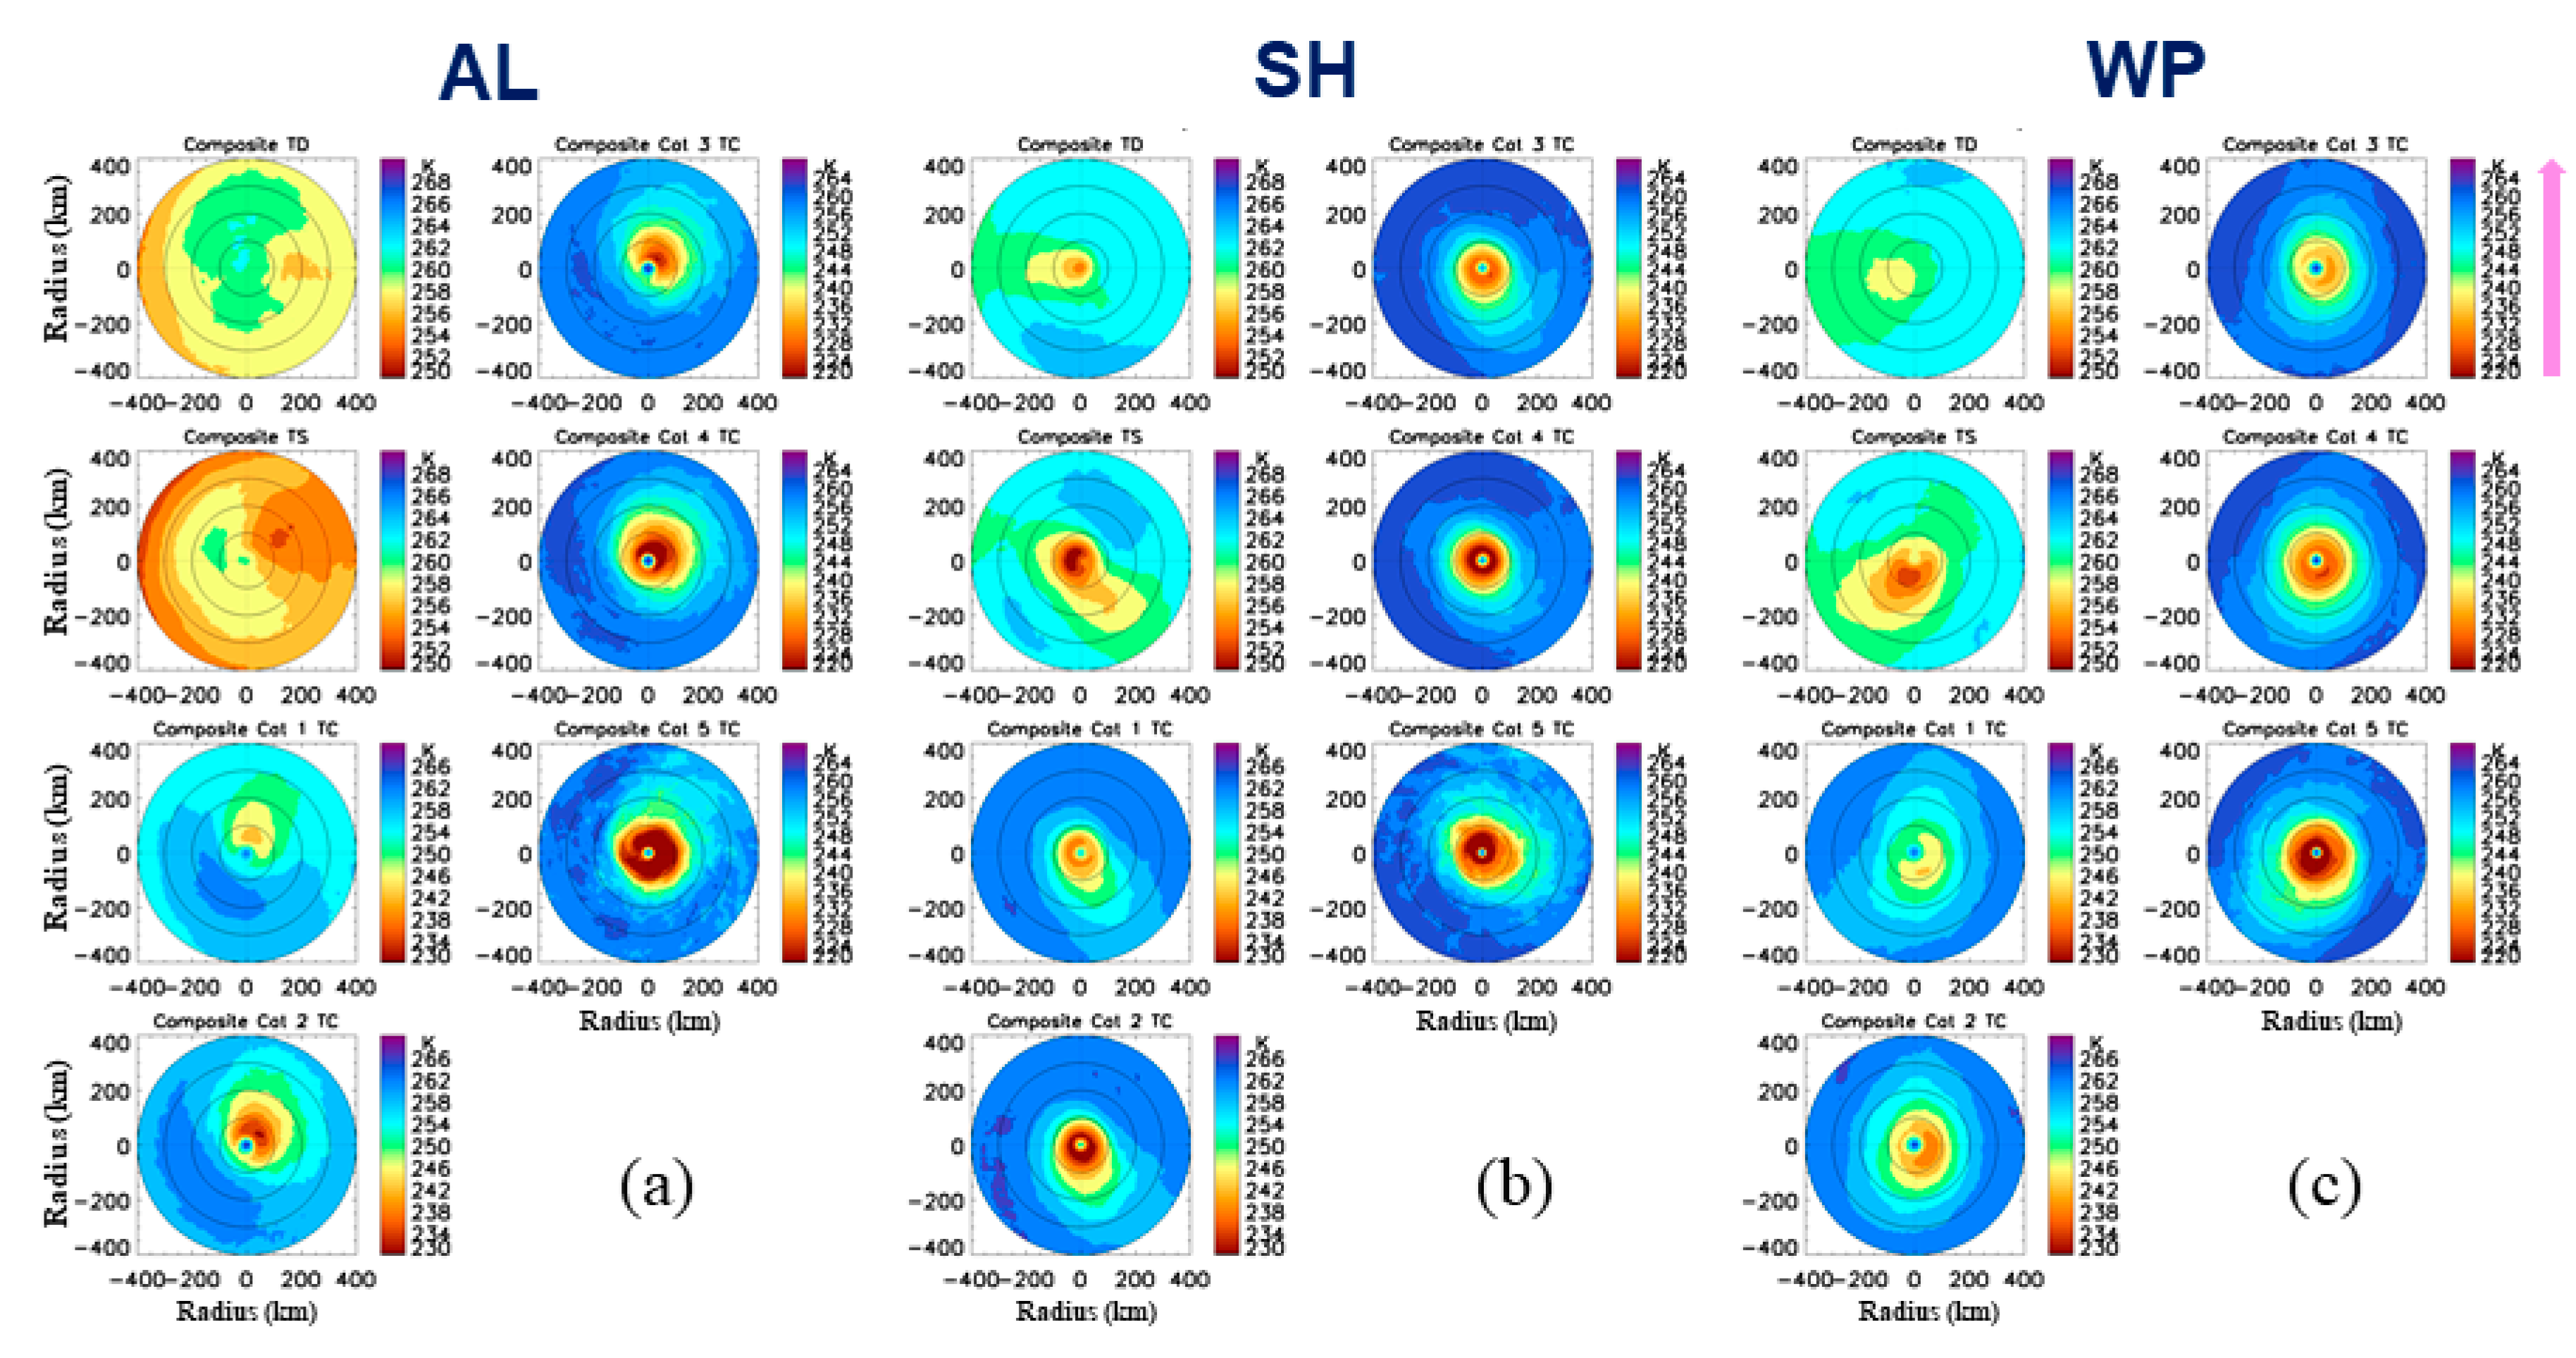
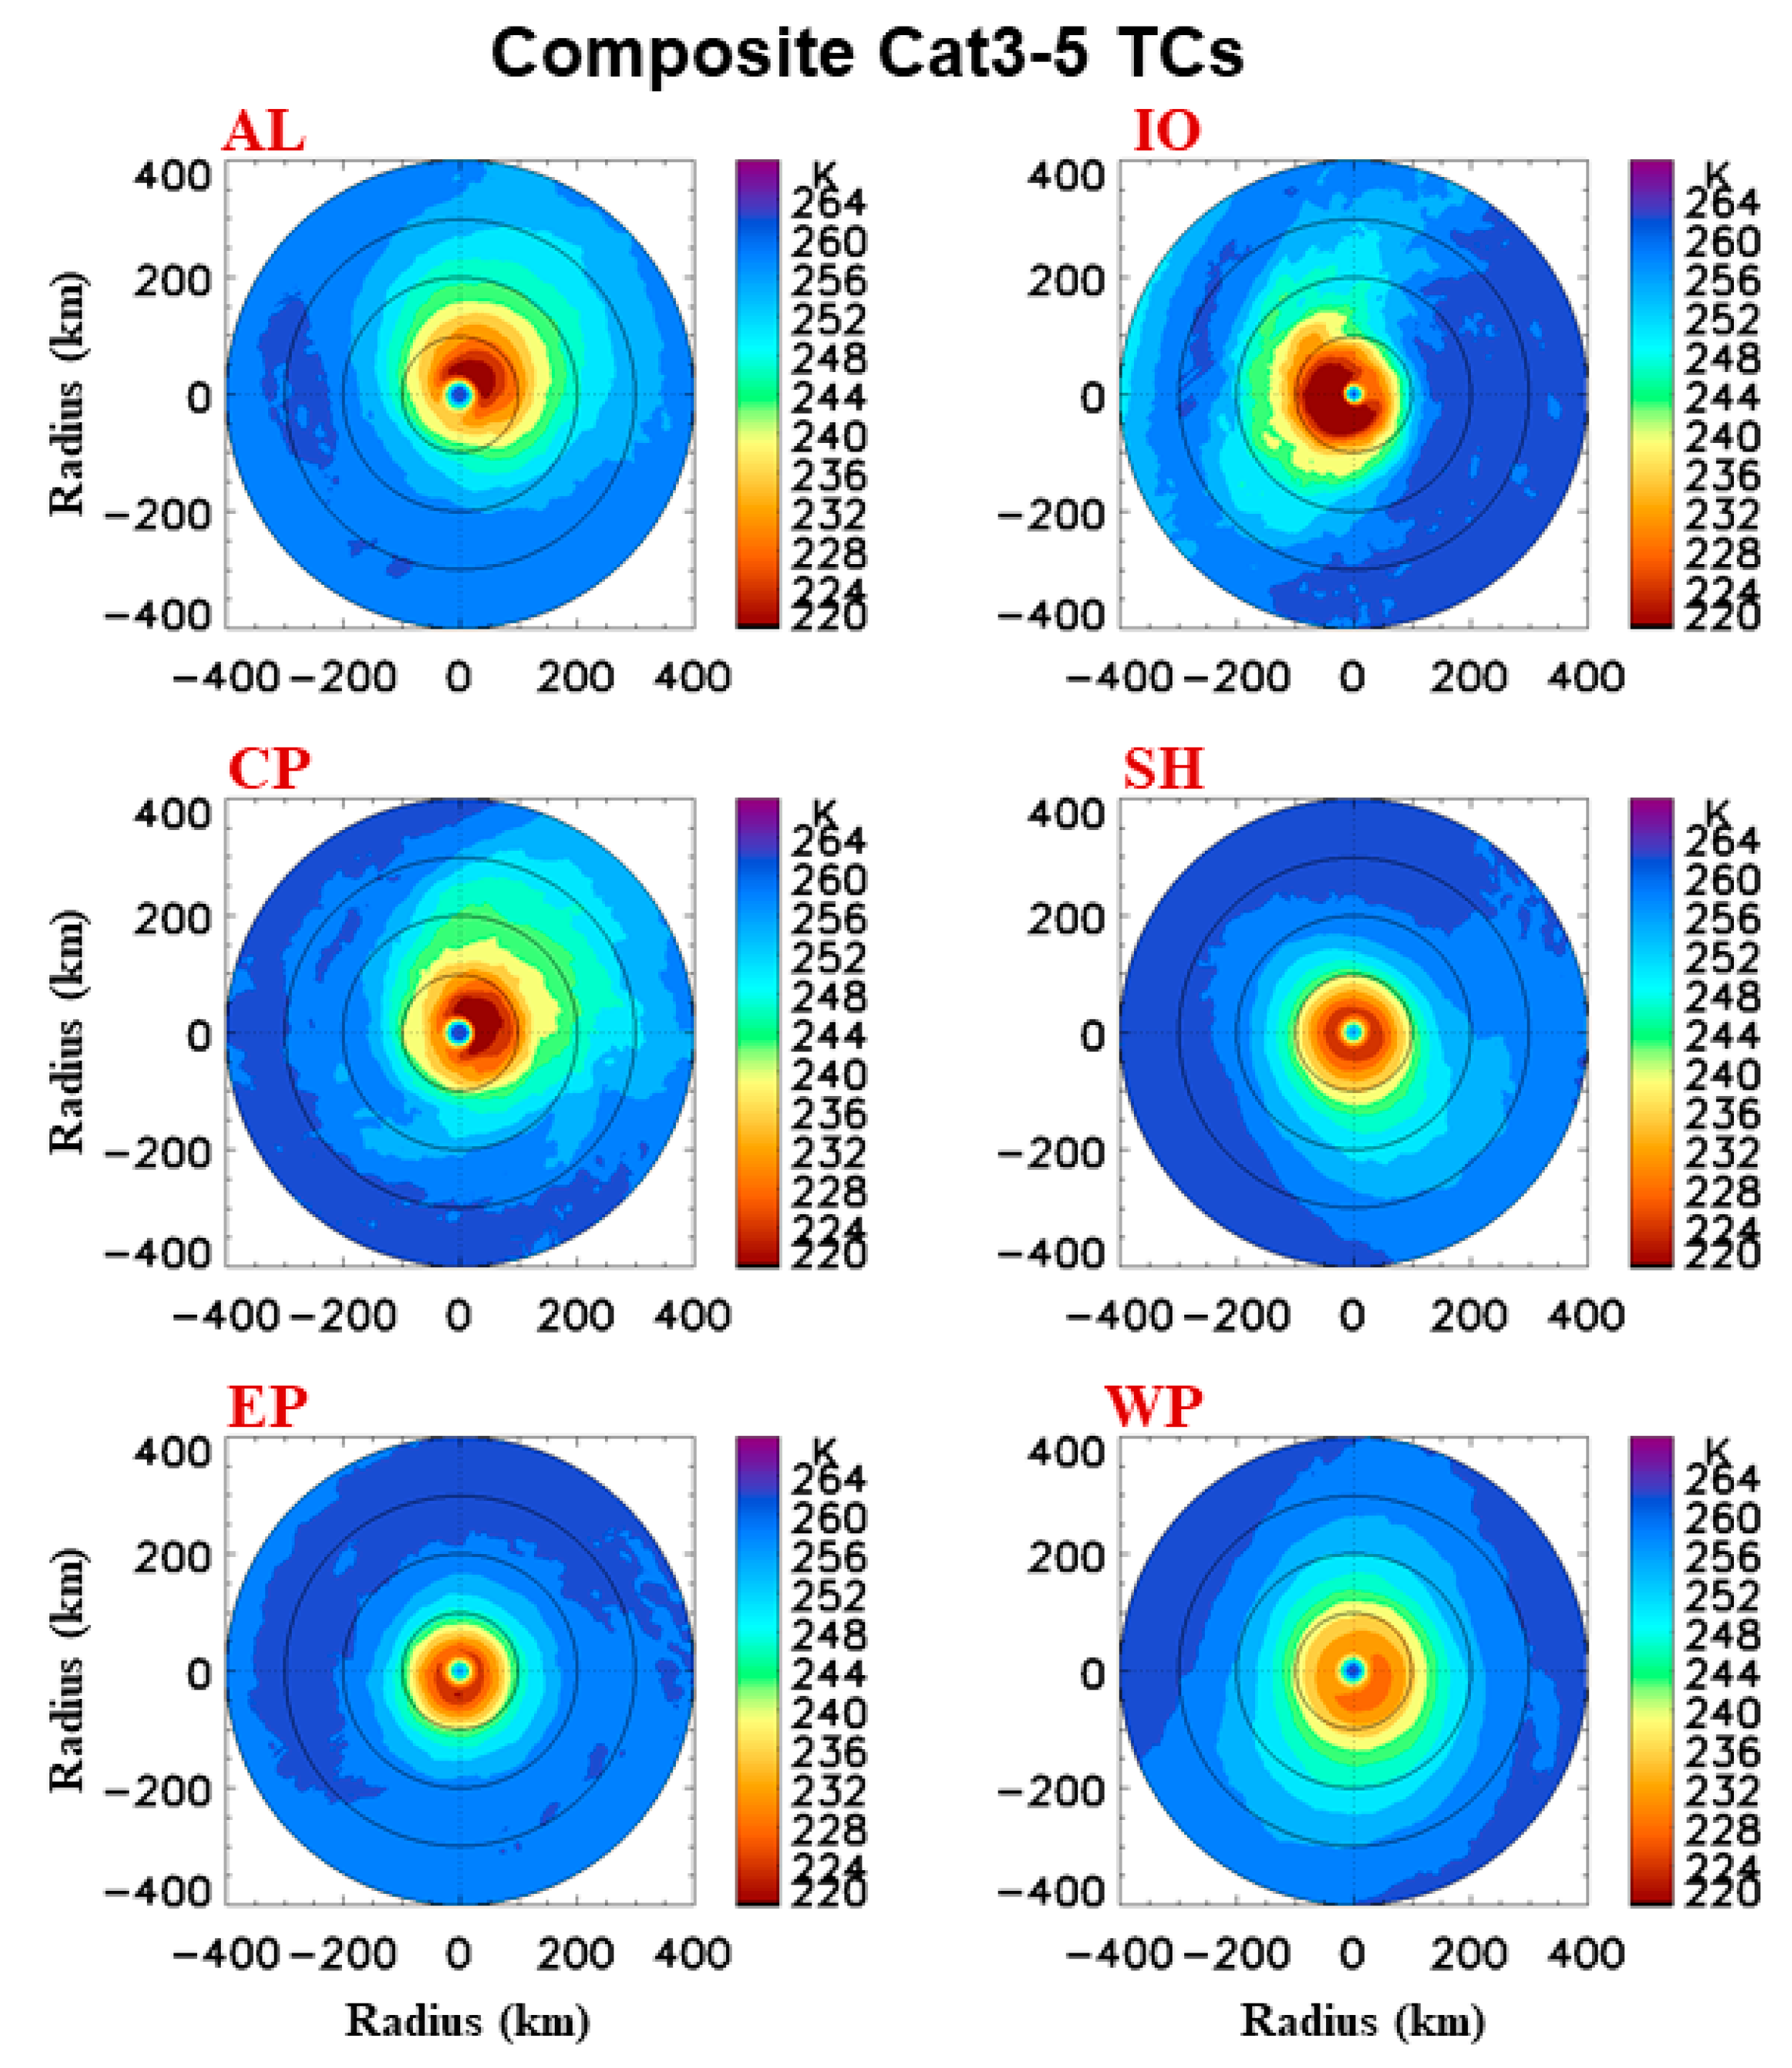
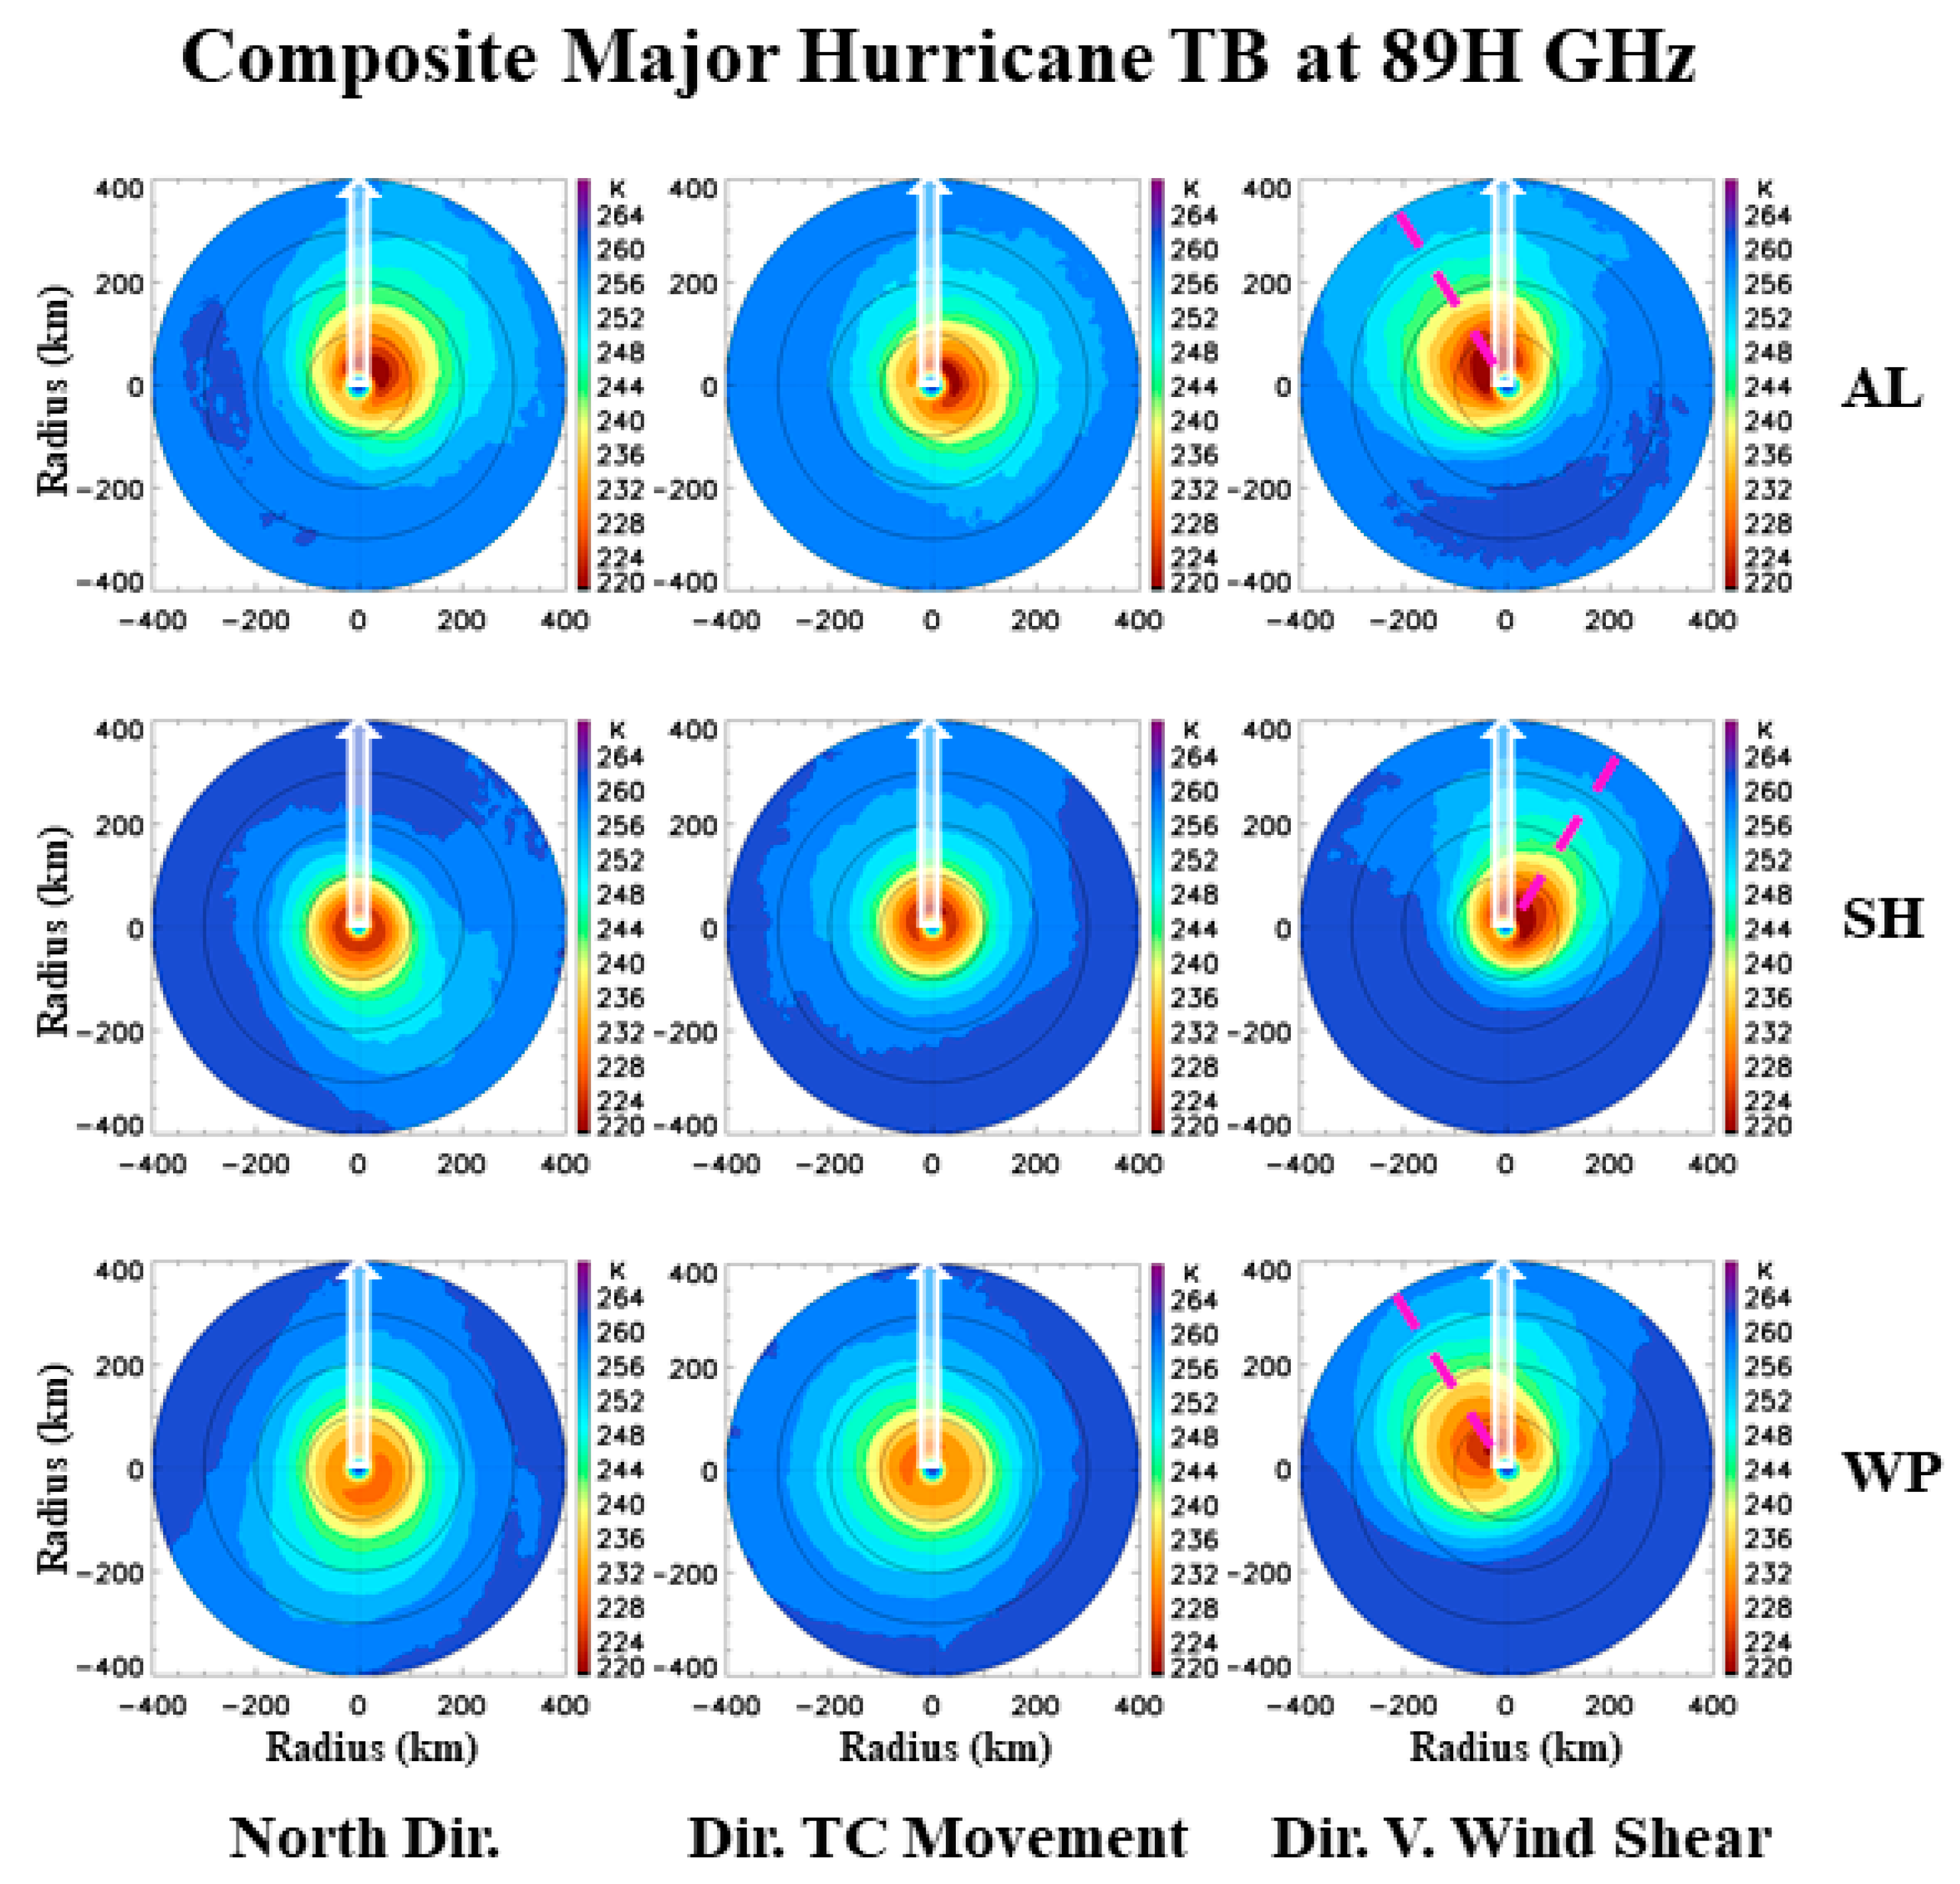
3.2. Structure Differences Among TC Basins

3.2.1. Geographic Features of Environmental Impacts

The environmental impacts on TC structure are clearly shown in Section 3.1.3 and the published literature [22,25,26,28,29]. However, discussion of regional differences on the environmental impacts was not thoroughly verified because of the limited TC observations used in these published studies. With the large TC observations in 1982–2012, a reliable and detailed analysis on geographic features of environmental impacts can be conducted. The mean motion speed of each storm intensity category over all TC basins is listed in Table 2. It is obvious that the averaged storm motion speed is relatively slower over CP, EP, IO, and SH than AL and WP basin. The mean motion speeds (scalar average) of 5.4–6.9, 3.9–6.0, 4.2–6.3, 3.6–5.9, 4.0–4.7, and 4.9–6.0 m s−1 are for AL, CP, EP, IO, SH, and WP, respectively. In general, the motion speed increases from TD to Cat 1 TCs, then decreases from Cat 2 to Cat 5 TCs. Table 3 displays the mean 200–850 hPa wind shear amplitude (scalar average) for each storm intensity category over all TC basins. A range of the shear magnitudes are 5.8–9.9, 5.6–7.5, 4.4–7.3, 5.6–9.1, 5.4–8.9, and 4.7–8.0 m s−1 for AL, CP, EP, IO, SH, and WP basin, respectively. The prominent feature is a consistent decrease of the vertical wind shear magnitude with increase of the TC intensity category over all basins, except the Cat 4–5 TCs over IO which has a very limited samples. It is well established a relatively weak vertical wind shear is a favorable condition for TC intensification process. Overall, AL basin has a relatively large vertical wind shear, while CP and EP have a relatively small vertical wind shear.
Figure 7 displays the composite structures with regard to direction of TC movement at each storm intensity category over AL, SH, and WP. Over the AL basin, the minimum TBs are in DMRQ for Cat 2–3 TCs while an apparent concentric pattern within 200 km radius is for Cat 4–5 TCs. The Cat 1 TC has the minimum TBs in DMLQ. TD and TS have no clear patterns but with relative low TBs in the left quadrants. Over the SH basin, there is a clear concentration of convections in the down-motion quadrants for TD, TS, and Cat 1–3 TCs, while Cat 4–5 TCs still have a dominant concentric pattern. Over the WP basin, TD, TS, and Cat 1–3 TCs have the minimum TBs located in DMLQ, and Cat 4–5 TCs have a concentric pattern. The mean motion vector of each storm category over all basins (average of motion vectors) is listed in Table 4. It is evident that the mean storm motion vector is headed to the northwest direction over CP, EP, and WP basin. The AL basin storms have the mean motion vector directions of 289°–15° from the North and the IO basin storms have mean motion vector directions of 303°–10°, while the SH storms have different mean vector directions of 185°–225°. The relatively smaller amplitudes of the motion vectors compared with the corresponding scalar averages of motion speeds shown in Table 2 are resultant of the varying directions of motion vectors. In addition, percentage of the amplitude decrease of averaged motion vectors is relatively larger for weak storms than for higher intensity TCs, indicating that there are more variations of the motion vector directions for weak storms than for strong TCs. Therefore, there are clear regional structure differences regarding direction of TC movement for TD, TS and Cat 1–3 TCs. It also indicates that direction of TC movement has less impact on higher intensity Cat 4–5 TCs, which demonstrates the TC strong vortex is resilient to impact of the TC motion.
A similar analysis of TC structure with regard to direction of the 200–850 hPa wind shear is displayed in Figure 8. The most striking feature is that AL and WP storms have a consistent structure pattern with the minimum TBs within a radius of 300 km in DSLQ for Cat 1–5 TCs and in downshear quadrants for TD and TS. For SH storms, the minimum TBs is in downshear quadrants for TD and TS, while in DSRQ for Cat 1–5 TCs. The difference in location of the minimum TBs for Cat 1–5 TCs between AL/WP and SH actually reflects the opposite circulation patterns of storms between the Northern and the Southern Hemisphere, which further demonstrates a critical role from direction of the 200–850 hPa wind shear. In addition, a more concentric pattern in the inner core area (radius < 100 km) for Cat 5 TCs demonstrates a more resilience to the environmental impact for strong vortexes than for weak storms. A close review also indicates that the axis of the minimum TBs marked by the red dashed line is slightly shifted toward the vertical wind shear direction. In addition, similar characteristics as the AL/WP storms relative to the vertical wind shear direction are found for CP, EP, and IO basins (Figures are omitted).
The mean 200–850 hPa wind shear vectors (average of the shear vectors) of storms for each intensity category over all basins are shown in Table 5. The overall much smaller mean amplitudes of the vertical wind shear vector compared to the corresponding averaged scalar wind shear shows environmental conditions for different storms. The large geographic variations of the mean vertical wind shear directions among these basins clearly display their different environmental conditions. The mean vertical wind shear vector presents directions of 75°–95°, 54°–157°, 252°–95°, 260°–17°, 90°–135°, and 81°–227° for storms over AL, CP, EP, IO, SH, and WP, respectively.
TC structure of the composite major hurricanes with regard to direction of TC movement over the six basins is given in Figure 9a. The prominent feature is a common concentric pattern of TBs at 89H GHz within 200 km radius over all basins except IO, indicating a resilience of the strong vortex to the motion impact. However, a close review still reveals differences on locations of the minimum TBs near the eyewall. It is in the down-motion right quadrant (DMRQ) for AL, right quadrants for CP, left quadrants for EP, down-motion quadrants for SH, and DMLQ for WP. The minimum TBs are obviously shifted into the left quadrants for IO. Similar analysis with regard to direction of the 200–850 hPa wind shear demonstrates a consistent TC structural pattern (Figure 9b). A striking feature is a consistent location of the minimum TBs at 89H GHz in DSLQ for all basins except SH where it is in DSRQ. Since the TC circulation pattern in the southern hemisphere is opposite to what is seen in the northern hemisphere, the TC minimum TBs at 89 HGHz in DSRQ over SH is expected. A close review of Figure 9b indicates a consistent axis of the minimum TBs marked by the red dashed line is slightly shifted toward the vertical shear direction.

3.2.2. Regional Characteristics of TC Structure

Distribution patterns relative to the North direction at each storm intensity category over AL, SH and WP are displayed in Figure 10. These kinds of patterns actually reflect the combined impacts of the storm motion and the 200–850 hPa wind shear on storm structures. The similar concentric pattern for Cat 4–5 TCs among these basins are expected because a strong vortex and consistent eyewall appearance associated with intense TCs that are more resilient to the external forcing than the weak storms. The relative minimum TBs at 89H GHz within radius of 300 km are in the northeast quadrant for AL Cat 1–4 TCs, where relatively low TBs are also evident for Cat 5 TCs (Figure 10a). The approximate eastward direction of the vertical wind shear vector indicates that location of the TC minimum TBs is corresponding to DSLQ. Due to the mostly northwest direction of the TC motion, the motion impact is actually in a competitive role of the vertical wind shear. However, results demonstrate the vertical wind shear has a dominant role on the AL TC structure.
The relative minimum 89H GHz TBs are located in the southeast quadrant for the SH Cat 1–4 TCs (Figure 10b). The associated vertical wind shear vectors, generally, have an East direction, which shows that convections are in DSRQ. The associated TC motions are mainly in the south direction. Thus, impacts from motion and the vertical wind shear are supportive to each other which lead to the SH TC convections located in the southeast quadrant. For the WP Cat 1–4 TCs, the minimum TBs at 89H GHz in the southeast quadrant are resultant of the combined impact of the motion and the vertical wind shear (Figure 10c); however, it seems more impacts are linked with the wind shear. The mean vertical wind shear vectors have direction in the southeast quadrant while the mean motion vectors have direction in the northwest quadrant. Differences are obvious for TD and TS among these basins. Both motion directions and the vertical wind shear directions given by Table 4 and Table 5 show the combined impacts lead to variations of TD and TS structures.
Regional differences of TC structure are visible from comparison of 89H GHz TB distributions among the six basins. Figure 11 shows distribution of TBs at 89H GHz for the composite Cat 3–5 TCs over the six basins regarding the North direction. Although the strong TC vortex is resilient to the environmental impacts, a geographic variation is obvious. The concentric patterns of TBs within a 200 km radius are clearly shown in EP, SH, and WP. Both AL and CP basin has the minimum TBs concentrated in the northeast quadrant, while in the west quadrants over the IO basin.
For better display of impacts of storm movement and the 200–850 hPa wind shear on storm structure, a comparison of major hurricanes during 1987–2012 over AL, SH, and WP regarding direction of the North, TC motion and the 200–850 hPa wind shear is shown in Figure 12. For composition relative to direction of TC movement (middle panel), the AL major hurricanes have the minimum TBs located in DMRQ, while both SH and WP major hurricanes have a concentric pattern with a slight shift of minimum TBs in the down-motion quadrants. A consistent pattern for AL and WP major hurricane is displayed with minimum TBs in DSLQ, while SH major hurricanes have the minimum TBs in DSRQ which is opposite to what shown in AL/WP, regarding to direction of the 200–850 hPa wind shear (right panel). The red dashed lines indicate the axis of the minimum TBs is slightly shifted toward the vertical shear direction. The major hurricane structure relative to the North direction shows the minimum TBs are located in the northeast quadrant for AL, the southeast quadrant for WP, and in concentric zones for SH (left panel).

4. Discussion

This analysis demonstrates the obvious regional differences of storm structure relative to storm motion among the six basins, especially for weak storms. TC structure relative to the 200–850 hPa wind shear direction has a consistent pattern with convection located in DSLQ among these basins except the SH basin where convection is located in DSRQ. Results demonstrated in this study are consistent with the published literature [20,21,24,28,46,47]. Exploring mechanisms to explain different impacts on structure from TC motion and the vertical shear are beyond scope of this study. However, evidence revealed here does support the conclusion that the convergence caused by storm motion is most likely responsible for strong convection ahead of storm motion, especially for a weak storm [47,48]. The maximum vertical motion in DSLQ caused by the rapid rotating tangential winds near TC strong convection proposed by Black et al. [45] is verified by observational evidence. Because of the relatively small differences of the TC motion direction among the northern hemispheric basins and large differences of the vertical wind shear direction, the regional variability of TC structure relative to the storm motion is actually caused by differences of the environmental forcing among these basins. The combined impact of storm motion and the vertical wind shear leads to asymmetric TC convection. The vertical wind shear plays a dominant role if the storm motion impact is not lined up with the wind shear. Mctaggart-Cowan et al. [49] demonstrated there are significant differences of large scale systems affecting tropical cyclogenesis among these basins. Results from Wu et al. [50] showed 19.8% TC formations over west Pacific are associated with the Monsoon Gyres, indicating more complex large scale environmental conditions for WP TC formation. Results from this study provide observational evidence from prospective of satellite measurements to confirm that the large scale 200–850 hPa wind shear is critical to storm development and structure.
Systematic analysis not only confirms results from published literature but also leads to an improved and detailed climatology of TCs associated with each storm category and their geographic variability based on long and reliable satellite PMW observations. The satellite-observed TCs from recent years are not included, although they will increase TC samples for a potentially better climatology, especially for major hurricanes. Recent updates on PMW sensor calibrations [51] are also not included. Although these updates could reduce potential uncertainties on TC structure especially for Cat 5 TCs over CP, EP, and IO, they will not, in general, change results from this study. Reprocessing of the new PMW TB datasets for an updated TC database will address these issues, but it is beyond scope of this study. In addition, impacts from speed of TC movement and magnitude of the 200–850 hPa wind shear and their combined impacts are not investigated in details in this study and should be topics of future studies.

5. Conclusions

The historical storms (TD, TS and TCs) observed by all satellite PMW sensors during 1987–2012 are analyzed in a polar coordinate system with different composition methods regarding directions of the North, TC movement and the 200–850 hPa wind shear. The primary goal of this study is to provide a reliable and detailed climatology on global TC activities, structure and geographic characteristics. The TMI and SSM/I TBs at 85 GHz and SSMIS TBs at 91 GHz TBs are calibrated to 89 GHz so that SSM/I, SSMIS, TMI and AMSR-E used in this study have a consistent high frequency channel at 89 GHz. ARCHER is used to accurately fix the TC center positions. The suppression of TBs at 89 GHz due to ice particle scattering effects is strongly associated with TC convection, i.e., the minimum TBs display locations of strong convection.
Analysis shows that having a large number of samples of observed storms in this study leads to robust results on climatology of TC structure and their regional differences. There is significant annual variability of global TC activities, especially for major hurricanes; however, the total number of storms is relatively stable around 100. There is no evidence indicating any trend of TC activities. The radius of the TC eyewall increases with decrease of intensity with a radius of 30 km and 50 km for Cat 5 and Cat 1TCs, respectively.
The composition method regarding the North direction for global storms presents a concentric pattern of TBs within 200 km radius because of the large number of samples of the observed storms used in the composition process. Thus, this method for global storms will not lead to a realistic storm structure for an individual storm due to the fact that TCs have a unique spiral convection structure. The impact of direction of TC movement and the 200–850 hPa wind shear on TC structure are systematically analyzed in this study. The composite structures of global storms at different intensity categories regarding direction of TC movement show the minimum TBs located in DMLQ for TD, TS, and Cat 1–2 TCs, while major hurricanes have an apparent concentric pattern. The climatology of storm structure with regard to direction of the 200–850 hPa wind shear presents a distinctive feature, i.e., the minimum TBs located in DSLQ for Cat 1–5 TCs and in forward quadrants for TD and TS. Results demonstrate direction of TC movement has obvious impacts on the structure of the relatively weak storms; however, direction of the 200–850 hPa wind shear has a critical role in distribution of the TC convection.
The detailed geographic characteristics of TC structure are clearly demonstrated by comparison of three different composition schemes. Regarding direction of TC movement, the composite pattern of major hurricanes has the minimum TBs at 89H GHz located in DMRQ over AL basin, left quadrants over IO basin, and a concentric pattern within 200 km radius over CP, SH, EP, and WP basins. The direction of TC movement has more significant impacts on less intense TCs than strong TCs. The concentric pattern within 200 km radius is always similar for Cat 4–5 TCs among these basins; however, differences are obvious for TD, TS, and Cat 1–3 TCs. The AL Cat 2–3 TCs have the minimum TBs in DMRQ while Cat 1 TCs have a minimum in DMLQ. TD, TS and Cat 1–3 TCs over SH basin have the minimum TBs in the down-motion quadrants. Over the WP basin, TD, TS, and Cat 1–2 TCs have minimum TBs in DMLQ while Cat 3 TCs have minimum TBs in the down-motion quadrants. Results demonstrate that there is a significant regional variation of storm structure relative to the motion direction and that convergence induced by TC movement play an import role on the structure of TD, TS, and Cat 1–2 TCs and less role for Cat 3 TCs and almost no impacts on Cat 4–5 TCs. This study also reveals that the geographic variation of the structure relative to storm motion direction is mainly due to differences of the vertical wind shear direction among these basins.
Regarding direction of the 200–850 hPa wind shear, TD and TS have a consistent minimum TBs in the downshear quadrants, while Cat 1–5 TCs have consistent minimum TBs in DSLQ for all basins except in DSRQ for SH basin, i.e., TC structure has no geographic variations regarding direction of the vertical wind shear. Since the suppressed TBs at 89 GHz are closely linked to deep convection, the consistent patterns shown in TBs and surface precipitation for all storm categories solidify results from this study. This study provides robust observational evidence to confirm the large scale environmental forcing has a critical and consistent impact on TC structure. This feature is important because it could be utilized in TC forecasting and preparation to mitigate impacts from an approaching TC.
The storm structures relative to the North direction are resultant from the combined impact of storm motion and the 200–850 hPa wind shear. Results demonstrate the geographic variation of storm structures relative to motion direction is actually due to regional differences of the vertical wind shear direction. The impact from vertical wind shear dominates the impact from storm motion when their roles are not collaborated each other, indicating the critical role to storm structure by the vertical wind shear direction. Zhang and Tao [52] showed the vertical wind shear has a significant effect on the TC predictability, especially during storm formation and rapid intensification. More studies are needed to investigate the potential mechanisms through carefully designed cloud model simulations.

Author Contributions

S.Y. designed and performed research and wrote the paper. R.B. reviewed and edited this paper. J.C. analyzed and created the satellite PMW tropical cyclone TB dataset. R.B. and S.Y. obtained funding for this study. All authors have read and agreed to the published version of the manuscript.

Funding

This research received financial support from the Office of Naval Research (ONR) program under a 6.4 project “Environmental and Tropical Cyclone Characterization via Sensor Data Exploitation ” and a NRL base project “River Influence at Multi-scales” (PE 61153N).

Acknowledgments

The authors appreciate the Colorado State University PMW sensors fundamental climate data records (http://rain.atmos.colostate.edu/FCDR) and the TC best track datasets from NOAA and Joint Typhoon Warning Center. Constructive comments from three reviewers are also appreciated for improving quality of this study.

Conflicts of Interest

The authors declare no conflict of interest.

References

  1. Anthes, R.A. Tropical Cyclones: Their Evolution, Structure, and Effects. In Meteorological Monographs; American Meteorological Society: Boston, MA, USA, 1982; 208p. [Google Scholar] [CrossRef]
  2. Gray, W.M. The Formation of Tropical Cyclones. Meteorol. Atmos. Phys. 1998, 67, 37–69. [Google Scholar] [CrossRef]
  3. Blake, E.S.; Landsea, C.W.; Gibney, E.J. The Deadliest, Costliest, and Most Intense United States Tropical Cyclones from 1851 to 2010 (And Other Frequently Requested Hurricane Facts) (PDF) (NOAA Technical Memorandum NWS NHC-6); United States National Oceanic and Atmospheric Administration’s National Weather Service: Washington, DC, USA, 2011. [Google Scholar]
  4. Rappaort, E.N. Loss of life in the United States associated with recent Atlantic tropical cyclones. Bull. Amer. Meteor. Soc. 2000, 81, 2065–2074. [Google Scholar] [CrossRef] [Green Version]
  5. Knight, D.B.; Davis, R.E. Climatology of tropical cyclone rainfall in the southeastern United States. Phys. Geogr. 2007, 28, 126–147. [Google Scholar] [CrossRef]
  6. Yang, S.; Cossuth, J. Satellite remote sensing of tropical cyclones. Chapter 7 of Recent Developments. Trop. Cyclone Dyn. Predict. Detect. Intech 2016, 138–170. [Google Scholar] [CrossRef] [Green Version]
  7. Wimmers, A.J.; Velden, C.S. MIMIC: A New Approach to Visualizing Satellite Microwave Imagery of Tropical Cyclones. Bull. Amer. Meteor. Soc. 2007, 88, 1187–1196. [Google Scholar] [CrossRef]
  8. Hawkins, J.D.; Lee, T.F.; Turk, J.; Sampson, C.; Kent, J.; Richardson, K. Real-time internet distribution of satellite products for tropical cyclone reconnaissance. Bull. Amer. Meteor. Soc. 2001, 82, 567–578. [Google Scholar] [CrossRef] [Green Version]
  9. Kidder, S.Q.; Goldberg, M.D.; Zehr, R.M.; DeMaria, M.; Purdom, J.F.; Velden, C.S.; Grody, N.C.; Kusselson, S.J. Satellite analysis of tropical cyclones using the Advanced Microwave Sounding Uint (AMSU). Bull. Amer. Meteor. Soc. 2000, 81, 1241–1259. [Google Scholar] [CrossRef] [Green Version]
  10. Hawkins, J.D.; Turk, F.J.; Lee, T.F.; Richardson, K. Observations of tropical cyclones with the SSMIS. IEEE Trans. Geosci. Remote Sens. 2008, 46, 901–912. [Google Scholar] [CrossRef]
  11. Willoughby, H.E. Mature Structure and Evolution. In Chapter 2, Global Perspectives on Tropical Cyclones, WMO/TD-No. 693, Report No. TCP-38; World Meteorological Organization: Geneva, Switzerland, 1995. [Google Scholar]
  12. Dvorak, V.F. Tropical cyclone intensity analysis using satellite data. In NOAA Technical Report NESDIS; US Department of Commerce, National Oceanic and Atmospheric Administration: Silver Spring, MD, USA; Montgomery, AL, USA, 1984; Volume 11, pp. 1–47. [Google Scholar]
  13. Velden, C.S.; Olander, T.L.; Zehr, R.M. Development of an Objective Scheme to Estimate Tropical Cyclone Intensity from Digital Geostationary Satellite Infrared Imagery. Weather. Forecast. 1998, 13, 172–186. [Google Scholar] [CrossRef] [Green Version]
  14. Olander, T.L.; Velden, C.S. The advanced Dvorak technique: Continued development of an objective scheme to estimate tropical cyclone intensity using geostationary infrared satellite imagery. Weather Forecast. 2007, 22, 287–298. [Google Scholar] [CrossRef]
  15. Hawkins, J.; Velden, C. Supporting Meteorological Field Experiment Missions and Postmission Analysis with Satellite Digital Data and Products. Bull. Amer. Meteor. Soc. 2011, 92, 1009–1022. [Google Scholar] [CrossRef] [Green Version]
  16. Herndon, D.C.; Velden, C.S.; Hawkins, J.; Olander, T.; Wimmers, A. The CIMSS Satellite Consensus (SATCON) tropical cyclone intensity algorithm. In Proceedings of the 29th Conference on Hurricanes and Tropical Meteorology, Tucson, AZ, USA, 10–14 May 2010. [Google Scholar]
  17. Rogers, R.; Zhang, J.; Zawislak, J.; Jiang, H.; Alvey, G.R., III; Zipser, E.J.; Stevenson, S.N. Observations of the structure and evolution of Hurricane Edouard (2014) during intensity change. Part II: Kinematic structure and the distribution of deep convection. Mon. Weather Rev. 2016, 144, 3355–3376. [Google Scholar] [CrossRef]
  18. Rogers, R.; Reasor, P.D.; Zhang, J.A. Multiscale structure and evolution of Hurricane Earl (2010) during rapid intensification. Mon. Weather Rev. 2015, 143, 536–562. [Google Scholar] [CrossRef]
  19. Stevenson, S.N.; Corbosiero, K.L.; Molinari, J. The convective evolution and rapid intensification of Hurricane Earl (2010). Mon. Weather Rev. 2014, 142, 4364–4380. [Google Scholar] [CrossRef]
  20. Stevenson, S.N.; Corbosiero, K.L.; Abarca, S.F. Lightning in eastern North Pacific tropical cyclones: A comparison to the North Atlantic. Mon. Weather Rev. 2016, 144, 225–239. [Google Scholar] [CrossRef]
  21. Stevenson, S.N.; Corbosiero, K.L.; DeMaria, M.; Vigh, J.L. A 10-Year Survey of Tropical Cyclone Inner-Core Lightning Bursts and Their Relationship to Intensity Change. Weather Forecast. 2018, 60, 23–36. [Google Scholar] [CrossRef]
  22. Jiang, H.; Ramirez, E.M. Necessary conditions for tropical cyclone rapid intensification as derived from11 years of TRMM data. J. Clim. 2013, 26, 6459–6470. [Google Scholar] [CrossRef]
  23. Zagrodnik, J.P.; Jiang, H. Rainfall, convection, and latent heating distributions in rapidly intensifying tropical cyclones. J. Atmos. Sci. 2014, 71, 2789–2809. [Google Scholar] [CrossRef]
  24. Tao, C.; Jiang, H. Distributions of shallow to very deep precipitation–convection in rapidly intensifying tropical cyclones. J. Clim. 2015, 28, 8791–8824. [Google Scholar] [CrossRef]
  25. Tao, C.; Jiang, H.; Zawislak, J. The relative importance of stratiform and convective rainfall in rapidly intensifying tropical cyclones. Mon. Weather Rev. 2017, 145, 795–809. [Google Scholar] [CrossRef] [Green Version]
  26. Fischer, S.F.; Tang, B.H.; Corbosiero, K.L. Normalized convective characteristics of tropical cyclone rapid intensification events in the North Atlantic and Eastern North Pacific. Mon. Weather Rev. 2018, 146, 1133–1155. [Google Scholar] [CrossRef]
  27. Fischer, S.F.; Tang, B.H.; Corbosiero, K.L. A climatological analysis of tropical cyclone rapid intensification in environments of upper-tropospheric troughs. Mon. Weather Rev. 2019, 147, 3693–3719. [Google Scholar] [CrossRef]
  28. Chen, S.S.; Knaff, J.A.; Marks, F.D. Effects of vertical wind shear and storm motion on tropical cyclone rainfall asymmetries deduced from TRMM. Mon. Weather Rev. 2006, 134, 3190–3208. [Google Scholar] [CrossRef]
  29. Lonfat, M.; Marks, F.D.; Chen, S. Precipitation distribution in tropical cyclones using the Tropical Rainfall Measuring Mission (TRMM) microwave imager: A global perspective. Mon. Weather Rev. 2004, 132, 1645–1660. [Google Scholar] [CrossRef]
  30. SHIPS. Available online: http://rammb.cira.colostate.edu/research/tropical_cyclones/ships/index.asp. (accessed on 31 October 2020).
  31. Yang, S.; Hawkins, J.; Richardson, K. The improved NRL tropical cyclone monitoring system with a unified microwave brightness temperature calibration scheme. Remote Sens. 2014, 6, 4563–4581. [Google Scholar] [CrossRef] [Green Version]
  32. Wimmers, A.J.; Velden, C.S. Advancements in objective multisatellite tropical cyclone center fixing. J. Appl. Meteor. Climatol. 2016, 55, 197–212. [Google Scholar] [CrossRef]
  33. Wimmers, A.J.; Velden, C.S. Objectively determining the rotational center of tropical cyclones in passive microwave satellite imagery. J. Appl. Meteor. Climatol. 2010, 49, 2013–2034. [Google Scholar] [CrossRef]
  34. Poe, G.A. Optimum interpolation of imaging microwave radiance data. IEEE Trans. Geosci. Remote Sens. 1990, 28, 800–810. [Google Scholar] [CrossRef] [Green Version]
  35. DeMaria, M.; Mainelli, M.; Shay, L.K.; Knaff, J.A.; Kaplan, J. Further Improvements in the Statistical Hurricane Intensity Prediction Scheme (SHIPS). Weather Forecast. 2005, 20, 531–543. [Google Scholar] [CrossRef] [Green Version]
  36. Knaff, J.; Sampson, C.; DeMaria, M. An Operational Statistical Typhoon Intensity Prediction Scheme for the Western North Pacific. Weather Forecast. 2005, 20, 688–699. [Google Scholar] [CrossRef] [Green Version]
  37. NOAA. Saffir-Simpson Hurricane Scale Information, National Hurricane Center. Available online: http://www.nhc.noaa.gov/aboutsshws.php (accessed on 5 December 2016).
  38. WMO. Regional Association IV Hurricane Operational Plan 2015, World Meteorological Organization Technical Document, 109p. Available online: https://www.wmo.int/pages/prog/www/tcp/documents/OPERATIONALPLAN2015_en_final.pdf. (accessed on 2 November 2020).
  39. Leighton, H.; Gopalakrishnan, S.; Zhang, J.; Rogers, R.F.; Zhang, Z.; Tallapragada, V. Azimuthal Distribution of Deep Convection, Environmental Factors, and Tropical Cyclone Rapid Intensification: A Perspective from HWRF Ensemble Forecasts of Hurricane Edouard (2014). J. Atmos. Sci. 2018, 75, 275–295. [Google Scholar] [CrossRef]
  40. Nguyen, L.T.; Rogers, R.F.; Reasor, P.D. Thermodynamic and Kinematic Influences on Precipitation Symmetry in Sheared Tropical Cyclones: Bertha and Cristobal (2014). Mon. Weather Rev. 2017, 145, 4423–4446. [Google Scholar] [CrossRef]
  41. Yu, Z.; Wang, Y.; Xu, H. Observed rainfall asymmetry in tropical cyclone making landfall over China. J. Appl. Meteor. Climatol. 2015, 54, 117–136. [Google Scholar] [CrossRef]
  42. Alvey, R.G., III; Zawislak, J.; Zipser, E. Precipitation properties observed during tropical cyclone intensity change. Mon. Weather Rev. 2015, 143, 4476–4492. [Google Scholar] [CrossRef]
  43. Rogers, R.F.; Marks, F.D.; Marchok, T. Tropical cyclone rainfall. In Encyclopedia of Hydrological Sciences; Anderson, M.G., Ed.; John Wiley and Sons: Chicester, UK, 2009. [Google Scholar]
  44. Yang, S.; Lao, V.; Bankert, R.; Whitcomb, T.R.; Cossuth, J. Improved Climatology of Tropical Cyclone Precipitation from Satellite Passive Microwave Measurements. J. Clim. 2020. (In Revision) [Google Scholar]
  45. Black, M.L.; Gamache, J.F.; Marks, F.D.; Samsury, C.E.; Willoughby, H.E. Eastern Pacific Hurricanes Jimana of 1991 and Olivia of 1994: The effect of vertical shear on structure and intensity. Mon. Weather Rev. 2002, 130, 2291–2312. [Google Scholar] [CrossRef]
  46. Corbosiero, K.L.; Molinari, J. The effects of vertical wind shear on the distribution of convection in tropical cyclones. Mon. Weather Rev. 2002, 130, 2110–2123. [Google Scholar] [CrossRef] [Green Version]
  47. Corbosiero, K.L.; Molinari, J. The relationship between storm motion, vertical wind shear, and convective asymmetries in tropical cyclones. J. Atmos. Sci. 2003, 60, 366–376. [Google Scholar] [CrossRef]
  48. Shapiro, L.J. The asymmetric boundary layer flow under a translating hurricane. J. Atmos. Sci. 1983, 40, 1984–1998. [Google Scholar] [CrossRef] [Green Version]
  49. McTaggart-Cowan, R.; Galarneau, T.J.; Bosart, L.F.; Moore, R.W.; Martius, O. A global climatology of baroclinically influenced tropical cyclogenesis. Mon. Weather Rev. 2013, 141, 1963–1989. [Google Scholar] [CrossRef] [Green Version]
  50. Wu, L.; Zong, H.; Liang, J. Observational analysis of tropical cyclone formation associated with monsoon gyres. J. Atmos. Sci. 2013, 70, 1023–1034. [Google Scholar] [CrossRef]
  51. Berg, W.; Bilanow, S.; Chen, R.; Datta, S.; Draper, D.; Ebrahimi, H.; Farrar, S.; Jones, W.L.; Kroodsma, R.; McKague, D.; et al. Intercalibration of the GPM microwave radiometer constellation. J. Atmos. Ocean. Technol. 2016, 33, 2639–2654. [Google Scholar] [CrossRef]
  52. Zhang, F.; Tao, D. Effects of vertical wind shear on the predictability of tropical cyclones. J. Atmos. Sci. 2013, 70, 975–983. [Google Scholar] [CrossRef]
Figure 1. Chart of all satellite passive microwave (PMW) sensors during 1987–2012 used in the Naval Research Laboratory (NRL) Tropical Cyclone (TC) database.
Remotesensing 12 03610 g001
Figure 2. Annual variability of TC activities at each category. Left panel is from the PMW sensor observations while right panel is from Joint Typhoon Warning Center (JTWC). The vertical dashed line is a mark of 1991 which was for start of at least two PMW sensor observations.
Remotesensing 12 03610 g002
Figure 3. Radial patterns of PMW sensor brightness temperatures (TBs) at 89H GHz for each category of the global composite TCs in 1987–2012. The heavy dashed line is connection of minimum TBs of Cat 1–5 TCs.
Remotesensing 12 03610 g003
Figure 4. Climatology of the composited global TC structure relative to the North direction at each storm intensity category from PMW sensors at 89H GHz in 1987–2012.
Remotesensing 12 03610 g004
Figure 5. Same Figure 4, except for composition with regard to (a) direction of TC movement and (b) direction of the 200–850 hPa wind shear. The pink vertical arrow shows direction of the TC movement or 200–850 hPa wind shear. The red dashed line in (b) is for axis of the minimum TBs.
Remotesensing 12 03610 g005
Figure 6. Climatology of major hurricanes at 89H GHz composited from global TCs in 1987–2012. Left, middle and right panel is for composition with direction of northward, TC movement and 200–850 hPa wind shear, respectively. White arrow is shown as direction of the composition method for each panel. The red dashed line in the right panel is for axis of the minimum TBs.
Remotesensing 12 03610 g006
Figure 7. Distributions of TBs at 89H GHz of the composite storms relative to the storm motion direction at tropical depression (TD), tropical storm (TS), and Cat 1–5 TCs during 1987–2012 for (a) Atlantic (AL), (b) Southern Hemisphere (SH) and (c) West Pacific (WP) basin. The pink vertical arrow indicates direction of TC movement.
Remotesensing 12 03610 g007
Figure 8. Same as Figure 7, except for relative to direction of the 200–850 hPa wind shear. The red dashed line is for axis of the minimum TBs.
Remotesensing 12 03610 g008
Figure 9. Distributions of the 89H GHz TBs over six basins in 1987–2012 for the composite Cat 3–5 TCs relative to (a) direction of TC movement and (b) direction the 200–850 hPa wind shear. The red dashed line in (b) is for axis of the minimum TBs.
Remotesensing 12 03610 g009
Figure 10. Same as Figure 7, except for relative to the North direction.
Remotesensing 12 03610 g010
Figure 11. Distributions of 89H GHz TBs for the composite Cat3–5 TCs relative to the North direction over six basins in 1987–2012.
Remotesensing 12 03610 g011
Figure 12. Comparison of the composite TB distributions at 89H GHz for major hurricanes over AL, SH and WP. Left, middle and right panel is for composition with regard to northward, direction of TC movement, and direction of the 200–850 hPa wind shear, respectively. White arrow is direction of the composition method for each panel. The red dashed line in the right panel is for axis of the minimum TBs.
Remotesensing 12 03610 g012
Table 1. Total observations from satellite passive microwave (PMW) sensors in 1987–2012 for every tropical cyclone (TC) basin and category.
TDTSCat 1Cat 2Cat 3Cat 4Cat 5
AL49097832219574954846174
CP78533212968859447
EP60164633117857449735544
IO2025135315948816117
SH10,225868521741026102572679
WP11,71887943101169914181520354
Total35,67831,6298936416436543217615
Table 2. Averaged motion speed at each intensity category over each TC basin (m s−1).
TDTSCat 1Cat 2Cat 3Cat 4Cat 5
AL5.46.76.95.86.15.75.6
CP4.95.56.03.94.65.04.9
EP4.24.54.64.85.05.26.3
IO3.63.83.84.44.04.15.9
SH4.04.74.44.54.54.14.1
WP4.96.06.05.55.45.25.3
Table 3. Averaged 200–850 hPa wind shear at each intensity category over each TC basin (m s−1).
TDTSCat 1Cat 2Cat 3Cat 4Cat 5
AL8.59.49.98.48.06.75.8
CP6.07.47.57.35.65.65.7
EP7.36.45.55.44.84.54.4
IO9.09.16.86.55.66.66.8
SH8.38.98.27.47.66.05.4
WP7.98.07.87.57.45.64.7
Table 4. Averaged motion vector at each intensity category over each TC basin. (Direction: clockwise from the North in degree; Speed unit: m s−1).
Basin.Motion VectorTDTSCat 1Cat 2Cat 3Cat 4Cat 5
ALSpeed2.43.04.13.44.24.95.2
Direction323.79.715.0344.8328.7302.3289.2
CPSpeed3.72.65.13.44.04.54.7
Direction277.5317.7306.0315.5316.0296.7274.1
EPSpeed3.03.74.04.04.44.85.0
Direction287.0295.7296.7297.6294.2291.1296.4
IOSpeed2.22.22.13.43.03.25.1
Direction303.5324.2348.21.510.5356.2342.9
SHSpeed1.82.32.42.62.52.42.5
Direction225.2185.1191.4186.0191.5212.5206.5
WPSpeed2.93.13.43.33.53.84.5
Direction308.5349.7345.8340.5339.2323.4309.4
Table 5. Averaged 200–850 hPa wind shear vector at each intensity category over each TC basin (Direction: clockwise from the North in degree; Wind shear unit: m s−1).
BasinWind Shear VectorTDTSCat 1Cat 2Cat 3Cat 4Cat 5
ALWindShear4.76.17.15.55.44.54.0
Direction93.591.575.779.779.277.394.8
CPWindShear2.03.75.45.64.52.45.6
Direction77.868.554.074.859.6109.6157.2
EPWindShear0.30.60.80.60.71.32.2
Direction345.8255.7252.9277.0288.2258.494.7
IOWindShear6.16.24.03.83.63.14.5
Direction300.1299.6297.8281.7260.1324.217.3
SHWindShear8.38.98.27.47.66.05.4
Direction135.2123.1119.6121.1117.8126.989.9
WPWindShear2.51.50.91.02.00.81.1
Direction226.9197.3130.4122.981.5156.0186.4
Publisher’s Note: MDPI stays neutral with regard to jurisdictional claims in published maps and institutional affiliations.

