Correction

Correction: Kolbe, C., et al. Precipitation Retrieval over the Tibetan Plateau from the Geostationary Orbit—Part 2: Precipitation Rates with Elektro-L2 and Insat-3D. Remote Sensing 2020, 12, 2114

1
Department of Geography, Laboratory for Climatology and Remote Sensing, Deutschhausstrasse 12, Philipps-Universität Marburg, 35032 Marburg, Germany
2
College of Hydrology and Water Resources, Hohai University, Nanjing 210098, China
*
Author to whom correspondence should be addressed.
Remote Sens. 2020, 12(21), 3594; https://doi.org/10.3390/rs12213594
Submission received: 23 October 2020 / Accepted: 27 October 2020 / Published: 2 November 2020
(This article belongs to the Special Issue Remote Sensing of the Water Cycle in Mountain Regions)
The authors wish to make the following corrections to this paper [1]:
Error in Figure/Table
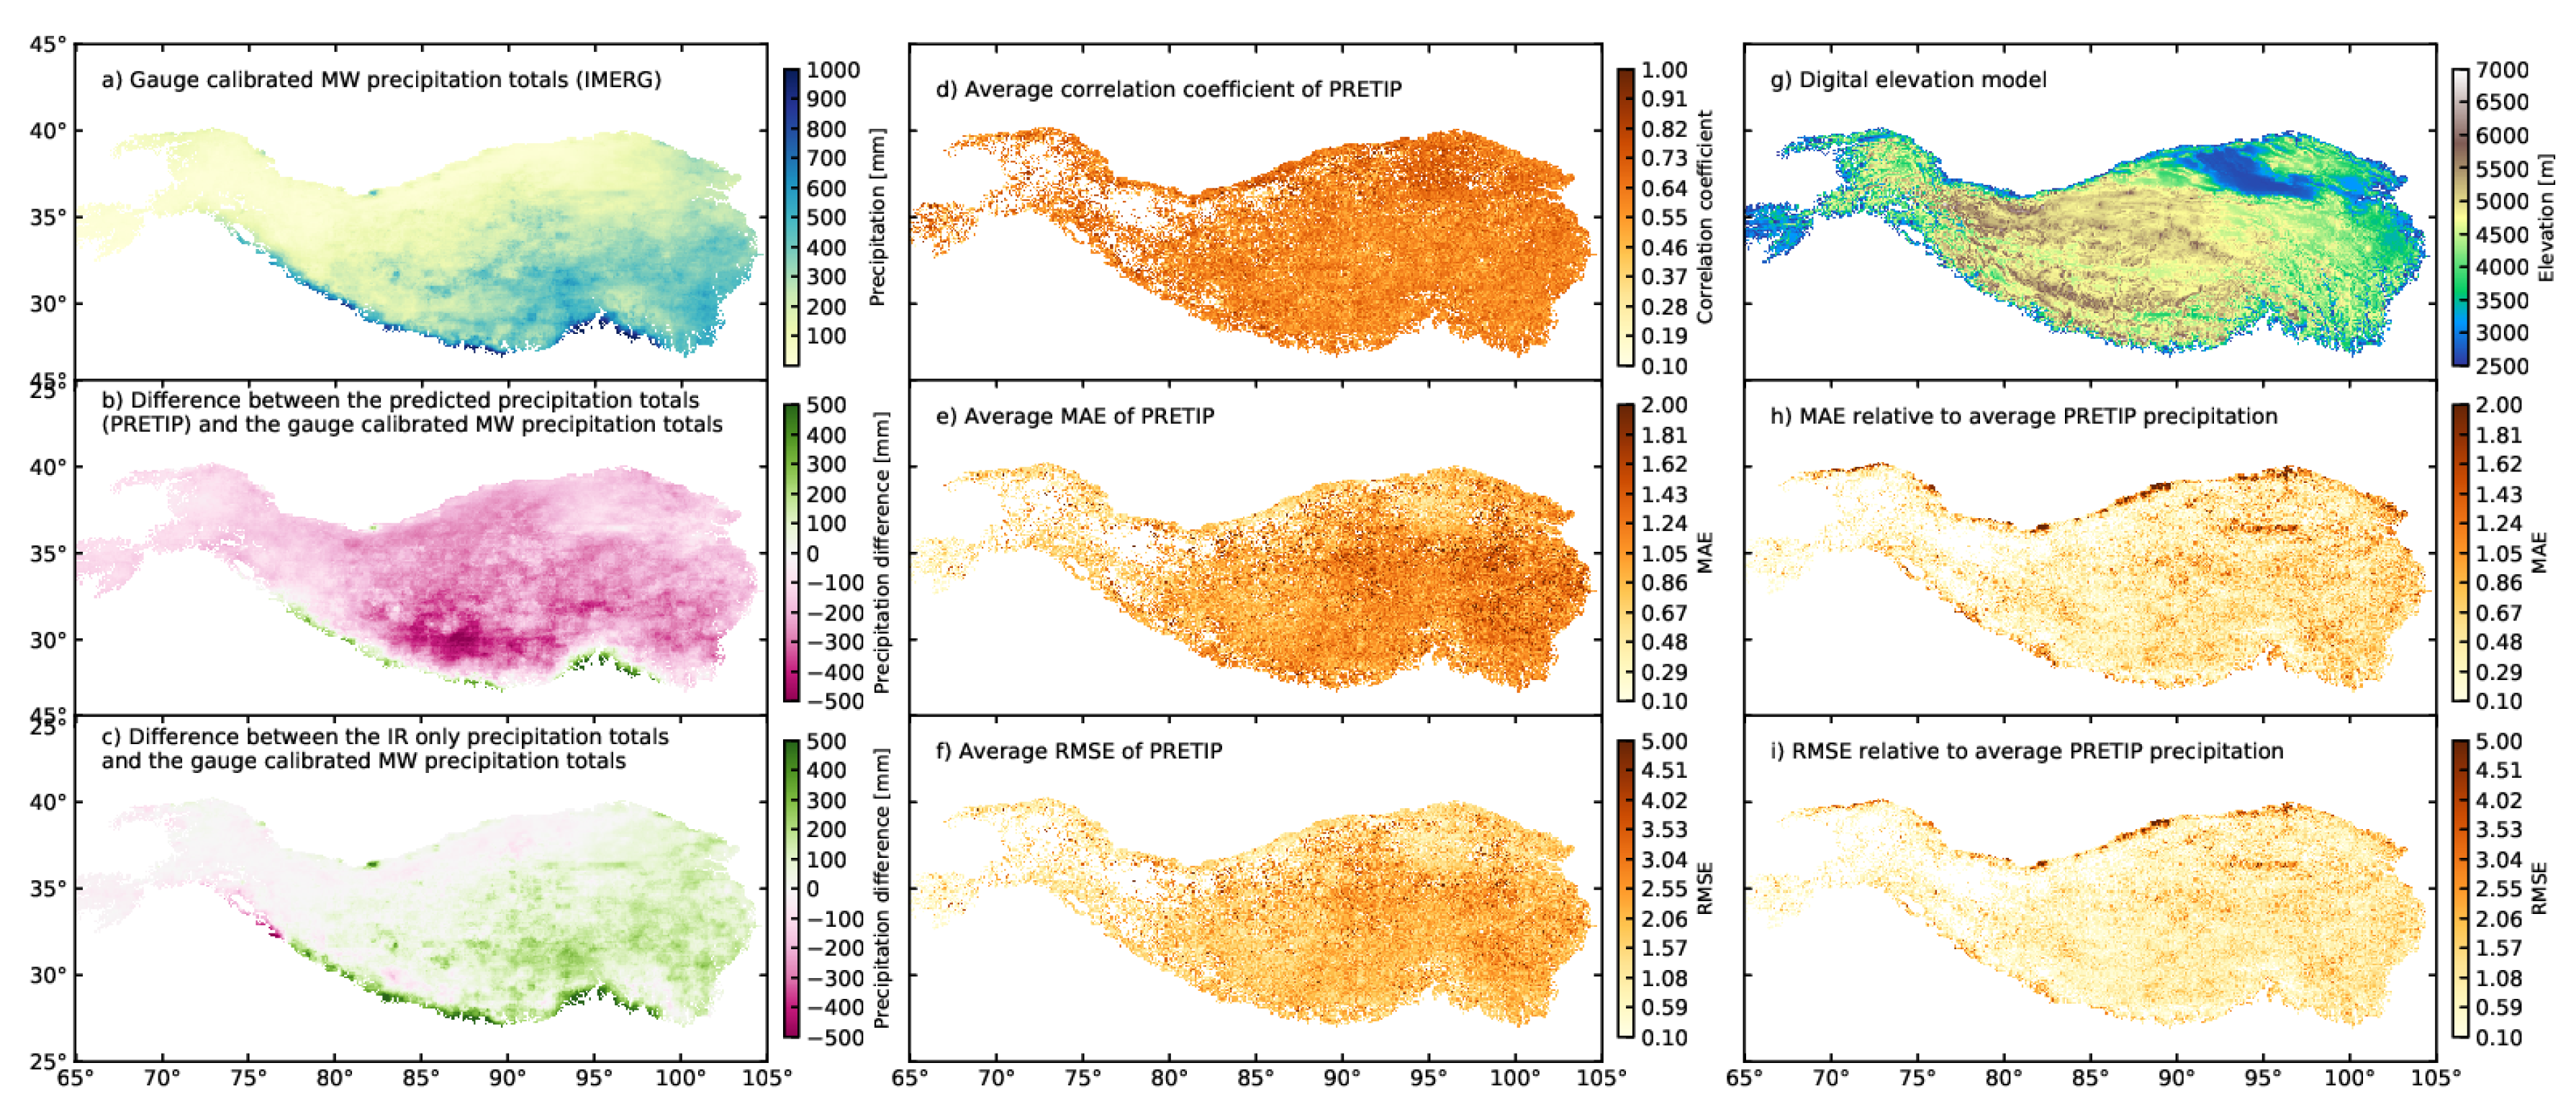
In the original article, there was a mistake in Figures 9–12 as published. We did not correctly calculate the hourly and daily precipitation sums based on the half hourly precipitation estimates (mm/h). We corrected the precipitation sums, produced the concerned figures and rewrote the concerned sections. In the section “4.2. Results of the Comparison between IMERG’s IR Only Precipitation and IMERG’s Gauge Calibrated MW Precipitation” we replaced Figure 9 and Figure 10. The corrected Figure 9 and Figure 10 appear below.
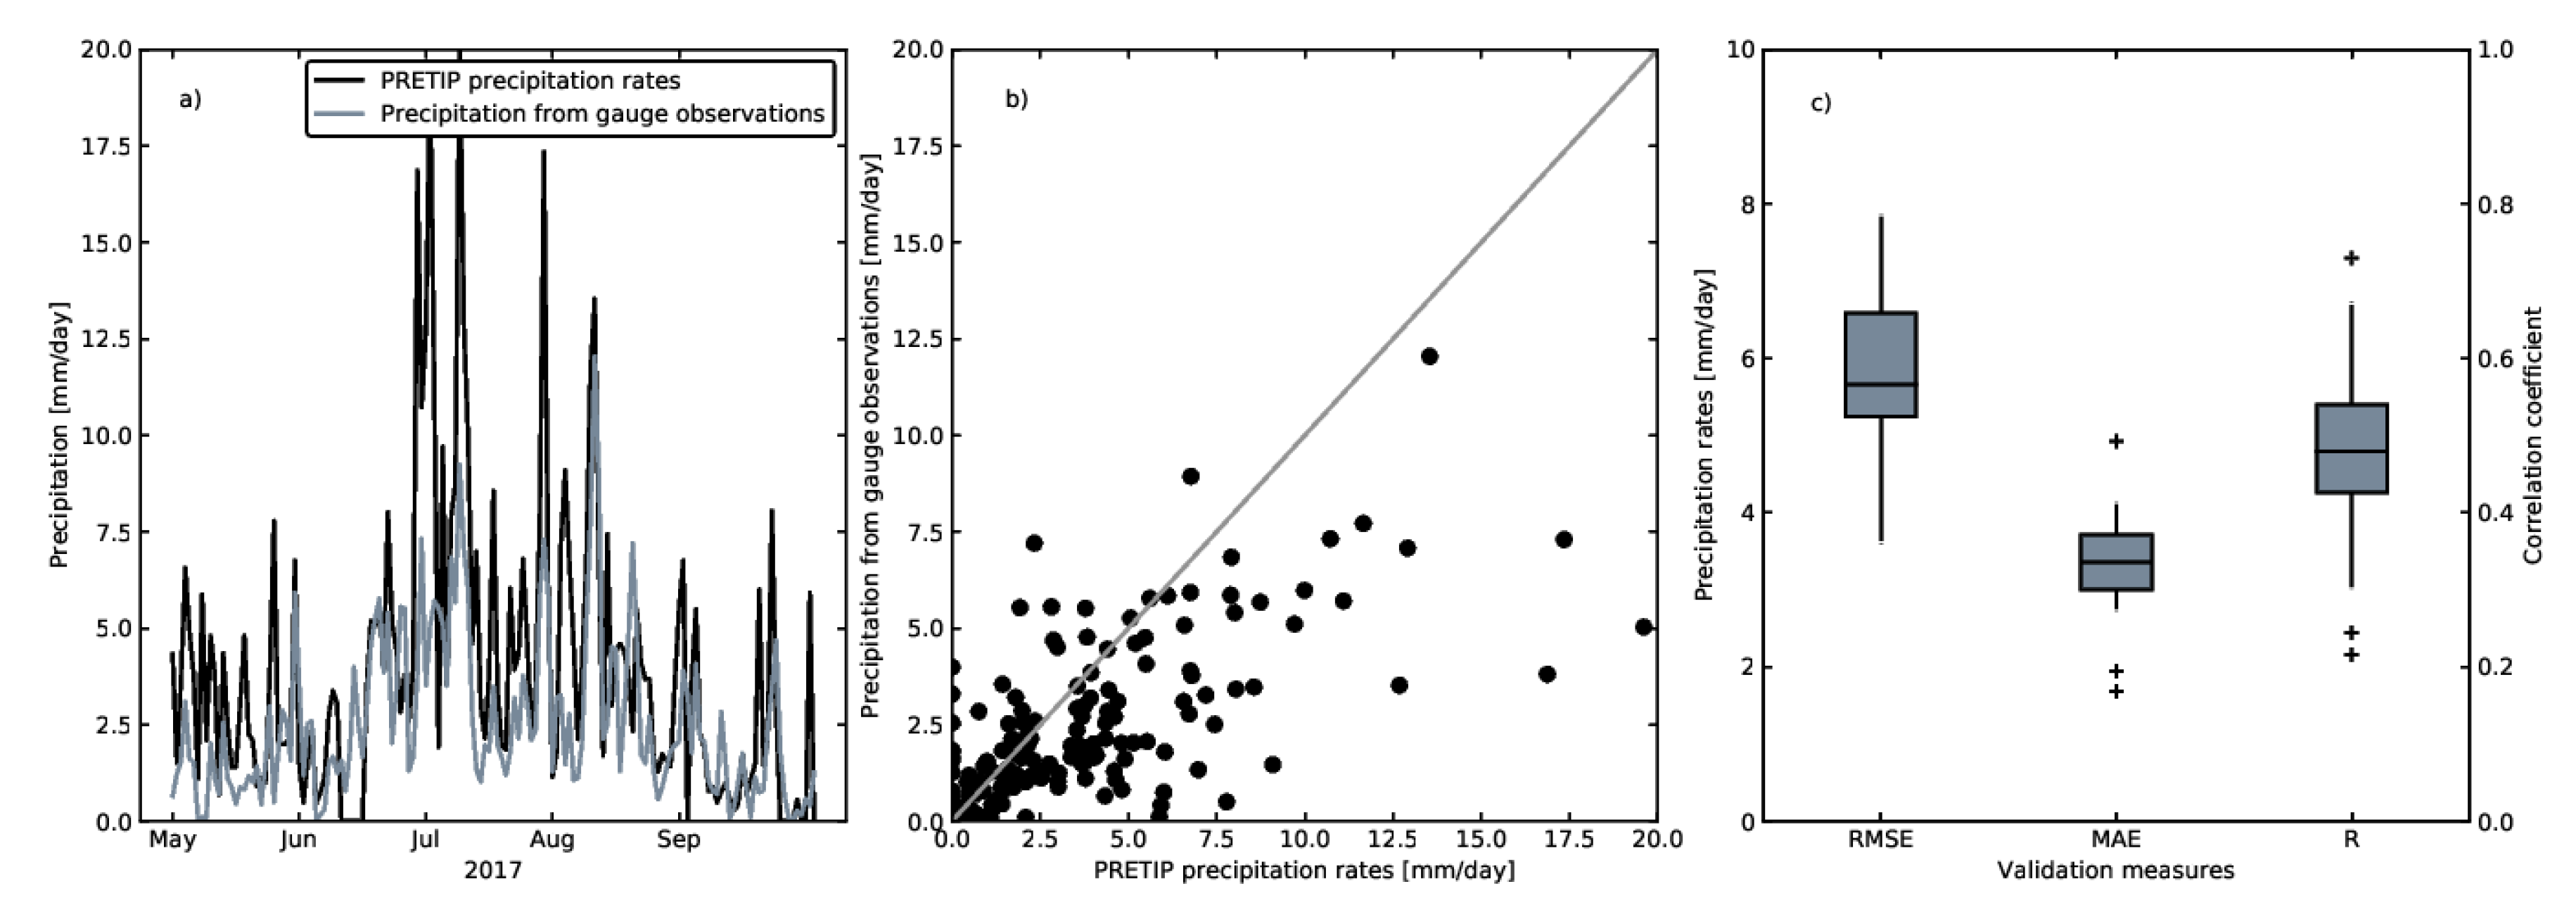
In the section “4.3. Validation of PRETIP against 28 Chinese Rain Gauge Observations” we replaced Figure 11 and Figure 12 with the correctly calculated precipitation sums and the updated validation measures.
We made following correction: The worst correlation is R = 0.21 and the best correlation is R = 0.71. We found an average MAE of 3.3 and an average RMSE of 5.9, which shows the high variability of the precipitation captured by the gauge observations. The lowest/highest MAE is 1.7/4.9 and the lowest/highest RMSE is 3.6/7.9 (see Figure 12 for details).
We originally wrote that the magnitude of PRETIP precipitation rates compared to the gauge observations strongly differs, however, there is just an slight overestimation of PRETIP.
In the section “5. Discussion” we wrote: “Further, we compared our product with Chinese gauge measurements and found a correlation coefficient of R = 0.49 while using the 4 km resolution of PRETIP. The MAE is 12.3 mm/day and the RMSE is 7.1 mm/day on average regarding the 4 km resolution.”
We corrected the average MAE = 3.3 mm/day and RMSE = 5.3 mm/day.
The authors apologize for any inconvenience caused and state that the scientific conclusions are unaffected.

Conflicts of Interest

The authors declare no conflict of interest.

Reference

  1. Kolbe, C.; Thies, B.; Turini, N.; Liu, Z.; Bendix, J. Precipitation Retrieval over the Tibetan Plateau from the Geostationary Orbit—Part 2: Precipitation Rates with Elektro-L2 and Insat-3D. Remote Sens. 2020, 12, 2114. [Google Scholar] [CrossRef]
Figure 9. Daily precipitation sums for gauge calibrated MW precipitation rates with the predicted precipitation (a) and with IR only precipitation rates (b). (c,d) depict the gauge calibrated MW precipitation rates, the predicted precipitation rates the IR only precipitation rates on an averaged daily cycle as boxplots. The boxes display the percentiles (25th, 50th and 75th). The whiskers indicate extreme data up to 1.5 times of the interquartile range. Crosses mark outliers. The width of the boxes is relative to the number of validation scenes.
Remotesensing 12 03594 g001
Figure 10. (a) depicts the precipitation totals of IMERG’s gauge calibrated MW precipitation and (b,c) show the differences of IMERG’s gauge calibrated MW precipitation with PRETIP and IMERG’s IR only precipitation for the time period of May–September 2017. For the precipitation totals of (a) and the differences of (c) only those scenes in which PRETIP is available were used. Green/pink represents the under-/overestimation of the gauge calibrated MW precipitation rates from IMERG when compared to the predicted precipitation rates (PRETIP)/IR only precipitation (IMERG). (df) show the average R, MAE, and RMSE of the validation data between PRETIP and the gauge calibrated MW precipitation relative to the number of available PRETIP scenes. (g) shows the digital elevation model of the TiP. (h,i) illustrate the average MAE and RMSE of the validation between PRETIP and the gauge calibrated MW precipitation relative to the average PRETIP precipitation for the complete time period (May–September 2017).
Remotesensing 12 03594 g002
Figure 11. Spatial distribution of validation measures correlation coefficient (yellow/brown circles), MAE (green triangles), and RMSE (blue squares).
Remotesensing 12 03594 g003
Figure 12. Temporal variation (a) and scatterplot (b) of daily precipitation from the Chinese rain gauge stations and the corresponding PRETIP precipitation pixels averaged for the complete study period. (c) shows the boxplots of the validation measures correlation coefficient R (right y-axis), MAE, and RMSE (both left y-axis) for the comparison of PRETIP in the 4 km resolution with the 28 Chinese rain gauge observations on the daily scale.
Remotesensing 12 03594 g004
Publisher’s Note: MDPI stays neutral with regard to jurisdictional claims in published maps and institutional affiliations.