Article

Using Remotely Sensed Information to Improve Vegetation Parameterization in a Semi-Distributed Hydrological Model (SMART) for Upland Catchments in Australia

1
School of Civil and Environmental Engineering, University of New South Wales, Sydney, NSW 2052, Australia
2
Department of Environmental Sciences, University of California Riverside, Riverside, CA 92521, USA
*
Author to whom correspondence should be addressed.
Remote Sens. 2020, 12(18), 3051; https://doi.org/10.3390/rs12183051
Submission received: 21 July 2020 / Revised: 3 September 2020 / Accepted: 16 September 2020 / Published: 18 September 2020
(This article belongs to the Special Issue Remote Sensing of the Water Cycle in Mountain Regions)

Abstract

:
Appropriate representation of the vegetation dynamics is crucial in hydrological modelling. To improve an existing limited vegetation parameterization in a semi-distributed hydrologic model, called the Soil Moisture and Runoff simulation Toolkit (SMART), this study proposed a simple method to incorporate daily leaf area index (LAI) dynamics into the model using mean monthly LAI climatology and mean rainfall. The LAI-rainfall sensitivity is governed by a parameter that is optimized by maximizing the Pearson correlation coefficient (R) between the estimated and satellite-derived LAI time series. As a result, the LAI-rainfall sensitivity is smallest for forest, shrub, and woodland regions across Australia, and increases for grasslands and croplands. The impact of the proposed method on catchment-scale simulations of soil moisture (SM), evapotranspiration (ET) and discharge (Q) in SMART was examined across six eco-hydrologically contrasted upland catchments in Australia. Results showed that the proposed method produces almost identical results compared to simulations by the satellite-derived LAI time series. In addition, the simulation results were considerably improved in nutrient/light limited catchments compared to the cases with the default vegetation parameterization. The results showed promise, with possibilities of extension to other hydrologic models that need similar specifications for inbuilt vegetation dynamics.

Graphical Abstract

1. Introduction

Terrestrial vegetation plays an important role in the water and energy cycles. Changes in the vegetation cover affect land surface properties, carbon generation and consumption, and significantly impact regional and global climate systems dynamics [1,2,3]. For the hydrological cycle, vegetation density (e.g., leaf area index (LAI)) and physiological properties (e.g., stomatal conductance) control partitioning of rainfall into runoff and evapotranspiration [4]. Specifically, stomatal conductance controls leaf-scale transpiration rates, and LAI controls transpiration rates and canopy interception losses. As a result, changes in LAI not only impact evapotranspiration rates, but also can affect subsequent hydrologic processes including soil moisture, baseflow and runoff [5,6]. Such long term changes in vegetation cover in response to environmental factors can also manifest themselves through nonstationary hydrologic responses where long-term trends in annual runoff to precipitation ratios in 20 anthropogenically unaffected catchments in Australia are observed [7].
Given the importance of vegetation in the hydrologic cycle, appropriate representation of the vegetation processes (i.e., photosynthesis, respiration, carbon allocation, and phenology) in hydrologic models is desirable. Physically based ecohydrologic models such as the Regional Hydro-Ecological Simulation System (RHESSys) [8] and Tethys-Chloris [9] have been developed to simulate ecohydrological processes at catchment scales. These ecohydrologic models integrate hydrological and ecological processes of a catchment where vegetation dynamics are internally simulated as a function of water and energy availability, and vegetation is used as a state variable for solving water/energy balances [10,11]. As the application of ecohydrologic models is limited by a large number of parameters and high computational demand, it is still a challenge to effectively consider dynamic vegetation effects on the water and energy balances in hydrological models [12]. Some physically-based hydrologic models assume vegetation as a static component of the hydrologic cycle or prescribe the same monthly LAI climatology (climatologically representative value of LAI by taking a long-term average of monthly LAI values) year after year to incorporate vegetation processes [13]. For example, in a distributed hydrology-vegetation model, Wigmosta et al. [14] defined maximum canopy interception storage capacities and resistance based on seasonal LAI values. In a semi-distributed variable infiltration capacity (VIC) model, Liang et al. [15] parameterized land cover types based on monthly LAI climatology values, canopy resistance and relative fractions of roots in the soil layers. In the HYDRUS software package that simulates water, heat, and solute transport in porous media [16], potential evapotranspiration is partitioned to transpiration and soil evaporation according to the Beer’s law that attenuates light through the canopy based on light extinction coefficient and LAI [17].
These limited parameterization approaches using constant or inter-annually invariant monthly LAI values have been shown to impact accuracy of simulated hydrologic fluxes. Ford and Quiring [18] showed that incorporating inter-annual LAI dynamics from the moderate resolution imaging spectroradiometer (MODIS) in the VIC model improved soil moisture simulations particularly during dry periods. However, the improvement has not been consistent. Donohue et al. [12] emphasized explicit representation of vegetation dynamics in the Budyko model particularly when it is applied at small timescales and/or small catchments as vegetation dynamics affect annual and seasonal vegetation water use. For this reason, many efforts have been made to include vegetation component in the Budyko model framework [19,20,21,22]. Wegehenkel [23] coupled a hydrologic model with a static and a dynamic vegetation module implemented at a catchment scale, and showed that simulated evapotranspiration and groundwater recharge are significantly different from those derived from temporally invariant vegetation conditions. Tang et al. [24] also showed that incorporating observed MODIS LAI compared to LAI climatology has larger impacts on evapotranspiration compared to soil moisture particularly in regions with larger LAI inter-annual variability. Tesemma et al. [4] also illustrated that VIC simulated runoff from the Goulburn–Broken catchment in Australia is improved when observed monthly LAI data from the Global Land Surface Satellite (GLASS) are used instead of long-term mean monthly LAI climatology.
As incorporating LAI dynamics at large scale depends on the quality of remotely sensed observations and data availability, empirical approaches have been developed to include LAI dynamics in hydrologic models while keeping model structure unchanged. To incorporate changes in LAI dynamics for climate change impact assessment, Tesemma et al. [25] examined predictive capability of a set of three-parameter empirical functions that relate annual or monthly LAI to a range of climate variables (precipitation, potential evapotranspiration, soil moisture and temperature) for three different land covers types in the Goulburn–Broken catchment in Australia. The best non-linear empirical LAI model calibrated against remotely sensed LAI data were first applied to simulate changes in LAI under climate change scenarios. Results of future runoff simulations using VIC model illustrated significant differences in the mean annual runoff when estimated LAI from the empirical function were utilized instead of LAI climatology [26]. Mohaideen and Varija [27] also used the VIC model for simulating various hydrologic fluxes for a catchment that has experienced significant land cover changes over a 10-year period. Satellite-derived LAI and land cover data were used for grid-wise vegetation parameterization, and results showed significant increases/decreases in hydrologic fluxes for different land cover types.
To incorporate vegetation dynamics in hydrologic models without explicitly simulating carbon cycle, this study aims to improve the LAI parameterization method in a semi-distributed hydrologic model, called the Soil Moisture and Runoff simulation Toolkit (SMART) [28]. SMART is a semi-distributed hydrologic modeling toolbox for computationally efficient hydrologic simulations. The computational efficiency is achieved by formulating two-dimensional representative hillslopes or equivalent cross sections (ECSs) in every sub-basin where each ECS consists of topographically defined hydrologic response units (HRUs). These delineations will result in a highly efficient semi-distributed hydrological modeling framework compared to distributed hydrologic models that perform model simulations at very grid cell [29,30]. Despite SMART’s computational efficiency, its vegetation parameterization needs to be improved. The current version of SMART relies on a simple method proposed by Vaze et al. [31], where monthly LAI climatology is proportionally scaled by the ratio of monthly rainfall to monthly rainfall climatology for three land cover classes (pasture, crop, and tree). However, the accuracy of this method on simulating hydrologic fluxes and states has not been fully assessed compared to prescribing inter-annual variability of LAI from remotely sensed data. Therefore, we aim to develop a viable alternative to the existing LAI parameterization in SMART using remotely sensed LAI data to improve catchment-scale simulations of soil moisture (SM), evapotranspiration (ET) and streamflow (Q). We also expect that the proposed framework can be conveniently incorporated in any hydrologic model where simple parameterization of vegetation dynamics is desired. The proposed LAI scaling method was evaluated by simulating soil moisture, evapotranspiration, and streamflow over six ecohydrologically contrasted catchments located in high elevation mountain ranges in Australia. For this research objective, this paper is organized as follows. In Section 2, we describe the study area and data used in this study together with a summary of the exiting LAI model in SMART, and the proposed LAI parameterization method. In Section 3, we present and discuss the evaluation results over the six catchments. Lastly, in Section 4, we summarize the results and present conclusions.

2. Methodology

2.1. Study Area

Australia was selected as the study area to develop a simple scaling approach for LAI parameterization in hydrologic models. The region (10° S–45° S, 110° E–155° E) covers various climate and land cover types allowing to assess the general applicability of the proposed method, and its potential applicability elsewhere. As shown in Figure 1a,b, Australia consists of six primary land covers including forest, shrublands, woodlands, grasslands, croplands and unvegetated regions, and three dominant climate zones; tropical, arid and temperate. The presented land covers and climate zones are based on the moderate resolution imaging spectroradiometer (MODIS) yearly land cover data [32], and the updated Köppen–Geiger climate classification [33], respectively (see Section 2.2 for details).
For the simulations using SMART, as presented in Figure 1, we selected six ecohydrologically contrasted catchments from the hydrologic reference stations (HRS). These catchments are distributed over the mountainous regions and present non-stationary hydrologic responses [7]. The HRS consists of 222 monitoring sites with long-term streamflow records, and minimal flow regulation and land use change [34,35]. The catchment areas of HRS range from 101 to 232,846 km2, and the elevations vary from 284 to 1351 m (above sea level), respectively.
Ajami et al. [7] identified that 20 out of 166 HRS catchments exhibit non-stationary hydrologic responses based on the long-term trends in annual runoff ratio, and subsequently developed an ecohydrologic catchment classification method using rainfall, runoff, vegetation productivity and evapotranspiration data to characterize ecohydrologic response. According to this classification, a positive or negative correlation between annual precipitation and fractional vegetation cover (productivity) in a catchment determines whether catchment-scale vegetation productivity is water limited (class A, positive correlation) or nutrient/light limited (class B, negative correlation). Both A and B classes are further subdivided into two groups based on the relationship between mean annual ET and vegetation productivity. In A1 catchments, productivity depends on the dominance of structural control (increases in LAI), and annual ET increases with annual productivity increase. In A2 catchments, physiological control (decreases in stomatal conductance) is dominant, and annual ET decreases with increases in productivity. In group B catchments, productivity is likely limited by biogeochemical factors. Productivity of B1 catchments is limited by nutrients, and in B2 catchments light availability is a limiting factor. Note that none of the 20 non-stationary catchments belongs to the A2 class. Here, we selected six catchments out of the 20 non-stationary catchments for hydrologic modeling. The selection included two catchments from each class with different proportion of land cover types. Details of the six catchments are summarized in Table 1. All of these catchments represent upland/hilly terrains, creating a mix of overland and lateral subsurface flow.

2.2. Remote Sensing and Forcing Datasets

The datasets used in this study span over a 12-year study period from November 2002 to December 2014. As summarized in Table 2, these data include remotely sensed observations and gridded climate products and are grouped to three categories by their primary purposes: LAI modelling; SMART modelling; evaluation of SM, ET, and Q simulations. Although ground measurements are generally regarded as truth and used for model validation, availability of in situ data is considerably limited in time and space [36,37,38]. Therefore, we used satellite-derived data for the catchment-scale evaluations of SM and ET similar to previous investigations [39,40].
For the LAI modelling, the 12-year period was separated into two segments: 2002–2009 (seven years) for model calibration, and 2010–2014 (five years) for model validation, respectively. The SMART modelling was implemented over a period from 1 January 2010 to 31 December 2014, and the first-year of model simulation was excluded from the evaluation in order to minimize the impact of model initialization.
In this study, three remote sensing datasets were used for LAI parameterization and hydrologic model evaluation at catchment scales. MODIS-derived 8-day composite LAI (MCD15A2H from Terra and Aqua satellites, V006) products [41] were used to cover the 12-year study period. As the products consist of 10° × 10° tiles in the sinusoidal projection, they were re-projected and resampled to 0.05° × 0.05° grids (identical to the gridded rainfall data) by using the MODIS re-projection tool [53]. The Savitzky–Golay filter [54] in the TIMESAT software package [55] was used for removing outliers from the reprojected LAI time series [56,57,58]. The filtered 8-day LAI maps were linearly interpolated to a daily time scale for temporally matching with other hydro-climatological datasets (i.e., rainfall, potential/actual evapotranspiration, and surface soil moisture) used in this study.
The European Space Agency Climate Change Initiative (ESA CCI) surface SM data was used for validating the SMART-simulated SM at the topsoil layer (<10 cm). The ESA CCI has released daily surface SM (<2 cm) products gridded at 0.25° that are derived from seven passive and three active microwave spaceborne instruments covering 39 years from 1 November, 1978 to 30 June, 2018 (V04.4) [49,50,51]. Among the three surface SM products: active, passive, and active–passive combined data, the active–passive combined data were used for model validation in this study. MODIS-derived 8-day evapotranspiration data (MYD16A2, from Aqua satellite, V600) were used for evaluating SMART simulated ET. The raw ET data consisted of 10° × 10° tiles in the sinusoidal projection and were resampled to 0.05° × 0.05° grids through the MODIS re-projection tool. Only good quality data were included by using MODIS pixel-level quality code data. The spatiotemporal gaps in the quality-assured ET data were simultaneously filled by using a generic smooth parameter (s = 10−6) in the three-dimensional (3-D) gap-filling method, called penalized least-square regression based on 3-D discrete cosine transform (DCT-PLS) [59,60,61].
For the LAI and SMART modeling, the Australian water availability project (AWAP) rainfall data gridded at 0.05° [42] were used. The AWAP product uses a thin plate smoothing spline to interpolate monthly rainfall climatology derived from ground measurements, and a successive correction method is used for interpolating anomalies of daily rainfall [62]. The AWAP rainfall data is available from 1900 onwards as operational daily maps over Australia with a day of latency, and has been frequently used for various hydro-climatological studies [63,64,65,66]. For hydrologic modeling, daily PET data gridded at 0.05° from the Australian Water Resource Assessment Landscape (AWRA-L) were used [48]. This product uses the Penman equation [67] for PET estimation. Alternate satellite precipitation products covering global extents are becoming increasingly refined and available for future extensions of the study to other parts of the world [68].

2.3. Description of SMART

The Soil Moisture and Runoff simulation Toolkit (SMART) [28] was used for daily simulations over the six catchments described in in Section 2.1. SMART is a geographic information system (GIS)-based semi-distributed hydrologic modelling framework designed for large catchment-scale simulations. Computational efficiency in SMART is achieved by delineating topologically connected hydrologic response units (HRUs), and formulating a series of equivalent cross sections (ECSs) by weighting topographic and physiographic properties of a part or an entire first-order sub-basin. In the 3-ECSs delineation approach employed here [29,30], 2 or 3 ECSs are delineated for every sub-basin depending on the number of hillslopes in each sub-basin. Each ECS consists of 4 HRUs (upslope, mid-slope, foot-slope, and alluvial flats) delineated based on changes in slope versus distance from the river. In each HRU, the dominant landcover type is selected for hydrologic simulation. Previous application of the ECSs approach reported 3.7 to 22.8 times reduction in the number of computational units [30]. The current version of SMART adopts the Unsaturated Soil Moisture Movement Model (U3M-2D) to solve the 2-dimensional Richards equation for every ECS by using spatially distributed climate, land cover and soil type information. U3M-2D developed by Tuteja et al. [69] is an extended two-dimensional version of U3M-1D [31]. U3M-2D calculates the vertical water balance by solving the 1D Richard’s equation and then uses the unsaturated form of Darcy’s law to transfer horizontal flow down the hillslope. The model generates daily time series of horizontal flow, deep drainage, total runoff, overstory and understory transpiration, soil evaporation, and soil moisture at multiple depths for every HRU. The U3M-2D uses monthly LAI climatology and scales it based on monthly rainfall to partition PET into overstory and understory potential transpirations and soil evaporation. Scaled monthly LAI is calculated as:
LAI ¯ i ,   j =   LAI ¯ i · ( P ¯ i , j P ¯ i ) β
where LAI ¯ i ,   j and P ¯ i ,   j are the scaled monthly mean LAI and monthly mean rainfall, respectively, in ith month (i = 1,…, 12) of jth year; LAI ¯ i and P ¯ i are monthly mean LAI and precipitation climatology, respectively, in ith month (i = 1,…, 12), β is a scaling parameter with a default value of 1 in SMART [70].
Based on the LAI ¯ i ,   j of every land cover type, U3M-2D partitions potential evapotranspiration (PET) into overstory and understory potential transpirations ( ET o and ET u ), and potential soil evaporation ( ET g ) for three different land cover types (i.e., tree, crop, and pasture) as
Tree : ET o = PET · ( 1 exp ( L · LAI ¯ i ,   j ) ) ;   ET u = 0 ;   ET g = PET · exp ( L · LAI ¯ i ,   j ) Crop   and   pasture : ET o = 0 ;   ET u = PET · ( 1 exp ( L · LAI ¯ i ,   j ) ) ;   ET g = PET · exp ( L · LAI ¯ i ,   j )
where L is a canopy light extinction coefficient (default value of 0.8 for trees and 0.6 for crop and pasture are adopted in SMART) [70].
The following datasets were used for the SM and ET simulations with SMART: (1) Shuttle Radar Topography Mission (SRTM)-derived 1-s (~30m) Hydrologically Enforced Digital Elevation Model (DEM-H) Version 1.0 [43] for representing the topographic and physiographic properties of the catchments and delineating HRUs; (2) 2012 MODIS-derived yearly land cover (LC) map gridded at 0.05° (MCD12C1, V051) [32] to represent landcover types. As summarized in Table 3, the MCD12C1 product consists of the 17-class International Geosphere Biosphere Program (IGBP) classified to 6 primary classes: forest, shrublands, woodlands, grasslands, croplands, and unvegetated regions. Note that the primary land cover classes in the MODIS LC product were aggregated to the three LC types used in Equation (2) of SMART; (3) The updated Köppen–Geiger climate classification [71] to define climate zones in SMART, and apply different rainfall and potential evapotranspiration datasets for each zone; (4) Soil attribute maps of silt, clay, and sand proportions at multiple depths, and soil depth at a 3-s (≈90m) spatial resolution [44,45,46,47]; and (5) daily precipitation and PET data as described in Section 2.2.

2.4. Proposed LAI Parameterization Method

Tesemma et al. [25] tested various types of linear and nonlinear models to estimate monthly LAI by using multiple climate predictors over the Goulburn–Broken catchment in southeastern Australia. Their results showed that a sigmoid model based on rainfall and reference potential evapotranspiration performs best over the three different land covers: crop, pasture, and trees in the catchment. The sigmoid function has the form
LAI ^ =   α 1 1 + exp ( ( ( P PET ) α 2 α 3 ) )
where LAI ^ is the estimated monthly LAI; α 1 ,   2 ,   3 are model parameters that should be calibrated for each land cover classes (i.e., crop, pasture and tree) by minimizing the root-mean-square error between the modelled and remotely sensed LAI over the region; P and PET are n-month moving average rainfall and reference crop evapotranspiration, respectively (n = 6 for crop and pasture, and n = 9 for tree).
Based on the results of Tesemma et al. [25], we propose a simplified one-parameter sigmoid scaling model to estimate daily LAI based on monthly mean LAI climatology and rainfall as
LAI ^ t =   2 · LAI ¯ i 1 + exp ( k ( P ¯ 30 P ¯ i ) )
where LAI ^ t is the estimated daily LAI at the time of t; LAI ¯ i and P ¯ i are identical to those in Equation (1) and, in this study, were derived from the 12-year time series of MODIS LAI and AWAP rainfall respectively; k (≥0) is the scaling parameter calibrated based on remotely sensed LAI; P ¯ 30 is the mean daily precipitation during recent 30 days (i.e., from t-29 to t). The k parameter in Equation (4) represents sensitivity of LAI dynamics to rainfall at every grid cell, and its value was optimized by maximizing the Pearson correlation coefficient (R) between the MODIS LAI time series and predicted LAI ^ t at each grid cell over the calibration period. The benefit of this LAI scaling is that LAI data can be estimated for regions or periods where high quality remote sensing data are not available.

2.5. Hydrologic Modeling Scenarios and Evaluation Metrics

Three approaches for incorporating LAI dynamics into SMART were examined in this study to assess their impacts on simulated ET, SM and Q. These scenarios are (1) Opt def : using the scaled monthly LAI of Equation (1) (default in SMART), (2)   Opt MOD : directly using the MODIS LAI (see Section 2.2), and (3) Opt est : using the estimated daily LAI by Equation (4).
Three metrics were used for model evaluation. Those are Pearson correlation coefficients (R), Nash–Sutcliffe model efficiency coefficient (NSE) [72] and root mean squared error (RMSE) between the simulated and observed SM, ET, and Q. Considering systematic differences in the amplitude and mean values of satellite-derived datasets resulting from limited parameterization and imperfect retrieval algorithms [36], R would be a more reliable metric because it is less sensitive to the bias or amplitude of variations [73].
Note that both satellite-derived and estimated SM and ET data within a catchment boundary were spatially averaged on a daily time step for catchment-scale comparisons given the coarse resolution of satellite data products and sizes of the study catchments. It should be also noted that the current version of SMART does not have a routing module. Therefore, total runoff (horizontal flow + deep drainage) values from each ECS were simply area-weighted averaged to represent Q at the outlet, and this limitation should be considered in interpreting the results of simulated Q.

3. Results and Discussion

3.1. Results of LAI Modelling

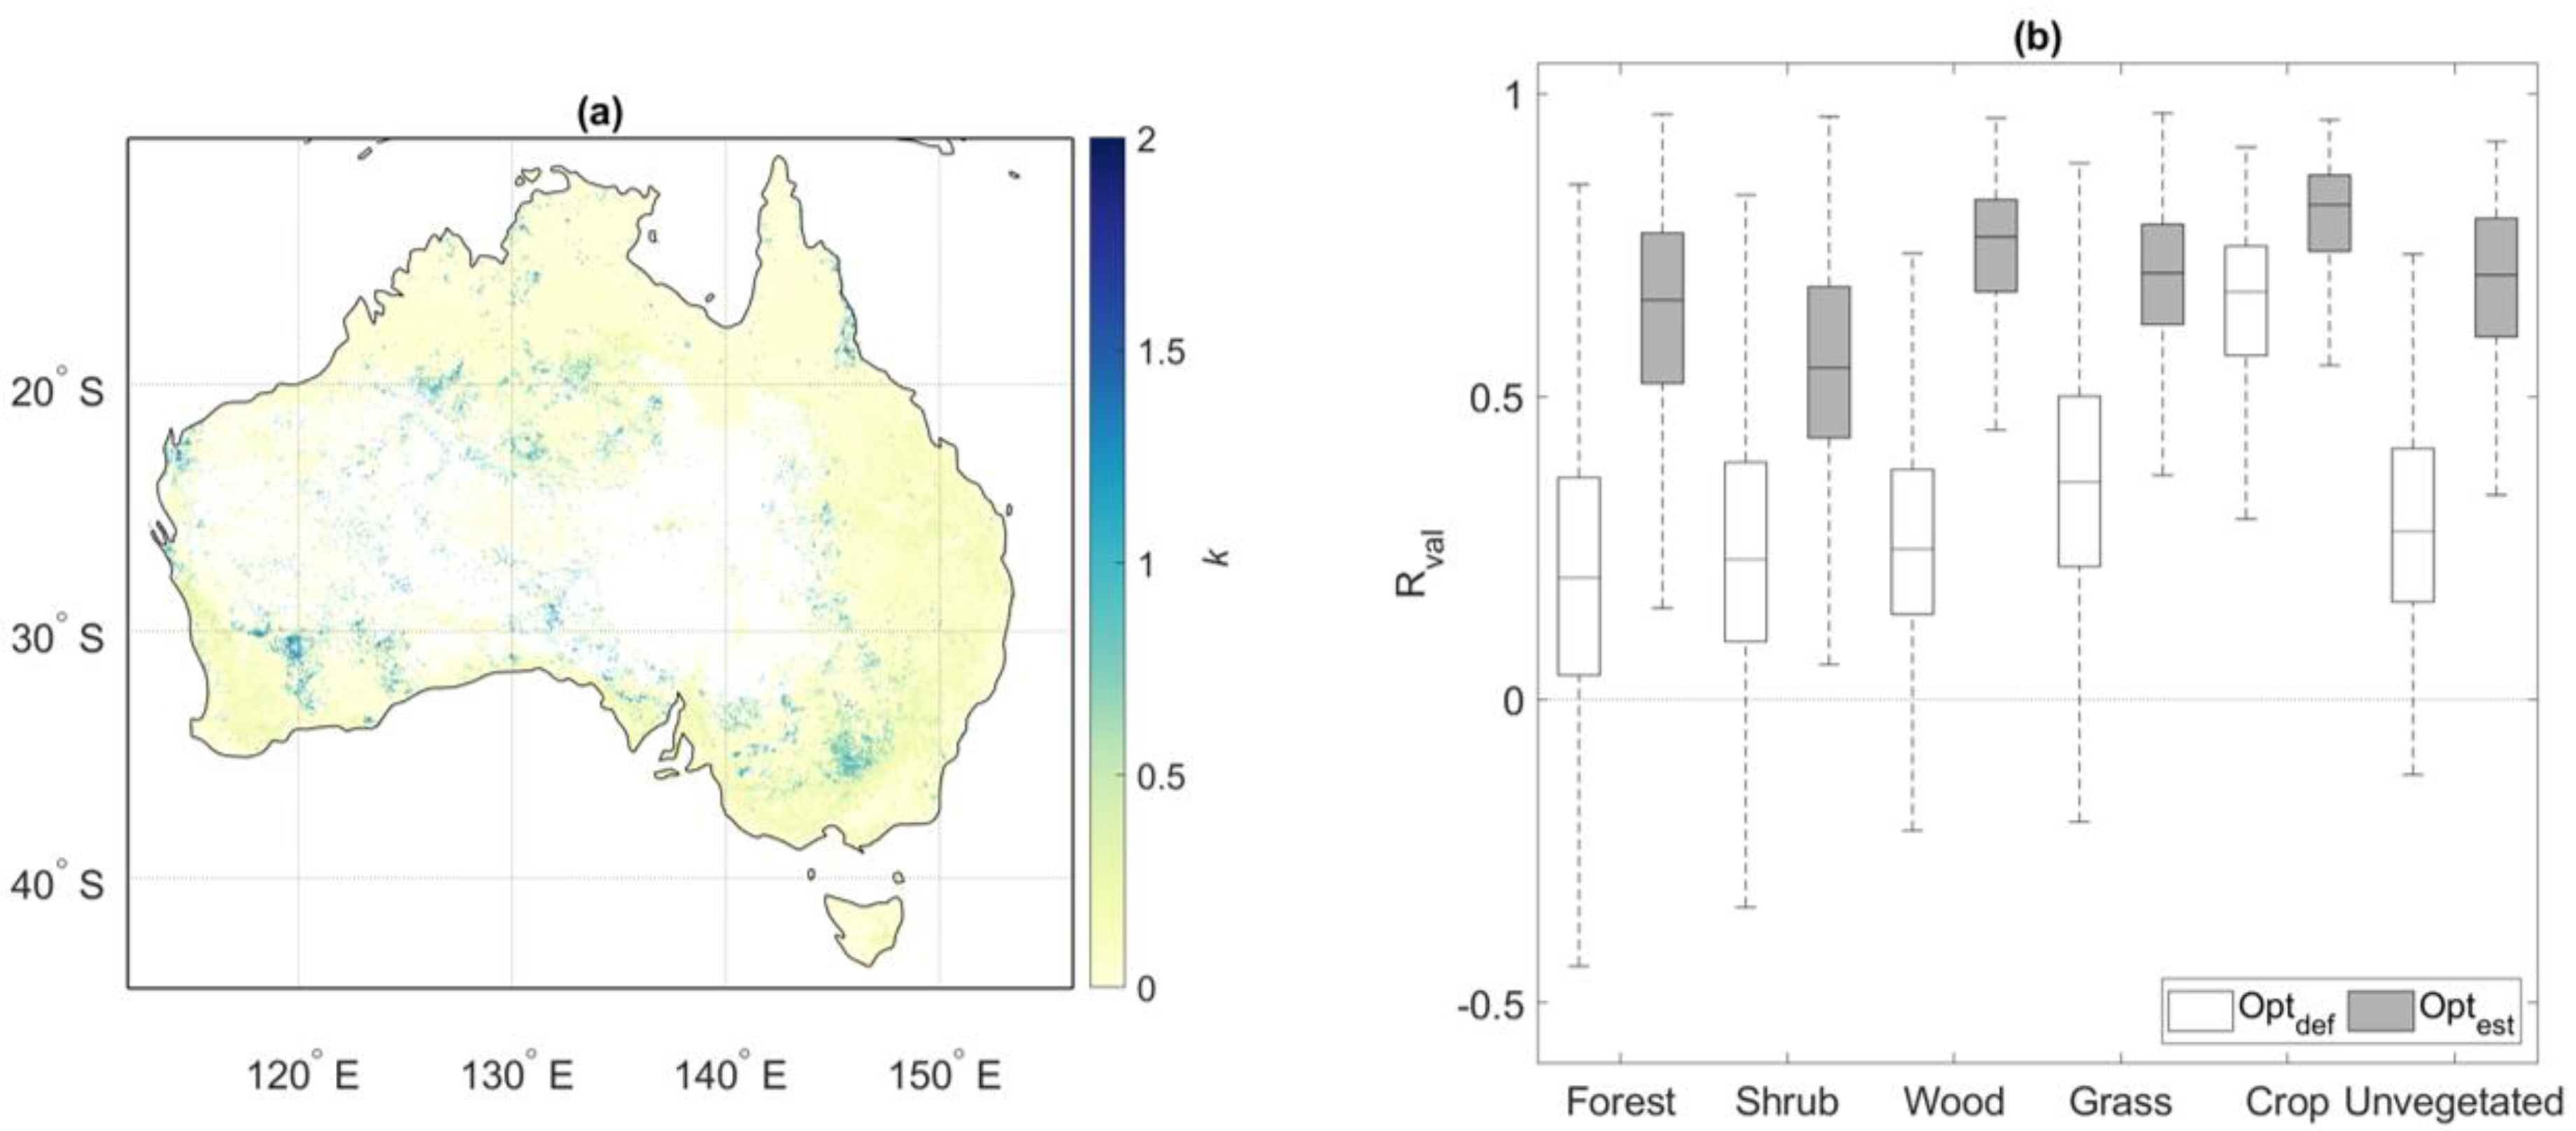
We compared the two LAI estimation approaches across Australia using the Opt est and Opt def methods for the five-year validation period from 2010 to 2014. For the LAI estimation by Opt est , the parameter k of Equation (4) was calibrated over the seven-year calibration period from 2002 to 2009 (Figure 2a). Then LAI time series at each grid cell were estimated by Equation (4) using the calibrated k. Likewise, for the case with Opt def , time series of LAI for every grid were generated by Equation (1). For both approaches the correlation coefficient between the estimated and MODIS LAI data at each grid cell was calculated to assess accuracy of the LAI parameterization approach. Figure 2b shows boxplots comparing the two sets of correlation coefficients (R) derived from Opt def and Opt def approaches conditioned by the six primary land cover classes described in Table 3.
As shown in Figure 2b, R values have been considerably improved for Opt est compared to Opt def indicating better performance of the sigmoid function in capturing LAI dynamics compared to the default LAI scaling option of Equation (1). When the results are grouped by the MODIS-derived six primary land covers (Figure 2b), the LAI estimation method best performed in woodlands, grasslands, and croplands compared to forest, shrublands, and unvegetated regions (Table 4).
Larger k values coincide with the arid regions indicating larger sensitivity of vegetation cover to rainfall amounts over semi-arid ecosystems covered by grasslands and croplands [74,75,76,77]. As presented in Table 4, relatively small k values were observed for forests, shrublands, woodlands and unvegetated regions, meaning that these vegetation types are less sensitive to the rainfall amounts.
At the catchment scale, Opt est resulted in considerable improvements in R values of simulated LAI and remotely sensed LAI compared to Opt def as summarized in Table 5. In general, estimated catchment average k values in study catchments are small and less than 0.10 as the dominant land cover is forest and woodlands. In catchment 405238, k is 0.13 because this catchment is mainly covered by grass and croplands.

3.2. Results of Catchment-Scale Simulations of SM, ET and Q

Note that Results of the modeling with SMART for the six catchments are summarized in Table 6. First, Opt MOD improves SM and ET simulations compared to those from Opt def in terms of all metrics (i.e., R, NSE, and RMSE), with results being almost identical to that of Opt est . Therefore, the proposed LAI estimation method has considerable potential for adoption in hydrological modelling. Comparisons of SM simulations across multiple catchments and LAI options indicate that, A1 (water limited) catchments tend to have the highest R values (>0.8) between simulated and observed SM followed by the B2 (light limited) and B1 (nutrient limited) catchments. However, no difference among various LAI options were observed in simulated SM of A1 catchments, and the Opt est approach improved simulated SM in light/nutrient limited catchments. In terms of simulated ET, relatively low R values are also observed in B1 compared to B2 and A1 catchments. While the improvement in R for Opt est against Opt def is 10% or more for B1 and B2 catchments, the two water-limited catchments (A1) do not show such improvements in Opt est against Opt def . One possible explanation for getting similar results in the A1 catchments is that ET in A1 catchments is mainly limited by the precipitation amount, i.e., water supply [7]. As the current version of SMART does not have a routing module, it would be useful to focus on the differences in the metrics across the vegetation parameterization methods particularly in large catchments. For example, simulated discharge in the largest catchment (405238) showed notably poor performance with R of around 0.2 and NSE of −0.54 (Table 6). Even considering such limits, the differences in the Q simulations metrics are not considerable among different LAI parameterizations as shown in the last three columns of Table 6. This result indicates that simulated Q in SMART is less sensitive to the vegetation dynamics compared to those of the SM and ET.
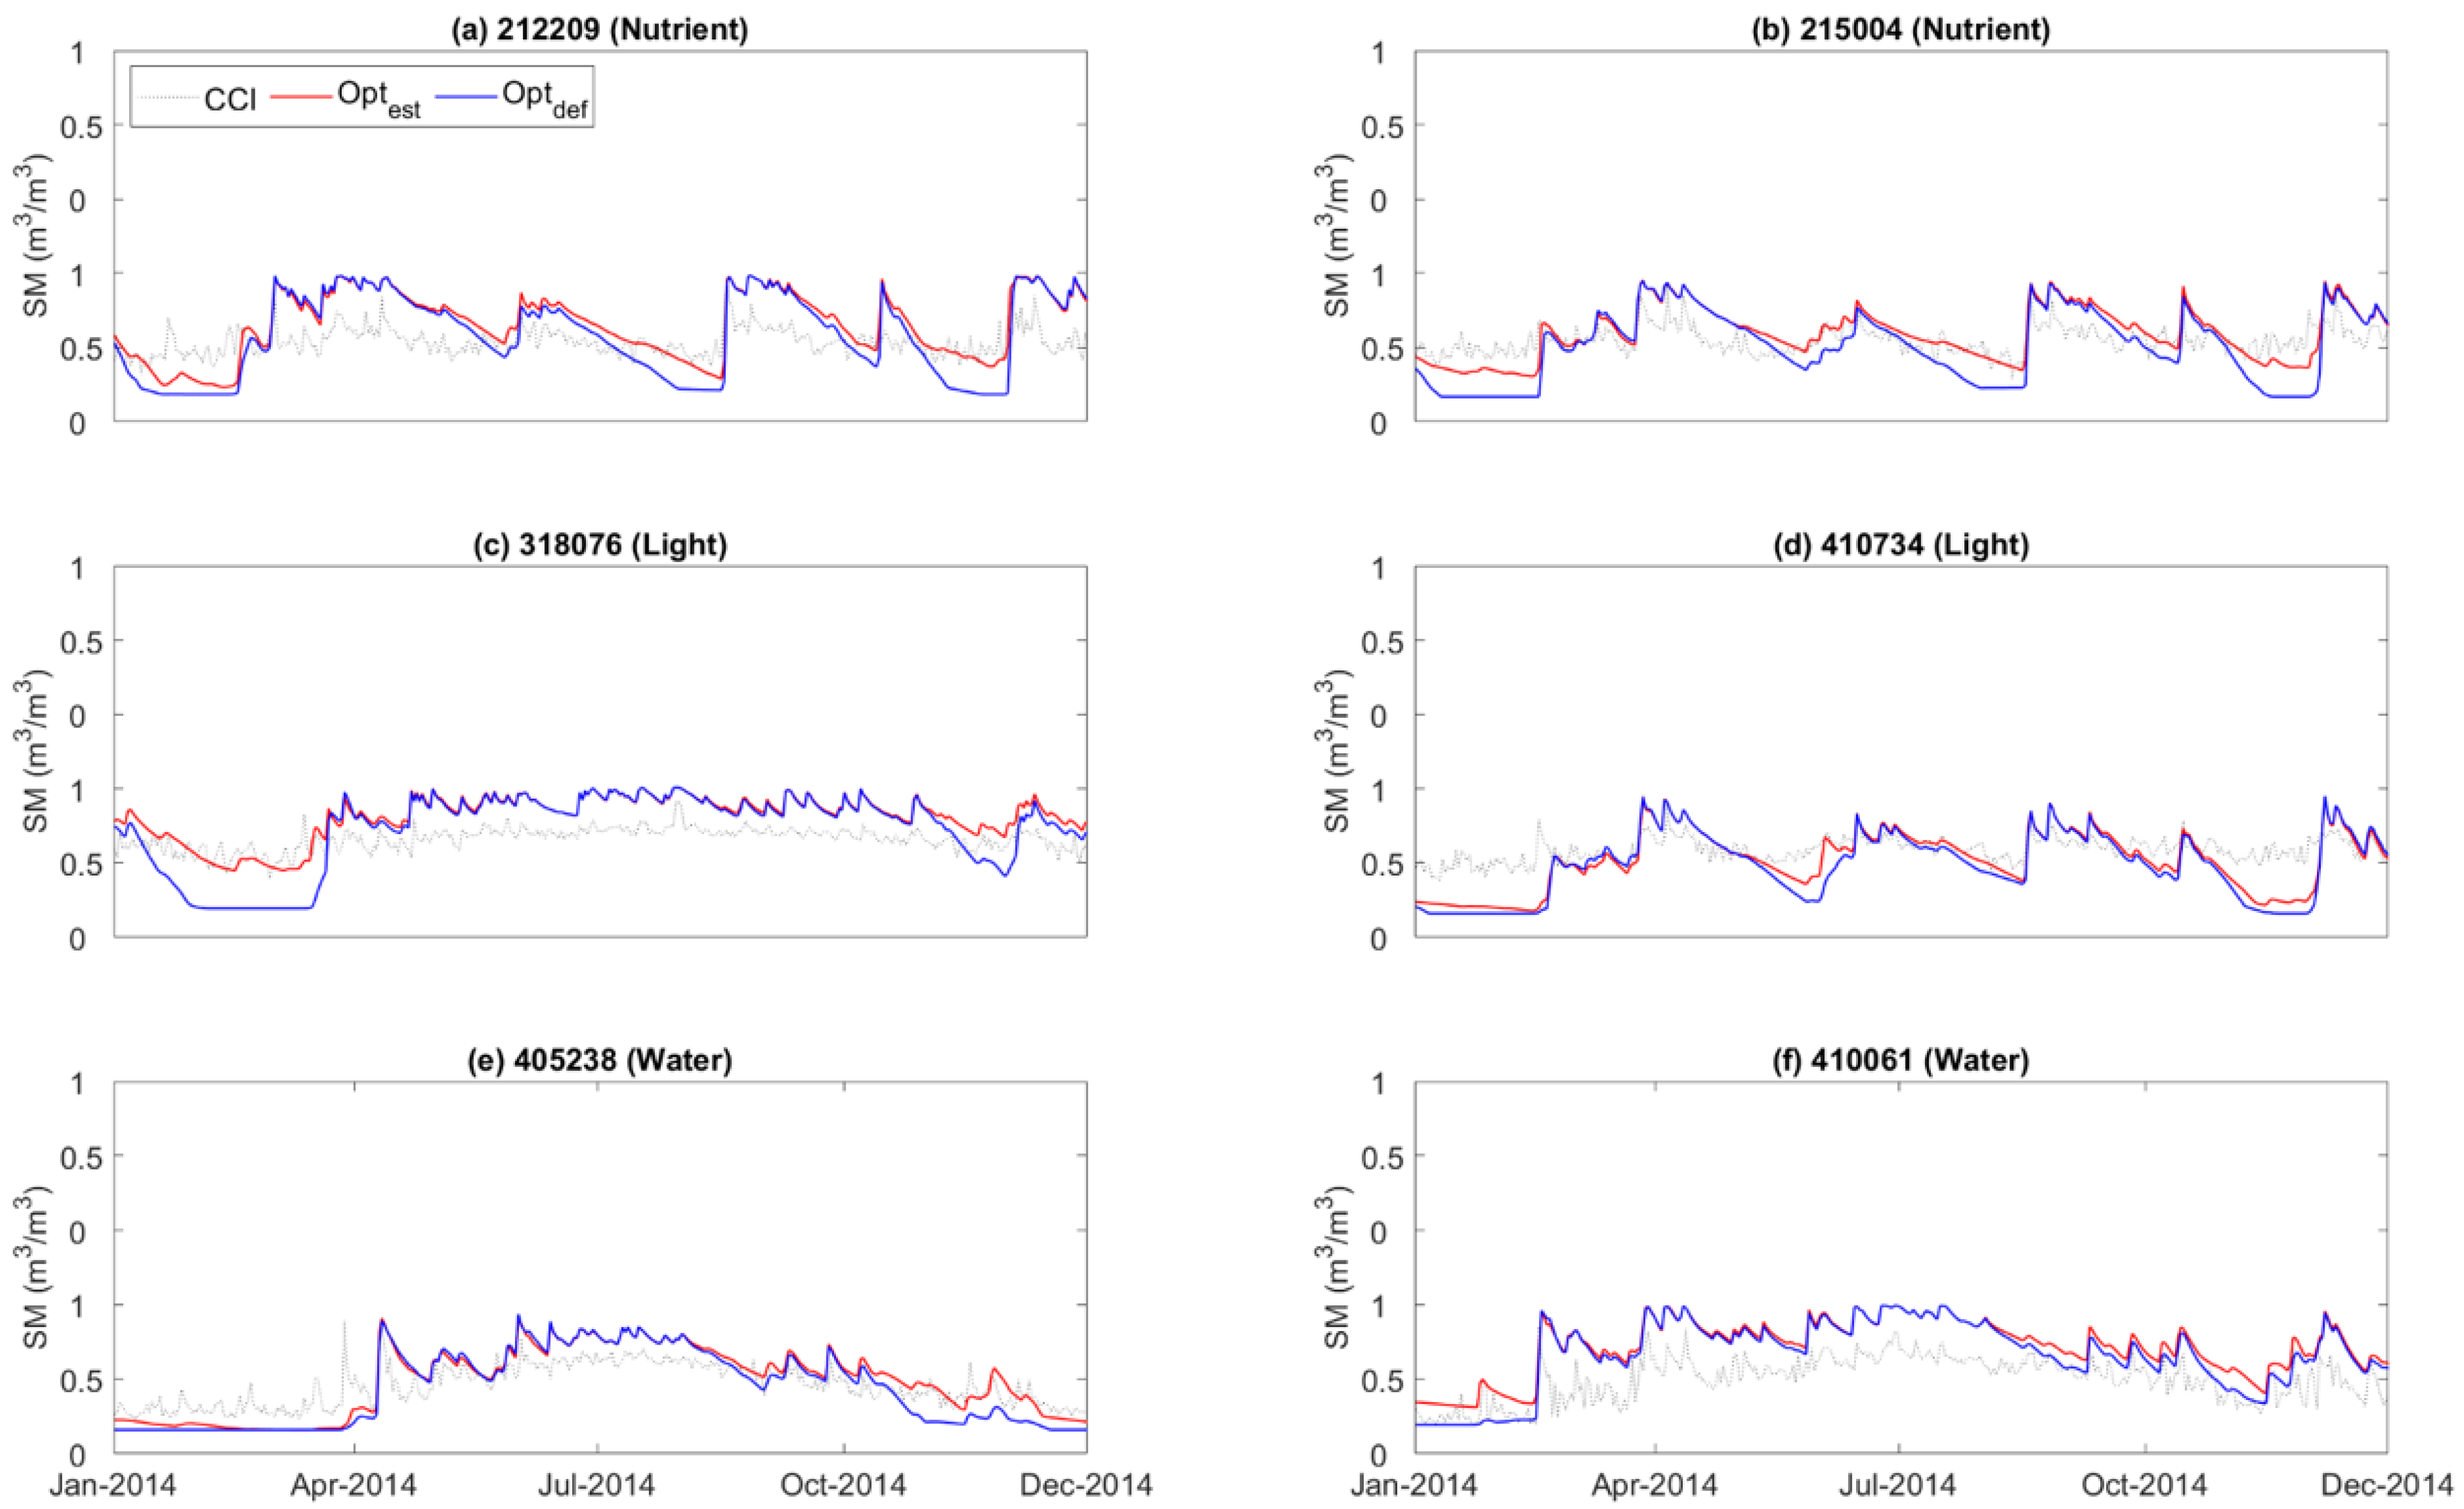
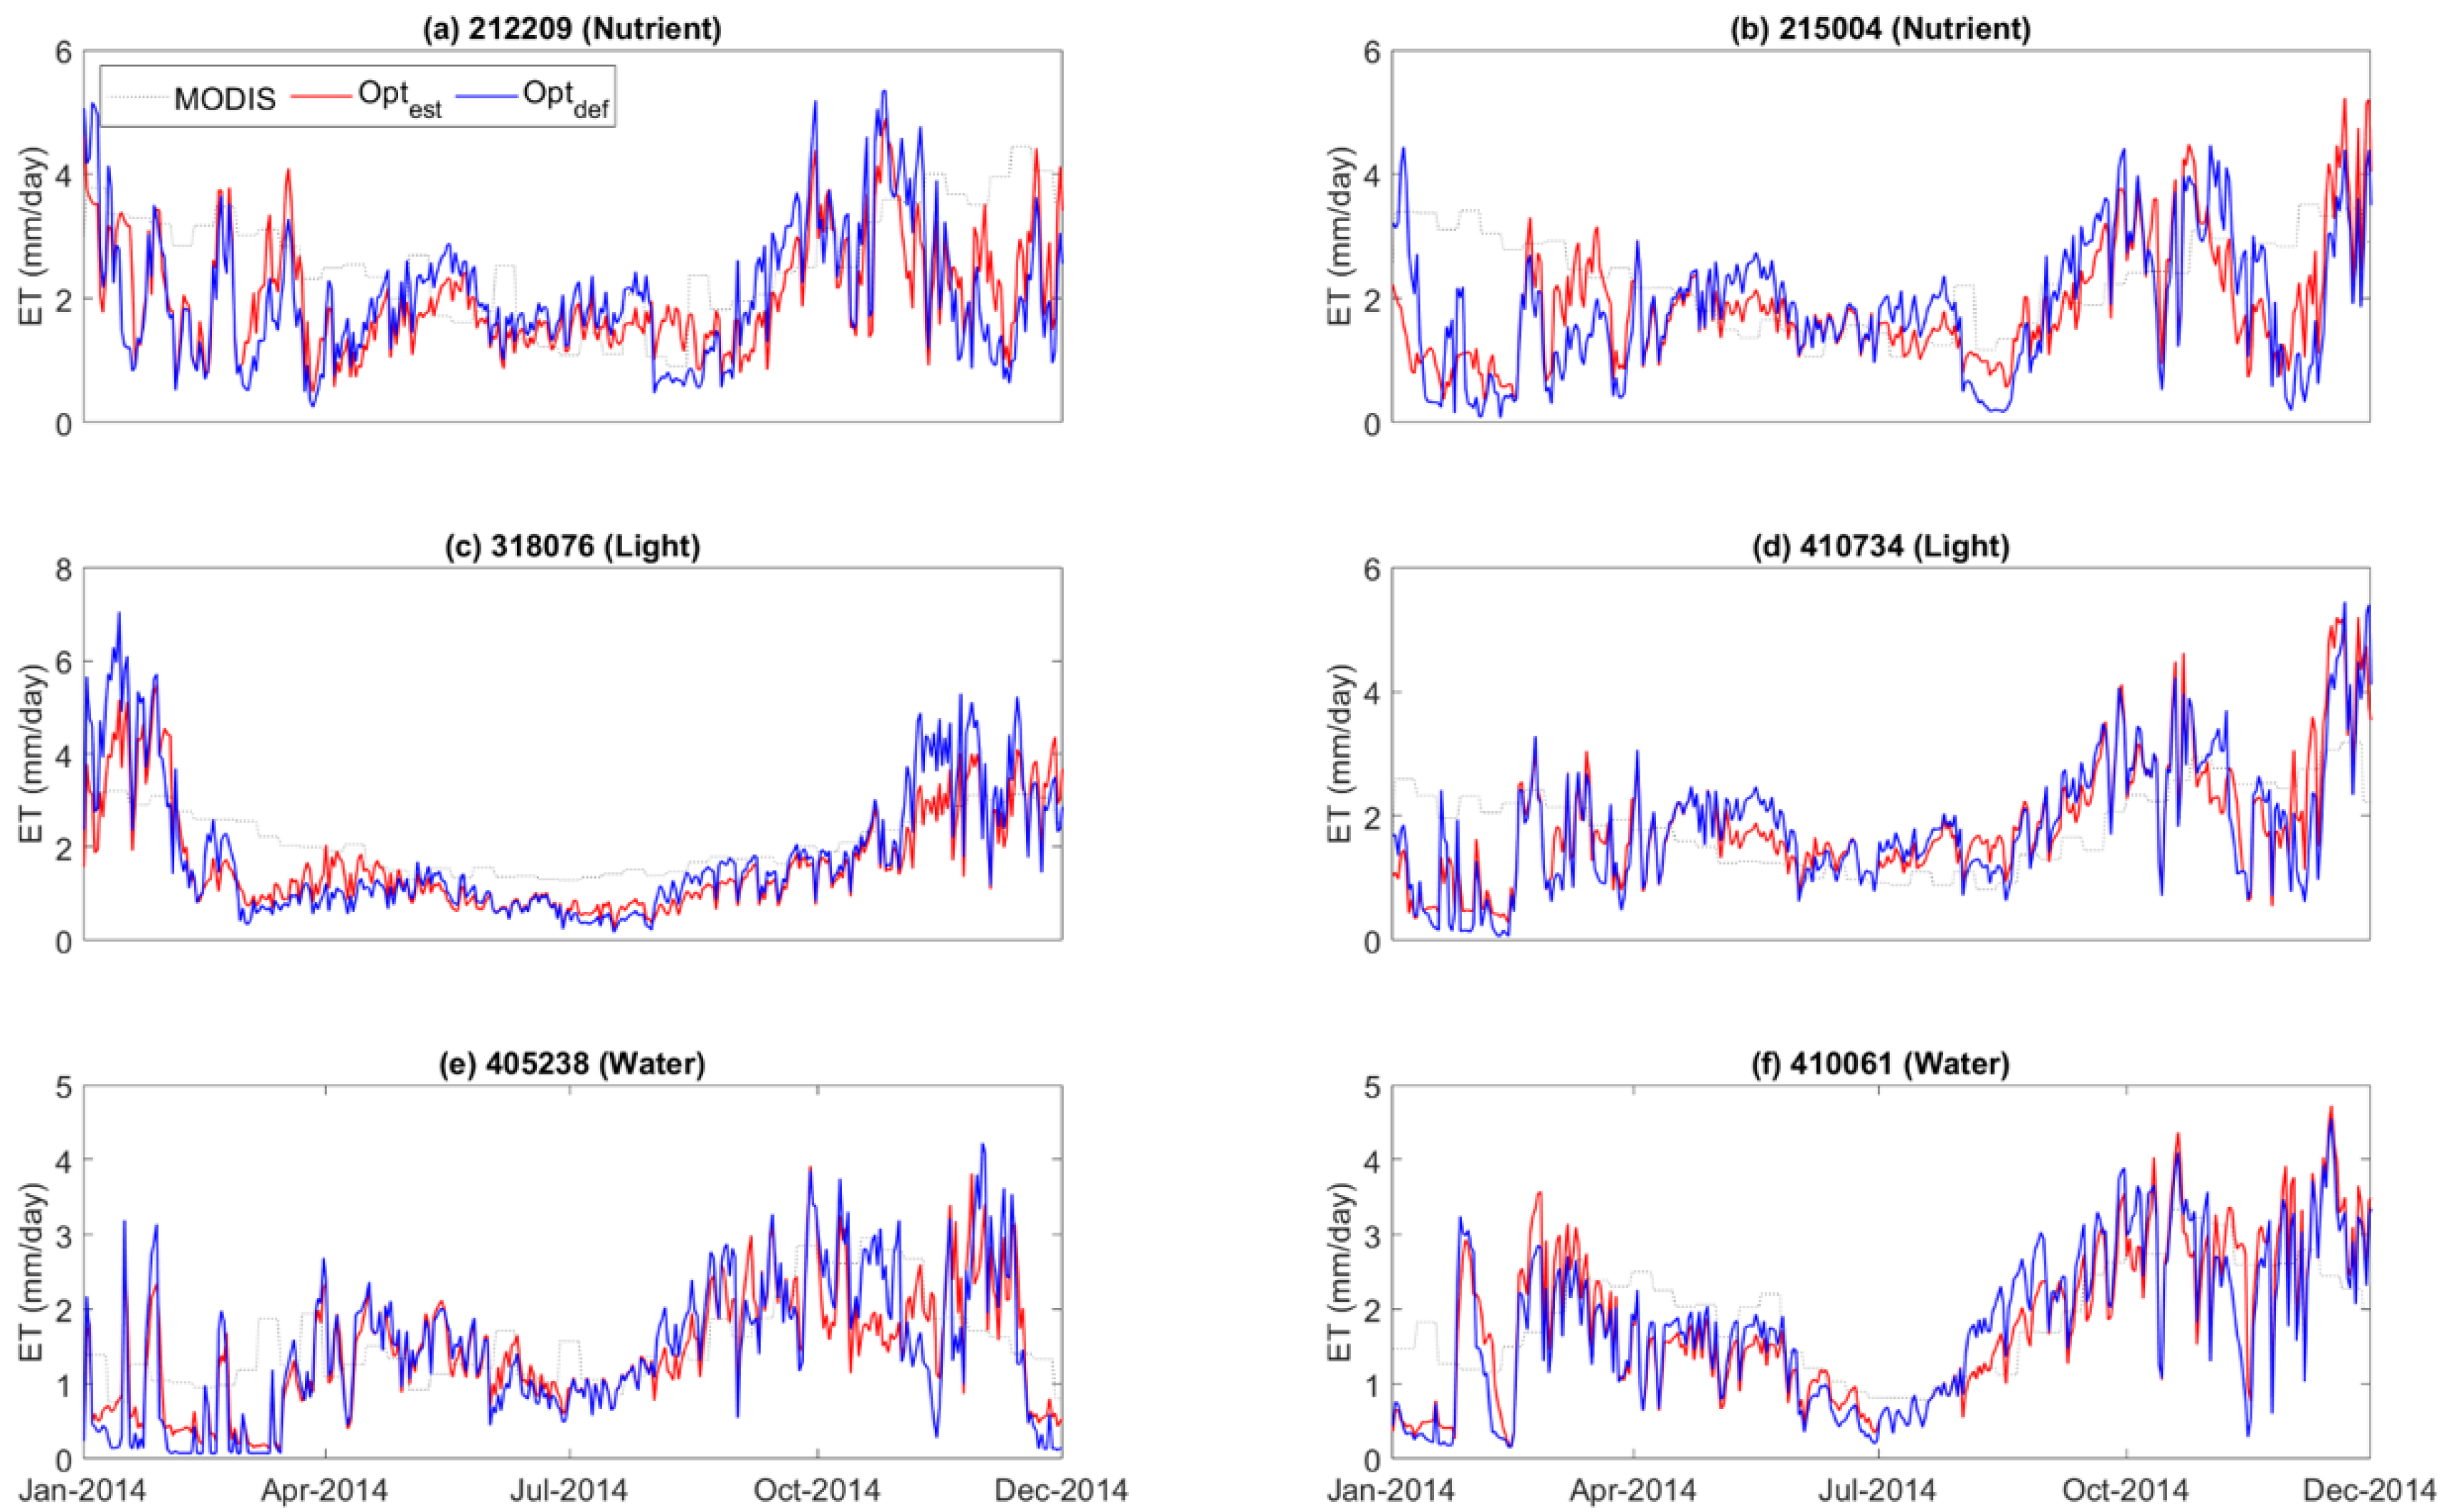
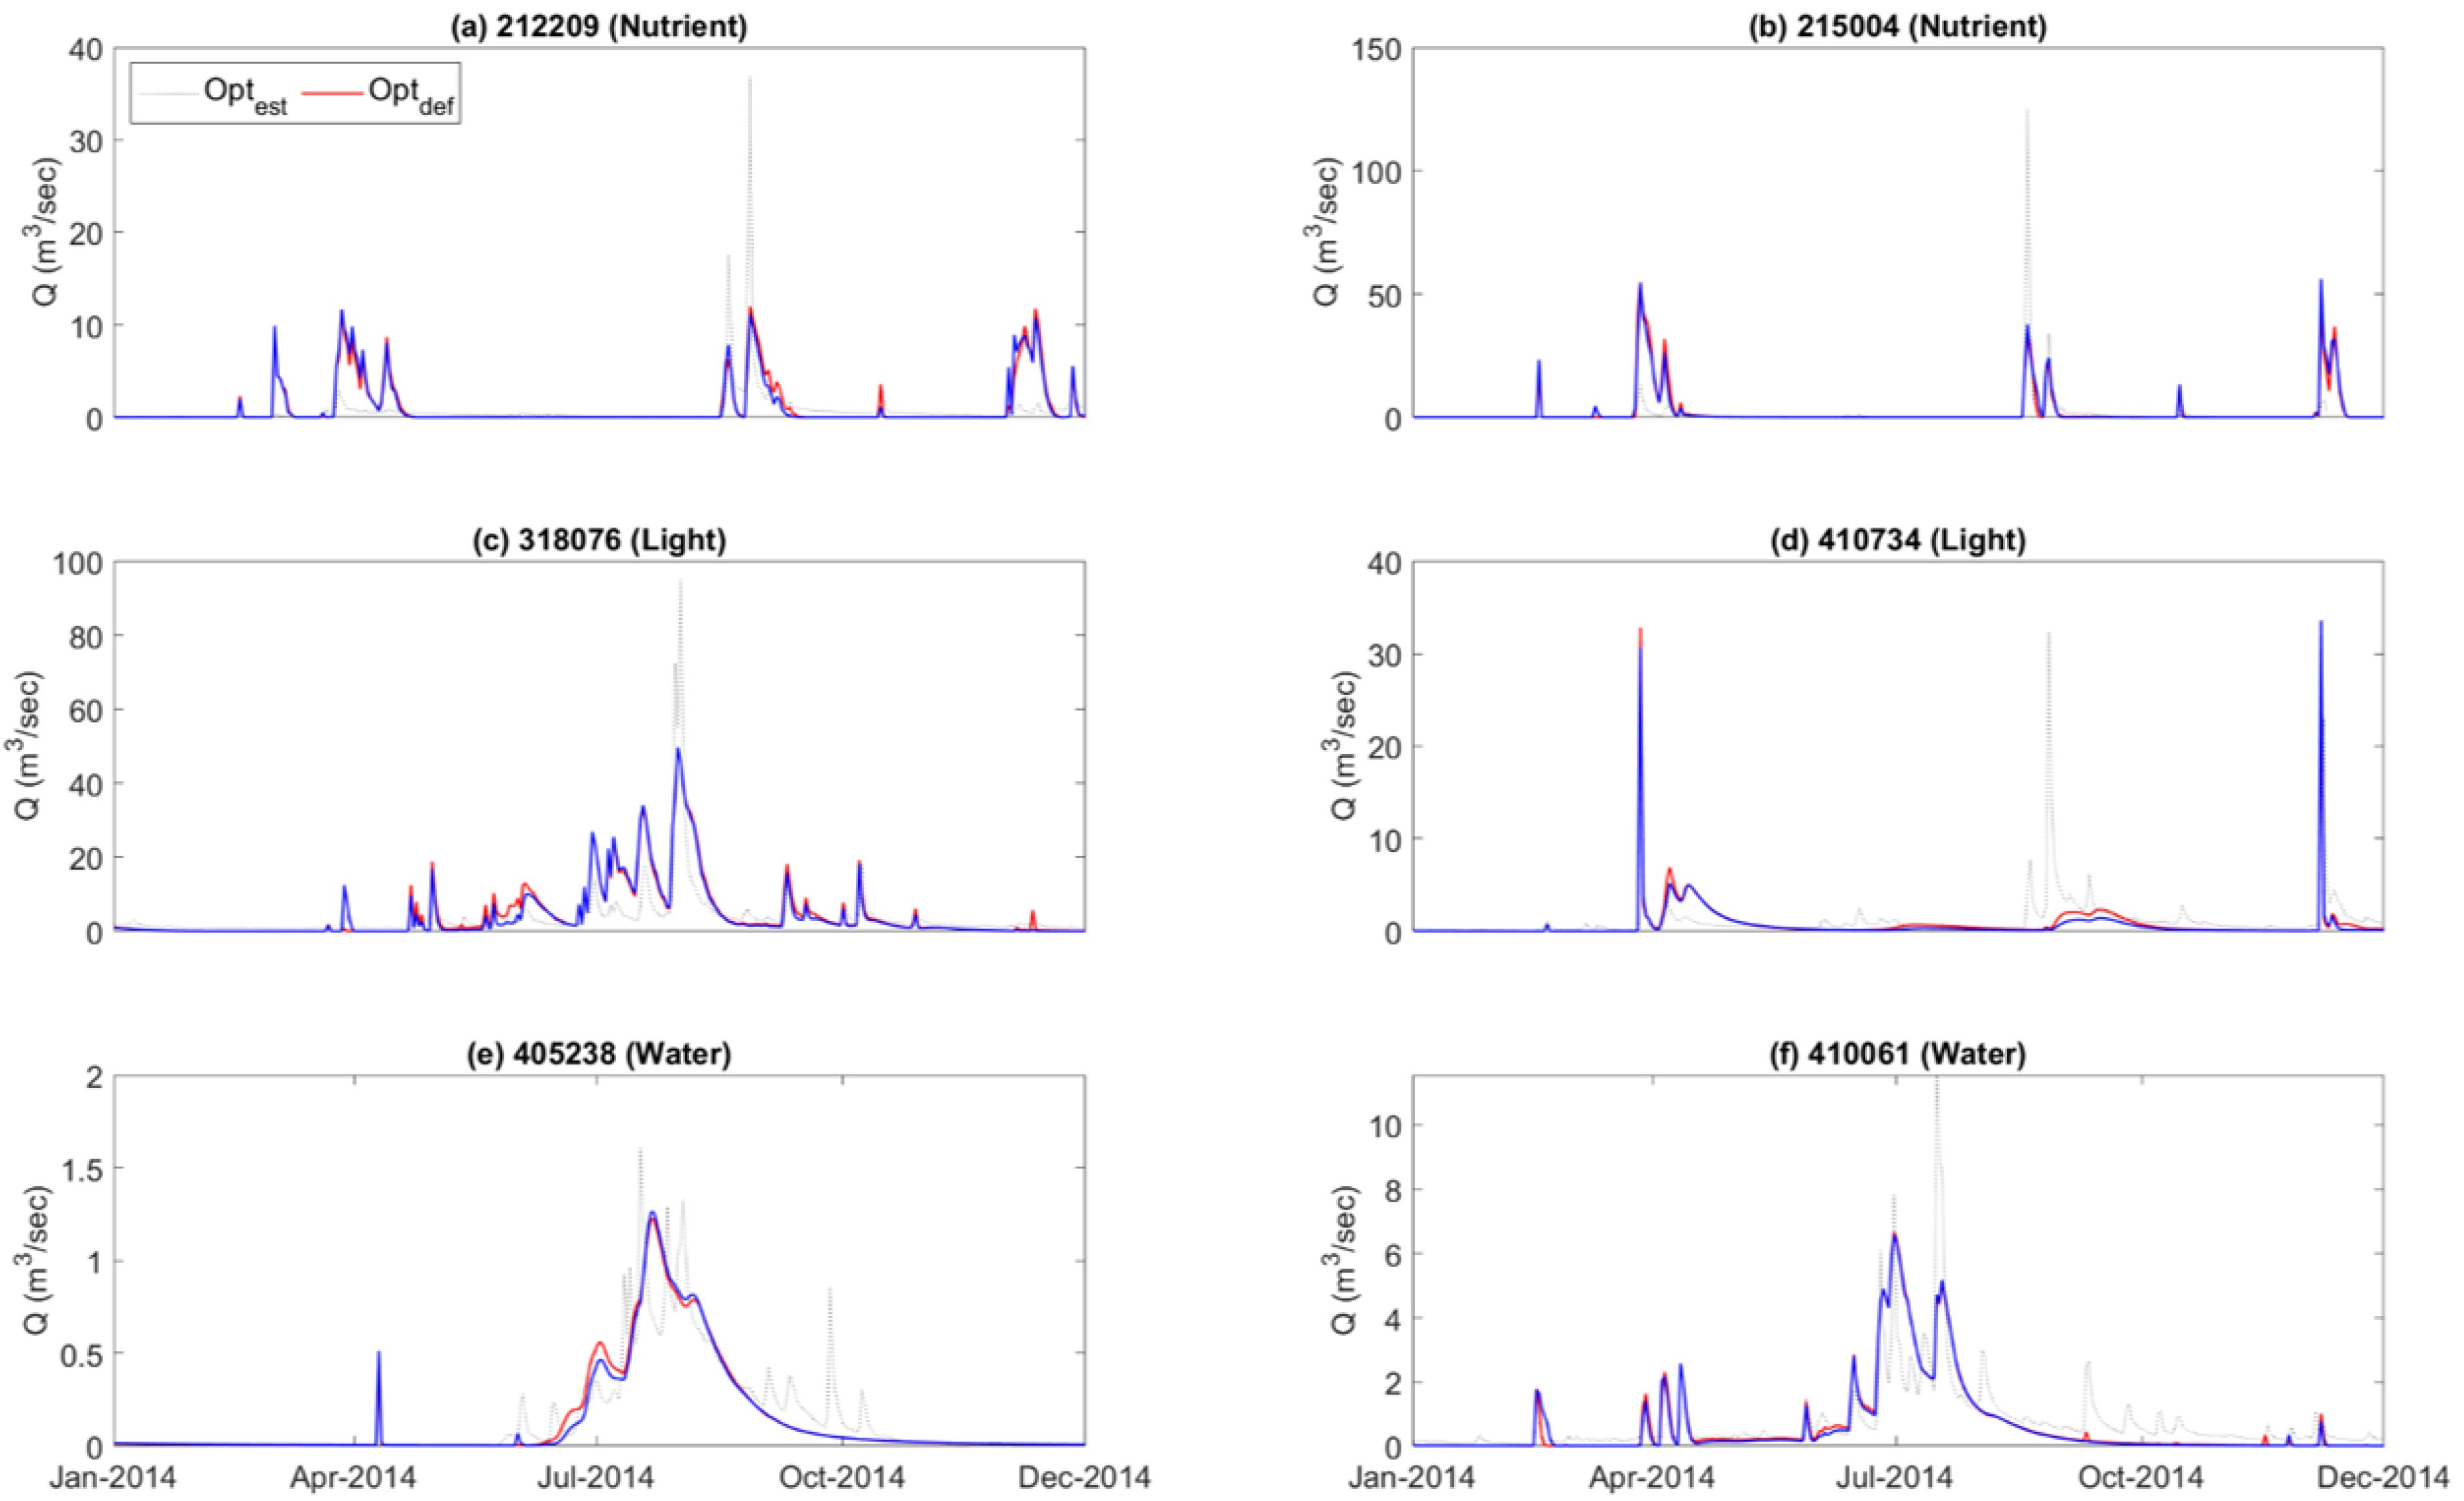
To further investigate the results, time series of satellite-derived and simulated SM, ET and Q are presented in Figure 3, Figure 4 and Figure 5. Note that for better interpretation and visualization, only 1-year (i.e., 2014) of simulated results were presented for the Opt est and Opt def scenarios. As shown in Figure 3a–f, Opt def parameterization frequently underestimates top layer soil moisture compared to Opt est , especially during the dry period from January to May, while similar performance during very wet periods are also observed. Underestimation of top layer soil moisture further decreases deep drainage from root zone in models parameterized with Opt def . For the ET simulation results (Figure 4a–f), underestimations of SM during dry periods for Opt def results in ET overestimation. Again, both Opt est and Opt def do not show significant differences in the water-limited catchments (A1) despite differences in vegetation types. However, the differences in performance are larger for the nutrient-limited catchments (B1). For the Q simulation results (Figure 5a–f), it should be noted that the area weighted total runoff from all sub-basins instead of routed runoff does not properly represent the observed Q with attenuated and transformed peaks. In particular, these distortions are most noticeable in flows from the largest catchment (410734), and the two water-limited catchments (405238 and 410061) where small to medium peaks during the recession periods are disappearing. Despite these limitations, differences in the Q simulations by Opt est and Opt def are detectable in the rise and recession stages of Q. Small to moderated flow events from Opt est tends to be higher than that of Opt def , which can be explained by the under- and overestimations of SM and ET by Opt def , respectively.
While general conclusions cannot be drawn regarding the impacts of LAI dynamics on simulated hydrologic fluxes in ecohydrologically contrasted catchments given the limited number of study catchments, our results indicate improvements in overall model performance across the board. Further investigation is needed to show whether these conclusions hold across other ecohydrologically contrasted catchments. It should be noted that the impacts of LAI dynamics on simulated model states and fluxes depend on model structure as well, which is not explored here.

3.3. Saptial Variability of SM and ET

In this section, we further compared the spatial variability of SM and ET derived from Opt est and Opt def at 318076 catchment. The reasons for selecting 318076 catchment are that the catchment size is relatively large (379.8 km2) and improvements in simulated SM and ET are considerable compared to other catchments. As presented in Figure 6a, the elevation of 318076 catchment varies from 300 to 1500 m. Most of the land cover of this catchment consists of forest (88%) except for the southeastern highland area covered by grasslands (Table 1), and has considerably lower mean LAI than other regions (Figure 6b). Because of this spatial heterogeneity, different SM and ET values over the region are generally expected.
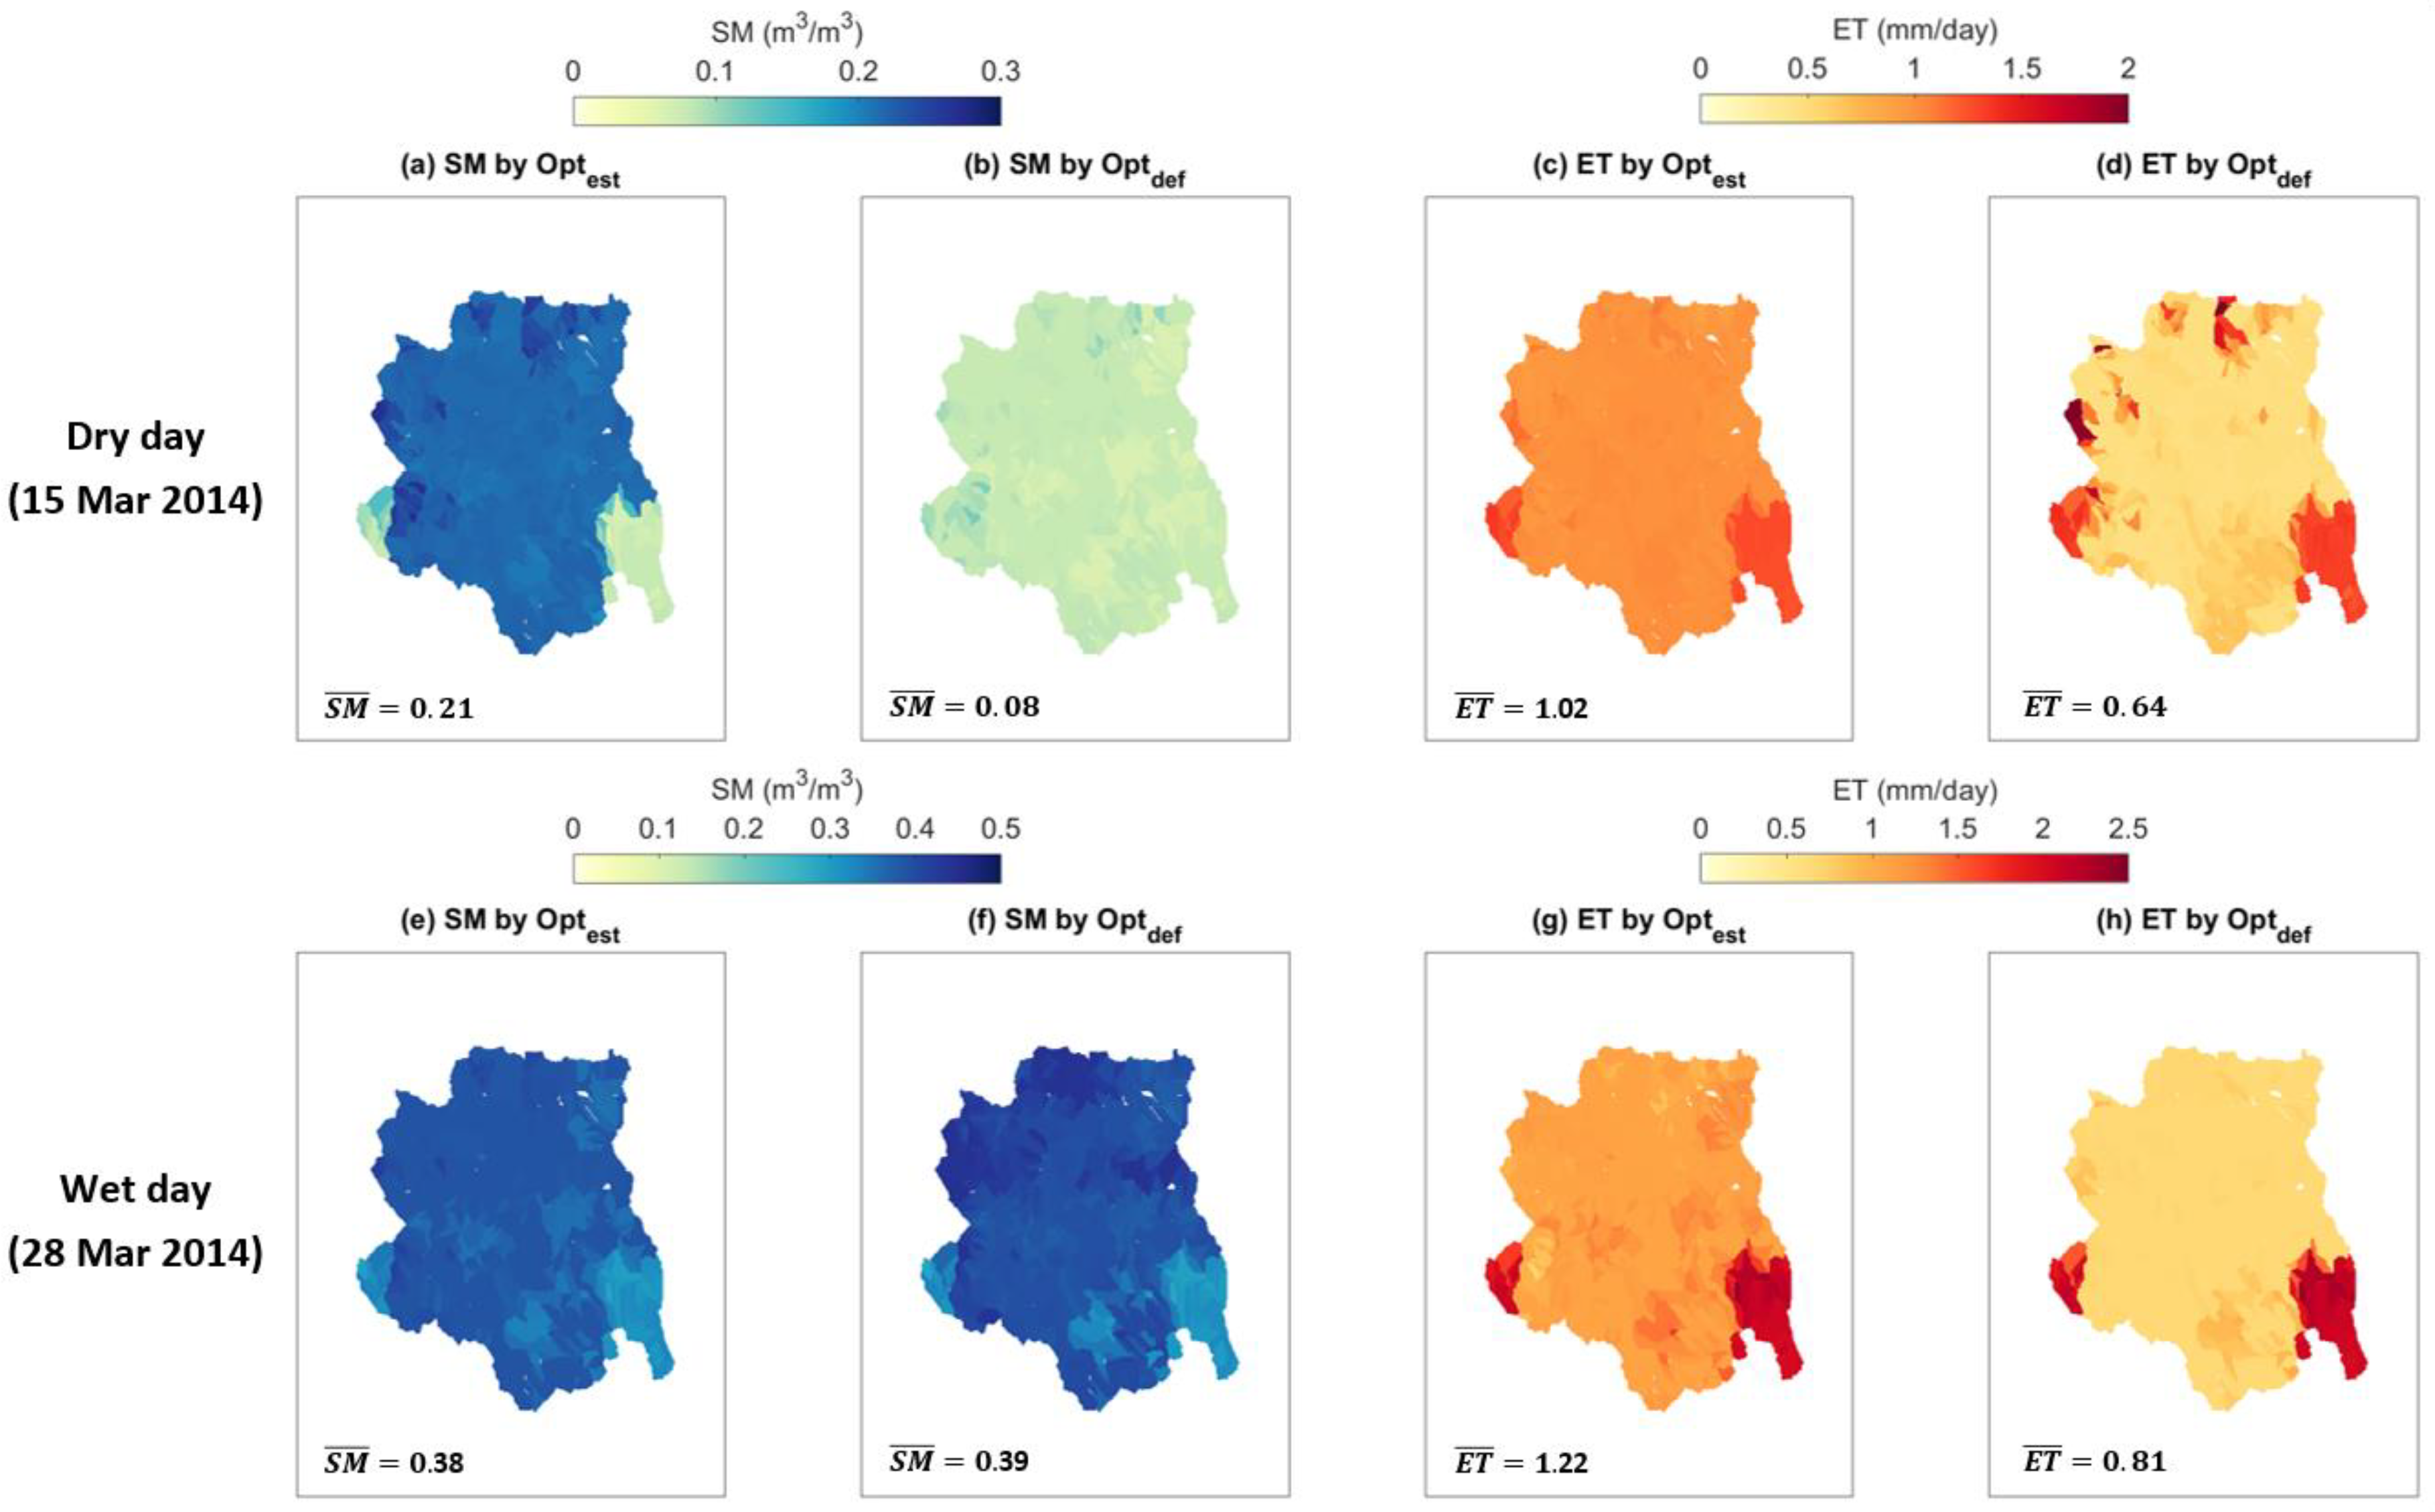
For comparisons, we selected two contrasting days with extreme dryness and wetness within the one-year period (2014), 15 March 2014 and 28 March 2014, respectively (Figure 7).
First, we performed two-sided paired t-tests at a significance level of 0.05 for the four pairs in Figure 7., i.e., a–b, c–d, e–f, and g–h, with the null hypothesis of the same mean for each pair. Results indicate that the mean values are significantly different (p-value < 0.05) for all pairs. In terms of the spatial patterns of SM and ET simulated by the two options, the differences in the dry day are larger than the wet day. This result is well explained by the spatial correlation coefficient of SM (ET) on the dry day which is 0.16 (0.77) and in the wet day is 0.89 (0.96). There are considerable differences in the mean and spatial pattern of SM during the dry day (Figure 7a,b) and the SM underestimation is explained in Section 3.2 and Figure 3.
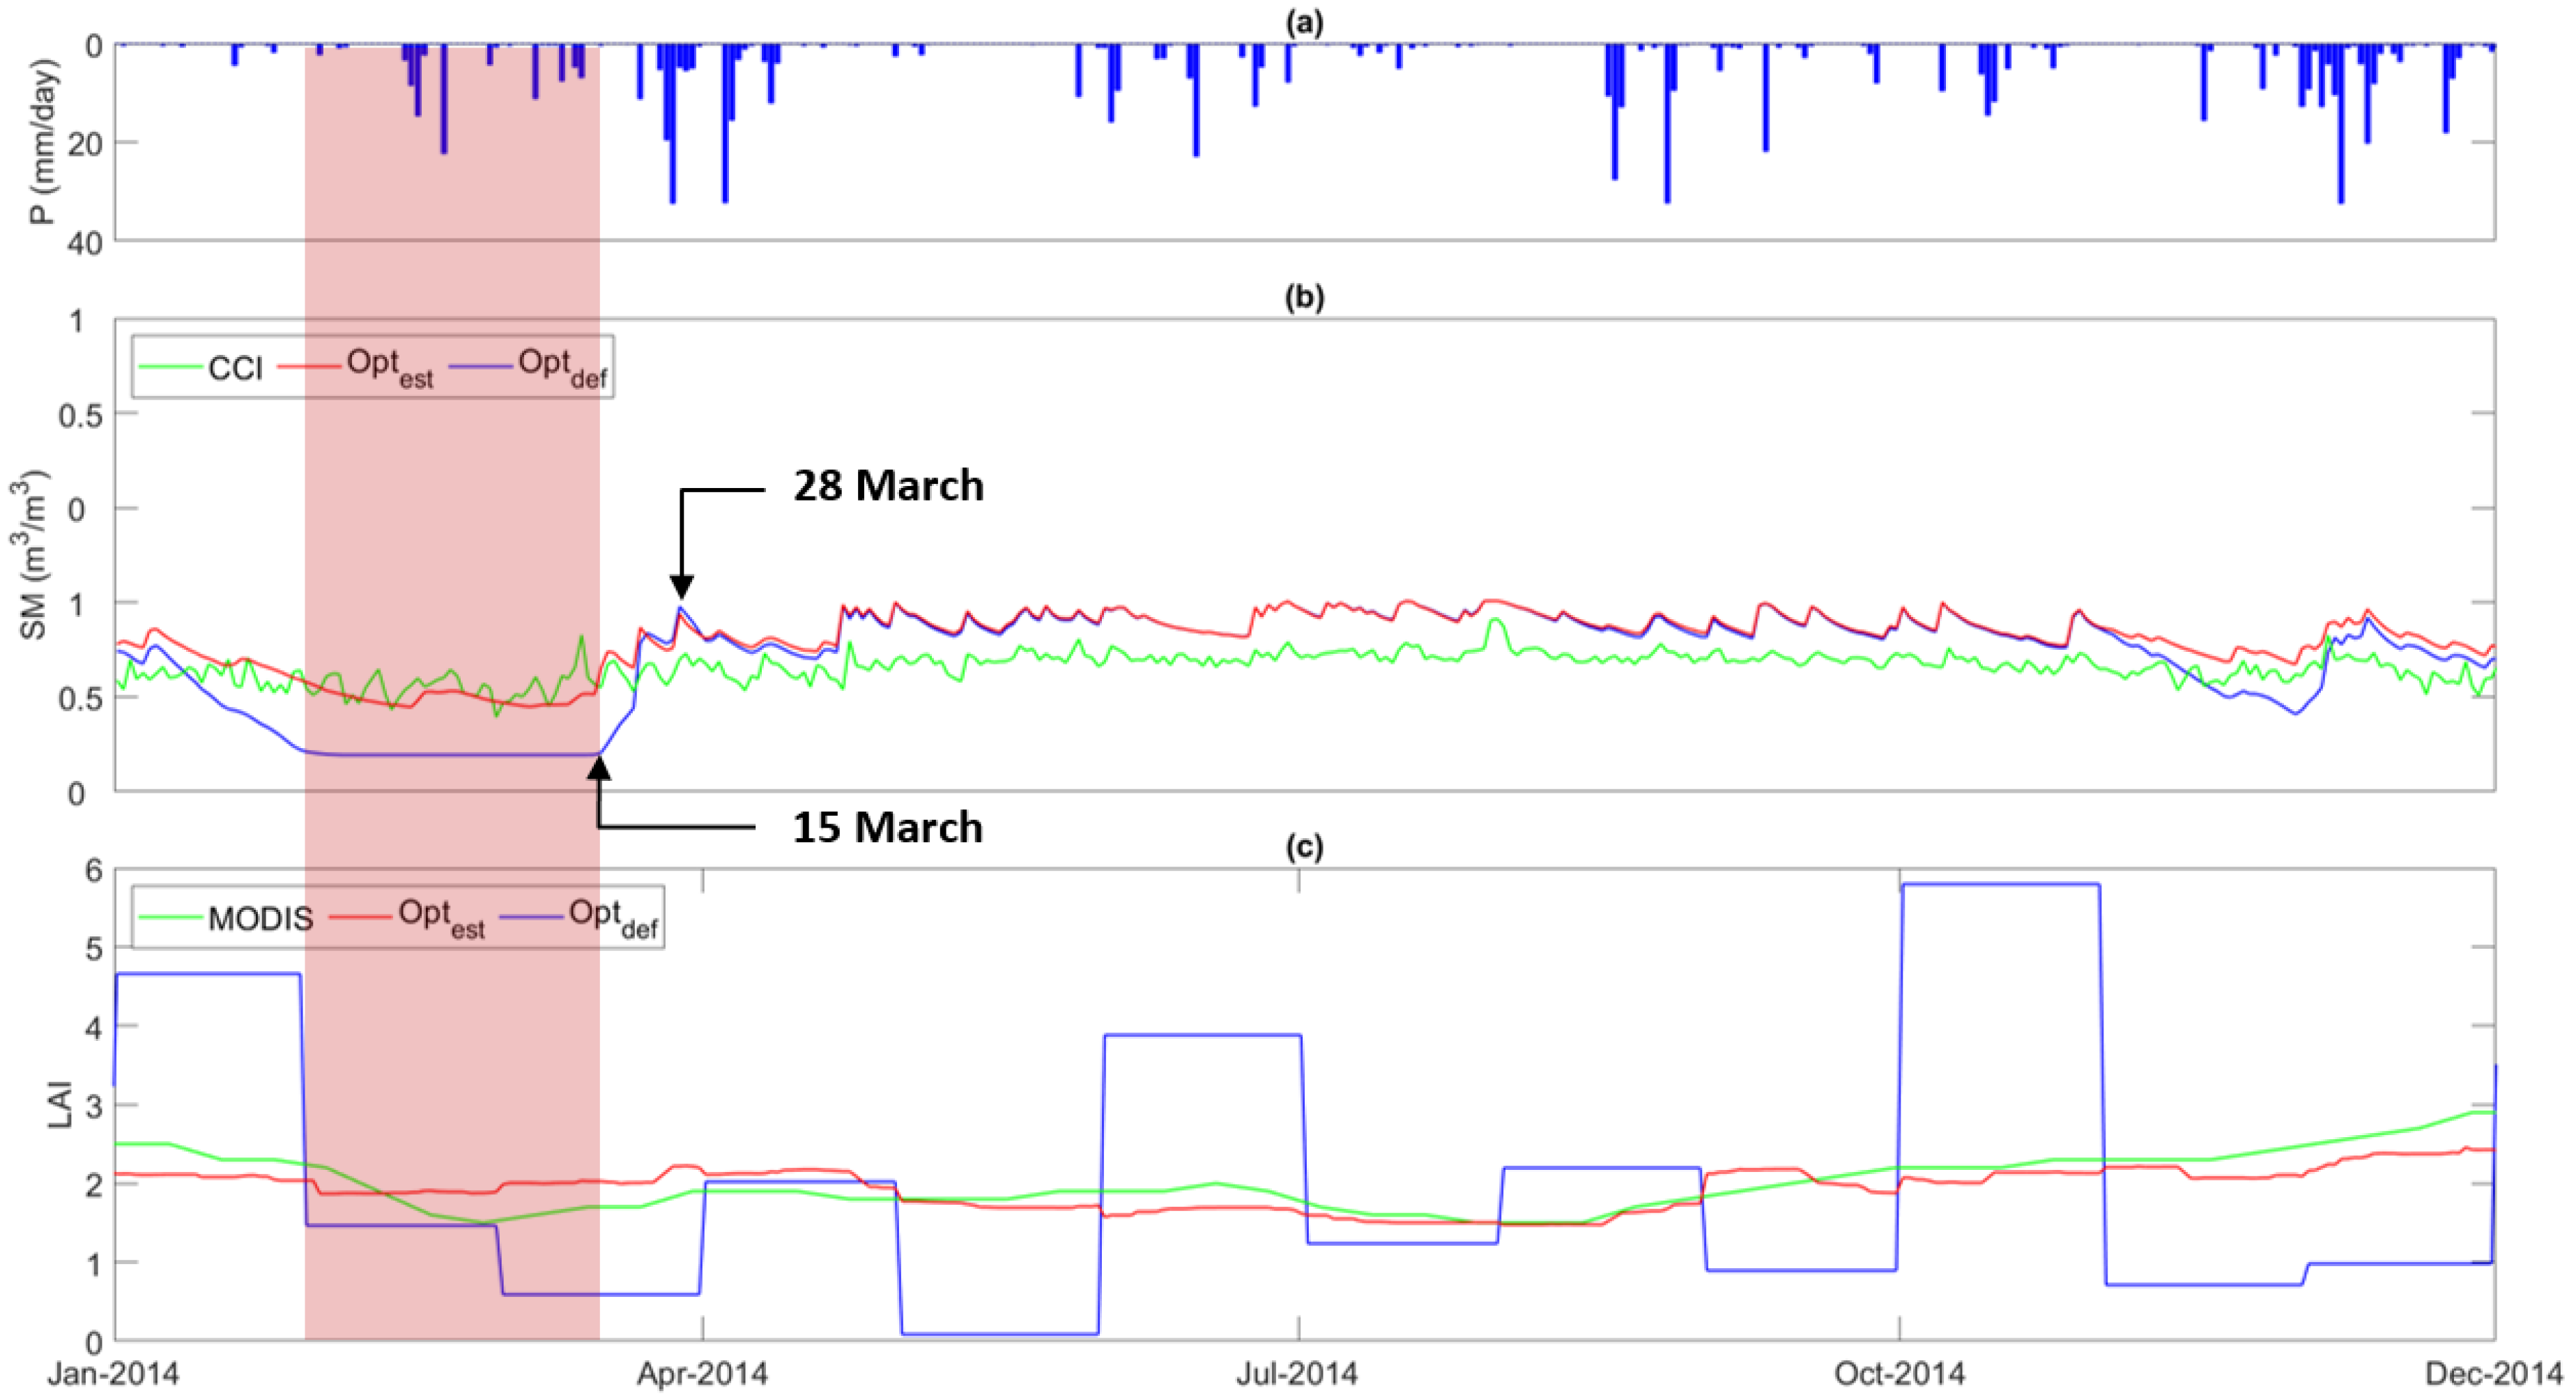
This underestimated SM by Opt def can be explained by low LAI values estimated by Equation (1) over the two-month period from February to March (shaded area in Figure 8) while the MODIS LAI smoothly changes over that period. Lower LAI values in the default vegetation parameterization method ( Opt def ) results in drier soil layer as shown again in November. The proposed method ( Opt est ) compensates for these shortcomings and produces improved simulation results.

3.4. Caveats and Follow-Up Studies

In spite of the simplicity in the LAI modeling and improvements in the catchment-scale simulations, it is worth addressing the following improvements for practical applications of this framework in any hydrologic model.
First, the global monthly mean leaf area index climatology derived from more than three decades (1981–2015) of bi-weekly LAI data from the advanced very-high -resolution radiometer (AVHRR) gridded at 0.25° [78] could be an alternative dataset to the 12-year MODIS LAI data used herein for parameter estimation and obtaining the monthly mean LAI climatology. Second, we presented optimized k values for the six primary MODIS land covers as shown in Figure 2e. However, large uncertainties exist for k values for shrub, grass, and croplands indicating consideration of a more detailed land cover map may reduce uncertainty of estimated parameters for hydrologic modeling. Third, although we have shown simulated discharge from the different vegetation parameterization approaches, the results from large catchments raise the need for developing a streamflow routing module in SMART. Fourth, given the uncertainty of the reference datasets, it is necessary to use multiple data sources for a more comprehensive validation of ET and SM simulations [29,79,80]. Lastly, further improvements can be achieved by increasing the complexity of the LAI estimation model to include more climate variables, calibration parameters and/or use other model structures.

4. Conclusions

In this study, a method was proposed for effectively incorporating LAI dynamics in a hydrologic model, SMART, by only using monthly mean LAI climatology and rainfall data over a region. The presented method adopts a simple sigmoid model that scales the monthly mean LAI climatology to a lower/higher value using a temporally aggregated rainfall amount and a parameter called k that control LAI-rainfall sensitivity. Here, the k parameter was optimized by maximizing the Pearson correlation coefficient between the estimated and satellite-derived LAI time series. It was found that forest, woodlands, and unvegetated regions have smaller k values, and present less sensitivity to the rainfall amounts compared to shrublands, grasslands and croplands that are more sensitive.
Surface soil moisture and evapotranspiration simulations illustrated that the proposed LAI estimation method performs almost identical to the case where the satellite-derived LAI time series over the six eco-hydrologically contrasted catchments in Australia are used. In nutrient/light limited catchments (B1 and B2), generally, correlation coefficients between simulated and observed SM and ET are improved by more than 10% compared to the default option in SMART. However, the choice of the LAI model did not impact SM and ET simulations in A1 catchments where vegetation productivity is water-limited. The differences in the discharge simulations by the default and proposed methods are noticeable during the rise and recession stages of hydrographs. Small to moderated flowrates from the proposed method are larger than that of the default method, which can be explained by the under-and overestimations of SM and ET by the default method during dry periods. The proposed LAI parametrization method compensates for the shortcomings of the default method which underestimates LAI and SM during dry periods. This can improve simulations especially in future climates given documented shifts towards more arid landscapes and drier pre-storm antecedent conditions that have been noted in the literature [81,82].
The LAI parameter estimation and model evaluations results showed promise, with possibilities of extension to other hydrologic models that need to include vegetation dynamics for periods or regions where satellite data are unavailable.

Author Contributions

Conceptualization, S.K., H.A., and A.S.; methodology, S.K. and H.A.; software, H.A.; validation, S.K. and H.A.; formal analysis, S.K.; investigation, S.K.; resources, S.K. and H.A.; data curation, S.K.; writing—original draft preparation, S.K.; writing—review and editing, H.A. and A.S.; visualization, S.K.; supervision, A.S.; project administration, S.K. and A.S.; funding acquisition, A.S. All authors have read and agreed to the published version of the manuscript.

Funding

This work has been undertaken as part of a Linkage Project (LP160100620) “Adapting catchment monitoring and potable water treatment to climate change” and we appreciate the funders, Australian Research Council, WaterNSW and Sydney Water.

Acknowledgments

We thank all contributors to the datasets used in this study, particularly, the Bureau of Meteorology (BoM) Australia, the National Aeronautics and Space Administration (NASA), Geoscience Australia (GA) the Commonwealth Scientific and Industrial Research Organization (CSIRO) and the European Space Agency Climate Change Initiative (ESA CCI). The data sets can be freely obtained as follows. The MODIS LAI, land cover and ET data from the NASA Earthdata website: https://earthdata.nasa.gov/, the AWAP rainfall and AWRA-L PET data from the BoM website: http://www.bom.gov.au/jsp/awap/rain/index.jsp, the DEM data from the GA website: http://www.ga.gov.au/scientific-topics/national-location-information/digital-elevation-data, the soil data from the CSIRO data portal: https://data.csiro.au/dap/home?execution=e1s1 and the SM data from ESA CCI: http://www.esa-soilmoisture-cci.org/.

Conflicts of Interest

The authors declare no conflict of interest.

References

  1. Ukkola, A.M.; Keenan, T.F.; Kelley, D.I.; Prentice, I.C. Vegetation plays an important role in mediating future water resources. Environ. Res. Lett. 2016, 11, 094022. [Google Scholar] [CrossRef] [Green Version]
  2. Bonan, G.B.; Pollard, D.; Thompson, S.L. Effects of boreal forest vegetation on global climate. Nature 1992, 359, 716–718. [Google Scholar] [CrossRef]
  3. Yuan, X.; Wang, W.; Cui, J.; Meng, F.; Kurban, A.; De Maeyer, P. Vegetation changes and land surface feedbacks drive shifts in local temperatures over Central Asia. Sci. Rep. 2017, 7, 3287. [Google Scholar] [CrossRef] [PubMed] [Green Version]
  4. Tesemma, Z.K.; Wei, Y.; Peel, M.C.; Western, A.W. The effect of year-to-year variability of leaf area index on Variable Infiltration Capacity model performance and simulation of runoff. Adv. Water Resour. 2015, 83, 310–322. [Google Scholar] [CrossRef] [Green Version]
  5. Peel, M.C. Hydrology: Catchment vegetation and runoff. Prog. Phys. Geogr. Earth Environ. 2009, 33, 837–844. [Google Scholar] [CrossRef]
  6. Yang, C.; Yu, Z.; Hao, Z.; Lin, Z.; Wang, H. Effects of Vegetation Cover on Hydrological Processes in a Large Region: Huaihe River Basin, China. J. Hydrol. Eng. 2013, 18, 1477–1483. [Google Scholar] [CrossRef]
  7. Ajami, H.; Sharma, A.; Band, L.E.; Evans, J.P.; Tuteja, N.K.; Amirthanathan, G.E.; Bari, M.A. On the non-stationarity of hydrological response in anthropogenically unaffected catchments: An Australian perspective. Hydrol. Earth Syst. Sci. 2017, 21, 281–294. [Google Scholar] [CrossRef] [Green Version]
  8. Tague, C.; Band, L. RHESSys: Regional Hydro-Ecologic Simulation System—An object-oriented approach to spatially distributed modeling of carbon, water, and nutrient cycling. Earth Interact. 2004, 8, 1–42. [Google Scholar] [CrossRef]
  9. Fatichi, S.; Ivanov, V.; Caporali, E. A mechanistic ecohydrological model to investigate complex interactions in cold and warm water-controlled environments: 1. Theoretical framework and plot-scale analysis. J. Adv. Model. Earth Syst. 2012, 4. [Google Scholar] [CrossRef]
  10. Tang, Y.; Marshall, L.; Sharma, A.; Ajami, H. A Bayesian alternative for multi-objective ecohydrological model specification. J. Hydrol. 2018, 556, 25–38. [Google Scholar] [CrossRef]
  11. Asbjornsen, H.; Goldsmith, G.R.; Alvarado-Barrientos, M.S.; Rebel, K.; Van Osch, F.P.; Rietkerk, M.; Chen, J.; Gotsch, S.; Tobón, C.; Geissert, D.R.; et al. Ecohydrological advances and applications in plant–water relations research: A review. J. Plant Ecol. 2011, 4, 3–22. [Google Scholar] [CrossRef]
  12. Donohue, R.; Roderick, M.; McVicar, T.R. On the importance of including vegetation dynamics in Budyko? s hydrological model. Hydrol. Earth Syst. Sci. Discuss. 2006, 3, 1517–1551. [Google Scholar] [CrossRef] [Green Version]
  13. Arora, V. Modeling vegetation as a dynamic component in soil-vegetation-atmosphere transfer schemes and hydrological models. Rev. Geophys. 2002, 40. [Google Scholar] [CrossRef] [Green Version]
  14. Wigmosta, M.S.; Vail, L.W.; Lettenmaier, D.P. A distributed hydrology-vegetation model for complex terrain. Water Resour. Res. 1994, 30, 1665–1679. [Google Scholar] [CrossRef]
  15. Liang, X.; Lettenmaier, D.P.; Wood, E.F.; Burges, S.J. A simple hydrologically based model of land surface water and energy fluxes for general circulation models. J. Geophys. Res. Atmos. 1994, 99, 14415–14428. [Google Scholar] [CrossRef]
  16. Simunek, J.J.; Šejna, M.; Saito, H.; Sakai, M.; Van Genuchten, M. The Hydrus-1D Software Package for Simulating the Movement of Water, Heat, and Multiple Solutes in Variably Saturated Media. Version 4.17, HYDRUS Software Series 3. Department of Environmental Sciences, University of California Riverside: Riverside, CA, USA, 2013. Available online: https://www.pc-progress.com/Downloads/Pgm_Hydrus1D/HYDRUS1D-4.17.pdf(accessed on 18 September 2020).
  17. Ritchie, J.T. Model for predicting evaporation from a row crop with incomplete cover. Water Resour. Res. 1972, 8, 1204–1213. [Google Scholar] [CrossRef] [Green Version]
  18. Ford, T.W.; Quiring, S.M. Influence of MODIS-derived dynamic vegetation on VIC-simulated soil moisture in Oklahoma. J. Hydrometeorol. 2013, 14, 1910–1921. [Google Scholar] [CrossRef]
  19. Donohue, R.J.; Roderick, M.L.; McVicar, T.R. Roots, storms and soil pores: Incorporating key ecohydrological processes into Budyko’s hydrological model. J. Hydrol. 2012, 436, 35–50. [Google Scholar] [CrossRef]
  20. Li, D.; Pan, M.; Cong, Z.; Zhang, L.; Wood, E. Vegetation control on water and energy balance within the Budyko framework. Water Resour. Res. 2013, 49, 969–976. [Google Scholar] [CrossRef]
  21. Yang, Y.; Donohue, R.J.; McVicar, T.R. Global estimation of effective plant rooting depth: Implications for hydrological modeling. Water Resour. Res. 2016, 52, 8260–8276. [Google Scholar] [CrossRef] [Green Version]
  22. Zhang, S.; Yang, Y.; McVicar, T.R.; Yang, D. An analytical solution for the impact of vegetation changes on hydrological partitioning within the Budyko framework. Water Resour. Res. 2018, 54, 519–537. [Google Scholar] [CrossRef]
  23. Wegehenkel, M. Modeling of vegetation dynamics in hydrological models for the assessment of the effects of climate change on evapotranspiration and groundwater recharge. Adv. Geosci. 2009, 21, 109–115. [Google Scholar] [CrossRef] [Green Version]
  24. Tang, Q.; Vivoni, E.R.; Muñoz-Arriola, F.; Lettenmaier, D.P. Predictability of evapotranspiration patterns using remotely sensed vegetation dynamics during the North American monsoon. J. Hydrometeorol. 2012, 13, 103–121. [Google Scholar] [CrossRef]
  25. Tesemma, Z.K.; Wei, Y.; Western, A.W.; Peel, M.C. Leaf Area Index Variation for Crop, Pasture, and Tree in Response to Climatic Variation in the Goulburn–Broken Catchment, Australia. J. Hydrometeorol. 2014, 15, 1592–1606. [Google Scholar] [CrossRef]
  26. Tesemma, Z.K.; Wei, Y.; Peel, M.C.; Western, A.W. Including the dynamic relationship between climatic variables and leaf area index in a hydrological model to improve streamflow prediction under a changing climate. Hydrol. Earth Syst. Sci. 2015, 19, 2821–2836. [Google Scholar] [CrossRef] [Green Version]
  27. Mohaideen, M.M.D.; Varija, K. Improved vegetation parameterization for hydrological model and assessment of land cover change impacts on flow regime of the Upper Bhima basin, India. Acta Geophys. 2018, 66, 697–715. [Google Scholar] [CrossRef]
  28. Ajami, H.; Khan, U.; Tuteja, N.K.; Sharma, A. Development of a computationally efficient semi-distributed hydrologic modeling application for soil moisture, lateral flow and runoff simulation. Environ. Modell. Softw. 2016, 85, 319–331. [Google Scholar] [CrossRef]
  29. Khan, U.; Ajami, H.; Tuteja, N.K.; Sharma, A.; Kim, S. Catchment Scale Simulations of Soil Moisture Dynamics Using an Equivalent Cross-Section based Hydrological Modelling Approach. J. Hydrol. 2018, 564, 944–966. [Google Scholar] [CrossRef]
  30. Khan, U.; Tuteja, N.K.; Ajami, H.; Sharma, A. An equivalent cross-sectional basis for semidistributed hydrological modeling. Water Resour. Res. 2014, 50, 4395–4415. [Google Scholar] [CrossRef]
  31. Vaze, J.; Tuteja, N.; Teng, J. CLASS Unsaturated Moisture Movement Model U3M-1D, User’s Manual; NSW Department of Infrastructure, Planning and Natural Resources: Sydney, Australia, 2004; ISBN 0-7347-5513-9. [Google Scholar]
  32. Friedl, M.A.; Sulla-Menashe, D.; Tan, B.; Schneider, A.; Ramankutty, N.; Sibley, A.; Huang, X. MODIS Collection 5 global land cover: Algorithm refinements and characterization of new datasets. Remote Sens. Environ. 2010, 114, 168–182. [Google Scholar] [CrossRef]
  33. Peel, M.C.; Finlayson, B.L.; McMahon, T.A. Updated world map of the Köppen-Geiger climate classification. Hydrol. Earth Syst. Sci. 2007, 11, 1633–1644. [Google Scholar] [CrossRef] [Green Version]
  34. Turner, M.; Bari, M.; Amirthanathan, G.; Ahmad, Z. Australian network of hydrologic reference stations-advances in design, development and implementation. In Proceedings of the Hydrology and Water Resources Symposium 2012, Sydney, Australia, 19–22 November 2012; pp. 1555–1564. [Google Scholar]
  35. Zhang, X.S.; Amirthanathan, G.E.; Bari, M.A.; Laugesen, R.M.; Shin, D.; Kent, D.M.; MacDonald, A.M.; Turner, M.E.; Tuteja, N.K. How streamflow has changed across Australia since the 1950s: Evidence from the network of hydrologic reference stations. Hydrol. Earth Syst. Sci. 2016, 20, 3947–3965. [Google Scholar] [CrossRef] [Green Version]
  36. Kim, S.; Zhang, R.; Pham, H.; Sharma, A. A Review of Satellite-Derived Soil Moisture and Its Usage for Flood Estimation. Remote Sens. Earth Syst. Sci. 2019. [Google Scholar] [CrossRef]
  37. Baldocchi, D.; Falge, E.; Gu, L.; Olson, R.; Hollinger, D.; Running, S.; Anthoni, P.; Bernhofer, C.; Davis, K.; Evans, R. FLUXNET: A new tool to study the temporal and spatial variability of ecosystem-scale carbon dioxide, water vapor, and energy flux densities. Bull. Am. Meteorol. Soc. 2001, 82, 2415–2434. [Google Scholar] [CrossRef]
  38. Dorigo, W.A.; Wagner, W.; Hohensinn, R.; Hahn, S.; Paulik, C.; Xaver, A.; Gruber, A.; Drusch, M.; Mecklenburg, S.; van Oevelen, P.; et al. The International Soil Moisture Network: A data hosting facility for global in situ soil moisture measurements. Hydrol. Earth Syst. Sci. 2011, 15, 1675–1698. [Google Scholar] [CrossRef] [Green Version]
  39. Jung, M.; Reichstein, M.; Ciais, P.; Seneviratne, S.I.; Sheffield, J.; Goulden, M.L.; Bonan, G.; Cescatti, A.; Chen, J.; de Jeu, R.; et al. Recent decline in the global land evapotranspiration trend due to limited moisture supply. Nature 2010, 467, 951. [Google Scholar] [CrossRef]
  40. Walker, E.; García, G.A.; Venturini, V.; Carrasco, A. Regional evapotranspiration estimates using the relative soil moisture ratio derived from SMAP products. Agric. Water Manag. 2019, 216, 254–263. [Google Scholar] [CrossRef]
  41. Didan, K.; Barreto-Munoz, A.; Solano, R.; Huete, A. MODIS Vegetation Index User’s Guide (MOD13 Series); Vegetation Index and Phenology Lab, The University of Arizona: Tucson, AZ, USA, 2015; pp. 1–32. [Google Scholar]
  42. Raupach, M.; Briggs, P.; Haverd, V.; King, E.; Paget, M.; Trudinger, C. Australian water availability project (AWAP): CSIRO marine and atmospheric research component: Final report for phase 3. In Centre for Australian Weather and Climate Research (Bureau of Meteorology and CSIRO); CSIRO Marine and Atmospheric Research: Melbourne, Australia, 2009; Volume 67. [Google Scholar]
  43. Read, A.; Dowling, T.; Gallant, J.; Tickle, P.K.; Wilson, N. 1 Second SRTM Derived Hydrological Digital Elevation Model (DEM-H) Version 1.0; Commonwealth of Australia (Geoscience Australia): Canberra, Australia, 2011. [Google Scholar]
  44. Viscarra Rossel, R.; Chen, C.; Grundy, M.; Searle, R.; Clifford, D.; Odgers, N.; Holmes, K.; Griffin, T.; Liddicoat, C.; Kidd, D. Soil and Landscape Grid National Soil Attribute Maps—Soil Depth (3" resolution)—Release 1. v4 ed.; Commonwealth Scientific and Industrial Research Organisation (CSIRO): Canberra, Australia, 2014; Available online: https://data.csiro.au/dap/landingpage?pid=csiro%3A11413 (accessed on 31 December 2013).
  45. Viscarra Rossel, R.; Chen, C.; Grundy, M.; Searle, R.; Clifford, D.; Odgers, N.; Holmes, K.; Griffin, T.; Liddicoat, C.; Kidd, D. Soil and Landscape Grid National Soil Attribute Maps—Sand (3" resolution)—Release 1. v4 ed.; Commonwealth Scientific and Industrial Research Organisation (CSIRO): Canberra, Australia, 2014; Available online: https://data.csiro.au/dap/landingpage?pid=csiro%3A10149 (accessed on 31 December 2013).
  46. Viscarra Rossel, R.; Chen, C.; Grundy, M.; Searle, R.; Clifford, D.; Odgers, N.; Holmes, K.; Griffin, T.; Liddicoat, C.; Kidd, D. Soil and Landscape Grid National Soil Attribute Maps—Clay (3" resolution)—Release 1. v4 ed.; Commonwealth Scientific and Industrial Research Organisation (CSIRO): Canberra, Australia, 2014; Available online: https://data.csiro.au/dap/landingpage?pid=csiro:10168 (accessed on 31 December 2013).
  47. Viscarra Rossel, R.; Chen, C.; Grundy, M.; Searle, R.; Clifford, D.; Odgers, N.; Holmes, K.; Griffin, T.; Liddicoat, C.; Kidd, D. Soil and Landscape Grid National Soil Attribute Maps—Silt (3" Resolution)—Release 1. v4 ed.; Commonwealth Scientific and Industrial Research Organisation (CSIRO): Canberra, Australia, 2014; Available online: https://data.csiro.au/dap/landingpage?pid=csiro%3A10688 (accessed on 31 December 2013).
  48. Frost, A.; Ramchurn, A.; Smith, A. The Bureau’s Operational AWRA Landscape (AWRA-L) Model. Melb. Bur. Meteorol. 2016, 47. Available online: http://www.bom.gov.au/water/landscape/assets/static/publications/Frost_Model_Description_Report.pdf (accessed on 31 December 2013).
  49. Liu, Y.Y.; Dorigo, W.A.; Parinussa, R.M.; de Jeu, R.A.M.; Wagner, W.; McCabe, M.F.; Evans, J.P.; van Dijk, A.I.J.M. Trend-preserving blending of passive and active microwave soil moisture retrievals. Remote Sens. Environ. 2012, 123, 280–297. [Google Scholar] [CrossRef]
  50. Dorigo, W.; Wagner, W.; Albergel, C.; Albrecht, F.; Balsamo, G.; Brocca, L.; Chung, D.; Ertl, M.; Forkel, M.; Gruber, A.; et al. ESA CCI Soil Moisture for improved Earth system understanding: State-of-the art and future directions. Remote Sens. Environ. 2017, 203, 185–215. [Google Scholar] [CrossRef]
  51. Gruber, A.; Dorigo, W.A.; Crow, W.; Wagner, W. Triple Collocation-Based Merging of Satellite Soil Moisture Retrievals. IEEE Trans. Geosci. Remote Sens. 2017, 55, 6780–6792. [Google Scholar] [CrossRef]
  52. Mu, Q.; Zhao, M.; Running, S.W. Improvements to a MODIS global terrestrial evapotranspiration algorithm. Remote Sens. Environ. 2011, 115, 1781–1800. [Google Scholar] [CrossRef]
  53. Dwyer, M.J.; Schmidt, G. The MODIS reprojection tool. In Earth Science Satellite Remote Sensing Vol. 2: Data, Computational Processing, and Tools; Qu, J.J., Gao, W., Kafatos, M., Murphy, R.E., Salomonson, V.V., Eds.; Tsinghua University Press: Beijing, China; Springer: Berlin/Heidelberg, Germany, 2006; pp. 162–177. [Google Scholar]
  54. Savitzky, A.; Golay, M.J.E. Smoothing and Differentiation of Data by Simplified Least Squares Procedures. Anal. Chem. 1964, 36, 1627–1639. [Google Scholar] [CrossRef]
  55. Jönsson, P.; Eklundh, L. TIMESAT—A program for analyzing time-series of satellite sensor data. Comput. Geosci. 2004, 30, 833–845. [Google Scholar] [CrossRef] [Green Version]
  56. Chen, J.; Jönsson, P.; Tamura, M.; Gu, Z.; Matsushita, B.; Eklundh, L. A simple method for reconstructing a high-quality NDVI time-series data set based on the Savitzky–Golay filter. Remote Sens. Environ. 2004, 91, 332–344. [Google Scholar] [CrossRef]
  57. Pettorelli, N.; Vik, J.O.; Mysterud, A.; Gaillard, J.-M.; Tucker, C.J.; Stenseth, N.C. Using the satellite-derived NDVI to assess ecological responses to environmental change. Trends Ecol. Evol. 2005, 20, 503–510. [Google Scholar] [CrossRef]
  58. Zhu, Z.; Piao, S.; Myneni, R.B.; Huang, M.; Zeng, Z.; Canadell, J.G.; Ciais, P.; Sitch, S.; Friedlingstein, P.; Arneth, A. Greening of the Earth and its drivers. Nat. Clim. Chang. 2016, 6, 791. [Google Scholar] [CrossRef]
  59. Garcia, D. Robust smoothing of gridded data in one and higher dimensions with missing values. Comput. Stat. Data Anal. 2010, 54, 1167–1178. [Google Scholar] [CrossRef] [Green Version]
  60. Wang, G.; Garcia, D.; Liu, Y.; De Jeu, R.; Dolman, A.J. A three-dimensional gap filling method for large geophysical datasets: Application to global satellite soil moisture observations. Environ. Modell. Softw. 2012, 30, 139–142. [Google Scholar] [CrossRef]
  61. Pham, H.T.; Kim, S.; Marshall, L.; Johnson, F. Using 3D robust smoothing to fill land surface temperature gaps at the continental scale. Int. J. Appl. Earth Obs. Geoinf. 2019, 82, 101879. [Google Scholar] [CrossRef]
  62. Beesley, C.; Frost, A.; Zajaczkowski, J. A comparison of the BAWAP and SILO spatially interpolated daily rainfall datasets. In Proceedings of the 18th World IMACS/MODSIM Congress, Cairns, Australia, 13–17 July 2009; p. 17. [Google Scholar]
  63. Gergis, J.; Gallant, A.J.E.; Braganza, K.; Karoly, D.J.; Allen, K.; Cullen, L.; D’Arrigo, R.; Goodwin, I.; Grierson, P.; McGregor, S. On the long-term context of the 1997–2009 ‘Big Dry’ in South-Eastern Australia: Insights from a 206-year multi-proxy rainfall reconstruction. Clim Chang. 2012, 111, 923–944. [Google Scholar] [CrossRef]
  64. Delworth, T.L.; Zeng, F. Regional rainfall decline in Australia attributed to anthropogenic greenhouse gases and ozone levels. Nat. Geosci. 2014, 7, 583–587. [Google Scholar] [CrossRef]
  65. Ji, F.; Ekström, M.; Evans, J.P.; Teng, J. Evaluating rainfall patterns using physics scheme ensembles from a regional atmospheric model. Theor. Appl. Climatol. 2014, 115, 297–304. [Google Scholar] [CrossRef]
  66. Kim, S.; Paik, K.; Johnson, F.M.; Sharma, A. Building a Flood-Warning Framework for Ungauged Locations Using Low Resolution, Open-Access Remotely Sensed Surface Soil Moisture, Precipitation, Soil, and Topographic Information. IEEE J. Sel. Top. Appl. Earth Observ. Remote Sens. 2018, 11, 375–387. [Google Scholar] [CrossRef]
  67. Penman, H.L. Natural evaporation from open water, bare soil and grass. Proc. R. Soc. Lond. Ser. A Math. Phys. Sci. 1948, 193, 120–145. [Google Scholar] [CrossRef] [Green Version]
  68. Libertino, A.; Sharma, A.; Lakshmi, V.; Claps, P. A global assessment of the timing of extreme rainfall from TRMM and GPM for improving hydrologic design. Environ. Res. Lett. 2016, 11, 054003. [Google Scholar] [CrossRef]
  69. Tuteja, N.K.; Vaze, J.; Murphy, B.; Beale, G. CLASS: Catchment Scale Multiple-landuse Atmosphere Soil Water and Solute Transport Model; CRC for Catchment Hydrology: Melbourne, Australia, 2004. [Google Scholar]
  70. Ajami, H.; Khan, U.; Tuteja, N.K.; Sharma, A. Semi-Distributed Hydrologic Modelling with Soil Moisture and Runoff Simulation Toolkit (SMART) User’s Manual. 2016. Available online: https://github.com/hooriajami/SMART (accessed on 29 November 2018).
  71. Peel, M.C.; Finlayson, B.L.; McMahon, T.A. Updated world map of the Köppen-Geiger climate classification. Hydrol. Earth Syst. Sci. Discuss. 2007, 4, 439–473. [Google Scholar] [CrossRef] [Green Version]
  72. Nash, J.E.; Sutcliffe, J.V. River flow forecasting through conceptual models part I—A discussion of principles. J. Hydrol. 1970, 10, 282–290. [Google Scholar] [CrossRef]
  73. Entekhabi, D.; Reichle, R.H.; Koster, R.D.; Crow, W.T. Performance Metrics for Soil Moisture Retrievals and Application Requirements. J. Hydrometeorol. 2010, 11, 832–840. [Google Scholar] [CrossRef]
  74. Ahlström, A.; Raupach, M.R.; Schurgers, G.; Smith, B.; Arneth, A.; Jung, M.; Reichstein, M.; Canadell, J.G.; Friedlingstein, P.; Jain, A.K.; et al. The dominant role of semi-arid ecosystems in the trend and variability of the land CO2 sink. Science 2015, 348, 895–899. [Google Scholar] [CrossRef] [Green Version]
  75. Poulter, B.; Frank, D.; Ciais, P.; Myneni, R.B.; Andela, N.; Bi, J.; Broquet, G.; Canadell, J.G.; Chevallier, F.; Liu, Y.Y.; et al. Contribution of semi-arid ecosystems to interannual variability of the global carbon cycle. Nature 2014, 509, 600. [Google Scholar] [CrossRef] [PubMed] [Green Version]
  76. Li, L.; Wang, Y.-P.; Beringer, J.; Shi, H.; Cleverly, J.; Cheng, L.; Eamus, D.; Huete, A.; Hutley, L.; Lu, X.; et al. Responses of LAI to rainfall explain contrasting sensitivities to carbon uptake between forest and non-forest ecosystems in Australia. Sci. Rep. 2017, 7, 11720. [Google Scholar] [CrossRef]
  77. Bobée, C.; Ottlé, C.; Maignan, F.; de Noblet-Ducoudré, N.; Maugis, P.; Lézine, A.M.; Ndiaye, M. Analysis of vegetation seasonality in Sahelian environments using MODIS LAI, in association with land cover and rainfall. J. Arid Environ. 2012, 84, 38–50. [Google Scholar] [CrossRef]
  78. Zhu, Z.; Bi, J.; Pan, Y.; Ganguly, S.; Anav, A.; Xu, L.; Samanta, A.; Piao, S.; Nemani, R.R.; Myneni, R.B. Global Data Sets of Vegetation Leaf Area Index (LAI)3g and Fraction of Photosynthetically Active Radiation (FPAR)3g Derived from Global Inventory Modeling and Mapping Studies (GIMMS) Normalized Difference Vegetation Index (NDVI3g) for the Period 1981 to 2011. Remote Sens. 2013, 5, 927–948. [Google Scholar]
  79. Javadian, M.; Behrangi, A.; Smith, W.K.; Fisher, J.B. Global Trends in Evapotranspiration Dominated by Increases across Large Cropland Regions. Remote Sens. 2020, 12, 1221. [Google Scholar] [CrossRef] [Green Version]
  80. Fisher, J.B.; Melton, F.; Middleton, E.; Hain, C.; Anderson, M.; Allen, R.; McCabe, M.F.; Hook, S.; Baldocchi, D.; Townsend, P.A. The future of evapotranspiration: Global requirements for ecosystem functioning, carbon and climate feedbacks, agricultural management, and water resources. Water Resour. Res. 2017, 53, 2618–2626. [Google Scholar] [CrossRef]
  81. Asadi Zarch, M.A.; Sivakumar, B.; Sharma, A. Assessment of global aridity change. J. Hydrol. 2015, 520, 300–313. [Google Scholar] [CrossRef]
  82. Fitsum, W.; Ashish, S. Should flood regimes change in a warming climate? The role of antecedent moisture conditions. Geophys. Res. Lett. 2016, 43, 7556–7563. [Google Scholar] [CrossRef]
Figure 1. (a) Six primary land covers based on MODIS data (F = forest; S = shrublands; W = woodlands; G = grasslands; C = croplands; U = unvegetated regions) and (b) three dominant climate zones (tropical, arid and temperate) of Australia from the updated Köppen-Geiger climate classification. (c) locations and boundaries of six catchments used for SM and ET simulations in this study.
Remotesensing 12 03051 g001
Figure 2. (a) Estimated k values over the seven-year calibration period (2002 to 2009). Note that the white-space regions in the map were excluded from the optimization due to lack of LAI data. (b) Box plots presenting correlation coefficients over the five-year validation period (2010 to 2014) (Rval) between the MODIS and estimated LAI by Opt def and Opt est approaches conditioned by the six primary land cover classes across Australia.
Remotesensing 12 03051 g002
Figure 3. 1-year time series of daily SM derived from CCI SM (black dotted-line) and simulated by Opt def (blue continuous line) and Opt est (red continuous line) respectively for six selected catchments: (a) 212209, (b) 215004, (c) 318076, (d) 410734, (e) 405238 and (f) 410061.
Remotesensing 12 03051 g003
Figure 4. 1-year time series of daily ET derived from MODIS (black dotted-line) and simulated by Opt def (blue continuous line) and Opt est (red continuous line) respectively for six selected catchments: (a) 212209, (b) 215004, (c) 318076, (d) 410734, (e) 405238 and (f) 410061.
Remotesensing 12 03051 g004
Figure 5. 1-year time series of daily Q observed (black dotted-line) and simulated by Opt def (blue continuous line) and Opt est (red continuous line) respectively for six selected catchments: (a) 212209, (b) 215004, (c) 318076, (d) 410734, (e) 405238 and (f) 410061.
Remotesensing 12 03051 g005
Figure 6. Spatial distributions of (a) elevation and (b) mean LAI during the 5-year validation period (2010–2014) over 318076 catchment. Here, the red diamond mark in the east indicates the catchment outlet.
Remotesensing 12 03051 g006
Figure 7. Comparisons of SM and ET simulations by Opt est and Opt def in dry (ad, 15 March 2014) and wet (eh, 28 March 2014) days over 318076 catchment.
Remotesensing 12 03051 g007
Figure 8. 1-year (2014) time series of (a) precipitation, (b) SM and (c) LAI for 318076 catchment.
Remotesensing 12 03051 g008
Table 1. Details of Six Catchments Used for SM and ET Simulations in this Study.
NoHRS IDClassLimited byArea
(km2)
Max
Ele. (m)
P
(mm)
PET
(mm)
Land Cover Proportion (%)
FWGCTotal
1212209B1Nutrient67.4823115913806733--100
2215004B1Nutrient165.691581514154357--100
3318076B2Light379.815721279120488-12-100
4410734B2Light563.715398331352333333-100
5405238A1Water164.1773756143614-7114100
6410061A1Water146.1100010541471501733-100
Max Ele = maximum elevation above sea level; P = annual mean precipitation; and PET = annual mean potential evapotranspiration. Note that the land cover proportions (%) are based on the MODIS land cover product (F = forest; W=woodlands; G = grasslands; C = croplands).
Table 2. Summary of Data Used in this Study with Data Links Presented below the Table.
Primary PurposeData
(link)
Source/Product NameReferencesResolution
(Temp./Spa.)
Units
LAI modellingLAI 1MODIS/
MCD15A2H (V006)
[41]8-day/0.05°m2/m2
Rainfall 2Bureau of Meteorology Australia/AWAP Gridded Daily Rainfall[42]Daily/0.05°mm/day
SMART modelling DEM 3Geoscience Australia
/SRTM-derived 1” Hydrologically Enforced DEM (DEM-H) (V1.0)
[43]-/1”m
(a.s.l)
Land cover 1MODIS
/MCD12C1 (V051)
[32]Yearly/0.05°-
Climate zoneUpdated world map of the Köppen-Geiger climate classification[33]-/0.25°-
Soil data 4Commonwealth Scientific and Industrial Research Organization (CSIRO)/Soil grain size distribution and depth (Release 1)[44,45,46,47]-/3”-
PET 2Bureau of Meteorology Australia
/AWRA-L PET (V5.0)
[48]Daily/0.05°mm/day
SM, ET and Q evaluationSM 5ESA CCI
/Active–passive combined surface SM (V04.4)
[49,50,51]Daily/0.25°m3/m3
ET 1MODIS
/MYD16A2 (V006)
[52]Daily/0.05°mm/day
Q 6HRS/Daily discharge (~2014)[34,35]Dailym3/sec
1 MODIS LAI, land cover and ET data: https://earthdata.nasa.gov/, 2 AWAP rainfall and AWRA-L PET data: http://www.bom.gov.au/jsp/awap/rain/index.jsp, 3 DEM data: http://www.ga.gov.au/scientific-topics/national-location-information/digital-elevation-data, 4 Soil data: https://data.csiro.au/dap/home?execution=e1s1, 5 ESA CCI SM data: http://www.esa-soilmoisture-cci.org/, and 6 HRS Q data: http://www.bom.gov.au/water/hrs/. DEM = Digital Elevation Model; PET = Potential Evapotranspiration; SM=Soil Moisture; Temp. = temporal; Spa. = spatial; a.s.l. = above sea level and other acronyms and abbreviations can be found in the main texts. 0.05° and 0.25° approximately correspond to 5 km and 25 km over the equatorial regions, respectively.
Table 3. Land Cover Classes Used in this Study.
IGBP Class NumberIGBP ClassPrimary ClassSMART Class
1Evergreen needleleaf forestForestTree
2Deciduous needleleaf forest
3Evergreen broadleaf forest
4Deciduous broadleaf forest
5Mixed forests
6Closed shrublandsShrublandsPasture
7Open shrublands
8Woody savannasWoodlandsTree
9Savannas
10GrasslandsGrasslandsPasture
11Permanent wetlands//
12CroplandsCroplandsCrop
14Cropland/natural vegetation mosaics
13Urban and built-up landUnvegetated/
16Barren or sparsely vegetated
15Permanent snow and ice//
17Water
Table 4. Correlation Coefficients of Two LAI Estimation Methods and Parameter Optimization Results over Australia by the MODIS-Derived Six Primary Land Cover Types.
Land CoverRk
O p t d e f O p t e s t
Forest0.21 ± 0.220.63 ± 0.180.05 ± 0.16
Shrublands0.24 ± 0.210.55 ± 0.160.12 ± 0.26
Woodlands0.25 ± 0.180.73 ± 0.130.06 ± 0.14
Grasslands0.34 ± 0.210.69 ± 0.120.12 ± 0.18
Croplands0.65 ± 0.150.79 ± 0.110.18 ± 0.18
Unvegetated regions0.28 ± 0.180.67 ± 0.170.08 ± 0.19
Table 5. Parameter Optimization Results over the Six Catchments Used for SM and ET Simulations.
NoHRS IDCatchment Average R
b/w MODIS and Estimated LAI
Catchment Average k
O p t d e f O p t e s t
12122090.390.680.05
22150040.260.740.02
33180760.190.670.01
44107340.180.600.06
54052380.560.770.13
64100610.360.730.04
Table 6. Summary of SM, ET and Q Simulation Results over the Six Catchments.
HRS IDOptSMETQ
RNSERMSERNSERMSERNSERMSE
212209 Opt MOD 0.513−0.8470.0930.440−0.1081.1420.5380.0752.612
Opt est 0.506−0.7600.0930.449−0.1241.1580.5350.0702.619
Opt def 0.482−2.2550.0990.309−0.5131.3310.5290.0572.637
215004 Opt MOD 0.570−0.5500.0610.310−0.4821.0280.5610.1178.319
Opt est 0.576−0.5340.0600.311−0.5081.0340.5590.1148.331
Opt def 0.511−2.7960.0730.147−1.0171.1950.5400.0758.514
318076 Opt MOD 0.714−0.0690.0770.7550.1750.7500.7940.5806.533
Opt est 0.714−0.0680.0770.7550.1650.7570.7950.5826.514
Opt def 0.669−1.3840.0840.726−0.3210.9020.7940.5846.484
410734 Opt MOD 0.633−1.2060.0580.521−0.4390.8550.7320.4553.907
Opt est 0.604−1.3070.0660.526−0.4530.8600.7400.4703.854
Opt def 0.540−1.4230.0880.415−0.8700.9730.8040.5963.365
405238 Opt MOD 0.8390.0160.0520.610−0.3960.8060.210−0.5242.199
Opt est 0.8290.0400.0510.633−0.3910.8050.191−0.5642.215
Opt def 0.800−0.4440.0650.634−0.7270.8970.212−0.5402.170
410061 Opt MOD 0.8130.0980.1000.680−0.2060.7870.5990.1982.024
Opt est 0.8040.0940.1010.693−0.1910.7820.6030.2052.015
Opt def 0.797−0.0980.0930.635−0.6600.9100.6070.2152.003