Technical Note

Displacement Monitoring in Airport Runways by Persistent Scatterers SAR Interferometry

by
Luca Bianchini Ciampoli
1,*,
Valerio Gagliardi
1,
Chiara Ferrante
1,
Alessandro Calvi
1,
Fabrizio D’Amico
1 and
Fabio Tosti
2
1
Department of Engineering, Roma Tre University, Via Vito Volterra 62, 00146 Rome, Italy
2
School of Computing and Engineering, University of West London, St. Mary’s Road, London W5 5RF, UK
*
Author to whom correspondence should be addressed.
Remote Sens. 2020, 12(21), 3564; https://doi.org/10.3390/rs12213564
Submission received: 31 August 2020 / Revised: 8 October 2020 / Accepted: 26 October 2020 / Published: 30 October 2020
(This article belongs to the Special Issue Trends in GPR and Other NDTs for Transport Infrastructure Assessment)

Abstract

:
Deformations monitoring in airport runways and the surrounding areas is crucial, especially in cases of low-bearing capacity subgrades, such as the clayey subgrade soils. An effective monitoring of the infrastructure asset allows to secure the highest necessary standards in terms of the operational and safety requirements. Amongst the emerging remote sensing techniques for transport infrastructures monitoring, the Persistent Scatterers Interferometry (PSI) technique has proven effective for the evaluation of the ground deformations. However, its use for certain demanding applications, such as the assessment of millimetric differential deformations in airport runways, is still considered as an open issue for future developments. In this study, a time-series analysis of COSMO–SkyMed satellite images acquired from January 2015 to April 2019 is carried out by employing the PSI technique. The aim is to retrieve the mean deformation velocity and time series of the surface deformations occurring in airport runways. The technique is applied to Runway 3 at the “Leonardo da Vinci” International Airport in Rome, Italy. The proposed PSI technique is then validated by way of comparison with the deformation outcomes obtained on the runway by traditional topographic levelling over the same time span. The results of this study clearly demonstrate the efficiency and the accuracy of the applied PSI technique for the assessment of deformations in airport runways.

Graphical Abstract

1. Introduction

Runways are central elements in airport infrastructures, as they are mostly dedicated to the two fundamental and most critical manoeuvres of taking-off and landing of the aircrafts. In light of this, runways must comply with very strict requirements in terms of the construction [1] and the maintenance standards [2]. In this regard, it is worthy of mention that a continuously regular surface must be ensured in runways over their entire life cycle, and no superficial (e.g., cracking or rutting) or deep (e.g., subgrade subsidence) damage is acceptable to compromise safe manoeuvring of the aircrafts.
Although the provision of proper design methods for runways is crucial to minimise future maintenance and rehabilitation of the infrastructure, this can be compromised by other critical factors, such as construction site related issues (e.g., geotechnical instability of the subgrade) or the non-linear action of different heavy loads over the infrastructure life cycle. The occurrence of these events requires a dedicated and deep monitoring of differential settlements and deformations of the surface, in order to plan targeted interventions on time [3,4] and comply with budget constraints [5].
Within this context, it is important to mention that innovative inspection techniques are in demand by infrastructure agencies and administrators to be incorporated into more effective infrastructure management systems. Scope is to enhance the reliability of the decay prediction models by increasing the productivity of the system at reduced inspection costs. Nowadays, various methodologies have been reported as effective in the detection and monitoring of deformations in runways. Among these, the most acknowledged techniques are the point-based geodetic methods, such as the topographic levelling [6], often coupled to Global Navigation Satellite Systems (GNSS) for referencing purposes [7], or the LiDAR technique [8]. These methods work with different resolutions, and they all rely on the comparison between the positions of points measured across successive surveys. This approach is necessary to allow the monitoring of the deformation trend of the targets.
More recently, satellite-based techniques are gaining momentum for the monitoring of transport infrastructures. One of their major advantages is on the fact that measurements of targets can be repeated over an investigated area, with a fixed revisiting time that is related to the orbit of the satellite. This allows to collect a significant amount of information regularly distributed in time, without the requirement to close the infrastructure to traffic. Hence, tremendous benefits can be brought forward in terms of safety and costs in the asset management process [9]. Among the satellite remote sensing techniques, the Synthetic Aperture Radar Interferometry (InSAR) has proven effective in the analysis of subsidence effects in a wide range of structures [10] and infrastructures [11].
This study focuses on the application of the InSAR technology and, more specifically, of the Persistent Scatters Interferometry (PSI) [12,13] to the monitoring of differential settlements in airport runways. To demonstrate the viability of the proposed technique, a case study is presented with an application to Runway 3 at the “Leonardo da Vinci” International Airport in Rome, Italy. The investigated area is known to be affected by subsidence due to soft subgrades. Results of the InSAR acquisitions and processing are finally compared to the deformations obtained on the runway by traditional topographic levelling over the same time span.

2. Aim and Objectives

The main aim of the investigation reported in this paper is to verify the effectiveness of the satellite remote sensing technology in gaining vital information about the functionality of airport runways for inclusion in airport asset management systems. To achieve this aim, the following objectives are identified:
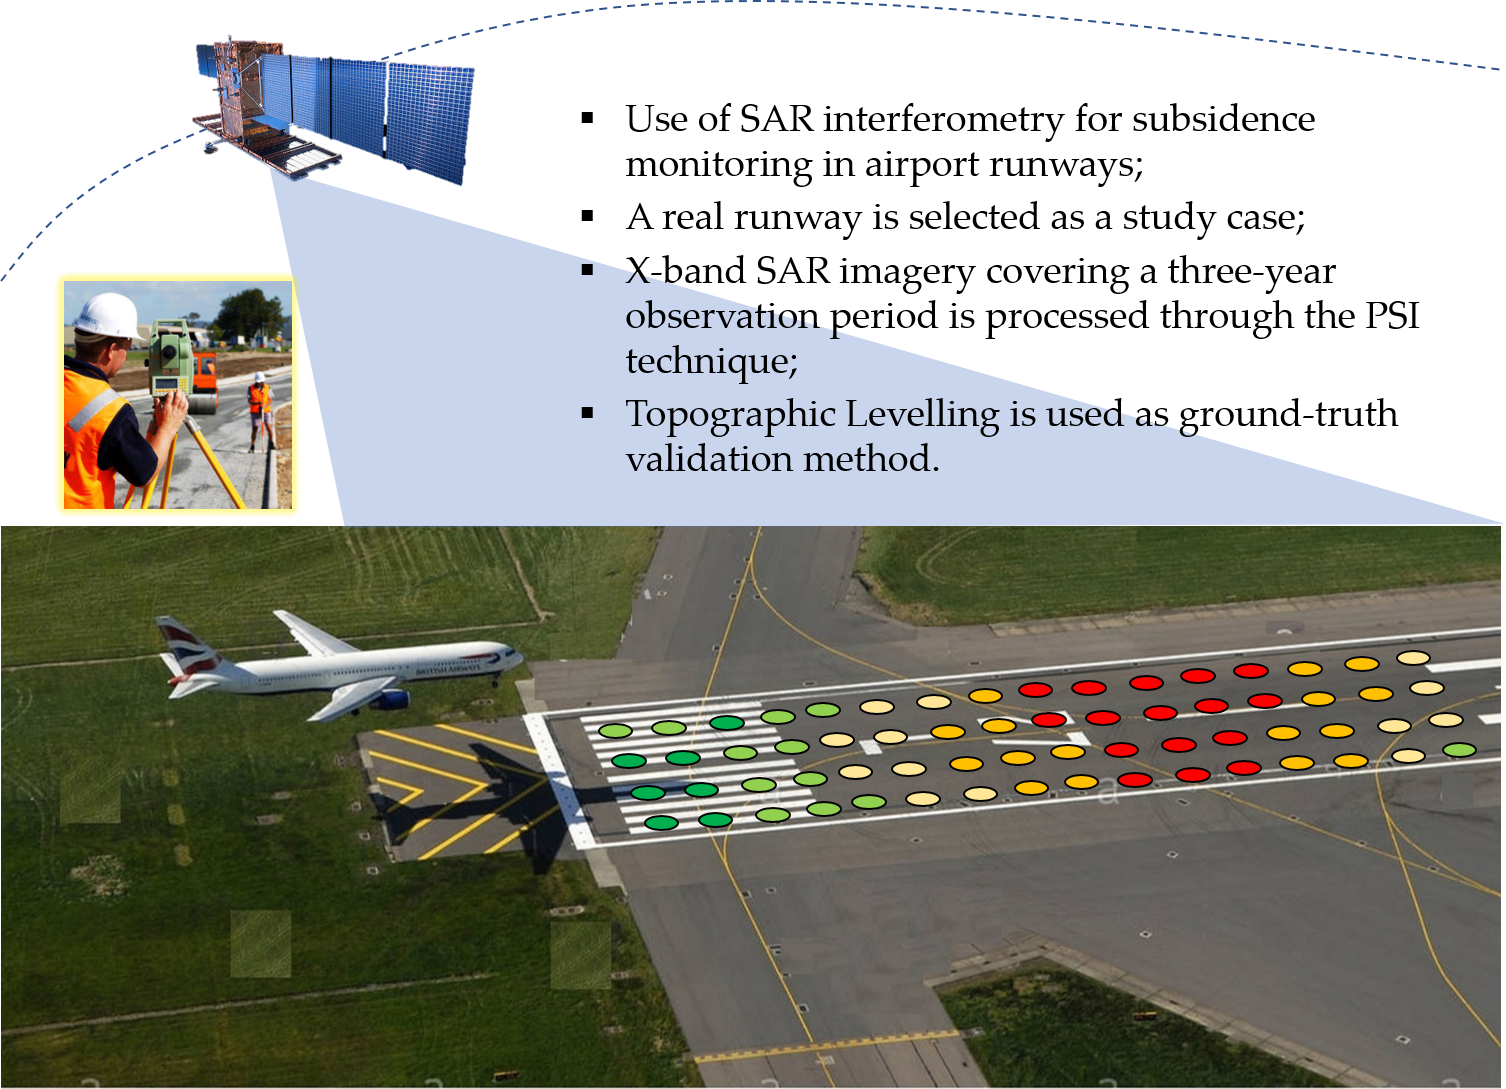
  • to assess runway displacements at the millimetre scale and evaluate their trend on a multi-year scale using the PSI monitoring technique;
  • to compare the results obtained with the PSI technique and the traditional topographic levelling method.

3. Runway Monitoring Techniques

Relevant methods employed for the monitoring of airport runways are presented in the following sections. The topographic levelling and the LiDAR techniques are here referred to as “established techniques”, as opposed to the PSI method, referred to as an “innovative technique”.

3.1. Established Techniques

3.1.1. Topographic Levelling

The process of measuring variations in elevation is a relatively basic operation in topographical surveys, and it is typically referred to as levelling. Various levelling techniques have been developed over the time. In regard to infrastructure surveying, geometric levelling is the most adopted [14]. The height difference is here obtained from readings on levelling staffs where the level’s horizontal sightline intersects them. The level is mostly used in the middle between two levelling staffs (differential levelling), with the objective of the survey being the definition of the difference in vertical distance between the two staff positions.
As demonstrated by [6], the topographic levelling procedure allows us to monitor the long-term settlements of an infrastructure by measuring the variation in the vertical position of the target over multiple surveys. This is performed with respect to a single or multiple stable point, typically referred to as topographic benchmarks.
In recent decades, various levelling investigations on civil infrastructures have been reported in the literature [15,16]. In regard to the monitoring of the airport runways, both advantages and drawbacks can be mentioned on the use of the topographic levelling. As for the advantages, the high accuracy of the measurements [17] and the possibility to perform tests independently from indoor or outdoor environments once a reference point is defined [18] is worthy of mention. The drawbacks include a) a limited productivity [19,20], due to the need of measuring each target separately, b) the necessity to close the runway during testing, c) the impossibility to perform the survey in adverse weather conditions [15], and d) the provision of a clear line of sight between consecutive targets of the survey, implying several practical constraints. Lastly, the observed displacements are relative measurements that might be affected by potential settlements levelling benchmarks, which may result in a distortion of the results.

3.1.2. LiDAR Surveys

LiDAR is a surveying method that measures the distance to a target by illuminating the target with a laser light and measuring the reflected light with a sensor [21]. The differences in the laser return, times, and wavelengths can then be used to create digital 3D representations of the target. Since this technology has started to spread in several scientific and professional fields, successful applications in transport infrastructures monitoring have been reported [22] for both the static [23] and the mobile [24] configurations of the equipment.
With regard to airport runway monitoring, static terrestrial laser scanners are being mostly used for reconstructing the geometry of the pavement surface in order to detect defects and decayed areas [8,25]. This is carried out by illuminating the whole runway surface by means of different scans performed at different and distributed survey stations. A certain rate of superposition of the point clouds must also be provided for matching purposes [26]. The georeferencing operation between different scans is ensured by the use of common ground targets working as reference objects. However, by coupling a GNSS receiver to this ground targets, it is possible to skip from relative to global coordinates and compare successive surveys, in order to monitor the evolution of differential settlements.
Among the advantages of this technique, it is worth mentioning the rapidity and the high resolution of the surveys, as millions of point clouds can be collected in limited time. Furthermore, the use of global georeferenced ground targets allows us to prevent the measurements from relative errors due to the instability of the reference. In turn, LiDAR surveys require the runaway to be closed to traffic during the tests. In addition, the application of this technique, as well as the levelling, requires the presence of operators on site. This represents a considerable safety concern as airport runways and aprons are considered as high-risk environments.

3.2. Persistent Scatterers Interferometry (PSI)

The InSAR technique, or SAR interferometry, relies on the measurement of the signal phase variation between images acquired by a satellite orbiting over the same area [9]. Indeed, once the phase contribution related to atmospheric conditions and both temporal and spatial decorrelations are adequately accounted for, it is possible to detect a time sequence of the sensor–target distance along the sight direction of the satellite. This can be related to the surface deformations, e.g., the subsidence. [11].
For this purpose, various processing techniques have been proposed over time. Among these, PSI is one of the most acknowledged [12,13]. PSI is based on the statistical analysis of the signals back-scattered from a network of phase-coherent targets, namely the Persistent Scatterers (PS), which are defined as the points on the ground returning stable signals to the satellite sensor. Indeed, the constant scattering properties of the PS over time and the reflection dominance within a pixel cell are effective in reducing the temporal and geometric decorrelations. In addition, the atmospheric contribute can be estimated and removed using the series of images acquired at different times.
SAR sensors operate at different bands of the microwave domain, namely X, C, and L, corresponding to wavelengths (λ) ranging from 2.4 to 30 cm. Each wavelength is associated to a differently sized resolution cell on the ground, whose displacement trend is described by a single PS.
By means of the PSI technique, satellite remote sensing can provide a continuous monitoring of the overall stability of structures and infrastructures, as well as the surrounding environment. This is obtained by the analysis of multiple SAR images collected at different time stages. Subject-related literature reports the SAR techniques as viable tools for the monitoring of ground deformations, landslides, subsidence, and tectonic motions [27,28,29]. Similarly, in the last few years, various successful applications of the PSI technique have been presented, proving the feasibility of this technique for the assessment of transport infrastructures and surveillance areas, such as highways [30,31,32], bridges [33,34,35,36,37], subways and tunnels [31,38,39], railways [40,41,42,43], and airport runways [44,45,46]. This evidence confirms the wide applicability of these techniques within these specific areas of endeavour.
The use of the InSAR technique in transport infrastructure monitoring holds several advantages [9]. InSAR data can be collected regardless of the atmospheric and lighting conditions. In addition, a single InSAR survey permits the analysis of extended areas, due to the wide footprint of the sensor. The continuous motion of the satellites ensures the availability of regularly spaced images, which allows us to perform very dense analyses as opposed to on-site and low-frequency inspections. The acquisition and processing of SAR images do not require on-site operations, thereby preventing both the closure of the runway to air traffic and the presence of operators on the site, with related economic and safety benefits.
On the other hand, the applicability of the PSI analysis is by definition limited to areas where an adequate number of PSs can be observed. This implies that, in case of varying surface conditions (e.g., frequent repaving or accelerated degradation), the stability of the scattering properties of the target may be compromised, with a reduced number of PSs being detected. Furthermore, reliable InSAR assessments require the processing of various SAR images in order to detect statistically stable PSs. This occurrence involves potential computational-related issues, due to the size of the database required at each survey. Lastly, according to the frequency of the adopted sensor, uncertainties may arise in the scattering source, as it is impossible to recognise the scattering object within the resolution cell.

4. Case Study

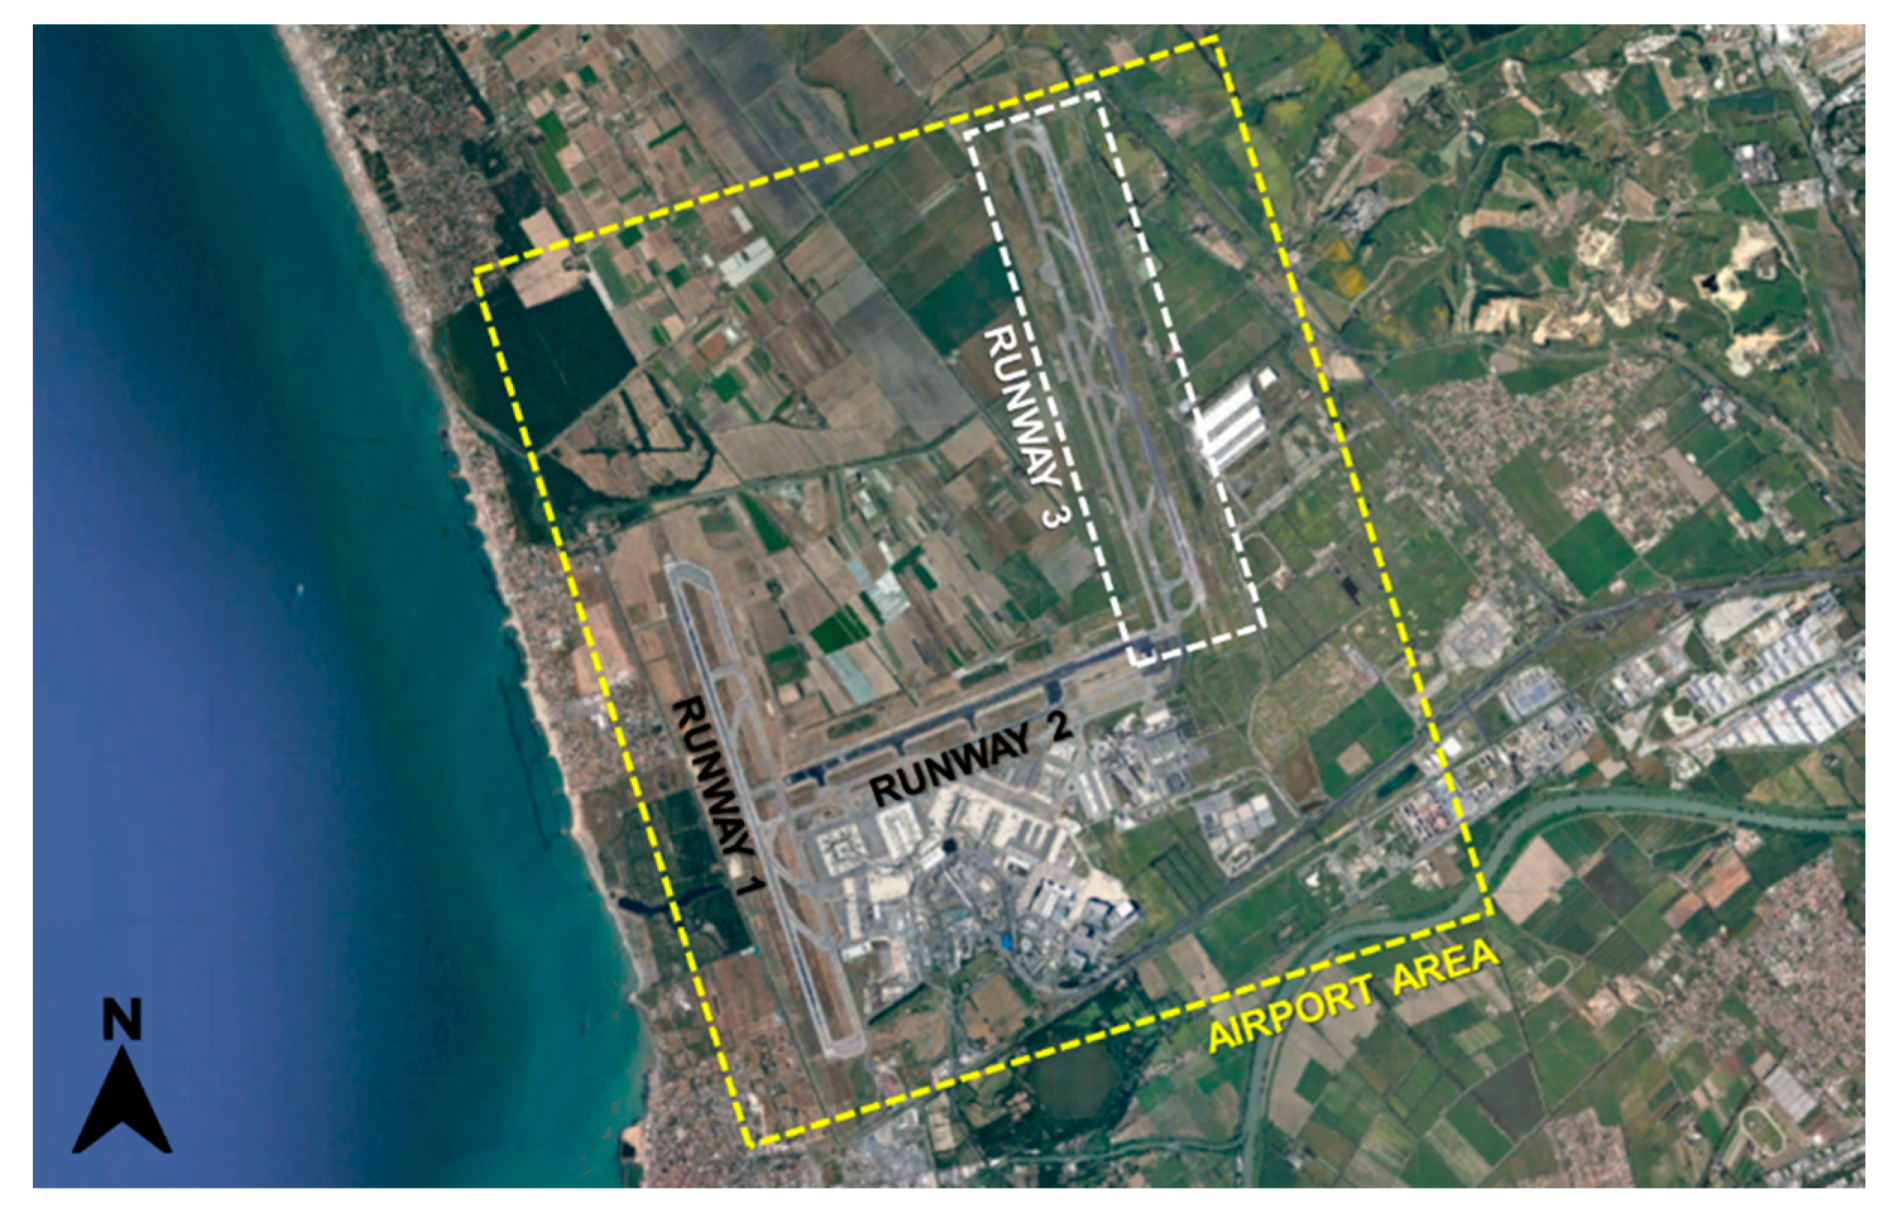
4.1. Site Description

In the present study, a case study is presented where the PSI technique is applied Runway 3 at the “Leonardo da Vinci” International Airport in Rome, Italy.
The airport is located in the area of Fiumicino, about 30 km on the west of Rome, and carries most of the intercontinental air traffic from and towards Italy, that ranks it as one of the major airports in Europe. With an excess of 43 million passengers in 2018 and over 199,000 tons of traffic, the airport is the largest in Italy by number of passengers/year and ranks second by number of cargo flights/year.
The airport has three terminals reserved for domestic, international, and intercontinental flights and three runways. Initially, the layout of the airport included two runways (Runway 1 and Runway 2) only. However, due to an increasing traffic demand, it was expanded with a new runway located in the north-east area of the airport, which develops in the north–south direction (Figure 1)
The area where Runway 3 was realized is known to be affected by the presence of clayey and peaty soils. As a result, the runway was affected by long-term differential subsidence effects, which required accurate monitoring and had to be brought to a full-depth pavement rehabilitation in 2015. This was aimed at increasing the bearing capacity of the subgrade in the norther section of the runway, where severe differential settlements had been recorded in the previous years. Nevertheless, Runway 3 remains a critical asset that is levelled every year in order to be able to monitor the deformation trends and plan maintenance activities.

4.2. Levelling Data

In regard to the on-site topographic surveys conducted on the survey area, a classical geometric levelling survey of the runway was conducted by means of the DNA03 Digital Level system, manufactured by Leica. The elevation measurements were collected by means of a 2 m high levelling rod made of invar, i.e., a metal with a limited thermal expansion coefficient. The main features of the employed levelling system are summarised in Table 1.
In particular, in situ levelling data were collected by multiple closed-loop levelling nets covering the entire Runway 3. The collected nets were automatically compensated, with an average squared root mean error of 0.94 mm. The starting and ending point of the measure was a levelling benchmark located in the north-west corner of the runway area, which was verified to be stable in elevation. This point was connected to the high precision levelling net developed by the Istituto Geografico Militare (IGM), through a levelling line having an average accuracy of 1.0 mm/km.
Tests were performed every year from 2015 to 2019 and covered five sections along the runway with a transversal spacing of 15 metres and a length equal to the entire runway longitudinal development (Figure 2).
Furthermore, the output of these data allows us to detect and exactly quantify the displacements and the average velocity in the investigated time period. Therefore, this information is significant for a validation of the displacements detected by the InSAR technique.

4.3. SAR Imagery

In regard to the application of the InSAR technique, a multi-temporal interferogram analysis of SAR images, namely the Persistent Scatterers Interferometry technique (PSI), was applied. To this effect, two different data stacks were acquired in ascending and descending geometries using high-resolution SAR imagery acquired in X-Band, which allows the detection of displacements with a millimetre accuracy.
In more detail, a dataset of 72 Stripmap images collected in ascending and descending geometries from the COSMO–SkyMed mission (COSMO–SkyMed Product—©ASI: Italian Space Agency, 2015–2019, All Rights Reserved) were processed. The system operates in the X-band corresponding to a wavelength of 3.1 cm, with a 3 m ground-resolution cell. The radar antenna is a phased array that is 1.4 m wide x 5.7 m long. The system is capable of both single- and dual-polarisation data collection. The central frequency is 9.6 GHz with a maximum radar bandwidth of 400 MHz. The main features of the SAR dataset are reported in Table 2.

4.4. Data Processing

These products have been acquired and processed using the PS technique of SARscape Interferometric Stacking Module [47], integrated in the Envi software, within the framework of the project “MOBI: MOnitoring Bridges and Infrastructures networks” (proposal ID 46829), approved by the European Space Agency (ESA).
The processing algorithm includes the following steps [12,13,48,49]:
  • Generation of differential interferograms out of the stack of SAR images;
  • Implementation of High definition Digital Elevation Models (DEM) for topographic phase-term removal;
  • Selection of candidate PS points, through the calculation of the Amplitude Dispersion Index;
  • Coherence-based filtering of the dataset;
  • Phase unwrapping;
  • Identification and removal of the phase values not related to the displacements: evaluation of spatial, orbital, and atmospheric decorrelations;
  • Identification of the displacements and calculation of deformation time series.
In regard to the implementation of the high-definition DEM models, an SRTM v3 “Shuttle Radar Topography Mission” DEM was collected and implemented in the interferometric process [50,51] in order to identify and subtract phase-related parameters linked to the topography of the investigated area. The DEM, with a pixel resolution of 3 arc-second (90 m × 90 m), is made available by NASA in partnership with the United States Geological Survey (USGS) [50].
The outputs of the PSI processing algorithm were exported into a GIS environment and the PSs were displayed as a function of the average annual-motion velocities.
A specific procedure was adopted in order to compare each ground-truth levelled data with a single satellite-derived displacement measure, as follows:
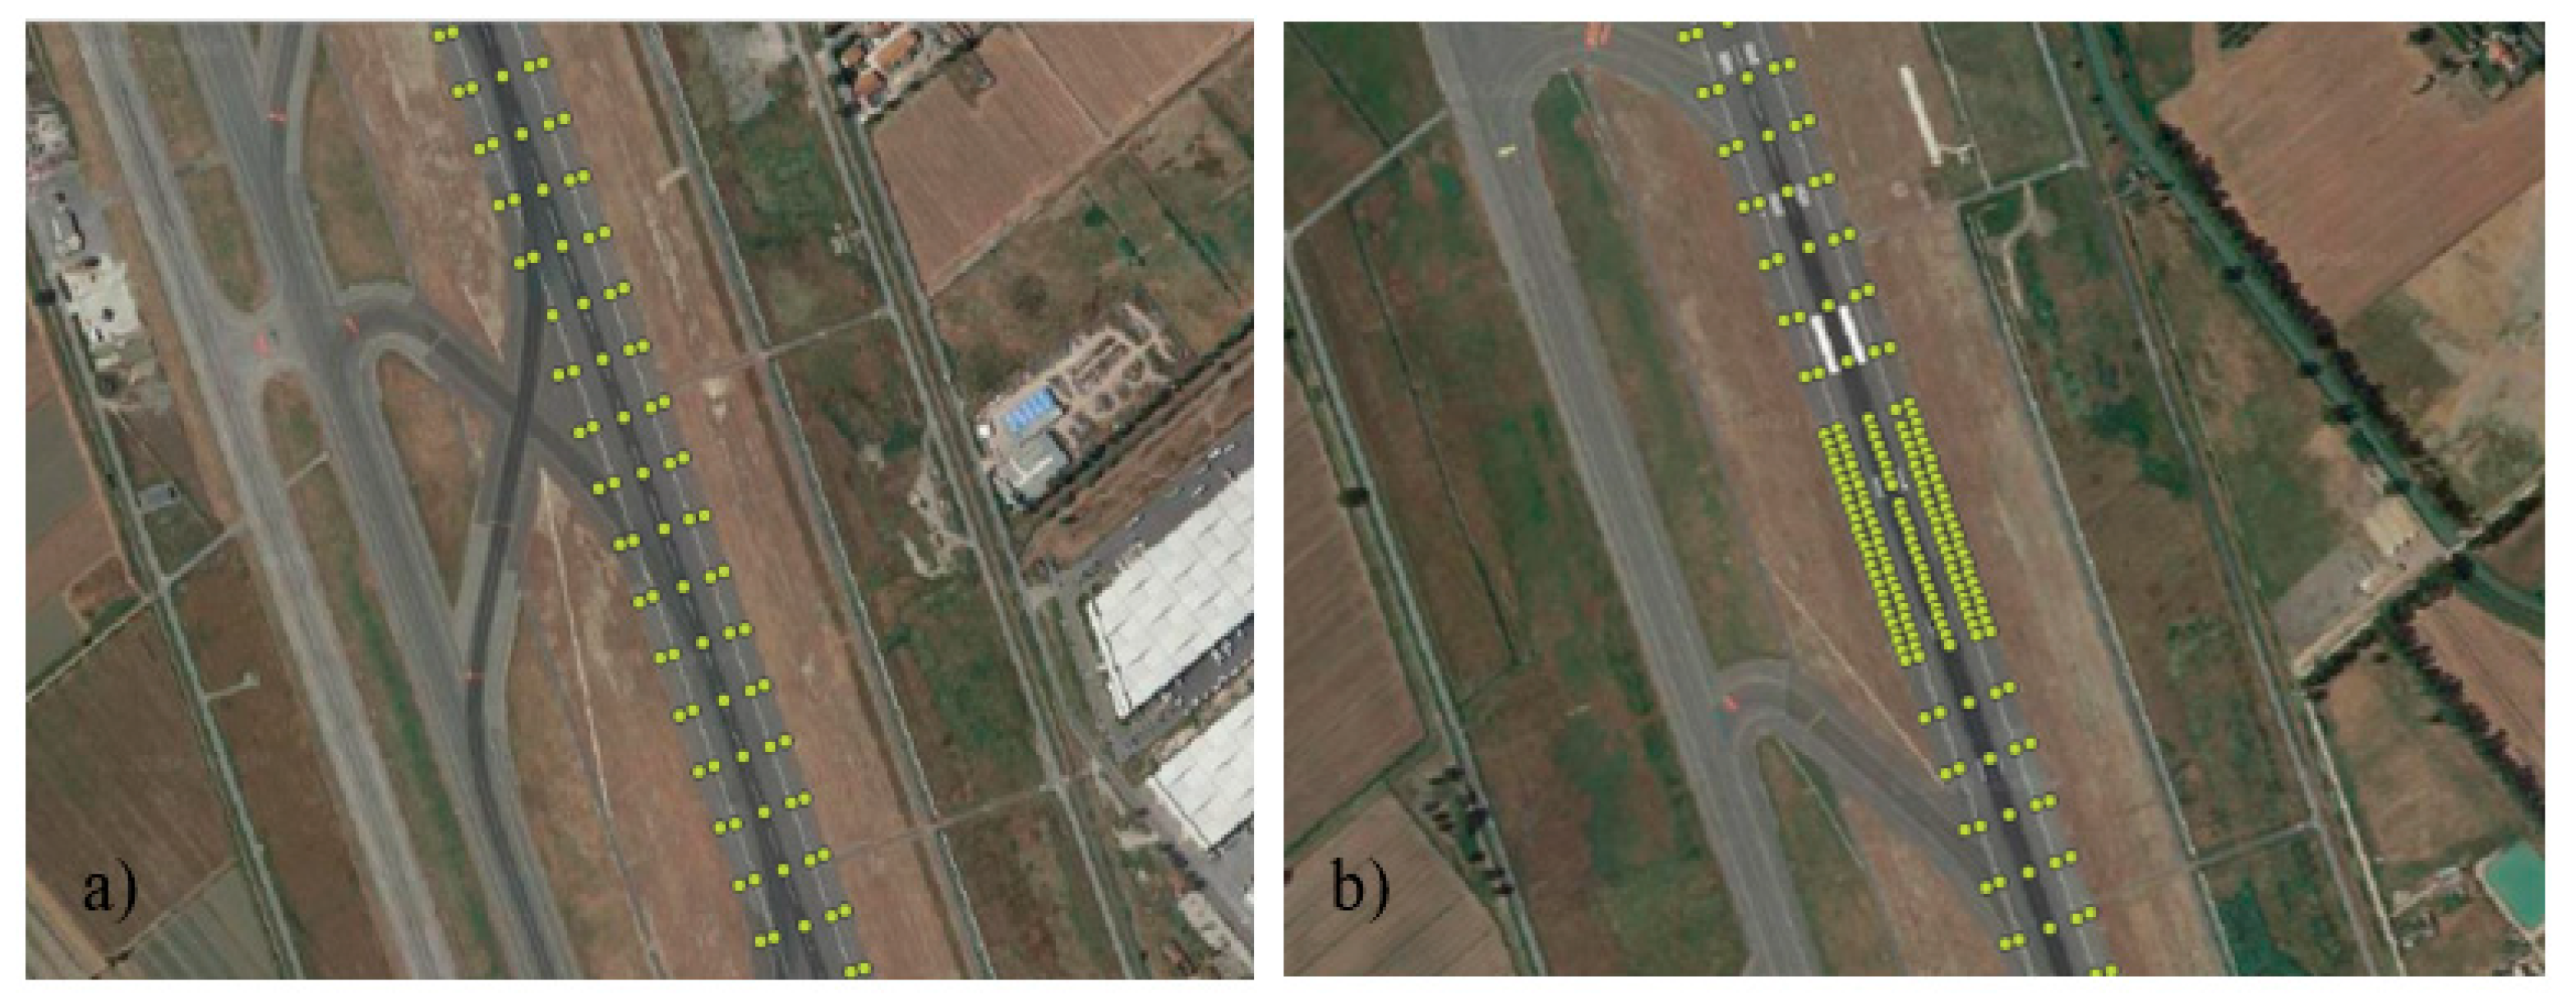
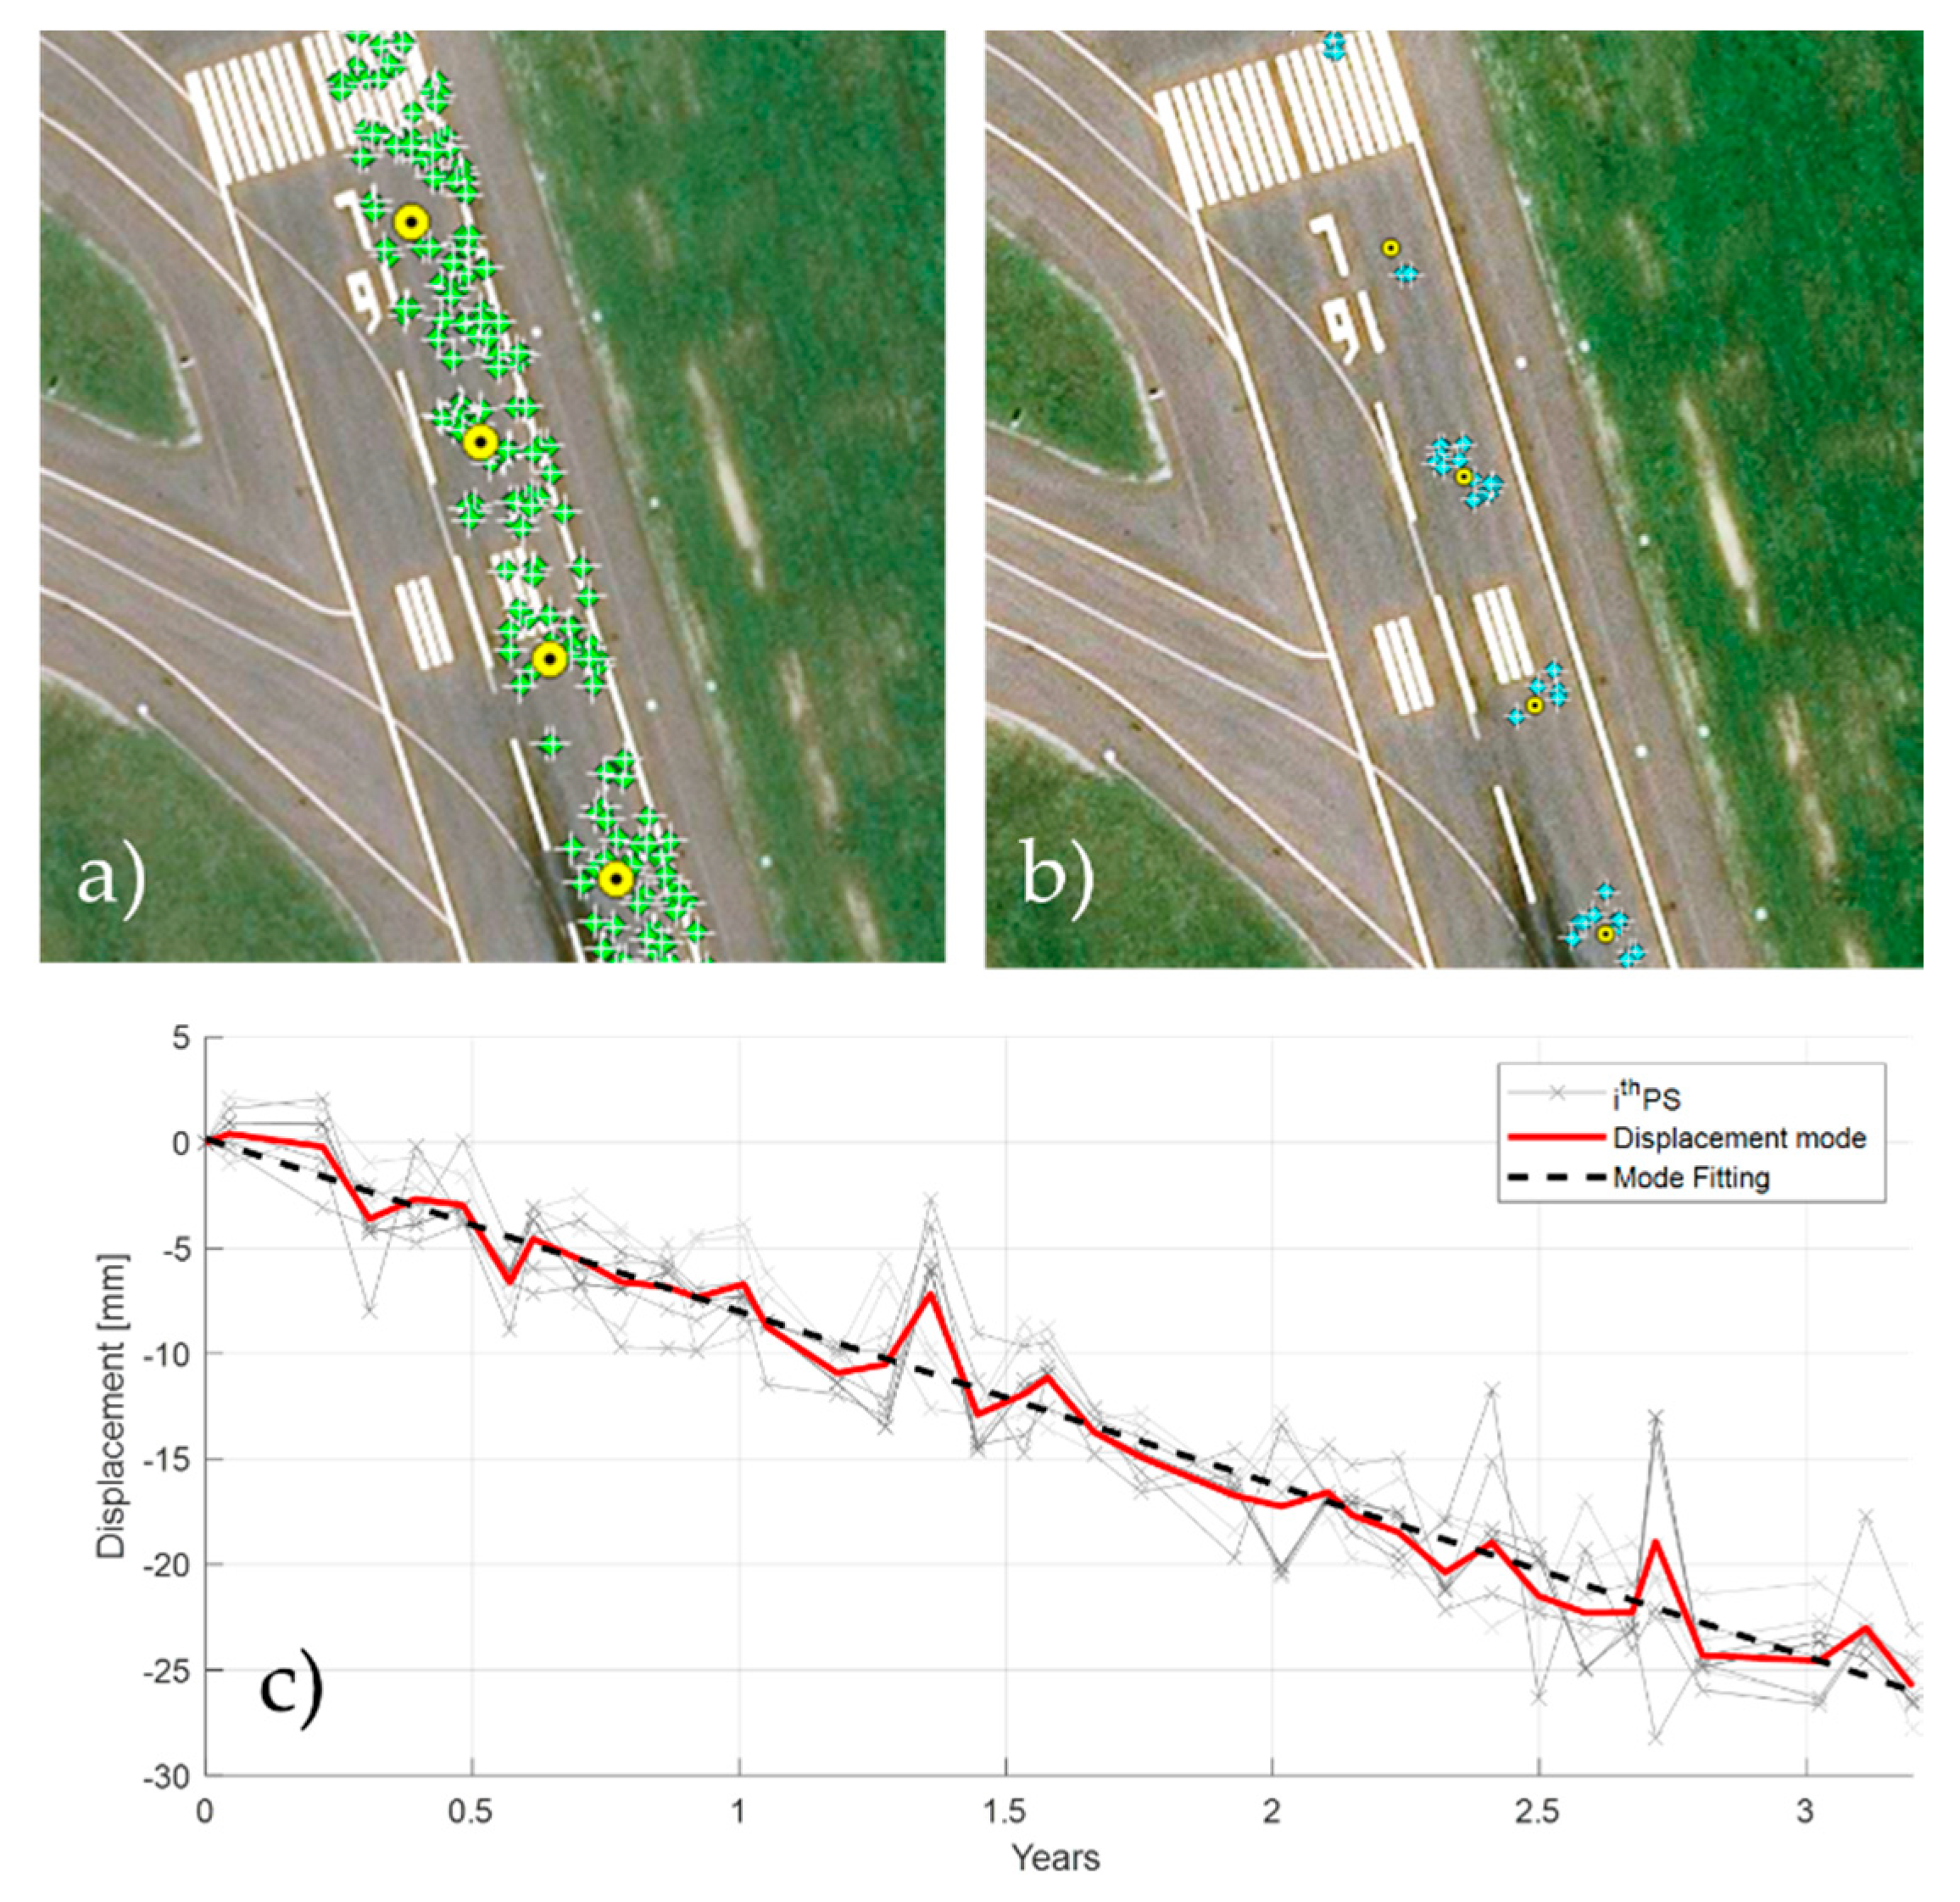
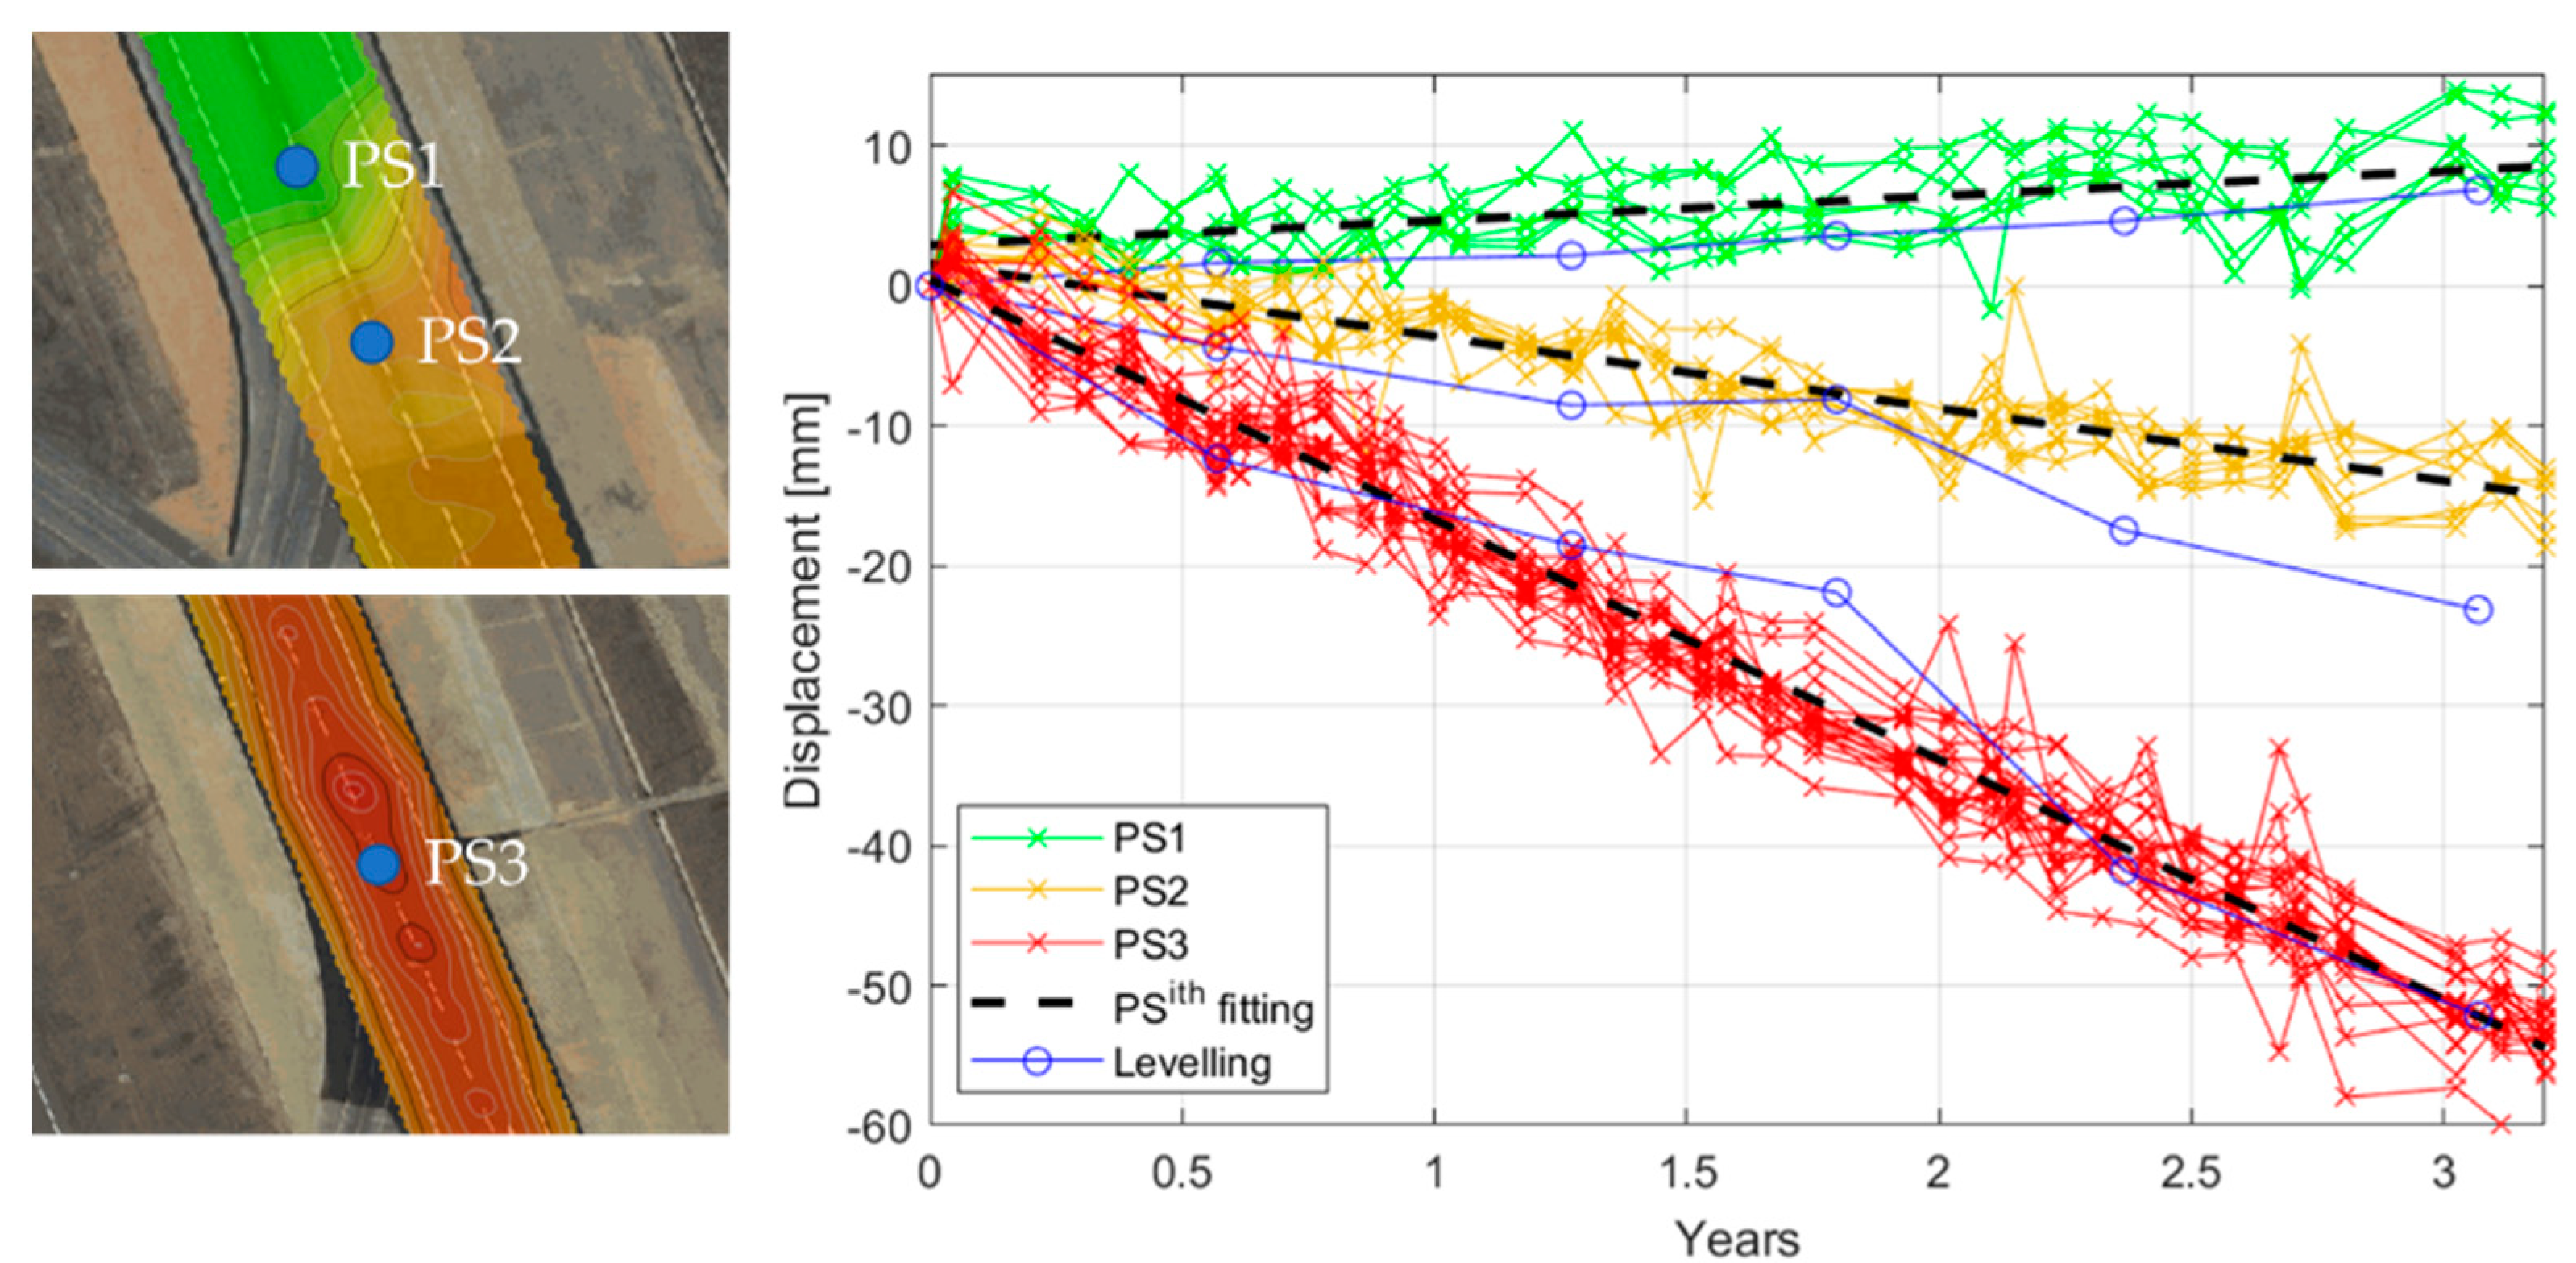
  • All the PSs in the vicinity of the observed levelled point are selected within a distance radius of 10 m (Figure 3a,b);
  • Out of all the selected PSs, a single displacement time series is derived by calculating the moving average of the deformations at each acquisition date (Figure 3c);
  • The displacement velocity is defined by a linear regression of the displacement against time (Figure 3c).
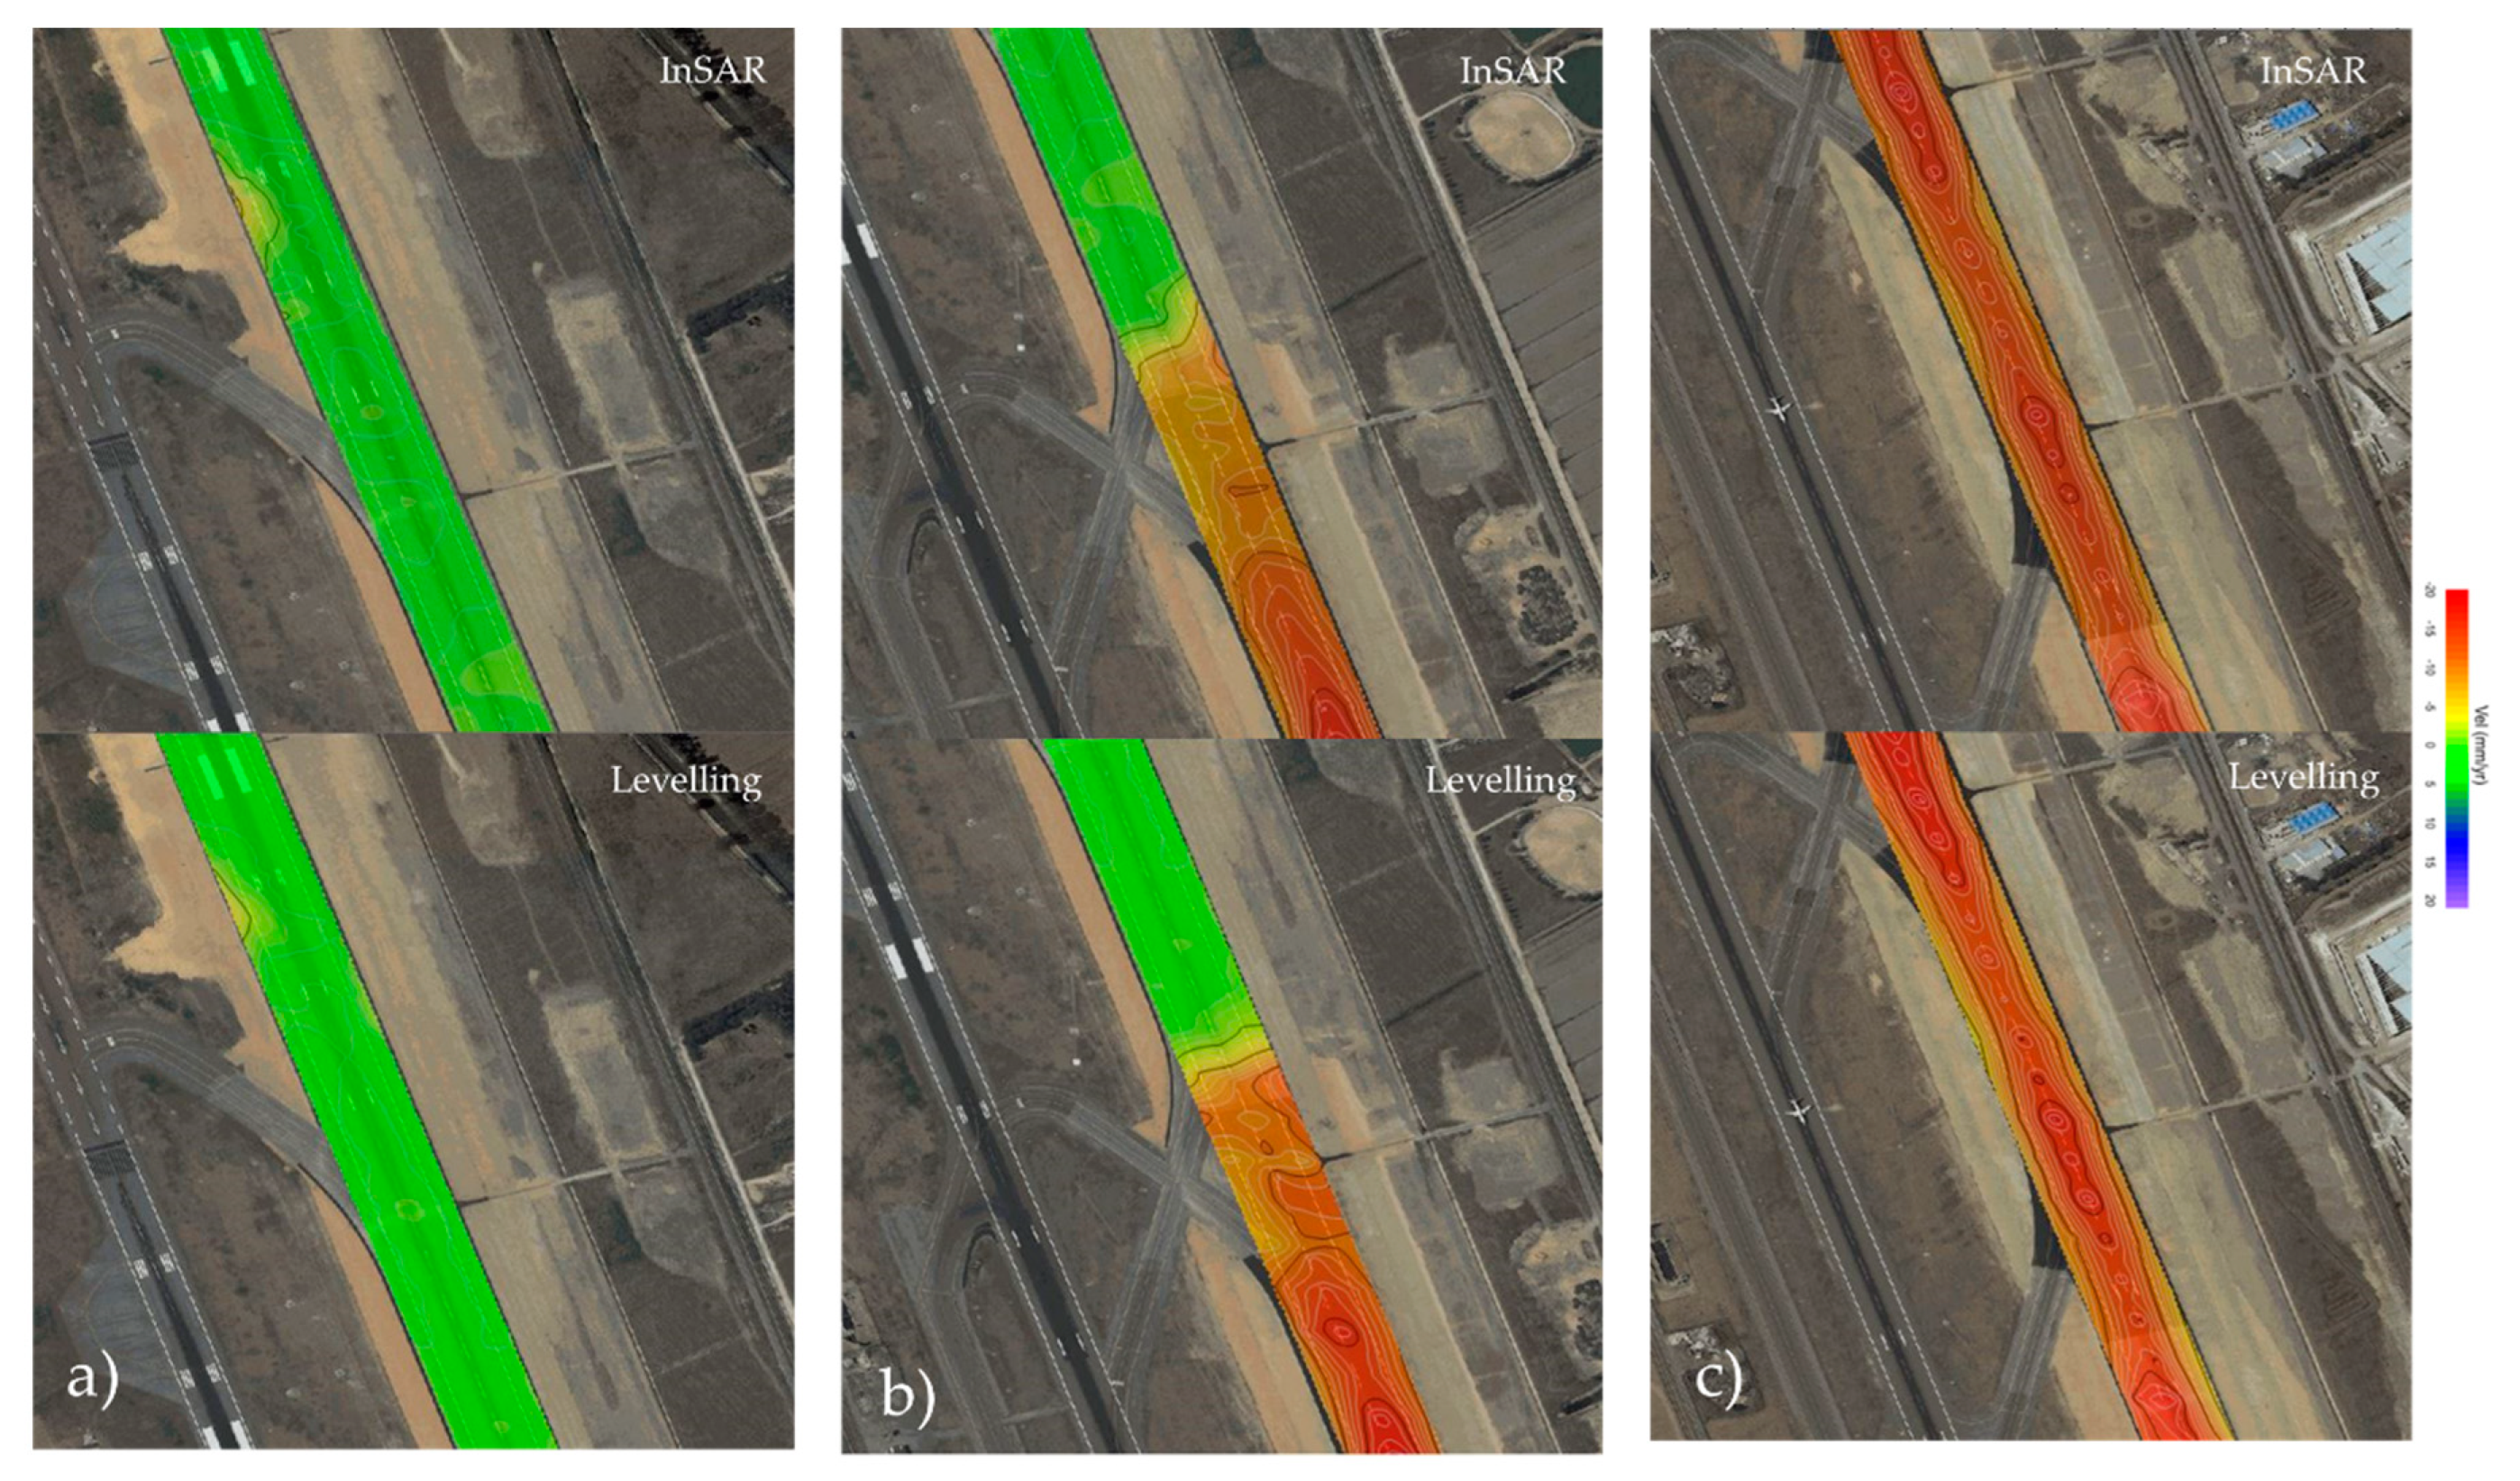
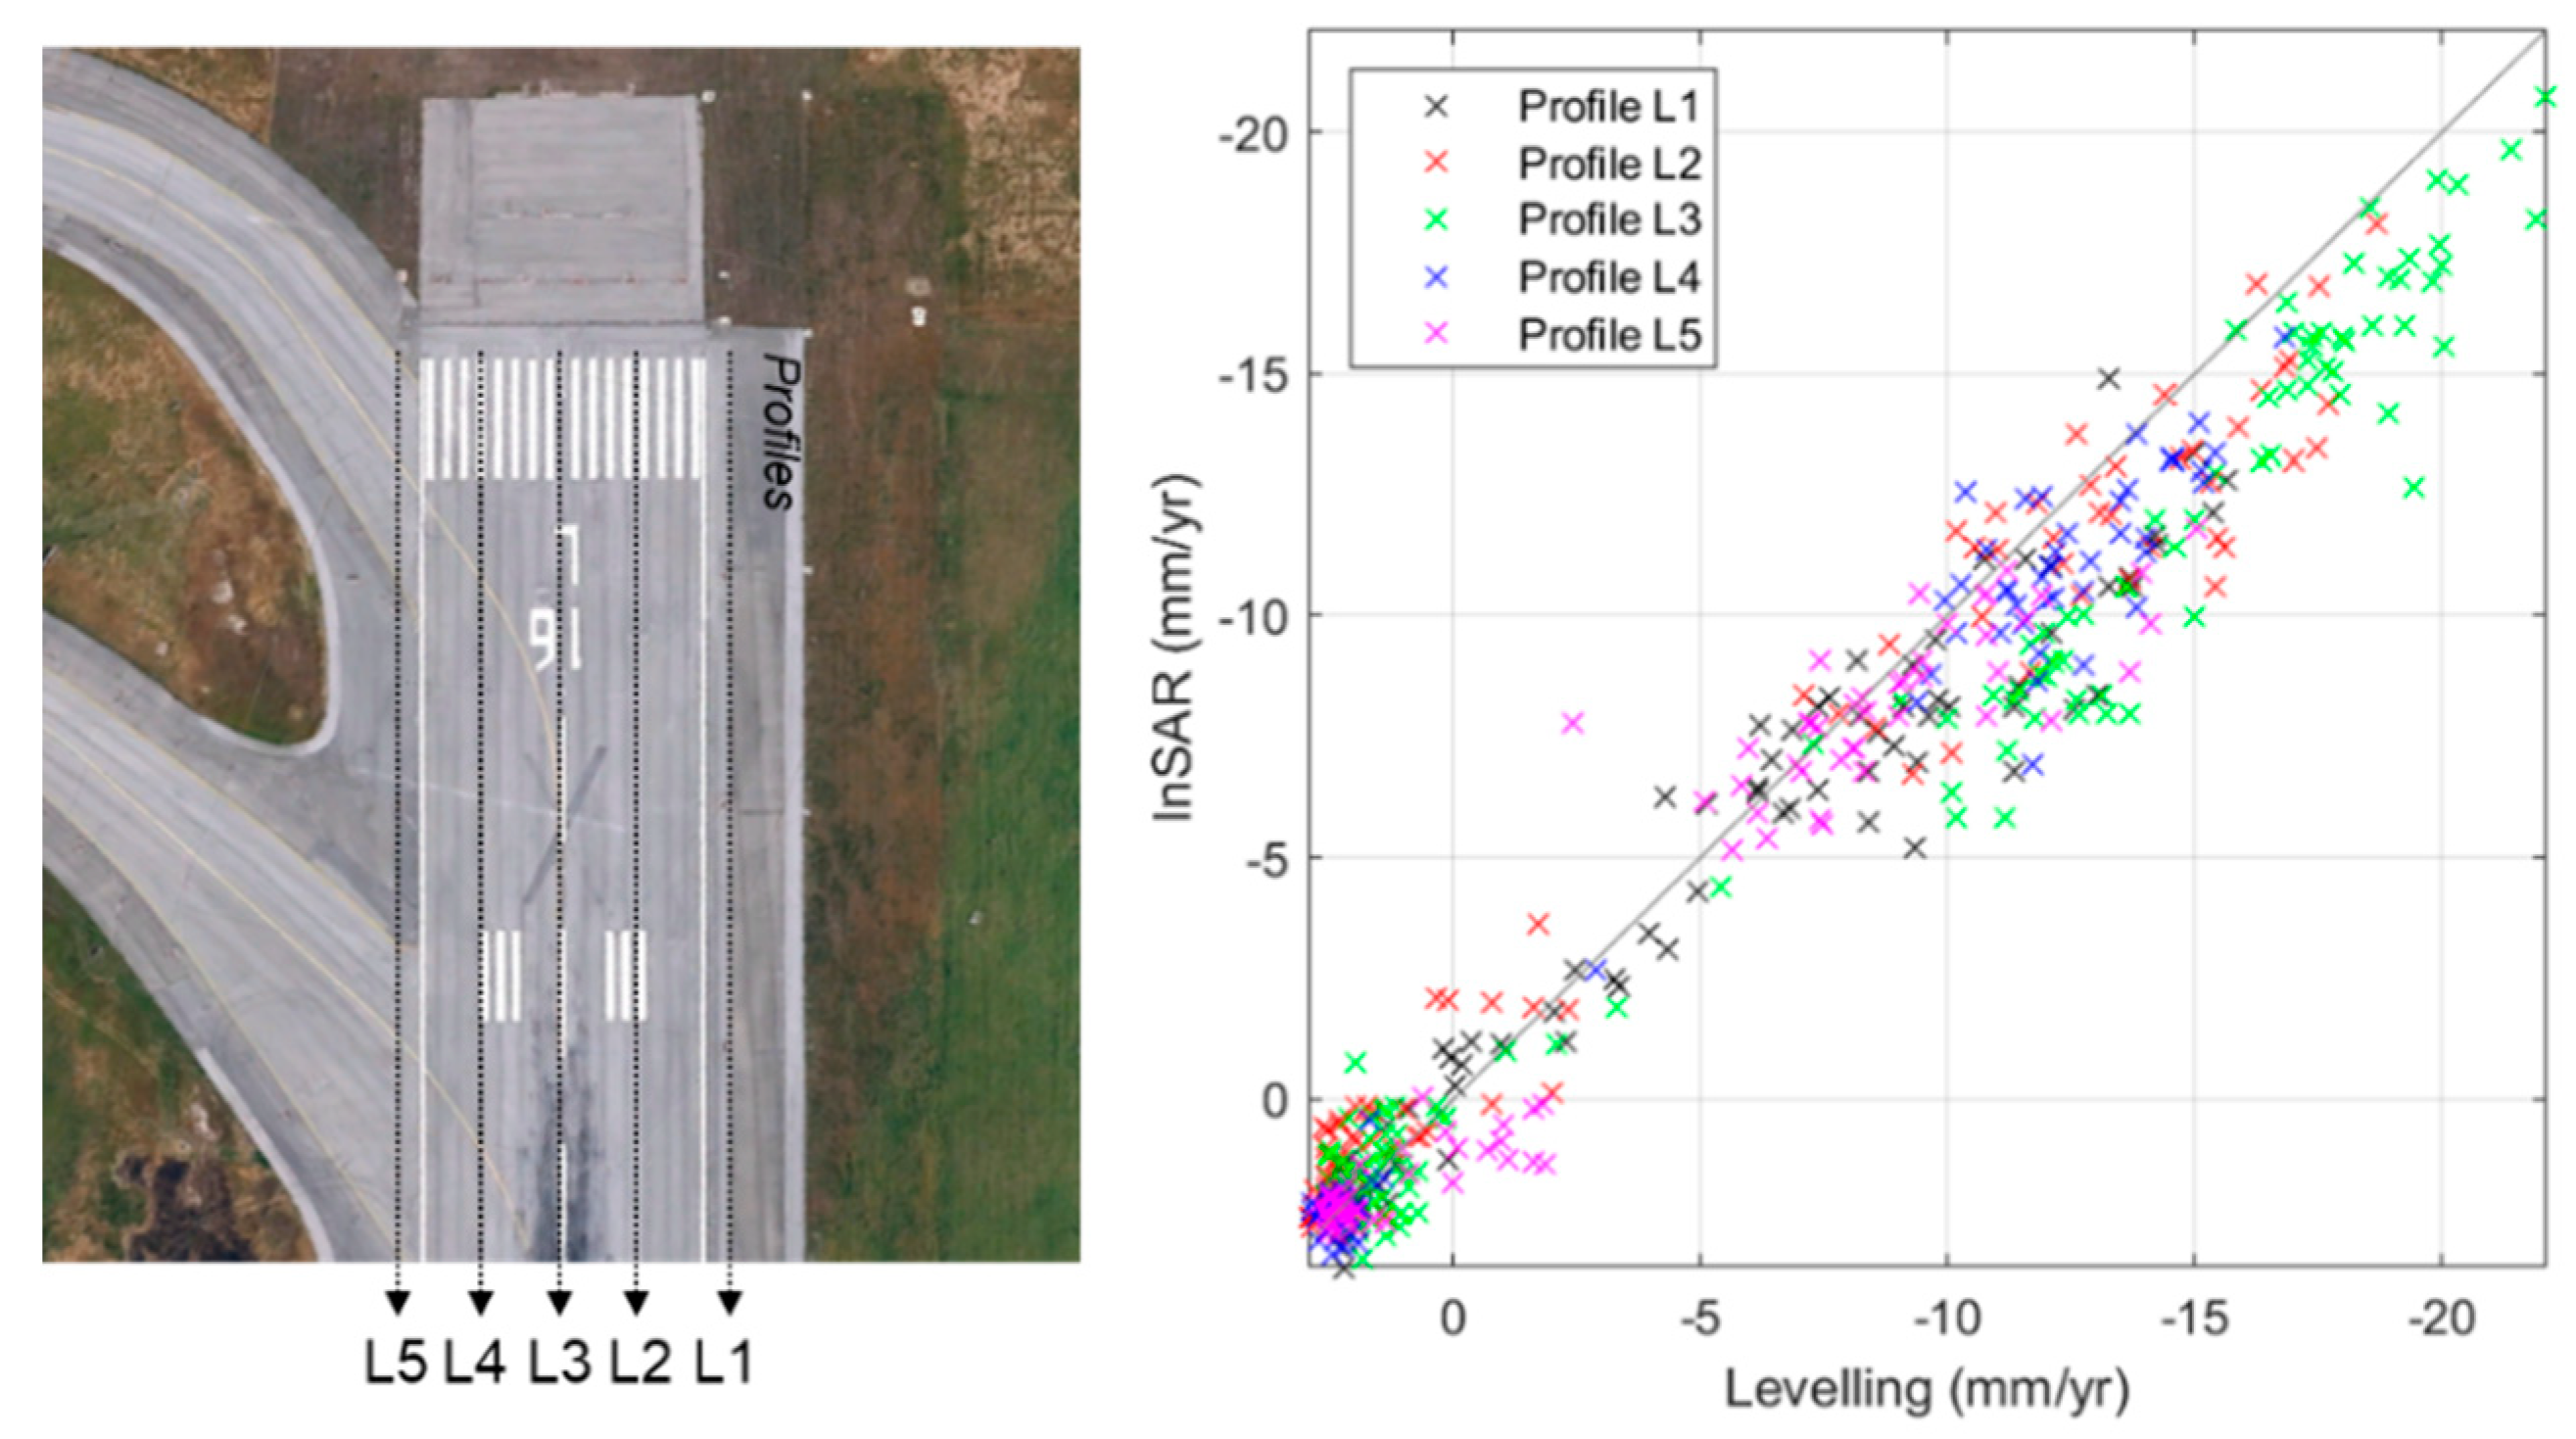
Finally, in order to obtain continuous average-velocity maps representative of the runway condition, a geo-statistical gridding method was implemented both to the PS datasets and the levelling measurements.
The geo-statistical ordinary Kriging method was used for this purpose [52,53]. Kriging is applied due to the flexibility and the high accuracy in the gridding methods and the provision of representative maps applied to different types of datasets. Moreover, it can compensate for clustered data by weighting less than the cluster in the overall prediction. Each grid node value is based on the known data points neighbouring the node. Each data point is weighted by its distance away from the node, and consequently, points that are further from the node will be weighted less in the estimation of the node. To compute the Z ^ (x0) value at a randomly given grid node at position x0, the following equation is used [52,53]:
Z ^ ( x 0 ) = [ w 1   w 2     w n ]   ·   [ z 1 z n ] = i = 1 n w i ( x 0 ) × Z ( x i )
where Z ^ (x0) is the estimated value of the grid node, n is the number of neighbouring data values used in the estimation, Z(xi) is the observed value at the ith location weighting wi(x0) with i ranging between 1 and n. The values of the weights add up to 1 in order to ensure that no bias occurs towards clustered data points. The weights are intended to summarise two important procedures in a spatial inference process, i.e., (i) to reflect the structural proximity of the samples to the estimation location; (ii) in parallel, they should not have a separation effect in order to avoid bias effects caused by potential sample clusters.

5. Results

As a qualitative assessment of the reliability of the PSI technique, Figure 4 shows the velocity maps obtained from the levelling and the PSI techniques by interpolation of the displacement velocity data. The similarity between the two maps in low (Figure 4a), intermediate (Figure 4b), and severe (Figure 4c) displacing conditions demonstrates the accuracy of the prediction made using the satellite measurements.
A quantitative analysis of the results (Figure 5) shows a displacement velocity scatter plot of the whole ensemble of survey points, where points belonging to different longitudinal survey profiles are marked with different colours. A relatively good matching is observed between levelling and PSI across all the five survey sections acquired by levelling, which returned paired values distributed very close to the bisector, regardless of the value of velocity.
The correlation and the loss performance of the prediction are reported in Table 3. This includes Pearson’s coefficients (r) and root squared mean error (RSME) values for the five survey profiles.
It is worthy to note that the survey profile L3 returns slightly less accurate results, as shown in both Figure 5 and Table 3. Especially for the highest values of velocity (which are mainly included within L3), the PSI method seems in fact to underestimate the ground-truth levelled displacement trend. The nature of this coherent error is most likely related to the atmospheric noise contribution, which seems not to be completely filtered out through the applied processing [53,54]. However, the extent of the error is found to be quite limited (around 0.5 cm/year, approximatively). Accordingly, it is observed that the potential of the method in reconstructing the deformation behaviour of the runway is not significantly affected. This allows the provision of very useful information to airport managers for scheduling flight-lists and planning strategic on-site monitoring operations.
As a further confirmation of the above observations, Figure 6 shows the displacement velocity of the survey profiles against the space (WGS84 N Coordinate). Still, it is possible to note that as the displacement trend reaches values higher than 15 mm/year (Figure 6b,c,e), the PSI method turns out to slightly underestimate the deformation rate. However, besides this specific observation, Figure 6 succeeds in demonstrating the effectiveness of PSI in reconstructing the actual deformation pattern over the inspected infrastructure.
In order to evaluate the capability of the method to reconstruct the exact deformation time series of each levelled point, a few examples are here reported, with reference to the three displacement conditions mentioned in Figure 4. More specifically, PS1, PS2, and PS3 in Figure 7 refer to low, intermediate, and severe displacement conditions, respectively.
A quantitative analysis of the comparison between the two methods is instead reported in Table 4. Specifically, for every levelled point, the displacement rate is reported for both the survey methodology, with the reliability of the InSAR measurement being expressed by the root squared mean error.

6. Conclusions

This work demonstrates the applicability of the high-resolution X-band COSMO–SkyMed mission data and the Persistent Scatters Interferometry (PSI) technique in monitoring the deformations occurring on airport runways.
To this purpose, a time-series analysis of a set of satellite images acquired from January 2015 to April 2019 is carried out by employing the PSI technique. To assess the actual reliability of the method in reconstructing the exact deformation pattern of the monitored infrastructure, the outcomes from the PSI technique were compared to those obtained by the traditional topographic levelling technique, which has been applied on the runway at the same time range as the satellite analysis.
The outcome of the analysis clearly indicates that the use of the PSI technique is reliable and accurate for deformation assessment purposes.
More specifically, the application of the PSI technique has proven to be effective in reconstructing the average trend of the annual deformation velocity (see the coloured maps in Figure 4 and the profiles reported in Figure 6) and the monthly deformation time series of each levelled point (see the examples included in Figure 7).
As opposed to the advantages related to the application of this method, it is fair to comment that in the case of the highest rates of deformation observed in the investigated runway, the PSI technique was found to slightly underestimate the subsidence velocity. Such a coherent bias was related to a limited processing of the atmospheric noise contribution, and as a consequence, it is expected to be accounted for by means of an advanced processing phase.
In general, the results presented in this research demonstrate that the PSI technique is worthy of implementation in Airport Pavement Management Systems (APMS), which may profit by a significant increase in the efficiency in the scheduling of maintenance operations.

Author Contributions

Conceptualization, L.B.C. and A.C.; methodology, A.C. and F.D.; investigation, V.G. and C.F.; data curation, L.B.C. and F.D.; writing—original draft preparation, L.B.C. and F.T.; writing—review and editing, F.D., A.C., and F.T. All authors have read and agreed to the published version of the manuscript.

Funding

This research was funded by the Italian Ministry of Education, University and Research (MIUR) under the National Project “Extended resilience analysis of transport networks (EXTRA TN): Towards a simultaneously space, aerial and ground sensed infrastructure for risks prevention”, PRIN 2017, Prot. 20179BP4SM.

Acknowledgments

The license for using the software ENVI SARscape® is granted by the European Space Agency (ESA) approved project "MOBI: MOnitoring Bridges and Infrastructure networks” (EOhops proposal ID 52479). The COSMO–SkyMed Products®—©ASI: Italian Space Agency, 2015–2019, All Rights Reserved- are © of the ASI (Italian Space Agency) delivered under the license to use. In addition, the authors express their deep gratitude to G.R.S. S.r.l. for providing the topographic levelling database, and for the valuable contribution in interpreting the results.

Conflicts of Interest

The authors declare no conflict of interest.

References

  1. Federal Aviation Administration (FAA). Advisory Circular AC 150/5370-10H—Standard Specifications for Construction of Airports. 2018. Available online: https://www.faa.gov/documentLibrary/media/Advisory_Circular/150-5370-10H.pdf (accessed on 10 March 2020).
  2. Federal Aviation Administration (FAA). Advisory Circular AC 150/5320-6F—Airport Pavement Design and Evaluation. 2016. Available online: https://www.faa.gov/documentLibrary/media/Advisory_Circular/150-5320-6F.pdf (accessed on 10 March 2020).
  3. Li, D.; Selig, E.T. Cumulative Plastic Deformation for Fine-Grained Subgrade Soils. J. Geotech. Eng. 1996, 122, 1006–1013. [Google Scholar] [CrossRef]
  4. Zhou, J.; Gong, X.; Li, J. Experimental study on saturated soft clay under cyclic loading. Ind. Constr. 2000, 30, 43–47. [Google Scholar]
  5. Bevilacqua, M.; Braglia, M. The analytic hierarchy process applied to maintenance strategy selection. Reliab. Eng. Syst. Saf. 2000, 70, 71–83. [Google Scholar] [CrossRef]
  6. Cosser, E.; Roberts, G.W.; Meng, X.; Dodson, A.H. Measuring the Dynamic Deformation of Bridges Using a Total Station. In Proceedings of the 11th FIG Symposium on Deformation Measurements, Santorini, Greece, 25–28 May 2003. [Google Scholar]
  7. Chen, W.; Yuan, J.; Li, M. Application of GIS/GPS in Shanghai Airport Pavement Management System. Procedia Eng. 2012, 29, 2322–2326. [Google Scholar] [CrossRef] [Green Version]
  8. Barbarella, M.; De Blasiis, M.R.; Fiani, M. Terrestrial laser scanner for the analysis of airport pavement geometry. Int. J. Pavement Eng. 2017, 20, 466–480. [Google Scholar] [CrossRef]
  9. Ciampoli, L.B.; Gagliardi, V.; Clementini, C.; Latini, D.; Del Frate, F.; Benedetto, A. Transport Infrastructure Monitoring by InSAR and GPR Data Fusion. Surv. Geophys. 2019, 41, 371–394. [Google Scholar] [CrossRef]
  10. Bru, G.; Herrera, G.; Tomás, R.; Duro, J.; De La Vega, R.; Mulas, J. Control of deformation of buildings affected by subsidence using persistent scatterer interferometry. Struct. Infrastruct. Eng. 2010, 9, 1–13. [Google Scholar] [CrossRef]
  11. Koudogbo, F.; Urdiroz, A.; Robles, J.G.; Chapron, G.; Lebon, G.; Fluteaux, V.; Priol, G. Radar interferometry as an innovative solution for monitoring the construction of the Grand Paris Express metro network—First results. In Proceedings of the World Tunnel Conference, Dubai, UAE, 21–25 April 2018. [Google Scholar]
  12. Ferretti, A.; Prati, C.; Rocca, F. Nonlinear subsidence rate estimation using permanent scatterers in indifferential SAR interferometry. IEEE Trans. Geosci. Remote Sens. 2000, 38, 2202–2212. [Google Scholar] [CrossRef] [Green Version]
  13. Ferretti, A.; Prati, C.; Rocca, F. Analysis of permanent scatterers in {SAR} interferometry. IEEE Trans. Geosci. Remote Sens. 2000, 39, 761–763. [Google Scholar]
  14. Elhassan, I.M.; Ali, A. Comparative study of accuracy in distance measurement using: Optical and digital levels. J. King Saud Univ. Eng. Sci. 2011, 23, 15–19. [Google Scholar] [CrossRef] [Green Version]
  15. Kuhlmann, H.; Glaser, A. Investigation of New Measurement Techniques for Bridge Monitoring. In Proceedings of the 2nd Symposium on Geodesy for Geotechnical and Structural Engineering, Berlin, Germany, 21–24 May 2002. [Google Scholar]
  16. Uddin, W.; Gutelius, B.; Parrish, C. Airborne Laser Survey Specifications and Quality Management Protocols for Airport Obstruction Surveys. Transp. Res. Rec. J. Transp. Res. Board 2011, 2214, 117–125. [Google Scholar] [CrossRef]
  17. Hill, C.D.; Sippel, K.D. Modern Deformation Monitoring: A Multi Sensor Approach. In Proceedings of the FIG XXII International Congress, Washington, DC, USA, 19–26 April 2002. [Google Scholar]
  18. Radovanovic, R.S.; Teskey, W.F. Dynamic Monitoring of Deforming Structures: GPS verses Robotic Tacheometry Systems. In Proceedings of the 10th FIG International Symposium on Deformation Measurements, Orange, CA, USA, 19–22 March 2001. [Google Scholar]
  19. Meng, X. Real-time Deformation Monitoring of Bridges Using GPS/Accelerometers. Ph.D. Thesis, University of Nottingham, Nottingham, UK, 2002. [Google Scholar]
  20. Uddin, W.; Al-Turk, E. Airport obstruction space management using airborne LIDAR three dimensional digital terrain mapping. In Proceedings of the Federal Aviation Administration Technology Transfer Conference, Washington, DC, USA, 20–22 April 2002. [Google Scholar]
  21. Kim, J.S.; Lee, J.C.; Kang, I.J.; Cha, S.Y.; Choi, H.; Lee, T.G. Extraction of geometric information on highway using terrestrial laser scanning technology. Int. Arch. Photogramm. Remote Sens. Spat. Inf. Sci. 2008, 37, 539–544. [Google Scholar]
  22. Williams, K.; Olsen, M.J.; Roe, G.V.; Glennie, C. Synthesis of Transportation Applications of Mobile LIDAR. Remote Sens. 2013, 5, 4652–4692. [Google Scholar] [CrossRef] [Green Version]
  23. Laurent, J.; Hébert, J.F.; Lefebvre, D.; Savard, Y. Using 3D Laser Profiling Sensors for the Automated Measurement of Road Surface Conditions. In Proceedings of the 7th RILEM International Conference on Cracking in Pavements, Delft, The Netherlands, 20–22 June 2012; Volume 4, pp. 157–167. [Google Scholar]
  24. Pu, S.; Rutzinger, M.; Vosselman, G.; Elberink, S.O. Recognizing basic structures from mobile laser scanning data for road inventory studies. ISPRS J. Photogramm. Remote Sens. 2011, 66, S28–S39. [Google Scholar] [CrossRef]
  25. De Blasiis, M.R.; Di Benedetto, A.; Fiani, M. Mobile Laser Scanning Data for the Evaluation of Pavement Surface Distress. Remote Sens. 2020, 12, 942. [Google Scholar] [CrossRef] [Green Version]
  26. Barbarella, M.; D’Amico, F.; De Blasiis, M.R.; Di Benedetto, A.; Fiani, M. Use of Terrestrial Laser Scanner for Rigid Airport Pavement Management. Sensors 2017, 18, 44. [Google Scholar] [CrossRef] [PubMed] [Green Version]
  27. Colesanti, C.; Ferretti, A.; Prati, C.; Rocca, F. Monitoring landslides and tectonic motions with the Permanent Scatterers Technique. Eng. Geol. 2003, 68, 3–14. [Google Scholar] [CrossRef]
  28. Colombo, D.; Farina, P.; Moretti, S.; Nico, G.; Prati, C. Land subsidence in the Firenze-Prato-Pistoia basin measured by means of spaceborne SAR interferometry. In Proceedings of the 2003 IEEE International Geoscience and Remote Sensing Symposium (IGARSS 2003), Toulouse, France, 21–25 July 2003; Volume 4, pp. 2927–2929. [Google Scholar]
  29. Frattini, P.; Crosta, G.B.; Allievi, J. Damage to Buildings in Large Slope Rock Instabilities Monitored with the PSInSAR™ Technique. Remote Sens. 2013, 5, 4753–4773. [Google Scholar] [CrossRef] [Green Version]
  30. Yu, B.; Liu, G.; Zhang, R.; Jia, H.; Li, T.; Wang, X.; Dai, K.; Ma, D. Monitoring subsidence rates along road network by persistent scatterer SAR interferometry with high-resolution TerraSAR-X imagery. J. Mod. Transp. 2013, 21, 236–246. [Google Scholar] [CrossRef] [Green Version]
  31. Perissin, D.; Wang, Z.; Lin, H. Shanghai subway tunnels and highways monitoring through Cosmo-SkyMed Persistent Scatterers. ISPRS J. Photogramm. Remote Sens. 2012, 73, 58–67. [Google Scholar] [CrossRef]
  32. Fárová, K.; Jelének, J.; Kopačková-Strnadová, V.; Kycl, P. Comparing DInSAR and PSI Techniques Employed to Sentinel-1 Data to Monitor Highway Stability: A Case Study of a Massive Dobkovičky Landslide, Czech Republic. Remote Sens. 2019, 11, 2670. [Google Scholar] [CrossRef] [Green Version]
  33. Milillo, P.; Giardina, G.; Perissin, D.; Milillo, G.; Coletta, A.; Terranova, C. Pre-Collapse Space Geodetic Observations of Critical Infrastructure: The Morandi Bridge, Genoa, Italy. Remote Sens. 2019, 11, 1403. [Google Scholar] [CrossRef] [Green Version]
  34. D’Amico, F.; Gagliardi, V.; Ciampoli, L.B.; Tosti, F. Integration of InSAR and GPR techniques for monitoring transition areas in railway bridges. NDT E Int. 2020, 115, 102291. [Google Scholar] [CrossRef]
  35. Alani, A.M.; Tosti, F.; Bianchini Ciampoli, L.; Gagliardi, V.; Benedetto, A. Integration of GPR and InSAR methods for the health monitoring of masonry arch bridges. NDT E Int. 2020, in press. [Google Scholar] [CrossRef]
  36. Jung, J.; Kim, D.-J.; Vadivel, S.K.P.; Yun, S.-H. Long-Term Deflection Monitoring for Bridges Using X and C-Band Time-Series SAR Interferometry. Remote Sens. 2019, 11, 1258. [Google Scholar] [CrossRef] [Green Version]
  37. Ciampoli, L.B.; Gagliardi, V.; Calvi, A.; D’Amico, F.; Tosti, F. Automatic network level bridge monitoring by integration of InSAR and GIS catalogues. Multimodal Sens. Technol. Appl. 2019, 11059, 110590I. [Google Scholar] [CrossRef] [Green Version]
  38. Roccheggiani, M.; Piacentini, D.; Tirincanti, E.; Perissin, D.; Menichetti, M. Detection and Monitoring of Tunneling Induced Ground Movements Using Sentinel-1 SAR Interferometry. Remote Sens. 2019, 11, 639. [Google Scholar] [CrossRef] [Green Version]
  39. Barla, G.; Tamburini, A.; Del Conte, S.; Giannico, C. InSAR monitoring of tunnel induced ground movements. Géoméch. Tunnelbau 2016, 9, 15–22. [Google Scholar] [CrossRef]
  40. Yang, Z.; Schmid, F.; Roberts, C. Assessment of Railway Performance by Monitoring Land Subsidence. In Proceedings of the 6th IET Conference on Railway Condition Monitoring (RCM 2014), Birmingham, UK, 17–18 September 2014; pp. 1–6. [Google Scholar]
  41. Chang, L.; Dollevoet, R.P.B.J.; Hanssen, R.F. Nationwide Railway Monitoring Using Satellite SAR Interferometry. IEEE J. Sel. Top. Appl. Earth Obs. Remote Sens. 2016, 10, 596–604. [Google Scholar] [CrossRef]
  42. Qin, X.; Liao, M.; Zhang, L.; Yang, M. Structural Health and Stability Assessment of High-Speed Railways via Thermal Dilation Mapping With Time-Series InSAR Analysis. IEEE J. Sel. Top. Appl. Earth Obs. Remote Sens. 2017, 10, 2999–3010. [Google Scholar] [CrossRef] [Green Version]
  43. Tosti, F.; Gagliardi, V.; D’Amico, F.; Alani, A.M. Transport infrastructure monitoring by data fusion of GPR and SAR imagery information. Transp. Res. Procedia 2020, 45, 771–778. [Google Scholar] [CrossRef]
  44. Jiang, L.; Lin, H. Integrated analysis of SAR interferometric and geological data for investigating long-term reclamation settlement of Chek Lap Kok Airport, Hong Kong. Eng. Geol. 2010, 110, 77–92. [Google Scholar] [CrossRef]
  45. Gao, M.; Gong, H.; Chen, B.; Zhou, C.; Chen, W.; Liang, Y.; Shi, M.; Si, Y. InSAR time-series investigation of long-term ground displacement at Beijing Capital International Airport, China. Tectonophysics 2016, 691, 271–281. [Google Scholar] [CrossRef]
  46. Jiang, Y.; Liao, M.; Wang, H.; Zhang, L.; Balz, T. Deformation Monitoring and Analysis of the Geological Environment of Pudong International Airport with Persistent Scatterer SAR Interferometry. Remote Sens. 2016, 8, 1021. [Google Scholar] [CrossRef] [Green Version]
  47. Sarmap. SARscape Technical Description. Available online: http://www.sarmap.ch/pdf/SARscapeTechnical.pdf/ (accessed on 22 July 2020).
  48. Sarmap. SAR-Guidebook. Available online: http://www.sarmap.ch/pdf/SAR-Guidebook.pdf (accessed on 22 July 2020).
  49. NASA. The Shuttle Radar Topography Mission (SRTM) Collection User Guide. 2015. Available online: https://lpdaac.usgs.gov/documents/179/SRTM_User_Guide_V3.pdf (accessed on 11 February 2020).
  50. Rodriguez, E.; Morris, C.S.; Belz, J.E.; Chapin, E.C.; Martin, J.M.; Daffer, W.; Hensley, S. An assessment of the SRTM Topographic Products; Technical Report JPL D-31639; Jet Propulsion Laboratory: Pasadena, CA, USA, 2005; p. 143. [Google Scholar]
  51. Giraldo, R.; Delicado, P.; Mateu, J. Ordinary kriging for function-valued spatial data. Environ. Ecol. Stat. 2010, 18, 411–426. [Google Scholar] [CrossRef] [Green Version]
  52. Papritz, A.; Stein, A. Spatial prediction by linear kriging. In Spatial Statistics for Remote Sensing; Springer Science and Business Media LLC: Berlin/Heidelberg, Germany, 1999; Volume 1, pp. 83–113. [Google Scholar]
  53. Doin, M.-P.; Lasserre, C.; Peltzer, G.; Cavalié, O.; Doubre, C. Corrections of stratified tropospheric delays in SAR interferometry: Validation with global atmospheric models. J. Appl. Geophys. 2009, 69, 35–50. [Google Scholar] [CrossRef]
  54. Fattahi, H.; Amelung, F. InSAR bias and uncertainty due to the systematic and stochastic tropospheric delay. J. Geophys. Res. Solid Earth 2015, 120, 8758–8773. [Google Scholar] [CrossRef] [Green Version]
Figure 1. Satellite view of “Leonardo Da Vinci” International Airport and location area of Runway 3 (Google Earth Image, 2015).
Remotesensing 12 03564 g001
Figure 2. Scheme of in situ levelling data: (a) section in the middle region of Runway 3; (b) increase in measuring points density on the ground in the area interested by subsidence effects.
Remotesensing 12 03564 g002
Figure 3. Scheme of SAR data processing: (a) visualisation of the whole PS (green) and levelling (yellow) datasets; (b) selection of PSs (blue) within a 10 m radius from each levelling point (yellow); (c) reconstruction of a single time series and deformation velocity starting from the PS sample.
Remotesensing 12 03564 g003
Figure 4. Comparison between the velocity maps obtained by (top) Persistent Scatterers Interferometry (PSI) datasets and (bottom) levelling, relative to (a) low (from 2600 m to 3200 m in N direction), (b) intermediate (from 1900 m to 2600 m in N direction), and (c) severe (from 850 m to 1620 m in N direction) displacing conditions.
Remotesensing 12 03564 g004
Figure 5. Displacement velocity scatter plot comparing observed (levelling) and predicted (PSI) data.
Remotesensing 12 03564 g005
Figure 6. Displacement velocity trends for longitudinal survey profiles (ae) L1 to L5.
Remotesensing 12 03564 g006
Figure 7. Deformation time series for three points related to low, intermediate, and severe displacement conditions.
Remotesensing 12 03564 g007
Table 1. Main features of the employed levelling equipment.
Leica DNA03
Measuring RangeUp to 110 m
Measuring TimeOperator Dependent
Levelling Accuracy (Std Dev.)±0.3 mm/km
CompensatorPendulum with magnetic damping
DisplayLCD
Table 2. Main features of the Synthetic Aperture Radar Interferometry (SAR) imagery dataset from the COSMO–SkyMed mission—Italian Space Agency (ASI).
Ascending GeometryDescending Geometry
Number of Images3537
Reference Period01/2015–04/201903/2016–04/2019
Frequency/Wavelength9.6 GHz/3.1 cm
Ground-Range Resolution3 m
Azimuth Resolution3 m
Table 3. Summary of the PSI potential in predicting levelling results.
Survey Profiler (-)RSME (mm/yr)
L10.97311.6430
L20.98371.6931
L30.98572.3477
L40.99071.3247
L50.96811.5361
Table 4. Quantitative analysis of the comparison between InSAR and levelling for the three PS in the example.
Surveyed PointDisplacement Velocity by Levelling (mm/yr)Displacement Velocity by InSAR (mm/yr)RSME (mm)
PS11.681.762.4659
PS2−6.21−5.164.9875
PS3−16.93−17.163.9101
Publisher’s Note: MDPI stays neutral with regard to jurisdictional claims in published maps and institutional affiliations.

