Article

Evaluations of Machine Learning-Based CYGNSS Soil Moisture Estimates against SMAP Observations

1
Geosystems Research Institute, Mississippi State University, Mississippi State, MS 39759, USA
2
Department of Electrical and Computer Engineering, Mississippi State University, Mississippi State, MS 39759, USA
*
Author to whom correspondence should be addressed.
Remote Sens. 2020, 12(21), 3503; https://doi.org/10.3390/rs12213503
Submission received: 8 September 2020 / Revised: 16 October 2020 / Accepted: 21 October 2020 / Published: 25 October 2020
(This article belongs to the Special Issue Applications of GNSS Reflectometry for Earth Observation)

Abstract

:
This paper presents a machine learning (ML) framework to derive a quasi-global soil moisture (SM) product by direct use of the Cyclone Global Navigation Satellite System (CYGNSS)’s high spatio-temporal resolution observations over the tropics (within ± 38 ° latitudes) at L-band. The learning model is trained by using in-situ SM data from the International Soil Moisture Network (ISMN) sites and various space-borne ancillary data. The approach produces daily SM retrievals that are gridded to 3 km and 9 km within the CYGNSS spatial coverage. The performance of the model is independently evaluated at various temporal scales (daily, 3-day, weekly, and monthly) against Soil Moisture Active Passive (SMAP) mission’s enhanced SM products at a resolution of 9 km × 9 km. The mean unbiased root-mean-square difference (ubRMSD) between concurrent (same calendar day) CYGNSS and SMAP SM retrievals for about three years (from 2017 to 2019) is 0.044 cm 3 cm 3 with a correlation coefficient of 0.66 over SMAP recommended grids. The performance gradually improves with temporal averaging and degrades over regions regularly flagged by SMAP such as dense forest, high topography, and coastlines. Furthermore, CYGNSS and SMAP retrievals are evaluated against 170 ISMN in-situ observations that result in mean unbiased root-mean-square errors (ubRMSE) of 0.055 cm 3 cm 3 and 0.054 cm 3 cm 3 , respectively, and a higher correlation coefficient with CYGNSS retrievals. It is important to note that the proposed approach is trained over limited in-situ observations and is independent of SMAP observations in its training. The retrieval performance indicates current applicability and future growth potential of GNSS-R-based, directly measured spaceborne SM products that can provide improved spatio-temporal resolution than currently available datasets.

1. Introduction

Soil moisture (SM) is an essential hydroecological variable that plays an important role in water dynamics, evapotranspiration [1], the energy and carbon flows between the surface and the atmosphere [2], vegetation states [3], climatic conditions [4], and many hydrological and agricultural processes. Microwave remote sensing at L-band (1–2 GHz) is an established method for providing accurate SM retrievals on a global basis because the primary physical property that affects the microwave measurement is directly dependent on the amount of water present in the top 5 cm of soil. The European Space Agency’s Soil Moisture and Ocean Salinity (SMOS, launched in late 2009) [5] and the National Aeronautics and Space Administration (NASA)’s Soil Moisture Active Passive (SMAP, launched in early 2015) [6] are two passive microwave spaceborne missions that are currently operating at L-band. Both provide global SM retrievals every 2–3 days with a spatial resolution on the order of several tens of kilometers. While this product is critical for many large-scale climate studies, a higher spatio-temporal resolution SM product is needed to advance applications in hydrometeorology, atmospheric research, and water resource management at regional and local scales [7,8,9].
There is a growing interest within the hydrology community to utilize spaceborne Global Navigation Satellite System (GNSS) Reflectometry (GNSS-R) observations in SM retrievals due to its relatively high spatial footprint (on the order of a few kilometers) over smooth Earth surface with frequent observation (subdaily or daily) capabilities [10]. The GNSS-R approach re-purposes existing GNSS infrastructure for remote sensing by processing the forward-scattered signal that is reflected off the surface of the Earth [11]. The exploitation of this approach has been particularly accelerated with the availability of large and diverse datasets acquired from recent spaceborne GNSS-R observatories such as the United Kingdom’s TechDemoSat-1 (TDS-1, launched in mid-2014 and retired in mid-2019) [12] and NASA’s Cyclone Global Navigation Satellite System (CYGNSS, launched in late 2016) [13]. While TDS-1’s GNSS-R measurements featured a relatively low revisit time due to the satellites intention for evaluating multiple payloads simultaneously, the dedicated research community surrounding TDS-1 has greatly improved the literature’s understanding of spaceborne GNSS-R responses to ocean winds [14,15], ice sheets [16,17], and land geophysical parameter features [18,19,20] from space due to TDS-1’s global coverage created by its polar orbiting configuration. On the other hand, CYGNSS features a high-temporal resolution over a smaller spatial extent in order to optimize its measurements for ocean studies. To achieve this, CYGNSS uses eight small satellites that orbit the tropics (within ± 38 ° latitudes). The considerable amount of CYGNSS land observation data also measured in this region has greatly contributed to the development of new SM retrieval approaches from spaceborne GNSS-R [21,22,23,24,25,26,27,28,29].
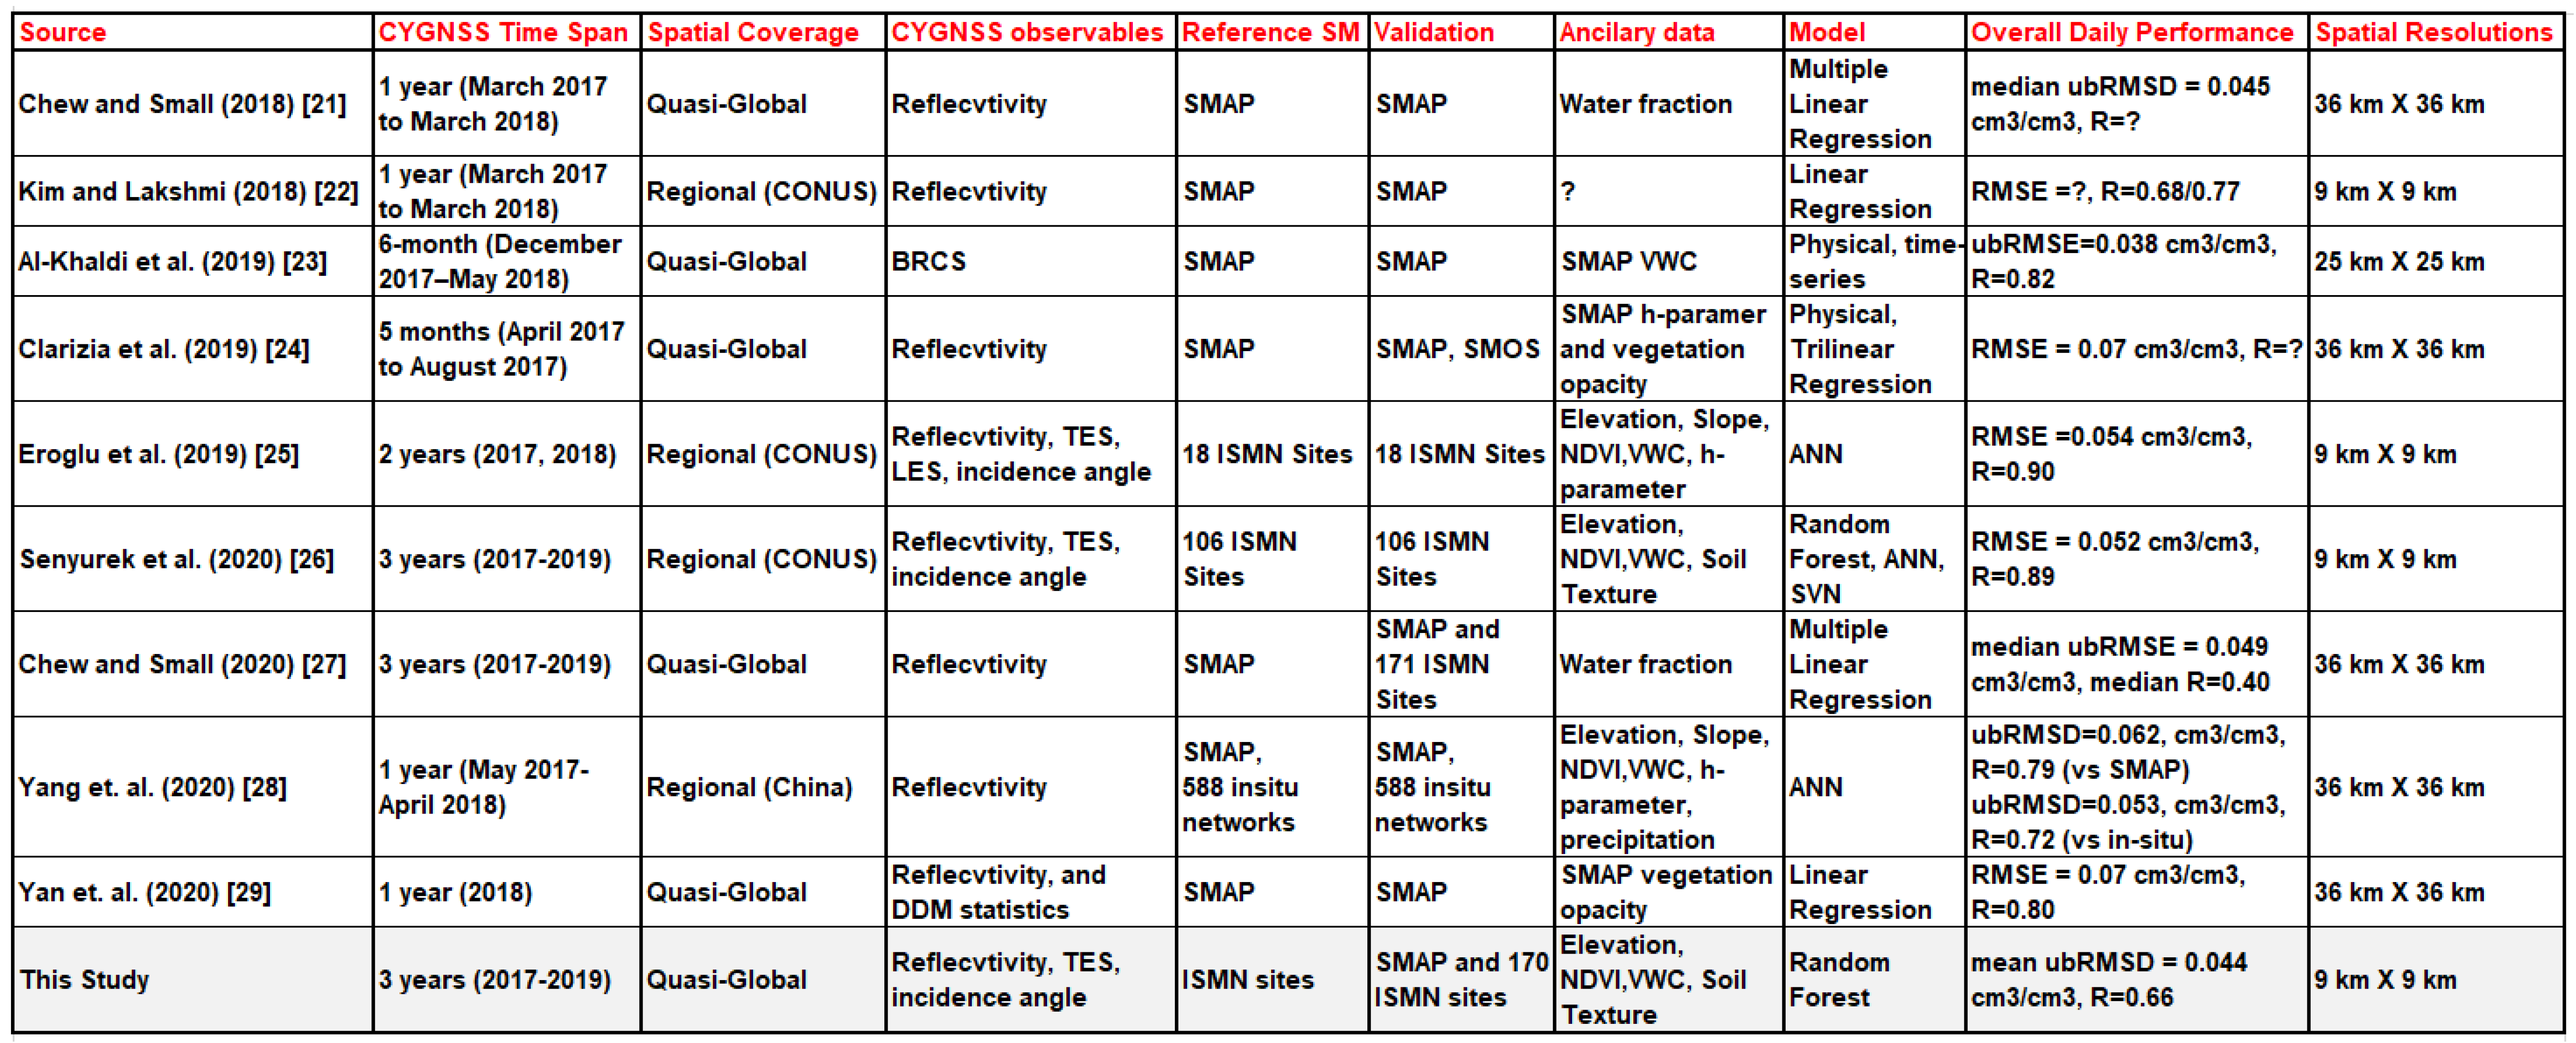
The GNSS-R approach comes with many unique challenges for SM retrieval such as (1) the variable footprint due to the relative contributions of coherent and incoherent scattering mechanisms, (2) non-repeating ground tracks due to quasi-random transmitter/receiver configurations, (3) sensitivity to fine-scale surface features (e.g., topography, water bodies), and (4) other non-geophysical factors (e.g., variation/uncertainty of the GNSS transmitter power). Spatial and/or temporal averaging are often employed in retrieval algorithms to overcome most of the aforementioned challenges. The majority of the previous GNSS-R-based SM inversion studies also calibrate their models and test their performance with SMAP or point-scale in-situ observations. However, it is difficult to directly compare the CYGNSS-based SM data products from these studies against each other because each paper assumes critically different inversion methodologies due to differences in (1) assumptions regarding gridding, open water masking, and surface conditions, (2) ancillary data requirements, (3) validation and reference data sets, (4) time spans, (5) models, and (6) spatial coverage. Despite these differences, most approaches have shown a moderate performance in retrieving SM from CYGNSS as summarised in Appendix A (see Figure A1). The purpose of this study is to achieve a daily 9-km gridded SM product within the CYGNSS spatial coverage ( ± 38 ° latitudes) and evaluate the predictions against Soil Moisture Active Passive (SMAP) mission’s enhanced SM products at a resolution of 9 km × 9 km.
In this paper, we apply a machine learning (ML) framework that is similar to those previously developed by [25,26] to perform SM predictions at a high spatio-temporal resolution. The framework uses in-situ SM data sets provided by the International Soil Moisture Network (ISMN) to train CYGNSS observations that fall within approximately 9 km × 9 km grid centering each ISMN site. Several physics-aware features from both CYGNSS observables and other space-borne ancillary data are incorporated into the model to contend with the nonlinear relationship between the CYGNSS signals and SM. While Eroglu et al. [25] established artificial neural network (ANN) retrieval over limited ISMN sites as a proof-of-concept using a ten-fold validation method, Senyurek et al. [26] generalized the framework by utilizing a larger and more diverse dataset and developing ANN, random forest (RF), and SVM approaches with 5-fold, site-independent, and year-based cross-validation strategies. This paper extends these ML-based studies to global scales by including more reference stations and applying an independent validation strategy. The learning model utilizes in-situ SM data sets provided by the 170 ISMN sites over a nearly 3-year period as the reference. Most importantly, the model’s performance is evaluated by using SMAP observations for 9-km gridded resolution at various temporal scales within the CYGNSS coverage.
The most distinct aspect of this study with respect to the previous studies, the framework does not use SMAP data in the training stage but uses it for independent validation only. In other words, the CYGNSS-based SM estimates are independent of SMAP observations, so we make predictions anywhere within CYGNSS coverage as long as it meets the quality control criteria of our approach (see details in our preceding publication [26]). However, the accuracy of our approach over denser vegetation (e.g., the Amazon) is expected to be degraded due to the limited vegetation penetration of L-band and lack of training over forested regions. Additionally, SMAP retrievals exist but their accuracy is not guaranteed over such regions. Therefore, this study often divides its comparison into the two groups “all grids” and “SMAP recommended grids”. Both SMAP and CYGNSS results are compared against each other within the CYGNSS coverage and at the same in-situ SM observations at ISMN sites. Temporal and regional studies are also demonstrated over selected areas (the US, India, Africa, and Australia) across the globe. The proposed approach achieves a performance better than 0.05 cm 3 cm 3 mean unbiased root-mean-square difference (ubRMSD) at a 9-km spatial resolution within the CYGNSS coverage and with a similar mean unbiased root-mean-square errors (ubRMSE) performance over ISMN sites.
The rest of the paper is organized as follows: Section 2 summarizes the CYGNSS and SMAP data, and ancillary data needed for the ML algorithm. Section 3 describes the training and evaluation methodology for the proposed ML framework. In Section 4, the results of CYGNSS SM retrievals and performance analysis are provided. This includes a study on effects of land cover on the performance of the proposed approach as well as the temporal and spatial illustrations on SM predictions of the proposed approach over selected regions across the globe. Section 5 discusses findings, challenges, and implications for future work. Finally, Section 6 summarizes our conclusions.

2. Datasets

In order to effectively develop an ML-based retrieval algorithm for surface SM from CYGNSS observations, different land surface products must be leveraged to indicate the underlying surface conditions. The following subsections introduce the input feature selection for the retrieval algorithm as well as the physical relationships related to the GNSS-R observables and SM content. The data quality control and spatial-temporal aggregation processes used by this framework to ensure consistency for accurate SM products are given. Here, pertinent details are provided and additional details can be found in [26].

2.1. Cyclone Global Navigation Satellite System

The CYGNSS data used for this study is the Level-1 (L1) version 2.1 product, available at the NASA Physical Oceanography Distributed Active Archive Center (PO.DAAC, https://podaac.jpl.nasa.gov/). The CYGNSS mission consists of eight micro-satellites that record the reflected Global Positioning System (GPS) signals via a four-channel GNSS-R bistatic radar receiver. These micro-satellites primarily orbit the tropics, limiting their spatial coverage to latitudes ± 38 ° .
In L1 data, the delay Doppler map (DDM) is processed to obtain the bistatic radar cross section (BRCS) and is represented as a 17 delay by 11 Doppler array. Under most circumstances, the surface reflections of GNSS signals are the combinations of coherent and incoherent reflections. Meanwhile, the spatial footprints for varying reflections are dependent on the bistatic geometry among the transmitter, reflecting surface, and receiver. Theoretically, the CYGNSS received DDM signals are impacted by the instrumental specifications and land surface characteristics. After correcting for the GPS transmitting power, antenna gain, signal travel distance, and wavelength, the derived reflectivity can be representative of the soil water content level and land surface roughness and vegetation conditions. Following [21,22,24,25,26,27,28,29], the CYGNSS reflectivity is calculated assuming a coherent reflection over land. This reflectivity derived using the coherent reflection assumption has demonstrated a satisfactory performance for estimating surface SM in various previous studies. In addition, from the BRCS, the reflectivity delay waveform can be calculated for the Doppler domain between the peak delay bin m and m + 3, which is then used for deriving the trailing edge slope (TES) [30]. TES is one of the indexes indicating the surface coherence/incoherence reflection, providing supplementary information for the ML-based retrieval model [25,26]. The instrumental data given in CYGNSS’s L1 product along with other metadata provide key information for filtering CYGNSS observations with larger uncertainties. The standard filtering criteria used in [26,27,30] are also applied here. Additional constraints for the CYGNSS data are applied and explained in Section 3.1. The CYGNSS data is spatially aggregated into EASE-Grid 2.0 3-km cells and is temporally averaged for daily values. For the ML process, three features derived from CYGNSS are used, i.e., specular point incidence angle, TES, and the reflectivity [30].

2.2. International Soil Moisture Network

Here, daily averaged in-situ SM data of 170 sites selected from the International Soil Moisture Network (ISMN) are used as ground truth information for the training of the ML model. The spatial distribution of in-situ sites used in this study are shown in Figure 1. The ISMN provides a global in-situ SM database with uniform data format and pre-processing quality flags [31] over the world. While there are some sites in Asia, Australia, and Europe, most ISMN sites within CYGNSS’s spatial coverage are in the Continental United States (CONUS). A similar distribution of sites can be found for the validation of other global retrievals such as SMAP’s SM products over core validation sites [32] and CYGNSS SM estimates over ISMN sites [27]. Nonetheless, the ISMN sites across CONUS provide a good coverage of heterogeneous land surface conditions. It is important to note that a good agreement between CYGNSS and in situ observations is expected to be achieved as in [26], which does not mean that CYGNSS’s SM predictions perform well in regions extremely disparate from those typical of the United States (e.g., tropical rain forests).
Detailed information about the ISMN is reported in [33,34]. The ISMN dataset is publicly accessible at http://ismn.geo.tuwien.ac.at. Here, the hourly SM data from ISMN is masked using the provided quality flag (identified as ‘good’ with ‘G’) and then averaged to daily values. From this ISMN data, the surface SM at a 5-cm depth is employed which is consistent with the penetration depth of L-band microwave signals.

2.3. Ancillary Data

Geophysical parameters such as vegetation density, topography, surface roughness, and soil texture also play important roles in securing accurate SM predictions in addition to CYGNSS observables. We use the five following ancillary datasets as input features to the learning model: (i) Normalized Difference Vegetation Index (NDVI), (ii) Vegetation Water Content (VWC), (iii) elevation, (iv) soil clay ratio, and (v) soil silt ratio.
The 16-day composite Normalized Difference Vegetation Index (NDVI) from Moderate Resolution Imaging Spectroradiometer (MODIS) data of MYD13A1 is utilized for characterizing vegetation conditions. The original 500-m resolution of NDVI data is spatially averaged to 3 km. The MYD13A1 dataset can be acquired from the NASA Land Processes Distributed Active Archive Center (https://lpdaac.usgs.gov/products/myd13a1v006/). Vegetation Water Content (VWC), used in the model, is derived from NDVI and Land Cover Type (MCD12Q1) product through the same lookup table approach as the SMAP VWC product [35]. The 1-km resolution Digital Elevation Model GTOPO30 product from the United States Geological Survey Earth Resources Observation and Science archive is used to provide surface elevation information. Similarly, the elevation data is spatially averaged from 1 km to 3 km. The Global Gridded Soil Information (SoilGrids) [36] is used to obtain soil clay and silt ratios. In the SoilGrids product, soil profiles are discretized into different layers and only data from the top layer (surface to 5-cm in depth) is used for consistency with the penetration depth of L-band signals. The product is available at 250 m and is spatially aggregated onto 3 km for this study. The presence of surface inland water body is identified by utilizing a 30-m Global Surface Water Dataset from the Joint Research Centre (GSW-JRC) [37]. The water percent is determined by calculating the percentage of 30-m grids within each 3-km grid indicating the presence of either permanent or seasonal water, and this value is used during the retrieval algorithm’s quality control phase.

2.4. SMAP Radiometer Soil Moisture Data

The CYGNSS-based SM retrieval framework is independently validated by using the SMAP Enhanced L3 Radiometer Global Daily 9-km EASE-Grid SM product. SMAP collects brightness temperature data via an L-band microwave radiometer and provides SM estimations at a 5-cm depth for each half orbit. Although the SMAP radiometer soil moisture product is generated at 36 km, a 9-km enhanced grid product is available by using Backus–Gilbert optimal interpolation techniques [38]. The data is freely available through the National Snow and Ice Data Center (NSIDC) at https://nsidc.org/data/SPL3SMP_E/versions/3. Retrieval Quality Flag (RQF) information is provided in the product as well. The first bit of the RQF is a summary flag indicating whether the SM retrieval is recommended or not. SM retrievals can have an uncertain quality for several reasons that includes water body fraction, coastal proximity, urban area, precipitation, slope, vegetation water content, etc. Figure 1 shows an example of SMAP RQF for the period of 18–24 March 2017. In the following validation of the proposed method, performance metrics are calculated separately for regions with only the recommended quality and the whole study area.

3. Methodology

The SM product is a complex non-linear function of CYGNSS’s measured reflectivity, system geometry, as well as environmental variables such as topography, vegetation, and soil properties. Our approach to a model with such complex and unknown relationships is to use a data-driven ML technique with physics-based features. Since ML techniques are known to be universal function approximators, the goal of our framework is to map the unknown relationships between available datasets to SM values. Our previous approach [26] has shown that a supervised ML technique has remarkable SM estimation performance when trained and tested over the ISMN sites in CONUS. In this study, we extend our previous results and evaluate our ML-based CYGNSS SM estimates against SMAP observations within the CYGNSS coverage. In Section 3.1, the training methodology of the ML model for SM estimation is described. An evaluation and application of the learned model is detailed in Section 3.2.

3.1. Training of Random Forest Model

We consider a supervised learning problem where the ML model maps a set of input features to the SM value, which is the final output label. A supervised training of an ML model requires a labeled dataset where the input features and the corresponding outputs, i.e., labels, are known. Such a training set is constructed using 170 ISMN sites over the globe as described in Section 2. Under this setting and following the feature selection results of our previous study [26], a set of 8 features from a 9-km × 9-km representative area centered around ISMN sites is used as the inputs to our ML model. These 8 features include observables from CYGNSS (i.e., reflectivity, incidence angle, and TES), MODIS (i.e., NDVI and VWC), SoilGrids soil texture database (i.e., soil clay and silt ratios), and GTOPO30 DEM data (i.e., elevation). The set of these input features is passed through a series of quality checks and additional masks before they are utilized in ML model’s training. (1) CYGNSS data with reflection power higher than −5 dB and lower than −30 dB, and specular point incident angle higher than 65 ° are filtered out. (2) CYGNSS observations are removed if more than 2% of the 3-km × 3-km area centered around the specular point is covered with permanent or seasonal water. The specular reflection from water bodies is typically much stronger than land reflections and, hence, including data samples near open water areas creates incorrect training data. (3) CYGNSS observations from urban areas are removed since reflections from these regions are not reliable for SM estimation. (4) ISMN sites above an altitude of 2000 m are not utilized in training since CYGNSS specular point for high altitudes are not reliable. (5) CYGNSS observations before December 2017 from a surface elevation above 600 m have been masked out due to the altitude limitation of CYGNSS L1 for the specified time frame. The remaining CYGNSS observations in the 9-km × 9-km area around ISMN sites along with the other features calculated from the same region constitute the input training data. As the labels, for these input feature sets, daily SM measurements from the corresponding ISMN sites are used. At this point, it is important to note that, although ISMN sites provide the SM value at their specific positions, we assume that the ISMN SM observation is a representative SM value for the entire 9-km × 9-km area around the ISMN site [26].
After the application of quality checks and data masking, from approximately 81,000 initial samples for the period of March 2017–May 2019, the remaining total of approximately 59,000 sets of input features and ISMN SM value data samples have been utilized as the training dataset for the ML model. Figure 2 illustrates the simplified training procedure. For the ML model, a RF regression structure is utilized. Our previous study [26] compared different ML models for the problem of CYGNSS-based SM estimation and showed that RF models provided enhanced SM estimation performance compared to other tested ML techniques. The developed RF model in this study contains 100 trees with a maximum split size of 60 for each tree. The RF model is trained using a least-squares boosting (LSBoost) ensemble strategy with a learning rate of 0.1. The required computations are carried out using the machine learning toolbox of MATLAB R2019b software over a machine with Intel(R) Xeon(R) CPU E5-2643 and 128 GB memory.

3.2. Quasi-Global Application and Evaluation of the Model

The learned RF model from Section 3.1 is applied within the CYGNSS coverage, and its performance is evaluated against the SMAP SM predictions. To achieve a proper evaluation, first the whole region bound between latitudes ± 38 ° is divided into EASE-Grid 2.0 3-km × 3-km grids creating a matrix of 2967 by 11,568 for the study region. For each grid cell, the input features for the ML model is acquired. This means that for each observation day an 8 × 1 feature vector is created for each of the 3-km × 3-km grids. The same CYGNSS, water body, elevation quality checks, and masking procedures that were utilized in training are also applied to the input data. The input features are fed into the learned RF model that outputs a SM prediction. In this way the learned RF model, which used the training dataset only from ISMN locations, generates SM predictions at unseen locations. To evaluate the performance of the SM predictions from the RF model, its predictions are compared against SMAP observations. However, the proposed ML-based model generates daily SM predictions at 3-km × 3-km resolutions. The SMAP SM product has a temporal resolution of 2–3 days at both 9-km × 9-km and 36-km × 36-km spatial resolutions. To properly compare ML-based SM predictions with SMAP, both datasets are spatially and temporally averaged to directly comparable resolutions. First, SM outputs of both SMAP and the proposed ML approach are temporally averaged over k consecutive days (i.e., k = daily, 3-days, 1-week, and 1-month), creating a k-day average SM product for both SMAP and the proposed approach. The daily CYGNSS data set refers the data averaged over the same calendar day that is concurrent with SMAP. In addition, to achieve the same spatial resolution, the 3-km resolution of the proposed SM estimation results are spatially averaged to SMAP spatial resolution levels. The general outline of the aforementioned steps for a k-days, 9-km × 9-km SM product is illustrated in Figure 3.
After achieving the same spatial and temporal resolutions, the CYGNSS ML model predictions are compared with both SMAP SM products and in-situ measurements. Several performance metrics including the root-mean-square error (RMSE), unbiased RMSE (ubRMSE), bias, and correlation coefficient (R) are calculated. The root-mean-square difference (RMSD) term is preferred for CYGNSS ML and SMAP SM product comparison because the reference SMAP SM values may contain errors and cannot be considered as the “true” SM values [39] whereas RMSE is used for in-situ evaluation since in-situ measurements are ground truth information for SM. Both RMSD and RMSE metrics are calculated in the same way. The next section provides performance results and detailed analysis on the proposed CYGNSS-ML based SM products.

4. Results

In this section, we evaluate the performance of the proposed CYGNSS ML-based SM retrieval against SMAP observations within the CYGNSS coverage. For this evaluation, the results are organized in order to discuss important factors that impact SM inversion quality such as spatial heterogeneity and temporal variation. First, the overall performance using the proposed SM predictions are shown in Section 4.1, along with a detailed analysis of the land cover effects. Next, both SMAP and the CYGNSS ML-based results are compared against in-situ SM observations at ISMN sites in Section 4.2. Spatial and temporal analysis on SM predictions of the proposed approach are detailed in Section 4.3, with examples extracted from different regions of the world.

4.1. Quasi-Global Performance Results of the Proposed ML-Based SM Retrieval

This study’s ML-based SM retrieval approach is designed to generate daily SM predictions for 3 km × 3 km grids using CYGNSS observations. In order to compare and evaluate these SM predictions with the SMAP observations, both SM products are sampled to the same spatial and temporal resolutions through gridding onto 9-km cells over k-days periods as detailed in Section 3. SM products are compared over a period of nearly three years (18 March 2017–31 December 2019). Figure 4 shows the ubRMSD between 3-day averaged SMAP and CYGNSS SM retrievals for each cell. For any grid cell with less than 30 collocated SM predictions in total over the 3-day averaging period, its performance metrics are not calculated or shown in the map to limit errors caused by a small number of samples. The mean ubRMSD for all measurements over the entire period is found to be 0.049 cm 3 cm 3 with a standard deviation of 0.025 cm 3 cm 3 . This result illustrates the potential and applicability of CYGNSS observations for high spatially and temporally-resolved global SM products. Even though the proposed approach uses no SMAP observations in its training, the retrieval still achieves a performance of less than 0.05 cm 3 cm 3 ubRMSD when compared to SMAP SM measurements independently. Regions that are generally flagged by SMAP as being ‘poor quality’ such as the Amazon, central Africa, and seasonal flooding regions (e.g., Southeast Asia) are also shown to have relatively worse ubRMSD values. This result is not surprising since the performance of CYGNSS SM estimates is also expected to degrade over those regions since they are not well represented by ISMN site networks that are used in the model training. On the other hand, most of the remaining regions show a high agreement with SMAP observations with lower ubRMSD results.
Figure 5 shows the bias between SMAP and CYGNSS-based SM retrievals for each grid within the CYGNSS coverage. The mean values of SM estimations of SMAP and CYGNSS are close for most of the globe except for the Amazon and central Africa regions where SMAP SM retrievals are also mostly flagged with uncertain quality. Over such regions (with mostly dense vegetation), CYGNSS estimates are often drier than those made by SMAP, leading to negative bias values. This bias could be attributed to uncertainties in SMAP’s SM estimates over flagged regions as well as the limited training dataset used in the ML algorithm. The ISMN sites are not equally distributed around the world, and the training dataset does not include data samples from regions with such a high bias (see cyan color around equatorial regions in Figure 1). Additionally, the training dataset constructed from ISMN observations does not include enough samples of high SM conditions and therefore the learned model trained with such data samples can underestimate SM for relatively high SM levels.
Another important metric is the correlation coefficient (R) which can be used to describe how CYGNSS-based ML predictions are spatially correlated with SMAP observations. Figure 6 shows the R values between SMAP and CYGNSS predictions as a function of time. It can be seen that the CYGNSS SM retrieval is highly correlated with SMAP observations with the coefficient changing between 0.6 and 0.8 over time. Although there are small fluctuations and periodicity in R values as a function of time, where the fall season has slightly higher correlation compared to spring, the correlation is mostly steady during the whole evaluation period. Moreover, when calculated only over SMAP RQF recommended cells, the correlation is further increased following a similar trend in time.
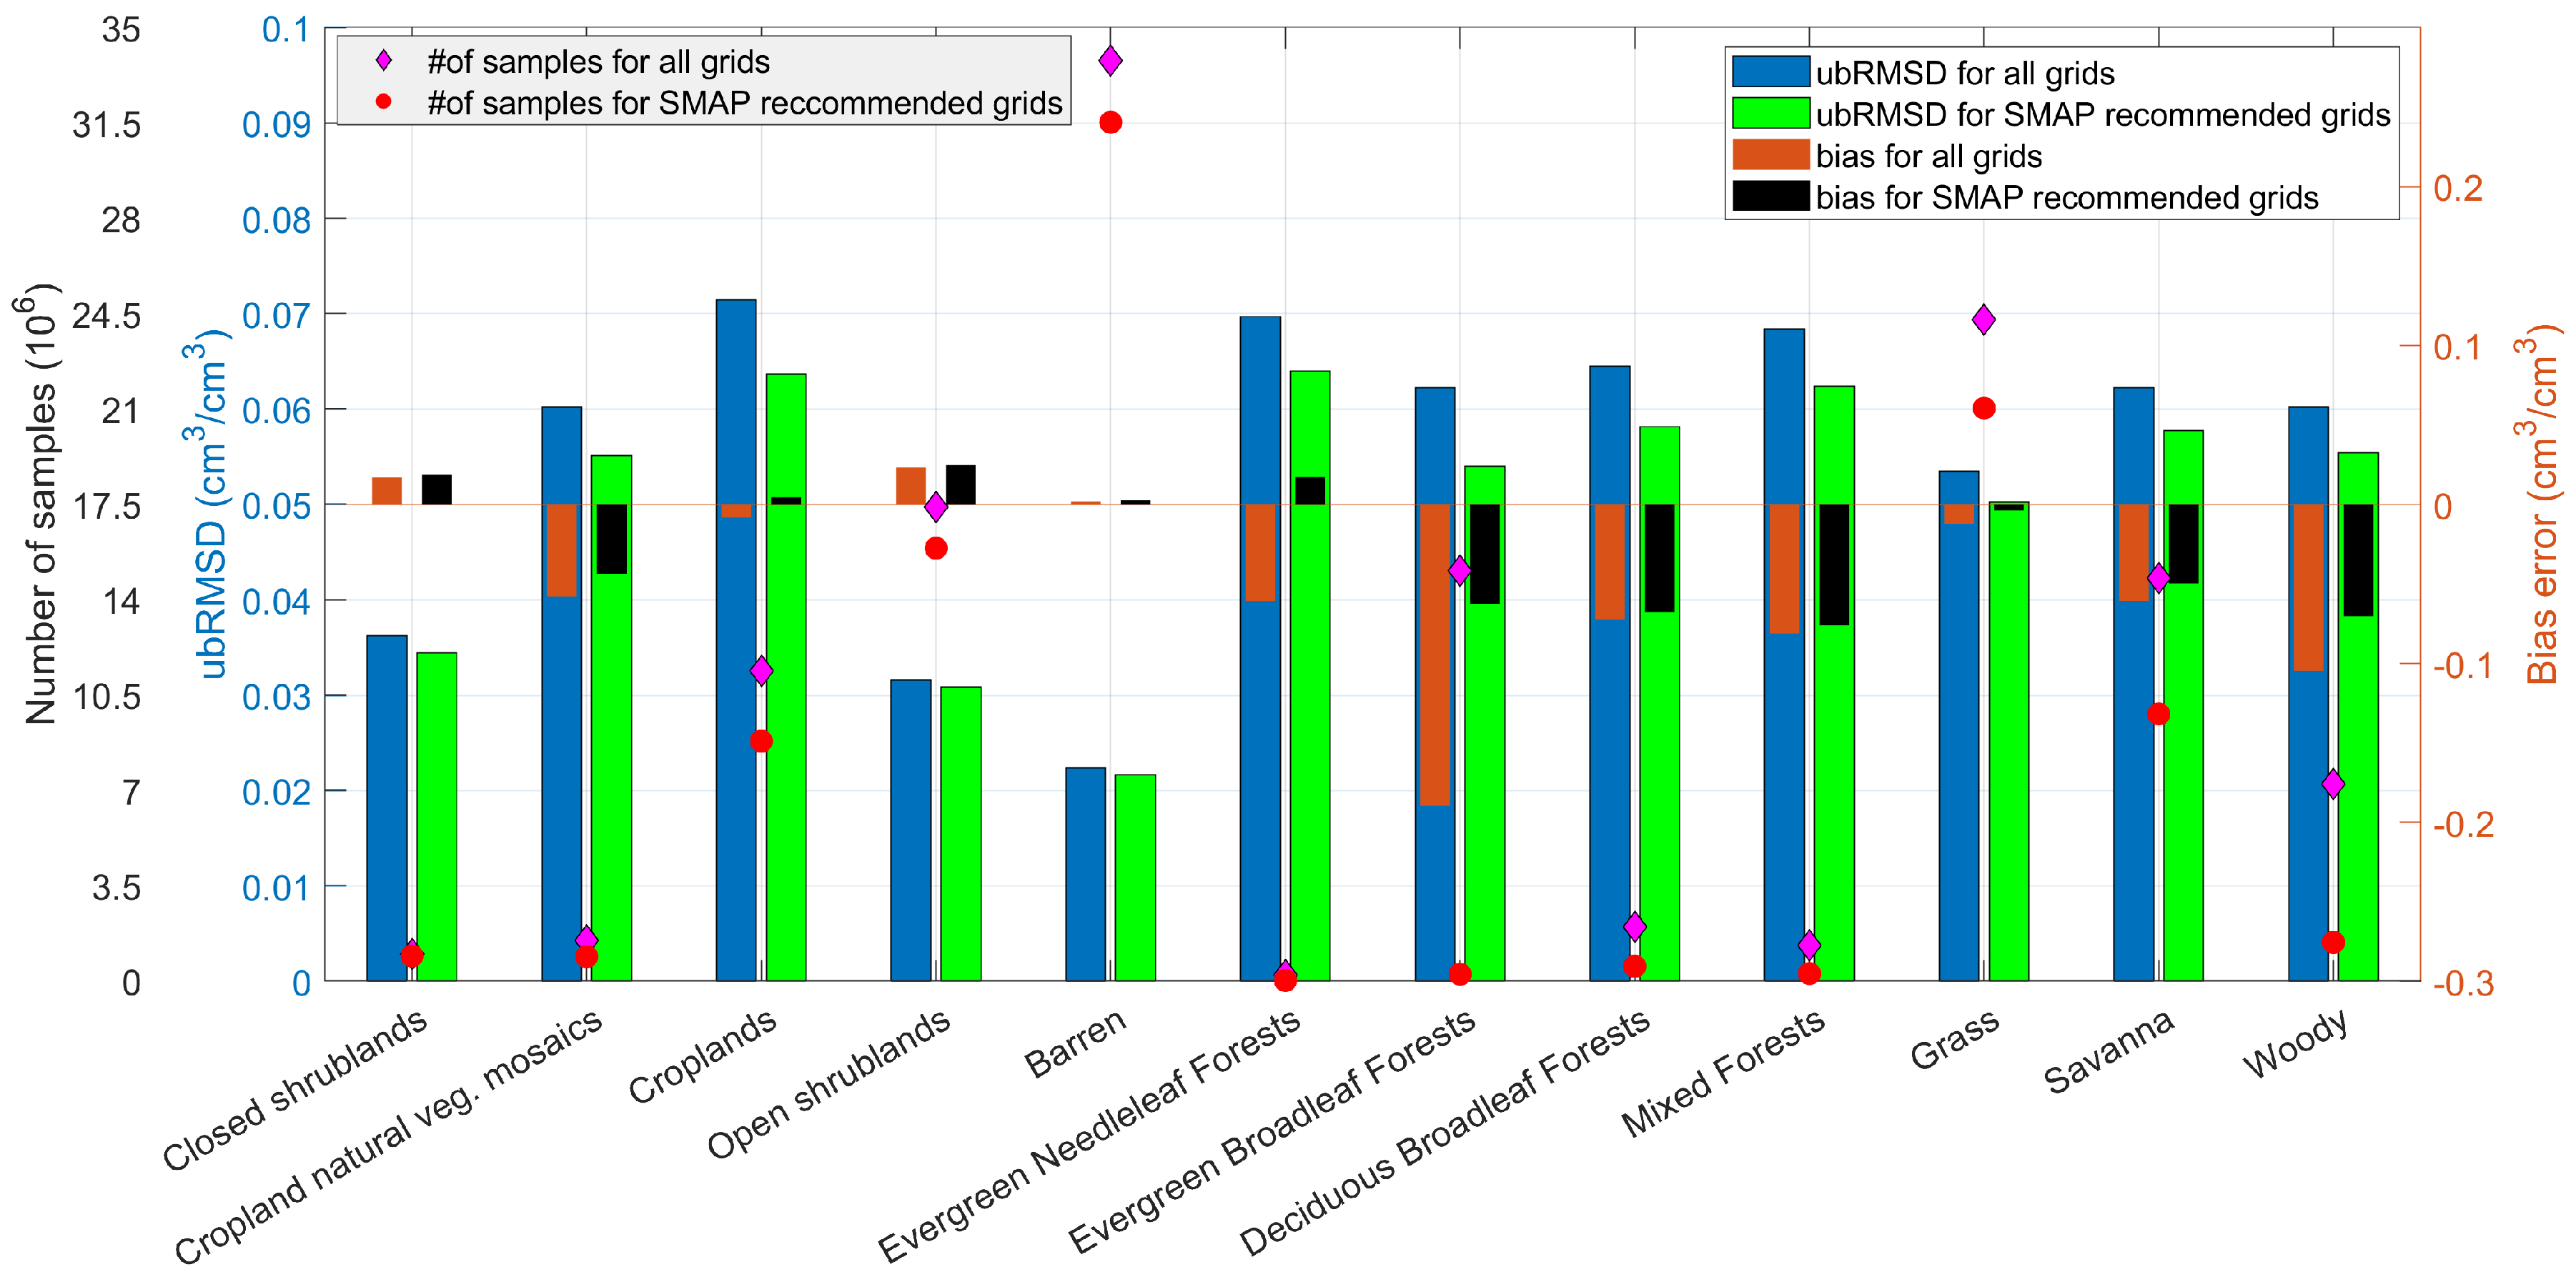
Figure 7 shows the SM estimation performance of the proposed ML model over different land cover types. The ubRMSD, bias and the number of data samples for each land cover type are provided, including croplands, shrubland, barren area, forest types, and savanna. All land cover types except for ice, snow, wetland, and urban are examined. It is clear that SM estimations over shrublands and barren have comparably lower ubRMSD of 0.032 cm 3 cm 3 and 0.022 cm 3 cm 3 respectively, while other land type classes have ubRMSD varying between 0.05 cm 3 cm 3 and 0.07 cm 3 cm 3 . Forest types and woody land covers generally show negative biases indicating that the ML model provides drier SM levels for these land cover classes while the biases in grass, barren, shrublands, and croplands are close to zero.
Table 1 provides the overall comparison (i.e., RMSD, ubRMSD, and R metrics) between CYGNSS and SMAP SM predictions over the entire CYGNSS ground track and SMAP’s recommended grid points at 9-km and 36-km spatial resolutions for concurrent, 3-day, 1-week, and 1-month temporal averaging. The mean ubRMSD and R over SMAP recommended 9-km grids between concurrent CYGNSS and SMAP SM retrievals are 0.044 cm 3 cm 3 and 0.66, respectively. This suggests that an enhanced quasi-global CYGNSS-based SM product in space and time with a relatively high performance can be generated given that the ML model is trained independently with the inclusion of any SMAP SM data. The metrics show that averaging over lower temporal frequencies (from 3-day to monthly) generally leads to decreased ubRMSD and increased R between CYGNSS and SMAP predictions while the RMSD remains mostly unaffected since the bias error does not change with spatial and temporal averaging. The RMSD, ubRMSD and R values improve when the metrics are calculated exclusively over the SMAP recommended grids. In particular, RMSD values are significantly lowered over recommended grids.

4.2. Performance Evaluation of SMAP and ML Model at ISMN Sites

The previous section has demonstrated the performance of the ML model, which is trained using the SM measurements from ISMN sites, and evaluated against the SMAP SM retrievals within the CYGNSS coverage. However, SMAP SM observations are also remotely sensed estimates and have their own error uncertainties. In this section, we compare both SMAP and CYGNSS SM predictions against the in-situ SM measurements at 170 ISMN stations. The SM observations are averaged over three days for comparison purposes. Table 2 presents the performance of both SMAP- and CYGNSS-based predictions against in-situ measurements over the 18 March 2017–31 December 2019 period. The mean ubRMSE for the SMAP observations is found to be 0.054 cm 3 cm 3 with a correlation coefficient (R) value of 0.59. The SMAP RMSE over the same dataset is 0.112 cm 3 cm 3 , much higher than the ubRMSE value indicating a bias in SMAP observations. This is expected since SMAP SM products are calibrated against the SMAP core validation site, which are defined as sites that have multiple calibrated and representative soil moisture measurement locations within a SMAP pixel [32]. The CYGNSS-based ML estimations are also compared with the same ISMN data. Since the developed ML model is trained with the ISMN SM measurements, we provide both the training- and 5-fold-cross-validation-based test performance of the ML model. The proposed CYGNSS-based ML model provides a 0.052 cm 3 cm 3 ubRMSE with a 0.83 correlation coefficient. While the ubRMSE performance of SMAP and CYGNSS estimates are similar, the ML model achieves a higher correlation and much lower RMSE. It should be noted that SMAP provides SM estimates at a larger spatial scale than the ISMN’s point-scale in-situ measurements. Such bias levels are expected due to the spatial representativeness error. In addition, the ML model is trained with the ISMN observations and is expected to perform better on data with similar statistics. Nonetheless, the comparison of CYGNSS SM estimates against those by SMAP within the CYGNSS coverage and ISMN sites locally show a similar ubRMSE performance to SMAP’s SM estimates against ISMN sites. This indicates that the quasi-global SM prediction performance of the proposed CYGNSS-based ML model performs with a similar accuracy compared to SMAP, even though no SMAP data is used in the ML model training.
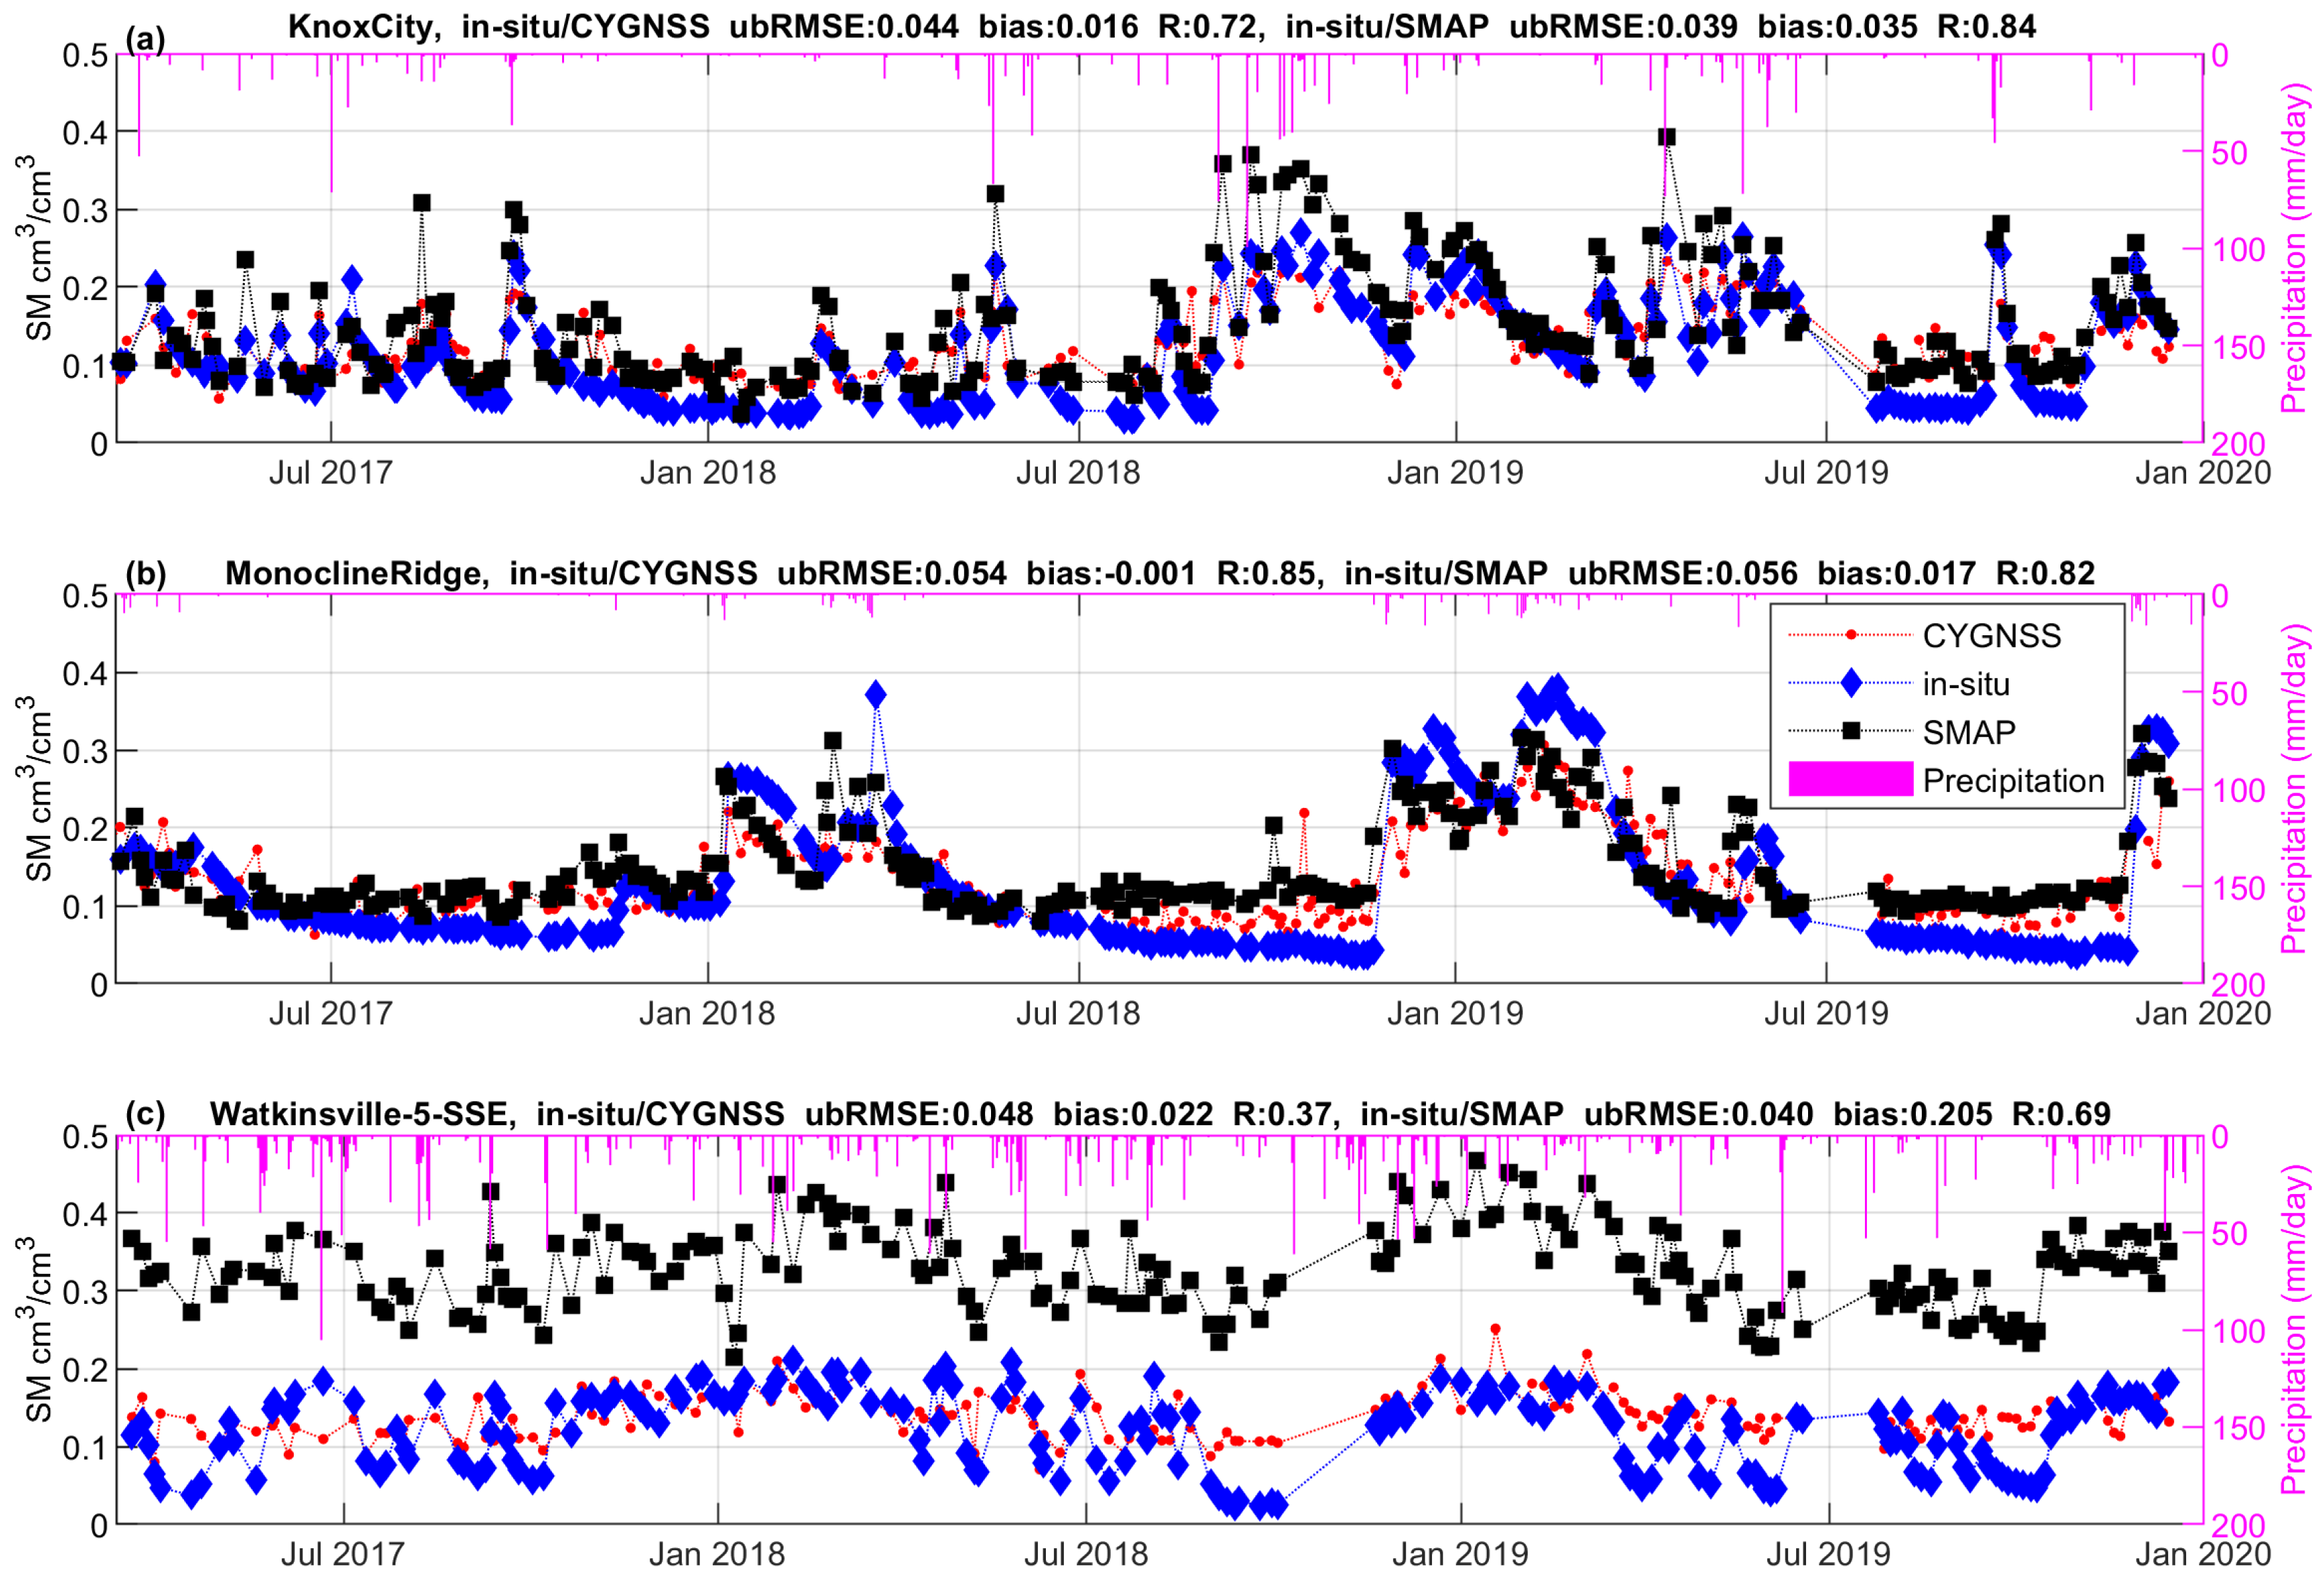
Figure 8 provides examples from individual sites for a temporal comparison of the SMAP’s and CYGNSS’s SM estimates against in-situ measurements. It is evident that both SMAP and CYGNSS SM estimates follow the in-situ observations closely but the SMAP estimates have consistent biases with respect to in-situ observations (particularly in Figure 8c). Again, a low bias of the CYGNSS SM estimates is expected since the ML model learns the site characteristics during the training phase. In summary, CYGNSS SM estimation shows some levels of variability from site to site but generally close to in-situ measurements with low RMSE, high correlation, and negligible bias. In order to illustrate the advantage of CYGNSS’s temporal coverage, a shorter duration of detailed SM estimation results at the Knoxcity site is provided in Figure 9. While SMAP provides an estimate every 2–3 days on average, CYGNSS can provide SM predictions almost daily depending on the quality factors and quasi-random transmitter/receiver configurations. This allows CYGNSS to capture rapid changes in SM, such as precipitation events, more frequently than SMAP. For example, two rapid increases in SM between 15–23 May 2018, is missed by SMAP while CYGNSS estimates are able to capture both events due to the increased temporal resolution of CYGNSS relative to SMAP. The more frequent CYGNSS observations in combination with the proposed ML-based prediction model can provide an enhanced SM product. However, the number of CYGNSS observations is also strongly determined by its spatial representing footprint and regridding scheme. For instance, in order to obtain daily CYGNSS estimates, observations need to be spatially aggregated over a larger area (36 × 36 km) as shown in Figure 9.

4.3. Spatial and Temporal Analysis of CYGNSS Soil Moisture Retrievals

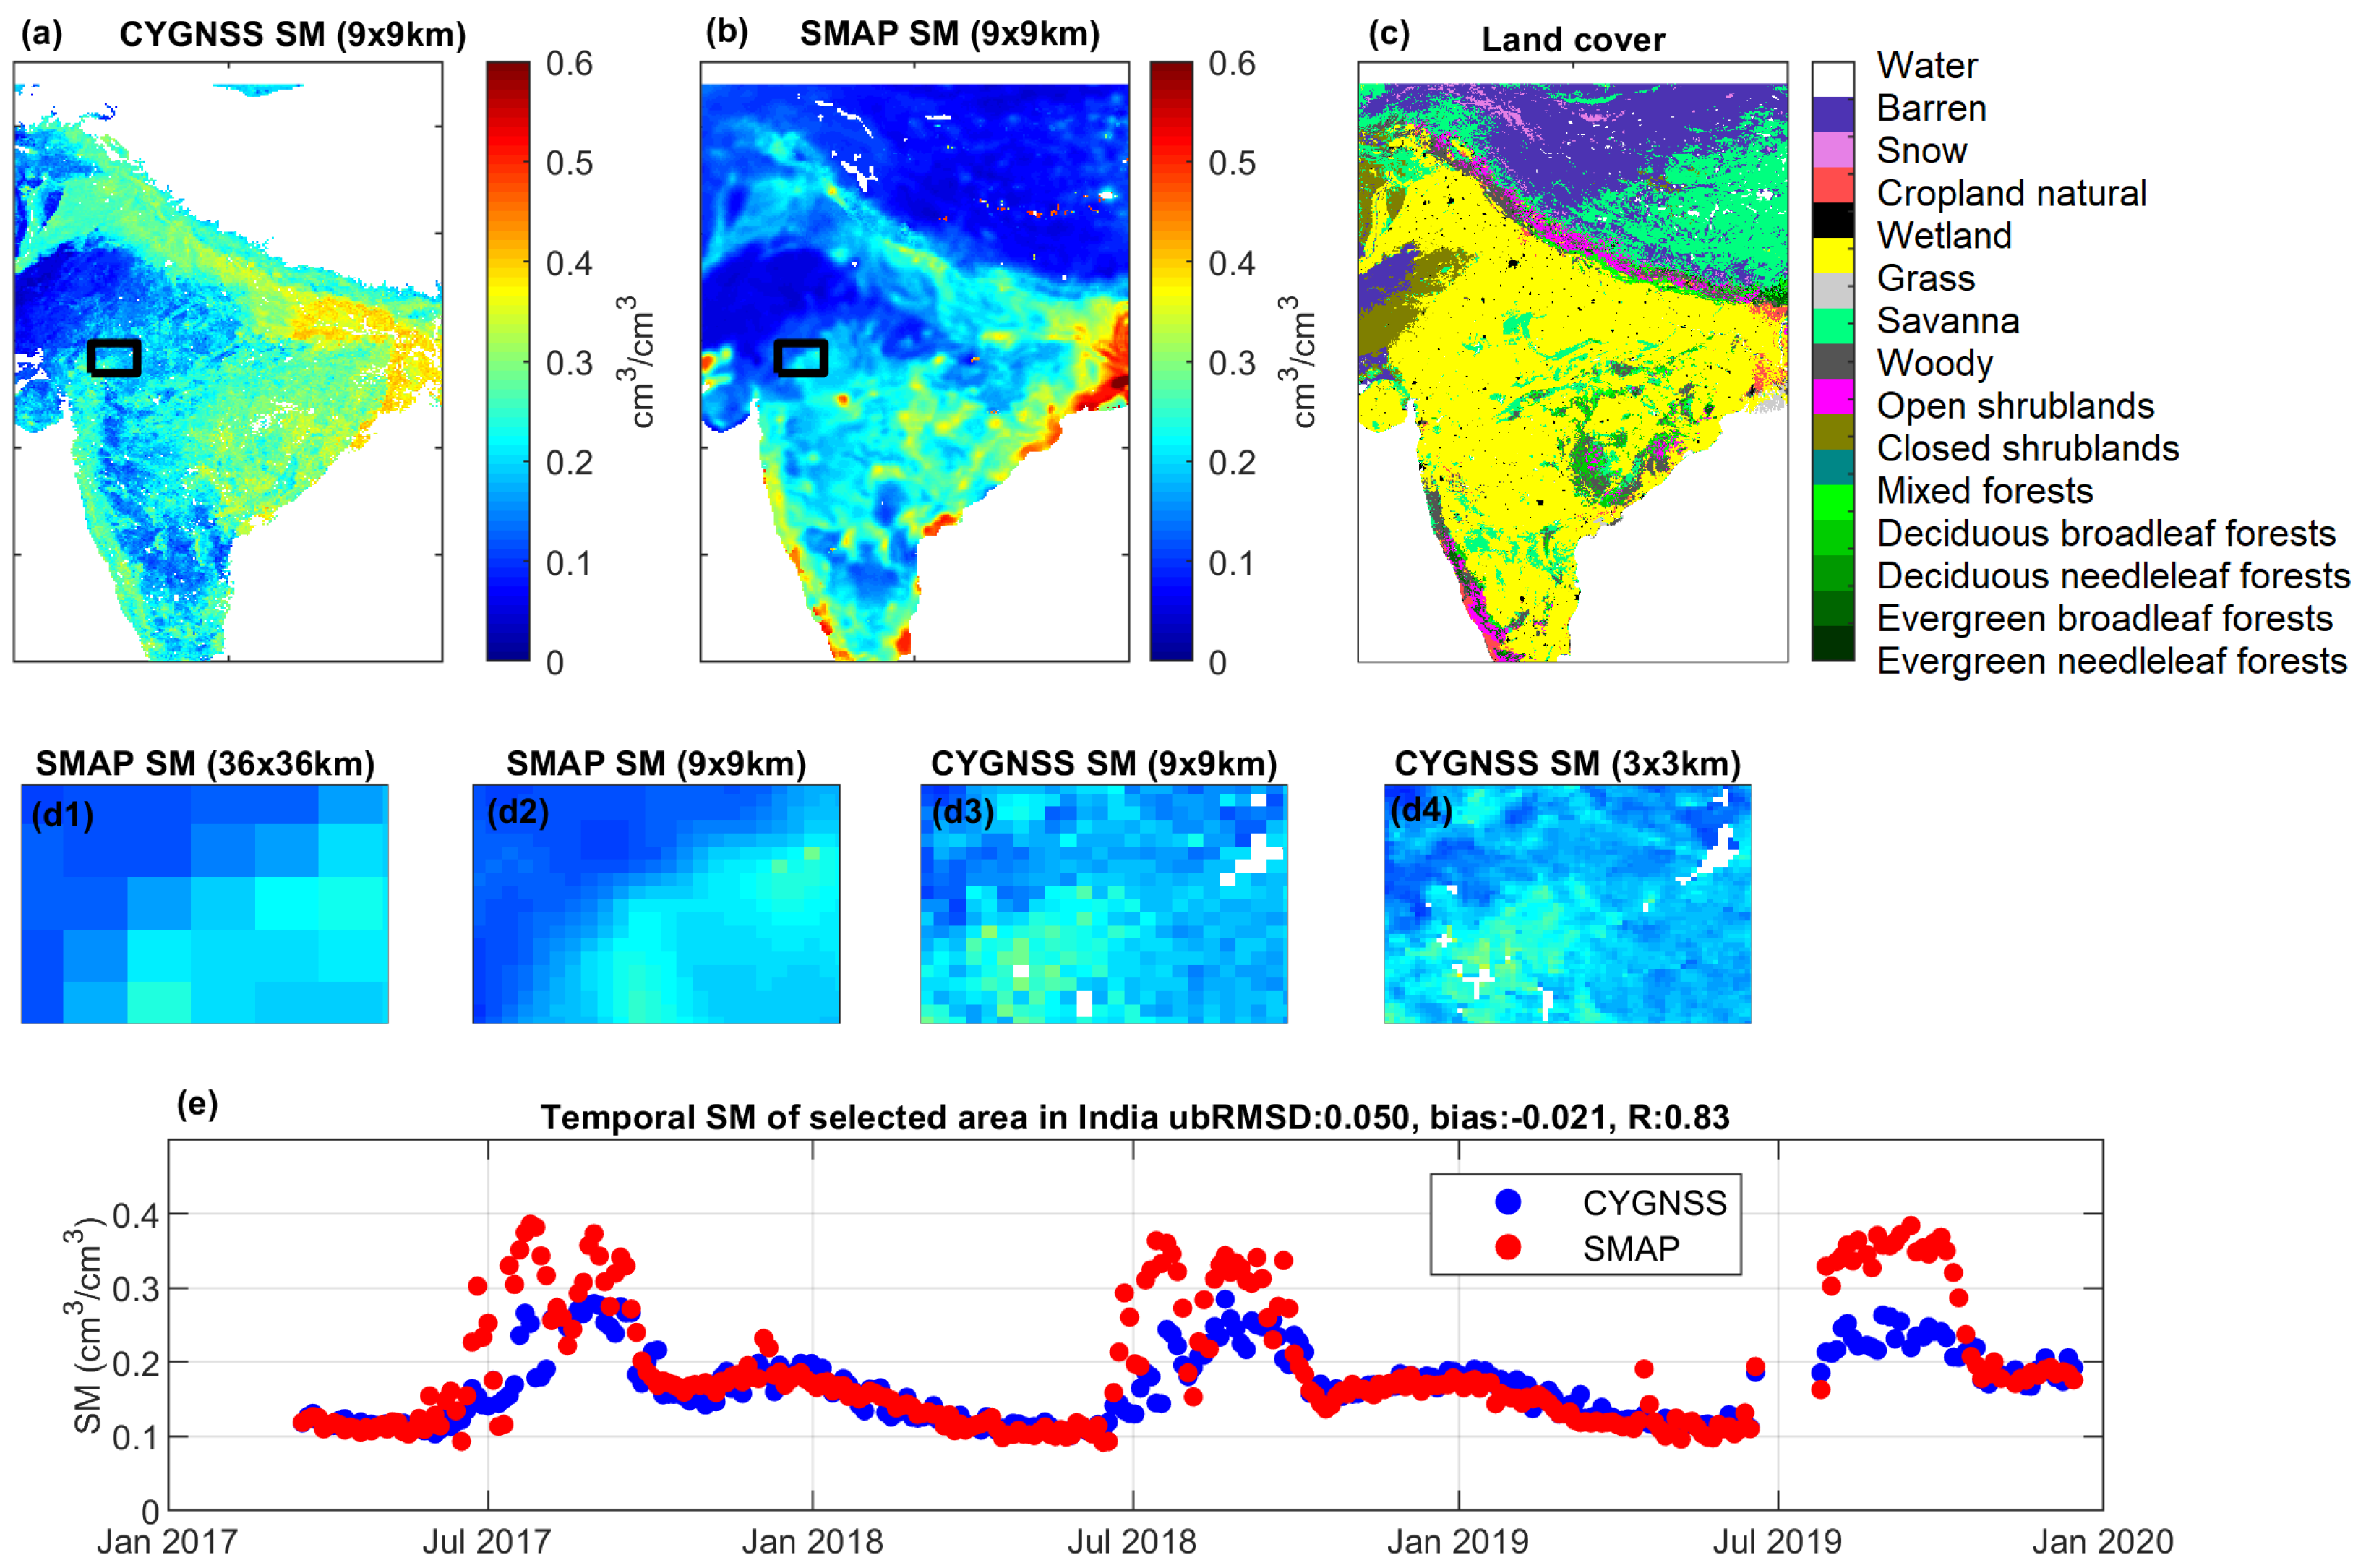
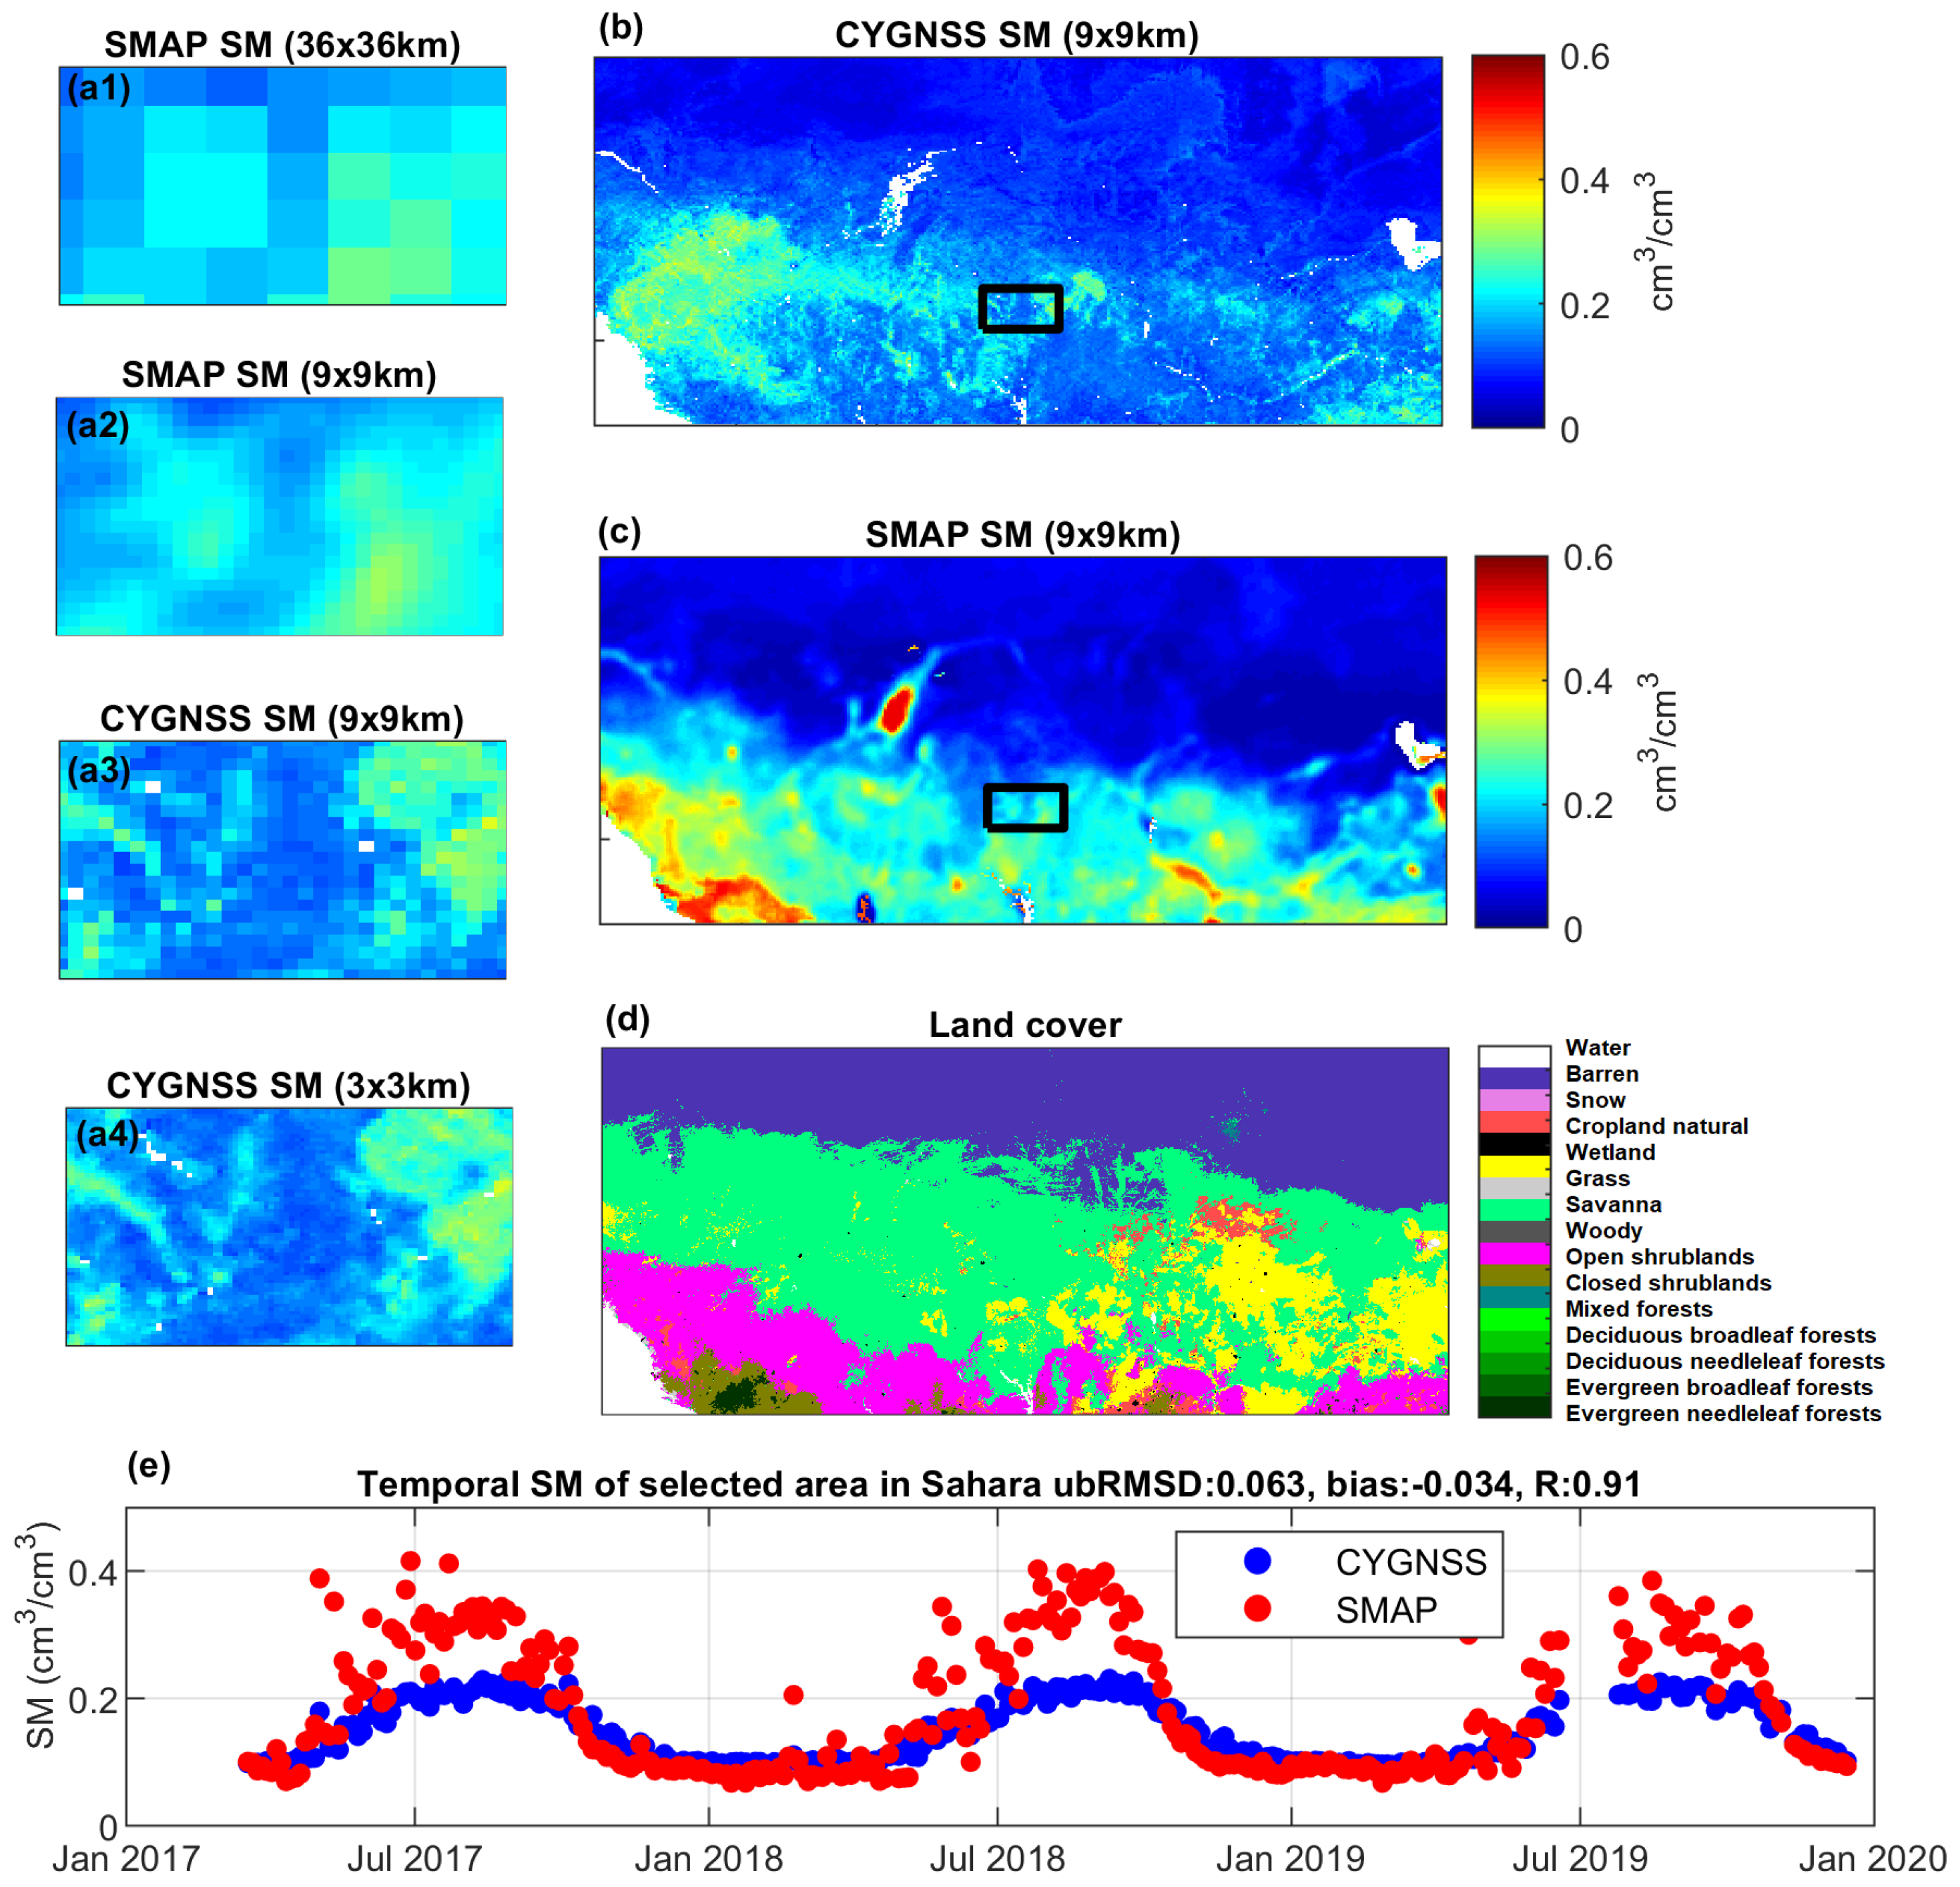
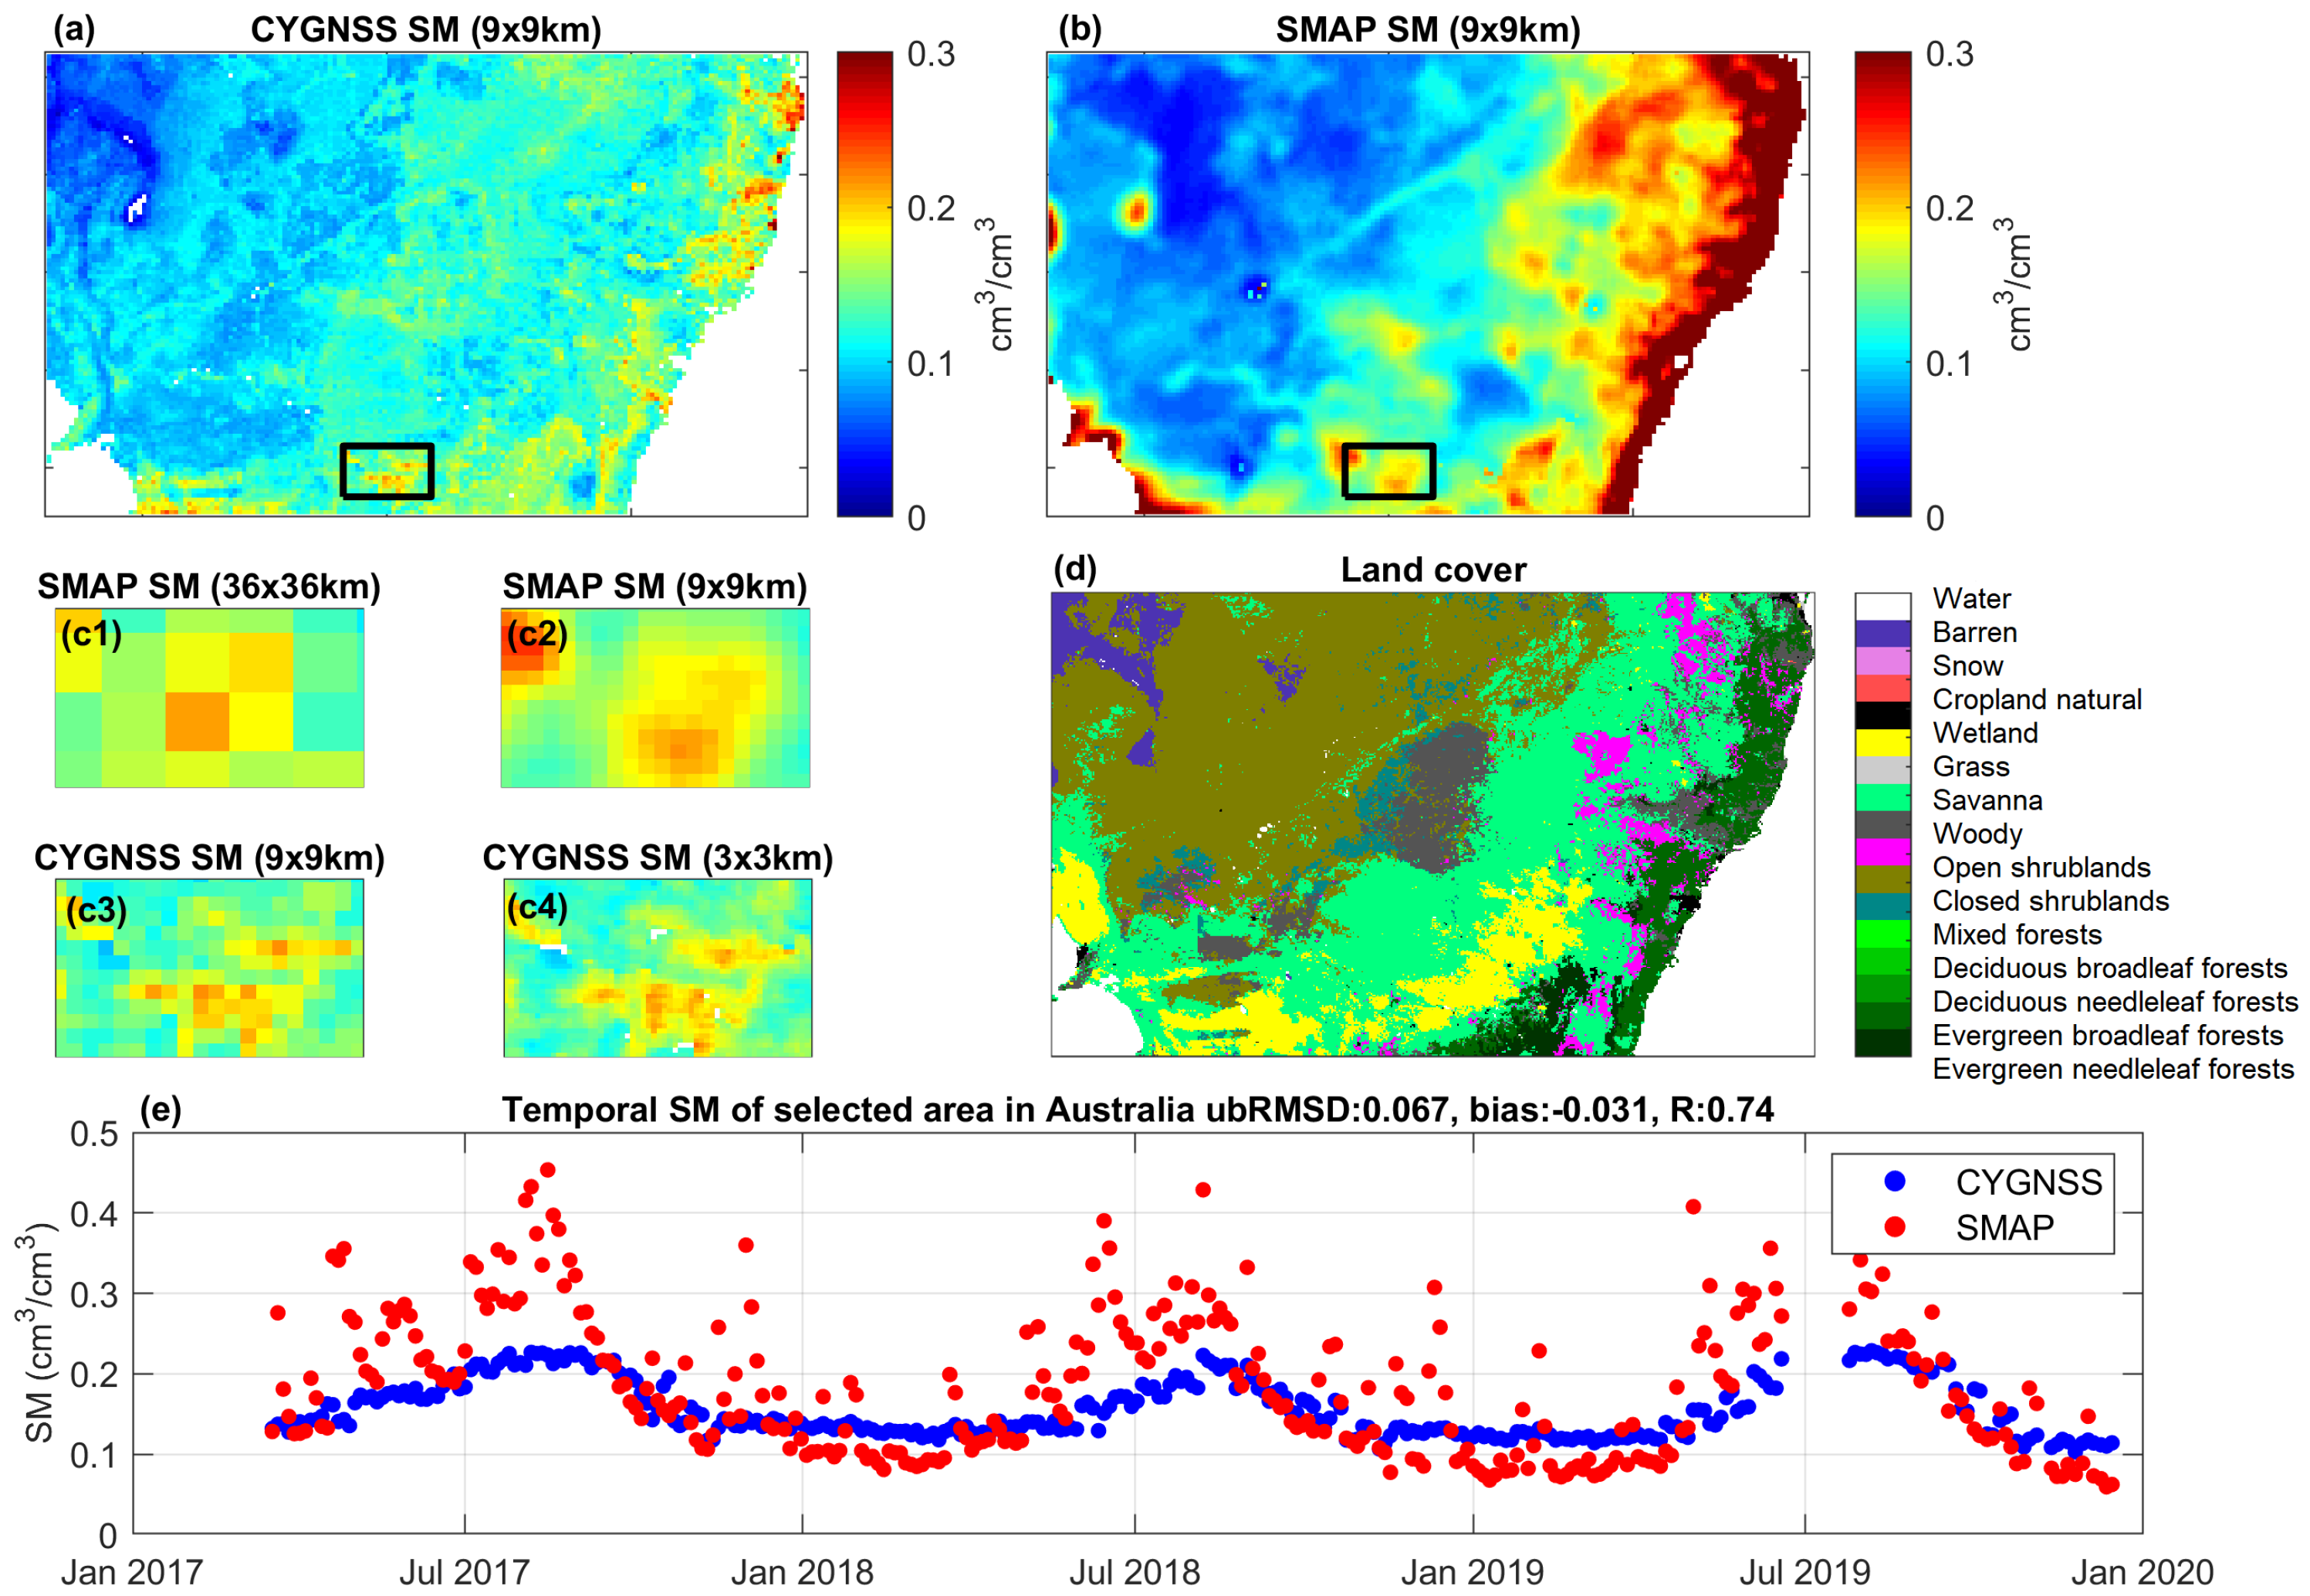
Here, four target regions are selected, i.e., Midwest US, India, the Sahara, and Australia, to provide a regional analysis of the temporal and spatial performance of CYGNSS in comparison to SMAP. These regions are chosen to be representative of different vegetation and climate characteristics. Information on each region with specific location coordinates, dominant land cover, and climate types are summarized in Table 3 and the extent of the target area are shown in Figure 1. In order to spatially compare CYGNSS and SMAP SM estimates, the results are averaged over a duration of one month. Both CYGNSS and SMAP 9-km SM maps are accompanied with the land cover map of the same region. In addition, sub-regions (approximately 200 km × 200 km) are selected to illustrate the differences and similarities between CYGNSS and SMAP estimates at all combinations of available resolutions (from 3 km, 9 km, to 36 km). For each sub-target area, the average CYGNSS and SMAP SM values are provided as a function of time from March 2017 to December 2019.
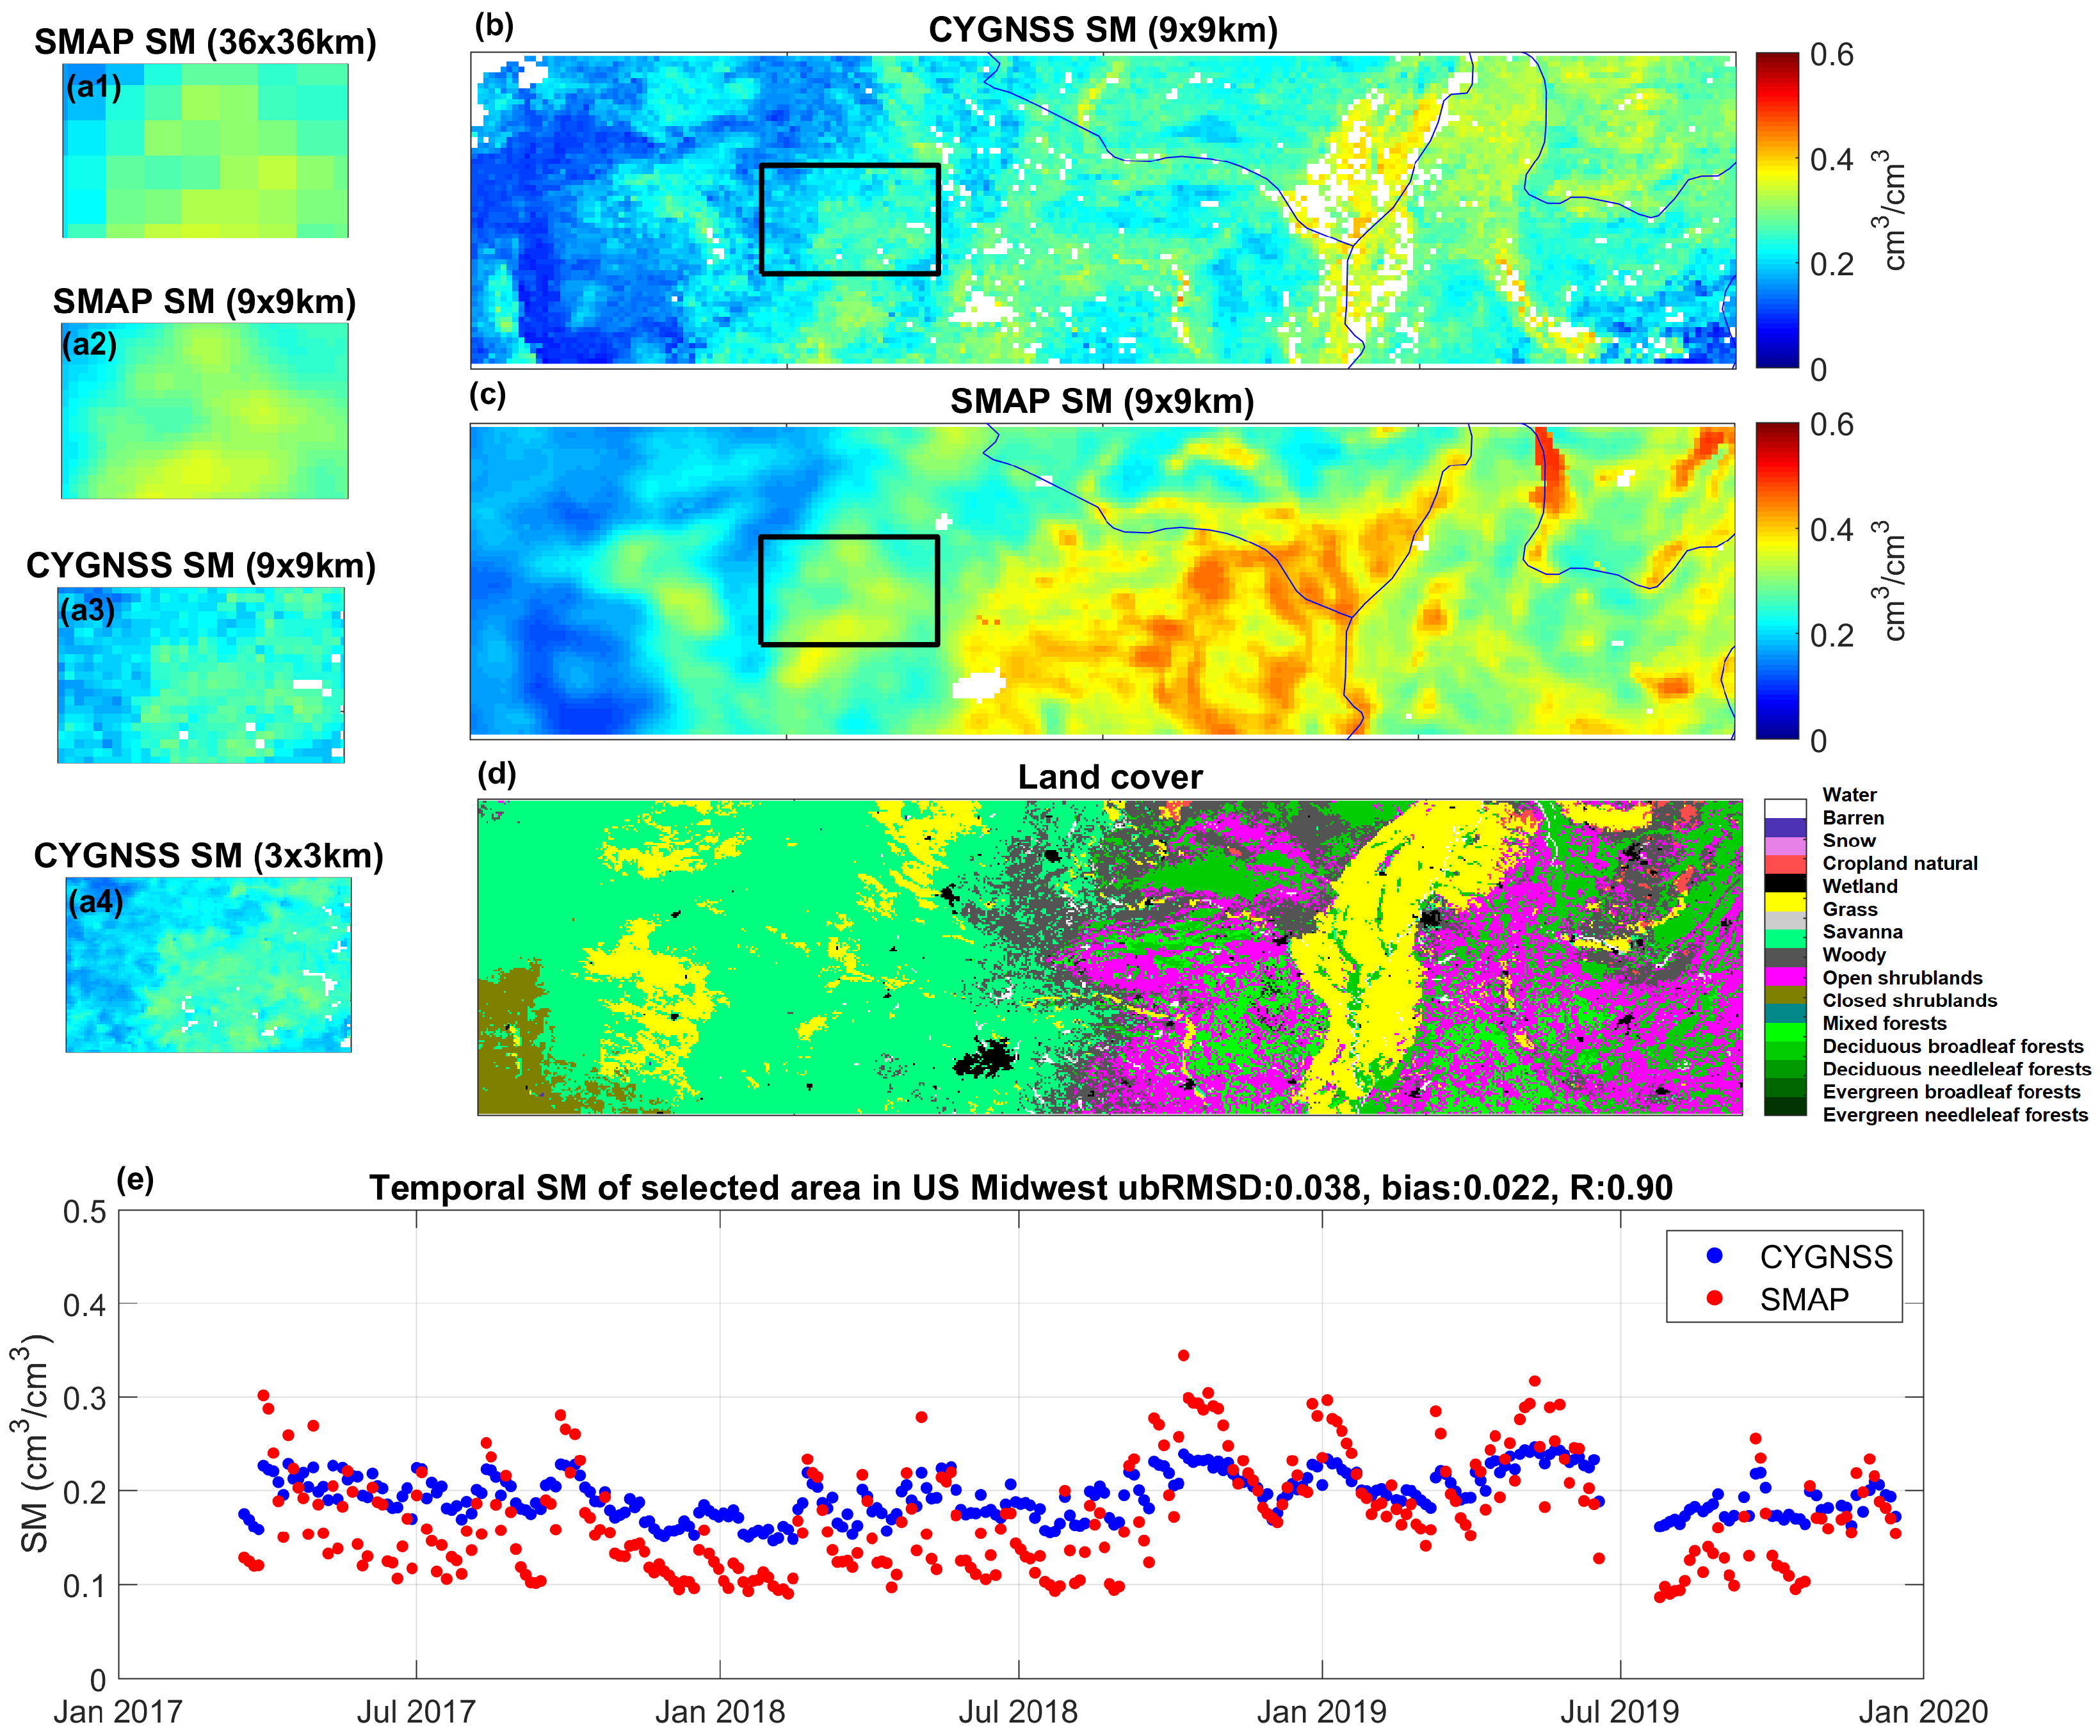
Figure 10 shows the results over the Midwest US for January 2018. This region has heterogeneous land cover conditions (grass, crop, and woody) and is within a warm temperate fully humid climate zone. From Figure 10b,c, a good spatial correspondence between CYGNSS and SMAP predictions is seen at 9 km while CYGNSS estimates are generally drier. In particular, SM from CYGNSS are underestimated near the Mississippi River and other water bodies. This can be due to the fact that SMAP’s native resolution is about 40 km. SMAP observations can blend small water bodies with land leading to higher SM values while the CYGNSS SM algorithm does not attempt to retrieve SM when the water fraction within the 3-km grid of the CYGNSS observation exceeds 2% (see white areas in Figure 10(a4)). A somparison of SM estimates at various resolutions is shown in Figure 10a to illustrate the CYGNSS SM algorithm’s ability to resolve small details. The 3-km gridded CYGNSS estimates are visually sharper and provide more detailed features than its coarser resolution (i.e., 9-km and 36-km) results. For the same sub-region, a time-series example for the entire data set is shown in Figure 10e. The CYGNSS-based SM values show good agreement with SMAP retrievals for the entire period. Although the dynamic range of CYGNSS ML-based estimates is slightly less than SMAP, there is a high correlation (0.90) between the two time series.
Figure 11 shows SM estimates for the month of Oct 2018 in the India region, which dominantly features croplands with equatorial-winter-dry climate zone. A high spatial correlation can be seen from the 9-km SMAP and CYGNSS SM maps in Figure 11a,b. CYGNSS tends to underestimate SM in some coastal and woody areas when compared to SMAP. However, these regions are also flagged by SMAP’s RQF as having high uncertainty for SM retrieval. The results in the selected sub-region are presented in Figure 11d for SM estimates at fine and coarse resolutions. Note that the Tibet regions in the top-right corner of the CYGNSS SM images are excluded due to high elevation. For other regions, due to the seasonal standing water on the soil surface, SMAP results are wetter compared to the CYGNSS estimates. This is visually apparent in the temporal trend given in Figure 11e where abrupt increases in SM appear during monsoon seasons. Outside of these monsoon events which occur roughly from June to September, a very high correlation is found between the time-series SM values from the proposed CYGNSS and SMAP retrievals. It should be noted that the training dataset does not have any samples from the monsoon areas, since there are no ISMN sites in this area. In addition, SMAP retrievals are not recommended for these regions in the monsoon season. The correlation coefficient of the two time series is calculated to be 0.83. The result shows the proposed model is able to follow dry and rainy seasons.
The selected region in the Sahara shown in Figure 12 captures a transition from barren to grass and savanna land covers in arid and equatorial climate zones. The results are given for the month of October in 2018. While both SMAP and CYGNSS estimates follow a similar spatial pattern, CYGNSS SM tends to underestimate SM over woody and savanna regions when compared to SMAP. In parallel to the previous examples, CYGNSS is drier around small water bodies compared to SMAP estimates as seen in close up images in Figure 12a. The temporal SM change of the sub-region for both CYGNSS and SMAP SM retrievals can be seen in Figure 12e.
The last test region is Australia which is dominantly open-shrublands in central regions and grass near coastal areas. The 9-km CYGNSS and SMAP SM maps are presented for the month of October in 2018 in Figure 13a,b for a spatial comparison while the close-up images are given in Figure 13c to check the details in finer resolution SM predictions. The temporal comparison of the sub-set area of Australia is shown in Figure 13e. Similar to previous observations, here CYGNSS’s high spatial resolution capability is able to resolve details over moderately heterogeneous regions. It is clearly seen that there is a large offset between SMAP and CYGNSS estimates for wet seasons and SMAP’s flagged grids. CYGNSS’s ability to distinguish small features at fine resolutions can potentially contribute to the quality of SM estimation.

5. Discussion

In this paper, we evaluated the performance of a CYGNSS ML-based SM product over the globe using SMAP radiometer SM data. The ML model is trained using measurements from in-situ SM stations that are primarily located in the continental U.S. Despite the lack of a large number of global in-situ SM stations, the SM estimates perform quite well when compared to SMAP even though the model is trained without any SMAP SM information. In general, the model estimation agrees well with SMAP measurements with an average ubRMSD of 0.049 and 0.041 cm 3 cm 3 for the whole globe and the areas encompassed by SMAP’s recommended quality flags, respectively.
The results show that the performance of the proposed model estimations is degenerated with increasing canopy cover, especially for forested areas. This is expected since the presence of a vegetation canopy reduces the dynamic range of observed reflectivity at L-band [40,41]. In addition, with increasing canopy affects, the model shows a dry bias compared to SMAP SM estimates. Part of the reason for this mismatch is that the model is trained on a small, point-scale dataset which does not feature sufficient samples from areas that can be classified as equatorial, high canopy, or other conditions such as seasonal snow and monsoon. In addition, SMAP’s large native resolution (about 40 km) blends small water bodies that makes the SMAP results contain higher SM values while the higher-resolution CYGNSS SM algorithm excludes small water bodies within the 3 km grid for the CYGNSS observations. The bias is particularly evident during the wet season (e.g., monson) where there exists seasonal surface standing water.
Overall, the proposed model based on CYGNSS and ancillary inputs generates promising results with a comparable accuracy to the reference SMAP data and in-situ measurements. The most challenging components of the study is the limited samples provided in the training dataset. The model is trained using 170 in-situ station records, and this corresponds to an approximate land surface area of 103 km 2 . However, the total surface area of the earth that the model is tested on is roughly 1.67× 10⁸ km 2 . It is expected that a CYGNSS-based ML model trained with a larger sample of in-situ measurements over the world can provide a more generalized solution for SM estimation with high spatial resolution and short revisit time.
Here, we implemented a single ML model to predict SM values for all locations within CYGNSS’s ground track. As our results suggest, model estimates can vary by location as influenced by different scattering structures within CYGNSS’s footprint. The use of such a single ML model can lead to significant biases caused by location-specific factors such as unique SM profiles, terrain, and weather conditions. Instead of a single ML model, future studies can implement multiple ML models that are trained over different geological areas in order to obtain better SM predictions for different terrain. Furthermore, we developed a model without using any seasonal data or location information. Such information plays a significant role in the SM profile structure, and the inclusion of these sources will likely increase the prediction accuracy for surface SM given sufficient training datasets with appreciable spatial variability.

6. Conclusions

In this paper, a ML model designed for surface SM estimation by using CYGNSS measurements in conjunction with ancillary data is presented for surface SM estimation. The model was trained exclusively with 170 in-situ measurements from ISMN sites within CYGNSS’s spatial coverage. The model was capable of producing daily SM estimates with a 3-km spatial resolution without requiring any space-borne SM data products such as SMAP. The SM estimates were spatially averaged to 9 km for comparison with SMAP’s enhanced, 9-km product within the CYGNSS coverage.
The model evaluation for about 3 years showed that the CYGNSS-based ML model yielded a ubRMSE of 0.049 cm 3 cm 3 when compared to all available SMAP SM values. After excluding all grid values that did no meet SMAP’s recommended quality control factors, the ubRMSE was further reduced to 0.041 cm 3 cm 3 . Despite being trained independently of SMAP data, it was shown that the ML model obtained high correlation with SMAP data with an approximate correlation coefficient of 0.7 within the CYGNSS coverage. Furthermore, by analyzing for various land cover types, SMAP and the ML model still showed high agreements in areas of light vegetation with ubRMSE below 0.03 cm 3 cm 3 . For areas with dense vegetation such as forests and croplands, higher ubRMSE values of roughly 0.07 cm 3 cm 3 were observed. In general, the ubRMSE between the two models could be reduced with spatio-temporal averaging as expected.
To further understand the accuracy of the model, a comparison between the CYGNSS-based ML model, SMAP, and in-situ data from the ISMN sites was performed. We note that the ML model was trained using ISMN samples. While this comparison involved three datasets of vastly different spatial extent (i.e., point-scale datasets vs. 3-km CYGNSS-based SM and 9-km SMAP-based SM), the performance showed that both SMAP and the ML model have similar ubRMSE against the ISMN data. SMAP data, however, showed a much larger bias in its dataset that was likely caused by SMAP’s coarse native resolutions and uncorrected small water bodies within the footprint. Additionally, it was shown that the ML method’s higher temporal resolution allowed it to capture abrupt changes in SM due to rain events.
In addition, all data was temporally averaged for a month-long period at selected regions. Overall, it could be seen that both SMAP and the ML model featured high spatial correspondence for all examined areas across the world. In general, the CYGNSS-based ML method was capable of producing higher resolution data with notable land features, but a reduced dynamic range was apparent when compared to SMAP’s datasets. Temporally, some smaller SM values were found for CYGNSS when compared to SMAP. This could be partially attributed to the limited samples in the ML model, as well as the quality control factors of the CYGNSS-based method which excludes grids with significant water bodies at 3-km resolution.
In summary, it can be seen that GNSS-R-based, physics-guided ML techniques could provide an excellent, complimentary dataset for global SM estimation with significant research potential for improved data products. Despite the limited spatial variability of the training dataset, the model showed high agreement with independent SM estimates over the entire CYGNSS coverage.

Supplementary Materials

The following are available online at https://www.mdpi.com/2072-4292/12/21/3503/s1

Author Contributions

Conceptualization: M.K. and A.C.G.; Methodology: M.K. and A.C.G.; Software: V.S. and F.L.; Validation: V.S. and F.L.; Formal analysis: V.S. and F.L.; Investigation: V.S., F.L., D.B., M.K., and A.C.G.; Resources: M.K. and A.C.G.; Data curation: F.L.; Writing–original draft preparation: V.S., F.L., M.K., D.B., and A.C.G.; Writing–review and editing: V.S., F.L., M.K., D.B., A.C.G., and R.M.; Visualization: V.S., F.L., and D.B.; Supervision: M.K. and A.C.G.; Project administration: M.K. and A.C.G.; Funding acquisition: M.K., A.C.G., and R.M. All authors have read and agreed to the published version of the manuscript.

Funding

This research was funded by USDA Agricultural Research Service(USDA-ARS), Award NACA 58-6064-9-007.

Conflicts of Interest

The authors declare no conflict of interest.

Appendix A. Retrieval Comparisons

Figure A1. A list of recent CYGNSS-based SM retrieval approaches that mostly differ in (1) assumptions regarding gridding, open water masking, and surface conditions, (2) ancillary data requirements, (3) validation and reference data sets, (4) time spans, (5) models and (6) spatial coverage. The list is given in chronological order.
Remotesensing 12 03503 g0a1

References

  1. Jung, M.; Reichstein, M.; Ciais, P.; Seneviratne, S.I.; Sheffield, J.; Goulden, M.L.; Bonan, G.; Cescatti, A.; Chen, J.; De Jeu, R.; et al. Recent decline in the global land evapotranspiration trend due to limited moisture supply. Nature 2010, 467, 951–954. [Google Scholar] [CrossRef] [PubMed]
  2. Entekhabi, D.; Rodriguez-Iturbe, I.; Castelli, F. Mutual interaction of soil moisture state and atmospheric processes. J. Hydrol. 1996, 184, 3–17. [Google Scholar] [CrossRef]
  3. Korres, W.; Reichenau, T.; Schneider, K. Patterns and scaling properties of surface soil moisture in an agricultural landscape: An ecohydrological modeling study. J. Hydrol. 2013, 498, 89–102. [Google Scholar] [CrossRef] [Green Version]
  4. Seneviratne, S.I.; Corti, T.; Davin, E.L.; Hirschi, M.; Jaeger, E.B.; Lehner, I.; Orlowsky, B.; Teuling, A.J. Investigating soil moisture–climate interactions in a changing climate: A review. Earth-Sci. Rev. 2010, 99, 125–161. [Google Scholar] [CrossRef]
  5. Kerr, Y.H.; Waldteufel, P.; Wigneron, J.P.; Delwart, S.; Cabot, F.; Boutin, J.; Escorihuela, M.J.; Font, J.; Reul, N.; Gruhier, C.; et al. The SMOS mission: New tool for monitoring key elements ofthe global water cycle. Proc. IEEE 2010, 98, 666–687. [Google Scholar] [CrossRef] [Green Version]
  6. Entekhabi, D.; Njoku, E.G.; ONeill, P.E.; Kellogg, K.H.; Crow, W.T.; Edelstein, W.N.; Entin, J.K.; Goodman, S.D.; Jackson, T.J.; Johnson, J.; et al. The soil moisture active passive (SMAP) mission. Proc. IEEE 2010, 98, 704–716. [Google Scholar] [CrossRef]
  7. Brocca, L.; Ciabatta, L.; Massari, C.; Moramarco, T.; Hahn, S.; Hasenauer, S.; Kidd, R.; Dorigo, W.; Wagner, W.; Levizzani, V. Soil as a natural rain gauge: Estimating global rainfall from satellite soil moisture data. J. Geophys. Res. Atmos. 2014, 119, 5128–5141. [Google Scholar] [CrossRef]
  8. Lu, Y.; Steele-Dunne, S.C.; Farhadi, L.; van de Giesen, N. Mapping surface heat fluxes by assimilating SMAP soil moisture and GOES land surface temperature data. Water Resour. Res. 2017, 53, 10858–10877. [Google Scholar] [CrossRef] [Green Version]
  9. Zhang, J.; Bai, Y.; Yan, H.; Guo, H.; Yang, S.; Wang, J. Linking observation, modelling and satellite-based estimation of global land evapotranspiration. Big Earth Data 2020, 4, 94–127. [Google Scholar] [CrossRef]
  10. Zavorotny, V.U.; Gleason, S.; Cardellach, E.; Camps, A. Tutorial on remote sensing using GNSS bistatic radar of opportunity. IEEE Geosci. Remote Sens. Mag. 2014, 2, 8–45. [Google Scholar] [CrossRef] [Green Version]
  11. Martin-Neira, M. A passive reflectometry and interferometry system (PARIS): Application to ocean altimetry. ESA J. 1993, 17, 331–355. [Google Scholar]
  12. Unwin, M.; Jales, P.; Tye, J.; Gommenginger, C.; Foti, G.; Rosello, J. Spaceborne GNSS-reflectometry on TechDemoSat-1: Early mission operations and exploitation. IEEE J. Sel. Top. Appl. Earth Obs. Remote Sens. 2016, 9, 4525–4539. [Google Scholar] [CrossRef]
  13. Ruf, C.S.; Chew, C.; Lang, T.; Morris, M.G.; Nave, K.; Ridley, A.; Balasubramaniam, R. A new paradigm in earth environmental monitoring with the CYGNSS small satellite constellation. Sci. Rep. 2018, 8, 8782. [Google Scholar] [CrossRef] [Green Version]
  14. Addabbo, P.; Giangregorio, G.; Galdi, C.; di Bisceglie, M. Simulation of TechDemoSat-1 delay-Doppler maps for GPS ocean reflectometry. IEEE J. Sel. Top. Appl. Earth Obs. Remote Sens. 2017, 10, 4256–4268. [Google Scholar] [CrossRef]
  15. Wang, F.; Yang, D.; Zhang, B.; Li, W. Waveform-based spaceborne GNSS-R wind speed observation: Demonstration and analysis using UK TechDemoSat-1 data. Adv. Space Res. 2018, 61, 1573–1587. [Google Scholar] [CrossRef]
  16. Rius, A.; Cardellach, E.; Fabra, F.; Li, W.; Ribó, S.; Hernández-Pajares, M. Feasibility of GNSS-R ice sheet altimetry in Greenland using TDS-1. Remote Sens. 2017, 9, 742. [Google Scholar] [CrossRef] [Green Version]
  17. Li, W.; Cardellach, E.; Fabra, F.; Ribó, S.; Rius, A. Measuring Greenland Ice Sheet Melt Using Spaceborne GNSS Reflectometry From TechDemoSat-1. Geophys. Res. Lett. 2020, 47, e2019GL086477. [Google Scholar] [CrossRef]
  18. Comite, D.; Cenci, L.; Colliander, A.; Pierdicca, N. Monitoring Freeze-Thaw State by means of GNSS Reflectometry: An Analysis of TechDemoSat-1 Data. IEEE J. Sel. Top. Appl. Earth Obs. Remote Sens. 2020, 13, 2996–3005. [Google Scholar] [CrossRef]
  19. Camps, A.; Park, H.; Pablos, M.; Foti, G.; Gommenginger, C.P.; Liu, P.W.; Judge, J. Sensitivity of GNSS-R spaceborne observations to soil moisture and vegetation. IEEE J. Sel. Top. Appl. Earth Obs. Remote Sens. 2016, 9, 4730–4742. [Google Scholar] [CrossRef] [Green Version]
  20. Chew, C.; Shah, R.; Zuffada, C.; Hajj, G.; Masters, D.; Mannucci, A.J. Demonstrating soil moisture remote sensing with observations from the UK TechDemoSat-1 satellite mission. Geophys. Res. Lett. 2016, 43, 3317–3324. [Google Scholar] [CrossRef] [Green Version]
  21. Chew, C.; Small, E. Soil moisture sensing using spaceborne GNSS reflections: Comparison of CYGNSS reflectivity to SMAP soil moisture. Geophys. Res. Lett. 2018, 45, 4049–4057. [Google Scholar] [CrossRef] [Green Version]
  22. Kim, H.; Lakshmi, V. Use of Cyclone Global Navigation Satellite System (CYGNSS) observations for estimation of soil moisture. Geophys. Res. Lett. 2018, 45, 8272–8282. [Google Scholar] [CrossRef] [Green Version]
  23. Al-Khaldi, M.M.; Johnson, J.T.; O’Brien, A.J.; Balenzano, A.; Mattia, F. Time-Series Retrieval of Soil Moisture Using CYGNSS. IEEE Trans. Geosci. Remote Sens. 2019, 57, 4322–4331. [Google Scholar] [CrossRef]
  24. Clarizia, M.P.; Pierdicca, N.; Costantini, F.; Floury, N. Analysis of CYGNSS Data for Soil Moisture Retrieval. IEEE J. Sel. Top. Appl. Earth Obs. Remote Sens. 2019, 12, 2227–2235. [Google Scholar] [CrossRef]
  25. Eroglu, O.; Kurum, M.; Boyd, D.; Gurbuz, A.C. High Spatio-Temporal Resolution CYGNSS Soil Moisture Estimates Using Artificial Neural Networks. Remote Sens. 2019, 11, 2272. [Google Scholar] [CrossRef] [Green Version]
  26. Senyurek, V.; Lei, F.; Boyd, D.; Kurum, M.; Gurbuz, A.C.; Moorhead, R. Machine Learning-Based CYGNSS Soil Moisture Estimates over ISMN sites in CONUS. Remote Sens. 2020, 12, 1168. [Google Scholar] [CrossRef] [Green Version]
  27. Chew, C.; Small, E. Description of the UCAR/CU Soil Moisture Product. Remote Sens. 2020, 12, 1558. [Google Scholar] [CrossRef]
  28. Yang, T.; Wan, W.; Sun, Z.; Liu, B.; Li, S.; Chen, X. Comprehensive Evaluation of Using TechDemoSat-1 and CYGNSS Data to Estimate Soil Moisture over Mainland China. Remote Sens. 2020, 12, 1699. [Google Scholar] [CrossRef]
  29. Yan, Q.; Huang, W.; Jin, S.; Jia, Y. Pan-tropical soil moisture mapping based on a three-layer model from CYGNSS GNSS-R data. Remote Sens. Environ. 2020, 247, 111944. [Google Scholar] [CrossRef]
  30. Rodriguez-Alvarez, N.; Podest, E.; Jensen, K.; McDonald, K.C. Classifying Inundation in a Tropical Wetlands Complex with GNSS-R. Remote Sens. 2019, 11, 1053. [Google Scholar] [CrossRef] [Green Version]
  31. Dorigo, W.A.; Xaver, A.; Vreugdenhil, M.; Gruber, A.; Hegyiova, A.; Sanchis-Dufau, A.D.; Zamojski, D.; Cordes, C.; Wagner, W.; Drusch, M. Global automated quality control of in situ soil moisture data from the International Soil Moisture Network. Vadose Zone J. 2013, 12. [Google Scholar] [CrossRef]
  32. Colliander, A.; Jackson, T.J.; Bindlish, R.; Chan, S.; Das, N.; Kim, S.; Cosh, M.; Dunbar, R.; Dang, L.; Pashaian, L.; et al. Validation of SMAP surface soil moisture products with core validation sites. Remote Sens. Environ. 2017, 191, 215–231. [Google Scholar] [CrossRef]
  33. Dorigo, W.A.; Wagner, W.; Hohensinn, R.; Hahn, S.; Paulik, C.; Xaver, A.; Gruber, A.; Drusch, M.; Mecklenburg, S.; Oevelen, P.V.; et al. The International Soil Moisture Network: A data hosting facility for global in situ soil moisture measurements. Hydrol. Earth Syst. Sci. 2011, 15, 1675–1698. [Google Scholar] [CrossRef] [Green Version]
  34. Gruber, A.; Dorigo, W.A.; Zwieback, S.; Xaver, A.; Wagner, W. Characterizing coarse-scale representativeness of in situ soil moisture measurements from the International Soil Moisture Network. Vadose Zone J. 2013, 12. [Google Scholar] [CrossRef] [Green Version]
  35. O’Neill, P.E.; Njoku, E.G.; Jackson, T.J.; Chan, S.; Bindlish, R. SMAP Algorithm Theoretical Basis Document: Level 2 & 3 Soil Moisture (Passive) Data Products; Jet Propulsion Laboratory, California Institute of Technology: Pasadena, CA, USA, 2015. [Google Scholar]
  36. Hengl, T.; de Jesus, J.; Heuvelink, G.B.; Gonzalez, M.R.; Kilibarda, M.; Blagotić, A.; Shangguan, W.; Wright, M.N.; Geng, X.; Bauer-Marschallinger, B.; et al. SoilGrids250m: Global gridded soil information based on machine learning. PLoS ONE 2017, 12, e0169748. [Google Scholar] [CrossRef] [Green Version]
  37. Pekel, J.F.; Cottam, A.; Gorelick, N.; Belward, A.S. High-resolution mapping of global surface water and its long-term changes. Nature 2016, 540, 418. [Google Scholar] [CrossRef]
  38. Chan, S.; Bindlish, R.; O’Neill, P.; Jackson, T.; Njoku, E.; Dunbar, S.; Chaubell, J.; Piepmeier, J.; Yueh, S.; Entekhabi, D.; et al. Development and assessment of the SMAP enhanced passive soil moisture product. Remote Sens. Environ. 2018, 204, 931–941. [Google Scholar] [CrossRef] [Green Version]
  39. Fernandez-Moran, R.; Al-Yaari, A.; Mialon, A.; Mahmoodi, A.; Al Bitar, A.; De Lannoy, G.; Rodriguez-Fernandez, N.; Lopez-Baeza, E.; Kerr, Y.; Wigneron, J.P. SMOS-IC: An alternative SMOS soil moisture and vegetation optical depth product. Remote Sens. 2017, 9, 457. [Google Scholar] [CrossRef] [Green Version]
  40. Zribi, M.; Guyon, D.; Motte, E.; Dayau, S.; Wigneron, J.P.; Baghdadi, N.; Pierdicca, N. Performance of GNSS-R GLORI data for biomass estimation over the Landes forest. Int. J. Appl. Earth Obs. Geoinf. 2019, 74, 150–158. [Google Scholar] [CrossRef]
  41. Zribi, M.; Motte, E.; Baghdadi, N.; Baup, F.; Dayau, S.; Fanise, P.; Guyon, D.; Huc, M.; Wigneron, J.P. Potential applications of GNSS-R observations over agricultural areas: Results from the GLORI airborne campaign. Remote Sens. 2018, 10, 1245. [Google Scholar] [CrossRef] [Green Version]
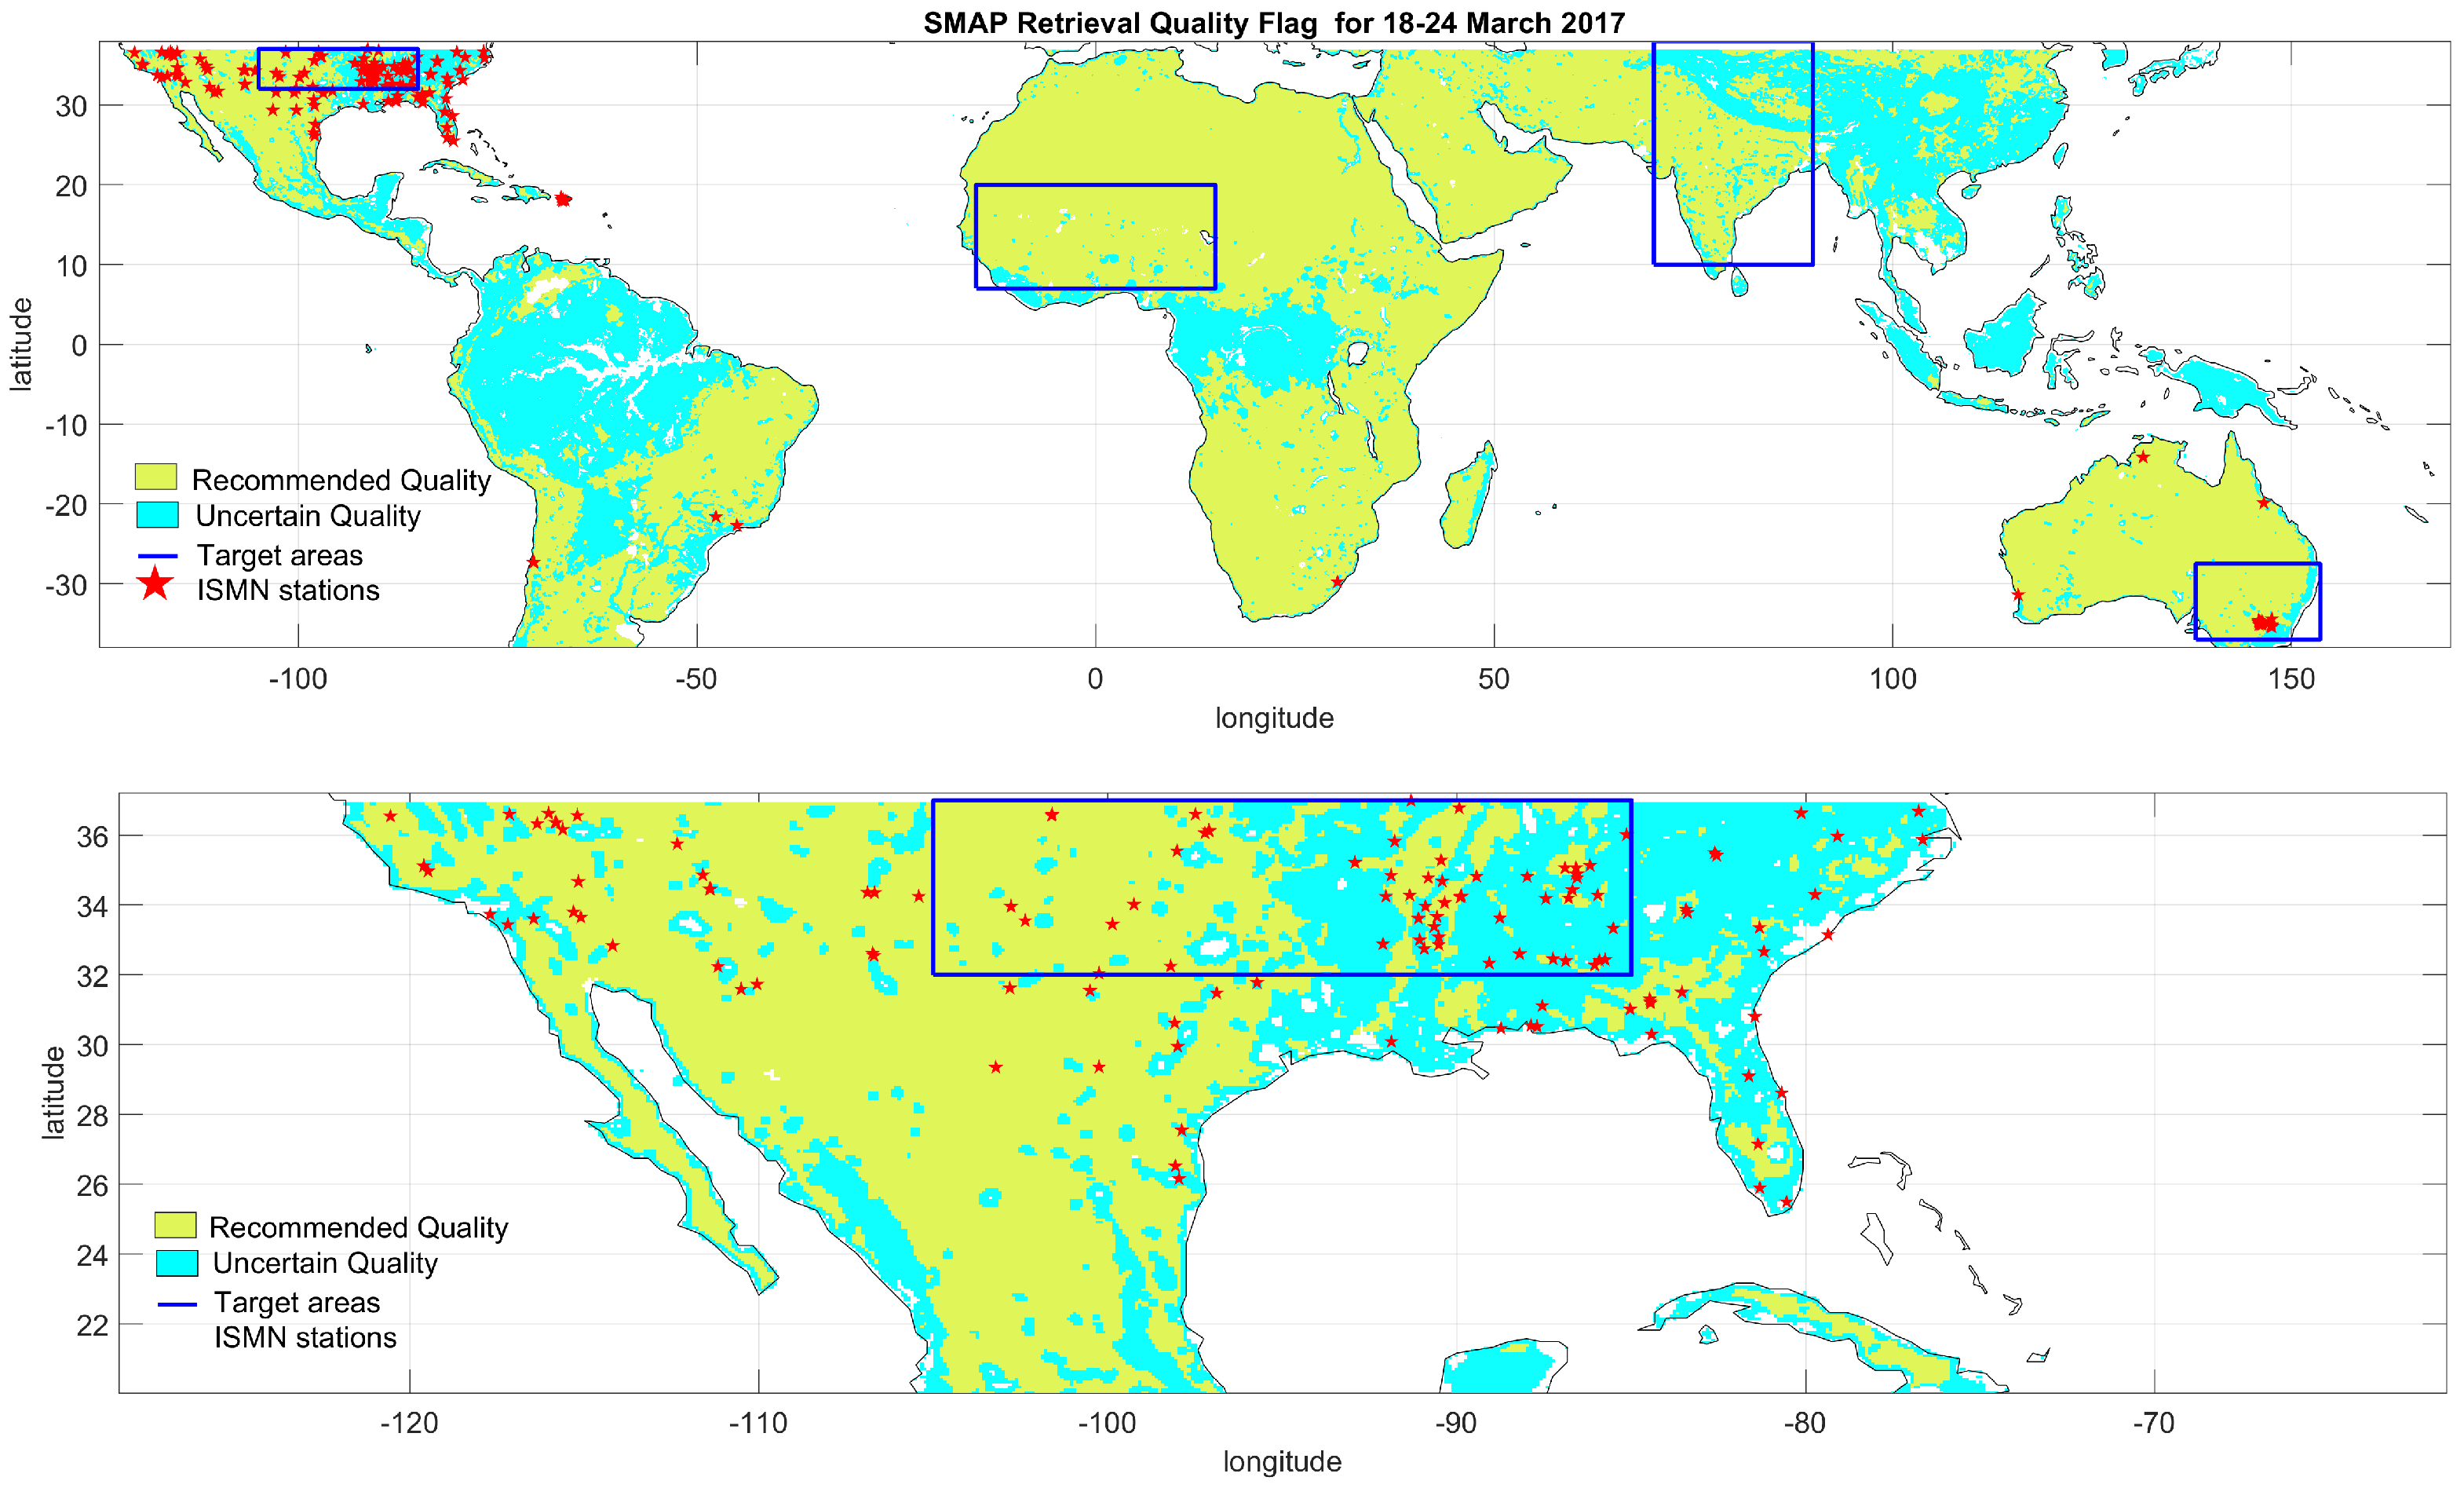
Figure 1. Soil Moisture Active Passive (SMAP) Retrieval Quality Flag (RQF) indicates whether soil moisture (SM) retrieval is recommended (green) or not recommended (cyan) over the specified location. Quality uncertain quality is influenced by factors such as water body fraction, coastal proximity, urban area, precipitation, terrain slope, and high vegetation water content. Red pentagrams show locations of International Soil Moisture Network (ISMN) stations. Blue boxes show target areas that are investigated in Section 4.3.
Remotesensing 12 03503 g001
Figure 2. Simplified random forest (RF) model training process.
Remotesensing 12 03503 g002
Figure 3. Application of the proposed machine learning (ML) model and k-days evaluation process.
Remotesensing 12 03503 g003
Figure 4. Unbiased root-mean-square difference (ubRMSD) between Cyclone Global Navigation Satellite System (CYGNSS)-based model prediction and SMAP retrievals. Semi-transparent regions are those flagged by SMAP as having uncertain SM retrieval quality.
Remotesensing 12 03503 g004
Figure 5. Bias between CYGNSS-based model prediction and SMAP retrievals. Semi-transparent regions are those flagged by SMAP as having an uncertain SM retrieval quality.
Remotesensing 12 03503 g005
Figure 6. Temporal evaluation of the spatial correlation between CYGNSS-based model prediction and SMAP retrievals for all grids (red circles) and SMAP recommended grids (blue circles).
Remotesensing 12 03503 g006
Figure 7. Evaluation of the model for different land cover types. The left axis is for ubRMSD and the right axis is for bias error.
Remotesensing 12 03503 g007
Figure 8. Time series examples of 3-day averaged CYGNSS and SMAP SM predictions that show a moderate performance: (a) KnoxCity, (b) MonoclineRidge, and (c) Watkinsville-5-SSE. The summary table of results from all sites are provided for the same time period in supplementary files.
Remotesensing 12 03503 g008
Figure 9. Shortened time series of CYGNS and SMAP soil moisture retrievals and in-situ measurements from the KnoxCity station.
Remotesensing 12 03503 g009
Figure 10. Averaged SM predictions for Midwest US during Jan 2018. (a) Detailed images of selected area for SMAP 9-km and 36-km and CYGNSS 3-km and 9-km, (b) CYGNSS 9-km, (c) SMAP 9-km, (d) land cover map, and (e) a time-series example from selected area.
Remotesensing 12 03503 g010
Figure 11. Averaged SM predictions for India during Oct 2018. (a) CYGNSS 9-km, (b) SMAP 9-km, (c) land cover map, (d) detailed images of selected area for SMAP 9-km and 36-km and CYGNSS 3-km and 9-km, and (e) a time-series example from selected area.
Remotesensing 12 03503 g011
Figure 12. Averaged SM predictions for Sahara during Oct 2018. (a) Detailed images of selected area for SMAP 9-km and 36-km and CYGNSS 3-km and 9-km, (b) CYGNSS 9-km, (c) SMAP 9-km, (d) land cover map, and (e) a time-series example from selected area.
Remotesensing 12 03503 g012
Figure 13. Averaged SM predictions for Australia during Oct 2018. (a) CYGNSS 9-km, (b) SMAP 9-km, (c) detailed images of selected area for SMAP 9-km and 36-km and CYGNSS 3-km and 9-km, (d) land cover map, and (e) a time-series example from selected area.
Remotesensing 12 03503 g013
Table 1. Overall performance evaluation metrics computed between CYGNSS and SMAP SM predictions at different spatial and temporal averaging levels for about 3 years (from March 2017 to December 2019).
Spatial
Resolution
Time
Resolution
# of SamplesRMSD
cm 3 cm 3
Mean ubRMSD (std.)
cm 3 cm 3
R-Value
for all grids9 km × 9 kmconcurrent1.64 × 1080.110.054 (±0.027)0.63
3-day1.07 × 1080.110.049 (±0.025)0.63
week7.13 × 1070.110.044 (±0.024)0.63
month2.24 × 1070.110.034 (±0.023)0.64
36 km × 36 kmconcurrent2.95 × 1070.110.050 (±0.024)0.65
3-day1.66 × 1070.120.045 (±0.024)0.65
week7.82 × 1060.120.040 (±0.023)0.66
month1.95 × 1060.120.032 (±0.022)0.66
for SMAP
recommended
grids
9 km × 9 kmconcurrent1.16 × 1080.0660.044 (±0.021)0.66
3-day9.14 × 1070.0660.041 (±0.022)0.66
week5.99 × 1070.0650.038 (±0.021)0.68
month1.87 × 1070.0650.031 (±0.021)0.71
36 km × 36 kmconcurrent2.12 × 1070.0700.045 (±0.021)0.69
3-day1.16 × 1070.0710.042 (±0.022)0.70
week5.51 × 1060.0710.037 (±0.022)0.72
month1.39 × 1060.0700.030 (±0.022)0.74
Table 2. Performance at in-situ stations.
In-Situ vs.RMSEMean ubRMSE cm 3 cm 3 Median ubRMSE cm 3 cm 3 R
CYGNSS (training)0.0670.0520.0490.83
CYGNSS (5-fold)0.0720.0550.0510.80
SMAP0.1120.0540.0520.59
Table 3. Information on selected regions for spatial and temporal analysis (see Figure 1 for locations of these regions on the map).
RegionLocationDominant Land CoverClimate Zone
Midwest US85W:105W–32N:37NGrassCfa
India70E:90E–10N:20NCroplandsAw
Sahara−15W:15 E–7N:20NGrassBWh, Aw
Australia138E:153 E–27S:37SOpen shrubladBWh
Publisher’s Note: MDPI stays neutral with regard to jurisdictional claims in published maps and institutional affiliations.