Article

Retrieval and Validation of AOD from Himawari-8 Data over Bohai Rim Region, China

1
School of Remote Sensing and Information Engineering, Wuhan University, Wuhan 430079, China
2
State Key Laboratory of Information Engineering in Surveying, Mapping and Remote Sensing, Wuhan University, Wuhan 430079, China
3
The College of Computer Science and Technology, Chongqing University of Posts and Telecommunications, Chongqing 400065, China
4
College of Geomatics, Shandong University of Science and Technology, Qingdao 266590, China
*
Author to whom correspondence should be addressed.
Remote Sens. 2020, 12(20), 3425; https://doi.org/10.3390/rs12203425
Submission received: 15 September 2020 / Revised: 10 October 2020 / Accepted: 15 October 2020 / Published: 19 October 2020
(This article belongs to the Special Issue Active and Passive Remote Sensing of Aerosols and Clouds)

Abstract

:
The geostationary satellite Himawari-8, possessing the Advanced Himawari Imager (AHI), which features 16 spectral bands from the visible to infrared range, is suitable for aerosol observations. In this study, a new algorithm is introduced to retrieve aerosol optical depth (AOD) over land at a resolution of 2 km from the AHI level 1 data. Considering the anisotropic effects of complex surface structures over land, Moderate Resolution Imaging Spectroradiometer (MODIS) bidirectional reflectance distribution function (BRDF) model parameters product (MCD19A3) is used to calculate the surface reflectance for Himawari-8’s view angle and band. In addition, daily BRDF model parameters are calculated in areas with dense vegetation, considering the rapid variation of surface reflectance caused by vegetation growth. Moreover, aerosol models are constructed based on long duration Aerosol Robotic Network (AERONET) single scattering albedo (SSA) values to stand for aerosol types in the retrieval algorithm. The new algorithm is applied to AHI images over Bohai Rim region from 2018 and is evaluated using the newest AERONET version 3 AOD measurements and the latest MODIS collection 6.1 AOD products. The AOD retrievals from the new algorithm show good agreement with the AERONET AOD measurements, with a correlation coefficient of 0.93 and root mean square error (RMSE) of 0.12. In addition, the new algorithm increases AOD retrievals and retrieval accuracy compared to the Japan Aerospace Exploration Agency (JAXA) aerosol products. The algorithm shows stable performance during different seasons and times, which makes it possible for use in climate or diurnal aerosol variation studies.

Graphical Abstract

1. Introduction

Atmospheric aerosols have profound impacts on the Earth’s radiative balance and the climate through their direct radiative effects, indirect effects, and other cloud-mediated climatic effects [1,2]. On the other hand, as the primary pollutant, atmospheric aerosols have adverse impacts on people’s health, since fine aerosol particles can be inhaled into human lungs, causing respiratory and cardiovascular diseases [3,4,5]. To study aerosol characteristics and their impacts to radiation, climate and human health, it is necessary to obtain in-depth observations and understand their physical and chemical characteristics.
Aerosol optical depth (AOD) is one of the important optical properties of aerosols, which describes the attenuation of sunlight by a total column of aerosols in the atmosphere [6]. Many satellite sensors have been used to measure AOD, such as the AVHRR (Advanced Very High Resolution Radiometer), ATSR-2 (Along Track Scanning Radiometer 2), POLDER (Polarization and Directionality of the Earth’s Reflectances), SeaWiFS (Sea-Viewing Wide Field-of-View Sensor), MODIS (Moderate Resolution Imaging Spectroradiometer), VIIRS (Visible Infrared Imaging Radiometer), and AHI (Advanced Himawari Imager), etc. [7,8,9,10,11,12]. Based on those sensors, a number of AOD retrieval algorithms have been proposed, including the dark target (DT), deep blue (DB), polarization, and multiangle implementation of atmospheric correction (MAIAC) algorithms [13,14,15]. The DT algorithm, introduced by Kaufman (1997), retrieves AOD over areas with dense dark vegetation, where there is an empirical relationship between the visible (0.47 and 0.66 μm) and near-infrared (2.1 μm) bands; however, it is not suitable for AOD retrieval over bright surfaces (e.g., urban regions, deserts, semiarid areas, etc.) [16,17]. To retrieve AOD over bright surfaces, Hsu et al. (2004) proposed the deep blue algorithm (DB), based on a precalculated surface reflectance database [18]. Both the DT and DB methods have been applied to MODIS measurements to generate global AOD products [19]. Bilal et al. (2013) developed a simplified aerosol retrieval algorithm (SARA) for AOD retrieval over Hong Kong based on MODIS data by combining the aerosol properties derived from an AERONET (Aerosol Robotic Network) station and surface reflectance from the MOD09GA L2 daily surface reflectance product [20]. Lyapustin et al. (2018) developed the MAIAC algorithm, which introduced time-series image-based processing and achieved aerosol retrieval using MODIS images at a resolution of 1 km [21]. Tian et al. (2018) built an a priori monthly surface anisotropic information database with a median range of 4 years using MCD43A1 in the blue channel, with which method high accuracy AOD by Landsat 8 OLI data over urban areas was retrieved. [22]. Most studies focused on AOD retrieval are based on polar satellite data, such as MODIS. Polar satellites are good in terms of their global coverage, but they cannot observe the diurnal variation of aerosol properties.
The AHI onboard the Himawari-8 satellite has similar bands to the MODIS, which makes it suitable for aerosol retrieval. In addition, due to being mounted on a geostationary satellite, AHI measurements can offer a high time resolution of 10 min, which cannot be achieved by polar orbiting satellites. Therefore, more studies have tended to retrieve aerosol properties using Himawari-8 measurements in recent years. In the current retrieval algorithm of the official aerosol products of Himawari-8, land surface reflectance (LSR) is estimated using the second lowest AHI reflectance within a month, and an aerosol model which assumes a mixture of fine and coarse aerosol particles based on the work of Omar el al. and Sayer et al. are used [23,24,25]. Other than that, Yan et al. introduced a minimum albedo aerosol retrieval method which calculates LSR based on a 30-day minimum albedo and radiative transfer model [26]. Ge et al. and Gupta et al. used the DT algorithm for AHI AOD retrieval [27,28]. Lim et al. developed the Yonsei aerosol retrieval (YAER) algorithm for the AHI sensor, which determined visible surface reflectance using short-wave infrared (SWIR) data and the minimum reflectance method [29]. Wang et al. retrieved AHI AOD using the lowest gas-corrected reflectance based on top-of-atmosphere (TOA) data [30]. Zhang et al. proposed a novel aerosol retrieval algorithm that utilized a simplified radiative transfer model and surface reflectance from one-month AHI apparent data [31]. However, most studies used a forward model using Lambertian surface approximation, which does not consider the influence of the surface BRDF. In fact, the surface anisotropic effect cannot be ignored for AOD retrieval over land, especially in urban areas. Shi et al. introduced an N-dimensional cost function (NDCF) to simultaneously retrieve AOD at multiple time AHI images, considering the effect of the surface BRDF by fitting the BRDF model parameters based on AHI measurements [32]. She et al. used an optimal estimation method to simultaneously retrieve AOD and bidirectional reflectance with the assistance of the MODIS BRDF product (MCD43) [33].
In this study, we developed a flexible and high-precision method to retrieve AHI AOD. The method uses different surface BRDF determination methods based on Normalized Difference Vegetation Index (NDVI) values and determines the aerosol model according to single scattering albedo (SSA) values for different AODs. The BRDF model parameters used in this study are calculated based on MAIAC BRDF products, measurements of AHI TOA reflectance, and the Ross-thick/Li-sparse (RTLS) model and are used them as inputs in the radiative transfer model to construct lookup tables for AOD retrieval. In order to solve the problem of surface reflectance changes due to the growth of vegetation, daily BRDF model parameters in areas with dense vegetation are calculated. In addition, average single scattering albedo (SSA) values are calculated under different air pollution conditions to constrain the aerosol model in the retrieval algorithm based on the long duration measurements from AERONET. The new AOD retrieval algorithm is applied to AHI level 1 data at a 2 km resolution during 2018. The retrieval algorithm is validated with AERONET AOD measurements and compared with the JAXA (Japan Aerospace Exploration Agency) and MODIS AOD products.

2. Data Sources and Study Area

2.1. Study Region

The Bohai Rim region (about 518,000 km2) is located in northern China (Figure 1), including the Hebei, Liaoning, and Shandong provinces, as well as the Beijing and Tianjin metropolitan areas. As one of the most populated regions in China, it has a population of 250 million. Due to the dense population and high industrialization, the region plays an important role in the development of China. In addition, Bohai Rim region has suffered from serious air pollution for many years.

2.2. Data Sources

2.2.1. AHI Data

Himawari-8, a geostationary satellite, was launched on the 7 October 2014 and is located at 140.7°E [34]. It carries an AHI including 16 spectral bands from visible to infrared with a spatial resolution of approximately 0.5 to 2 km (Table 1). The temporal resolutions of the full-disk and target area images are 10 and 2.5 min, respectively. Therefore, the Himawari-8/AHI can provide more detailed observations of atmospheric aerosols in Asia and Oceania, for instance, it is suitable for studying the diurnal variation of AOD [35].
The official JAXA P-Tree system provides the Himawari Standard Data (HSD format), level 1 gridded reflectance data (NetCDF4 format), and geophysical parameter data, which are readily accessible. In this study, daytime (10:00, 11:00, 12:00, 13:00, 14:00, and 15:00 in Beijing time) level 1 reflectance data at a spatial resolution of 2 km from 2018 are collected. The level 2 version 2.1 aerosol products at a 0.05° (~5 km) spatial resolution were downloaded from the JAXA for comparison.

2.2.2. MODIS Data

The MODIS, loaded on the Terra and Aqua satellites, includes 36 spectral bands that extent from the visible to the infrared with spatial resolutions of 0.25, 0.5, and 1 km. The Terra and Aqua satellites cross the equator at about 10:30 a.m. and 1:30 p.m. (local time), respectively [36]. With a wide swath (~2330 km), the MODIS can observe the entire globe every 1 to 2 days.
Hereafter, “MXD” represents both MYD (Aqua) and MOD (Terra) products for convenience. The latest MODIS aerosol products (MXD04) were retrieved using the DT and DB algorithms with spatial resolutions of 10 and 3 km (3 km product only for DT). Some studies have shown that the AOD retrieved using the DB algorithm are generally more accurate than that by using the DT algorithm [10,11]. In addition, the DB algorithm can retrieve more efficient AOD over non-vegetated regions (i.e., urban and desert regions, etc.). So, MXD04 DB AOD products from January to December of 2018 were used to perform an intercomparison of AHI AOD retrievals in this study.
The new 8-day BRDF model parameter product MCD19A3 provides three weights (isotropic kernel, volumetric kernel, and geometric kernel) of the Ross-thick/Li-sparse (RTLS) BRDF model and can be used to describe the anisotropy of each pixel, also reporting the number of days since the last RTLS model update. The MCD19A3 product can be downloaded from the EarthData website (https://search.earthdata.nasa.gov/), so the data for 2016 and 2017 were used to build a new monthly surface anisotropic information database for AHI AOD retrieval in this study.

2.2.3. AERONET Data

The Aerosol Robotic Network (AERONET) project is a federation of ground-based remote sensing aerosol networks established by NASA and PHOTONS. It can provide accurate ground measurements of AOD every 15 min with an uncertainty of about 0.01 [37]. AERONET also provides other aerosol properties products, such as aerosol refractive index and single scattering albedo. The AERONET version 3 (V3) data were released in January 2018, and the AOD data are provided for three data quality levels: Level 1.0 (unscreened), level 1.5 (cloud-screened and quality controlled), and level 2.0 (quality-assured) [38]. In this study, the AERONET level 2.0 AOD data at three sites, including Beijing (116.38°E, 39.97°N), Beijing-CAMS (116.32°E, 39.93°N), and Xianghe (116.96°E, 39.75°N), are used to validate the accuracy of our AOD retrieval algorithm. Level 1.5 AOD data were used when level 2.0 data were occasionally missing. SSA data during 2010–2018 were also collected to determine the aerosol model in 6SV (Second Simulation of a Satellite Signal in the Solar Spectrum-Vector) code.

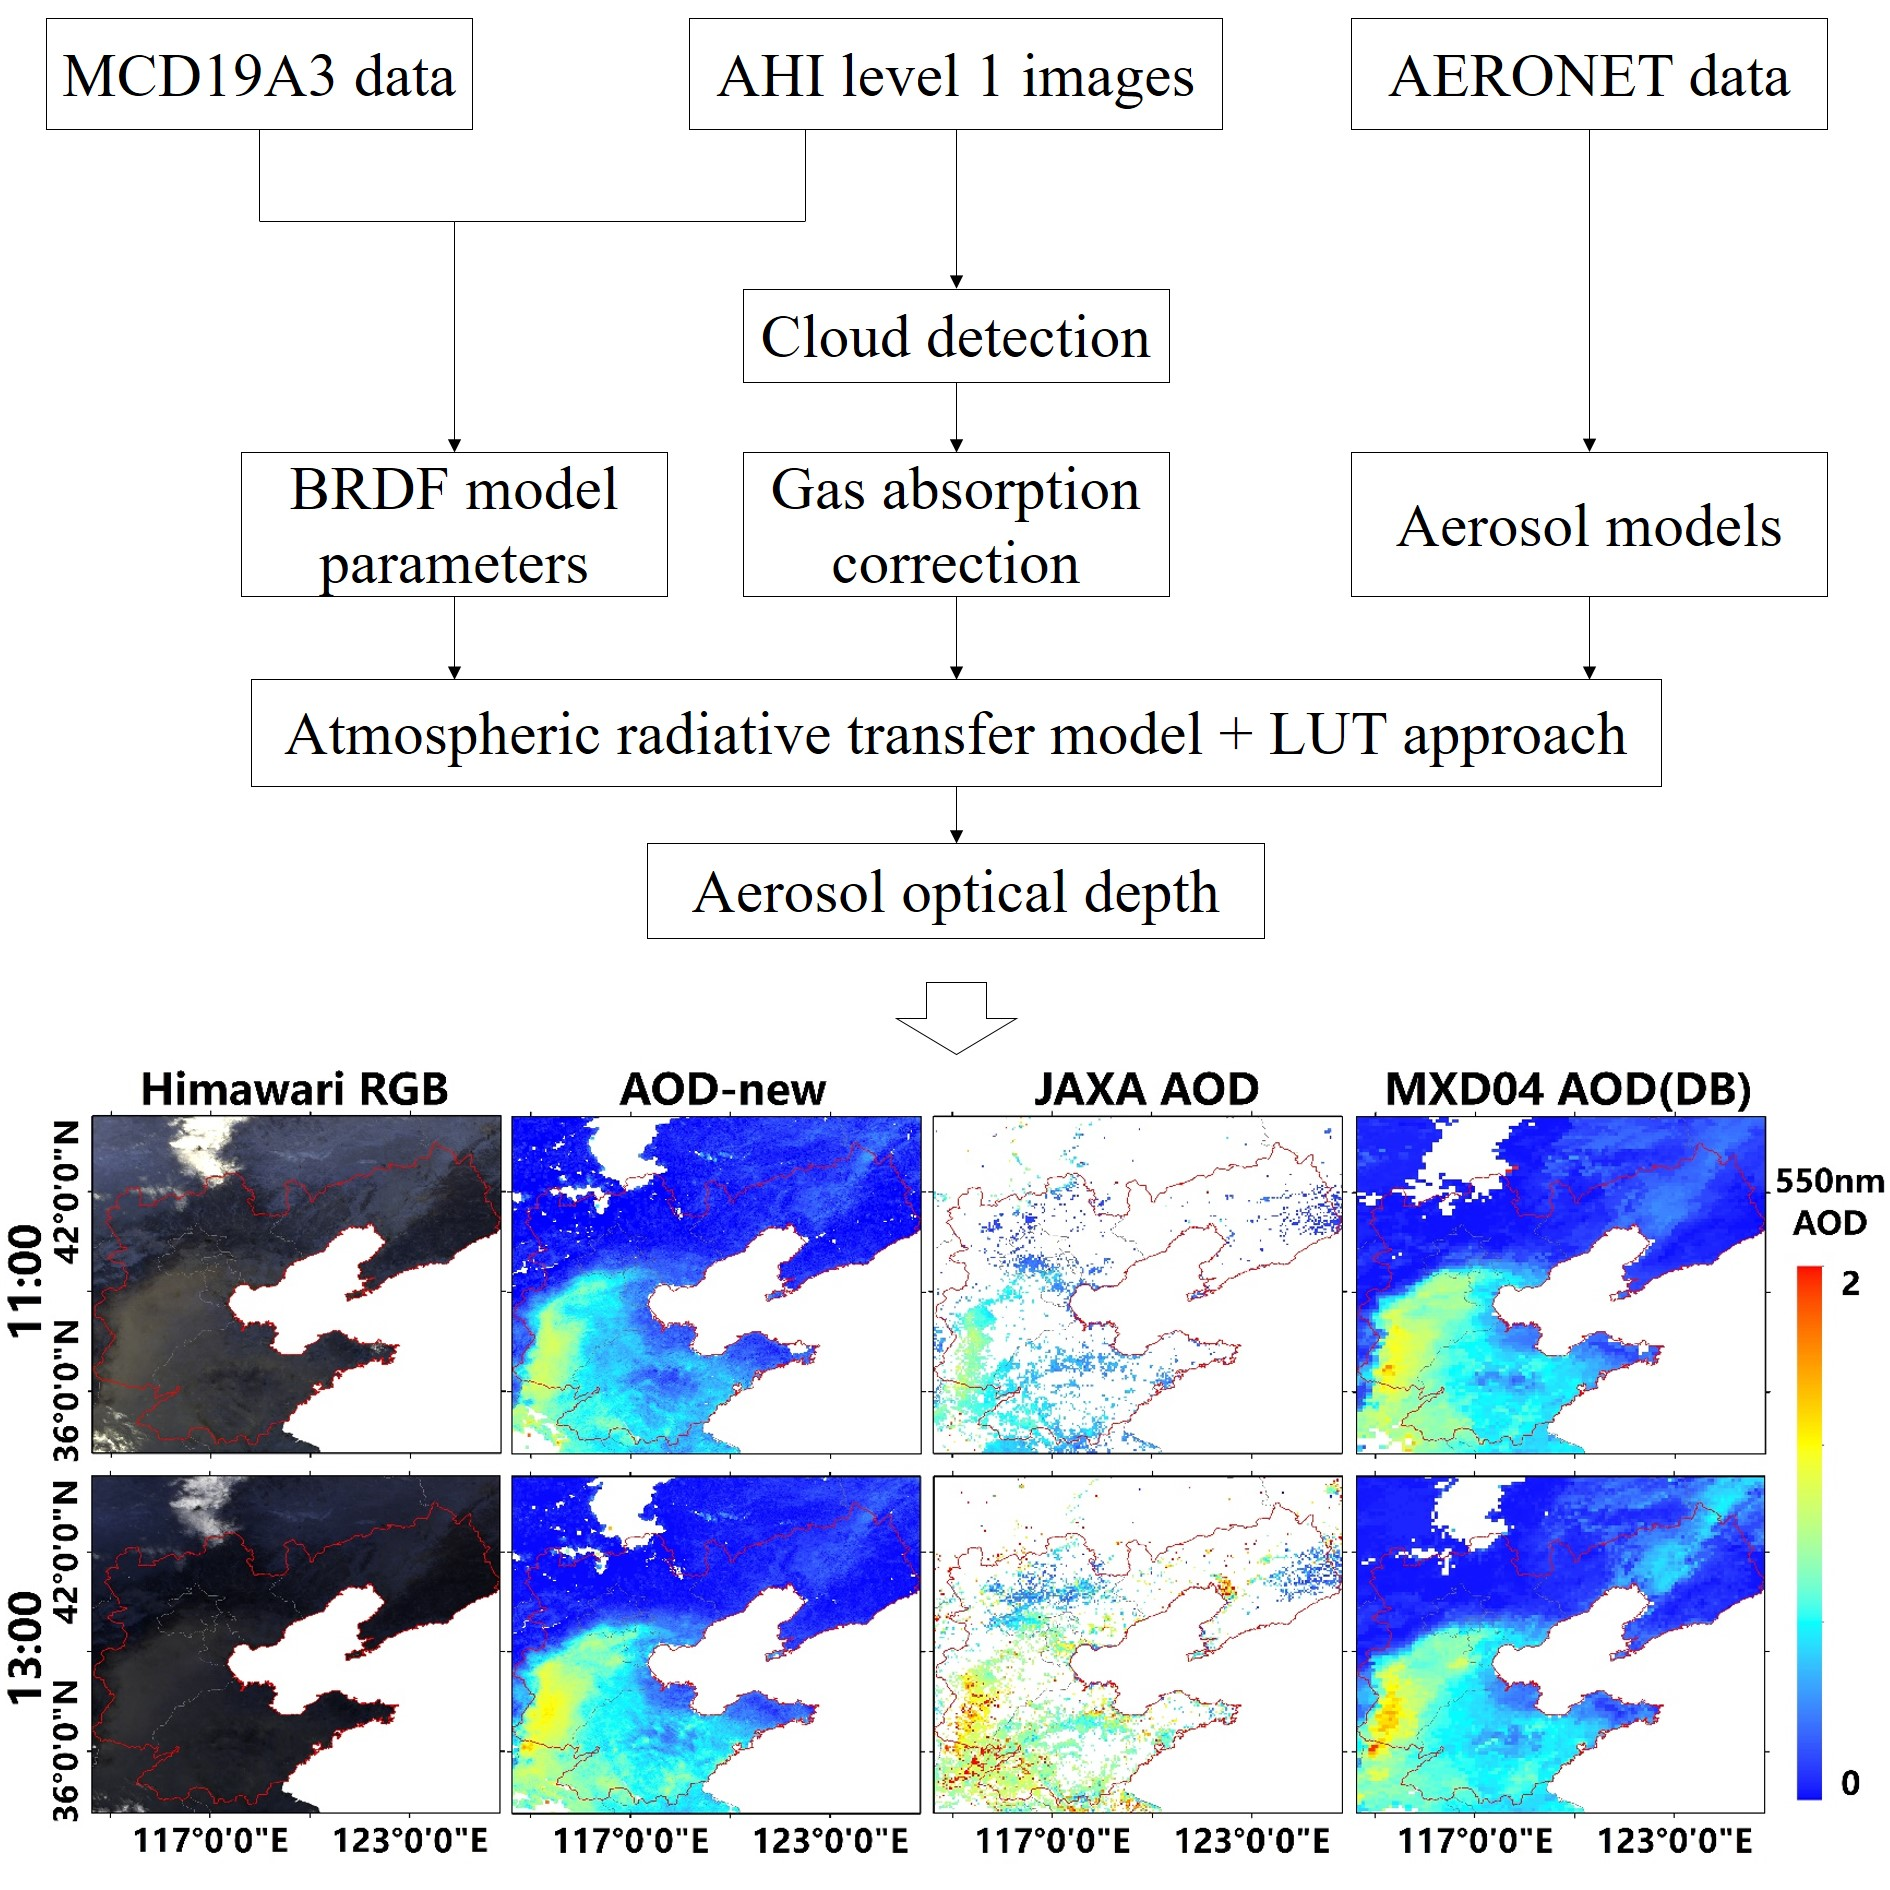
3. AOD Retrieval Methodology

Passive retrieval of AOD from satellites is usually based on the apparent reflectance ρ* at the top-of-atmosphere (TOA) as measured by a satellite sensor. Considering the surface BRDF effect, it can be expressed as follows [39,40]:
  ρ *   ( μ s ,   μ v ,   ϕ )   =   ρ 0   ( μ s ,   μ v ,   ϕ )   +   e   τ μ s   e   τ μ v   ρ t + t d   ( μ s )   ρ t ¯ e   τ μ v + t d   ( μ v )   ρ t ¯ e   τ μ s +   t d   ( μ v )   t d   ( μ s )   ρ t =   +   T R + A   ( μ s )   T R + A   ( μ v ) S   ( ρ t = ) 2 1 S ρ t =
where μ s   and   μ v are the cosines of the solar zenith angle and view zenith angle, respectively; ϕ is the relative azimuth angle;   ρ 0   ( μ s ,   μ v ,   ϕ ) is the atmospheric path reflectance; τ is the optical depth of the atmosphere; T R + A   ( μ s ) and T R + A   ( μ v ) represent the downward and upward atmospheric transmittance, respectively; t d and S are the diffuse transmittance and the atmospheric spherical albedo, respectively; ρ t is the directional surface reflectance and ρ t ¯ , ρ t ¯ , and ρ t = represent the surface hemispherical-directional, directional-hemispherical, and hemispherical-hemispherical reflectance, respectively. Detailed descriptions of ρ t ¯ , ρ t ¯ and ρ t = can be found in Shi’s work [41]. Equation (1) shows that the apparent reflectance at the TOA measured by the satellite sensor is attributed to the atmospheric path reflectance and the equivalent reflectance of the atmospheric and surface interactions. The atmospheric path reflectance includes the joint contribution of aerosols and molecules. Therefore, the aerosol model and LSR (calculated using the RTLS model based on prior knowledge of the BRDF) are crucial for satellite AOD retrieval over land. In addition, gas absorption and cloud detection also need to be carefully considered [42]. In this study, gas absorption is corrected using the midlatitude summer (winter) model defined in 6SV. Cloud detection is conducted based on the method proposed by Yang et al. with minor modification (4 pixels centered on the cloud pixel do not perform AOD retrieval) before further AOD retrieval [43].

3.1. Surface Reflectance Estimation

LSR is one of the key parameters for AOD retrieval over land. Previous studies have shown that an error of 0.01 in LSR leads to an error of 0.1 in AOD [44]. Methods using the lowest or second minimum value of MOD09 or TOA reflectance generally overestimate or underestimate surface reflectance due to anisotropic surface reflectance, as well as the possible significant changes of LSR due to the growth of vegetation [25,45].
Therefore, an a priori monthly BRDF database based on historical MCD19A3 data was built to calculate LSR for the AHI. Since the spectrum response function and wavelength range of the AHI band used is different from the MODIS sensor, spectral transformation was performed to minimize the effect of the different spectrum response between the two sensors.
In addition, considering that the LSR can significantly change due to the growth of vegetation in areas with dense vegetation, daily BRDF model parameters were calculated for AOD retrieval. The details of this LSR method are described below.

3.1.1. Method for Building Prior BRDF Database

In this study, the RTLS model is used to describe the directional reflectance of the land surface (i.e., the LSR). The model can be written as three terms:
ρ t   ( θ s ,   θ v ,   ϕ ,   λ )   =   f iso   ( λ )   +   f vol   ( λ )   K vol   ( θ s ,   θ v ,   ϕ )   +   f geo   ( λ )   K geo   ( θ s ,   θ v ,   ϕ ) =   f iso   ( λ )   [ 1 + f vol   ( λ ) f iso   ( λ ) K vol   ( θ s ,   θ v ,   ϕ )   + f geo     ( λ ) f iso   ( λ ) K geo   ( θ s ,   θ v ,   ϕ )   ]
where ρ t   ( θ s ,   θ v ,   ϕ ,   λ ) is the surface bidirectional reflectance; λ is the wavelength; f iso   ( λ ) , f vol   ( λ ) , and f geo   ( λ ) represent the weight of isotropic scattering, radiative transfer-type volumetric scattering, and geometric-optical surface scattering, respectively; and K vol is the Ross-thick kernel, which can be calculated by Equation (3):
  K vol   =   ( π 2     ξ ) cos ξ   +   sin ξ cos θ s   +   cos θ v     π 4
where ξ is the phase angle and can be written as:
cos ξ   =   cos θ s cos θ v   +   sin θ s sin θ v cos ϕ
K geo is the Li-sparse kernel, which can calculated by Equation (5):
K geo   =   O   ( θ s ,   θ v ,   ϕ )     sec θ s     sec θ v   +   1 2   ( 1   +   cos ξ )   sec θ s sec θ v
where
O   =   1 π   ( t     sin t   cos t )   ( sec θ s   +   sec θ v )
cos t   =   2 D 2   +   ( tan θ s tan θ v sin ϕ ) 2 sec θ s   +   sec θ v
D   =   tan 2 θ s   +   tan 2 θ v     2 tan θ s tan θ v cos ϕ
Notably, f iso   ( λ ) , f vol   ( λ ) , and f geo   ( λ ) vary with time, but f vol   ( λ ) f iso   ( λ ) and f geo   ( λ ) f iso   ( λ ) change slowly, especially among the same period of years [32,46]. In addition, the BRDF shape (in the square bracket of Equation (2)) is related to the structure of the surface, while the reflectance magnitude ( f iso   ( λ ) ) is determined by the microphysical properties of surface elements. Thus, in this study, we assumed that the BRDF shape and the reflectance magnitude remains unchanged among one month in areas with non-dense vegetation (i.e., urban areas and areas with sparse vegetation). The BRDF model parameters from the MODIS product, after a spectral transformation, can be used in these areas. In order to eliminate the possible outliers, the minimum standard deviation method was used to determine f vol   ( λ ) f iso   ( λ ) and f geo   ( λ ) f iso   ( λ ) of the BRDF based on 2 years of MCD19A3 data. The monthly average of f iso   ( λ ) was used to present the monthly change in isotropic scattering. The minimum standard deviation method used in this study was operated as follows: (1) There were about 8 images (namely, 8 values for a pixel) for every month, and every set of 4 values was combined as a group after the invalid values were removed. (2) The combination with minimum standard deviation was selected and the mean value in the selected combination was used to determine the final value of each pixel.

3.1.2. Spectral Transformation

The spectral response functions and wavelengths used between the MODIS and AHI are different, which causes different LSR values to be found for the same band at the same pixel between the instruments. Therefore, spectral transformation was conducted. With the assumption that the LSR between the AHI and MODIS is linear, the LSR of the AHI can be expressed as follows:
ρ λ AHI   =   A   +   B   *   ρ λ MODIS
where ρ λ AHI and ρ λ MODIS are the actual LSR of a target at wavelength λ for the AHI and MODIS, respectively. The actual LSR can be calculated by Equation (10):
ρ i = λ 1 λ 2 S ( λ ) Γ ( λ ) d λ λ 1 λ 2 Γ ( λ ) d λ
where ρ i is the LSR in band i; Γ is the spectral response function; and S ( λ ) is the spectral curve. Spectral curves of 60 different features were collected from the ENVI spectral library. For both the AHI and MODIS, LSR values at the blue band were calculated. The LSRs for the AHI and MODIS were very close (Figure 2) and the spectral convention model was then developed as follows:
ρ λ AHI   =   0.0018   +   1.0057 ρ λ MODIS

3.1.3. Method of Daily BRDF Model Parameters Determination

Since LSR may significantly vary in regions with dense vegetation, using the monthly BRDF database will result in inaccurate AOD retrieval. Figure 3 shows the relationship between AOD and TOA reflectance in the blue band under different reflectance magnitudes. It indicates that a 0.02 error in the reflectance magnitude will lead to an error of ~0.10 in AOD retrieval when the AOD and reflectance magnitude are relatively low. The error will increase with the increase of the reflectance magnitude and decrease with the increase of AOD. Therefore, it is important to determine the BRDF parameters in a daily scale in areas with dense vegetation. The change of the LSR under the same observation conditions is mainly caused by the change of the microphysical properties of surface elements [32]. Thus, the BRDF shape from MODIS products can be used and the reflectance magnitude can be solved according to Equation (2) once the LSR is determined. Therefore, the key factor in determining the BRDF model parameters is to calculate the LSR in real time with acceptable accuracy. The BRDF model parameters will be used in the 6SV code to build the lookup tables (LUTs) for AOD retrieval. The DT algorithm demonstrates that there is an empirical relationship between the visible and near-infrared bands over regions with dense vegetation and that the LSR in blue band can be calculated based on AHI measurements. However, using the MODIS DT algorithm for AHI AOD retrieval will induce overestimation [27]. Recently, Wang developed optimal reflectance relationships between visible and SWIR bands with three NDVI classifications, illustrating improvement of the accuracy of AHI AOD retrieval [30]. Thus, we used the model built by Wang for areas with dense vegetation (NDVI > 0.33) to calculate the LSR in this study. Firstly, the LSR in the blue band was calculated based on the SWIR band reflectance for dense vegetation pixels. Secondly, the f iso   ( λ ) was calculated according to Equation (2). Finally, the second lowest value of f iso   ( λ ) during a day was selected as the daily value to remove the influence of possible aerosols/clouds on the calculation results.

3.2. Aerosol Model

The aerosol model is another key parameter for AOD retrieval. An unsuitable assumption for the aerosol model will increase the uncertainty of AOD retrieval, potentially even leading to incorrect results. Continental aerosol model has been widely used to retrieve AOD in China [9,43,44]. However, the atmospheric conditions in Bohai Rim region are relatively complex, accompanied by heavy haze and dusty weather. The lookup table (LUT) built by the continental aerosol defined in the 6SV code can generate large errors in the retrieval of AOD at some periods in this area. In order to analyze the influence of the choice of aerosol model, the SSA, an important optical parameter of aerosols which reflects the scattering ability of aerosols, was set to different values to estimate the TOA reflectance with different AODs using the 6SV model. The relative errors of AOD retrieval with different values of the SSA are shown in Figure 4, in which the “true value” of the SSA was set as 0.93. It shows that the correct SSA information is important for AOD retrieval and that the retrieval errors increase with the increase of aerosol loading. In addition, when the SSA is underestimated, the error rises sharply. Thus, the observed SSA data from AERONET in Bohai Rim region during 2010–2018 were used to substitute the SSA (SSA of ~0.89 in the blue band) value of the continental aerosol model in the 6SV model to reduce the errors in the retrieval. In order to reflect the “dynamic” SSA (function of AOD), we separated all cases into two categories, either general (AOD < 0.8) or heavily polluted (AOD ≥ 0.8). The average SSA under the heavily polluted condition was calculated based on all the cases where the AOD was greater than or equal to 0.8. The average SSA under the general condition was calculated based on all the cases where the AOD was less than 0.8 but larger than 0.4 according to the recommendation from the AERONET team, since large SSA retrieval uncertainties may occur when the AOD is small. The two different average SSA values were used in the 6SV model for different atmospheric conditions (general or heavily polluted) for the construction of the LUTs. The results for the average SSA values in different bands are shown in Table 2.

3.3. Validation

For convenience, the AOD retrieved by the new method is denoted as AOD-new in this paper. The AERONET AOD measurements and the JAXA AOD product were used for validation and comparison purposes, and the MXD04 AOD products were used for intercomparison. The AHI AODs were averaged within a 3 × 3 pixel grid centered around each AERONET site. The AERONET AODs with a time difference between the AHI AODs less than 15 min were averaged and interpolated to 550 nm to match the retrieved AOD wavelength [10]. Since the JAXA AODs were retrieved at the wavelength of 500 nm, the AERONET data during 2015–2017 were used to build a spectral transformation model. The result (Figure 5) shows that the simple linear transformation model performs well.
AOD 550   =   0.883 AOD 500   +   0.002
To comprehensively and accurately evaluate the AOD retrievals, various statistical indicators were adopted to evaluate the accuracy and uncertainty, including the correlation coefficient (R), root mean square error (RMSE), mean absolute error (MAE), mean relative error (MRE), and relative mean bias (RMB) [47,48].

4. Results

4.1. Validation against AERONET AOD

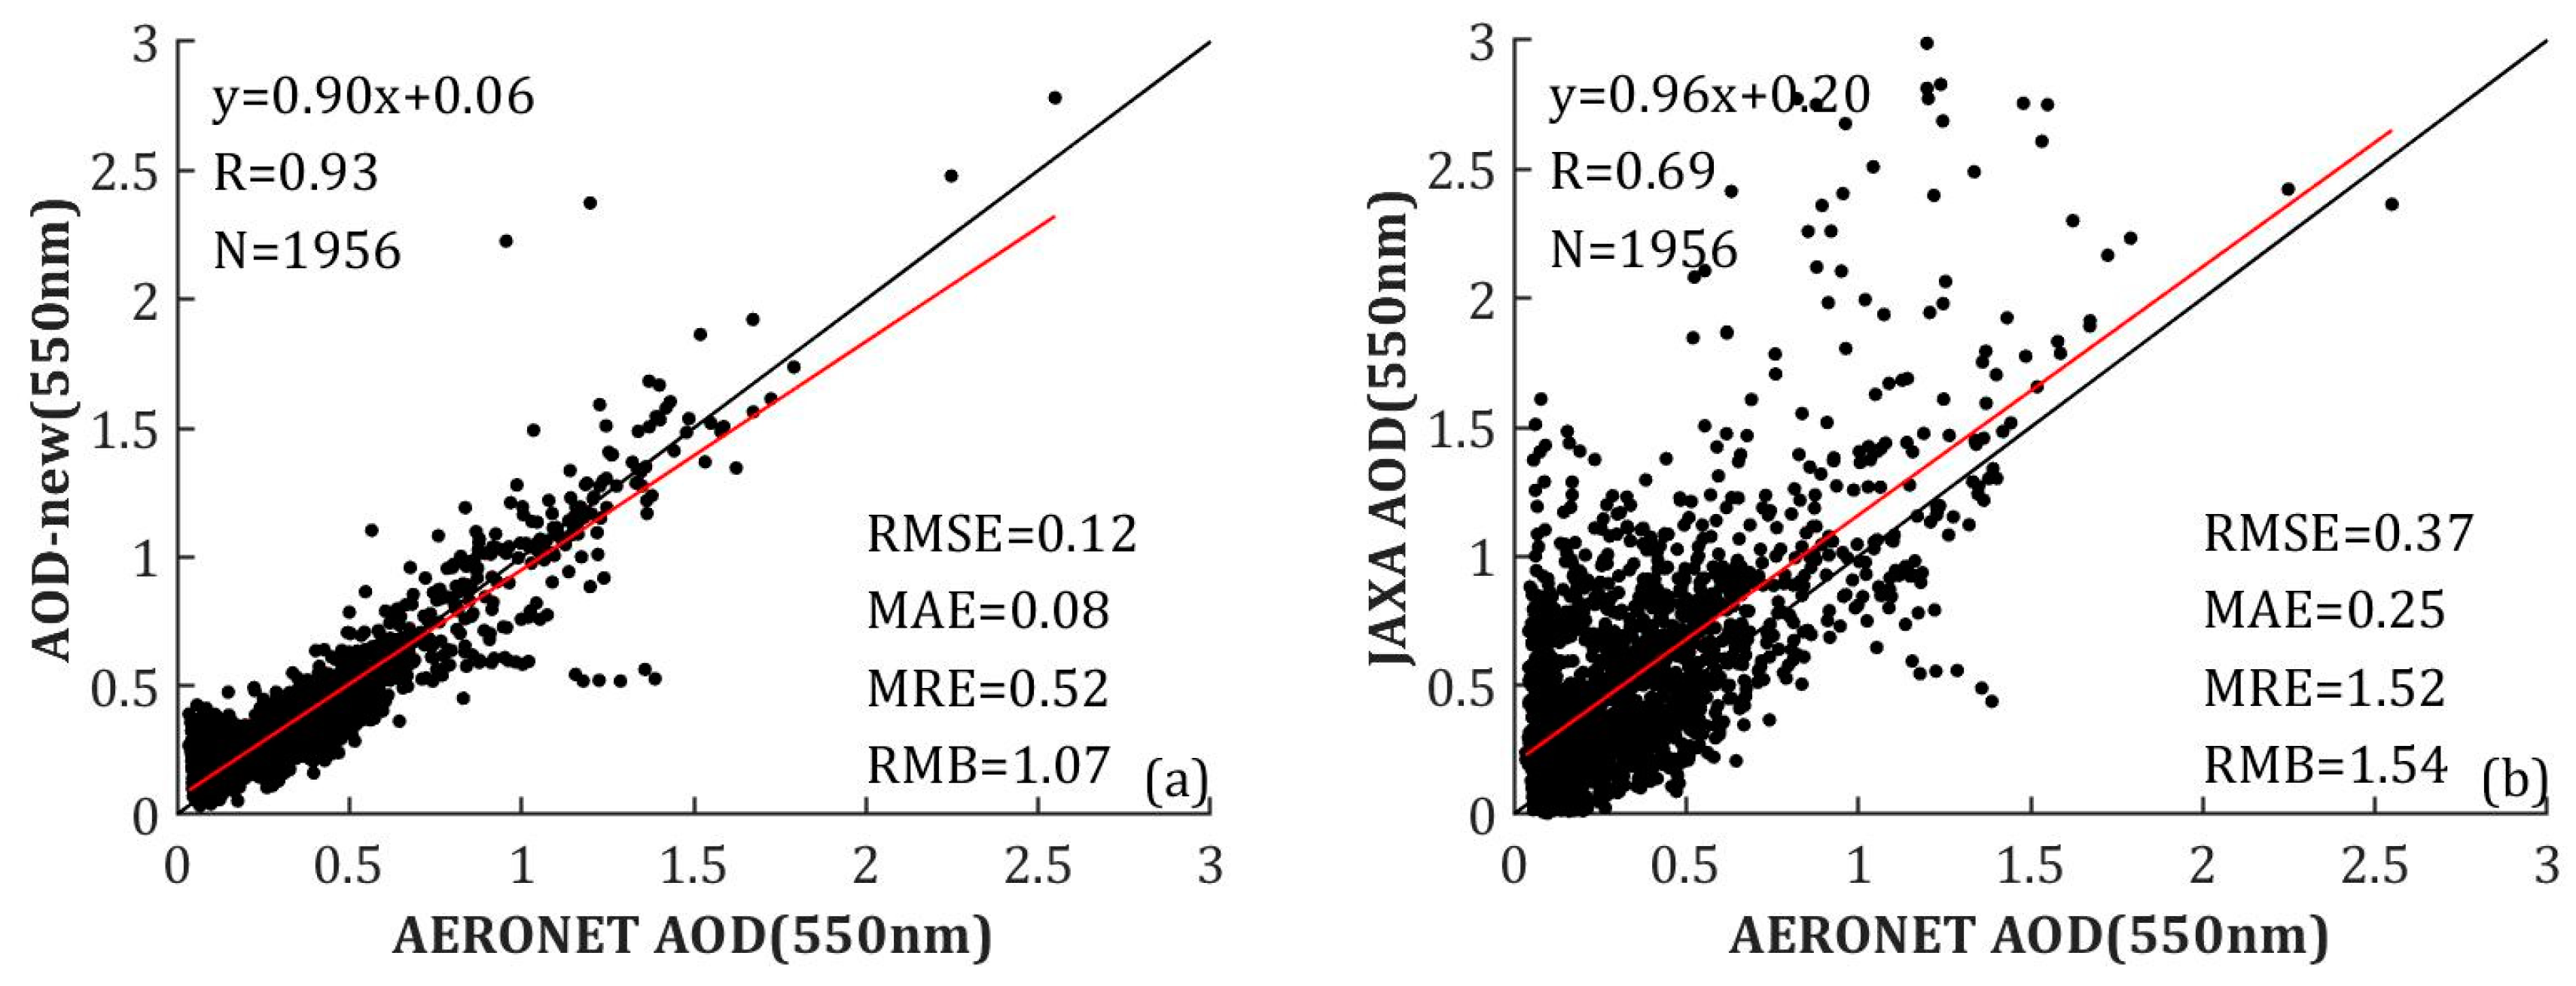
4.1.1. Overall Validation

Firstly, the AOD values retrieved by the new algorithm were compared against the AERONET AOD measurements using all 1956 matched samples at three sites during 2018. The correlations between the satellite-retrieved AODs (AOD-new and JAXA AOD) and AERONET AODs are shown in Figure 6a,b, respectively. Compared with the JAXA AODs, the new AODs are more in line with the AERONET AODs, with more matched samples distributed around the 1:1 line of the AERONET AODs. The correlation coefficient between the AOD-new and AERONET AODs is 0.93, while it is 0.69 between the JAXA AODs and AERONET AODs. The RMSE, MAE, and MRE of the AOD-new are 0.12, 0.08, and 0.52, representing reductions of 67.57%, 68.00%, and 65.79%, respectively, compared to the results of JAXA AODs. The RMB values of the AOD-new and JAXA AODs are 1.07 and 1.54, respectively, which shows an obvious overestimation of JAXA AODs.
The bias between the satellite-retrieved AODs (AOD-new and JAXA AOD) versus AERONET AODs, varying with the AOD, is shown in Figure 7, in which all matchup samples have been divided into 10 bins with 200 samples in each bin (156 samples in the 10th bin). As shown in the Figure 7a, the bias of the AOD-new decreases with increase of the AERONET AOD when the AERONET AOD is smaller than 0.5. Figure 7b shows the bias between the JAXA AOD versus the AERONET AOD. Large biases and uncertainties are found at all aerosol loadings situation. Both the AOD-new and JAXA AODs show overestimation when the atmosphere is clean, but the bias of AOD-new is much smaller than that of JAXA AOD. Figure 7c,d is the same as Figure 7a,b, but varying with satellite-retrieved AODs. Figure 7c shows that the bias of AOD-new does not significantly vary with the increase of the AHI AOD and that there is slight overestimation over the area with high retrieved value. Compared with the bias of AOD-new, the bias of JAXA AOD, shown in Figure 7d, varies more dramatically, almost showing a linear increase trend with the increase of the JAXA AOD.

4.1.2. Validation at Different Sites

The performances of the AHI AOD products (AOD-new and JAXA AOD) were examined at three sites (Table 3). Beijing and Beijing-CAMS are typical urban sites, while Xianghe is a countryside site near croplands. The comparison results show high correlation between the AOD-new and AERONET AOD data at all the three sites, with R values of 0.91, 0.92, and 0.94 and RMSE values of 0.12, 0.12, and 0.12, respectively. However, the best agreement of the JAXA AOD to the AERONET AOD was found at the Beijing-CAMS site, with the R of 0.73 and the RMSE of 0.32. The new retrieval algorithm achieved more than 50% decrease for the RMSE, MAE, and MRE compared to the JAXA method. In addition, the JAXA AOD exhibits the worst performance at the Xianghe site, with the R of 0.66 and RMSE of 0.42. In summary, these results demonstrate that the new method performs well over both bright and dark surface sites when utilizing the Himawari-8 data.

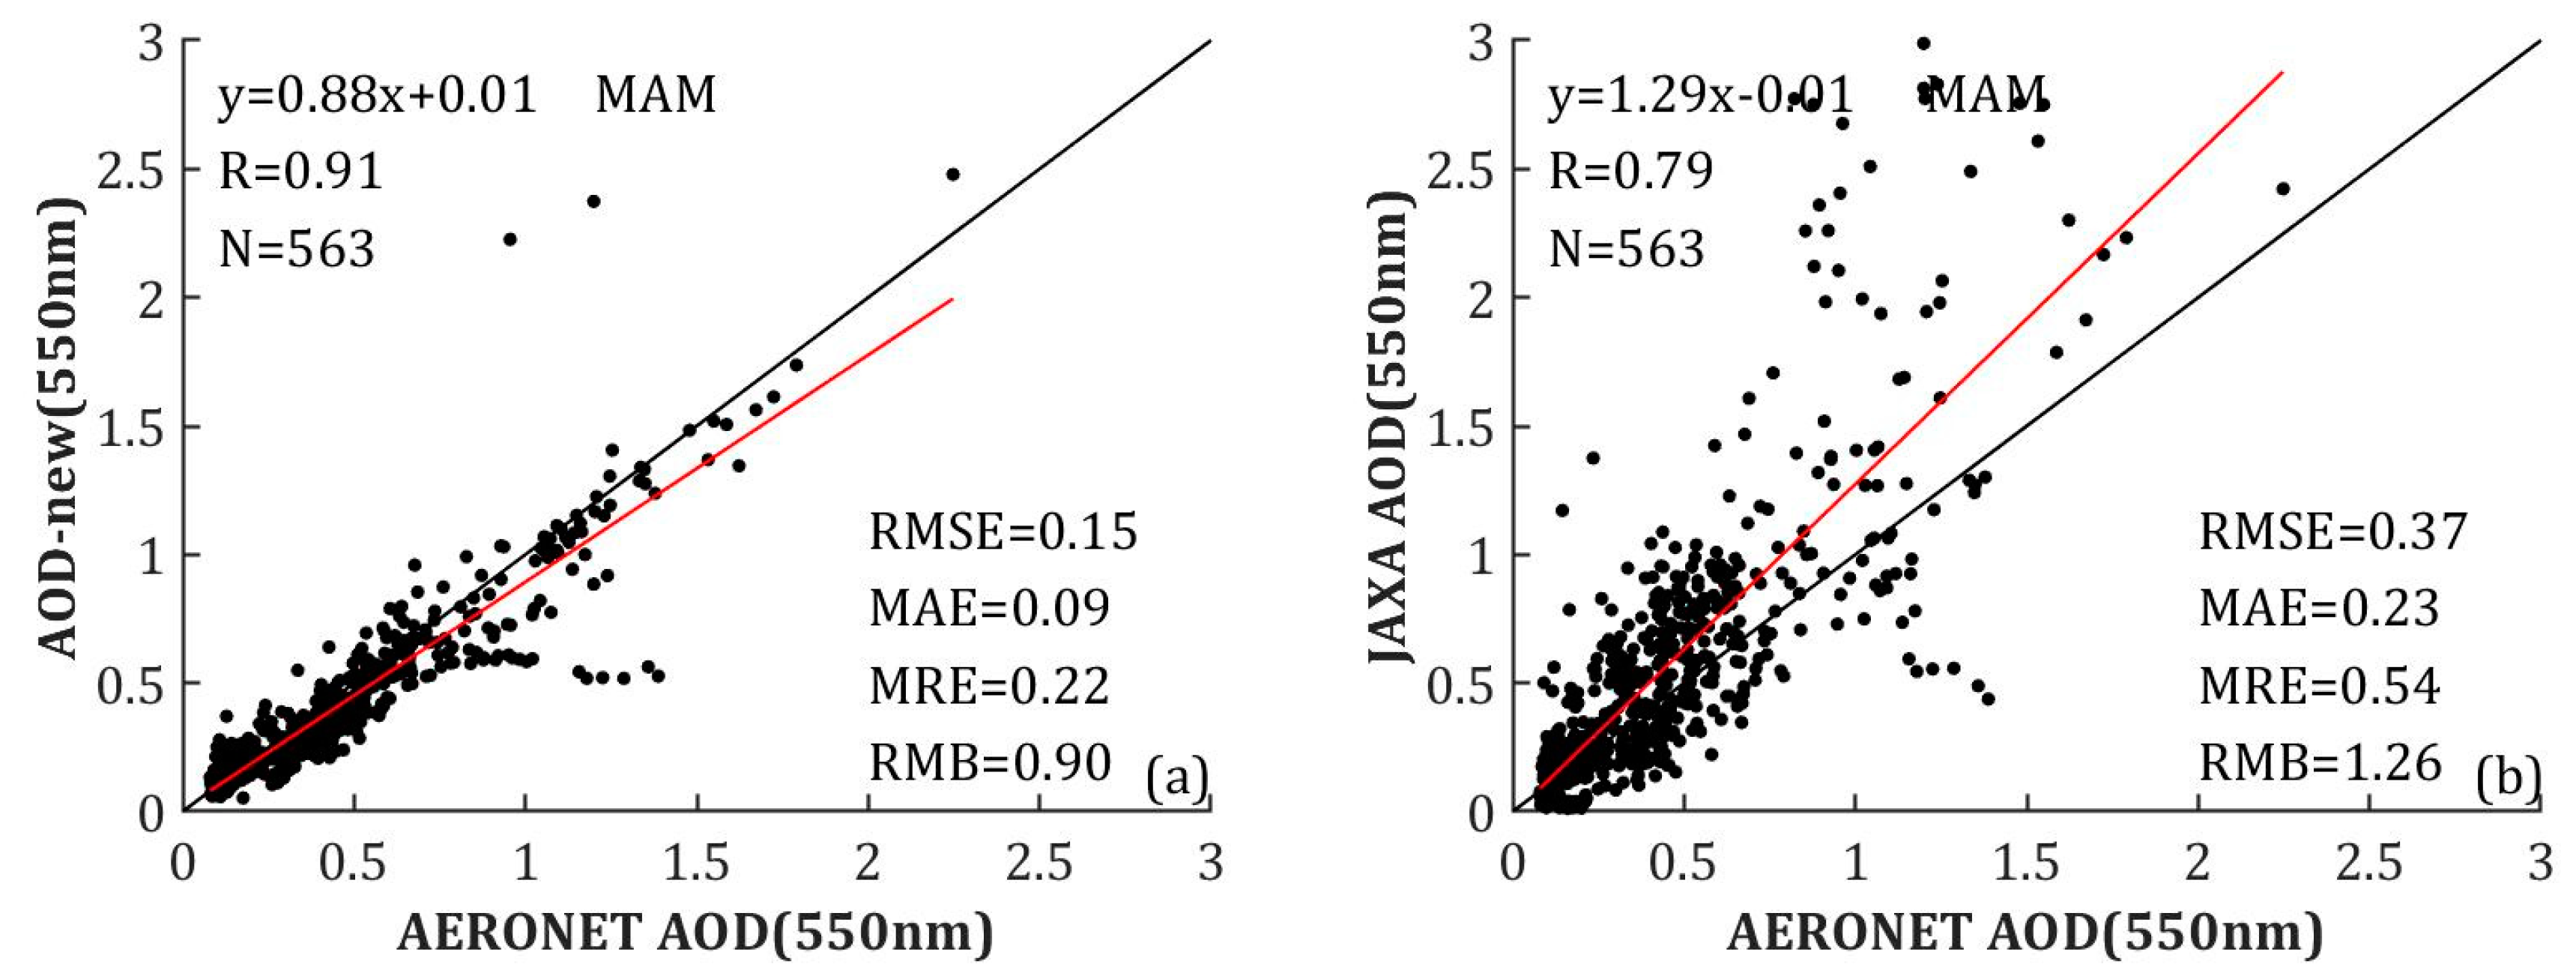
4.1.3. Validation in Different seasons

The performances of the AOD-new and JAXA AOD data in different seasons are shown in Figure 8. The correlation coefficients between the AOD-new (JAXA) and AERONET AOD data in spring, summer, autumn, and winter were 0.91 (0.79), 0.97 (0.90), 0.96 (0.78), and 0.86 (0.38), respectively. The new algorithm performs much better than the JAXA algorithm during all seasons. The RMSE, MAE, and MRE values for the new algorithm are smaller and the RMB values of AOD-new are closer to 1. It is noticed that there are some samples overestimation or underestimation largely in spring when aerosol loading is heavy. This indicates that the aerosol type changed significantly in this season. The JAXA AOD showed the best performance during summer, with the RMSE of 0.16 and MAE of 0.12, respectively. However, less agreement was found during autumn and winter. The RMSE, MAE, and RMB values in winter were 0.42, 0.30 and 2.08, respectively. These results demonstrate that the AHI AOD retrieved using the new algorithm feature considerable accuracy during each season, while the JAXA AOD performs poorly in autumn and winter.

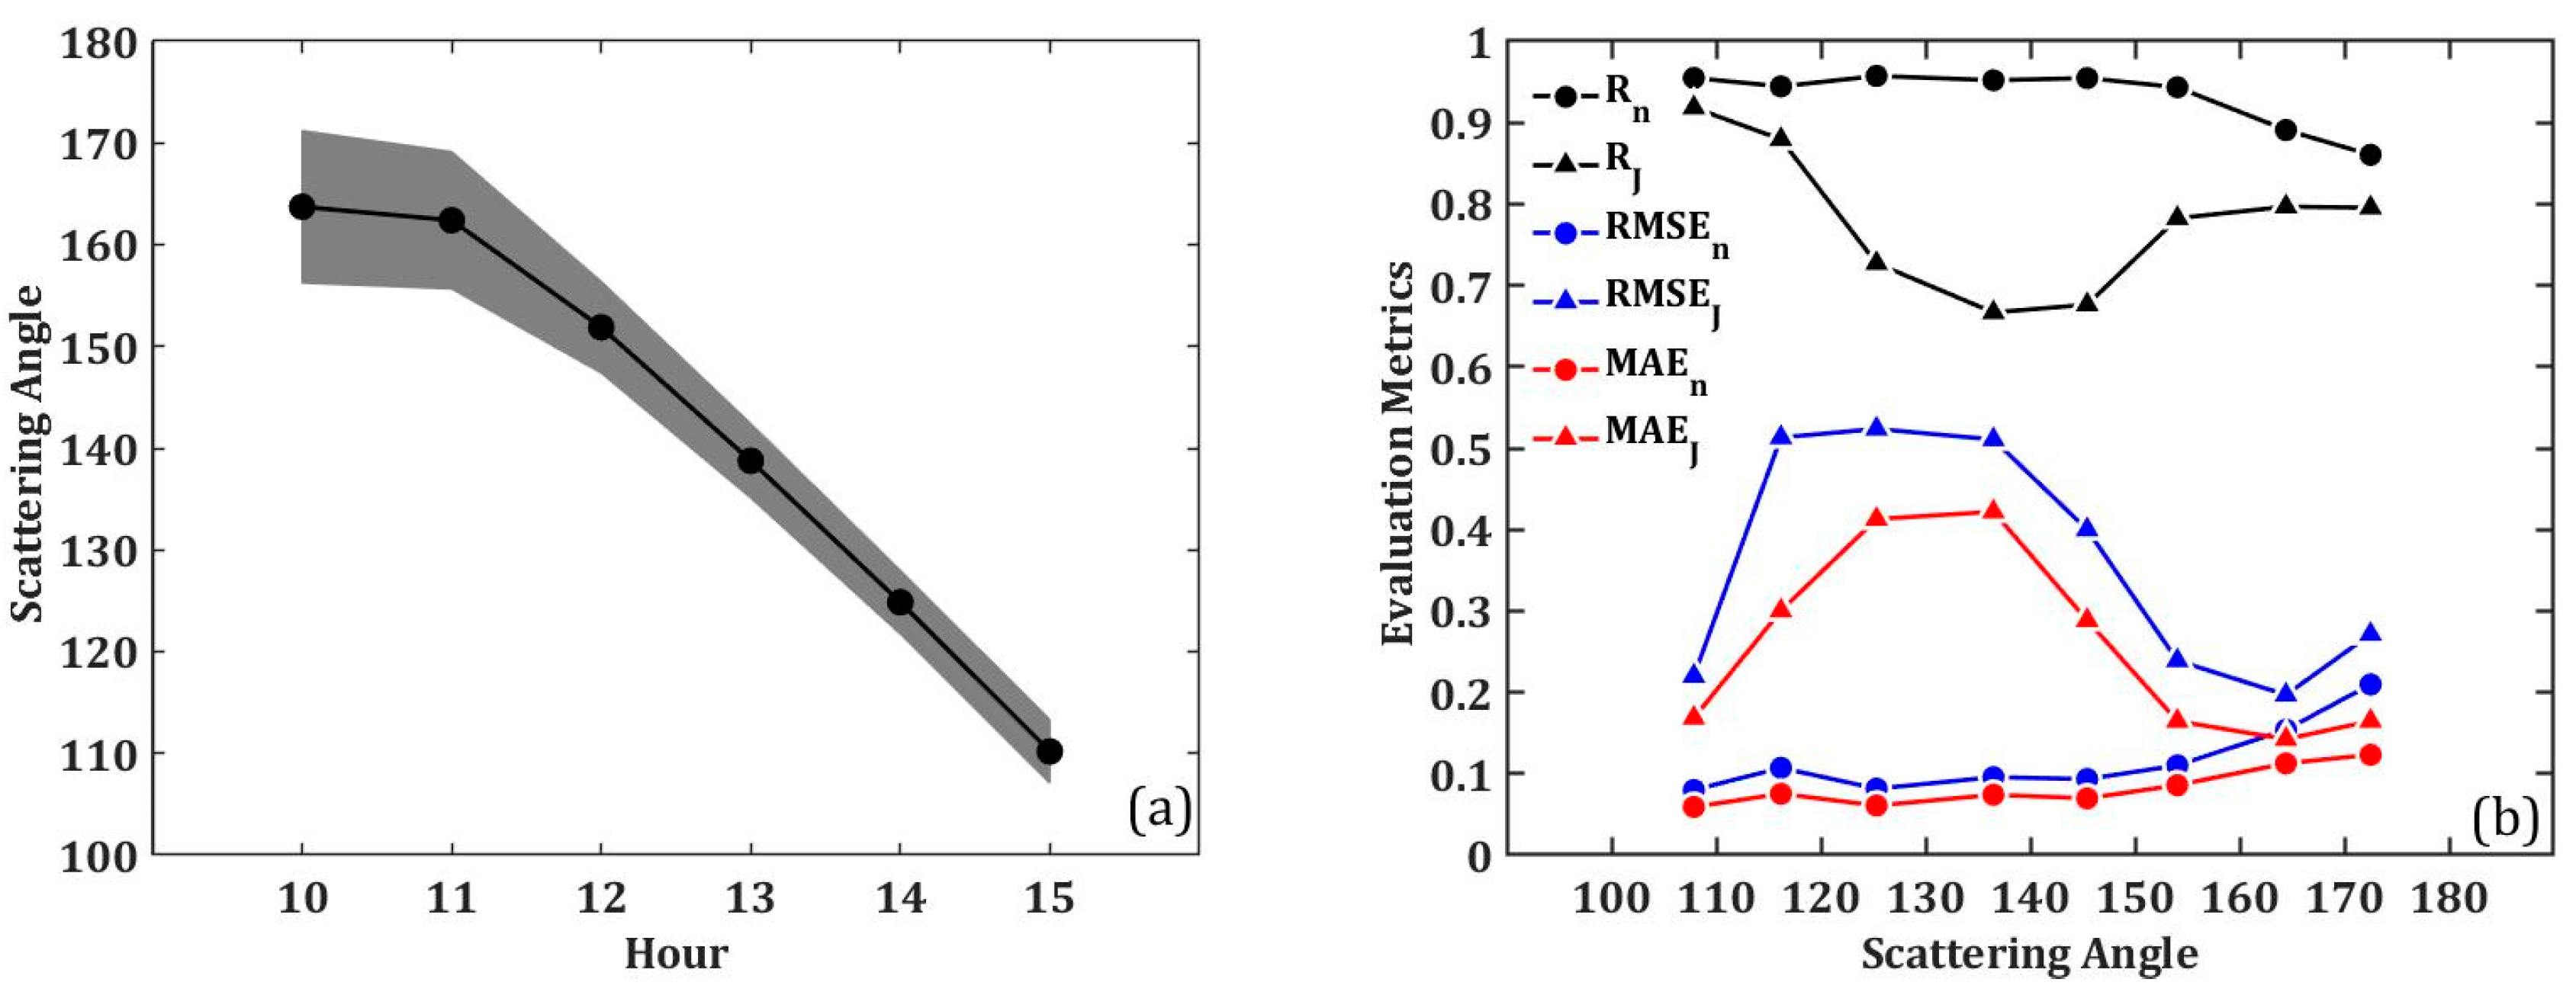
4.1.4. Validation at Different Times

Figure 9 shows the diurnal variation of AOD and the evaluation metrics, which were calculated using all matched samples at three sites during 2018. Figure 9a shows that AOD retrieved by the new method are close to AERONET measurements, with little overestimation or underestimation at different hours in a day. The aerosol loadings decrease from 10:00 (Beijing time) to 12:00, and there is an obviously increase from 14:00 to 15:00. Our AOD retrievals have the same time trend with the AERONET measurements, while the JAXA AOD product presents an opposite trend. In addition, there is an obvious bias between the JAXA and AERONET AOD data. According Figure 9b, the retrieval accuracy of our method is stable for different times. There are high correlations between the AOD-new and AERONET measurements, with R values varying from 0.91 (10:00) to 0.95 (14:00). The MAEs and RMSEs show a decreasing trend from 10:00 to 15:00. The evaluation metrics of the JAXA validation results show that the JAXA method performs worse during the afternoon. The difference in accuracy for the JAXA AOD product at different times is mainly caused by changes in the geometric angle, which can affect the direction reflectance. As shown in Figure 10a, the scattering angle decreases between 10:00 and 15:00. In addition, the evaluation metrics shown in Figure 10b demonstrate that neither method performs very well when the scattering angle is high; however, our results still show a clear advantage. These results suggest that the new method can better represent the LSR values at different angles. Therefore, the method can catch the diurnal variation of AOD well when compared to the JAXA method. The spatial distribution of the retrieved hourly AOD is shown in Figure A1 in Appendix A.

4.2. Intercomparison with MODIS Aerosol Products

Figure 11 shows the spatial distribution of AOD from different retrieval algorithms on 1 November 2018. The first column shows the AHI true color images. The second to last column are images of AOD from AOD-new, JAXA AOD and the MODIS DB AOD (MXD04) data, respectively. The spatial resolutions of the AOD-new, JAXA AOD, and MXD04 AOD data are 2, 5, and 10 km, respectively. Compared with the JAXA AOD, the available retrievals and spatial distribution of the AOD-new are closer to the MXD04 DB AOD. In contrast, the JAXA AOD shows a large amount of missing data due to the retrieval algorithm that is used. According to Yoshida’s work [25], land surface reflectance is estimated mainly by using the second lowest reflectance at 470 nm within a month, which may introduce noise that may cause retrieval failure. There are significant differences in the distribution between the JAXA AOD product and the other two data at 13:00. It is shown that the values of the JAXA AOD are much higher than both the AOD-new and MXD04 AOD. In addition, with a higher spatial resolution, the AOD-new can reflect more detailed information for AOD distributions.
Figure 12a,b show scatter plots of the AOD-new versus MXD04 AOD and JAXA AOD versus MXD04 AOD, respectively. The results from 548,283 matched samples show good agreement between the AOD-new and MXD04 AOD, with the R of 0.91. As seen in the Figure 12a, most of the samples are concentrated around the 1:1 line. The RMSE, MAE, and RMB values between the AOD-new and MXD04 AOD are 0.18, 0.12, and 0.96, respectively. From Figure 12b, the spatial distributions of the JAXA AODs and MXD AODs show many more differences, with the R of 0.60 and the RMSE of 0.53.

5. Discussion

The LSR and aerosol model are key parameters for AOD retrieval. In this study, a new method considering the effect of the surface BRDF and local aerosol type is presented. Compared to the methods under the Lambertian surface approximation (such as the DT method, minimum albedo/reflectance method, and some modified DT methods), the new method is more realistic because the anisotropic reflectance of the land surface is considered. Compared with studies that simultaneously retrieve the BRDF (or direction reflectance) and AOD, we calculated the BRDF model parameters independently before determining the AOD to reduce the computation burden. Instead of using the monthly BRDF database in all areas [33], daily BRDF model parameters were calculated according to short-wave infrared (SWIR) data and the RTLS model in areas with dense vegetation to solve the problem of surface reflectance changes due to the growth of vegetation. For aerosol model determination, we determined SSA values with the AOD according to the AERONET SSA at different AOD ranges in the study area. This is more suitable than selecting an aerosol model by changing the AOD and aerosol models to find the minimum errors between measurements and forward simulations of AHI bands. This is because the candidate aerosol models used as the final aerosol model may be unable to represent the real local aerosol type, which will lead to retrieval errors in practice.
The validation of AOD retrievals against AERONET AOD measurements, shown in Section 4, shows that the new method performs better than the JAXA algorithm (with R, RMSE, and MAE values of 0.93, 0.12, and 0.08, respectively, while the related metrics of the JAXA algorithm are 0.69, 0.37 and 0.25, respectively). In addition, it performs robustly with different sites, seasons, and times. However, increasing errors are shown when the scattering angle exceeds 160°. This is because the LSR is higher when scattering is backward, and according to the study of Sun et al. [44], errors of AOD retrieval caused by LSR errors will increase when the LSR increases. There are few ground sites in the study area and most of the regions cannot be validated. Thus, MODIS aerosol products have been used for intercomparison, and the results show good agreement between the AOD-new and MXD04 AOD.

6. Conclusions

A new AOD retrieval algorithm, using prior knowledge of the BRDF, has been proposed to improve Himawari-8 AOD retrieval in this study. To reduce the effect of surface anisotropy on AOD retrieval, a BRDF parameter database was built using a minimum standard deviation synthesis method based on historical MCD19A3 data. A daily BRDF model parameter determination method was developed for areas with dense vegetation. Meanwhile, the continental aerosol model defined in the 6SV code was modified by the AERONET SSA parameters to obtain more accurate LUTs. Based on the new method, AOD were retrieved from Himawari-8 images with a spatial resolution of 2 km.
The validation results suggest that the AOD values retrieved by new method have good agreement with the AERONET AOD measurements, with an overall correlation coefficient of 0.93. The accuracy at each ground site is high, no matter whether the site is at bright or dark surface. The validation results also show that the new method performs well during all seasons and that the accuracy is not sensitive to time during the day. Through intercomparison with two other aerosol products, we have found that the retrieved AOD data provide a wider spatial coverage and can reflect more detailed information than the JAXA AOD product. The new AOD retrieval has high correlation with the MODIS AOD product. These results demonstrate that MODIS BRDF products can be used for AHI AOD retrieval, even when there are differences in the observation angles between two sensors. In addition, accurate AOD retrieval can improve PM2.5 (particulate matter with an aerodynamic diameter < 2.5 μm) estimation, air quality forecasting models, and, additionally, diurnal aerosol variation studies. However, there are still some challenges in the retrieval, especially when the scattering angle approaches 180 degrees.

Author Contributions

Conceptualization, Q.W. and S.L.; methodology, Q.W. and L.S.; software, J.Y.; validation, Q.W. and H.L.; formal analysis, Q.W.; data curation, Q.W. and H.L.; writing—original draft preparation, Q.W.; writing—review and editing, S.L. and Q.Z. All authors have read and agreed to the published version of the manuscript.

Funding

This research was funded by The Foundation for Innovative Research Groups of the Hubei Natural Science Foundation, grant number 2020CFA003 and the National Natural Science Foundation of China, grant number 41975022.

Acknowledgments

The authors are grateful to the NASA (http://ladsweb.nascom.nasa.gov/), AERONET (http://aeronet.gsfc.nasa.gov/), JAXA P-Tree system (ftp.ptree.jaxa.jp) for the provision of in situ measurement data and satellite data utilized in this study.

Conflicts of Interest

The authors declare no conflict of interest.

Appendix A

Figure A1. Hourly AOD distribution during 2018 over Bohai Rim region, China.
Remotesensing 12 03425 g0a1

References

  1. Kaufman, Y.J.; Tanré, D.; Remer, L.A.; Vermote, E.F.; Chu, A.; Holben, B.N. Operational remote sensing of tropospheric aerosol over land from EOS moderate resolution imaging spectroradiometer. J. Geophys. Res. Atmos. 1997, 102, 17051–17067. [Google Scholar] [CrossRef]
  2. Remer, L.A.; Kaufman, Y.J.; Tanré, D.; Mattoo, S.; Chu, D.A.; Martins, J.V.; Li, R.-R.; Ichoku, C.; Levy, R.C.; Kleidman, R.G.; et al. The MODIS aerosol algorithm, products, and validation. J. Atmos. Sci. 2005, 62, 947–973. [Google Scholar] [CrossRef] [Green Version]
  3. Van Donkelaar, A.; Martin, R.V.; Brauer, M.; Kahn, R.; Levy, R.; Verduzco, C.; Villeneuve, P.J. Global estimates of ambient fine particulate matter concentrations from satellite-based aerosol optical depth: Development and application. Environ. Health. Persp. 2010, 118, 847–855. [Google Scholar] [CrossRef] [Green Version]
  4. Xu, P.; Chen, Y.; Ye, X. Haze, air pollution, and health in China. Lancet 2013, 382, 2067. [Google Scholar] [CrossRef]
  5. Jerrett, M.; Turner, M.C.; Beckerman, B.S.; Pope III, C.A.; Van Donkelaar, A.; Martin, R.V.; Serre, M.; Crouse, D.; Gapstur, S.M.; Krewski, D. Comparing the Health Effects of Ambient Particulate Matter Estimated Using Ground-Based versus Remote Sensing Exposure Estimates. Environ. Health. Persp. 2017, 125, 552–559. [Google Scholar] [CrossRef] [PubMed]
  6. Zeng, Q.; Chen, L.; Zhu, H.; Wang, Z.; Wang, X.; Zhang, L.; Gu, T.; Zhu, G.; Zhang, Y. Satellite-Based Estimation of Hourly PM2.5 Concentrations Using a Vertical-Humidity Correction Method from Himawari-AOD in Hebei. Sensors 2018, 18, 3456. [Google Scholar] [CrossRef] [Green Version]
  7. Cheng, T.; Gu, X.; Xie, D.; Li, Z.; Yu, T.; Chen, H. Aerosol optical depth and fine-mode fraction retrieval over East Asia using multi-angular total and polarized remote sensing. Atmos. Meas. Tech. 2012, 5, 501–516. [Google Scholar] [CrossRef] [Green Version]
  8. Holben, B.; Vemote, E.; Kaufman, Y.J.; Tanré, D.; Kalb, V. Aerosol retrieval over land from AVHRR data—Application for atmospheric correction. IEEE Trans. Geosci. Remote Sens. 1992, 30, 212–222. [Google Scholar] [CrossRef]
  9. Wang, Y.; Chen, L.; Li, S.; Wang, X.; Yu, C.; Si, Y.; Zhang, Z. Interference of Heavy Aerosol Loading on the VIIRS Aerosol Optical Depth (AOD) Retrieval Algorithm. Remote Sens. 2017, 9, 397. [Google Scholar] [CrossRef] [Green Version]
  10. Wang, Q.; Sun, L.; Wei, J.; Yang, Y.; Li, R.; Liu, Q. Validation and Accuracy Analysis of Global MODIS Aerosol Products over Land. Atmosphere 2017, 8, 155. [Google Scholar] [CrossRef] [Green Version]
  11. Wei, J.; Li, Z.; Peng, Y.; Sun, L. MODIS Collection 6.1 aerosol optical depth products over land and ocean: Validation and comparison. Atmos. Environ. 2019, 201, 428–440. [Google Scholar] [CrossRef]
  12. Zhang, W.; Xu, H.; Zheng, F. Aerosol Optical Depth Retrieval over East Asia Using Himawari-8/AHI Data. Remote Sens. 2018, 10, 137. [Google Scholar] [CrossRef] [Green Version]
  13. King, M.D.; Kaufman, Y.D.; Tanré, D.; Nakajima, T. Remote sensing of tropospheric aerosol from space: Past, present and future. Bull. Amer. Meteor. Soc. 1999, 80, 2229–2260. [Google Scholar] [CrossRef] [Green Version]
  14. Hsu, N.C.; Tsay, S.C.; King, M.D.; Herman, J.R. Deep Blue Retrievals of Asian Aerosol Properties during ACE-Asia. IEEE Trans. Geosci. Remote Sens. 2006, 44, 3180–3195. [Google Scholar] [CrossRef]
  15. Lyapustin, A.; Wang, Y.; Laszlo, I.; Kahn, R.; Korkin, S.; Remer, L.; Levy, R.; Reid, J.S. Multiangle implementation of atmospheric correction (MAIAC): 2. Aerosol algorithm. J. Geophys. Res. Atmos. 2011, 116. [Google Scholar] [CrossRef]
  16. Levy, R.C.; Remer, L.A.; Mattoo, S.; Vermote, E.F.; Kaufman, Y.J. Second-generation operational algorithm: Retrieval of aerosol properties over land from inversion of Moderate Resolution Imaging Spectroradiometer spectral reflectance. J. Geophys. Res. Atmos. 2007, 112. [Google Scholar] [CrossRef] [Green Version]
  17. Levy, R.C.; Remer, L.A.; Kleidman, R.G.; Mattoo, S.; Ichoku, C.; Kahn, R.; Eck, T.F. Global evaluation of the Collection 5 MODIS dark-target aerosol products over land. Atmos. Chem. Phys. 2010, 10, 10399–10420. [Google Scholar] [CrossRef] [Green Version]
  18. Hsu, N.C.; Jeong, M.J.; Bettenhausen, C.; Sayer, A.M.; Hansell, R.; Seftor, C.S.; Huang, J.; Tsay, S.C. Enhanced Deep Blue aerosol retrieval algorithm: The second generation. J. Geophys. Res. Atmos. 2013, 118, 9296–9315. [Google Scholar] [CrossRef]
  19. Levy, R.C.; Mattoo, S.; Munchak, L.A.; Remer, L.A.; Sayer, A.M.; Patadia, F.; Hsu, N.C. The Collection 6 MODIS aerosol products over land and ocean. Atmos. Meas. Tech. 2013, 6, 2989–3034. [Google Scholar] [CrossRef] [Green Version]
  20. Bilal, M.; Nichol, J.E.; Bleiweiss, M.P.; Dubois, D. A Simplified high resolution MODIS Aerosol Retrieval Algorithm (SARA) for use over mixed surfaces. Remote Sens. Environ. 2013, 136, 135–145. [Google Scholar] [CrossRef]
  21. Lyapustin, A.; Wang, Y.; Korkin, S.; Huang, D. MODIS Collection 6 MAIAC Algorithm. Atmos. Meas. Tech. 2018, 11, 5741–5765. [Google Scholar] [CrossRef] [Green Version]
  22. Tian, X.; Liu, Q.; Song, Z.; Dou, B.; Li, X. Aerosol optical depth retrieval from landsat 8 oli images over urban areas supported by modis brdf/albedo data. IEEE Geosci. Remote Sens. Lett. 2018, 15, 976–980. [Google Scholar] [CrossRef]
  23. Omar, A.H.; Won, J.G.; Winker, D.M.; Yoon, S.C.; Dubovik, O.; Mccormick, M.P. Development of global aerosol models using cluster analysis of aerosol robotic network (aeronet) measurements. J. Geophys. Res. Atmos. 2005, 110. [Google Scholar] [CrossRef]
  24. Sayer, A.M.; Smirnov, A.; Hsu, N.C.; Holben, B.N. A pure marine aerosol model, for use in remote sensing applications. J. Geophys. Res. Atmos. 2012, 117. [Google Scholar] [CrossRef] [Green Version]
  25. Yoshida, M.; Kikuchi, M.; Nagao, T.M.; Murakami, H.; Nomaki, T.; Higurashi, A. Common retrieval of aerosol properties for imaging satellite sensors. J. Meteorol. Soc. Jpn. Ser. II 2018, 96B, 193–209. [Google Scholar] [CrossRef] [Green Version]
  26. Yan, X.; Li, Z.; Luo, N.; Shi, W.; Zhao, W.; Yang, X.; Jin, J. A minimum albedo aerosol retrieval method for the new-generation geostationary meteorological satellite Himawari-8. Atmos. Res. 2018, 207, 14–27. [Google Scholar] [CrossRef]
  27. Ge, B.; Li, Z.; Liu, L.; Yang, L.; Chen, X.; Hou, W.; Zhang, Y.; Li, D.; Li, L.; Qie, L. A dark target method for himawari-8/ahi aerosol retrieval: Application and validation. IEEE Trans. Geosci. Remote Sens. 2019, 57, 381–394. [Google Scholar] [CrossRef]
  28. Gupta, P.; Levy, R.C.; Mattoo, S.; Remer, L.A.; Holz, R.E.; Heidinger, A.K. Applying the Dark Target aerosol algorithm with Advanced Himawari Imager observations during the KORUS-AQ field campaign. Atmos. Meas. Tech. 2019, 12, 6557–6577. [Google Scholar] [CrossRef] [Green Version]
  29. Lim, H.; Choi, M.; Kim, J.; Kasai, Y.; Chan, P. AHI/Himawari-8 Yonsei Aerosol Retrieval (YAER): Algorithm, Validation and Merged Products. Remote Sens. 2018, 10, 699. [Google Scholar] [CrossRef] [Green Version]
  30. Wang, L.; Yu, C.; Cai, K.; Zheng, F.; Li, S. Retrieval of Aerosol Optical Depth from the Himawari-8 Advanced Himawari Imager data: Application over Beijing in the summer of 2016. Atmos. Environ. 2020, 241, 117788. [Google Scholar] [CrossRef]
  31. Zhang, Z.; Fan, M.; Wu, W.; Wang, Z.; Tao, M.; Wei, J.; Wang, Q. A simplified aerosol retrieval algorithm for Himawari-8 Advanced Himawari Imager over Beijing. Atmos. Environ. 2019, 199, 127–135. [Google Scholar] [CrossRef]
  32. Shi, S.; Cheng, T.; Gu, X.; Letu, H.; Wang, Y.; Wu, Y. Synergistic Retrieval of Multitemporal Aerosol Optical Depth Over North China Plain Using Geostationary Satellite Data of Himawari-8. J. Geophys. Res. Atmos. 2018, 123, 5525–5537. [Google Scholar] [CrossRef]
  33. She, L.; Xue, Y.; Yang, X.; Leys, J.; Guang, J.; Che, Y.; Fan, C.; Xie, Y.; Li, Y. Joint Retrieval of Aerosol Optical Depth and Surface Reflectance over Land Using Geostationary Satellite Data. IEEE Trans. Geosci. Remote Sens. 2019, 57, 1489–1501. [Google Scholar] [CrossRef]
  34. Bessho, K.; Date, K.; Hayashi, M.; Ikeda, A.; Imai, T.; Inoue, H.; Kumagai, Y.; Miyakawa, T.; Murata, H.; Ohno, T.; et al. An Introduction to Himawari-8/9-Japan’s New-Generation Geostationary Meteorological Satellites. J. Meteorol. Soc. Jpn. Ser. II 2016, 94, 151–183. [Google Scholar] [CrossRef] [Green Version]
  35. Kikuchi, M.; Murakami, H.; Suzuki, K.; Nagao, T.M.; Higurashi, A. Improved hourly estimates of aerosol optical thickness using spatiotemporal variability derived from himawari-8 geostationary satellite. IEEE Trans. Geosci. Remote Sens. 2018, 56, 3442–3455. [Google Scholar] [CrossRef]
  36. Tian, X.; Liu, Q.; Li, X.; Wei, J. Validation and Comparison of MODIS C6.1 and C6 Aerosol Products over Beijing, China. Remote Sens. 2018, 10, 2021. [Google Scholar] [CrossRef] [Green Version]
  37. Tao, M.; Chen, L.; Wang, Z.; Tao, J.; Che, H.; Wang, X.; Wang, Y. Comparison and evaluation of the MODIS Collection 6 aerosol data in China. J. Geophys. Res. Atmos. 2015, 120, 6992–7005. [Google Scholar] [CrossRef]
  38. Giles, D.M.; Sinyuk, A.; Sorokin, M.G.; Schafer, J.S.; Smirnov, A.; Slutsker, I.; Eck, T.F.; Holben, B.N.; Lewis, J.R.; Campbell, J.R.; et al. Advancements in the Aerosol Robotic Network (AERONET) Version3 database—Automated near-real-time quality control algorithm with improved cloud screening for Sun photometer aerosol optical depth (AOD) measurements. Atmos. Meas. Tech. 2019, 12, 169–209. [Google Scholar] [CrossRef] [Green Version]
  39. Tanre, D.; Herman, M.; Deschamps, P.Y. Influence of the atmosphere on space measurements of directional properties. Appl. Opt. 1983, 22, 733–741. [Google Scholar] [CrossRef]
  40. Vermote, E.; Tanré, D.; Deuzé, J.; Herman, M.; Morcrette, J.; Kotchenova, S. Second Simulation of a Satellite Signal in the Solar Spectrum-Vector (6SV). 6S User Guide 2006, 3, 1–55. [Google Scholar]
  41. Shi, S.; Cheng, T.; Gu, X.; Chen, H.; Guo, H.; Wang, Y.; Bao, F.; Xu, B.; Wang, W.; Zuo, X.; et al. Synergy of MODIS and AATSR for better retrieval of aerosol optical depth and land surface directional reflectance. Remote Sens. Environ. 2017, 195, 130–141. [Google Scholar] [CrossRef]
  42. Shao, Z.; Pan, Y.; Diao, C.; Cai, J. Cloud Detection in Remote Sensing Images Based on Multiscale Features-Convolutional Neural Network. IEEE Trans. Geosci. Remote Sens. 2019, 57, 4062–4076. [Google Scholar] [CrossRef]
  43. Yang, F.; Wang, Y.; Tao, J.; Wang, Z.; Fan, M.; De Leeuw, G.; Chen, L. Preliminary Investigation of a New AHI Aerosol Optical Depth (AOD) Retrieval Algorithm and Evaluation with Multiple Source AOD Measurements in China. Remote Sens. 2018, 10, 748. [Google Scholar] [CrossRef] [Green Version]
  44. Sun, L.; Sun, C.; Liu, Q.; Zhong, B. Aerosol optical depth retrieval by HJ-1/CCD supported by MODIS surface reflectance data. Sci. China. Earth Sci. 2011, 53, 74–80. [Google Scholar] [CrossRef]
  45. Wei, J.; Li, Z.; Peng, Y.; Sun, L.; Yan, X. A Regionally Robust High-Spatial-Resolution Aerosol Retrieval Algorithm for MODIS Images over Eastern China. IEEE Trans. Geosci. Remote Sens. 2019, 57, 4748–4757. [Google Scholar] [CrossRef]
  46. Vermote, E.; Justice, C.O.; Breon, F.M. Towards a Generalized Approach for Correction of the BRDF Effect in MODIS Directional Reflectances. IEEE Trans. Geosci. Remote Sens. 2009, 47, 898–908. [Google Scholar] [CrossRef]
  47. Wang, Q.; Zeng, Q.; Tao, J.; Sun, L.; Zhang, L.; Gu, T.; Wang, Z.; Chen, L. Estimating PM2.5 Concentrations Based on MODIS AOD and NAQPMS Data over Beijing-Tianjin-Hebei. Sensors 2019, 19, 1207. [Google Scholar] [CrossRef] [Green Version]
  48. Wei, J.; Sun, L. Comparison and Evaluation of Different MODIS Aerosol Optical Depth Products Over the Beijing-Tianjin-Hebei Region in China. IEEE J. Sel. Topics Appl. Earth Observ. Remote Sens. 2017, 10, 835–844. [Google Scholar] [CrossRef]
Figure 1. Study region.
Remotesensing 12 03425 g001
Figure 2. Scatterplot of different surface features.
Remotesensing 12 03425 g002
Figure 3. Relationship between aerosol optical depth (AOD) and top-of-atmosphere (TOA) reflectance in the blue band under different reflectance magnitudes.
Remotesensing 12 03425 g003
Figure 4. Sensitivity study on the single scattering albedo (SSA) ( θ s   = 30°, θ v   = 30, ϕ   = 30).
Remotesensing 12 03425 g004
Figure 5. Spectral transformation model of the AOD. The black and red solid lines are the 1:1 line and regression line, respectively.
Remotesensing 12 03425 g005
Figure 6. Scatter plots of AOD-new versus AERONET AODs (a) and JAXA AODs versus AERONET AODs (b). The black and red solid lines are the 1:1 line and regression line, respectively.
Remotesensing 12 03425 g006
Figure 7. Bias between satellite-retrieved and AERONET AOD, plotted against (a,b) AERONET AOD; (c) AOD-new; (d) JAXA AOD. (red line and vertical gray line represent the mean value and 1 standard deviation of each AOD bin, respectively).
Remotesensing 12 03425 g007
Figure 8. The scatter plots of AOD validation in different seasons: (a,b) Spring; (c,d) summer; (e,f) autumn; (g,h) winter. Left: AOD-new; right: JAXA AOD.
Remotesensing 12 03425 g008aRemotesensing 12 03425 g008b
Figure 9. Diurnal variation of (a) AOD (550 nm) and (b) evaluation metrics. The subscript characters “n” and “J” denote the results for AOD-new and JAXA AOD, respectively.
Remotesensing 12 03425 g009
Figure 10. (a) Diurnal variation of the scattering angle and (b) evaluation metric variation with the scattering angle.
Remotesensing 12 03425 g010
Figure 11. AOD retrieval results for our method compared with the JAXA level 2 AOD product and MODIS version 6.1 deep blue AOD product over Bohai Rim region, China, on the 1st November in 2018.
Remotesensing 12 03425 g011
Figure 12. Intercomparison of AHI AOD and MODIS DB products. ((a): AOD-new; (b): JAXA AOD). The colored bar represents the density distribution of the MODIS-AHI AOD pairs.
Remotesensing 12 03425 g012
Table 1. Information about Himawari-8 Advanced Himawari Imager (AHI) bands.
Band (Central Wavelength/μm)Resolution (km)
Visible1, 2 (0.47, 0.51)
3 (0.64)
1
0.5
Near-infrared4, 5 (0.86, 1.6)
6 (2.3)
1
2
Infrared7–16 (3.9, 6.2, 6.9, 7.3, 8.6, 9.6, 10.4, 11.2, 12.4, 13.3)2
Table 2. Average SSA values during approximately 2010–2018.
Wavelength440 nm675 nm870 nm1020 nm
General 0.921 ± 0.0310.940 ± 0.0220.934 ± 0.0260.930 ± 0.029
Heavily polluted 0.944 ± 0.0270.959 ± 0.0180.954 ± 0.0220.950 ± 0.025
Table 3. Analysis of AHI AOD and ground AOD at different ground sites.
AERONET SitesAOD ProductsSample SizeRRMSEMAEMRERMB
BeijingAOD-new5150.910.120.090.581.05
JAXA AOD0.660.350.251.581.59
Beijing-CAMSAOD-new8000.920.120.100.711.17
JAXA AOD0.730.320.241.551.59
XiangheAOD-new6410.940.120.070.240.99
JAXA AOD0.660.420.271.451.46
Publisher’s Note: MDPI stays neutral with regard to jurisdictional claims in published maps and institutional affiliations.

