The Importance of High Resolution Digital Elevation Models for Improved Hydrological Simulations of a Mediterranean Forested Catchment


Abstract
1. Introduction
2. Material and Methods
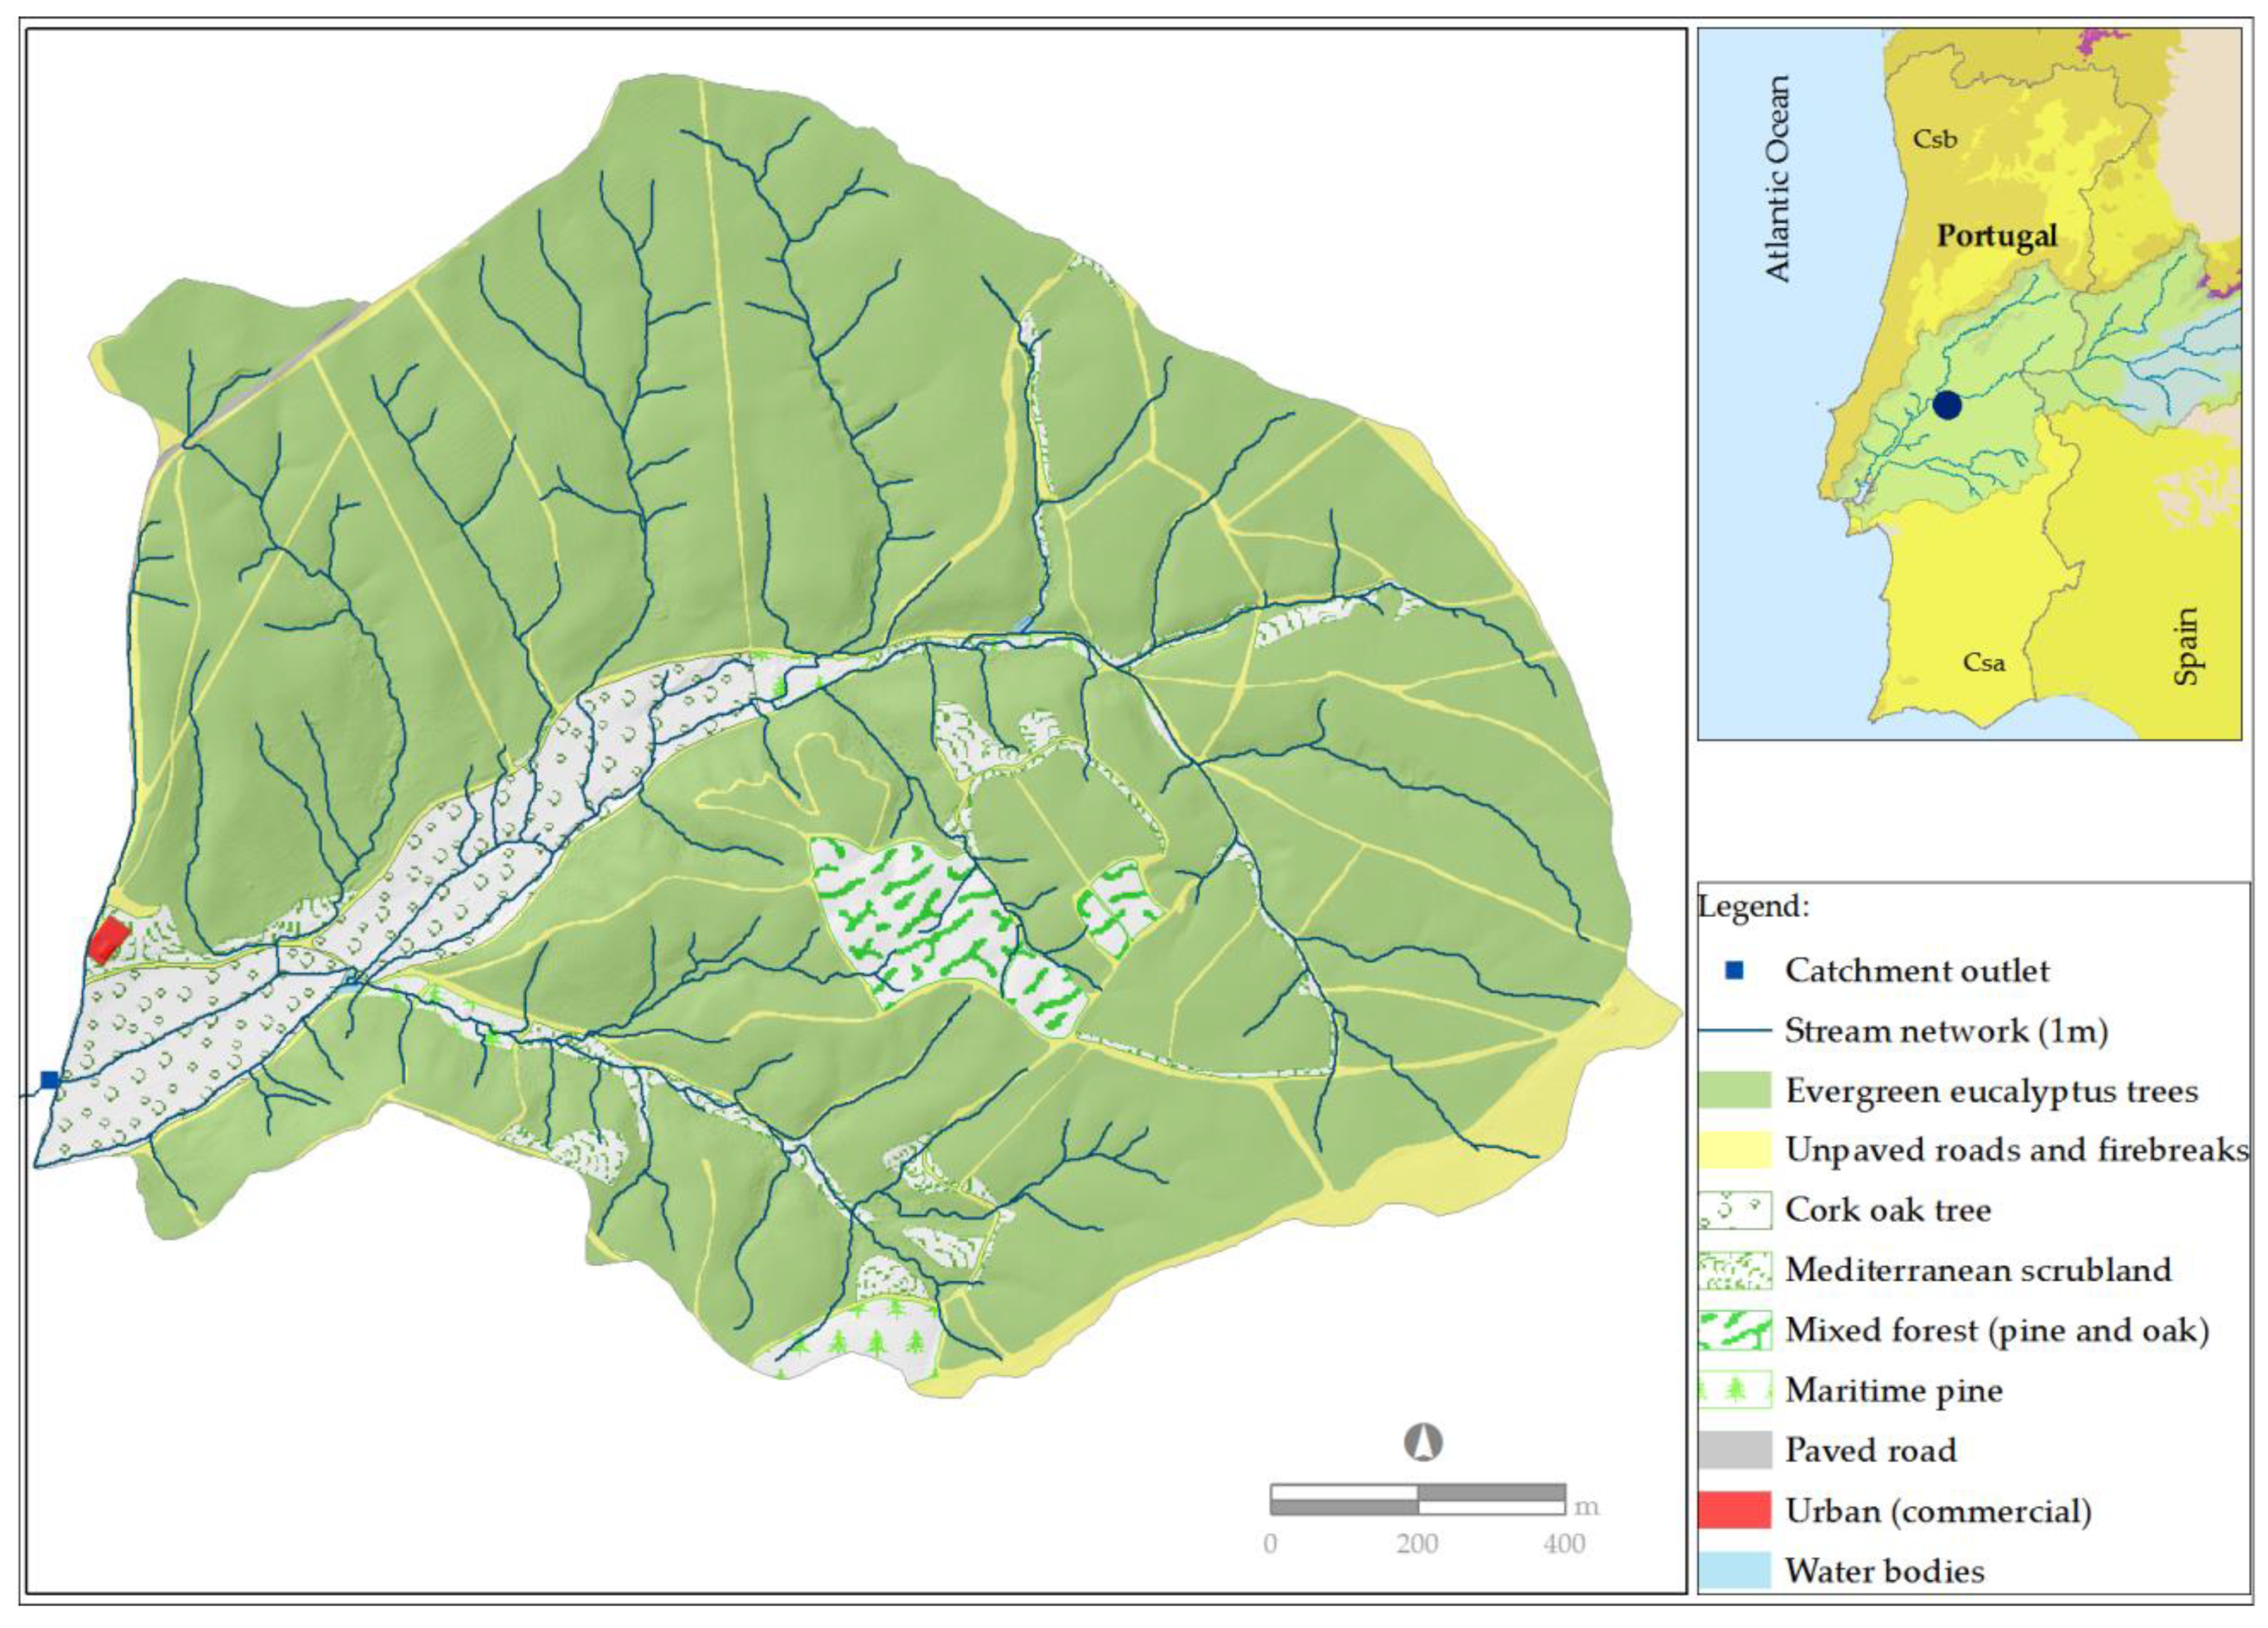
2.1. The Study Area
2.2. DEM Input Data
2.3. SWAT Modeling Approach and Calibration Routines
3. Results and Discussion
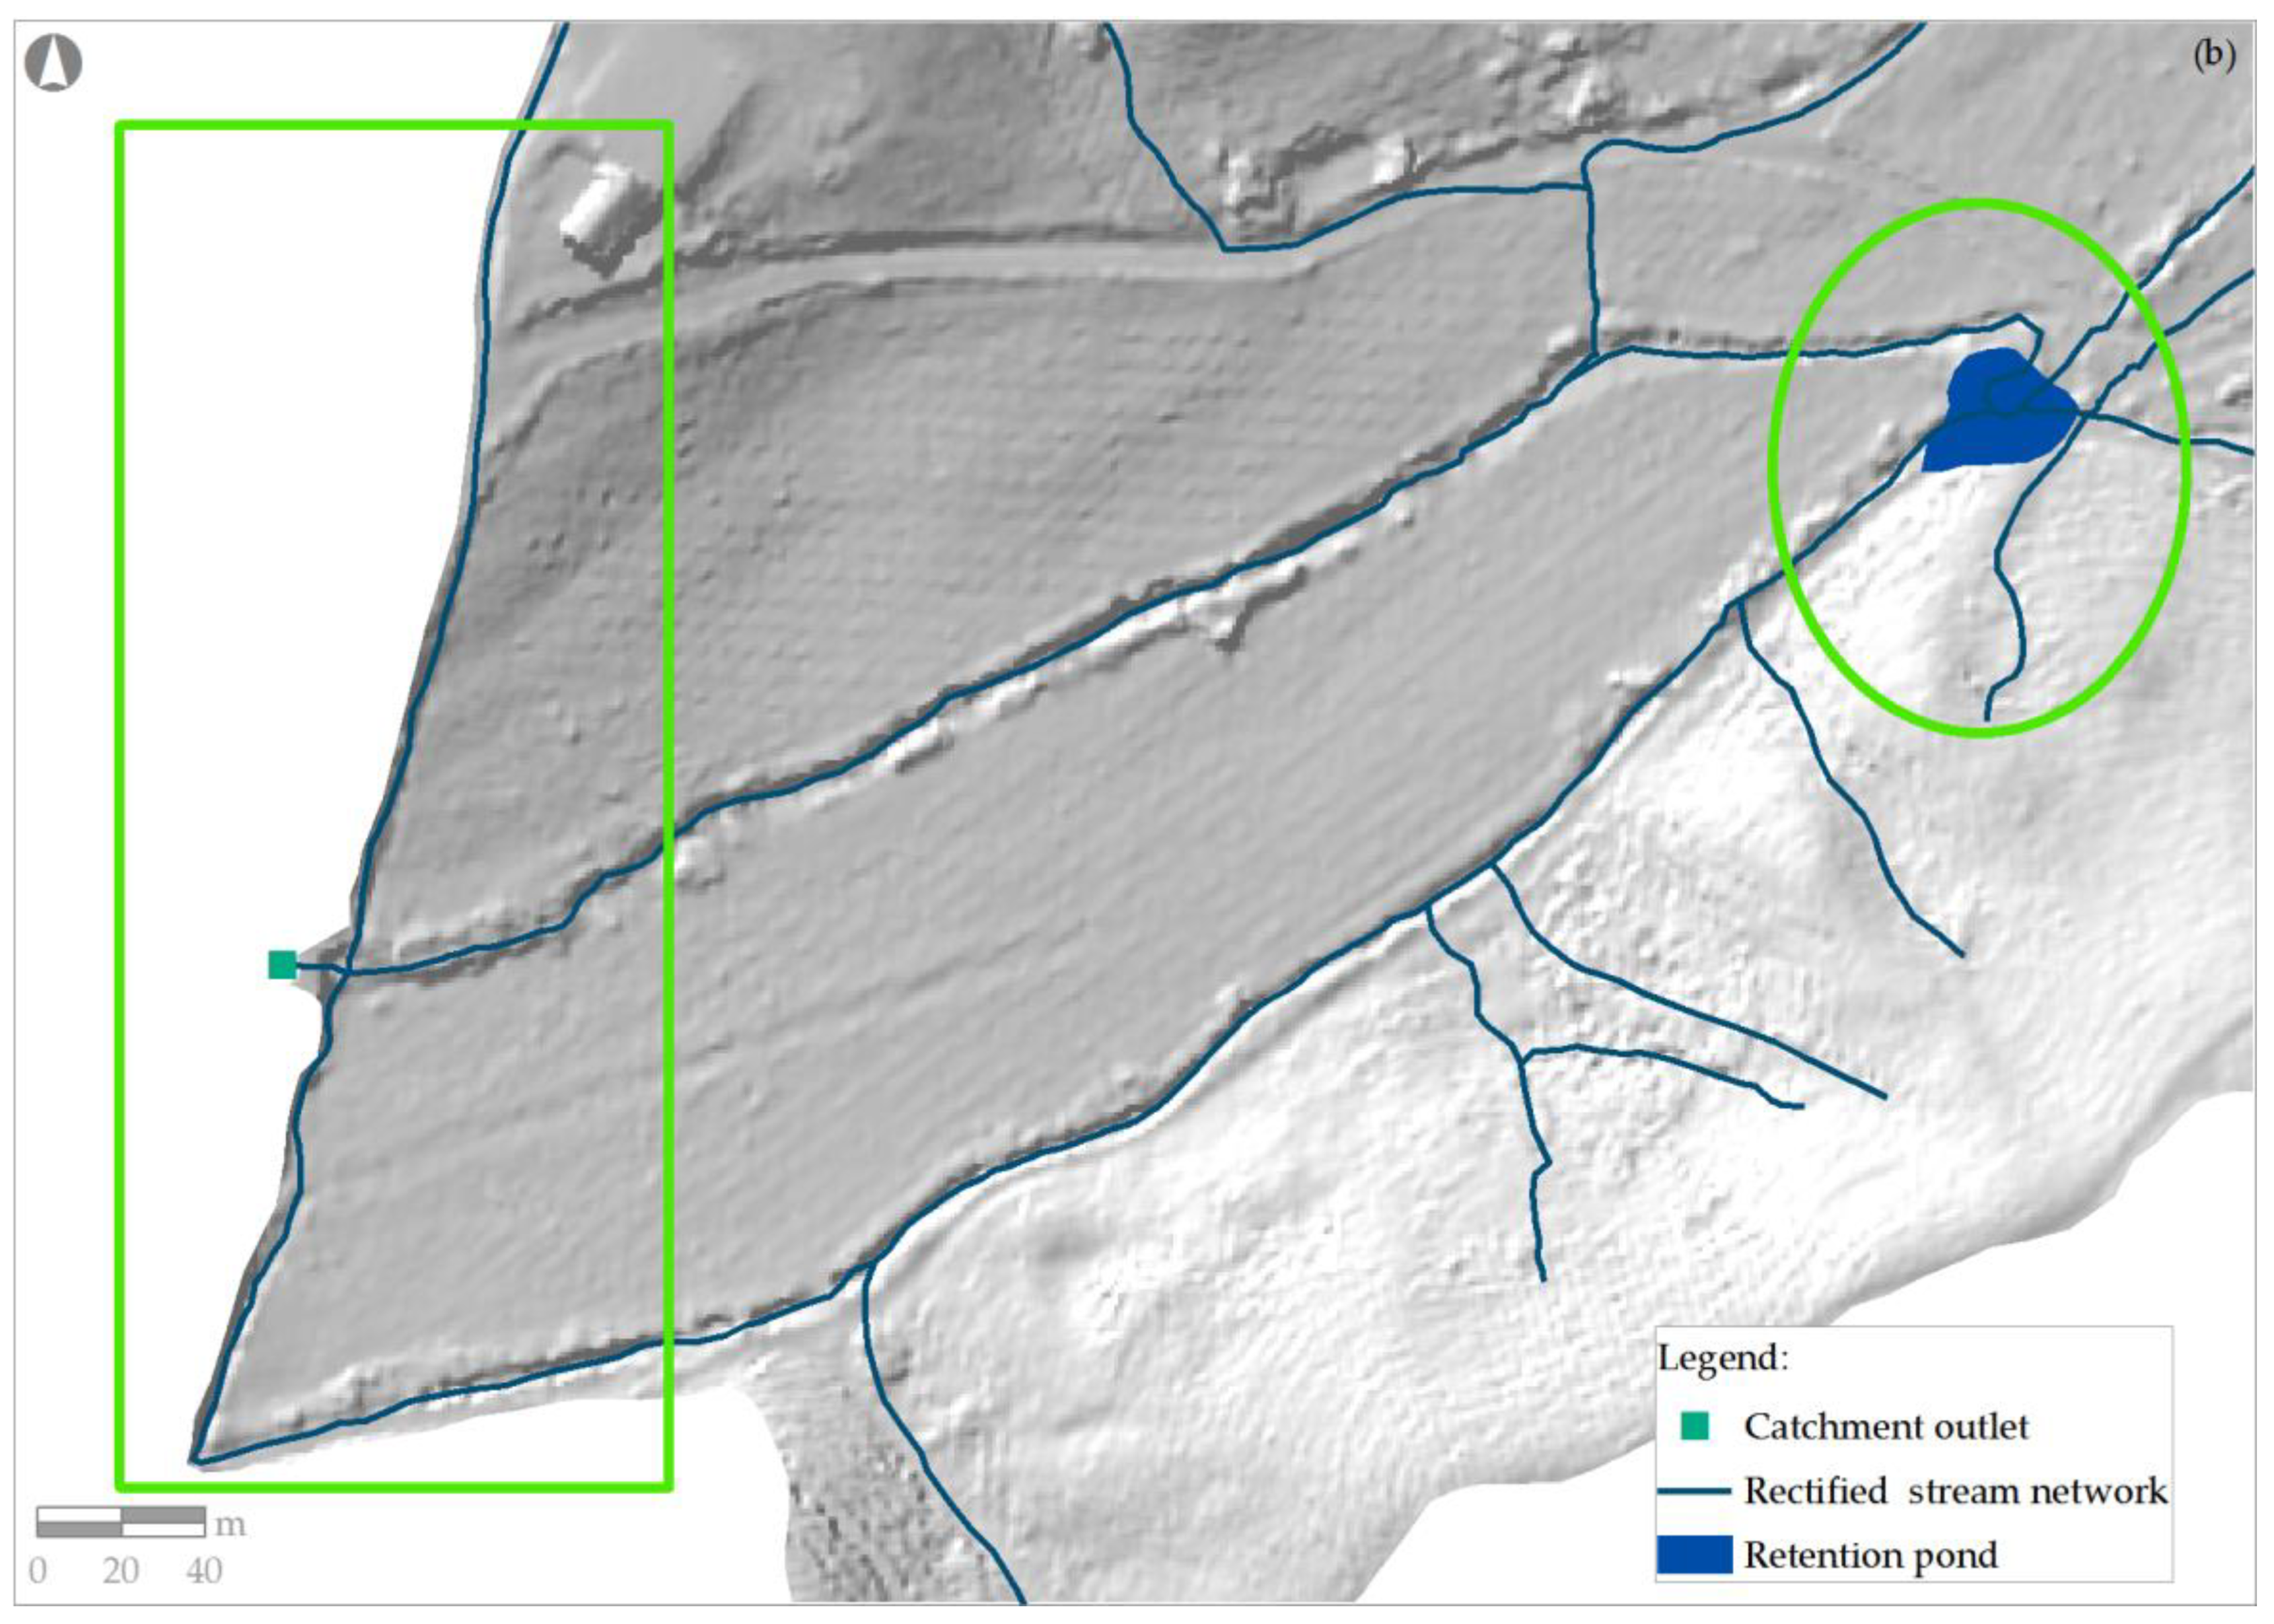
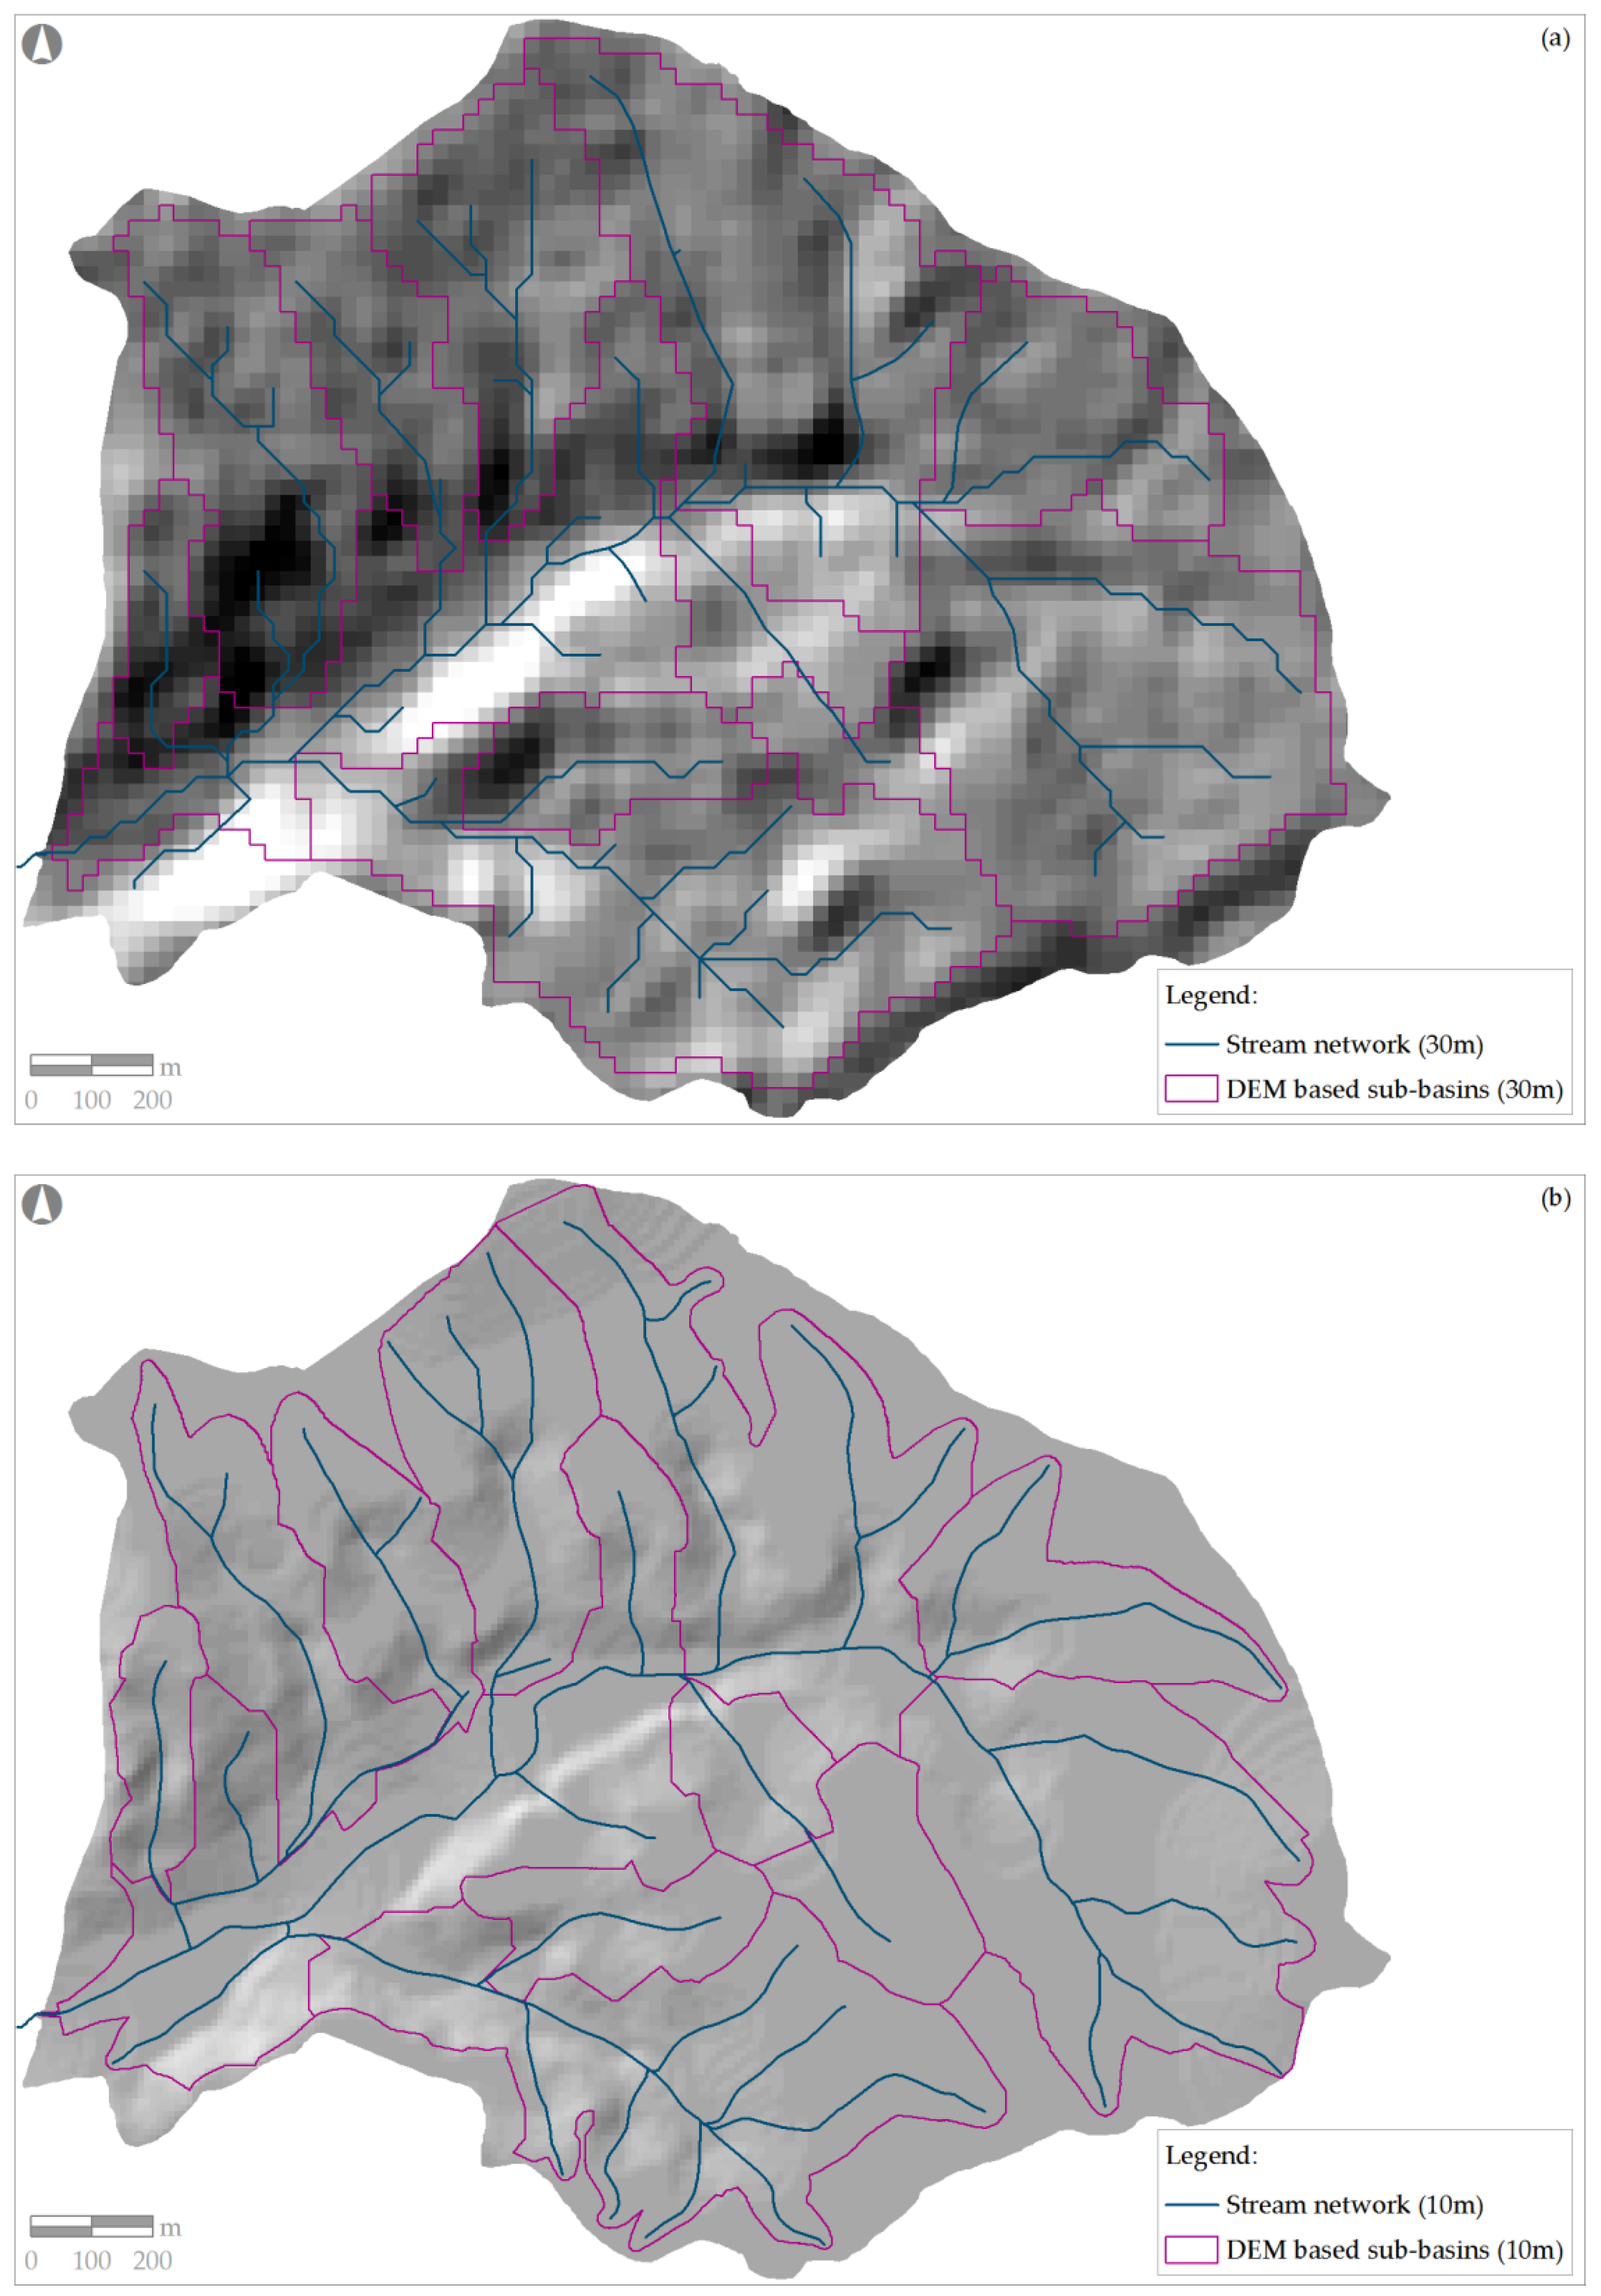
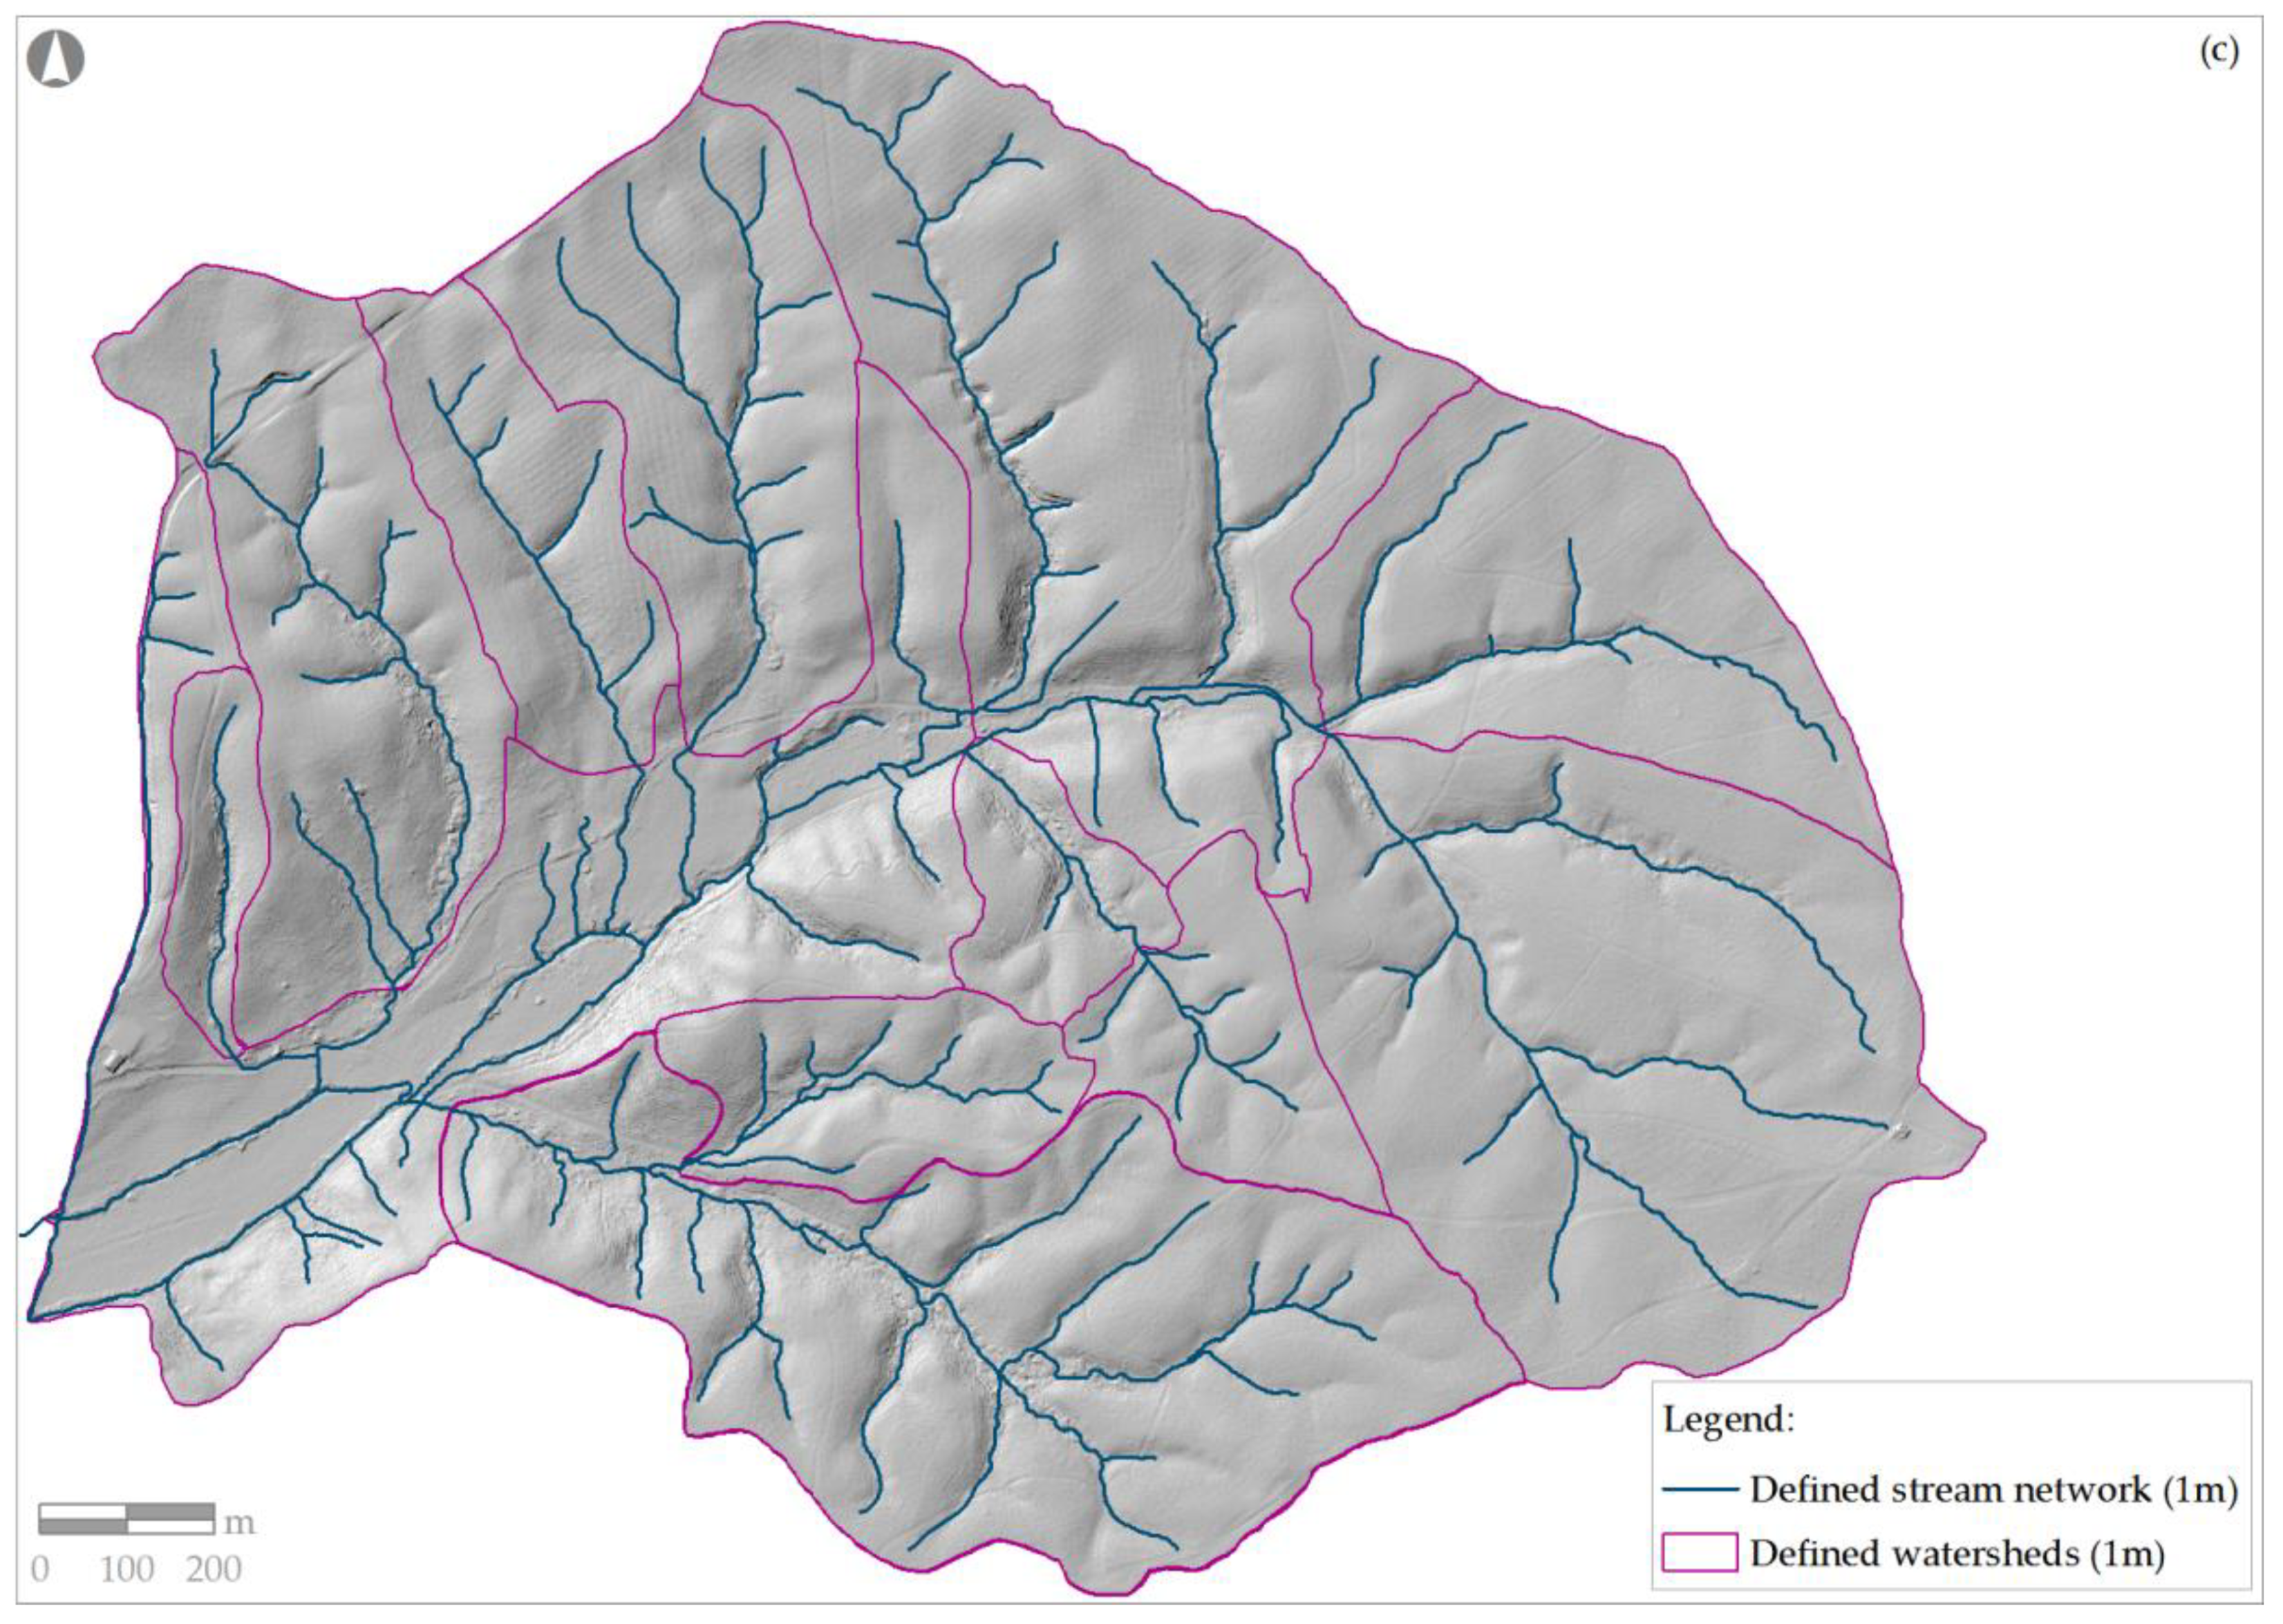
3.1. Impacts of DEM Resolution on Surface Representation and Watershed Properties
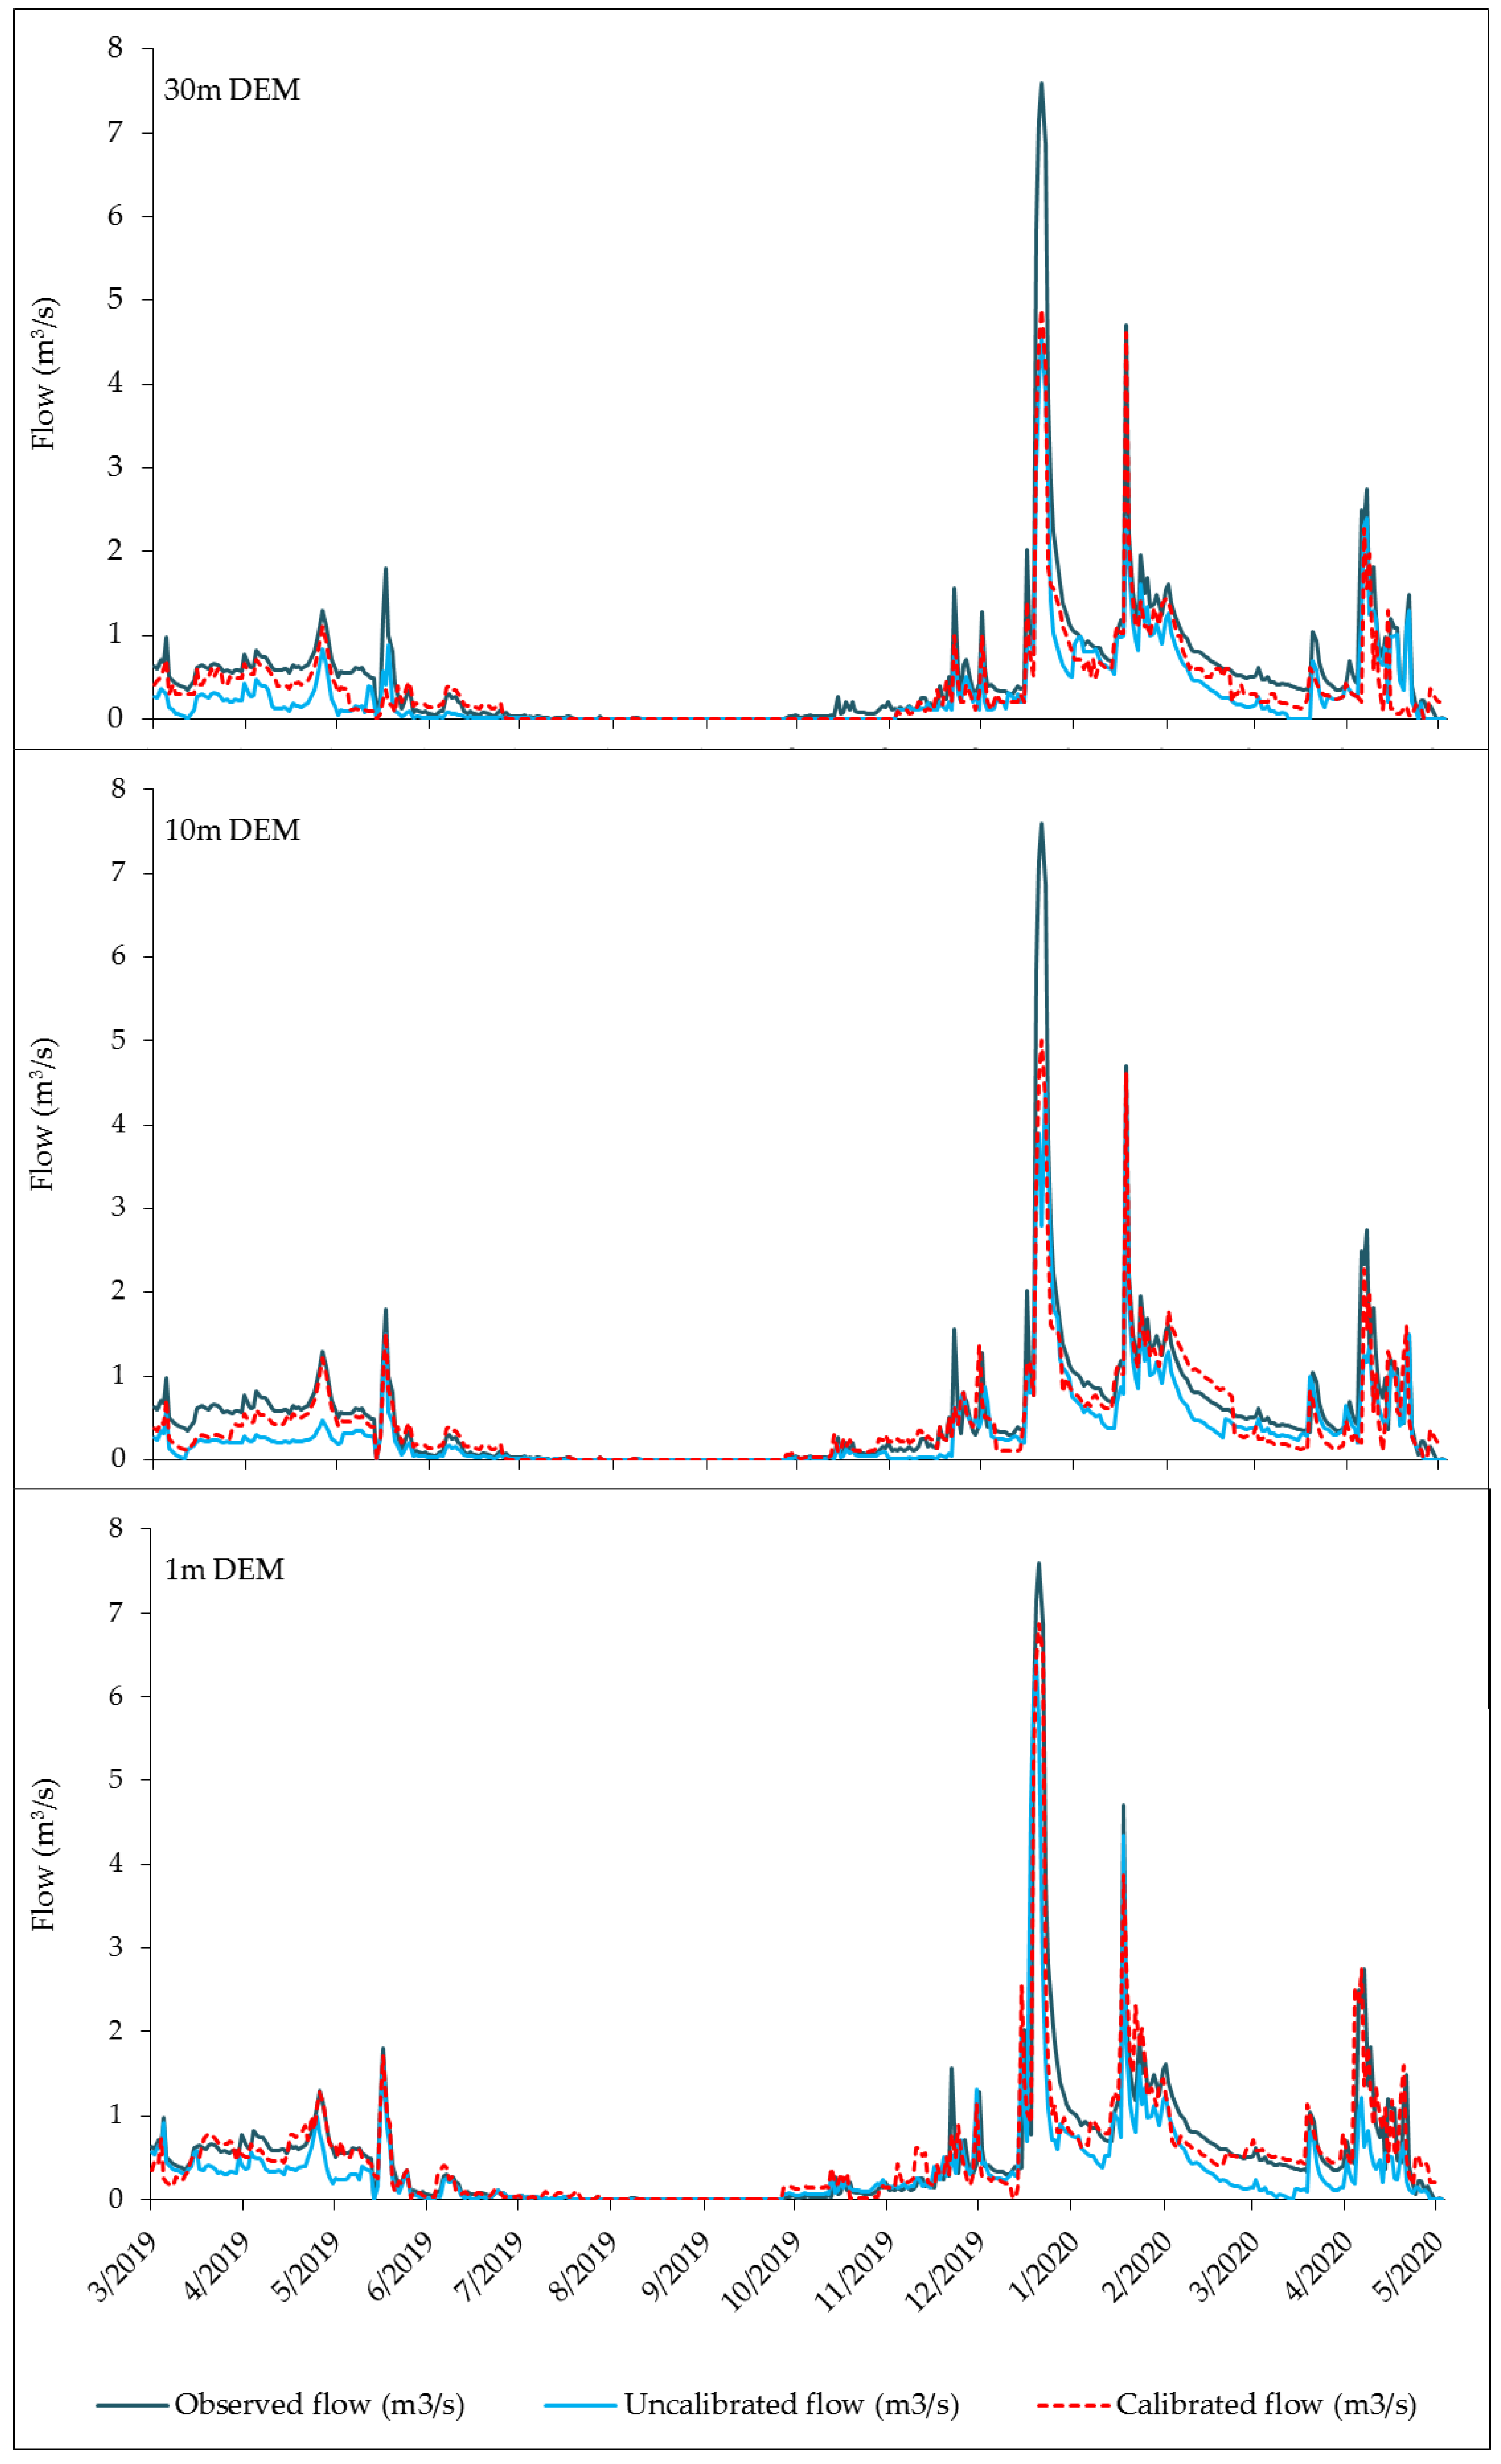
3.2. Impacts of DEM Resolution on Catchment Processes and Responses
4. Conclusions
Author Contributions
Funding
Acknowledgments
Conflicts of Interest
References
- Stape, J.L.; Binkley, D.; Ryan, M.G.; Fonseca, S.; Loos, R.A.; Takahashi, E.N.; Silva, C.R.; Silva, S.R.; Hakamada, R.E.; Ferreira, J.M.A.; et al. The Brazil Eucalyptus Potential Productivity Project: Influence of water, nutrients and stand uniformity on wood production. For. Ecol. Manage. 2010, 259, 1684–1694. [Google Scholar] [CrossRef]
- Peel, M.C.; Finlayson, B.L.; McMahon, T.A. Updated world map of the Köppen-Geiger climate classification. Hydrol. Earth Syst. Sci. 2007, 11, 1633–1644. [Google Scholar] [CrossRef]
- Spinoni, J.; Vogt, J.; Naumann, G.; Carrao, H.; Barbosa, P. Towards identifying areas at climatological risk of desertification using the Köppen-Geiger classification and FAO aridity index. Int. J. Climatol. 2015, 35, 2210–2222. [Google Scholar] [CrossRef]
- IFN6–6º Inventário Florestal Nacional; Instituto da Conservação da Natureza e das Florestas: Lisboa, Portugal, 2019. (In Portuguese)
- Sofia, G. Combining Geomorphometry, Feature Extraction Techniques and Earth-Surface Processes Research: The Way Forward. Geomorphology 2020, 355, 107055. [Google Scholar] [CrossRef]
- Zhang, W.; Montgomery, D.R. Digital elevation model grid size, landscape representation, and hydrologic simulations. Water Resour. Res. 1994, 30, 1019–1028. [Google Scholar] [CrossRef]
- Burrough, P.A.; Macdonnell, R.A.; Lloyd, C.D. Principles of Geographical Information Systems, 3rd ed.; Oxford University Press: New York, NY, USA, 2015; p. 352. [Google Scholar]
- Florinsky, I.V. Digital Terrain Analysis in Soil Science and Geology, 2nd ed.; Elsevier Academic Press: Amsterdam, The Netherlands, 2016; p. 379. [Google Scholar]
- Ouédraogo, M.; Degré, A.; Debouche, C.; Lisein, J. The evaluation of unmanned aerial system-based photogrammetry and terrestrial laser scanning to generate DEMs of agricultural watersheds. Geomorphology 2014, 214, 339–355. [Google Scholar] [CrossRef]
- Muhadi, N.A.; Abdullah, A.F.; Bejo, S.K.; Mahadi, M.R.; Mijic, A. The Use of LiDAR-Derived DEM in Flood Applications: A Review. Remote Sens. 2020, 12, 2308. [Google Scholar] [CrossRef]
- Sørensen, R.; Seibert, J. Effects of DEM resolution on the calculation of topographical indices: TWI and its components. J. Hydrol. 2007, 347, 79–89. [Google Scholar] [CrossRef]
- Vaze, J.; Teng, T.; Spencer, G. Impact of DEM accuracy and resolution on topographic indices. Environ. Model. Softw. 2010, 25, 1086–1098. [Google Scholar] [CrossRef]
- Tan, M.L.; Ficklin, D.L.; Dixon, B.; Ibrahim, A.L.; Yusop, Z.; Chaplot, V. Impacts of DEM resolution, source, and resampling technique on SWAT-simulated streamflow. Appl. Geogr. 2015, 63, 357–368. [Google Scholar] [CrossRef]
- Tan, M.L.; Ramli, H.P.; Tam, T.H. Effect of DEM resolution, source, resampling technique and area threshold on SWAT outputs. Water Resour. Manag. 2018, 32, 4591–4606. [Google Scholar] [CrossRef]
- Xu, F.; Dong, G.; Wang, Q.; Liu, L.; Yu, W.; Men, C.; Liu, R. Impacts of DEM uncertainties on critical source areas identification for non-point source pollution control based on SWAT model. J. Hydrol. 2016, 540, 355–367. [Google Scholar] [CrossRef]
- McDonald, S.; Mohammed, I.N.; Bolten, J.D.; Pulla, S.; Meechaiya, C.; Markert, A.W.; Srinivasang, R.; Nelson, J.; Lakshmi, V. A web-based decision support system tools: The Soil and Water Assessment Tool online visualization and analyses (SWATOnline) and NASA earth observation data downloading and reformatting tool (NASAaccess). Environ. Model. Softw. 2019, 120, 104499. [Google Scholar] [CrossRef] [PubMed]
- Ferraz, S.F.D.B.; Rodrigues, C.B.; Garcia, L.G.; Alvares, C.A.; Lima, W.D.P. Effects of Eucalyptus plantation on streamflow in Brazil: Moving beyond the water use debate. For. Ecol. Manage. 2019, 453, 1–10. [Google Scholar] [CrossRef]
- Di Luzio, M.; Srinivasan, R.; Arnold, J.G.; Neitsch, S.L. Soil and Water Assessment Tool–ArcView GIS Interface Manual–Version 2000; Grassland, Soil and Water Research Laboratory, Agricultural Research Service and Blackland Research Center, Texas Agricultural Experiment Station: Temple, TX, USA, 2001. [Google Scholar]
- Arnold, J.G.; Moriasi, D.N.; Gassman, P.W.; Abbaspour, K.C.; White, M.J.; Srinivasan, R.; Santhi, C.; Harmel, R.D.; van Griensven, A.; Van Liew, N.W.; et al. SWAT: Model use, calibration, and validation. Trans. ASABE 2012, 55, 1491–1508. [Google Scholar] [CrossRef]
- CARD 2020. SWAT Literature Database for Peer-Reviewed Journal Articles; Center for Agricultural and Rural Development, Iowa State University: Ames, IA, USA, 2019; Available online: https://www.card.iastate.edu/swat_articles/ (accessed on 4 May 2020).
- Cotter, A.S.; Chaubey, I.; Costello, T.A.; Soerens, T.S.; Nelson, M.A. Water quality model output uncertainty as affected by spatial resolution of input data. J. Am. Water Resour. Assoc. 2003, 39, 977–986. [Google Scholar] [CrossRef]
- Dixon, B.; Earls, J. Resample or not?! Effects of resolution of DEMs in watershed modeling. Hydrol. Process. 2009, 23, 1714–1724. [Google Scholar] [CrossRef]
- Duru, U.; Arabi, M.; Wohl, E.E. Modeling stream flow and sediment yield using the SWAT model: A case study of Ankara River basin, Turkey. Phys. Geogr. 2017, 39, 264–289. [Google Scholar] [CrossRef]
- Goulden, T.; Jamieson, R.; Hopkinson, C.; Sterling, S.; Sinclair, A.; Hebb, D. Sensitivity of hydrological outputs from SWAT to DEM spatial resolution. Photogramm. Eng. Remote Sens. 2014, 80, 639–652. [Google Scholar] [CrossRef]
- Reddy, A.S.; Reddy, M.J. Evaluating the influence of spatial resolutions of DEM on watershed runoff and sediment yield using SWAT. J. Earth Syst. Sci. 2015, 124, 1517–1529. [Google Scholar] [CrossRef]
- Nagaveni, C.; Kumar, K.P.; Ravibabu, M.V. Evaluation of TanDEMx and SRTM DEM on watershed simulated runoff estimation. J. Earth Syst. Sci. 2018, 128, 2. [Google Scholar] [CrossRef]
- Munoth, P.; Goyal, R. Effects of DEM source, spatial resolution and drainage area threshold values on hydrological modeling. Water Resour. Manag. 2019, 33, 3303–3319. [Google Scholar] [CrossRef]
- Lin, S.; Jing, C.; Coles, N.A.; Chaplot, V.; Moore, N.J.; Wu, J. Evaluating DEM source and resolution uncertainties in the Soil and Water Assessment Tool. Stoch. Environ. Res. Risk Assess. 2012, 27, 209–221. [Google Scholar] [CrossRef]
- Zhang, P.; Liu, R.; Bao, Y.; Wang, J.; Yu, W.; Shen, Z. Uncertainty of SWAT model at different DEM resolutions in a large mountainous watershed. Water Res. 2014, 53, 132–144. [Google Scholar] [CrossRef]
- Kumar, B.; Lakshmi, V.; Patra, K.C. Evaluating the Uncertainties in the SWAT Model Outputs due to DEM Grid Size and Resampling Techniques in a Large Himalayan River Basin. J. Hydrol. Eng. 2017, 22, 04017039. [Google Scholar] [CrossRef]
- Goulden, T.; Hopkinson, C.; Jamieson, R.; Sterling, S. Sensitivity of DEM, slope, aspect and watershed attributes to LiDAR measurement uncertainty. Remote Sens. Environ. 2016, 179, 23–35. [Google Scholar] [CrossRef]
- Wu, M.; Shi, P.; Chen, A.; Shen, C.; Wang, P. Impacts of DEM resolution and area threshold value uncertainty on the drainage network derived using SWAT. Water SA 2017, 43, 450. [Google Scholar] [CrossRef]
- Camargos, C.; Julich, S.; Houska, T.; Bach, M.; Breuer, L. Effects of Input Data Content on the Uncertainty of Simulating Water Resources. Water 2018, 10, 621. [Google Scholar] [CrossRef]
- Köppen, W. Grundriss der Klimakunde; Walter de Gruyter: Berlin, Germany, 1931; p. 388. [Google Scholar]
- Thornthwaite, C.W. An approach toward a rational classification of climate. Geogr. Rev. 1948, 38, 55–94. [Google Scholar] [CrossRef]
- Morais, J. Divisão climática de Portugal. In Memórias e Notícias; Publicações do Museu Mineralógico e Geológico da Universidade de Coimbra: Coimbra, Portugal, 1959; p. 27. (In Portuguese) [Google Scholar]
- Dias, R.; Araújo, A.; Terrinha, P.; Kullberg, J.C. (Eds.) Geologia de Portugal. Volume II Geologia Meso-Cenozóica de Portugal; Escolar Editora: Lisboa, Portugal, 2013; p. 798. (In Portuguese) [Google Scholar]
- Gonçalves, F.; Zbyzewski, G.; Carvalhosa, A.; Coelho, A.P. Notícia Explicativa da Carta Geológica de Portugal na Escala 1/50 000, Folha 27-D; Serviços Geológicos de Portugal: Lisboa, Portugal, 1979; p. 75. (In Portuguese) [Google Scholar]
- Almeida, C.; Jesus, M.R.; Mendonça, J.J.L.; Gomes, A.J. Sistemas Aquíferos de Portugal Continental-Sistema Aquífero das Aluviões do Tejo; INAG: Lisboa, Portugal, 2000; p. 12. [Google Scholar]
- Matias, M.J.; Marques, J.M.; Figueiredo, P.; Basto, M.J.; Abreu, M.M.; Carreira, P.M.; Ribeiro, C.; Flambo, A.; Feliciano, J.; Vicente, E.M. Assessment of pollution risk ascribed to Santa Margarida Military Camp activities (Portugal). Environ. Geol. 2008, 56, 1227–1235. [Google Scholar] [CrossRef]
- SROA. Carta dos Solos de Portugal. I Vol: Classificação e Caracterização Morfológica dos Solos; Ministério da Economia, Secretaria de Estado da Agricultura, Serviço de Reconhecimento e Ordenamento Agrário: Lisboa, Portugal, 1970. (In Portuguese) [Google Scholar]
- Cardoso, J.V.J.C. A Classificação dos Solos de Portugal-Nova Versão. Boletim de Solos (SROA) 1974, 17, 14–46. (In Portuguese) [Google Scholar]
- FAO–UNESCO. Soil Map of the World. Vol. I-Legend; UNESCO: Paris, France, 1974. [Google Scholar]
- FAO–UNESCO. Soil Map of the World. Revised Legend; World Soil Resources Report No. 60: Rome, Italy, 1988; p. 59. [Google Scholar]
- Rabus, B.; Eineder, M.; Roth, A.; Bamler, R. The Shuttle Radar Topography Mission-A new class of digital elevation models acquired by spaceborne radar. ISPRS J. Photogramm. Remote Sens. 2003, 57, 241–262. [Google Scholar] [CrossRef]
- Gonçalves, J.A.; Fernandes, J.C. Assessment of SRTM-3 DEM in Portugal with Topographic Map Data; EARSeL 3D Remote Sensing Workshop: Porto, Portugal, 2005. [Google Scholar]
- Gonçalves, J.A.; Morgado, A. Use of the SRTM DEM as a geo-referencing tool by elevation matching. Int. Arch. Photogramm. Remote Sens. Spat. Inf. Sci. 2008, 37, 879–883. [Google Scholar]
- Lin, S.; Jing, C.; Chaplot, X.; Yu, X.; Zhang, Z.; Moore, N.; Wu, J. Effect of DEM resolution on SWAT outputs of runoff, sediment and nutrients. Hydrol. Earth Syst. Sci. 2010, 7, 4411–4435. [Google Scholar] [CrossRef]
- Sharma, A.; Tiwari, K.N. A comparative appraisal of hydrological behavior of SRTM DEM at catchment level. J. Hydrol. 2014, 519, 1394–1404. [Google Scholar] [CrossRef]
- Petrasova, A.; Mitasova, H.; Petras, V.; Jeziorska, J. Fusion of high-resolution DEMs for water flow modeling. Open Geospat. Data Softw. Stand. 2017, 2, 6. [Google Scholar] [CrossRef]
- McGaughey, R.J. FUSION/LDV: Software for LIDAR Data Analysis and Visualization (Version 3.60+); Pacific Northwest Research Station, United States Department of Agriculture Forest Service: Seattle, WA, USA, 2009; p. 123. [Google Scholar]
- Tarboton, D.G. A new method for the determination of flow directions and contributing areas in grid digital elevation models. Water Resour. Res. 1997, 33, 309–319. [Google Scholar] [CrossRef]
- Horton, R.E. Erosional development of streams and their drainage basins; hydrophysical approach to quantitative morphology. Geol. Soc. Am. Bull. 1945, 56, 275–370. [Google Scholar] [CrossRef]
- Mueller, J.E. An introduction to the hydraulic and topographic sinuosity indexes. Ann. Assoc. Am. Geogr. 1968, 58, 371–385. [Google Scholar] [CrossRef]
- Bieger, K.; Arnold, J.G.; Rathjens, H.; White, M.J.; Bosch, D.D.; Allen, P.M. Introduction to SWAT+, a Completely Restructured Version of the Soil and Water Assessment Tool. J. Am. Water Resour. Assoc. 2016, 53, 115–130. [Google Scholar] [CrossRef]
- Neitsch, S.L.; Arnold, J.G.; Kiniry, J.R.; Williams, J.R.; King, K.W. Soil and Water Assessment Tool Theoretical Documentation, Version 2000; Blackland Research Center, Texas Agricultural Experiment Station: Temple, TX, USA, 2001. [Google Scholar]
- Rocha, J.; Roebeling, P.; Rialrivas, M.E. Assessing the impacts of sustainable agricultural practices for water quality improvements in the Vouga catchment (Portugal) using the swat model. Sci. Total Environ. 2015, 536, 48–58. [Google Scholar] [CrossRef] [PubMed]
- Rocha, J.; Carvalho-Santos, C.; Diogo, P.; Beça, P.; Keizer, J.J.; Nunes, J.P. Impacts of climate change on reservoir water availability, quality and irrigation needs in a water scarce Mediterranean region (southern Portugal). Sci. Total Environ. 2020, 736, 139477. [Google Scholar] [CrossRef]
- Serpa, D.; Nunes, J.P.; Santos, J.; Sampaio, E.; Jacinto, R.; Veiga, S.; Lima, J.C.; Moreira, M.; Corte-Real, J.; Keizer, J.J.; et al. Impacts of climate and land use changes on the hydrological and erosion processes of two contrasting Mediterranean catchments. Sci. Total Environ. 2015, 538, 64–77. [Google Scholar] [CrossRef]
- Nunes, J.P.; Jacinto, R.; Keizer, J.J. Combined impacts of climate and socio-economic scenarios on irrigation water availability for a dry Mediterranean reservoir. Sci. Total Environ. 2017, 584–585, 219–233. [Google Scholar]
- Williams, J.R.; Jones, C.A.; Dyke, P.T. A modeling approach to determining the relationship between erosion and soil productivity. Trans. ASAE 1984, 27, 129–144. [Google Scholar] [CrossRef]
- Abbaspour, K.C. User Manual for SWAT-CUP, SWAT Calibration and Uncertainty Analysis Programs; Swiss Federal Institute of Aquatic Science and Technology, Eawag: Duebendorf, Switzerland, 2007. [Google Scholar]
- Abbaspour, K.C.; Rouholahnejad, E.; Vaghefi, S.; Srinivasan, R.; Yang, H.; Kløve, B. A continental-scale hydrology and water quality model for Europe: Calibration and uncertainty of a high-resolution large-scale SWAT model. J. Hydrol. 2015, 524, 733–752. [Google Scholar] [CrossRef]
- Gupta, H.V.; Sorooshian, S.; Yapo, P.O. Status of automatic calibration for hydrologic models: Comparison with multilevel expert calibration. J. Hydrol. Eng. 1999, 4, 135–143. [Google Scholar] [CrossRef]
- Krause, P.; Boyle, D.; Bäse, P. Comparison of different efficiency criteria for hydrological model assessment. Adv. Geosci. 2005, 5, 89–97. [Google Scholar] [CrossRef]
- Moriasi, D.N.; Arnold, J.G.; Van Liew, M.W.; Bingner, R.L.; Harmel, R.D.; Veith, T.L. Model evaluation guidelines for systematic quantification of accuracy in watershed simulations. Trans. ASABE 2007, 50, 885–900. [Google Scholar] [CrossRef]
- Moriasi, D.N.; Gitau, M.W.; Pai, N.; Daggupati, P. Hydrologic and water quality models: Performance measures and evaluation criteria. Trans. ASABE 2015, 58, 1763–1785. [Google Scholar]
- Charrier, R.; Li, Y. Assessing resolution and source effects of digital elevation models on automated floodplain delineation: A case study from the Camp Creek Watershed, Missouri. Appl. Geogr. 2012, 34, 38–46. [Google Scholar] [CrossRef]
- Luo, Y.; Su, B.; Yuan, J.; Li, H.; Zhang, Q. GIS Techniques for Watershed Delineation of SWAT Model in Plain Polders. Procedia Environ. Sci. 2011, 10, 2050–2057. [Google Scholar] [CrossRef]
- Strahler, A.N. Quantitative analysis of watershed geomorphology. Trans. Am. Geophys. Union 1957, 38, 913–920. [Google Scholar] [CrossRef]
- Pang, S.J.; Wang, X.Y.; Melching, C.S.; Feger, K.H. Development and testing of a modified SWAT model based on slope condition and precipitation intensity. J. Hydrol. 2020, 588, 125098. [Google Scholar] [CrossRef]
- Yang, P.; Ames, D.P.; Fonseca, A.; Anderson, D.; Shrestha, R.; Glenn, N.F.; Cao, Y. What is the effect of LiDAR-derived DEM resolution on large-scale watershed model results? Environ. Model. Softw. 2014, 58, 48–57. [Google Scholar] [CrossRef]
- Malagó, A.; Vigiak, O.; Bouraoui, F.; Pagliero, L.; Franchini, M. The hillslope length impact on SWAT streamflow prediction in large basins. J. Environ. Inform. 2018, 32, 82–97. [Google Scholar] [CrossRef]


| LULC | Area | Area |
|---|---|---|
| ha | % | |
| Eucalyptus | 210.9 | 78.9 |
| Unpaved roads and firebreaks | 19.9 | 7.4 |
| Cork oaks | 16.4 | 6.1 |
| Mediterranean scrubland | 9.2 | 3.4 |
| Mixed forest (maritime pine, green oak) | 6.3 | 2.4 |
| Maritime pine | 3.7 | 1.4 |
| Paved road | 0.4 | 0.2 |
| Urban (commercial) | 0.2 | 0.1 |
| Water bodies | 0.1 | 0.0 |
| Performance Rating | bR2 | NSE | Pbias% |
|---|---|---|---|
| Very good | 0.75 < bR2 ≤ 1.00 | 0.75 < NSE ≤ 1.00 | Pbias < ±10 |
| Good | 0.65 < bR2 ≤ 0.75 | 0.65 < NSE ≤ 0.75 | ±10 ≤ Pbias < ±15 |
| Satisfactory | 0.50 < bR2 ≤ 0.65 | 0.50 < NSE ≤ 0.65 | ±15 ≤ Pbias < ±25 |
| Unsatisfactory | bR2 ≤ 0.50 | NSE ≤ 0.50 | Pbias ≥ ±25 |
| Watershed Characteristics | DEM Resolution | ||
|---|---|---|---|
| 30 m | 10 m | 1 m | |
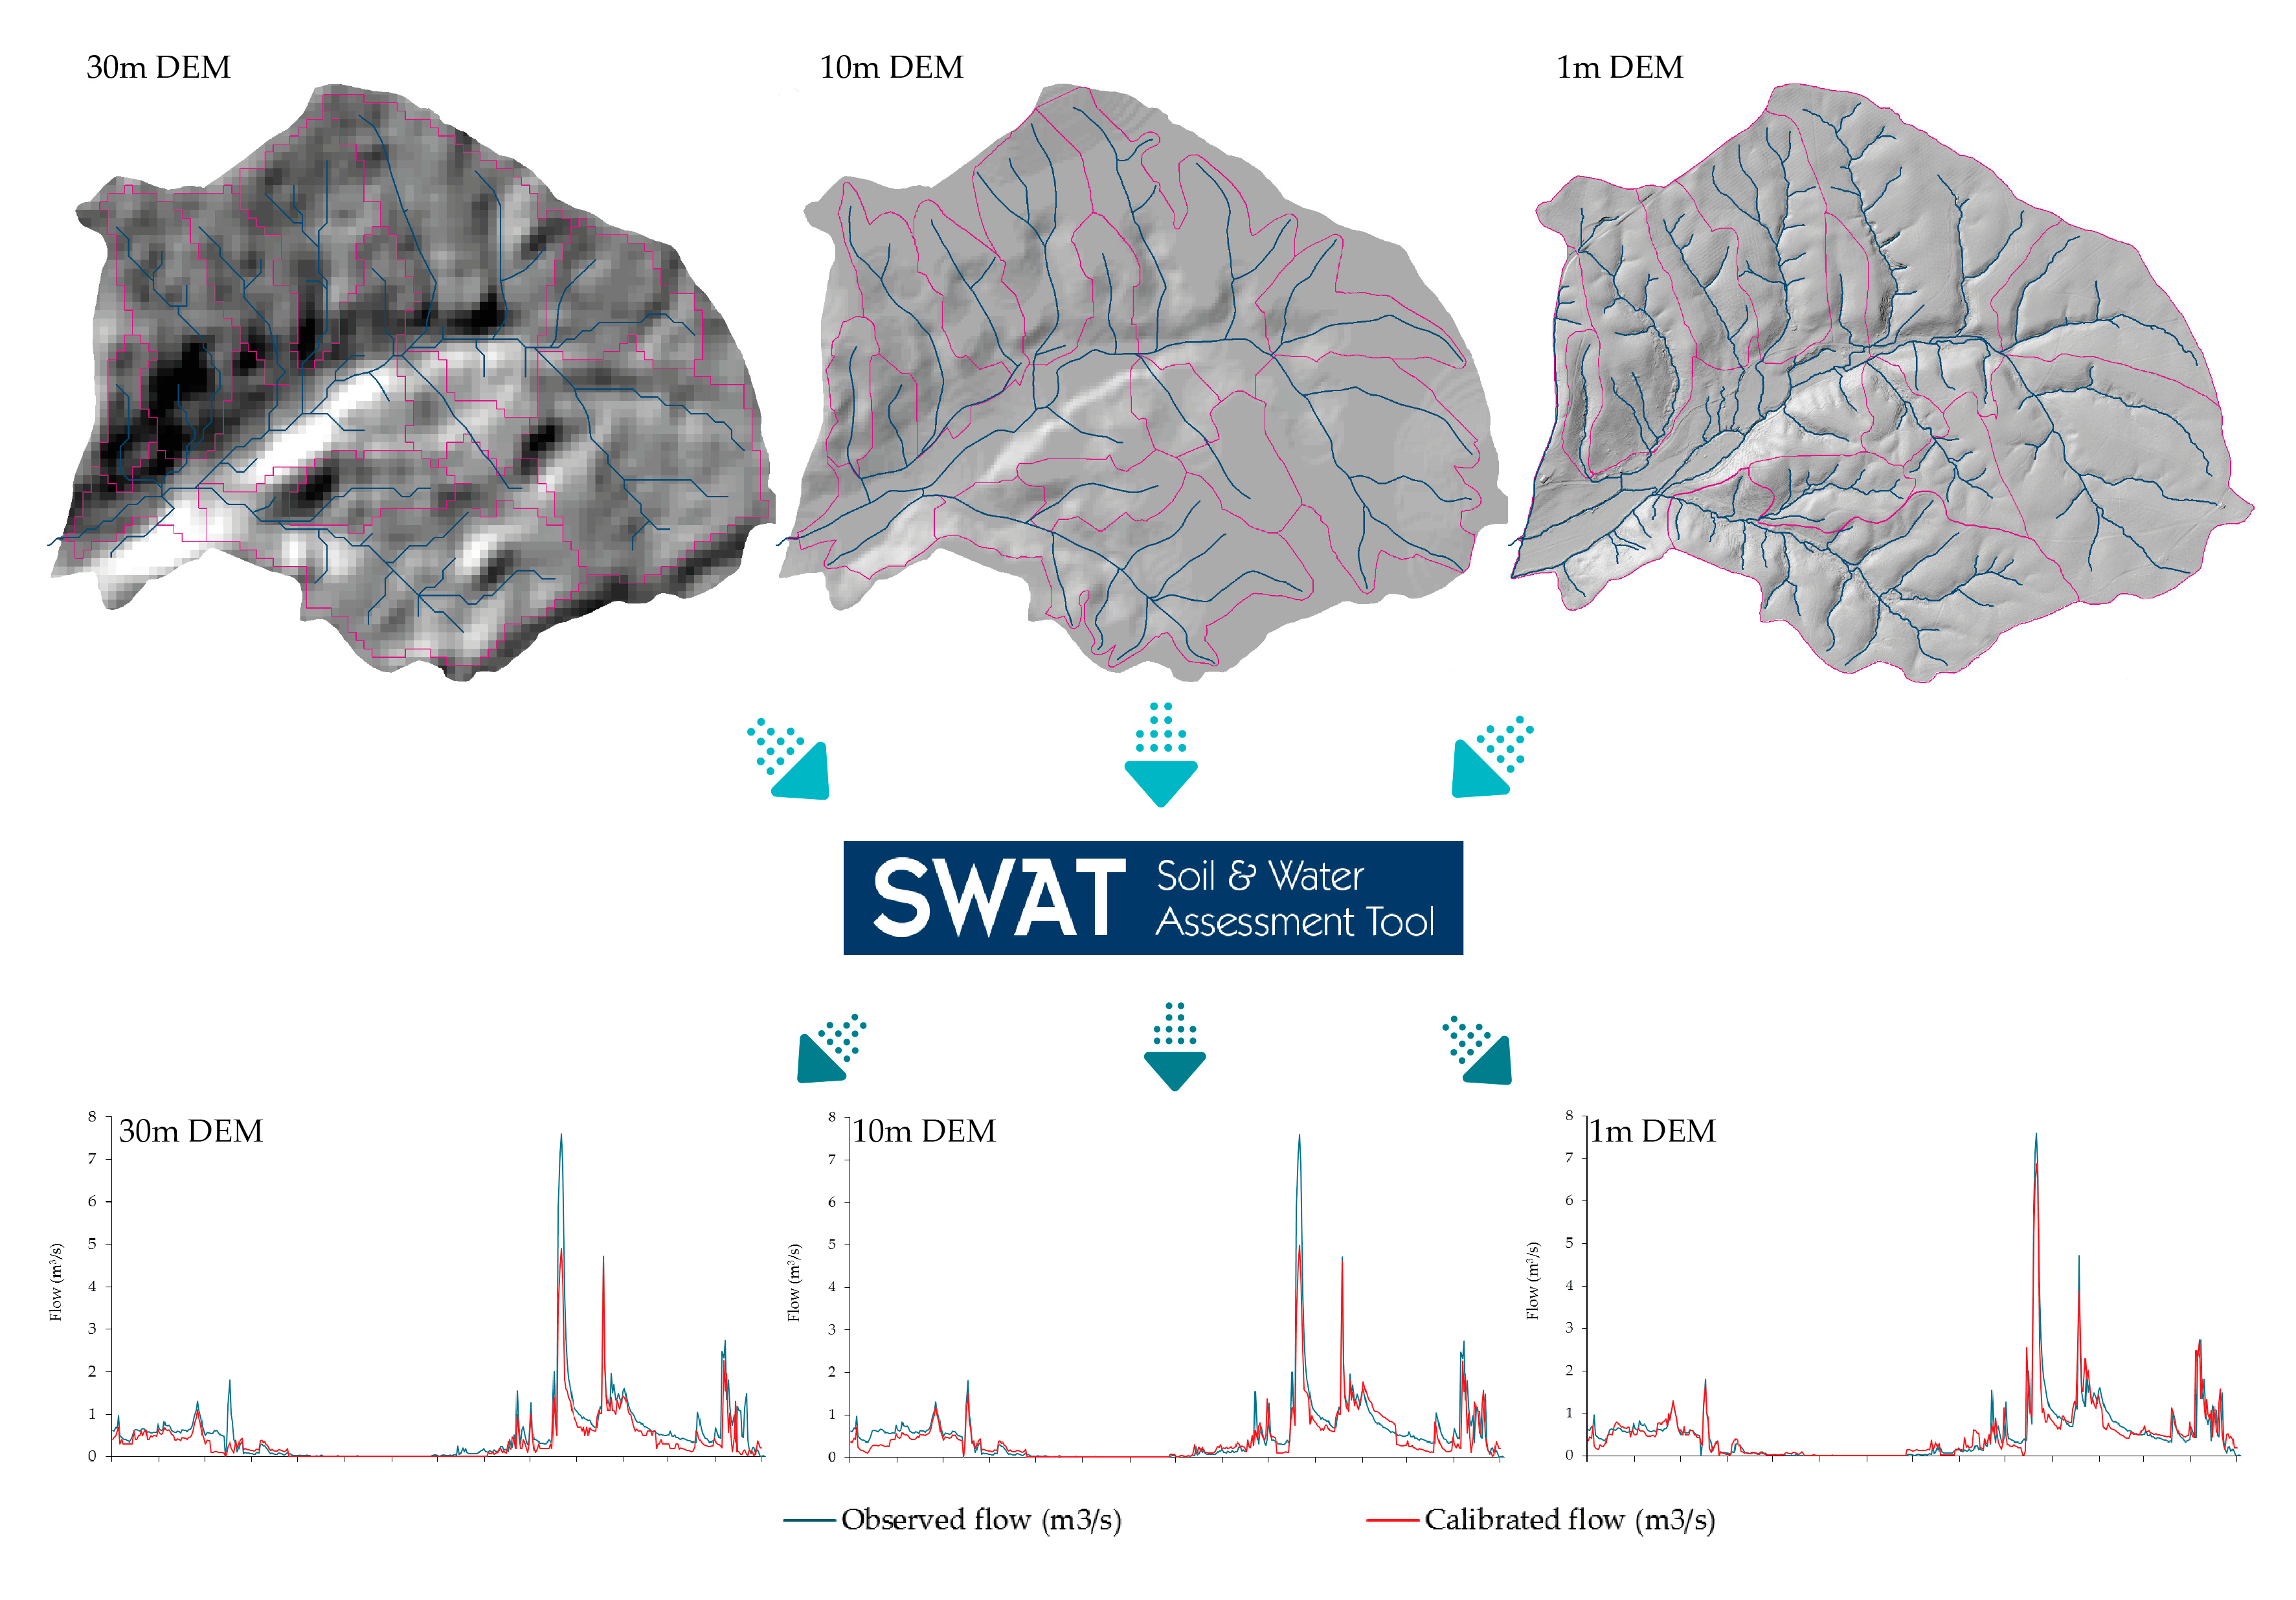
| Number of channels | 312 | 735 | 16,321 |
| Channels length | 14,955 m | 16,274 m | 26,317 m |
| Strahler order | 4 | 5 | 7 |
| Elevation (minimum) | 105 m | 102 m | 99 m |
| Elevation (maximum) | 169 m | 160 m | 164 m |
| Elevation (Std. deviation) | 13.7 | 11.3 | 12.8 |
| Drainage density | 0.55 mm−2 | 0.60 mm−2 | 0.98 mm−2 |
| Sinuosity | 0.45 | 0.12 | 0.06 |
| Vertices index | 0.04 | 0.09 | 1.24 |
| Hydrological response units | 263 | 297 | 402 |
| bR2 | NSE | Pbias | |||||||
|---|---|---|---|---|---|---|---|---|---|
| DEM Resolution | 30 m | 10 m | 1 m | 30 m | 10 m | 1 m | 30 m | 10 m | 1 m |
| Uncalibrated | 0.60 | 0.71 | 0.74 | 0.49 | 0.51 | 0.58 | −50.6 | −44.1 | −40.7 |
| Calibrated | 0.85 | 0.85 | 0.87 | 0.60 | 0.67 | 0.84 | −38.7 | −27.0 | −14.1 |
© 2020 by the authors. Licensee MDPI, Basel, Switzerland. This article is an open access article distributed under the terms and conditions of the Creative Commons Attribution (CC BY) license (http://creativecommons.org/licenses/by/4.0/).
Share and Cite
Rocha, J.; Duarte, A.; Silva, M.; Fabres, S.; Vasques, J.; Revilla-Romero, B.; Quintela, A. The Importance of High Resolution Digital Elevation Models for Improved Hydrological Simulations of a Mediterranean Forested Catchment. Remote Sens. 2020, 12, 3287. https://doi.org/10.3390/rs12203287
Rocha J, Duarte A, Silva M, Fabres S, Vasques J, Revilla-Romero B, Quintela A. The Importance of High Resolution Digital Elevation Models for Improved Hydrological Simulations of a Mediterranean Forested Catchment. Remote Sensing. 2020; 12(20):3287. https://doi.org/10.3390/rs12203287
Chicago/Turabian StyleRocha, João, André Duarte, Margarida Silva, Sérgio Fabres, José Vasques, Beatriz Revilla-Romero, and Ana Quintela. 2020. "The Importance of High Resolution Digital Elevation Models for Improved Hydrological Simulations of a Mediterranean Forested Catchment" Remote Sensing 12, no. 20: 3287. https://doi.org/10.3390/rs12203287
APA StyleRocha, J., Duarte, A., Silva, M., Fabres, S., Vasques, J., Revilla-Romero, B., & Quintela, A. (2020). The Importance of High Resolution Digital Elevation Models for Improved Hydrological Simulations of a Mediterranean Forested Catchment. Remote Sensing, 12(20), 3287. https://doi.org/10.3390/rs12203287