Article

Multiplatform Earth Observation Systems for Monitoring Water Quality in Vulnerable Inland Ecosystems: Maspalomas Water Lagoon

1
Instituto de Oceanografía y Cambio Global, IOCAG, Universidad de las Palmas de Gran Canaria, ULPGC, Unidad Asociada ULPGC-CSIC, 35017 Las Palmas de Gran Canaria, Canary Islands, Spain
2
Departamento de Física, Universidad de las Palmas de Gran Canaria, ULPGC, 35017 Las Palmas de Gran Canaria, Canary Islands, Spain
*
Author to whom correspondence should be addressed.
Remote Sens. 2020, 12(2), 284; https://doi.org/10.3390/rs12020284
Submission received: 11 November 2019 / Revised: 27 December 2019 / Accepted: 11 January 2020 / Published: 15 January 2020
(This article belongs to the Special Issue Remote Sensing of Coastal and Inland Waters)

Abstract

:
The accurate monitoring of water quality indicators, bathymetry and distribution of benthic habitats in vulnerable ecosystems is key to assessing the effects of climate change, the quality of natural areas and to guide appropriate biodiversity, tourism or fisheries policies. Coastal and inland water ecosystems are very complex but crucial due to their richness and primary production. In this context, remote sensing can be a reliable way to monitor these areas, mainly thanks to satellite sensors’ improved spatial and spectral capabilities and airborne or drone instruments. In general, mapping bodies of water is challenging due to low signal-to-noise (SNR) at sensor level, due to the very low reflectance of water surfaces as well as atmospheric effects. Therefore, the main objective of this work is to provide a robust processing framework to estimate water quality parameters in inland shallow waters using multiplatform data. More specifically, we measured chlorophyll concentrations (Chl-a) from multispectral and hyperspectral sensors on board satellites, aircrafts and drones. The Natural Reserve of Maspalomas, Canary Island (Spain), was chosen for the study because of its complexity as well as being an inner lagoon with considerable organic and inorganic matter and chlorophyll concentration. This area can also be considered a well-known coastal-dune ecosystem attracting a large amount of tourists. The water quality parameter estimated by the remote sensing platforms has been validated using co-temporal in situ measurements collected during field campaigns, and quite satisfactory results have been achieved for this complex ecosystem. In particular, for the drone hyperspectral instrument, the root mean square error, computed to quantify the differences between the estimated and in situ chlorophyll-a concentrations, was 3.45 with a bias of 2.96.

Graphical Abstract

1. Introduction

The protection of natural ecosystems is key to preserving biodiversity [1]. Unfortunately, bodies of water are very sensitive to natural phenomena, invasive species, human activities and other factors [2,3]. However, to reach their full potential, periodic monitoring of coastal and inner water ecosystems, and the analysis of multi-temporal changes are important for the sustainable management of natural resources as well as to understand our environment.
Monitoring the water quality is of great importance, since different concentrations of chlorophyll-a (Chl-a), suspended matter or CDOM (Colored Dissolved Organic Matter) can have a major effect on the biological activity in aquatic ecosystems [4]. For instance, very high CDOM concentrations decreases light intensity as it penetrates water and, thus, it can limit the growth of phytoplankton, affecting the oceanic food chains and the atmospheric oxygen.
Recently, growing interest in remote sensing imagery has provided synoptic maps of water quality parameters in turbid coastal waters, such as chlorophyll concentration, suspended matter and colored dissolved organic matter. Specifically, lagoon ecosystems contain elements that make these waters optically more complex than clear areas in deeper or shallow coastal waters [4]. In this context, remote sensing has many benefits compared with traditional sampling techniques, specifically, advanced multiplatform procedures [5].
For decades, ocean color remote sensing instruments have been successfully used in marine applications, but their spatial resolution is rather coarse and, as a consequence, they are not appropriate for the monitoring of most lakes, rivers or reservoirs. For this reason, satellite imagery with higher spatial resolution is required for inland water studies and, mainly, remote sensing platforms conceived for land applications, such as the Sentinel-2 or Landsat series, have been used [6,7]. Unfortunately, even though these data can have acceptable spatial detail, their spectral and radiometric resolutions may not be ideal for many inland water applications such as water quality retrieval or seabed mapping. Thus, advanced very high resolution (VHR) satellite-based imaging instruments, allocating spectral bands within the visible spectrum, can provide reliable information to implement spatially-based conservation initiatives and allow us to observe coastal parameters at greater, broader spatial and finer temporal scales than through field observation alone. However, certain elements impact the accuracy in shallow water applications and require advanced preprocessing techniques to address limitations in calibration, viewing effects, illumination geometry and disturbances caused by the atmosphere and sunglint. Thus, as the contribution to the received energy from water reflectivity is very weak, in the data preprocessing methodology, accurate atmospheric and deglinting correction techniques are necessary to improve the precision of water quality products. In our case, to accomplish this objective, in the framework of previous research projects, reliable VHR satellite atmospheric, sunglint and water column correction methods have already been developed and their main contributions and results published [8,9,10].
Recent works to estimate water quality parameters with VHR satellite data have been published [11,12,13,14,15]. As indicated, quality monitoring or bathymetry mapping using satellite imagery is very challenging as optical bands have limited SNR at sensor level [16]. Consequently, to achieve an acceptable accuracy, instead of considering multispectral data (MS), the use of finer hyperspectral (HS) data can be appropriate.
Unfortunately, very high spatial hyperspectral sensors onboard satellites are nowadays not available and the most recent hyperspectral operational satellites (Chinese GAOFEN-5 and Italian PRISMA satellites) only acquire images with 30 m spatial resolution. As a consequence, low altitude platforms are the only possibilities to map very complex habitats environments. In particular, the use of airborne HS instruments or, more recently, drone HS sensors can overcome these limitations and provide submetric information.
Thus, the main objective of this research is to generate knowledge for a robust image processing methodology and produce accurate water quality maps in inner lagoons or coastal shallow waters using multiplatform imagery. In particular, chlorophyll-a concentration has been derived as this pigment is necessary for photosynthesis and it is a key indicator of the phytoplankton abundance. Specifically, three different sensors have been considered and compared to allow the monitoring of vulnerable and complex ecosystems at the maximum spatial and spectral resolutions: Very High Resolution Satellite Multispectral Sensor (VHRMS), Airborne Hyperspectral Scanner (AHS) and Drone Hyperspectral Scanner (DHS).
In our context, we monitored a complex water inner lagoon, located at Maspalomas (Canary Island, Spain), and water quality parameters were collected in different years, using multiplatform data, to support the sustainable management of natural resources as well as to establish parameters related to climate change and anthropogenic stress. The Maspalomas coastal-dune ecosystem is affected by an important touristic pressure and, specifically, the lagoon is characterized by significant concentrations of inorganic and organic matter derived from the seabed and heavy rains. High concentrations of chlorophyll and materials directly affect nutrient dynamics, phytoplankton productivity and the presence of aquatic vegetation [17].
In summary, contributions are two-fold. On one hand, regarding the most accurate correction methods applied to VHRMS satellite data and, on the other hand, a comparative assessment of multiplatform (satellite, aircraft and drone) remote sensing imagery to obtain accurate, high resolution water quality parameters, specifically Chl-a, in complex inner water areas.
This paper is structured as follows: first, we present the study area, as well as the satellite, airborne, drone and in situ data used; next, we detail the processing methodology for the mapping of water quality parameters using multiplatform multispectral and hyperspectral data; then, the main results are included; finally, we highlight the central conclusions.

2. Methodology

2.1. Study Area

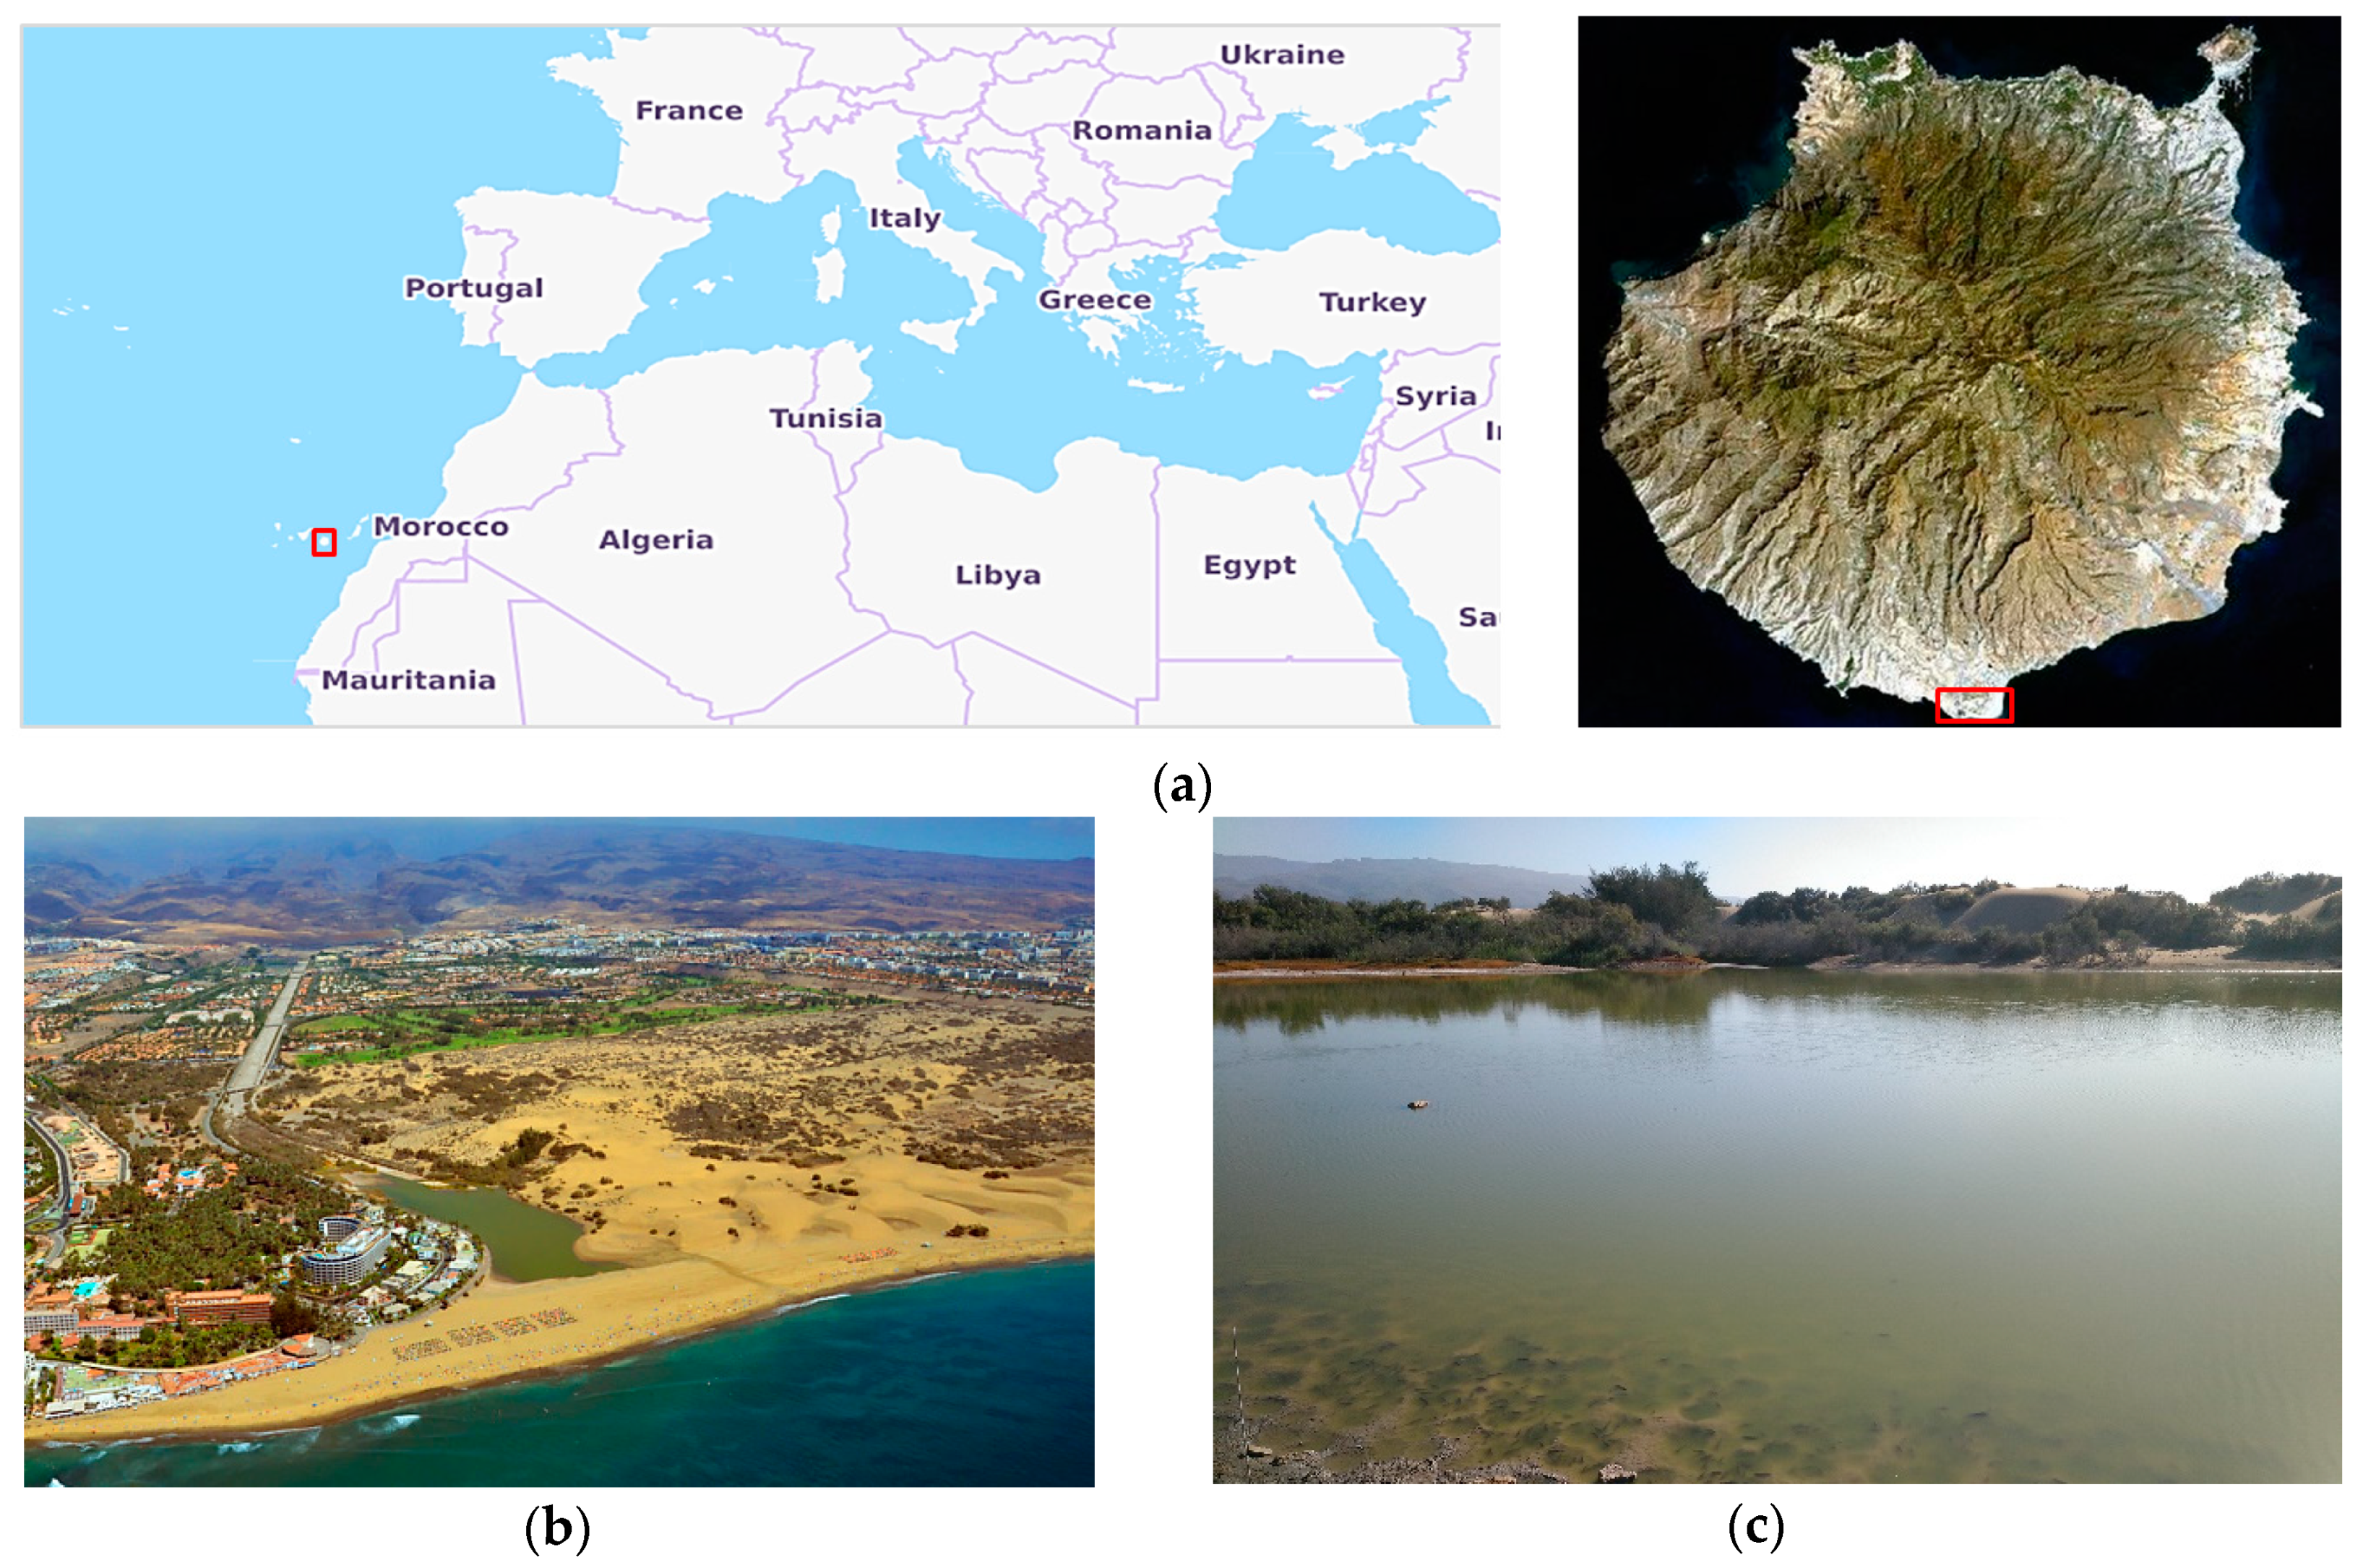
The Natural Reserve of Maspalomas, located in the south of Gran Canaria, is 403.9 hectares and includes a system of mobile dunes and a small lagoon known as “la Charca de Maspalomas” (Figure 1). The Maspalomas lagoon was formed when the flow from the Fataga ravine decreased due to climate change. This small lagoon combines salt water with that from the underground streams of the ravine and occasional runoffs, forming a unique ecosystem in the Canary Islands. The breakdown of the ecological balance of this area has triggered the disappearance or decrease of both animal and plant species, caused by the surrounding buildings, wastewater effluents, canyon canalization and transit of tourists and vehicles [18]. Therefore, the huge amount of tourists (2 million visitors each year) exerts a very high anthropic effect on this vulnerable ecosystem.
As show in Figure 1, “La Charca de Maspalomas” is considered a breathtaking oasis with an outstanding floristic and ornithological richness. One of the main characteristics of this ecosystem is its seasonality, with large variations in the salinity and volume of water, as well as in its levels of phytoplankton, dissolved and suspended matter. For this reason, within the framework of this research, a detailed study of water quality has been carried out in the water lagoon´s natural ecosystem with the latest technology using high-resolution images gathered by multiple sensors on board satellites, airplanes and drones, as well as field measurements.

2.2. Multisensor Remotely Sensed and In Situ Field Data

Satellite data obtained from the WorldView multispectral sensor were planned to be acquired at the same time as the airborne and drone overflights. Thus, VHR WorldView-3 (WV-3) satellite imagery was considered in the analysis. The level 2 ortho-ready product has been used, with a radiometric resolution of 11 bits and a spatial resolution of 1.8/1.6 m, at the nadir, for the eight multispectral bands (0.400–1.040 µm), as provided in Table 1 [19].
The flight campaign of 2 June 2017 used the INTA C-212 aircraft, which was equipped with the Airborne Hyperspectral Scanner (AHS). This radiometer records data with 12-bits resolution and covers the 0.43 to 12.8 µm range with 80 channels. In our study, which focuses on water areas, only the first 20 channels were used, covering the visible and near infrared (VIS-NIR) bands from 0.43 to 1.015 µm, with 2.5 m spatial resolution [20].
Finally, drone flights were performed on 4 June 2018 and 23 July 2019. In this case, the PIKA-L sensor was configured to have a spatial resolution of 10 cm × 10 cm, using 150 channels in the range 400–1000 nm, with a bandwidth of 4 nm. Table 1 includes a summary of the spectral and spatial characteristics of the multiplatform sensors.
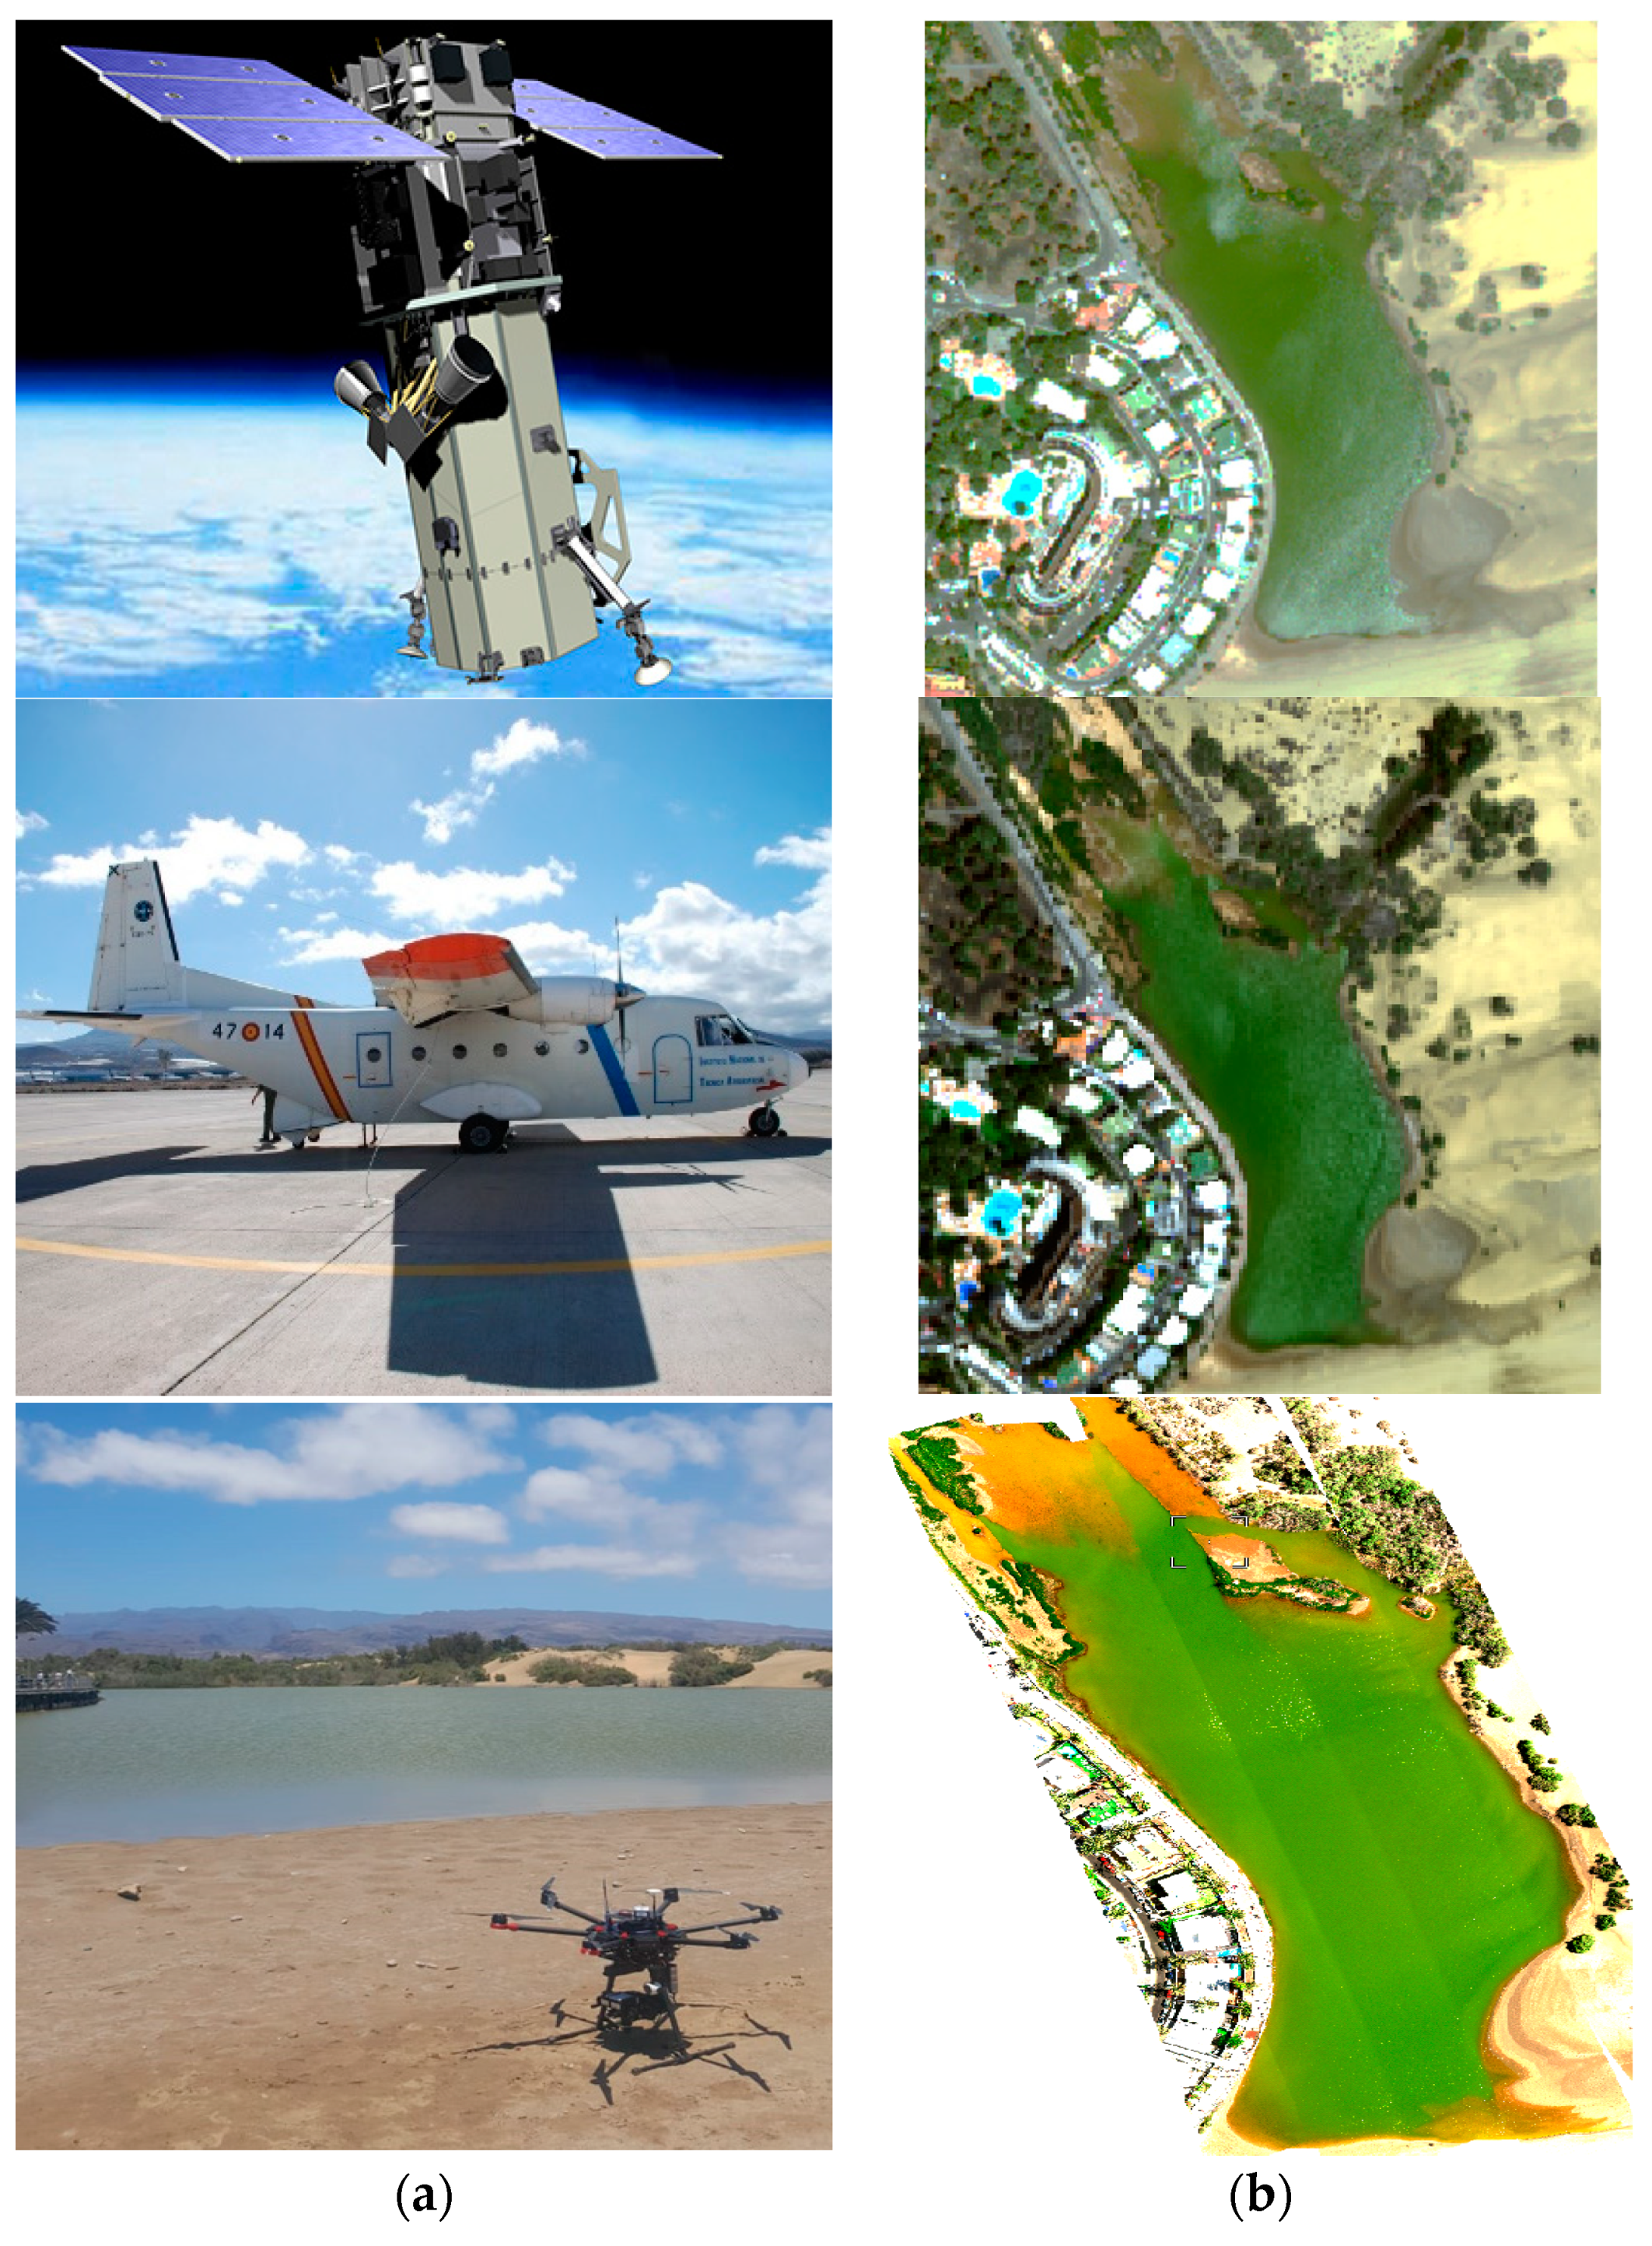
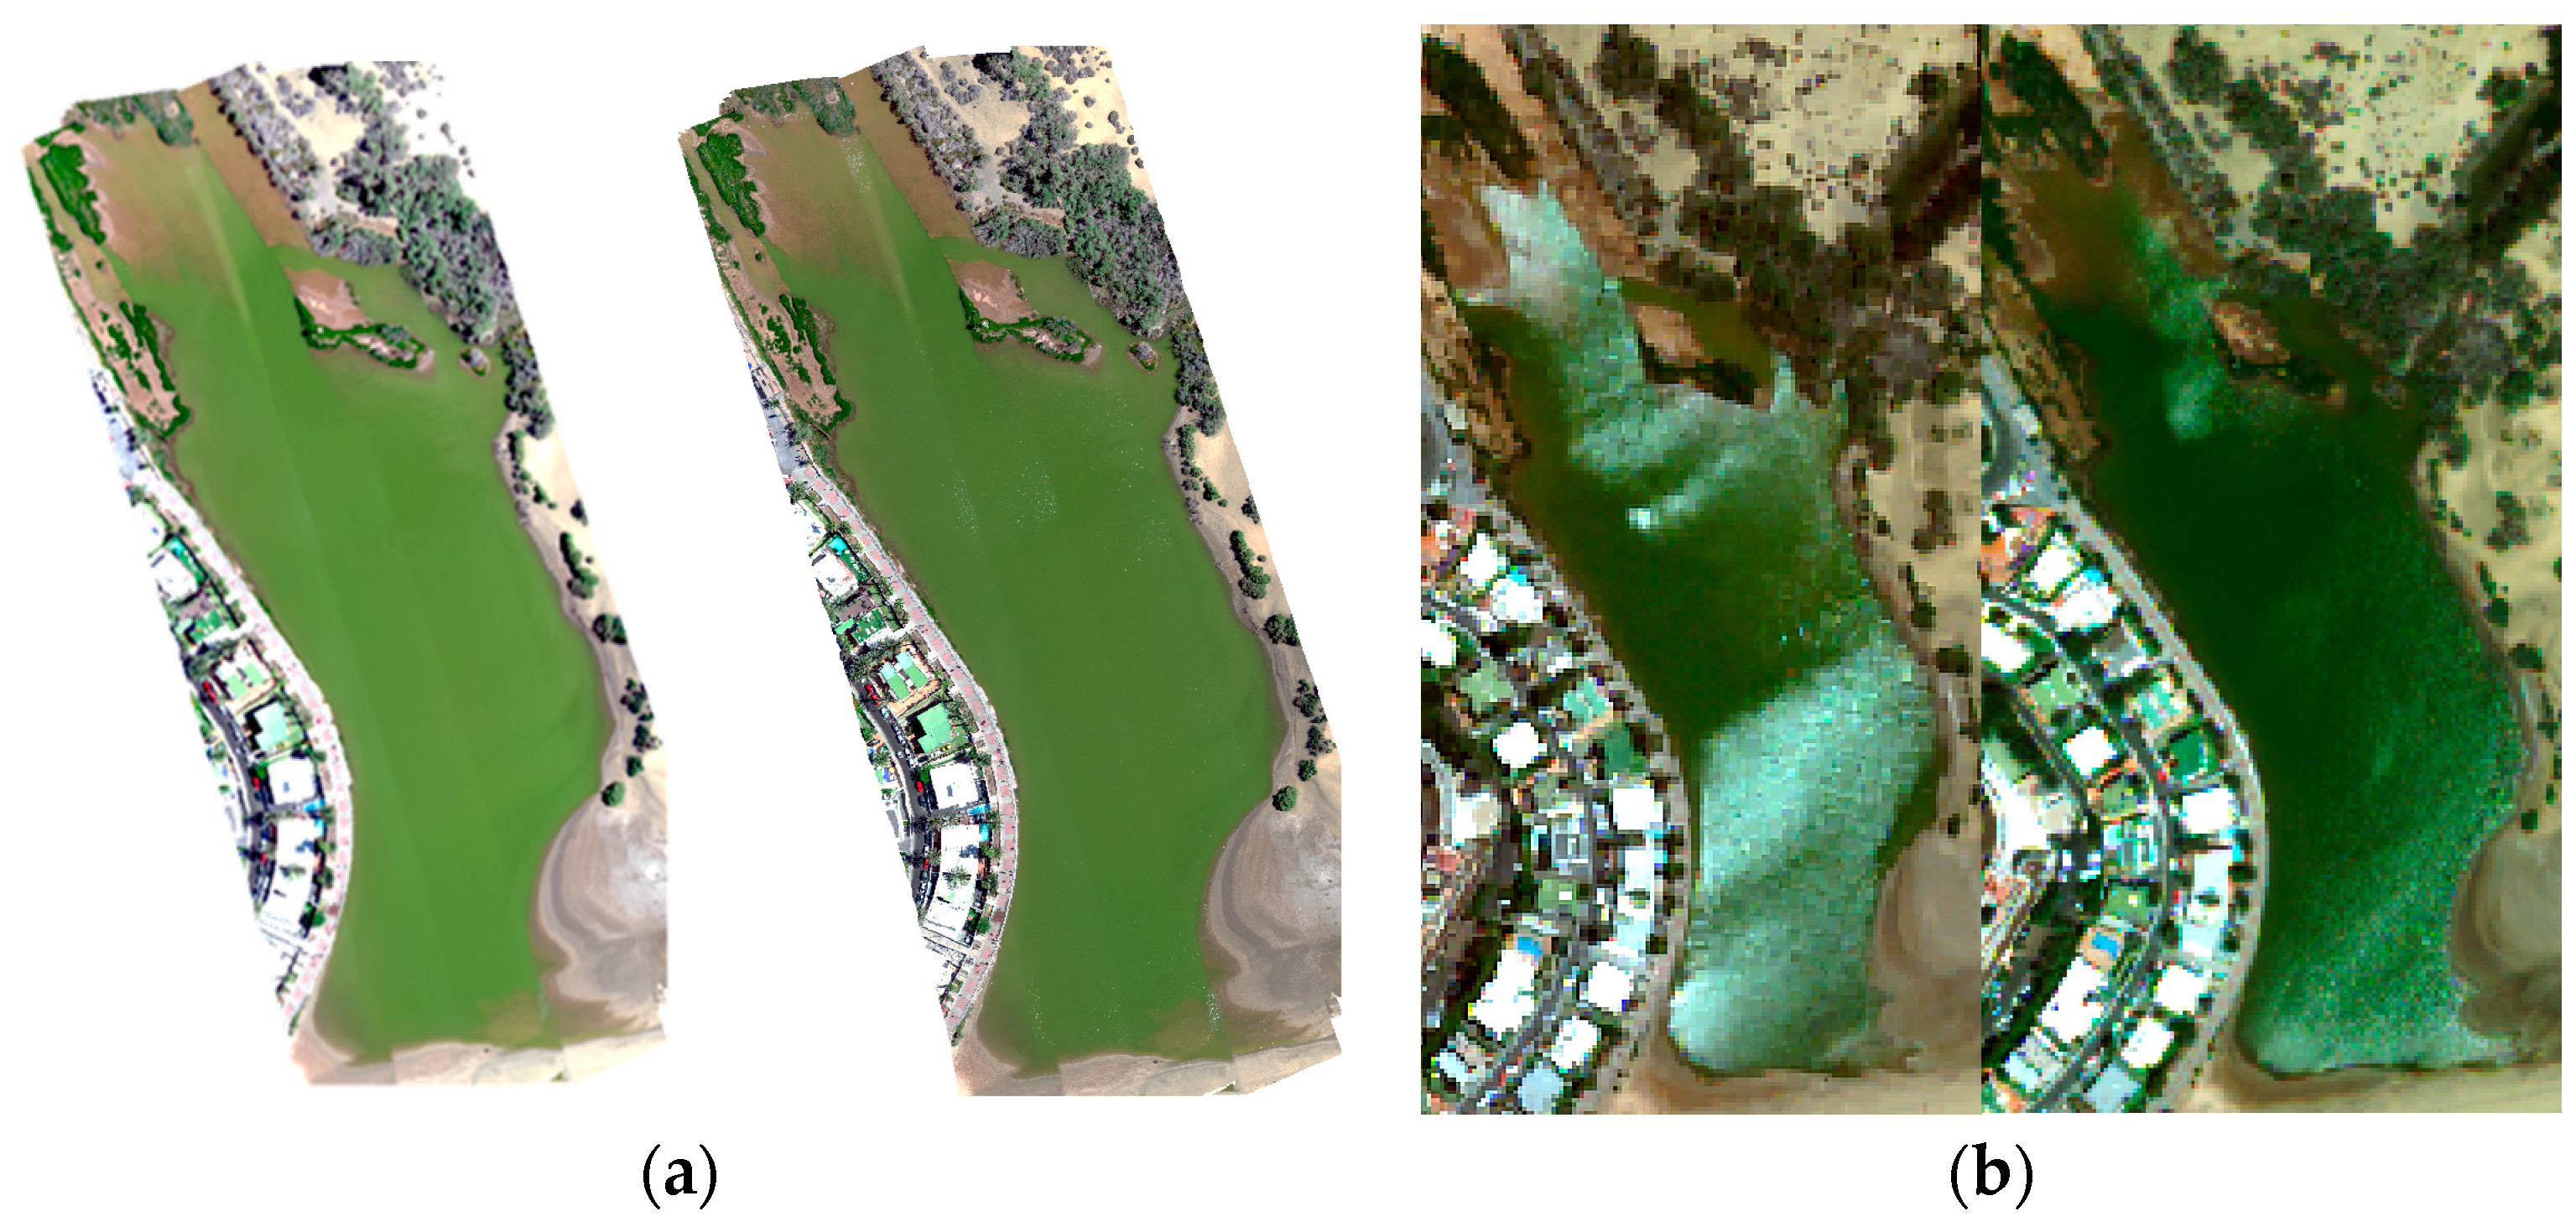
Figure 2 shows the remote sensing platforms and the corresponding imagery of the Maspalomas lagoon water ecosystem. Specifically, Figure 2a highlights the multiplatform Earth observation systems used in this study, while Figure 2b shows the Worldview, AHS and drone true color composite imagery of the study area processed in this work, respectively.
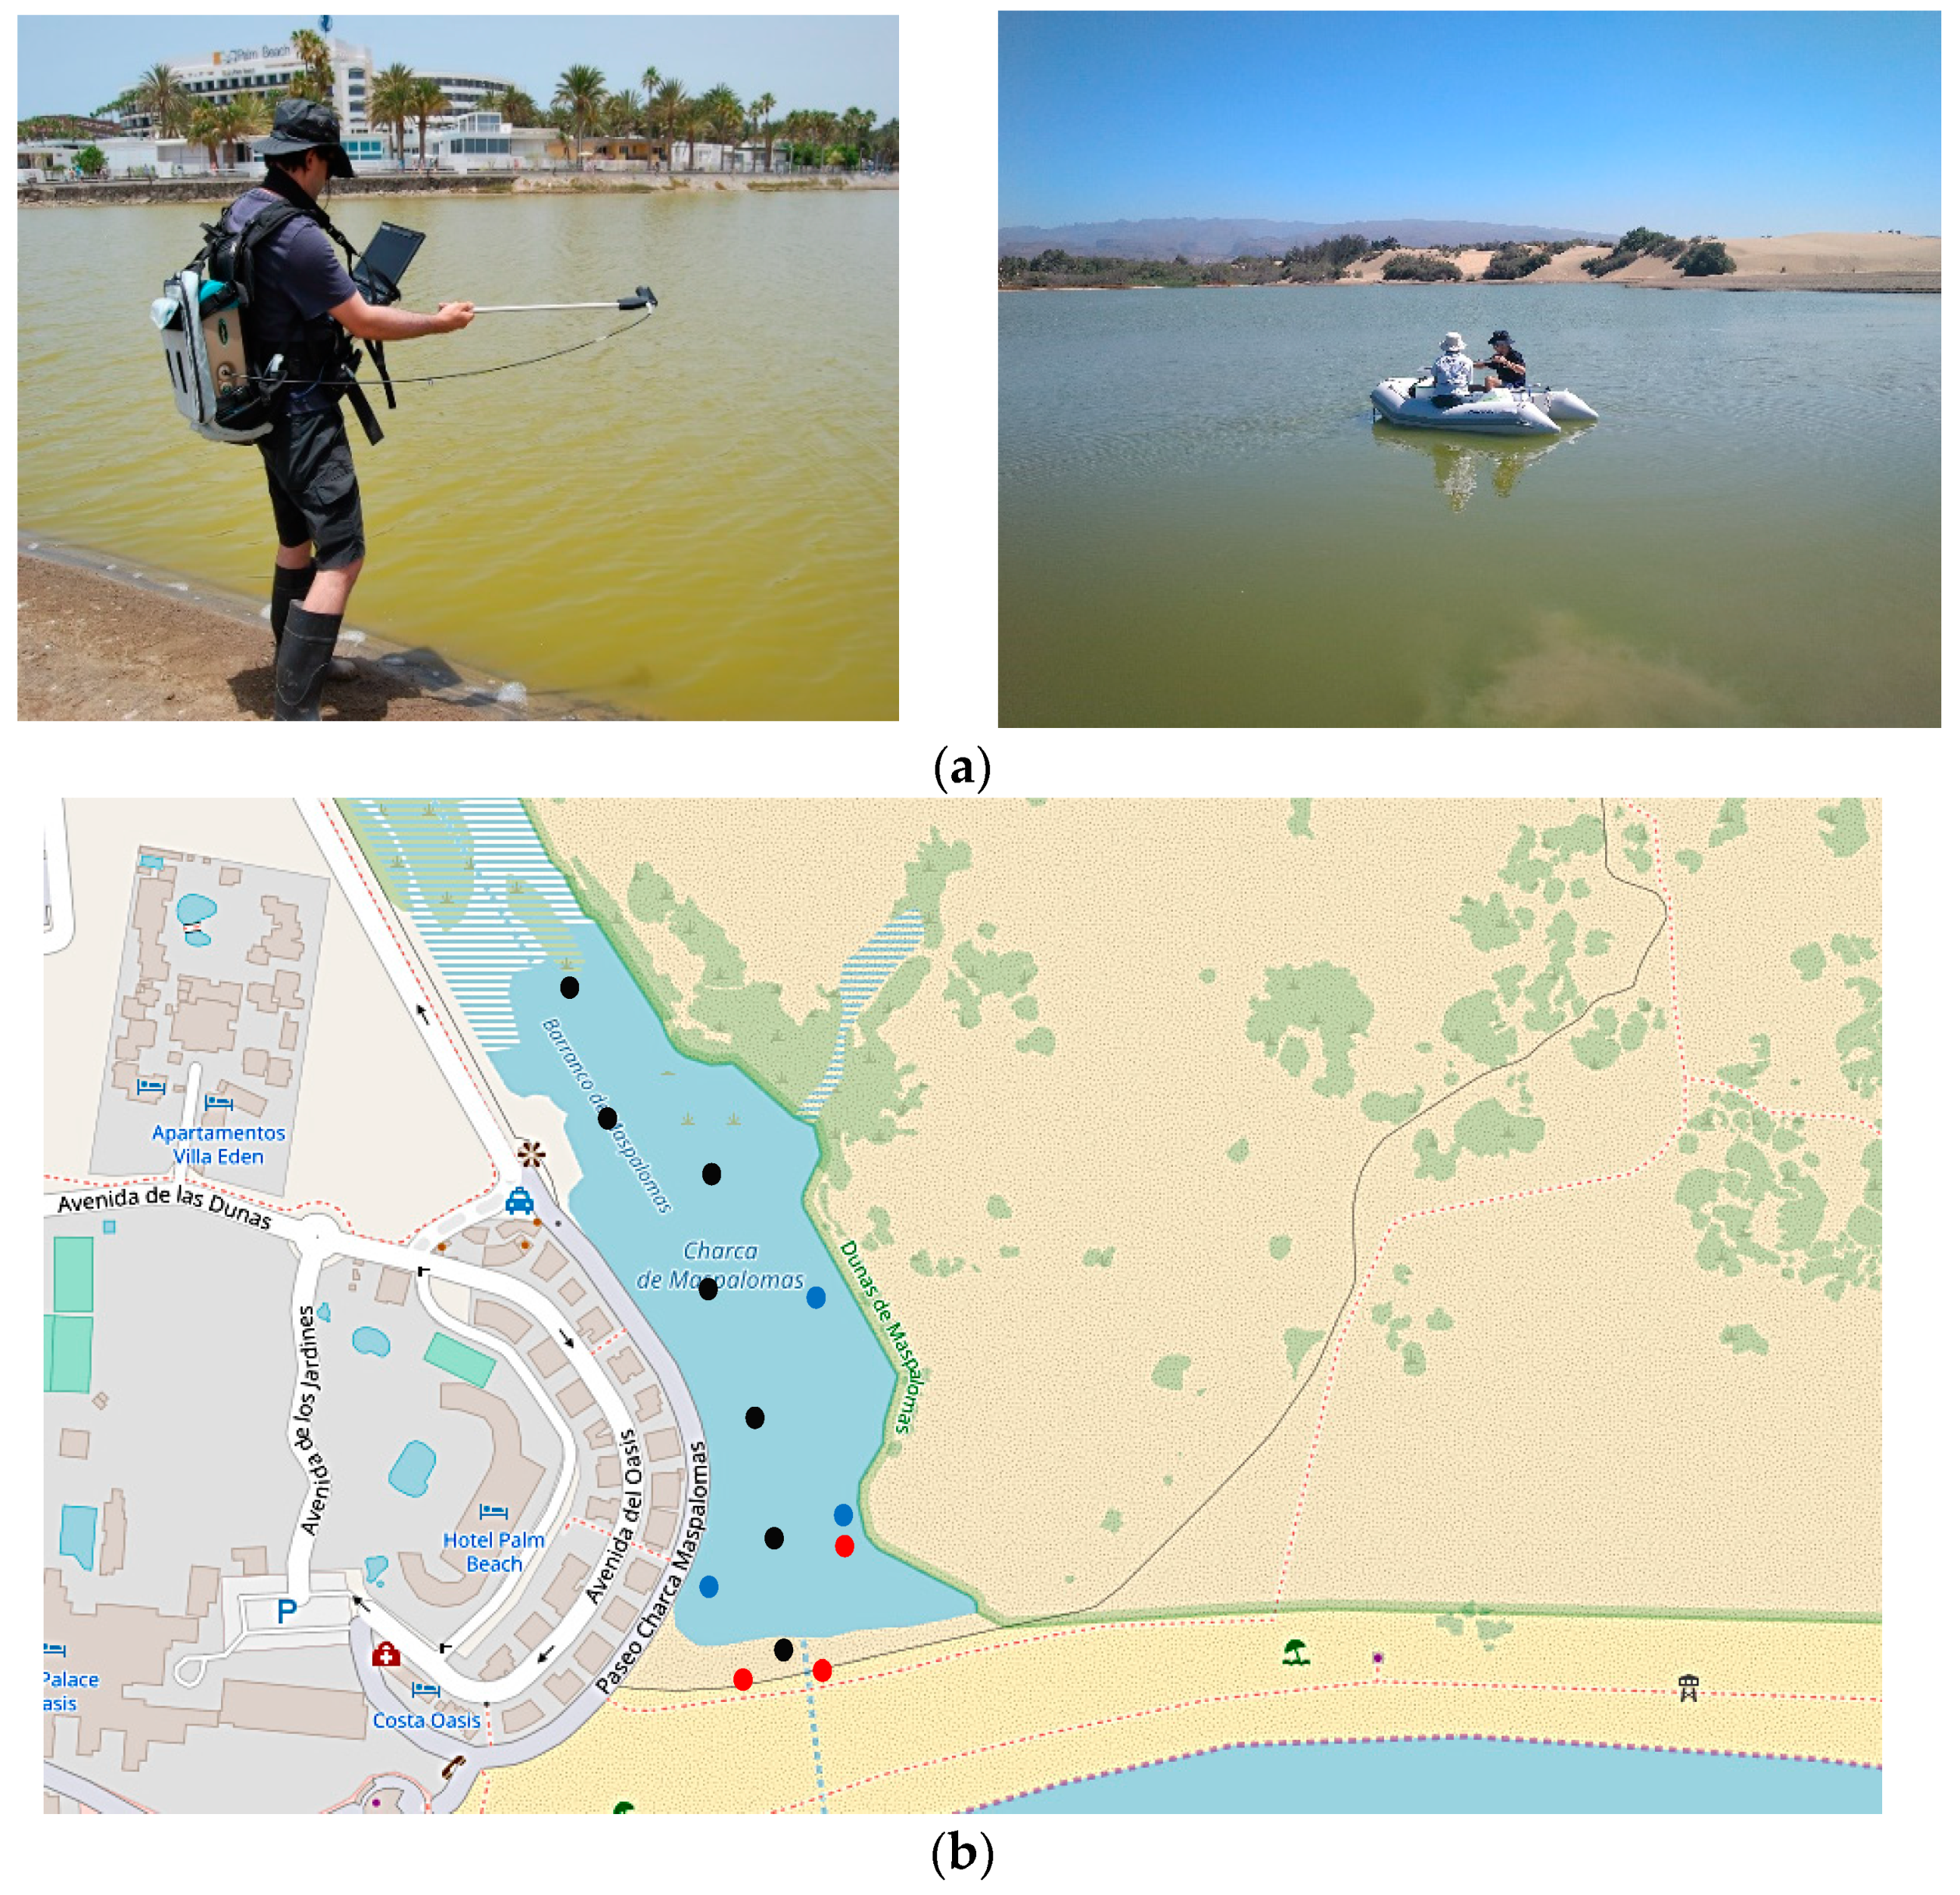
In situ field data was acquired simultaneously to the AHS and drone campaigns. Due to access restrictions to the area of interest, during the first campaigns, only locations near the shore could be sampled. Specifically, the following campaigns were performed (see Figure 3 and Table 2):
  • In June 2017, in situ data was acquired simultaneously to the AHS campaign. As shown in Figure 3, a total of three points were sampled at three different depths to measure water quality parameters (red points) using an IDRONAUT multiparameter probe. Precise information about the latitude, longitude and time were provided by a Trimble DSM132 Global Navigation Satellite System(GNSS) receiver. Additional sites monitored during 2015 were also used in the analysis. During the 2017 campaign, reflectance measurements were collected using the ASD FieldSpec3 precision radiometer. The procedure described in [21] was followed, measuring the radiance emanating from the water surface at a zenith angle between 30° and 50° and with an azimuth angle between 90° and 180° relative to the sun’s azimuth. The procedure was replicated five times and the mean and standard deviation value were derived. A MICROTOPS II solar light meter was also used and a subsequent processing was performed to get the reflectance [22].
  • In June, 2018, another field campaign was performed along with a drone flight. As shown in Figure 3, a total of three points were sampled (blue points) near to the lagoon shore measuring turbidity, chlorophyll-a/b and carothenoids using a Hydrolab HL4 multiparameter probe. A HYPER-V GNSS was used to get the time and precise coordinates.
  • During July, 2019, in situ data was also collected simultaneously to the drone flight. A total of seven points were sampled (black in Figure 3); however, for the two locations in the center of the lagoon, samples at two depths were collected. In this campaign, more specific water parameters were measured; specifically, Chl-a, Chl-b, turbidity, CDOM, carotenoids, phycobiliproteins and functional groups of planktonic microalgae. In addition, bathymetry and the geographic coordinates and time of each sampled were obtained.

2.3. Multiplatform Water Quality Monitoring

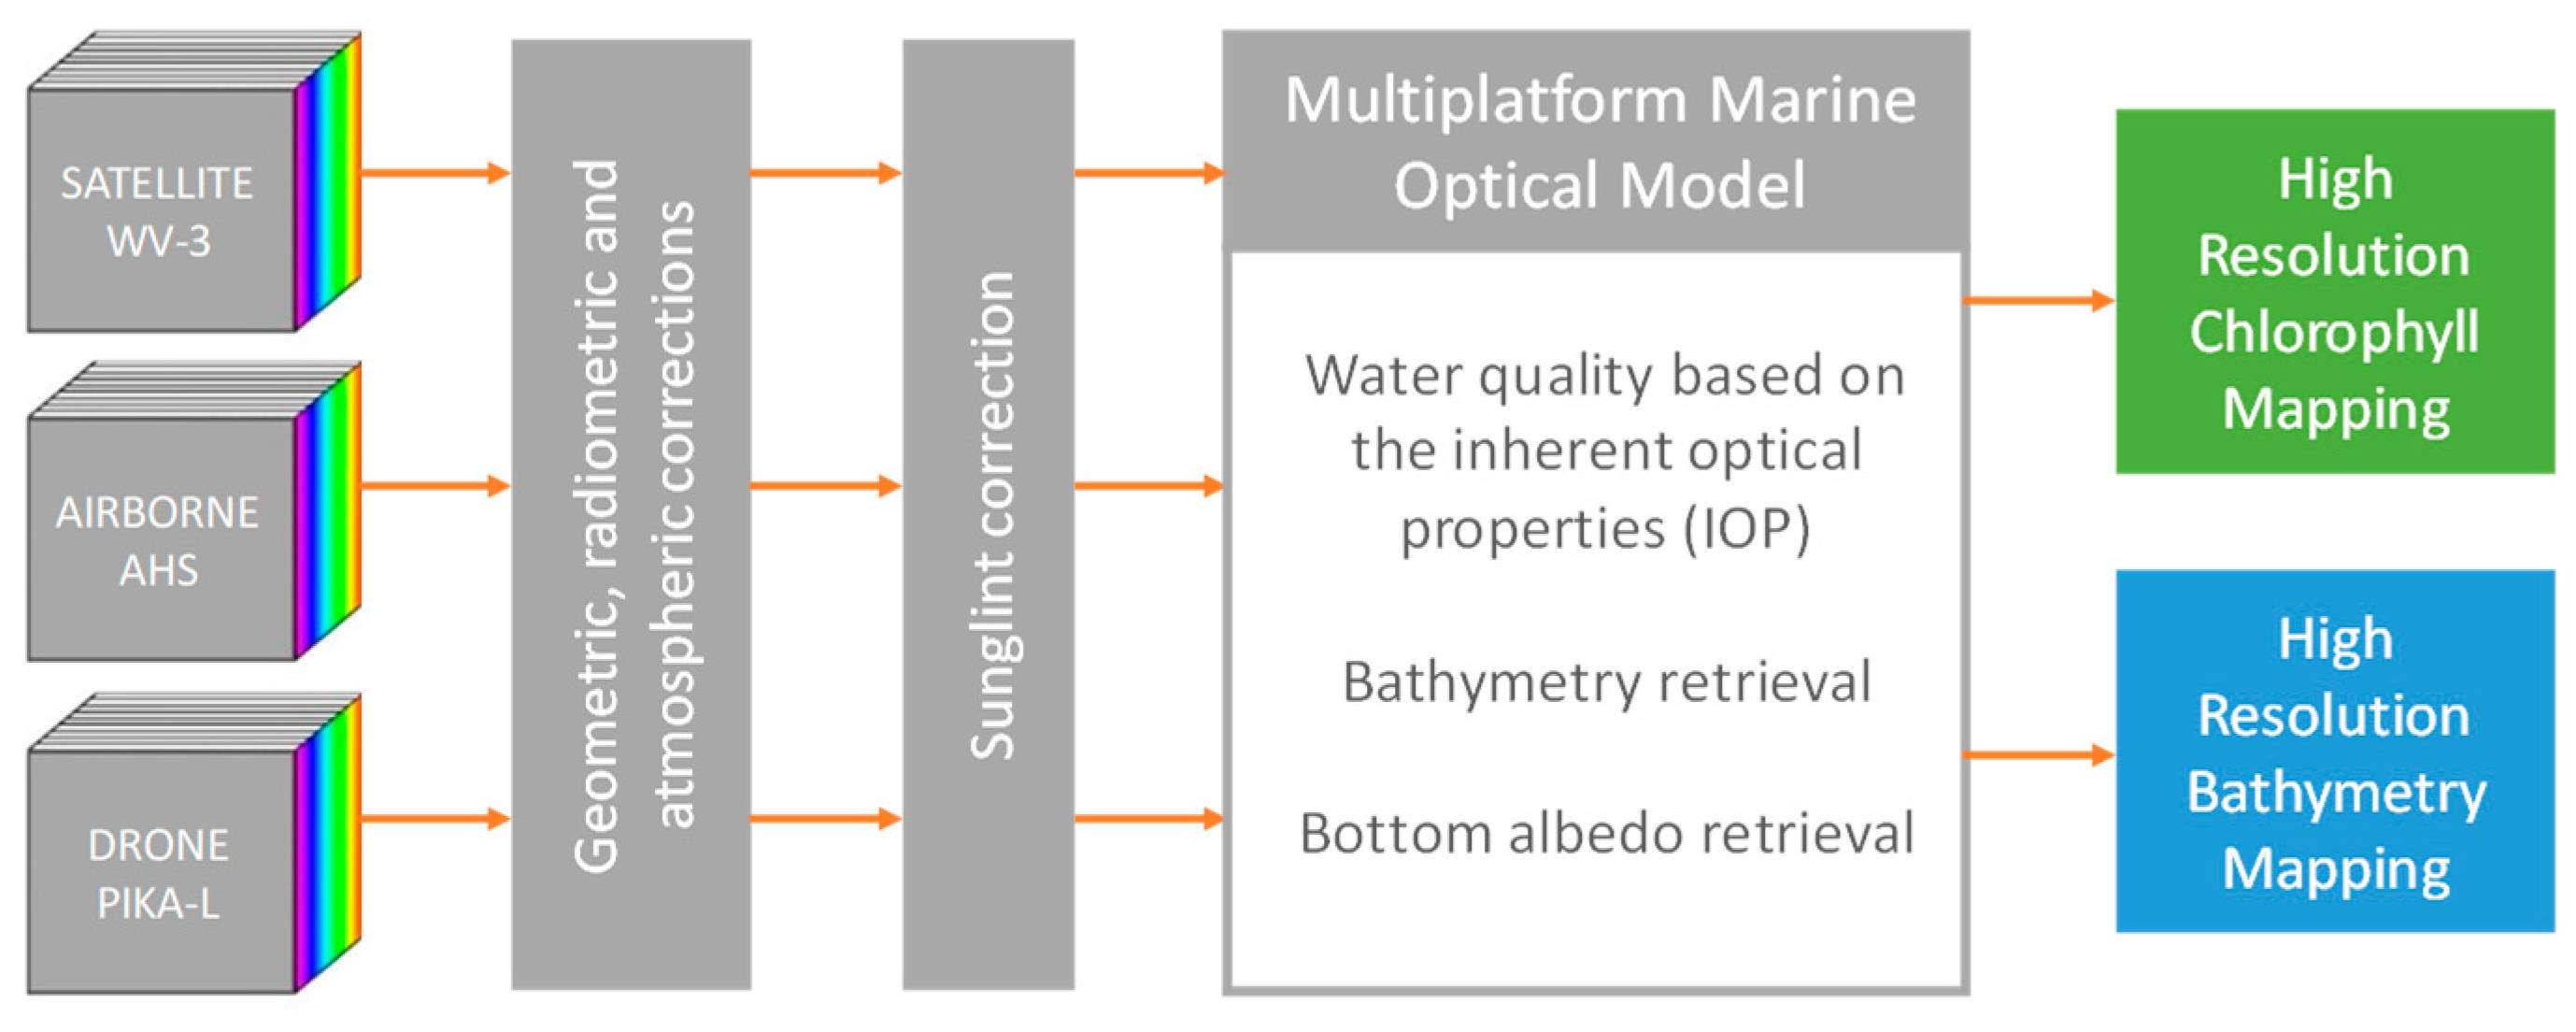
The overall processing protocol to generate high resolution water quality parameters for multiplatform imagery is presented in Figure 4. This work deals exclusively with the water quality monitoring; thus, the retrieval and evaluation of the high resolution bathymetry has not been addressed. Next, the different steps involved are described in more detail.

2.3.1. Radiometric and Atmospheric Corrections

Advanced Earth observation platforms and sensors, with enhanced capabilities, can contribute relevant and accurate information for the sustainability of vulnerable water ecosystems [23]. In particular, Worldview-2/3 platforms offer VHR imagery with additional VIS-NIR spectrum channels not included in former high resolution satellites (i.e., Geoeye, Quickbird, Ikonos, KOMPSAT, Pleiades etc.). Unfortunately, the energy collected by space sensors is influenced by atmospheric disturbances that hinders the accuracy at surface level. On the other hand, the new hyperspectral high-resolution instruments in airborne platforms, with new spectral bands, as well as the ability of some platforms to modify their sensing angle has highlighted the need to address atmospheric effects [20].
As the mapping of water areas is challenging, due to the low signal-to-noise received at sensor level, as a consequence of the minimum reflectance of water surfaces and atmospheric effects, precise preprocessing algorithms have to be applied in order to correct limitations in the sensor calibration, solar illumination geometry and viewing effects, as well as the atmospheric and sunglint disturbances.
Furthermore, as previously indicated, in bodies of water, radiometric and atmospheric corrections are fundamental steps in the VHR satellite data preprocessing protocol due to the low signal reaching the sensor from water surfaces. However, in some environments such as very shallow inner-lakes, radiance leaving the water surface may be considerably higher as a result of the dissolved and suspended matter back-scattering and the bottom albedo. Consequently, applying models developed for open ocean or coastal waters to remote sensing imagery often provide erroneous estimates and, therefore, complex atmospheric correction algorithms are required for inner shallow waters [24,25].
Specifically, in Eugenio et al. [10] for the Maspalomas lagoon ecosystem, a comparison was performed between the estimated reflectivity, provided by the application of different atmospheric correction algorithms, and the real reference spectral signature measured with a spectroradiometer, acquired at the time of the satellite overflight. It was demonstrated that model-based algorithms properly correct the atmospheric disturbances.
After a comprehensive assessment (see results section), for the WorldView-2/3 imagery we have selected the FLAASH (Fast Line-of-sight Atmospheric Analysis of Spectral Hypercubes) atmospheric model properly adapted to the multispectral satellite channels. On the other hand, for the airborne AHS data, ATCOR-4 (Atmospheric CORrection) was selected to correct atmospheric and illumination disturbances. Finally, atmospheric corrections were not applied to the drone Pika-L hyperspectral imagery. The following is a brief description of the atmospheric models used in the Maspalomas lagoon.
FLAASH [26] derives its physics-based model from the MODTRAN-4 radiative code. FLAASH estimates the reflectance at the surface by removing the absorption and scattering disturbances by:
L T O A = ( A ρ S U 1 ρ e S ) + ( B ρ e 1 ρ e S ) + L o
where A , B , S and L o are determined from the MODTRAN-4 simulations for the selected model of atmosphere (maritime, in our case). S is the spherical albedo, L o is the radiance backscattered by the atmosphere, and A , and B are coefficients related to the geometric and atmospheric conditions. ρ S U is the surface reflectance, ρ e is the mean surface reflectance for the pixel and adjacent regions. The first term in (1) refers to the direct radiation reaching the sensor from the surface, while the second term relates to the radiance received by the sensor coming from the surface that is scattered by the atmosphere.
ATCOR-4 is used for atmospheric correction of sensors flying at altitudes up to 20 km and the database was compiled with the MODTRAN-5 radiative transfer code, covering a wide range of weather conditions and sun angles. The spectral sampling distance is 0.4 nm, equidistant over the range from 350 nm to 2550 nm. Regarding the accuracy of the method, in the solar region and assuming the terrain is flat, the estimated surface reflectance errors range between ±2% (reflectance < 10%) and ±4% (reflectance > 40%). For rugged terrain, accuracy depends on different parameters such as the spatial resolution of the digital elevation model or the ortho-rectification precision [20,27].
For the ATCOR algorithm, also based on MODTRAN-4, the surface reflectance, without taking into account the adjacency effect, is found by:
ρ S U = 1 a 1 ( d 2 π L T O A E T O A cos θ i a 0 )
where a 0 and a 1 coefficients are obtained from the estimation of the main atmospheric parameters: water vapor column, aerosol type and optical thickness.
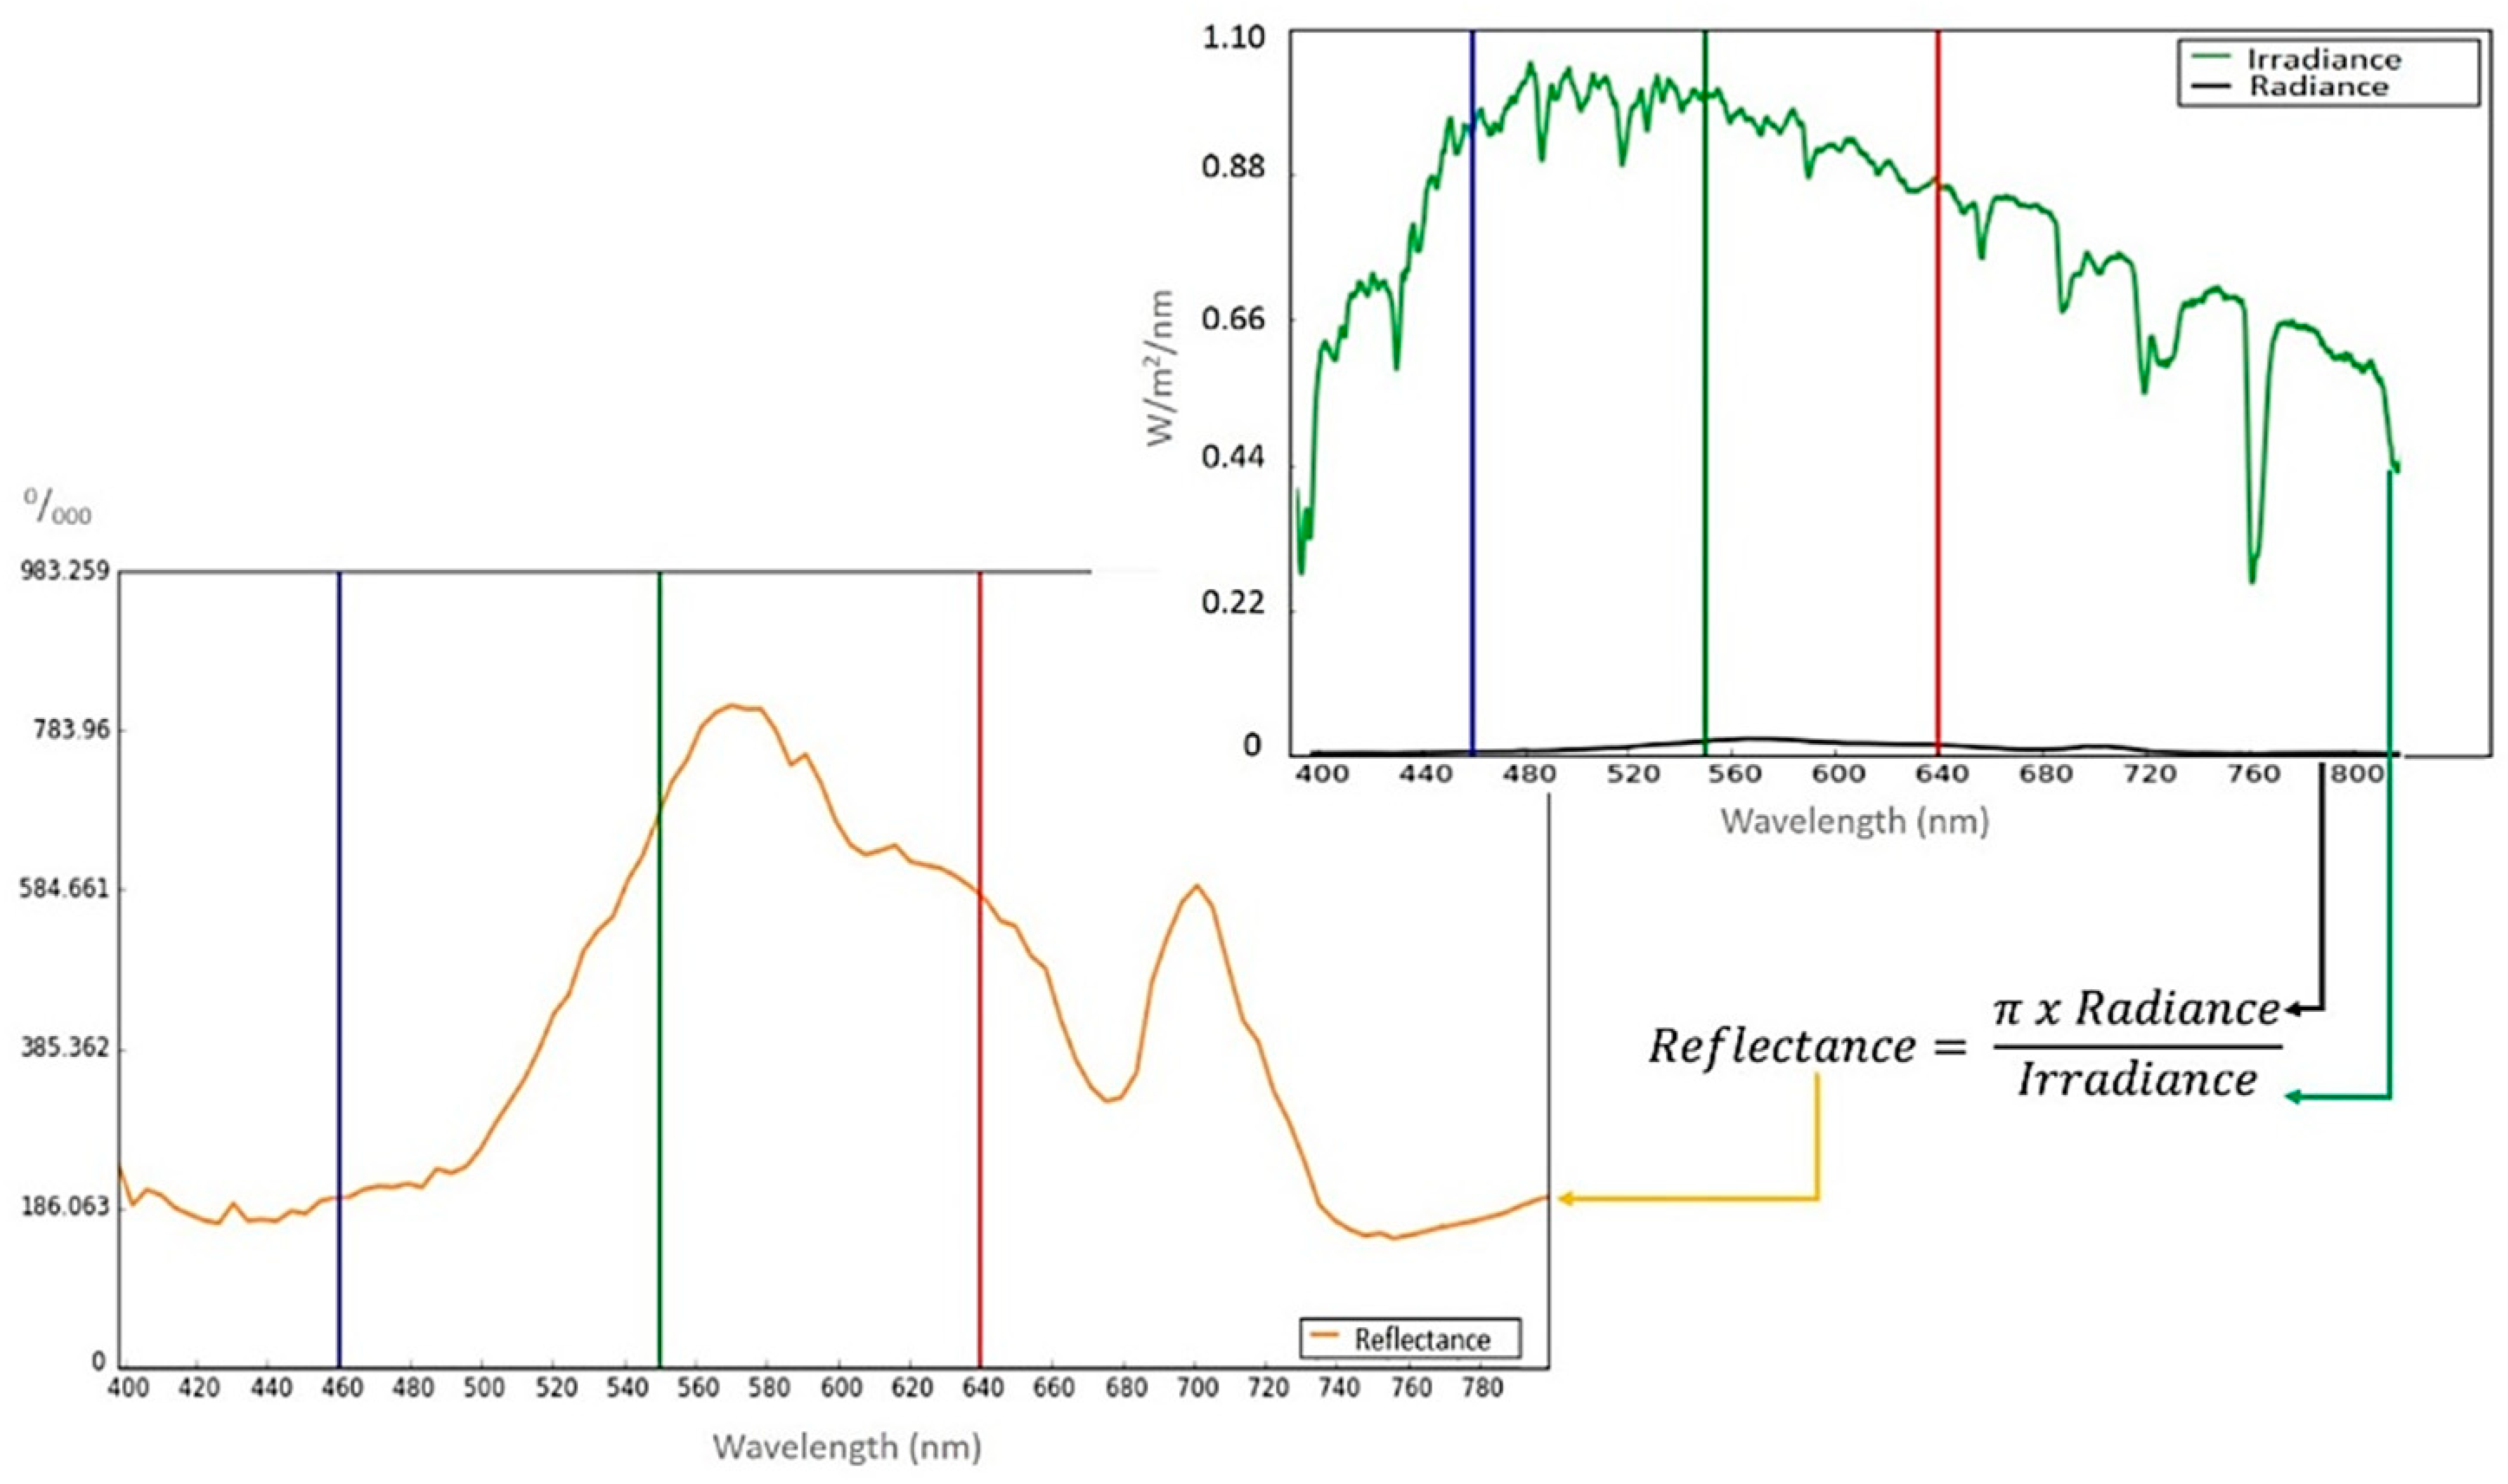
As indicated, for the drone-carried hyperspectral system, the flight altitude is around 100 m, so as to simplify the atmospheric correction process using the hypothesis that the irradiance at the height of the drone is equal to the irradiance reaching the Earth’s surface. In order to obtain the irradiance measurement, the drone carries a radiometer that points to the zenith with a cosine integrator, calculating the total irradiance in the 400–1000 nm range. With the information of the radiance and irradiance sensed simultaneously, we can get the reflectivity easily and with great accuracy (see Figure 5).

2.3.2. Water Column Modeling and Chlorophyll-A Estimation

For bodies of water, reflectivity recorded by the sensor, once the atmospheric effects are corrected, is gathered by two sources: the specular reflection of the surface of the water and the light backscattered contributed by the water column. Only the upward reflectivity of the water column provides information about the physic-optical phenomena produced within the aquatic environment. In coastal areas these phenomena can be modeled by the inherent optical properties (IOPs) of the water and modeling the bottom albedo taking into account its depth [28,29,30]. The complete expression of the radiative model is:
r r s m ( λ ) r r s , m ( λ ) ( 1 e [ 1 μ s s w + D u c μ v s w ] k d z ) + ρ a l b ( λ ) π e [ 1 μ s s w + D u b μ v s w ] k d z
where r r s m ( λ ) is the modeled reflectance below the sea surface, r r s , m ( λ ) is the reflectance below the sea surface for deep waters, ρ a l b ( λ ) is the seafloor albedo considering the Lambertian hypothesis, z represents the bathymetry, k d is the diffuse attenuation coefficient of the water, μ s s w is the cosine of the solar inclination angle and μ v s w is the cosine of the sensor vision angle and, finally, D u c is the light diffusion ascending factor due to the water backscattering, while D u b is due to the the bottom albedo.
The model variables related to the coastal bottom are both the bottom albedo and the bathymetry, where the albedo is generated by a linear mixing of representative benthic area classes [31]:
ρ a l b ( λ ) = i = 1 n e m a b u i b e n t o i ( λ )
where a b u i is the abundance of the benthic class i, b e n t o i is the reflectivity of the benthic class i and n e m is the number of benthic classes considered in the model. On the other hand, the parameters related to the inherent properties of water and, therefore, the elements in solution and suspension found in the water are r r s , m and k d . The diffuse attenuation is the sum of the water absorption ( a ) and backscatter ( b b ) :
k d = a + b b
r r s , m is computed from the Gordon parameter u [32]:
u = b b a + b b
Albert and Mobley [33] proposed the following equation for the calculation of the r r s m parameter, where the sun and sensor angles are also taken into account:
r r s , m = 0.0512 u ( 1 + 4.6659 u 7.8387 u 2 + 5.4571 u 3 ) ( 1 + 0.1098 μ s s w ) ( 1 + 0.4021 μ v s w )
Finally, absorption and backscattering results from contributions from the water plus the sum of the different elements in solution and suspension are:
a = a w + a p + a g d
b b = b b w + b b p
where a w is the absorption of water molecules, a p the phytoplankton absorption, a g d the joint absorption of dissolved matter and detritus, b b w is the molecular backscattering of water (Rayleigh scattering) and b b p is the backscattering of suspended matter (Mie scattering). While a w and b b w are known values, the other values depend on the concentration of the different elements (phytoplankton concentration P, dissolved matter concentration and detritus G and particulate matter concentration M). In this way, we can propose a non-linear system of equations with as many equations as available spectral bands in the image and with as many variables as the modeled parameters ( P ,   G ,   M ,   z ,   N a b u ).
Each of these equations will match the sensor bands by integrating the result of the equation across the entire bandwidth:
r r s m ( b a n d i ) = λ i n i λ e n d r r s m ( λ ) B a n d P a s s i ( λ ) = f ( P ,   G ,   M ,   z ,   N a b u )
where B a n d P a s s ( λ ) is the normalized bandpass filter of each sensor channel. Integration is performed with 5 nm deltas for multispectral bands, while monochromatic is assumed for hyperspectral sensor bands.
To solve the model variables, it is necessary to compare the modeled reflectivity r r s m with the measured reflectivity r r s . For this, we have to convert the water surface into r r s . First we must eliminate the specular brightness of the water using the following equation, as studied in Martin et al. [9]:
ρ ( b a n d i ) = ρ g l i n t ( b a n d i ) I d i r ( b a n d i ) I d i r ( N I R ) ( ρ g l i n t ( N I R ) ρ g l i n t m ( N I R ) )
where ρ g l i n t ( b a n d i ) is the surface reflectivity of band i affected by the specular brightness, I d i r ( b a n d i ) is the direct irradiance of band i, I d i r ( N I R ) is the irradiance of the NIR band and ρ g l i n t m ( N I R ) is the surface reflectivity of the modeled NIR band.
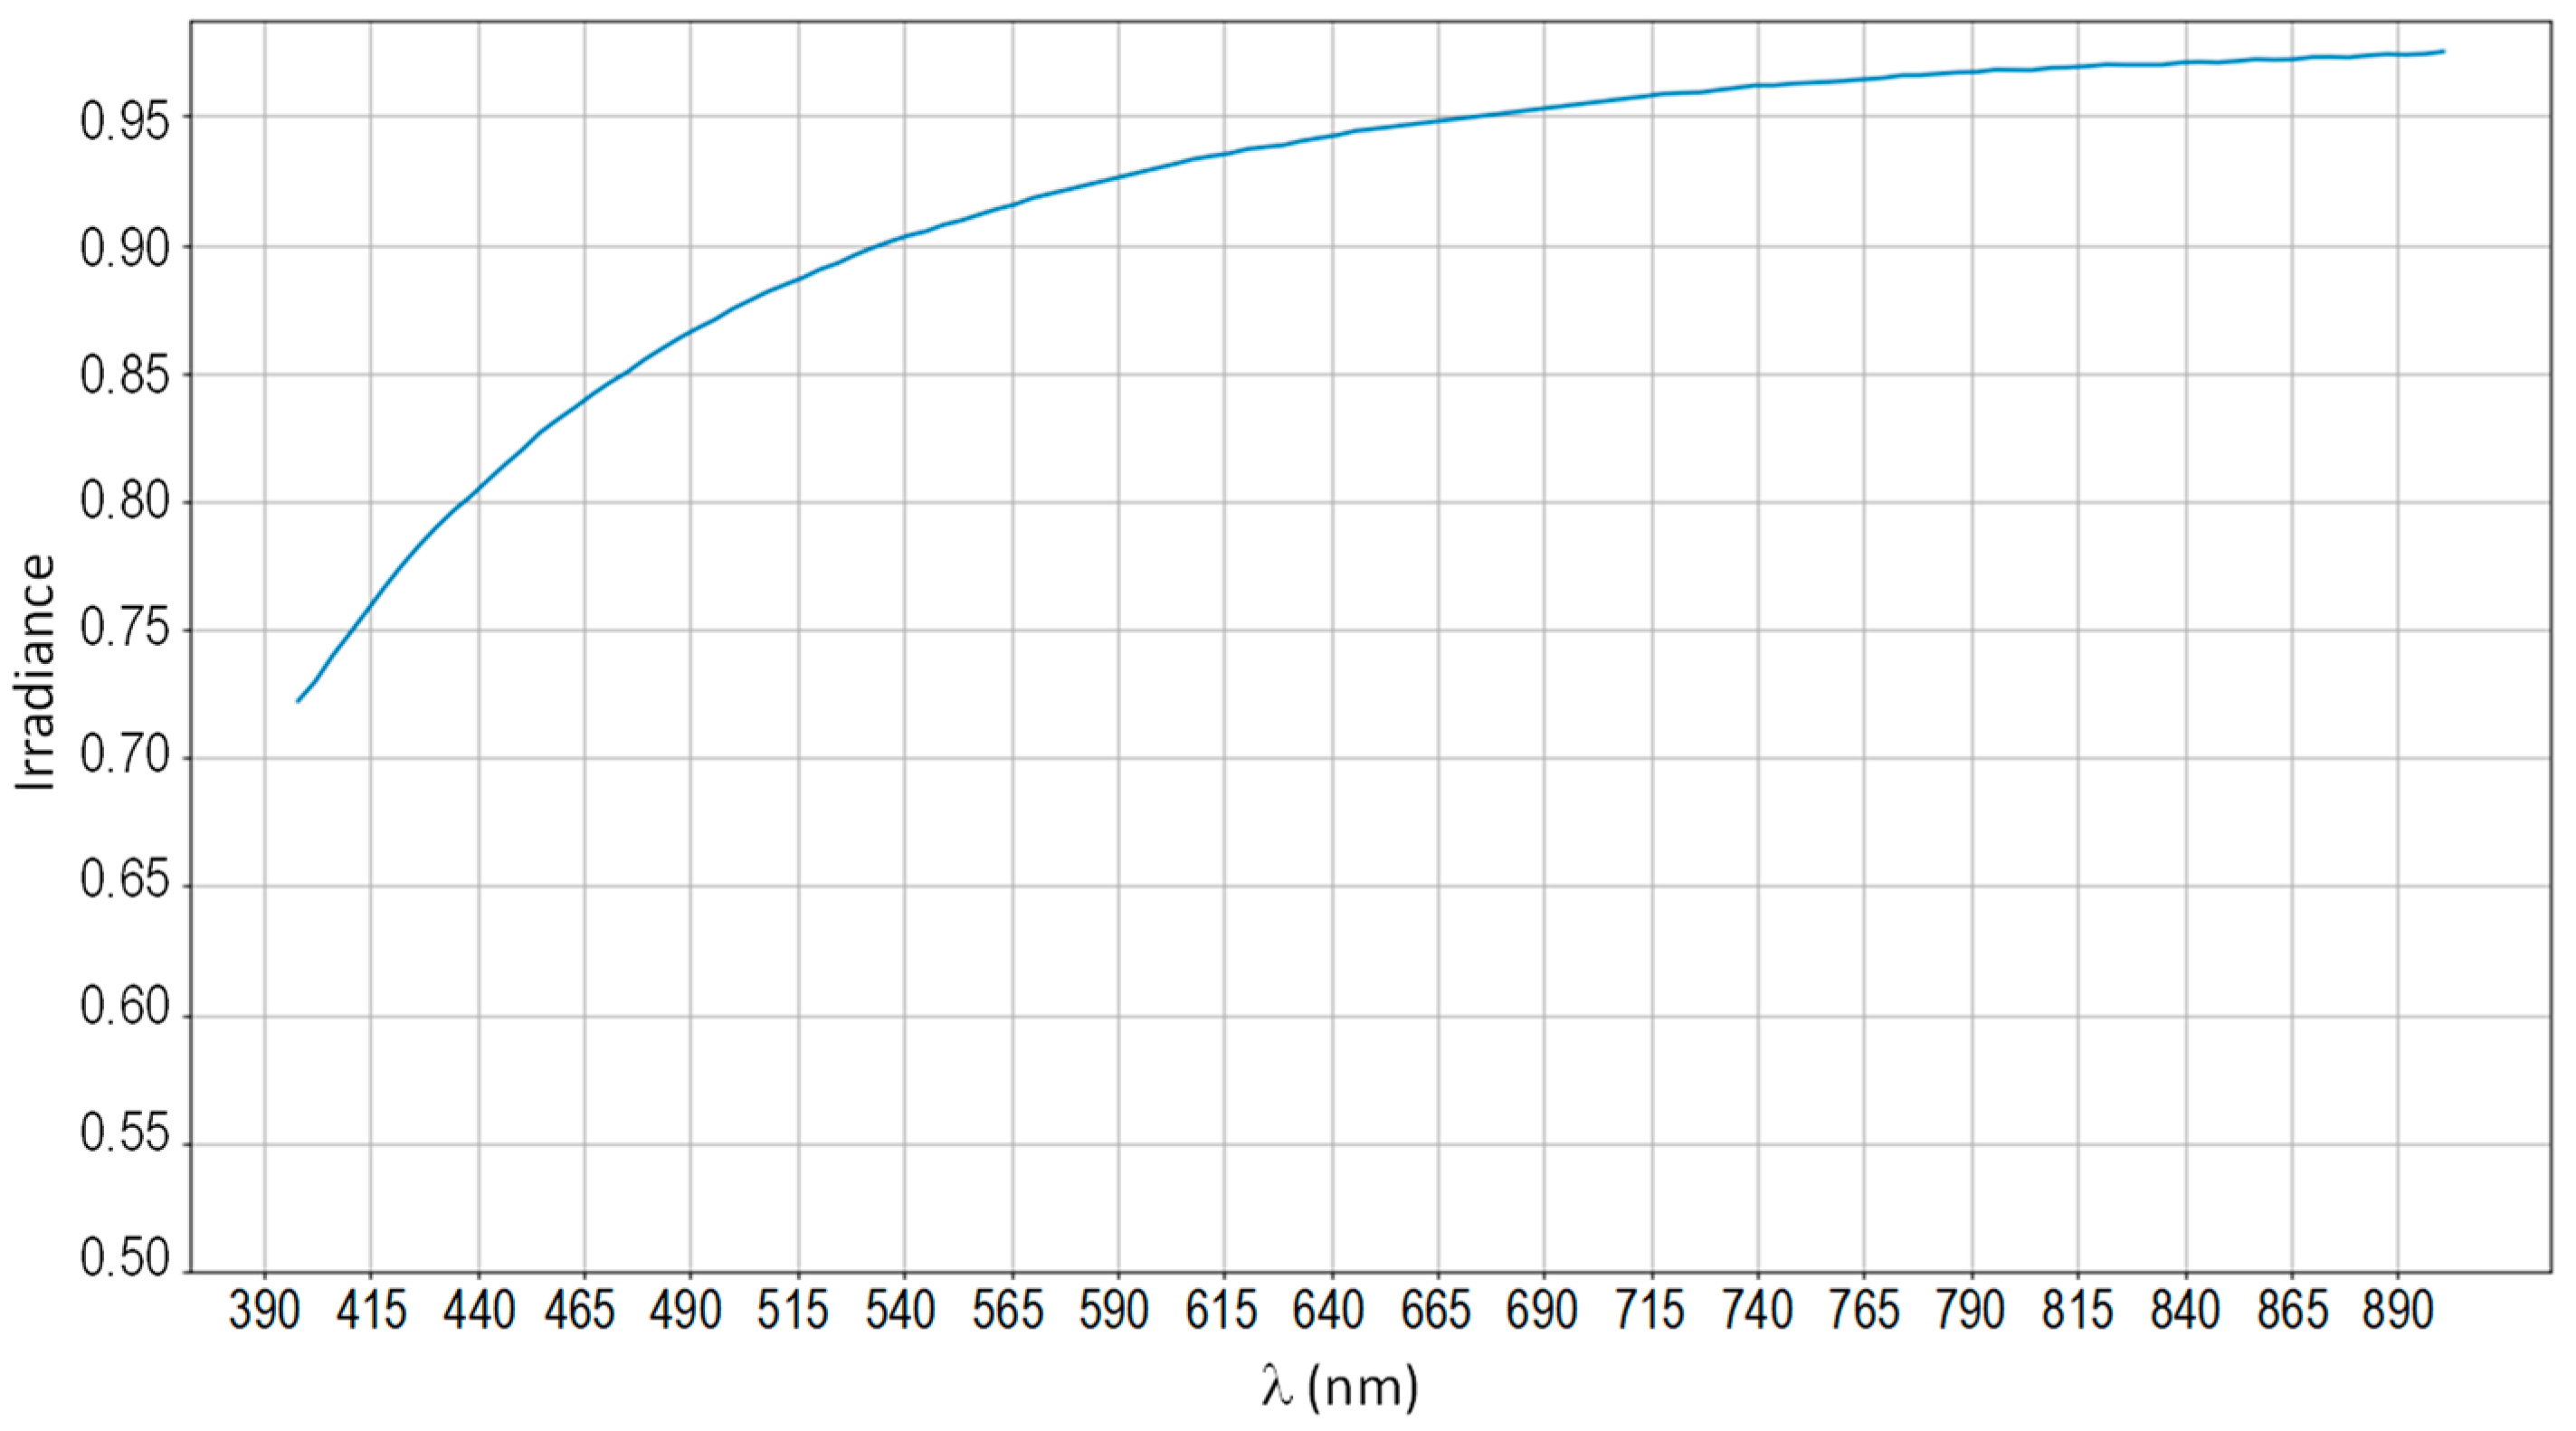
The removal of sunglint is carried out by subtracting the solar brightness detected in the NIR band, where the absorption of water means that, practically, all the reflectivity detected comes from the sun´s specular brightness. However, due to the very high turbidity and low depth of the study area, we cannot neglect the inherent reflectivity contribution of the NIR band. To take this fact into account, the contribution obtained by the radiative model is subtracted from the NIR band. Therefore, it is necessary to introduce the specular solar brightness removal equation in the radiative transfer model resolution. Values in one-for-one of direct irradiance I d i r ( b a n d i ) are obtained from the atmospheric model for the atmospheric conditions of the selected day. An example of the direct irradiance value for the 400–900 nm range is shown in Figure 6.
Finally, ρ ( b a n d i ) can be converted to r r s by:
ρ ( b a n d i ) = π 0.5374 r r s 1 0.3124 r r s
Taking all this into account, the problem can be represented regardless of the type of sensor used, via a system of equations for each band:
{ r r s m ( b a n d 1 ) = λ i n i λ e n d r r s m ( λ ) B a n d P a s s 1 ( λ ) = f ( P ,   G ,   M ,   z ,   N a b u ) r r s m ( b a n d n ) = λ i n i λ e n d r r s m ( λ ) B a n d P a s s n ( λ ) = f ( P ,   G ,   M ,   z ,   N a b u )
The system of equations´ solution is not easy because we have more equations than unknowns (especially in hyperspectral images). Furthermore, as it is a non-linear problem, there are multiple solutions for each unknown, so it is impossible to solve the problem directly. To solve it, a gradient optimizer (Levenberg-Marquardt) has been used [34]. This algorithm is based on the minimization of a cost function, which is the mean square error of the difference between the measured and modeled reflectivity:
Δ m i n = 1 n b a n d s i = 1 n b a n d s ( r r s ( i ) r r s m ( i ) r r s ( i ) ) 2
where Δ m i n is the cost function to be minimized by the optimizer and n b a n d s is the number of bands used.
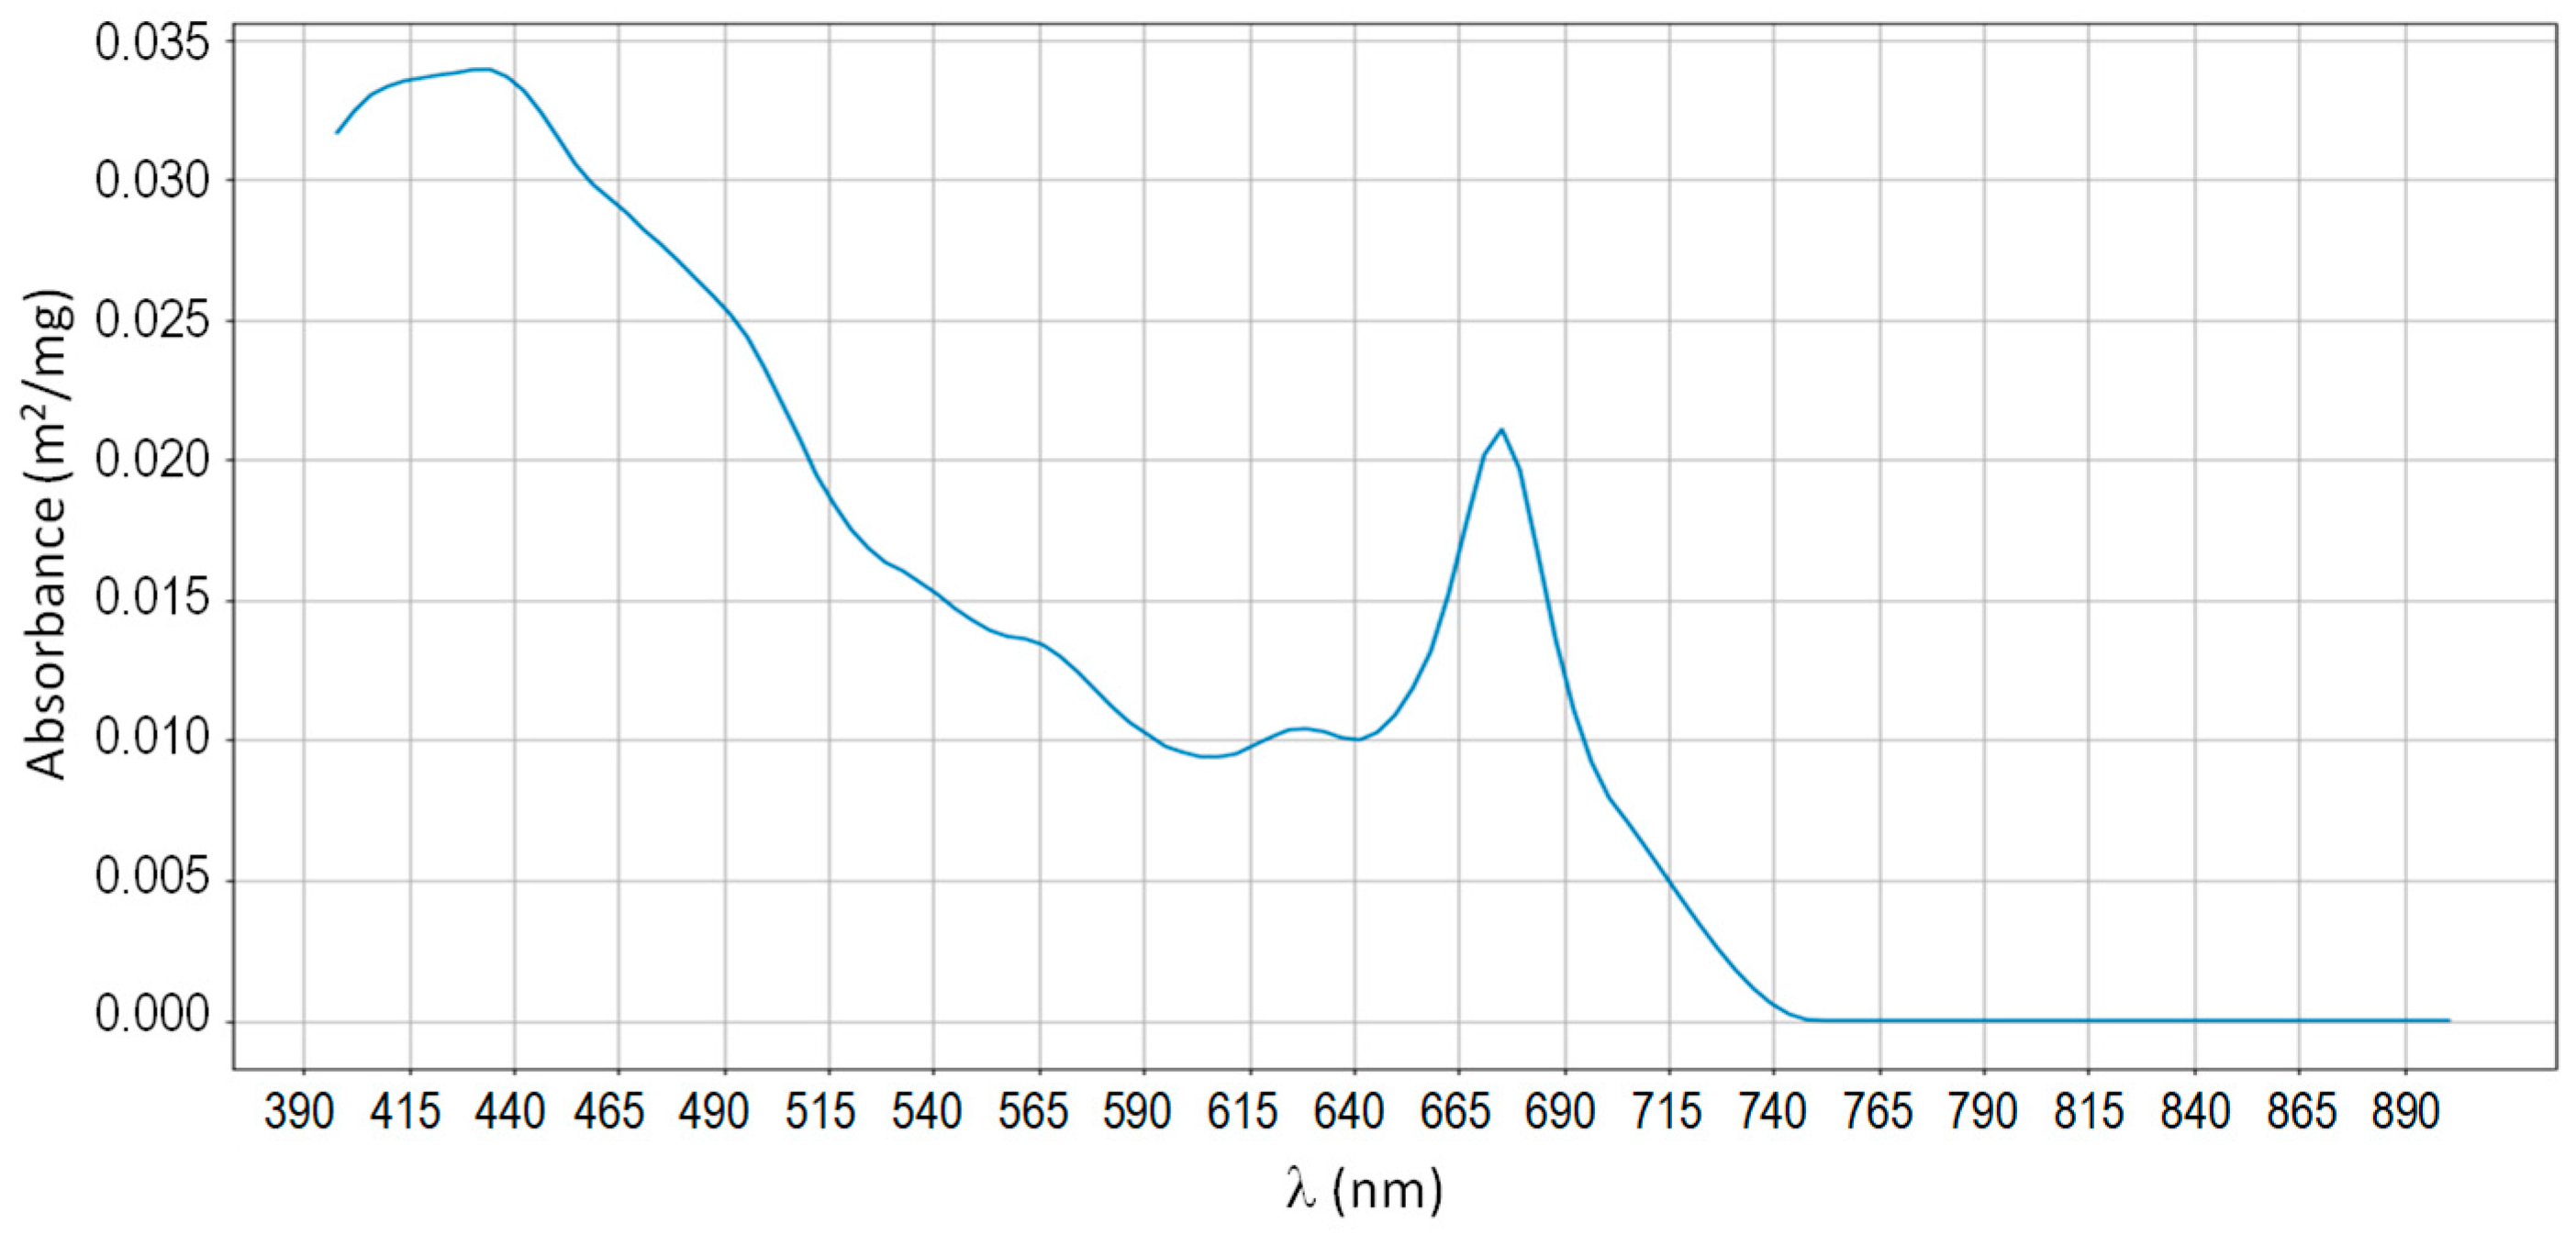
Finally, chlorophyll-a concentration can be estimated from remotely sensed data by relating optical changes observed in the reflected light at specific wavelengths. Multispectral data from low resolution satellite sensors, such as MODIS, MERIS, SENTINEL-3 etc., can be used to estimate the water quality of inner waters [35]. However, to monitor a complex ecosystem, such as the Maspalomas lagoon, VHR multispectral or hyperspectral imagery from different platforms is required. As better sensors with greater number of channels and narrower bandwidths are used, it is possible to more clearly distinguish the absorption and backscattering contributions of the water quality parameters. In particular, chlorophyll-a concentration can be estimated from remotely sensed data by relating optical changes observed in the reflected light at specific wavelengths. As presented in Figure 7, photosynthetic pigments can be distinguished thanks to the two absorption peaks of Chl-a.

3. Results

3.1. Satellite/Airborne Atmospheric Algorithms Assessment

Next, we presented a summary of the most relevant results, in the atmospheric and deglinting modeling context, for the Maspalomas inner-lake, using imagery from Worldview and airborne platforms.
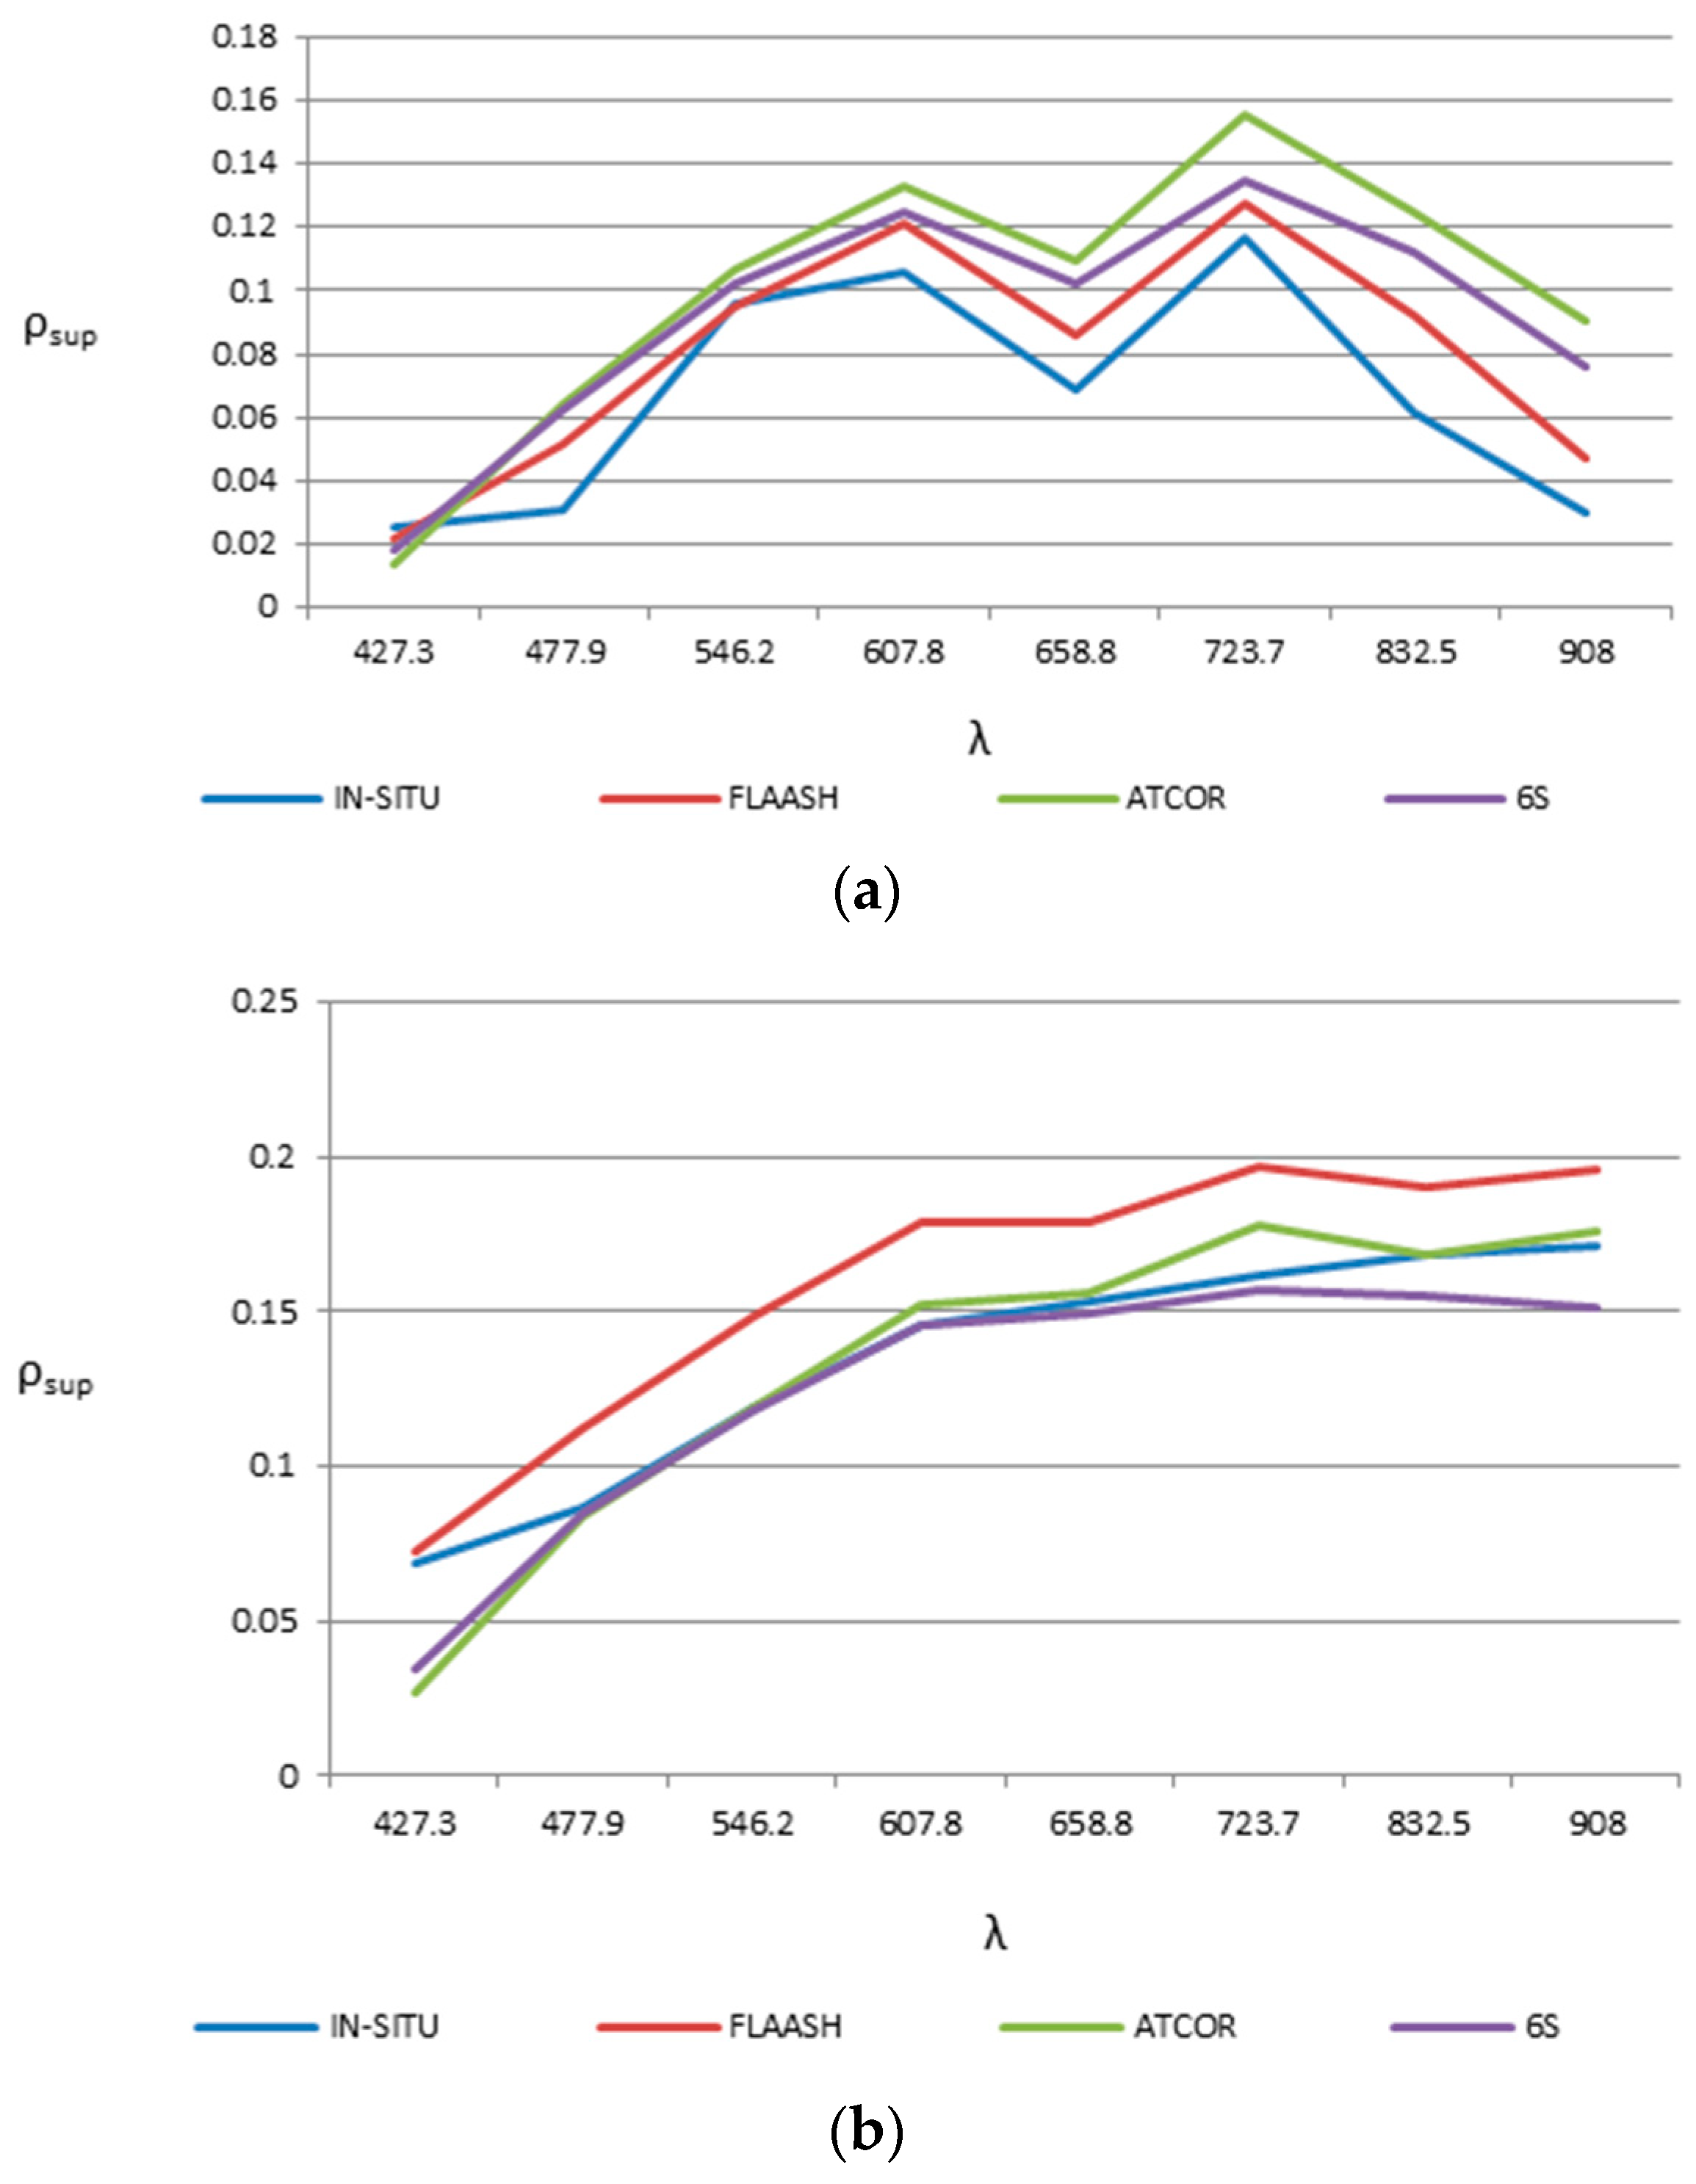
Figure 8 shows the water reflectance, for the visible and infrared satellite and airborne channels, in the lagoon, compared to in situ spectral data (Figure 3a left) measured simultaneously with remote sensors overflight. Both graphs show the mean reflectance averaged for the three sampled points measured during the 2017 field campaign.
Following this comparison, the most accurate results from the average measurements for the considered inner-lake points are included in Table 3 (see Table 2), in which we present the Root Mean Square Error(RMSE) and BIAS between the WorldView and AHS sensors corrected reflectance and in situ measurement. The equations used to calculate the error criteria are as follows:
R M S E = i = 1 N ( ρ i n s i t u i ρ s a t / a i r b o n e i ) 2 N ;    B I A S = i = 1 N ( ρ i n s i t u i ρ s a t / a i r b o n e i ) N
where ρ i n s i t u is the measured in situ surface reflectance and ρ s a t / a i r b o n e is the surface reflectance estimated from the satellite/airborne data.
Finally, as previously indicated, removal of sunglint is necessary for the reliable retrieval of water quality parameters in inner-water environments. Generally speaking, sunglint techniques are based on the assumption that water reflectivity in NIR channels is always negligible. However, as studied by Martin et al. [9] that is not the case in very shallow environments or in waters with high concentrations of turbidity. As these are common situations in coastal and inland waters, there can be significant errors. Thus, we proposed to integrate the sunglint removal algorithm in the radiative transfer model to estimate the contribution of the coastal waters NIR reflectance, which will allow us to eliminate specular NIR reflectance contribution.
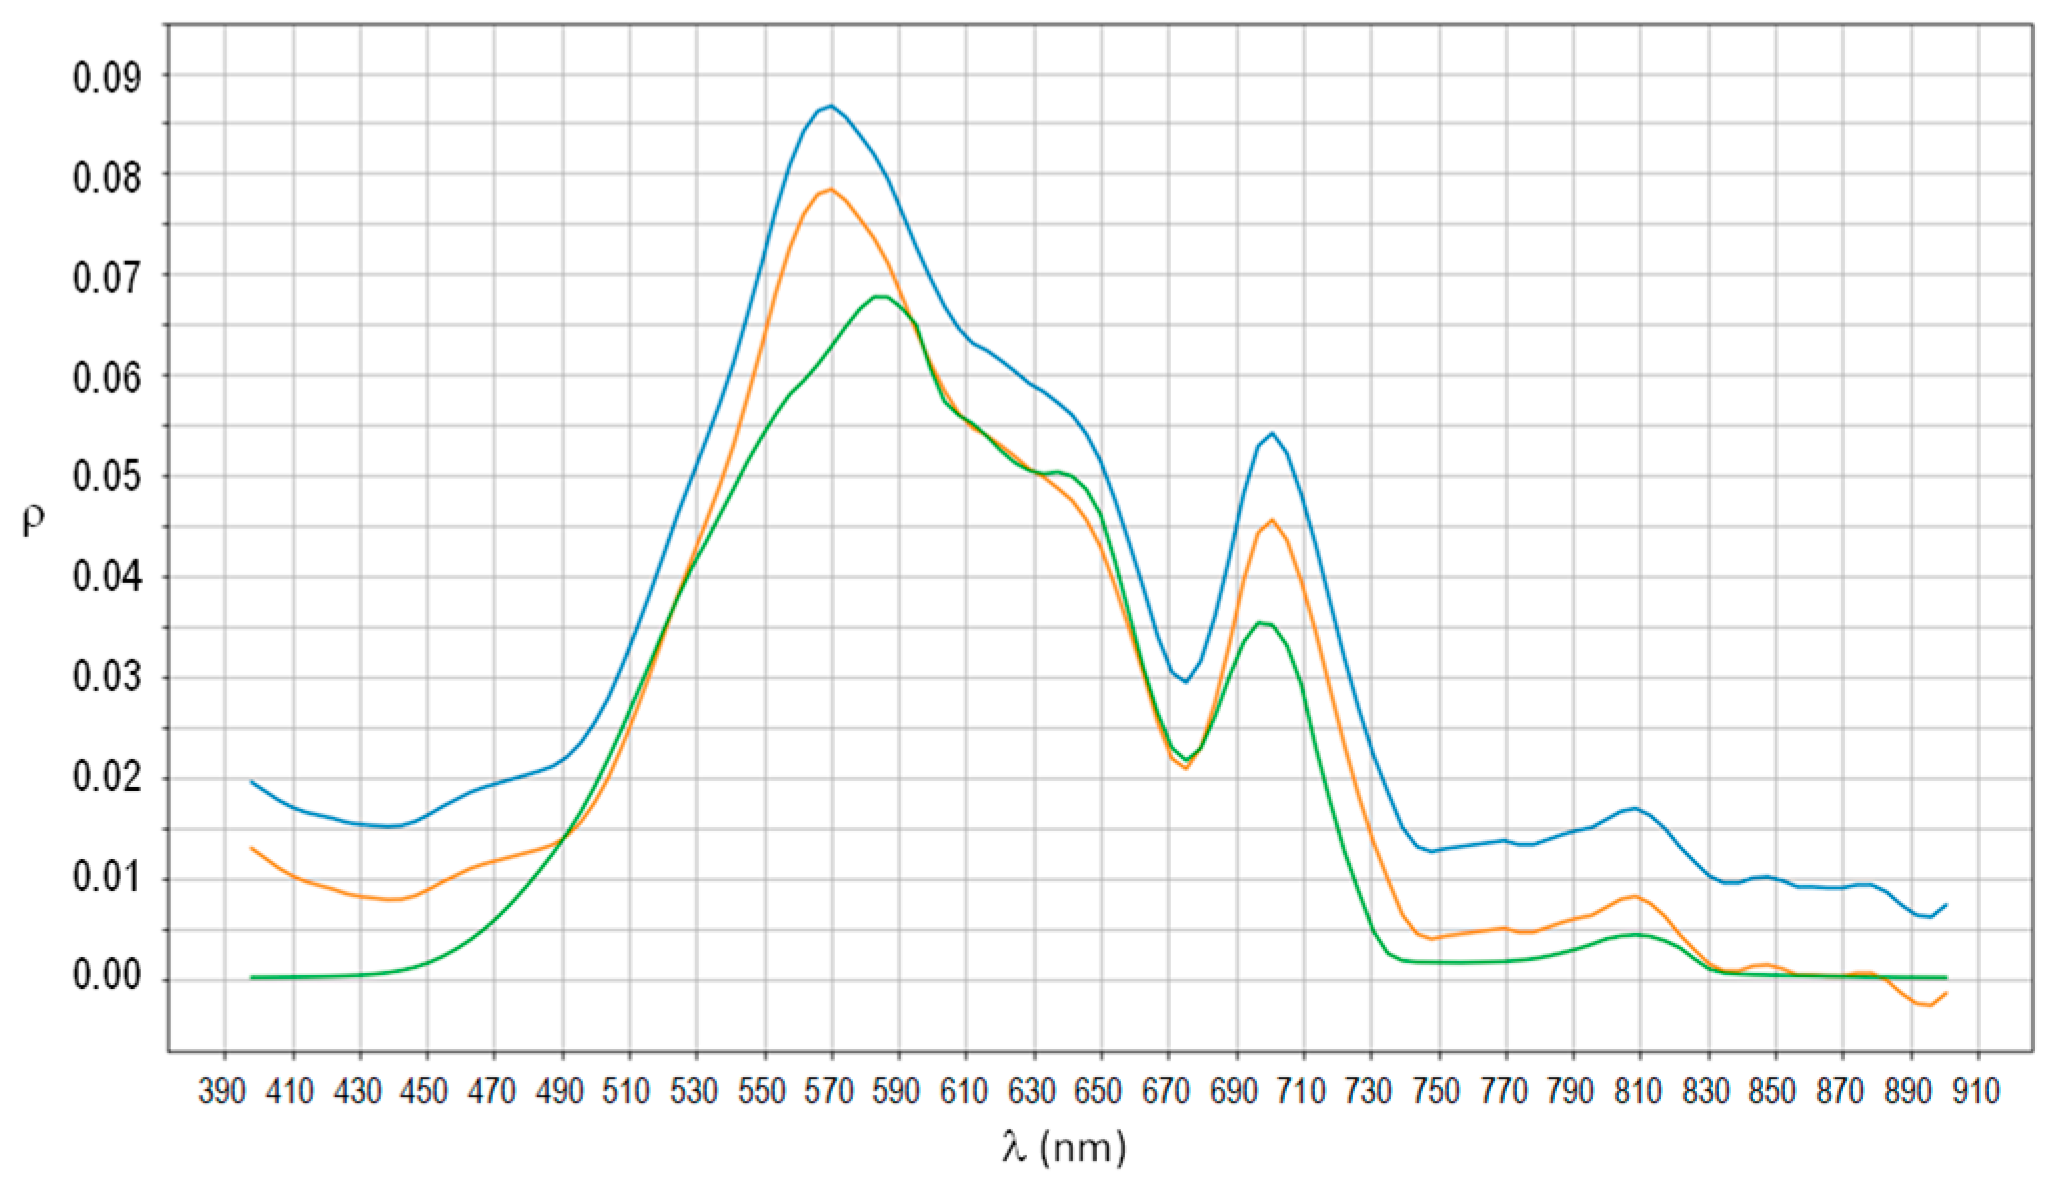
Next, Figure 9 shows an example of a hyperspectral spectrum of the Maspalomas lagoon, where the reference measured at the laboratory is depicted in blue, the modeled values generated using the radiative transfer model with the airborne data are included in green and the reflectivity after removing the sunglint is displayed in orange.
As an example, Figure 10 shows multiplatform color composite image (drone and satellite) before (left) and after (right) the sunglint contamination removal.

3.2. Inner Lake Monitoring: Chlorophyll-A Concentration

The ability to retrieve water quality parameters using different sensors has been evaluated in Maspalomas (Gran Canaria Island), not only a UNESCO Biosphere Reserve, but where monitoring of water quality is of special interest because of its exuberance, marine life and tourist activities. In particular, a corrected WV-3 multispectral imagery from the lagoon has been processed to generate a high-resolution chlorophyll-a concentration map. Furthermore, hyperspectral imagery from airborne and drone platforms have also been processed to assess the benefits of each technology in this challenging scenario. The true color composites of the data used in the study are included in Figure 2b.
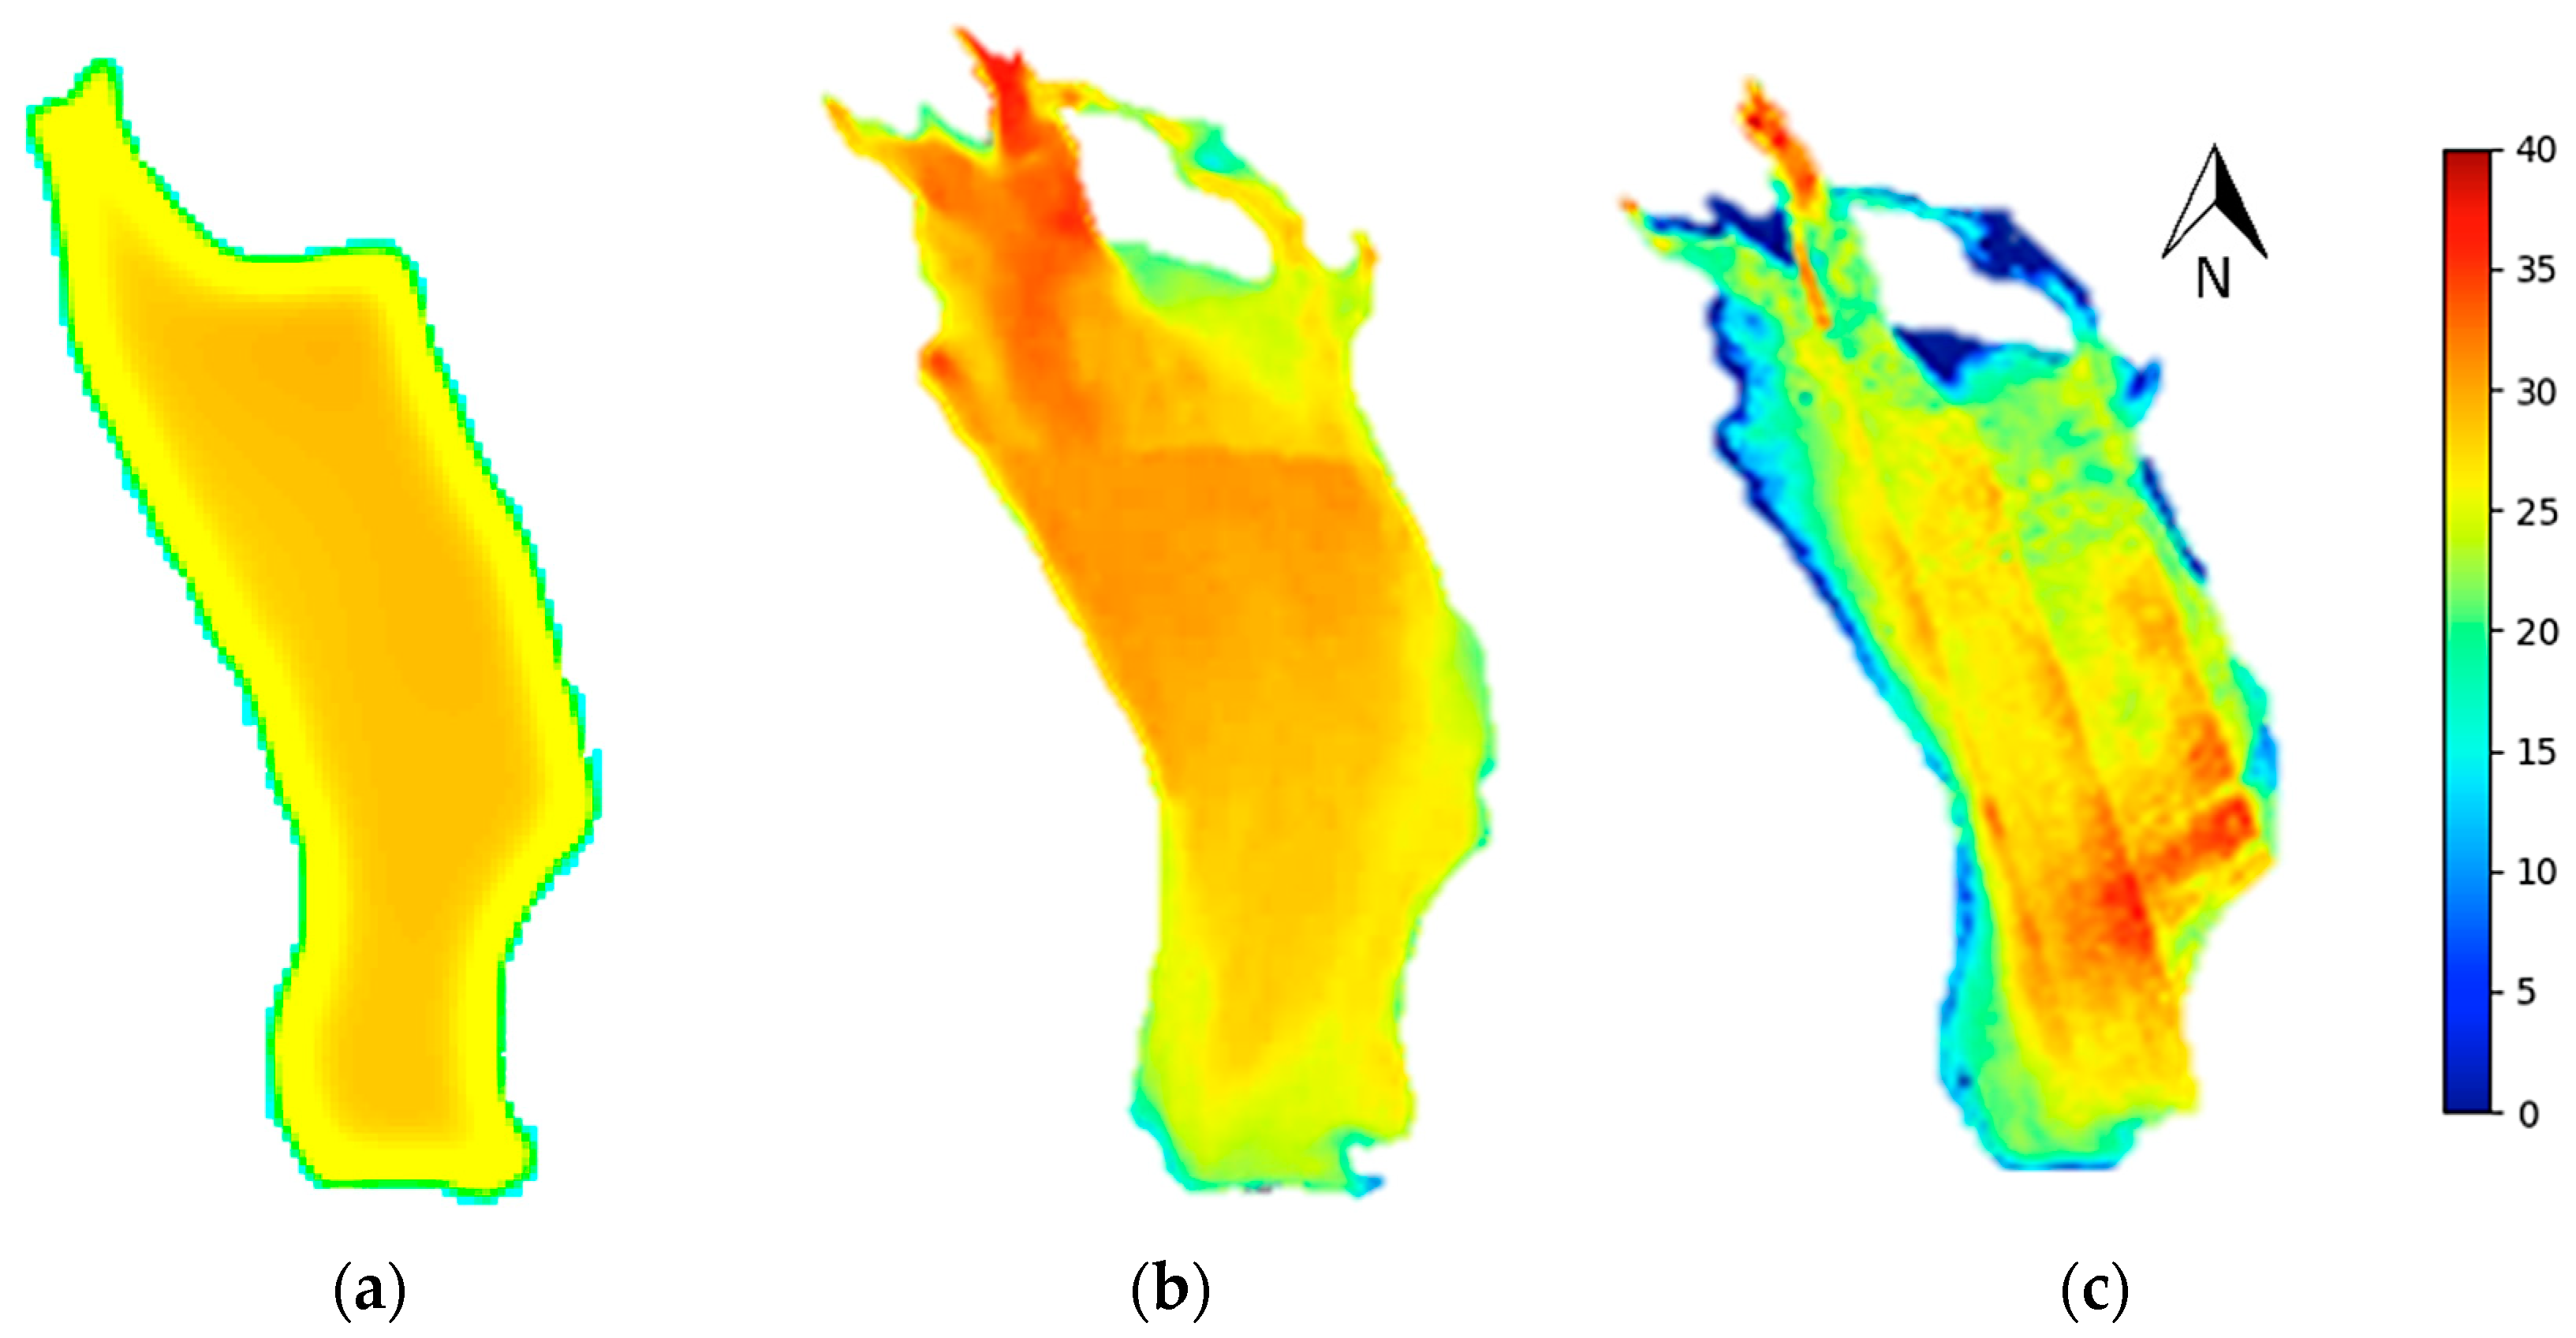
Figure 11 presents the mapping results for the chlorophyll-a concentration (μg/L) in the small lake using the multisensor imagery. Figure 11a shows the chlorophyll-a concentration map obtained by the WorldView-3 satellite, Figure 11b presents the result for the AHS radiometer and Figure 11c the map for the Pika-L instrument.
Table 4 offers a summary of the statistical analysis, providing quantitative information between estimated and real chlorophyll concentrations.
Finally, it is important to highlight that during the 2019 field campaign, after requesting the corresponding authorization to the conservation authorities, on this occasion a small boat was permitted to sail inside the lagoon and, therefore, samples could be collected at different points far from the border (black dots in Figure 3b). In general, chlorophyll concentration values were in the 25 to 35 μg/L range. The 2019 campaign was carried out during summer and, as a result, water quality conditions for the lagoon could be similar to the dates the remote sensing data was collected. Sometimes, water quality in the lagoon can change considerably after heavy rain but the Maspalomas area usually has an arid climate with over 250 sunny days per year and with low rainfall (between 10 and 15 days with rain per year), mainly during the winter.

4. Discussion

Concerning to the Satellite/Airborne atmospheric algorithms assessment, as analyzed in Section 2.3.1 and shown, qualitatively, in Figure 8 and, quantitatively, in Table 3, a detailed assessment of physical model-based atmospheric correction algorithms has been performed, applied to the multispectral bands of the high-resolution satellite for inner-lake. In this work, this study has been extended to airborne hyperspectral data.
An acceptable matching in the spectral signatures can be seen (Figure 8) between measured data and those estimated by the atmospheric correction algorithms, showing better performance in the visible wavelengths. Following this comparison, atmospheric models with the best statistical parameters are FLAASH, for the satellite imagery (RMSE: 0.1014 and BIAS: −0.0348), and ATCOR for the airborne data (RMSE: 0.0318 and BIAS: −0.0251).
On the other hand, regarding relation to inner lake monitoring, as shown in Figure 11, a corrected WV-3 multispectral imagery and hyperspectral imagery from airborne and drone platforms from the lagoon have been processed to assess the benefits of each technology in this challenging scenario. In Figure 11, we can appreciate better detail in the drone map as a result of its higher spatial and spectral resolution. However, it is more affected by the bottom disturbance near the shore. The satellite multispectral data used in the analysis provides an average result as it cannot properly capture the Chl-a spatial variation.
As provided in Table 4, comparing the in situ chlorophyll-a concentrations measured with those estimated by the remote sensing platforms, we can see that it was fairly accurate (RMSE values ranging between 3.49 and 6.75). RMSE and BIAS values for the hyperspectral drone sensor are lower than for the airborne and satellite estimates. Compared to the quantitative results, such statistical values are taken into account for worst case scenarios, as the samplings performed during the 2017 and 2018 campaigns were taken very close to the shoreline and, therefore, the bottom reflectivity affected, to a greater extent, the chlorophyll concentrations collected.
In this line, an on-going research effort is currently being undertaken to estimate very high-resolution bathymetry in this shallow and complex water ecosystem to better estimate quality parameters employing accurate bathymetric information.

5. Conclusions

An efficient monitoring of water quality parameters is important in coastal and inland water ecosystems to guide conservation managers regarding environmental protection, fisheries, tourism etc. In this context, remote sensing can be a fundamental tool to analyze vulnerable or complex water ecosystems. In particular, high-resolution hyperspectral or multispectral imaging systems, with spectral channels in the visible spectrum, can provide information on water quality parameters at finer temporal and spatial scales than field observations alone.
In any case, estimating water quality with remote sensing data is very challenging because a very small amount of energy leaving the water’s surface reaches the sensor and it is mainly affected by noise from different sources. Therefore, precise calibrations and corrections are required to take into account the sensors spectral response, viewing angles, solar illumination geometries, atmospheric effects and sunglint disturbances.
In this work, we chose the natural reserve of Maspalomas, Canary Islands (Spain). More specifically, a complex natural lagoon (La Charca de Maspalomas) of brackish waters, located at the edge of the dunes and the sea, which attracts many species of bird.
First, accurate preprocessing tasks have been carried out to retrieve the water leaving reflectance. In particular, three advanced atmospheric correction algorithms based on radiative transfer models (ATCOR, FLAASH and 6S) were applied and statistically evaluated with respect to real data. Indeed, for the Maspalomas lagoon, the reflectance estimated by the model-based atmospheric correction techniques was compared with the reference water leaving reflectance measured by a field radiometer signature measured with a spectroradiometer, simultaneously to the satellite overflight.
It was confirmed that the advanced correction algorithms assessed correctly model the atmospheric absorption and scattering disturbances. In particular, the ATCOR and FLAASH models performed properly in the Maspalomas lagoon and, accordingly, they have been implemented and adapted to the particularities of the specific area and sensor. Next, an enhanced deglinting algorithm was applied.
To gather water quality, specifically chlorophyll-a concentration, a multichannel physics-based model was implemented. The complex model used in this work expands a previous methodology based on a combination of water column properties, bathymetry retrieval and seafloor abundances.
Data provided by the multispectral (Worldview satellite) and hyperspectral (drone and airborne) imagery, together with the new methodology presented, performs reasonably when finding chlorophyll concentrations in a complex shallow-water ecosystem. Regarding the multiplatform comparison, the drone provides the highest spectral and spatial information and, as a result, the most accurate results.
In summary, the multiplatform processing protocol developed has provided a synoptic and systematic framework to support inland shallow water ecosystems. It has been validated using a database of real measurements sampled in field campaigns. Satisfactory results have been achieved, but to further increase the accuracy, new models are considered to improve gathering of bathymetric and seafloor information.

Author Contributions

All of the authors contributed to design the research. F.E. were responsible for the data preprocessing. J.M. (Javier Marcello) and J.M. (Javier Martín) designed and performed the in situ measurements (field campaign) and water quality parameter processing. Finally, F.E. wrote the overall paper with contributions from the rest of authors, who were also involved in the manuscript’s discussion and revision. All authors have read and agreed to the published version of the manuscript.

Funding

This research was funded by Spanish Agencia Estatal de Investigación (AEI) and by the Fondo Europeo de Desarrollo Regional (FEDER): project ARTEMISAT-2 (CTM2016-77733-R).

Acknowledgments

Authors want to acknowledge INTA (Instituto Nacional de Técnica Aeroespacial) for providing the AHS imagery. This work has been supported by the ARTEMISAT-2 (CTM2016-77733-R) project, funded by the Spanish AEI and FEDER funds. This article is a publication of the Unidad Océano y Clima of the Universidad de Las Palmas de Gran Canaria, a R&D&i CSIC-associate unit.

Conflicts of Interest

The authors declare no conflict of interest.

References

  1. Horning, E.; Robinson, J.; Sterling, E.; Turner, W.; Spector, S. Remote Sensing for Ecology and Conservation; Oxford University Press: New York, NY, USA, 2010. [Google Scholar]
  2. Purkis, S.; Klemas, V. Remote Sensing and Global Environmental Change; John Wiley & Sons Ltd.: Oxford, UK, 2011. [Google Scholar]
  3. Richards, J.A. Remote Sensing Digital Image Analysis, 5th ed.; Springer: Berlin, Germany, 2013; ISBN 978-3-54-029711-6. [Google Scholar]
  4. Gholizadeh, M.H.; Melesse, A.M.; Reddi, L. A comprehensive review on water quality parameters estimation using remote sensing techniques. Sensors 2016, 16, 1298. [Google Scholar] [CrossRef] [PubMed] [Green Version]
  5. Palmer, S.C.J.; Kutser, P.; Hunter, D. Remote sensing of inland waters: Challenges, progress and future directions. Remote Sens. Environ. 2015, 157, 1–8. [Google Scholar] [CrossRef] [Green Version]
  6. Bonanseaa, M.; Rodriguez, M.C.; Pinottic, L.; Ferrerod, S. Using multi-temporal Landsat imagery and linear mixed models for assessing water quality parameters in Río Tercero reservoir (Argentina). Remote Sens. Environ. 2015, 158, 28–41. [Google Scholar] [CrossRef]
  7. Toming, K.; Kutser, T.; Uiboupin, R.; Arikas, A.; Vahter, K.; Paavel, B. Mapping water quality parameters with sentinel-3 ocean and land colour instrument imagery in the Baltic sea. Remote Sens. 2017, 9, 1070. [Google Scholar] [CrossRef] [Green Version]
  8. Eugenio, F.; Marcello, J.; Martin, J. High-resolution maps of bathymetry and benthic habitats in shallow-water environments using multispectral remote sensing imagery. IEEE Trans. Geosci. Remote Sens. 2015, 53, 3539–3549. [Google Scholar] [CrossRef]
  9. Martin, J.; Eugenio, F.; Marcello, J.; Medina, A. Automatic sunglint removal of multispectral high-resolution worldview-2 imagery for retrieving coastal shallow water parameters. Remote Sens. 2016, 8, 37. [Google Scholar] [CrossRef] [Green Version]
  10. Eugenio, F.; Marcello, J.; Martin, J.; Rodríguez-Esparragón, D. Benthic habitat mapping using multispectral high-resolution imagery: evaluation of shallow water atmospheric correction techniques. Sensors 2017, 17, 2639. [Google Scholar] [CrossRef] [Green Version]
  11. Fichot, C.; Downing, B.; Bergamaschi, B.; Windham-Myers, L.; Marvin-Dipasquale, M.; Thompson, D.; Gierach, M. High-resolution remote sensing of water quality in the San Francisco bay-delta estuary. Environ. Sci. Technol. 2016, 50, 573–583. [Google Scholar] [CrossRef]
  12. Zheng, G.; Di Giacomo, P.M. Uncertainties and applications of satellite-derived coastal water quality products. Prog. Oceanogr. 2017, 159, 45–72. [Google Scholar] [CrossRef]
  13. Zhanga, Y.; Huang, Z.; Fu, D.; Yeu, J.; Tingchen, T.; Jiang, X.; Liang, S.; Lu, X. Monitoring of chlorophyll-a and sea surface silicate concentrations in the south part of Cheju island in the East China sea using MODIS data. Int. J. Appl. Earth Obs. Geoinf. 2018, 67, 173–178. [Google Scholar] [CrossRef]
  14. Koparan, C.; Koc, A.B.; Privette, C.V.; Sawyer, C.B. In situ water quality measurements using an Unmanned Aerial Vehicle (UAV) system. Water 2018, 10, 264. [Google Scholar] [CrossRef] [Green Version]
  15. Haoa, Q.; Chai, F.; Xiu, P.; Bai, Y.; Chen, J.; Liu, C.; Le, F.; Zhou, F. Spatial and temporal variation in chlorophyll a concentration in the Eastern China Seas based on a locally modified satellite dataset. Estuar. Coast. Shelf Sci. 2019, 220, 220–231. [Google Scholar] [CrossRef]
  16. Qi, L.; Lee, Z.; Hu, C.; Wang, M. Requirement of minimal signal-to-noise ratios of ocean color sensors and uncertainties of ocean color products. J. Geophys. Res. Ocean. 2017, 122. [Google Scholar] [CrossRef]
  17. Wang, Y. Remote Sensing of Coastal Environments; Taylor and Francis Series; CRC Press: Borarton, FL, USA, 2010; ISBN 978-1-42-009442-8. [Google Scholar]
  18. González-Henríquez, N.; Soler-Onís, E.; Moreno, T.; Castro-Hernández, J.; Betancort-Yllalba, M.J. Estudio de la dinámica del ecosistema del charco de Maspalomas (1992–1998), Gran Canaria. Inf. Técnicos Inst. Canario Cienc. Mar. 1999, 6, 1–76. [Google Scholar]
  19. Digital Globe. Accuracy of Worldview Products. White Paper. 2016. Available online: https://dg-cms-uploads-production.s3.amazonaws.com/uploads/document/file/38/DG_ACCURACY_WP_V3.pdf (accessed on 2 February 2019).
  20. De Miguel, E.; Fernández-Renau, A.; Prado, E.; Jiménez, M.; Gutiérrez, O.; Linés, C.; Gómez, J.; Martín, A.I.; Muñoz, F. A review of INTA AHS PAF. EARSeL eProc. 2014, 13, 20–29. [Google Scholar]
  21. Mueller, J.L.; Davis, C.; Arnone, R.; Frouin, R.; Carder, K.; Lee, Z.P.; Steward, R.G.; Hooker, S.; Mobley, C.D.; McLean, S. Above-water radiance and remote sensing reflectance measurement and analysis protocols, Chapter 10. In Ocean Optics Protocols for Satellite Ocean Color Sensor Validation; Revision 2; Giulietta, S., Fargion, G.S., Mueller, J.L., Eds.; NASA-GSFSC: Greenbelt, MD, USA, 2003. [Google Scholar]
  22. Jiménez, M.; González, M.; Amaro, A.; Fernández-Renau, A. Field spectroscopy metadata system based on ISO and OGC standards. ISPRS Int. J. Geo-Inf. 2014, 3, 1003–1022. [Google Scholar]
  23. Eugenio, F.; Martin, J.; Marcello, J.; Fraile-Nuez, E. Environmental monitoring of El Hierro Island submarine volcano, by combining low and high resolution satellite imagery. Int. J. Appl. Earth Obs. Geoinf. 2014, 29, 53–66. [Google Scholar] [CrossRef]
  24. Rani, N.; Mandla, V.R.; Singh, T. Evaluation of atmospheric corrections on hyperspectral data with special reference to mineral mapping. Geosci. Front. 2017, 8, 797–808. [Google Scholar] [CrossRef] [Green Version]
  25. Mahiny, A.S.; Turner, B.J. A comparison of four common atmospheric correction methods. Photogramm. Eng. Remote Sens. 2007, 73, 361–368. [Google Scholar] [CrossRef]
  26. Jaelani, L.M.; Matsushita, B.; Yang, W.; Fukushima, T. An improved atmospheric correction algorithm for applying MERIS data to very turbid inland waters. Int. J. Appl. Earth Obs. Geoinf. 2015, 39, 128–141. [Google Scholar] [CrossRef]
  27. Richter, R.; Schläpfer, D. Atmospheric/Topographic Correction for Airborne Imagery: ATCOR-4 User Guide; Version 7.0.3; DLR and ReSe Report: Wessling, Germany, 2016. [Google Scholar]
  28. Manessa, M.D.M.; Haidar, M.; Budhiman, S.; Winarso, G.; Kanno, A.; Sagawa, T.; Sekine, M. Evaluating the performance of Lyzenga’s water column correction in case-1 coral reef water using a simulated Worldview-2 imagery. In Proceedings of the IOP Conference Series: Earth and Environmental Science, Shanghai, China, 23–26 July 2016; Volume 47. [Google Scholar]
  29. Lee, Z.; Carder, K.L.; Mobley, C.D.; Steward, R.G.; Patch, J.S. Hyperspectral remote sensing for shallow waters: 1. A semi-analytical model. Appl. Opt. 1998, 37, 6329–6338. [Google Scholar] [CrossRef] [PubMed]
  30. Lee, Z.; Carder, K.L.; Mobley, C.D.; Steward, R.G.; Patch, J.S. Hyperspectral remote sensing for shallow waters: 2. Deriving bottom depths and water properties by optimization. Appl. Opt. 1999, 38, 3831–3843. [Google Scholar] [CrossRef] [PubMed] [Green Version]
  31. Heylen, R.; Burazerović, D.; Scheunders, P. Fully constrained least squares spectral unmixing by simplex projection. IEEE Trans. Geosci. Remote Sens. 2011, 49, 4112–4122. [Google Scholar] [CrossRef]
  32. Gordon, H.R.; Brown, O.B.; Jacobs, M.M. Computed relationships between the inherent and apparent optical properties of a flat homogeneous ocean. Appl. Opt. 1975, 14, 417–427. [Google Scholar] [CrossRef] [PubMed]
  33. Albert, A.; Mobley, C. An analytical model for subsurface irradiance and remote sensing reflectance in deep and shallow case-2 waters. Opt. Express 2003, 11, 2873–2890. [Google Scholar] [CrossRef] [PubMed]
  34. Gavin, H.P. The Levenberg-Marquardt Method for Nonlinear Least Squares Curve-Fitting Problems; Department of Civil and Environmental Engineering, Duke University: Durham, NC, USA, 2011; pp. 1–15. [Google Scholar]
  35. Korosov, A.; Moiseev, A.; Shuchman, R.A.; Pozdnyakov, D. Modis-aqua and sentinel-2 data fusion: Application to optically shallow waters of Lake Michigan. Karelian Res. Cent. Russ. Acad. Sci. 2017. [Google Scholar] [CrossRef] [Green Version]
Figure 1. Maspalomas area: (a) Geographic location (OpenStreetMap©) and Landsat color composite image of Gran Canaria; (b) Panoramic view of the study area; (c) Coastal-inner lake protected natural ecosystem of Maspalomas.
Remotesensing 12 00284 g001
Figure 2. (a) Multiplatform Earth observation systems for the monitoring of water quality in the Maspalomas lagoon ecosystem and, (b) true color RGB composite data obtained from Worldview-3 multispectral satellite (31 May 2017), Airborne Hyperspectral Scanner(AHS) hyperspectral airborne (2 June 2017) and PIKA-L sensor aboard drone platform (4 June 2018).
Remotesensing 12 00284 g002
Figure 3. (a) Field campaigns to measure surface radiance (left) and water quality and bathymetry (right), and (b) in situ sites monitored in the Maspalomas lagoon ecosystem during the campaigns performed in 2017 (red), 2018 (blue) and 2019 (black).
Remotesensing 12 00284 g003
Figure 4. Flowchart of the processing and assessment methodology to generate natural ecosystems multiplatform maps.
Remotesensing 12 00284 g004
Figure 5. Reflectance computation based on sensed Radiance/Irradiance.
Remotesensing 12 00284 g005
Figure 6. Percentage of direct irradiance for the 400–900 nm range.
Remotesensing 12 00284 g006
Figure 7. Absorbance of the Chl-a.
Remotesensing 12 00284 g007
Figure 8. Inner-lake spectral reflectivity signatures for: (a) WorldView satellite and, (b) AHS airborne platform.
Remotesensing 12 00284 g008
Figure 9. Spectral fitting of the model reflectance and the measured-deglinted reflectance (reference in blue and modeled reflectivity before and after the sunglint correction are presented in green and orange, respectively).
Remotesensing 12 00284 g009
Figure 10. Sunglint correction of the Maspalomas inner-lake multiplatform color composite imagery: (a) Pika-L drone imagery and (b) WorldView Satellite.
Remotesensing 12 00284 g010
Figure 11. Multiplatform estimated chlorophyll-a concentration (μg/L) in the Maspalomas lagoon: (a) satellite Worldview-3, (b) airborne AHS and (c) drone Pika-L.
Remotesensing 12 00284 g011
Table 1. Spatial and spectral characteristics of the multispectral satellite and hyperspectral airborne and drone scanners.
PLATFORM SENSORSpatial Resolution (m)Spectral BandWavelength (nm)Bandwidth (nm)
SATELLITE
WorldView-3
1.6Coastal Blue400–45047.3
Blue450–51054.3
Green510–58063.0
Yellow585–62537.4
Red630–69057.4
Red-edge705–74539.3
Near-IR 1770–89598.9
Near-IR 2860–104099.6
Panchromatic450–800284.6
AIRBORNE
AHS
2.5Visible and Near-IR
(20 channels)
434–101528–30
DRONE
PIKA-L
0.1Visible and Near-IR
(150 channels)
400–1000 nm4
Table 2. In situ field campaigns detailing the number of locations sampled in the Maspalomas lagoon (in brackets the number of measurements), the parameters measured and instrumentation used.
DateChl-aOther Field Data Acquisition
2 June 20173 (9)Reflectance (ADS Fieldspec 3) Temperature at 3 depths
Time and location
4 June 20183Time and location
23 July 20197 (9)Carotenoids, phycobiliproteins, functional groups of planktonic microalgae
Bathymetry, time and location
Table 3. Statistics results (Root Mean Square Error (RMSE) and BIAS) between the in situ measurements versus multiplatform (satellite and airborne) corrected reflectance for the best atmospheric algorithm.
AlgorithmSensor/PlatformRMSEBIAS
FLAASHWV/Satellite0.1014−0.0348
ATCORAHS/Airborne0.0318−0.0251
Table 4. RMSE and BIAS between estimated and in situ chlorophyll-a concentration (μg/L) for the different remote sensing platforms in the Maspalomas lagoon.
SensorMean EstimatedMean in SituRMSEBIAS
Wolrdview-317.5314.946.756.47
AHS19.9414.946.655.58
Pika—L17.9716.203.492.96