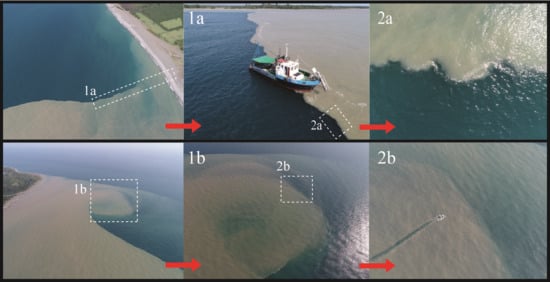
Spatial Structure, Short-temporal Variability, and Dynamical Features of Small River Plumes as Observed by Aerial Drones: Case Study of the Kodor and Bzyp River Plumes
Abstract
1. Introduction
2. Data and Methods
2.1. Study Area
2.2. Aerial, In Situ, and Satellite Data
2.3. Processing of Aerial Data
3. Results
3.1. Spatial Structure and Short-temporal Variability of the Kodor and Bzyp Plumes
3.2. Dynamical Features of the Kodor and Bzyp Plumes
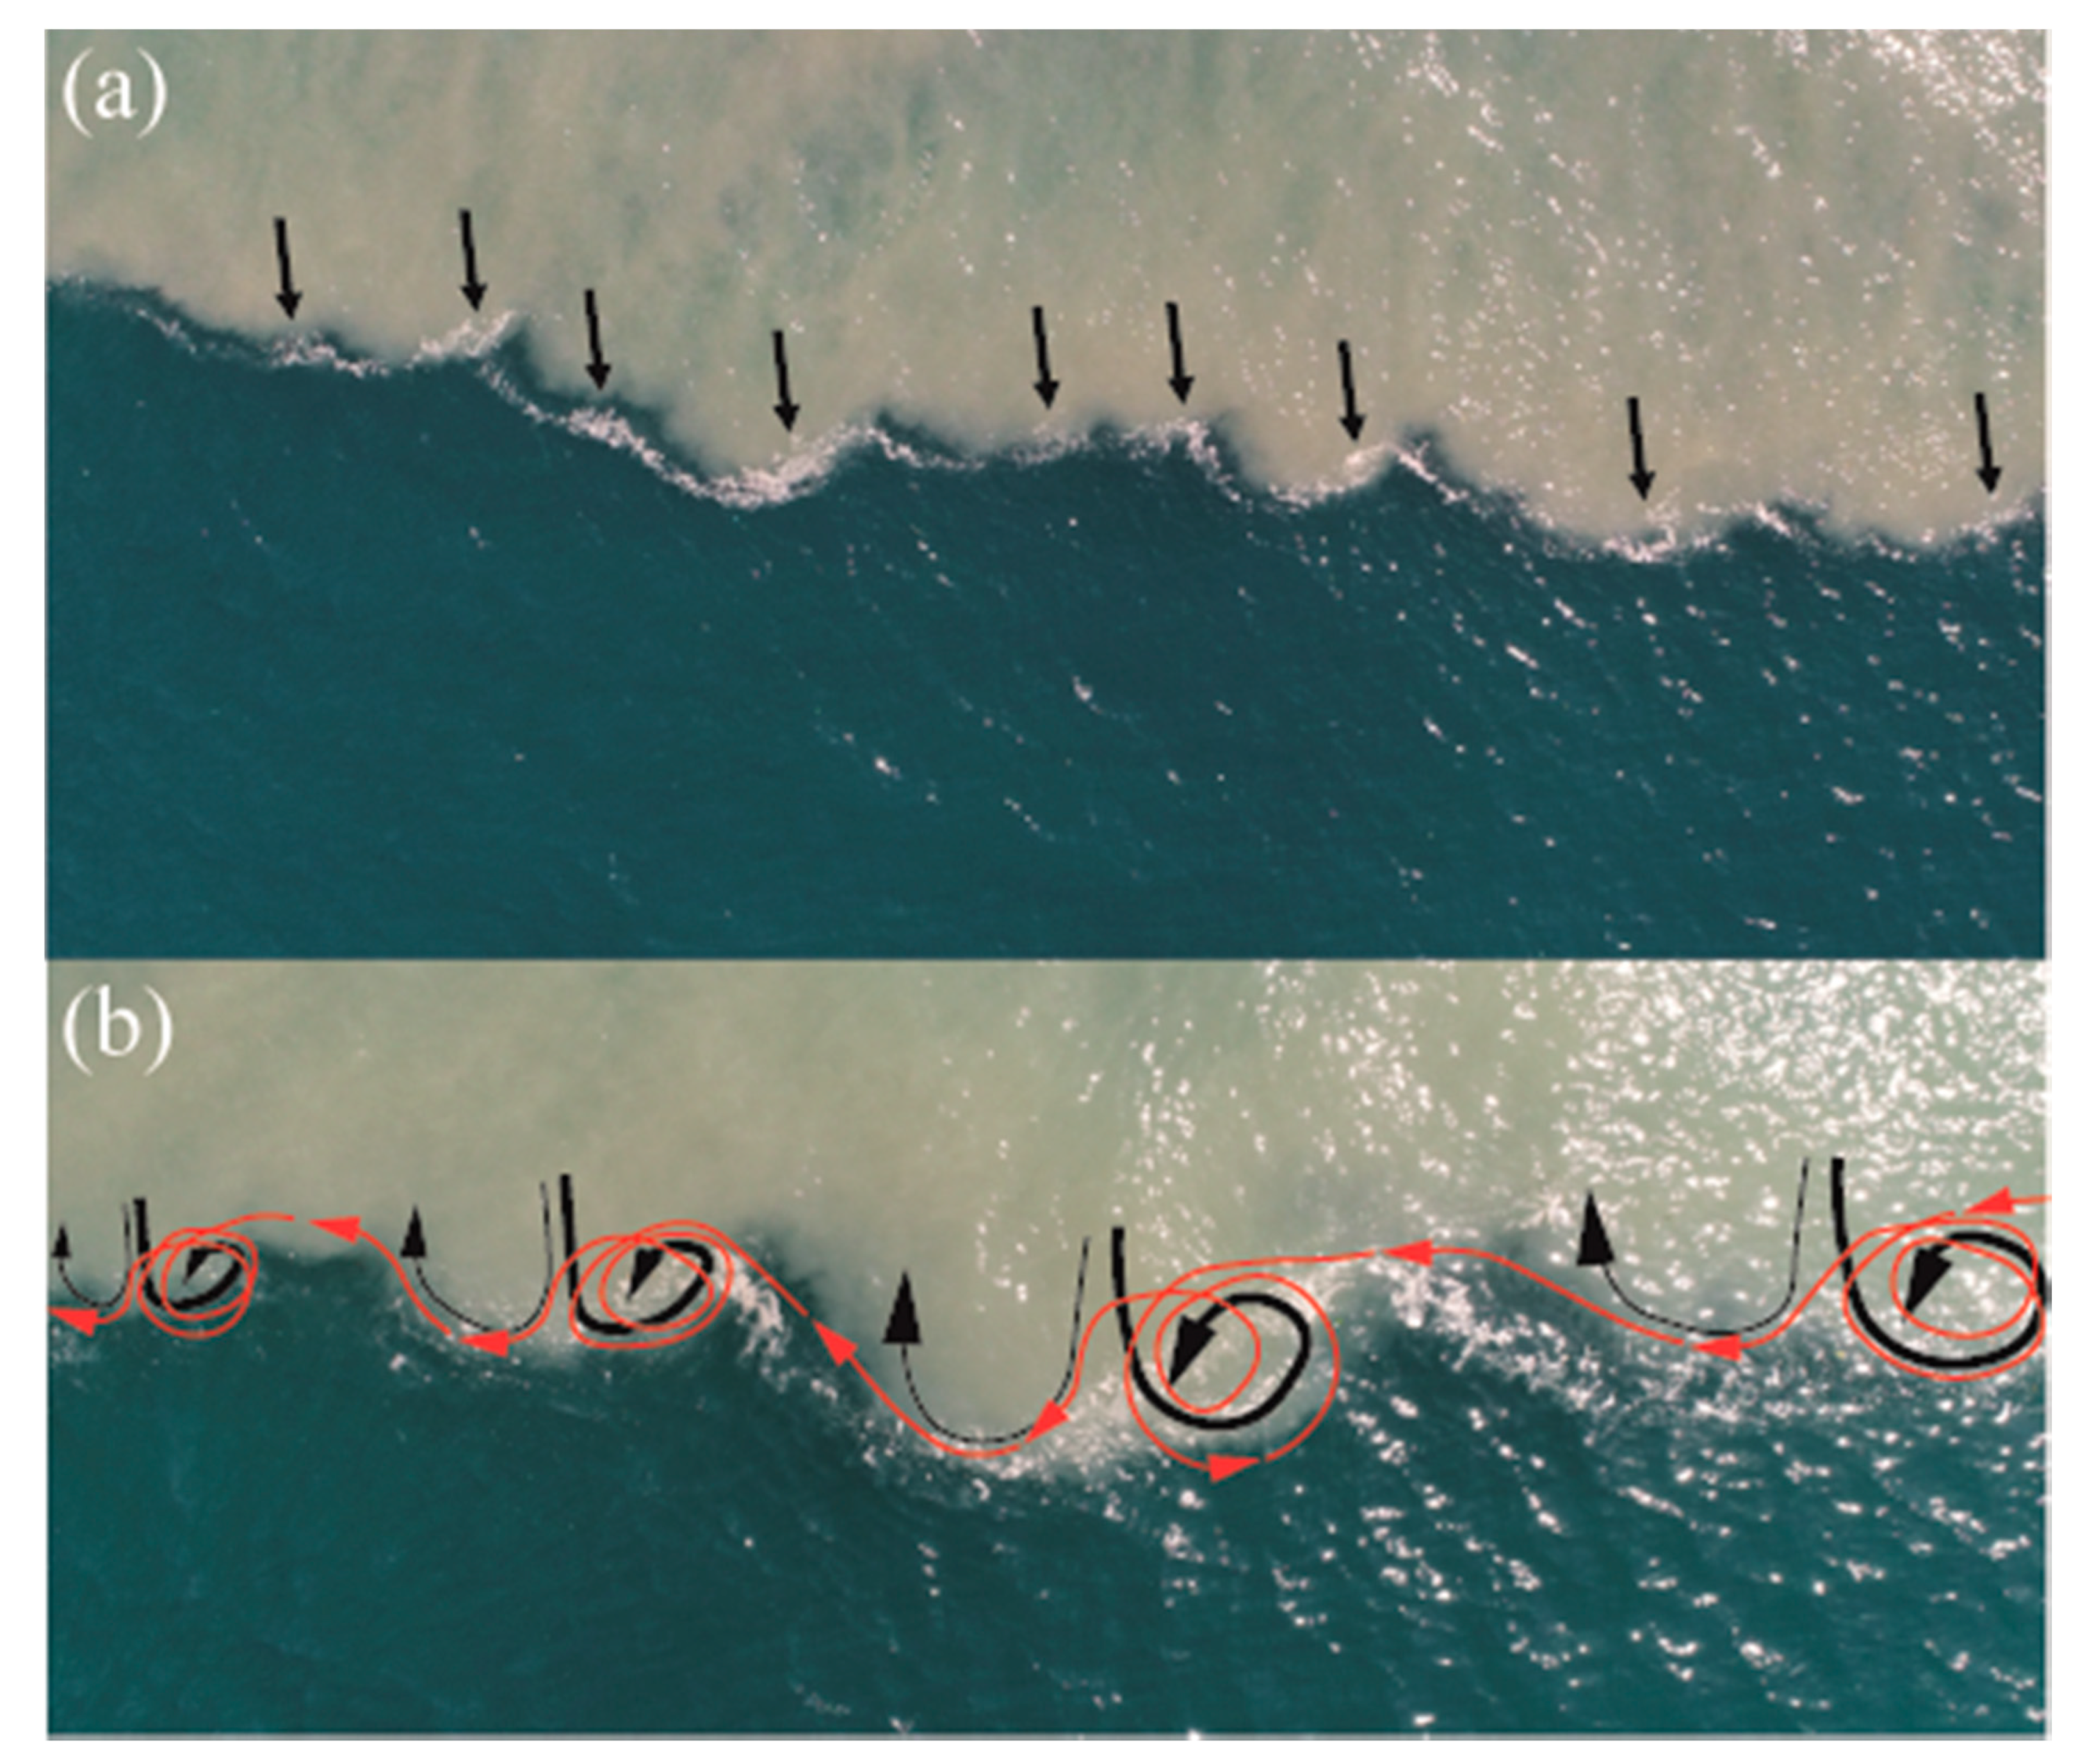
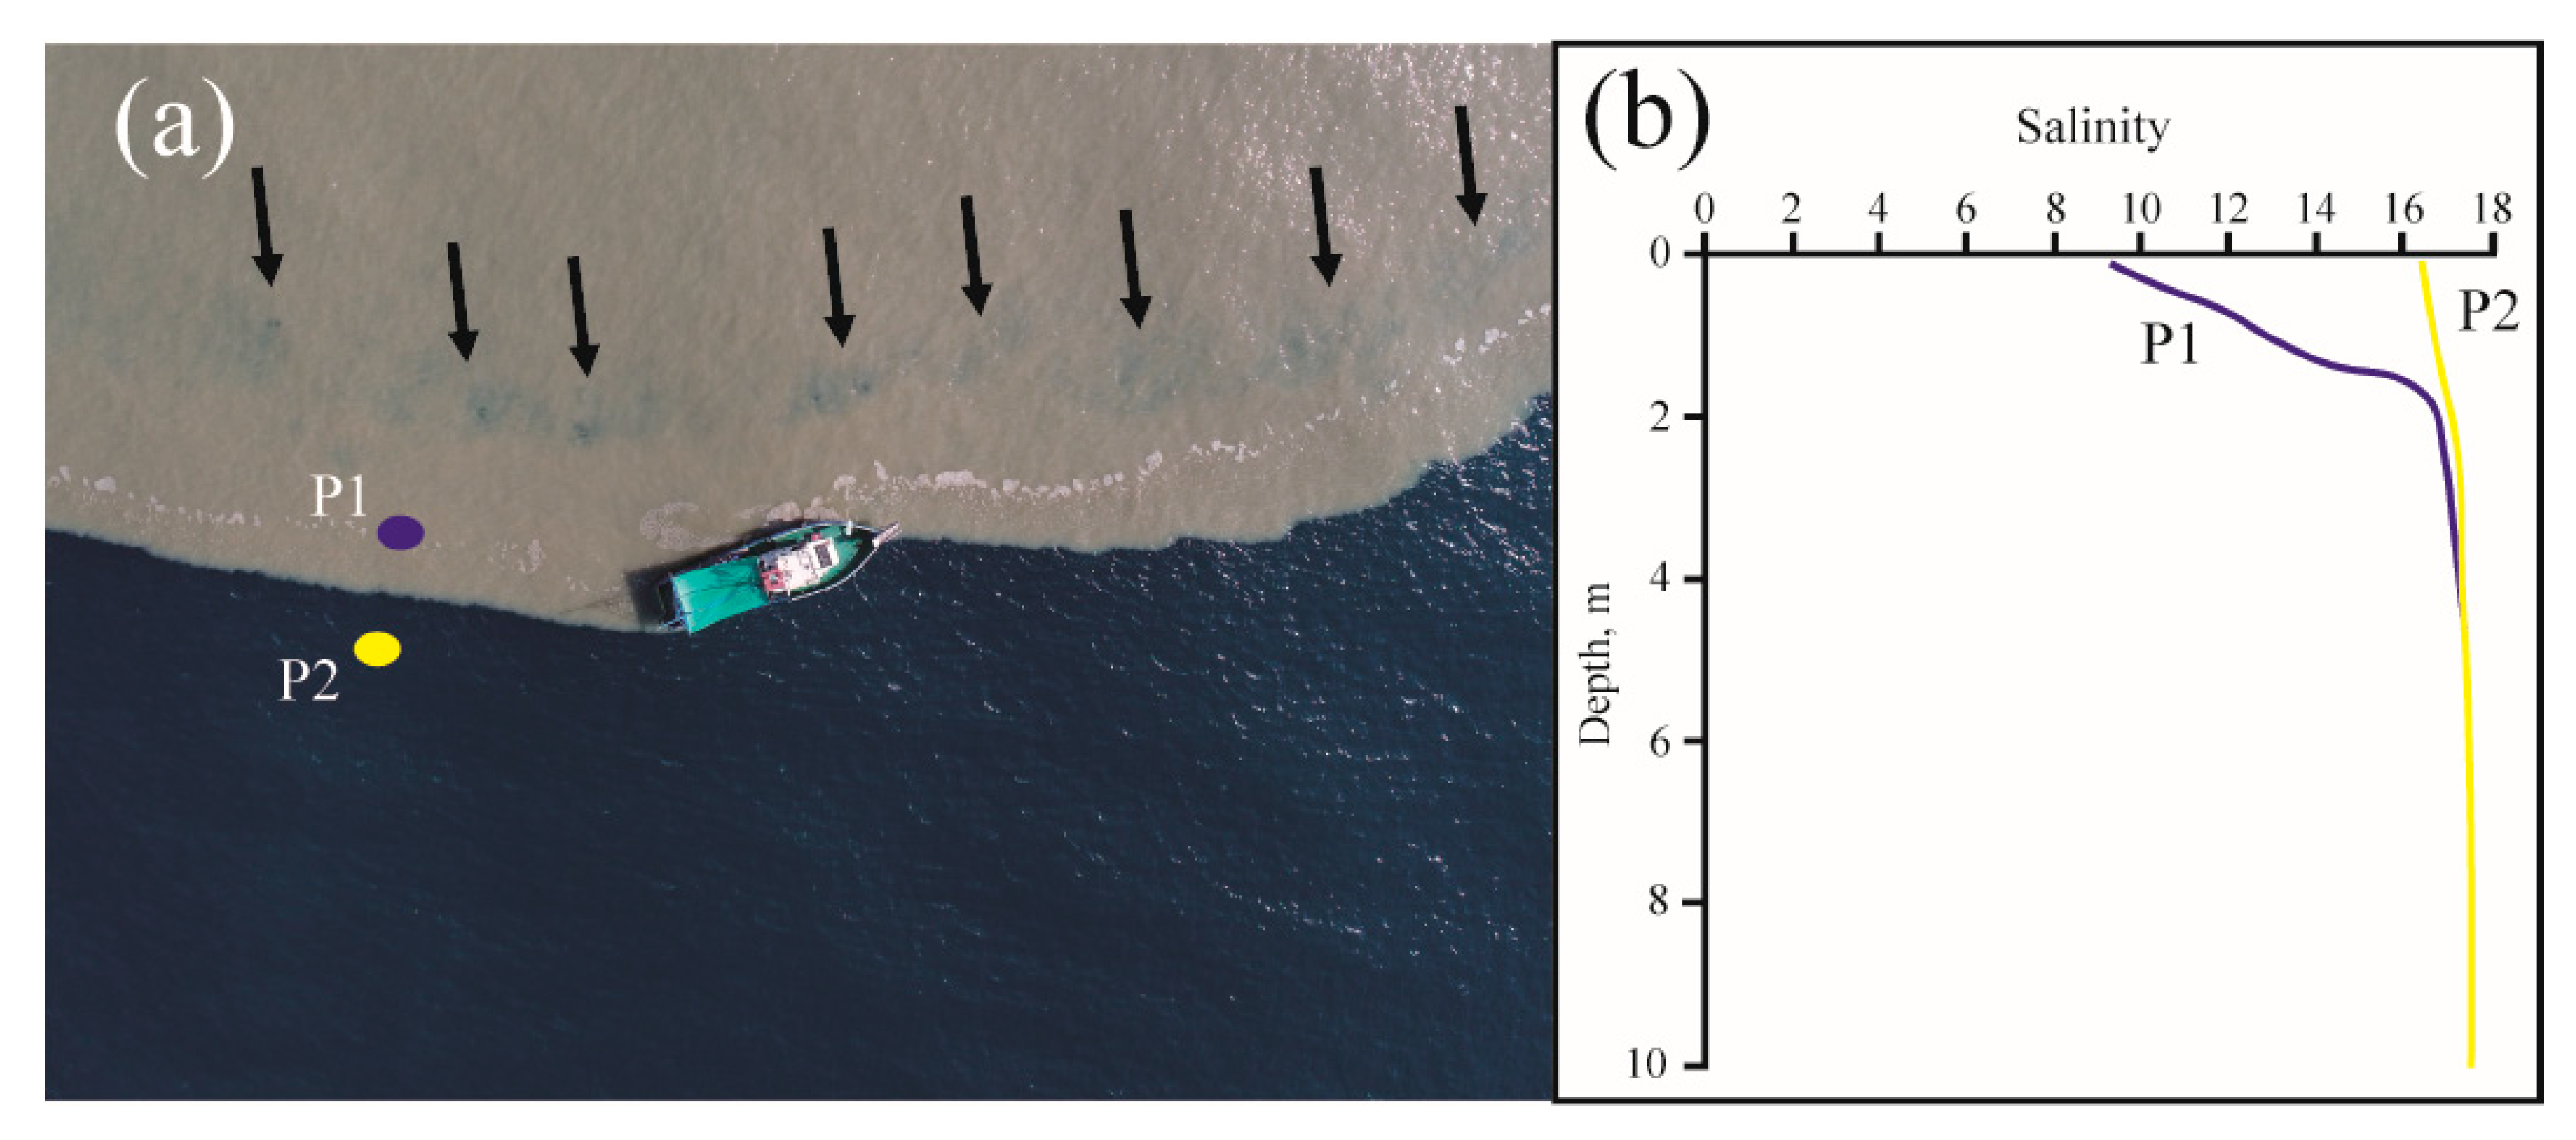
3.3. Undulate Borders of the Kodor and Bzyp plumes
4. Discussion
5. Conclusions
Supplementary Materials
Author Contributions
Funding
Acknowledgments
Conflicts of Interest
References
- Klemas, V.V. Airborne remote sensing of coastal features and processes: An overview. J. Coast. Res. 2013, 29, 239–255. [Google Scholar] [CrossRef]
- Holman, R.; Haller, M.C. Remote sensing of the nearshore. Annu. Rev. Mar. Sci. 2013, 5, 95–113. [Google Scholar] [CrossRef] [PubMed]
- Colomina, I.; Molina, P. Unmanned aerial systems for photogrammetry and remote sensing: A review. ISPRS J. Photogramm. 2014, 92, 79–97. [Google Scholar] [CrossRef]
- Klemas, V.V. Coastal and environmental remote sensing from unmanned aerial vehicles: An overview. J. Coast. Res. 2015, 31, 1260–1267. [Google Scholar] [CrossRef]
- Floreano, D.; Wood, R.J. Science, technology and the future of small autonomous drones. Nature 2015, 521, 460–466. [Google Scholar] [CrossRef]
- El Mahrad, B.; Newton, A.; Icely, J.D.; Kacimi, I.; Abalansa, S.; Snoussi, M. Contribution of remote sensing technologies to a holistic coastal and marine environmental management framework: A review. Remote Sens. 2020, 12, 2313. [Google Scholar] [CrossRef]
- Casella, E.; Rovere, A.; Pedroncini, A.; Stark, C.P.; Casella, M.; Ferrari, M.; Firpo, M. Drones as tools for monitoring beach topography changes in the Ligurian Sea (NW Mediterranean). Geo-Mar. Lett. 2016, 36, 151–163. [Google Scholar] [CrossRef]
- Topouzelis, K.; Papakonstantinou, A.; Doukari, M. Coastline change detection using unmanned aerial vehicles and image processing techniques. Fresenius Environ. Bull. 2017, 26, 5564–5571. [Google Scholar]
- Holman, R.A.; Holland, K.T.; Lalejini, D.M.; Spansel, S.D. Surf zone characterization from Unmanned Aerial Vehicle imagery. Ocean Dyn. 2011, 61, 1927–1935. [Google Scholar] [CrossRef]
- Turner, I.L.; Harley, M.D.; Drummond, C.D. UAVs for coastal surveying. Coast. Eng. 2016, 114, 19–24. [Google Scholar] [CrossRef]
- Papakonstantinou, A.; Topouzelis, K.; Pavlogeorgatos, G. Coastline zones identification and 3D coastal mapping using UAV spatial data. ISPRS Int. J. Geo-Inf. 2016, 5, 75. [Google Scholar] [CrossRef]
- Holman, R.A.; Brodie, K.L.; Spore, N.J. Surf zone characterization using a small quadcopter: Technical issues and procedures. IEEE Trans. Geosci. Remote Sens. 2017, 9, 2017–2027. [Google Scholar] [CrossRef]
- Ventura, D.; Bruno, M.; Lasinio, G.J.; Belluscio, A.; Ardizzone, G. A low-cost drone based application for identifying and mapping of coastal fish nursery grounds. Estuar. Coast. Shelf Sci. 2016, 171, 85–98. [Google Scholar] [CrossRef]
- Hodgson, A.; Kelly, N.; Peel, D. Unmanned aerial vehicles (UAVs) for surveying Marine Fauna: A dugong case study. PLoS ONE 2013, 8, e79556. [Google Scholar] [CrossRef]
- Burns, J.; Delparte, D.; Gates, R. Takabayashi Integrating structure-from-motion photogrammetry with geospatial software as a novel technique for quantifying 3D ecological characteristics of coral reefs. PeerJ 2015, 3, e1077. [Google Scholar] [CrossRef]
- Casella, E.; Collin, A.; Harris, D.; Ferse, S.; Bejarano, S.; Parravicini, V.; Hench, J.L.; Rovere, A. Mapping coral reefs using consumer-grade drones and structure from motion photogrammetry techniques. Coral Reefs 2017, 36, 269–275. [Google Scholar] [CrossRef]
- Fiori, L.; Doshi, A.; Martinez, E.; Orams, M.B.; Bollard-Breen, B. The use of unmanned aerial systems in marine mammal research. Remote Sens. 2017, 9, 543. [Google Scholar] [CrossRef]
- Murfitt, S.L.; Allan, B.M.; Bellgrove, A.; Rattray, A.; Young, M.A.; Ierodiaconou, D. Applications of unmanned aerial vehicles in intertidal reef monitoring. Sci. Rep. 2017, 7, 10259. [Google Scholar] [CrossRef]
- Torres, L.G.; Nieukirk, S.L.; Lemos, L.; Chandler, T.E. Drone up! Quantifying whale behavior from a new perspective improves observational capacity. Front. Mar. Sci. 2018, 5, 319. [Google Scholar] [CrossRef]
- Papakonstantinou, A.; Stamati, C.; Topouzelis, K. Comparison of true-color and multispectral unmanned aerial systems imagery for marine habitat mapping using object-based image analysis. Remote Sens. 2020, 12, 554. [Google Scholar] [CrossRef]
- Provost, E.J.; Butcher, P.A.; Coleman, M.A.; Kelaher, B.P. Assessing the viability of small aerial drones to quantify recreational fishers. Fish Manag. Ecol. 2020, 1–7. [Google Scholar] [CrossRef]
- Fallati, L.; Saponari, L.; Savini, A.; Marchese, F.; Corselli, C.; Galli, P. Multi-Temporal UAV Data and object-based image analysis (OBIA) for estimation of substrate changes in a post-bleaching scenario on a maldivian reef. Remote Sens. 2020, 12, 2093. [Google Scholar] [CrossRef]
- Hakvoort, H.; de Haan, J.; Jordans, R.; Vos, R.; Peters, S.; Rijkeboer, M. Towards airborne remote sensing of water quality in The Netherlands—validation and error analysis. ISPRS J. Photogramm. Remote Sens. 2002, 57, 171–183. [Google Scholar] [CrossRef]
- Klemas, V. Tracking oil slicks and predicting their trajectories using remote sensors and models: Case studies of the Sea Princess and Deepwater Horizon oil spills. J. Coast. Res. 2010, 26, 789–797. [Google Scholar] [CrossRef]
- Svejkovsky, J.; Nezlin, N.P.; Mustain, N.M.; Kum, J.B. Tracking stormwater discharge plumes and water quality of the Tijuana River with multispectral aerial imagery. Estuar. Coast. Shelf Sci. 2010, 87, 387–398. [Google Scholar] [CrossRef]
- Androulidakis, Y.; Kourafalou, V.; Ozgokmen, T.; Garcia-Pineda, O.; Lund, B.; Le Henaff, M.; Hu, C.; Haus, B.K.; Novelli, G.; Guigand, C.; et al. Influence of river-induced fronts on hydrocarbon transport: A multiplatform observational study. J. Geophys. Res. Oceans 2018, 123, 3259–3285. [Google Scholar] [CrossRef]
- Garaba, S.P.; Dierssen, H.M. An airborne remote sensing case study of synthetic hydrocarbon detection using short wave infrared absorption features identified from marine-harvested macro-and microplastics. Remote Sens. Environ. 2018, 205, 224–235. [Google Scholar] [CrossRef]
- Fallati, L.; Polidori, A.; Salvatore, C.; Saponari, L.; Savini, A.; Galli, P. Anthropogenic Marine Debris assessment with Unmanned Aerial Vehicle imagery and deep learning: A case study along the beaches of the Republic of Maldives. Sci. Total Environ. 2019, 693, 133581. [Google Scholar] [CrossRef]
- Savelyev, I.; Miller, W.D.; Sletten, M.; Smith, G.B.; Savidge, D.K.; Frick, G.; Menk, S.; Moore, T.; De Paolo, T.; Terrill, E.J.; et al. Airborne remote sensing of the upper ocean turbulence during CASPER-East. Remote Sens. 2018, 10, 1224. [Google Scholar] [CrossRef]
- Stresser, M.; Carrasco, R.; Horstmann, J. Video-based estimation of surface currents using a low-cost quadcopter. IEEE Geosci. Remote Sens. Lett. 2017, 14, 2027–2031. [Google Scholar] [CrossRef]
- Jung, D.; Lee, J.S.; Baek, J.Y.; Nam, J.; Jo, Y.H.; Song, K.M.; Cheong, Y.I. High temporal and spatial resolutions of sea surface current from low-altitude remote sensing. J. Coast. Res. 2019, 90, 282–288. [Google Scholar] [CrossRef]
- Ouillon, S.; Forget, P.; Froidefond, J.M.; Naudin, J.J. Estimating suspended matter concentrations from SPOT data and from field measurements in the Rhône river plume. Mar. Technol. Soc. J. 1997, 31, 15. [Google Scholar]
- Osadchiev, A.A. Small mountainous rivers generate high-frequency internal waves in coastal ocean. Sci. Rep. 2018, 8, 16609. [Google Scholar] [CrossRef] [PubMed]
- Devlin, M.J.; McKinna, L.W.; Alvarez-Romero, J.G.; Petus, C.; Abott, B.; Harkness, P.; Brodie, J. Mapping the pollutants in surface riverine flood plume waters in the Great Barrier Reef, Australia. Mar. Poll. Bull. 2012, 65, 224–235. [Google Scholar] [CrossRef] [PubMed]
- Brando, V.E.; Braga, F.; Zaggia, L.; Giardino, C.; Bresciani, M.; Matta, E.; Bellafiore, D.; Ferrarin, C.; Maicu, F.; Benetazzo, A.; et al. High-resolution satellite turbidity and sea surface temperature observations of river plume interactions during a significant flood event. Ocean Sci. 2015, 11, 909. [Google Scholar] [CrossRef]
- Nezlin, N.P.; DiGiacomo, P.M. Satellite ocean color observations of stormwater runoff plumes along the San Pedro Shelf (southern California) during 1997 to 2003. Continent. Shelf Res. 2005, 25, 1692–1711. [Google Scholar] [CrossRef]
- Osadchiev, A.A.; Sedakov, R.O. Spreading dynamics of small river plumes off the northeastern coast of the Black Sea observed by Landsat 8 and Sentinel-2. Remote Sens. Environ. 2019, 221, 522–533. [Google Scholar] [CrossRef]
- Nezlin, N.P.; DiGiacomo, P.M.; Stein, E.D.; Ackerman, D. Stormwater runoff plumes observed by SeaWiFS radiometer in the Southern California Bight. Remote Sens. Environ. 2005, 98, 494–510. [Google Scholar] [CrossRef]
- Constantin, S.; Doxaran, D.; Constantinescu, Ș. Estimation of water turbidity and analysis of its spatio-temporal variability in the Danube River plume (Black Sea) using MODIS satellite data. Cont. Shelf Res. 2016, 112, 14–30. [Google Scholar] [CrossRef]
- Gangloff, A.; Verney, R.; Doxaran, D.; Ody, A.; Estournel, C. Investigating Rhône River plume (Gulf of Lions, France) dynamics using metrics analysis from the MERIS 300m Ocean Color archive (2002–2012). Cont. Shelf Res. 2017, 144, 98–111. [Google Scholar] [CrossRef]
- Warrick, J.A.; Mertes, L.A.; Washburn, L.; Siegel, D.A. A conceptual model for river water and sediment dispersal in the Santa Barbara Channel, California. Cont. Shelf Res. 2004, 24, 2029–2043. [Google Scholar] [CrossRef]
- Lihan, T.; Saitoh, S.I.; Iida, T.; Hirawake, T.; Iida, K. Satellite-measured temporal and spatial variability of the Tokachi River plume. Estuar. Coast. Shelf Sci. 2008, 78, 237–249. [Google Scholar] [CrossRef]
- Jiang, L.; Yan, X.H.; Klemas, V. Remote sensing for the identification of coastal plumes: Case studies of Delaware Bay. Int. J. Remote Sens. 2009, 30, 2033–2048. [Google Scholar] [CrossRef]
- Grodsky, S.A.; Reverdin, G.; Carton, J.A.; Coles, V.J. Year-to-year salinity changes in the Amazon plume: Contrasting 2011 and 2012 Aquarius/SACD and SMOS satellite data. Remote Sens. Environ. 2014, 140, 14–22. [Google Scholar] [CrossRef]
- Reul, N.; Quilfen, Y.; Chapron, B.; Fournier, S.; Kudryavtsev, V.; Sabia, R. Multisensor observations of the Amazon-Orinoco river plume interactions with hurricanes. J. Geophys. Res. Oceans 2014, 119, 8271–8295. [Google Scholar] [CrossRef]
- Korosov, A.; Counillon, F.; Johannessen, J.A. Monitoring the spreading of the A mazon freshwater plume by MODIS, SMOS, A quarius, and TOPAZ. J. Geophys. Res. Oceans 2015, 120, 268–283. [Google Scholar] [CrossRef]
- Hessner, K.; Rubino, A.; Brandt, P.; Alpers, W. The Rhine outflow plume studied by the analysis of synthetic aperture radar data and numerical simulations. J. Phys. Oceanogr. 2001, 31, 3030–3044. [Google Scholar] [CrossRef]
- DiGiacomo, P.M.; Washburn, L.; Holt, B.; Jones, B.H. Coastal pollution hazards in southern California observed by SAR imagery: Stormwater plumes, wastewater plumes, and natural hydrocarbon seeps. Mar. Poll. Bull. 2004, 49, 1013–1024. [Google Scholar] [CrossRef]
- Zheng, Q.; Clemente-Colón, P.; Yan, X.H.; Liu, W.T.; Huang, N.E. Satellite synthetic aperture radar detection of Delaware Bay plumes: Jet-like feature analysis. J. Geophys. Res. Oceans 2004, 109, C03031. [Google Scholar] [CrossRef]
- Perez, T.; Wesson, J.; Burrage, D. Airborne remote sensing of the Rio de la Plata plume using STARRS. Sea Technol. 2006, 47, 31–34. [Google Scholar]
- Burrage, D.; Wesson, J.; Martinez, C.; Perez, T.; Moller, O., Jr.; Piola, A. Patos Lagoon outflow within the Río de la Plata plume using an airborne salinity mapper: Observing an embedded plume. Cont. Shelf Res. 2008, 28, 1625–1638. [Google Scholar] [CrossRef]
- Horner-Devine, A.; Chickadel, C.C.; MacDonald, D. Coherent structures and mixing at a river plume front. In Coherent Flow Structures in Geophysical Flows at the Earth’s Surface; Venditti, J., Best, J.L., Church, M., Hardy, R.J., Eds.; Wiley: Chichester, UK, 2013; pp. 359–369. [Google Scholar] [CrossRef]
- Horner-Devine, A.R.; Chickadel, C.C. Lobe-cleft instability in the buoyant gravity current generated by estuarine outflow. Geophys. Res. Lett. 2017, 44, 5001–5007. [Google Scholar] [CrossRef]
- Milliman, J.D.; Syvitski, J.P.M. Geomorphic-tectonic control of sediment discharge to the ocean: The importance of small mountainous rivers. J. Geol. 1992, 100, 525–544. [Google Scholar] [CrossRef]
- Milliman, J.D.; Farnsworth, K.L.; Albertin, C.S. Flux and fate of fluvial sediments leaving large islands in the East Indies. J. Sea Res. 1999, 41, 97–107. [Google Scholar] [CrossRef]
- Milliman, J.D.; Lin, S.W.; Kao, S.J.; Liu, J.P.; Liu, C.S.; Chiu, J.K.; Lin, Y.C. Short-term changes in seafloor character due to flood-derived hyperpycnal discharge: Typhoon Mindulle, Taiwan, July 2004. Geology 2007, 35, 779–782. [Google Scholar] [CrossRef]
- Osadchiev, A.A.; Zavialov, P.O. Structure and dynamics of plumes generated by small rivers. In Estuaries and Coastal Zones—Dynamics and Response to Environmental Changes; Pan, J., Ed.; IntechOpen: London, UK, 2019. [Google Scholar] [CrossRef][Green Version]
- Korotkina, О. A.; Zavialov, P.O.; Osadchiev, А. A. Submesoscale variability of the current and wind fields in the coastal region of Sochi. Oceanology 2011, 51, 745–754. [Google Scholar] [CrossRef]
- Korotkina, О. A.; Zavialov, P.O.; Osadchiev, А. A. Synoptic variability of currents in the coastal waters of Sochi. Oceanology 2014, 54, 545–556. [Google Scholar] [CrossRef]
- Xia, M.; Xie, L.; Pietrafesa, L.J. Winds and the orientation of a coastal plane estuary plume. Geophys. Res. Lett. 2010, 37, L19601. [Google Scholar] [CrossRef]
- Xia, M.; Xie, L.; Pietrafesa, L.J.; Whitney, M.M. The ideal response of a Gulf of Mexico estuary plume to wind forcing: Its connection with salt flux and a Lagrangian view. J. Geophys. Res. Oceans 2011, 116, C8. [Google Scholar] [CrossRef]
- Zavialov, P.O.; Makkaveev, P.N.; Konovalov, B.V.; Osadchiev, A.A.; Khlebopashev, P.V.; Pelevin, V.V.; Grabovskiy, A.B.; Izhitskiy, A.S.; Goncharenko, I.V.; Soloviev, D.M.; et al. Hydrophysical and hydrochemical characteristics of the sea areas adjacent to the estuaries of small rivers if the Russian coast of the Black Sea. Oceanology 2014, 54, 265–280. [Google Scholar] [CrossRef]
- Osadchiev, A.A. A method for quantifying freshwater discharge rates from satellite observations and Lagrangian numerical modeling of river plumes. Environ. Res. Lett. 2015, 10, 085009. [Google Scholar] [CrossRef]
- Osadchiev, A.A. Estimation of river discharge based on remote sensing of a river plume. In Proceedings of the SPIE Remote Sensing, Toulouse, France, 14 October 2015. [Google Scholar] [CrossRef]
- Jaoshvili, S. The rivers of the Black Sea; Chomeriki, I., Gigineishvili, G., Kordzadze, A., Eds.; Technical Report No. 71; European Environmental Agency: Copenhagen, Denmark, 2002. [Google Scholar]
- Korotaev, G.; Oguz, T.; Nikiforov, A.; Koblinsky, C. Seasonal, interannual, and mesoscale variability of the Black Sea upper layer circulation derived from altimeter data. J. Geophys. Res. 2003, 108, 3122. [Google Scholar] [CrossRef]
- Ivanov, V.A.; Belokopytov, V.N. Oceanography of the Black Sea; ECOSY-Gidrofizika: Sevastopol, Ukraine, 2013. [Google Scholar]
- Ginzburg, A.I.; Kostianoy, A.G.; Krivosheya, V.G.; Nezlin, N.P.; Soloviev, D.M.; Stanichny, S.V.; Yakubenko, V.G. Mesoscale eddies and related processes in the northeastern Black Sea. J. Mar. Syst. 2002, 32, 71–90. [Google Scholar] [CrossRef]
- Zatsepin, A.G.; Ginzburg, A.I.; Kostianoy, A.G.; Kremenetskiy, V.V.; Krivosheya, V.G.; Poulain, P.-M.; Stanichny, S.V. Observation of Black Sea mesoscale eddies and associated horizontal mixing. J. Geophys. Res. 2003, 108, 1–27. [Google Scholar] [CrossRef]
- Kubryakov, A.A.; Stanichny, S.V. Seasonal and interannual variability of the Black Sea eddies and its dependence on characteristics of the large-scale circulation. Deep Sea Res. 2015, 97, 80–91. [Google Scholar] [CrossRef]
- Medvedev, I.P.; Rabinovich, A.B.; Kulikov, E.A. Tides in three enclosed basins: The Baltic, Black, and Caspian seas. Front. Mar. Sci. 2016, 3, 46. [Google Scholar] [CrossRef]
- Medvedev, I.P. Tides in the Black Sea: Observations and numerical modelling. Pure Appl. Geophys. 2018, 175, 1951–1969. [Google Scholar] [CrossRef]
- Podymov, O.I.; Zatsepin, A.G. Seasonal anomalies of water salinity in the Gelendzhik region of the Black Sea according to shipborne monitoring data. Oceanology 2016, 56, 342–354. [Google Scholar] [CrossRef]
- Doukari, M.; Batsaris, M.; Papakonstantinou, A.; Topouzelis, K. A protocol for aerial survey in coastal areas using UAS. Remote Sens. 2019, 11, 1913. [Google Scholar] [CrossRef]
- Zavialov, P.O.; Izhitskiy, A.S.; Osadchiev, A.A.; Pelevin, V.V.; Grabovskiy, A.B. The structure of thermohaline and bio-optical fields in the surface layer of the Kara Sea in September 2011. Oceanology 2015, 55, 461–471. [Google Scholar] [CrossRef]
- Baker, S.; Scharstein, D.; Lewis, J.; Roth, S.; Black, M.; Szeliski, R. A database and evaluation methodology for optical flow. Int. J. Comp. Vis. 2011, 92, 1–31. [Google Scholar] [CrossRef]
- Fortun, D.; Bouthemy, P.; Kervrann, C. Optical flow modeling and computation: A survey. Comput. Vis. Image Underst. 2015, 134, 1–21. [Google Scholar] [CrossRef]
- Farneback, G. Two-frame motion estimation based on polynomial expansion. In Proceedings of the 13th Scandinavian Conference on Image Analysis, Halmstad, Sweden, 29 June–2 July 2003; Bigun, J., Gustavsson, T., Eds.; Springer: Berlin/Heidelberg, Germany. [Google Scholar] [CrossRef]
- O’Donnell, J.; Ackleson, S.G.; Levine, E.R. On the spatial scales of a river plume. J. Geophys. Res. Oceans 2008, 113, C4. [Google Scholar] [CrossRef]
- Horner-Devine, A.R.; Hetland, R.D.; MacDonald, D.G. Mixing and transport in coastal river plumes. Ann. Rev. Mar. Sci. 2015, 47, 569–594. [Google Scholar] [CrossRef]
- Zavialov, P.O.; Pelevin, V.V.; Belyaev, N.A.; Izhitskiy, A.S.; Konovalov, B.V.; Krementskiy, V.V.; Goncharenko, I.V.; Osadchiev, A.A.; Soloviev, D.M.; Garcia, C.A.E.; et al. High resolution LiDAR measurements reveal fine internal structure and variability of sediment-carrying coastal plume. Estuar. Coast. Shelf Sci. 2018, 205, 40–45. [Google Scholar] [CrossRef]
- Yankovsky, A.E.; Chapman, D.C. A simple theory for the fate of buoyant coastal discharges. J. Phys. Oceanogr. 1997, 27, 1386–1401. [Google Scholar] [CrossRef]
- Fong, D.A.; Geyer, W.R. The alongshore transport of freshwater in a surface-trapped river plume. J. Phys. Oceanogr. 2002, 32, 957–972. [Google Scholar] [CrossRef]
- Whitney, M.M.; Garvine, R.W. Wind influence on a coastal buoyant outflow. J. Geophys. Res. 2005, 110, C03014. [Google Scholar] [CrossRef]
- Choi, B.-J.; Wilkin, J.L. The effect of wind on the dispersal of the Hudson River plume. J. Phys. Oceanogr. 2007, 37, 1878–1897. [Google Scholar] [CrossRef]
- Warrick, J.A.; Farnsworth, K.L. Coastal river plumes: Collisions and coalescence. Prog. Oceanogr. 2017, 151, 245–260. [Google Scholar] [CrossRef]
- Osadchiev, A.A.; Korshenko, E.A. Small river plumes off the north-eastern coast of the Black Sea under average climatic and flooding discharge. Ocean Sci. 2017, 13, 465–482. [Google Scholar] [CrossRef]
- Osadchiev, A.A.; Sedakov, R.O. Reconstruction of ocean surface currents using near simultaneous satellite imagery. In Proceedings of the International Geosciences and Remote Sensing Symposium, Yokohama, Japan, 28 July–2 August 2019; IEEE: New York, NY, USA. [Google Scholar] [CrossRef]
- Alexeevsky, N.I.; Magritsky, D.V.; Koltermann, K.P.; Krylenko, I.N.; Toropov, P.A. Causes and systematics of inundations of the Krasnodar territory on the Russian Black Sea coast. Nat. Hazard. Earth Syst. 2016, 16, 1289–1308. [Google Scholar] [CrossRef]
- Marchevsky, I.K.; Osadchiev, A.A.; Popov, A.Y. Numerical modelling of high-frequency internal waves generated by river discharge in coastal ocean. In Proceedings of the 5th International Conference on Geographical Information Systems Theory, Applications and Management, Heraklion, Crete, Greece, 3–5 May 2019; Scitepress: Setubal, Portugal. [Google Scholar] [CrossRef]
- McPherson, R.A.; Stevens, C.L.; O’Callaghan, J.M.; Lucas, A.J.; Nash, J.D. The role of turbulence and internal waves in the structure and evolution of a near-field river plume. Ocean Sci. 2020, 16, 799–815. [Google Scholar] [CrossRef]
- O’Donnell, J.; Marmorino, G.O.; Trump, C.L. Convergence and downwelling at a river plume front. J. Phys. Oceanogr. 1998, 28, 1481–1495. [Google Scholar] [CrossRef]
- Zhurbas, V.; Väli, G.; Kuzmina, N. Rotation of floating particles in submesoscale cyclonic and anticyclonic eddies: A model study for the southeastern Baltic Sea. Ocean Sci. 2019, 15, 1691–1705. [Google Scholar] [CrossRef]
- Garvine, R.W. Estuary plumes and fronts in shelf waters: A layer model. J. Phys. Oceanogr. 1987, 17, 1877–1896. [Google Scholar] [CrossRef]
- O’Donnell, J. The formation and fate of a river plume: A numerical model. J. Phys. Oceanogr. 1990, 20, 551–569. [Google Scholar] [CrossRef]
- Hetland, R.D. Relating river plume structure to vertical mixing. J. of Phys. Oceanogr. 2005, 35, 1667–1688. [Google Scholar] [CrossRef]
- Saldias, G.S.; Sobarzo, M.; Largier, J.; Moffat, C.; Letelier, R. Seasonal variability of turbid river plumes off central Chile based on high-resolution MODIS imagery. Remote Sens. Env. 2012, 123, 220–233. [Google Scholar] [CrossRef]
- Saldias, G.S.; Largier, J.L.; Mendes, R.; Perez-Santos, I.; Vargas, C.A.; Sobarzo, M. Satellite-measured interannual variability of turbid river plumes off central-southern Chile: Spatial patterns and the influence of climate variability. Progr. Oceanogr. 2016, 146, 212–222. [Google Scholar] [CrossRef]
- Osadchiev, A.A.; Izhitskiy, A.S.; Zavialov, P.O.; Kremenetskiy, V.V.; Polukhin, A.A.; Pelevin, V.V.; Toktamysova, Z.M. Structure of the buoyant plume formed by Ob and Yenisei river discharge in the southern part of the Kara Sea during summer and autumn. J. Geophys. Res. Oceans 2017, 122, 5916–5935. [Google Scholar] [CrossRef]
- Gong, W.; Chen, L.; Chen, Z.; Zhang, H. Plume-to-plume interactions in the Pearl River Delta in winter. Ocean Coast. Manag. 2019, 175, 110–126. [Google Scholar] [CrossRef]
- Warrick, J.A.; Mertes, L.A.K.; Washburn, L.; Siegel, D.A. Dispersal forcing of southern California river plumes, based on field and remote sensing observations. Geo-Mar. Lett. 2004, 24, 46–52. [Google Scholar] [CrossRef]
- Osadchiev, A.A.; Korotenko, K.A.; Zavialov, P.O.; Chiang, W.-S.; Liu, C.-C. Transport and bottom accumulation of fine river sediments under typhoon conditions and associated submarine landslides: Case study of the Peinan River, Taiwan. Nat. Haz. Earth Syst. Sci. 2016, 16, 41–54. [Google Scholar] [CrossRef]
- Romero, L.; Siegel, D.A.; McWilliams, J.C.; Uchiyama, Y.; Jones, C. Characterizing storm water dispersion and dilution from small coastal streams. J. Geophys. Res. Oceans 2016, 121, 3926–3943. [Google Scholar] [CrossRef]
- Yankovsky, A.E.; Hickey, B.M.; Münchow, A.K. Impact of variable inflow on the dynamics of a coastal buoyant plume. J. Geophys. Res. Oceans 2001, 106, 19809–19824. [Google Scholar] [CrossRef]
- Yuan, Y.; Horner-Devine, A.R.; Avener, M.; Bevan, S. The role of periodically varying discharge on river plume structure and transport. Cont. Shelf Res. 2018, 158, 15–25. [Google Scholar] [CrossRef]
- Yankovsky, A.E.; Voulgaris, G. Response of a Coastal Plume Formed by Tidally Modulated Estuarine Outflow to Light Upwelling-Favorable Wind. J. Phys. Oceanogr. 2019, 49, 691–703. [Google Scholar] [CrossRef]
- Cole, K.L.; MacDonald, D.G.; Kakoulaki, G.; Hetland, R.D. River plume source-front connectivity. Ocean Model. 2020, 150, 101571. [Google Scholar] [CrossRef]
- Horner-Devine, A.R.; Jay, D.A.; Orton, P.M.; Spahna, E.Y. A conceptual model of the strongly tidal Columbia River plume. J. Mar. Syst. 2008, 78, 460–475. [Google Scholar] [CrossRef]
- Avicola, G.; Huq, P. Scaling analysis for the interaction between a buoyant coastal current and the continental shelf: Experiments and observations. J. Phys. Oceanogr. 2002, 32, 3233–3248. [Google Scholar] [CrossRef]
- Lentz, S.J.; Helfrich, K.R. Buoyant gravity currents along a sloping bottom in a rotating fluid. J. Fluid. Mech. 2002, 464, 251–278. [Google Scholar] [CrossRef]
- Pimenta, F.M.; Kirwan, A.D., Jr.; Huq, P. On the transport of buoyant coastal plumes. J. Phys. Oceanogr. 2011, 41, 620–640. [Google Scholar] [CrossRef]
- Korotenko, K.A.; Osadchiev, A.A.; Zavialov, P.O.; Kao, R.-C.; Ding, C.-F. Effects of bottom topography on dynamics of river discharges in tidal regions: Case study of twin plumes in Taiwan Strait. Ocean Sci. 2014, 10, 865–879. [Google Scholar] [CrossRef]
- Ostrander, C.E.; McManus, M.A.; DeCarlo, E.H.; Mackenzie, F.T. Temporal and spatial variability of freshwater plumes in a semi-enclosed estuarine–bay system. Estuaries Coasts 2008, 31, 192–203. [Google Scholar] [CrossRef]
- Osadchiev, A.A.; Zavialov, P.O. Lagrangian model for surface-advected river plume. Cont. Shelf Res. 2013, 58, 96–106. [Google Scholar] [CrossRef]
- Zhao, J.; Gong, W.; Shen, J. The effect of wind on the dispersal of a tropical small river plume. Front. Earth Sci. 2018, 12, 170–190. [Google Scholar] [CrossRef]
- Mityagina, M.I.; Lavrova, O.Y.; Karimova, S.S. Multi-sensor survey of seasonal variability in coastal eddy and internal wave signatures in the north-eastern Black Sea. Int. J. Remote Sens. 2010, 31, 4779–4790. [Google Scholar] [CrossRef]
- Lavrova, O.Y.; Mityagina, M.I. Satellite survey of internal waves in the Black and Caspian seas. Int. J. Remote Sens. 2017, 9, 892. [Google Scholar] [CrossRef]
- Trump, C.L.; Marmorino, G.O. Mapping small-scale along-front structure using ADCP acoustic backscatter range-bin data. Estuaries 2003, 26, 878–884. [Google Scholar] [CrossRef]
- Warrick, J.A.; Stevens, A.W. A buoyant plume adjacent to a headland—Observations of the Elwha River plume. Continent Shelf Res. 2011, 31, 85–97. [Google Scholar] [CrossRef]

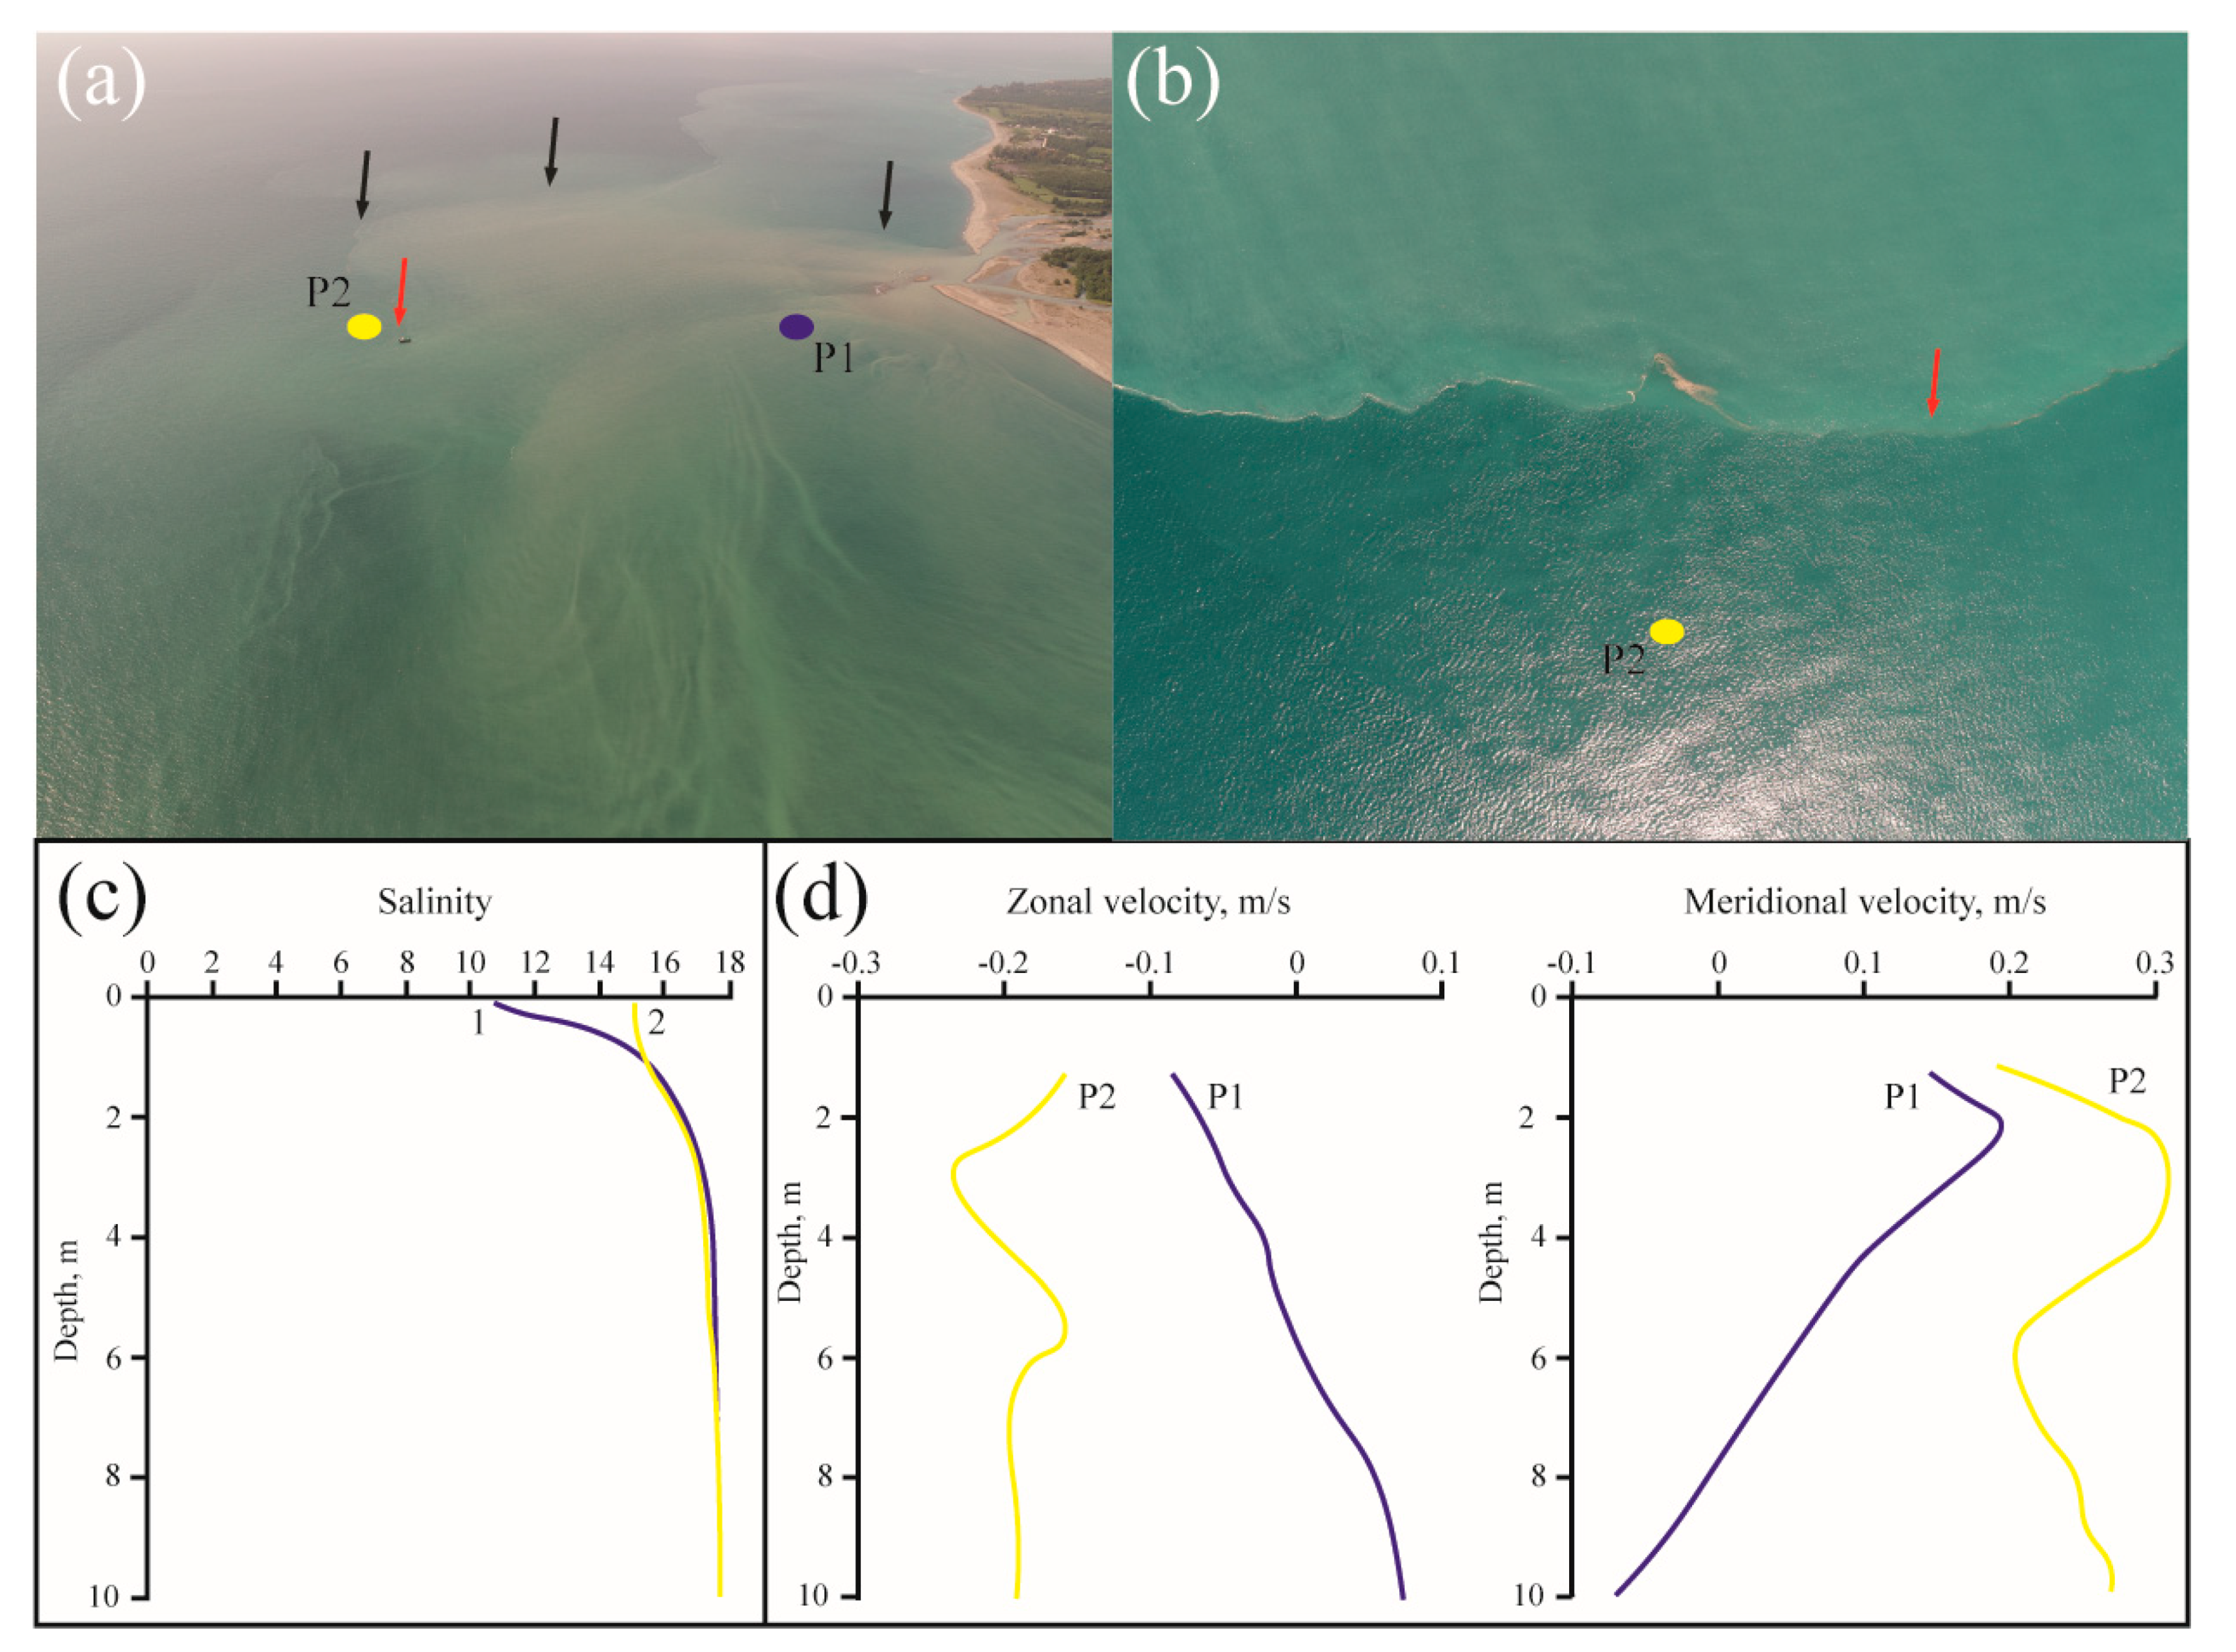
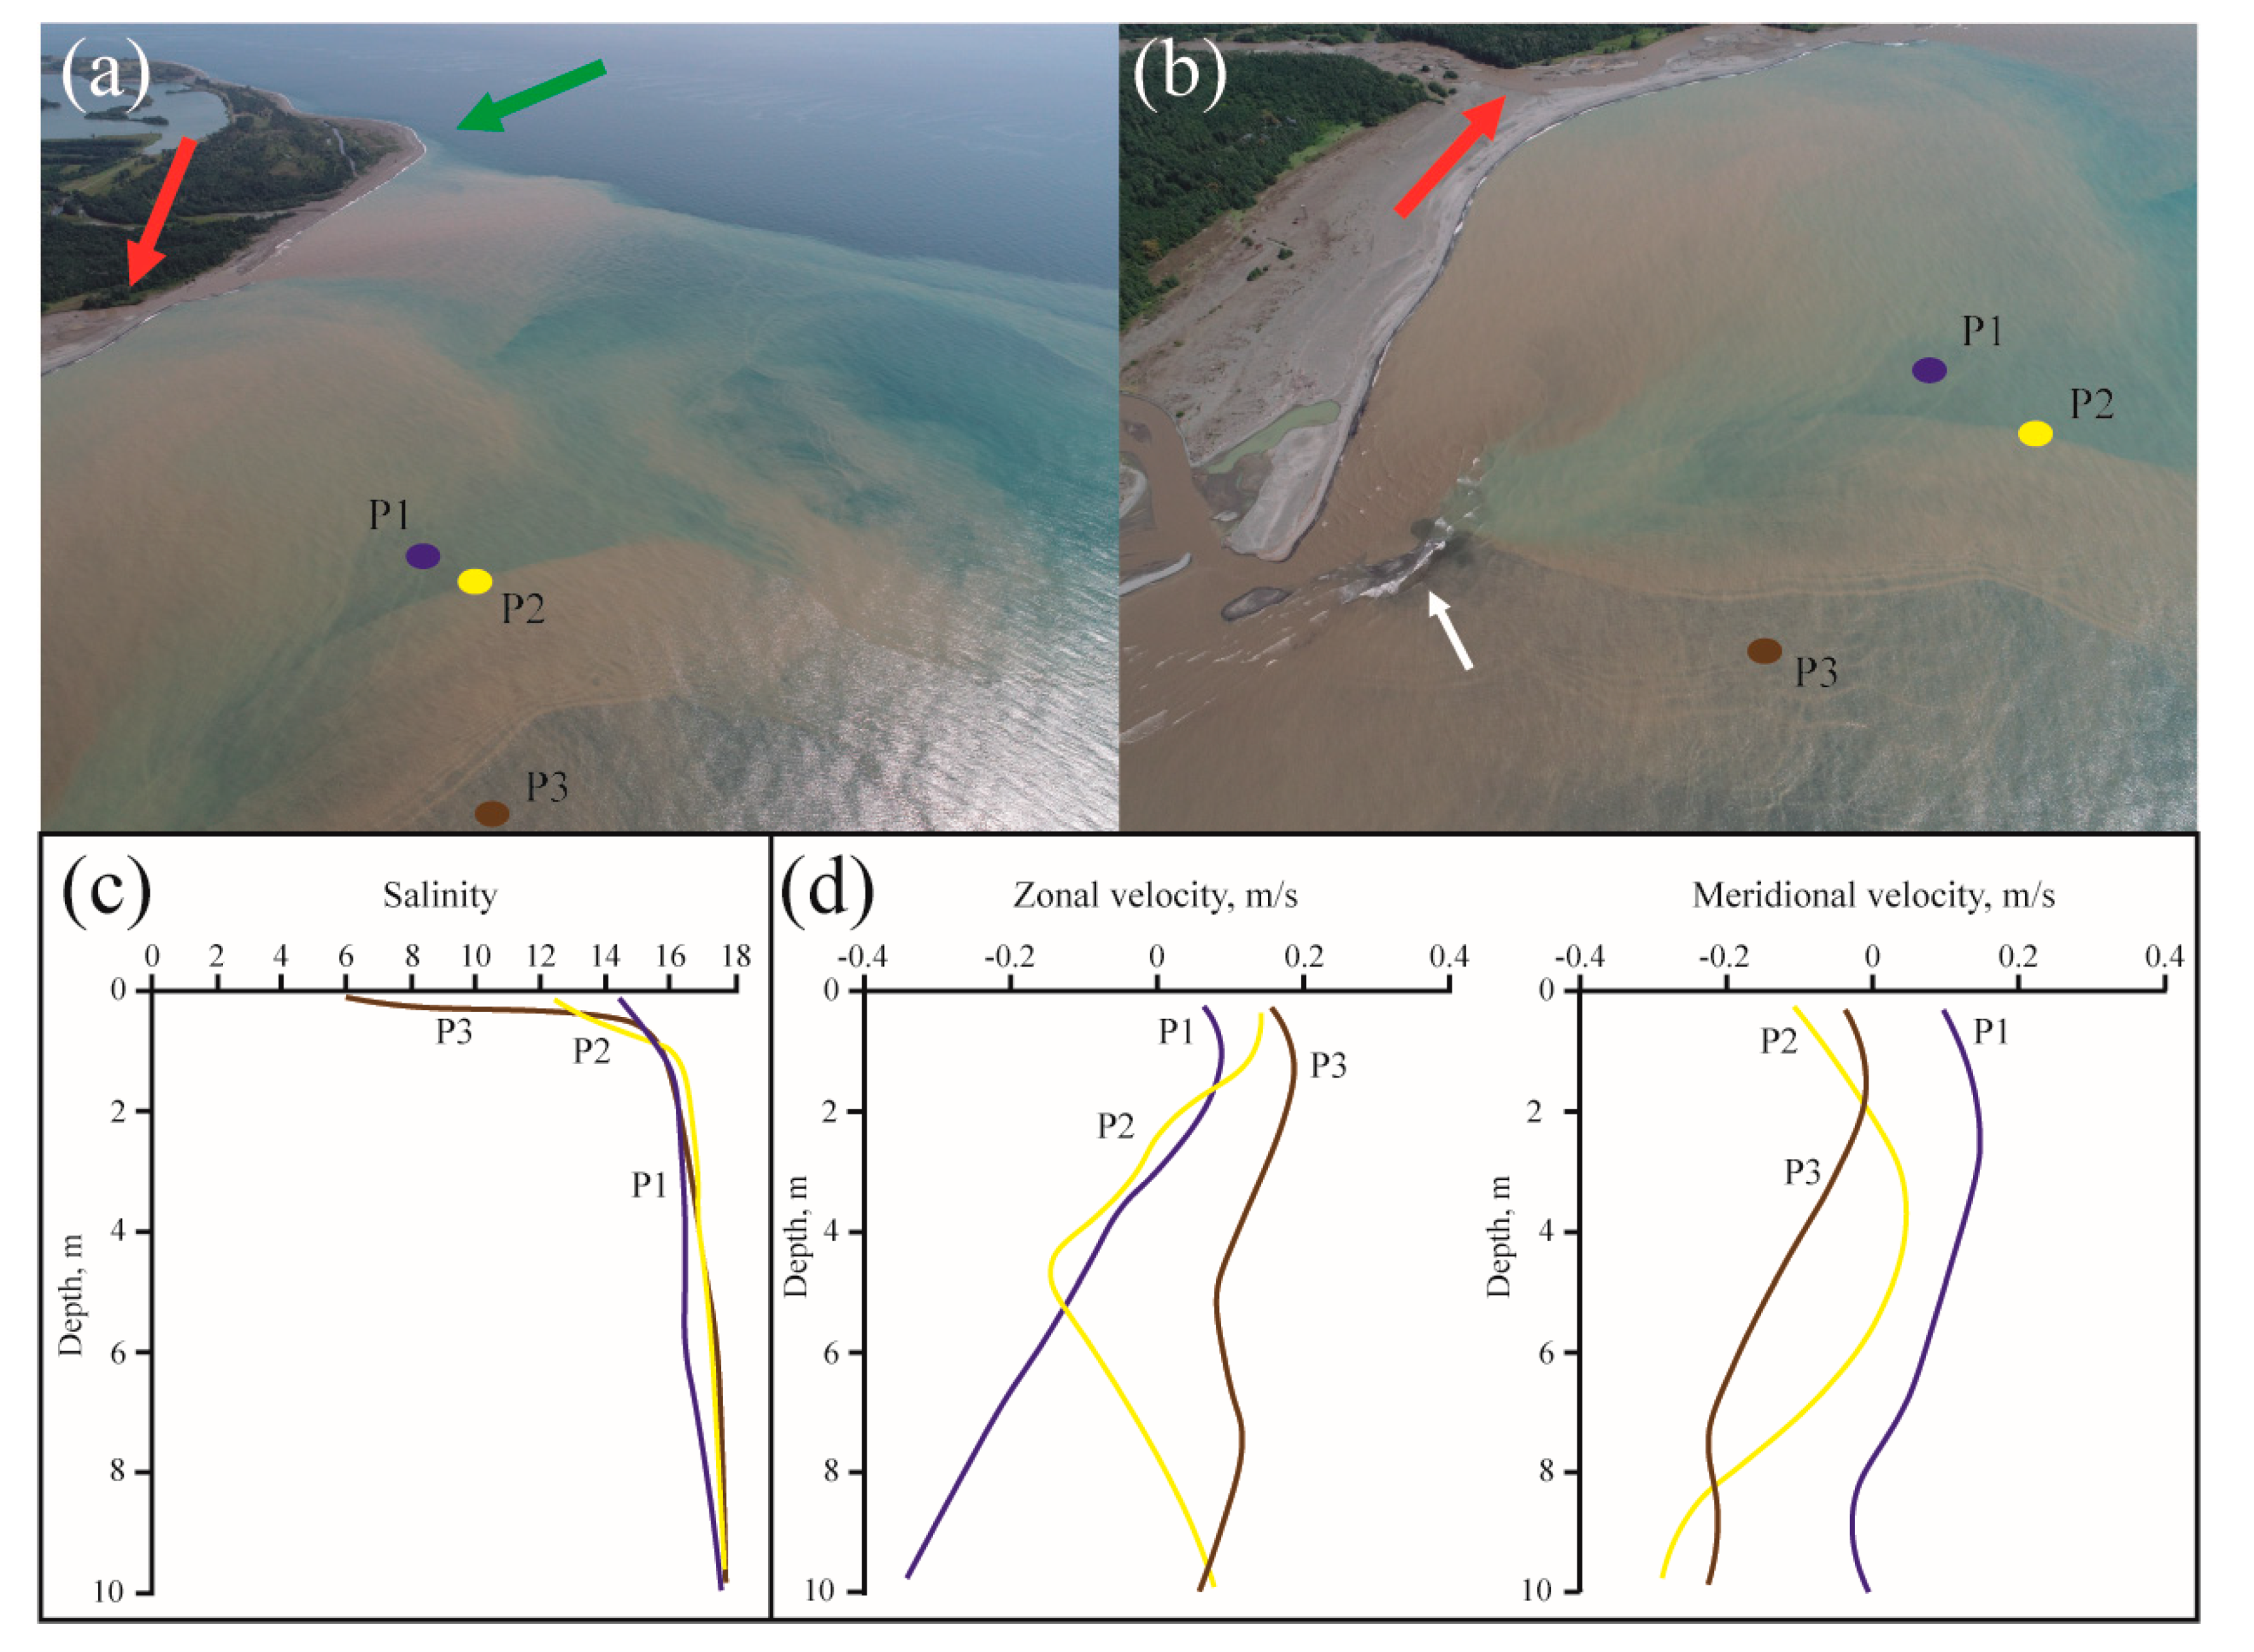
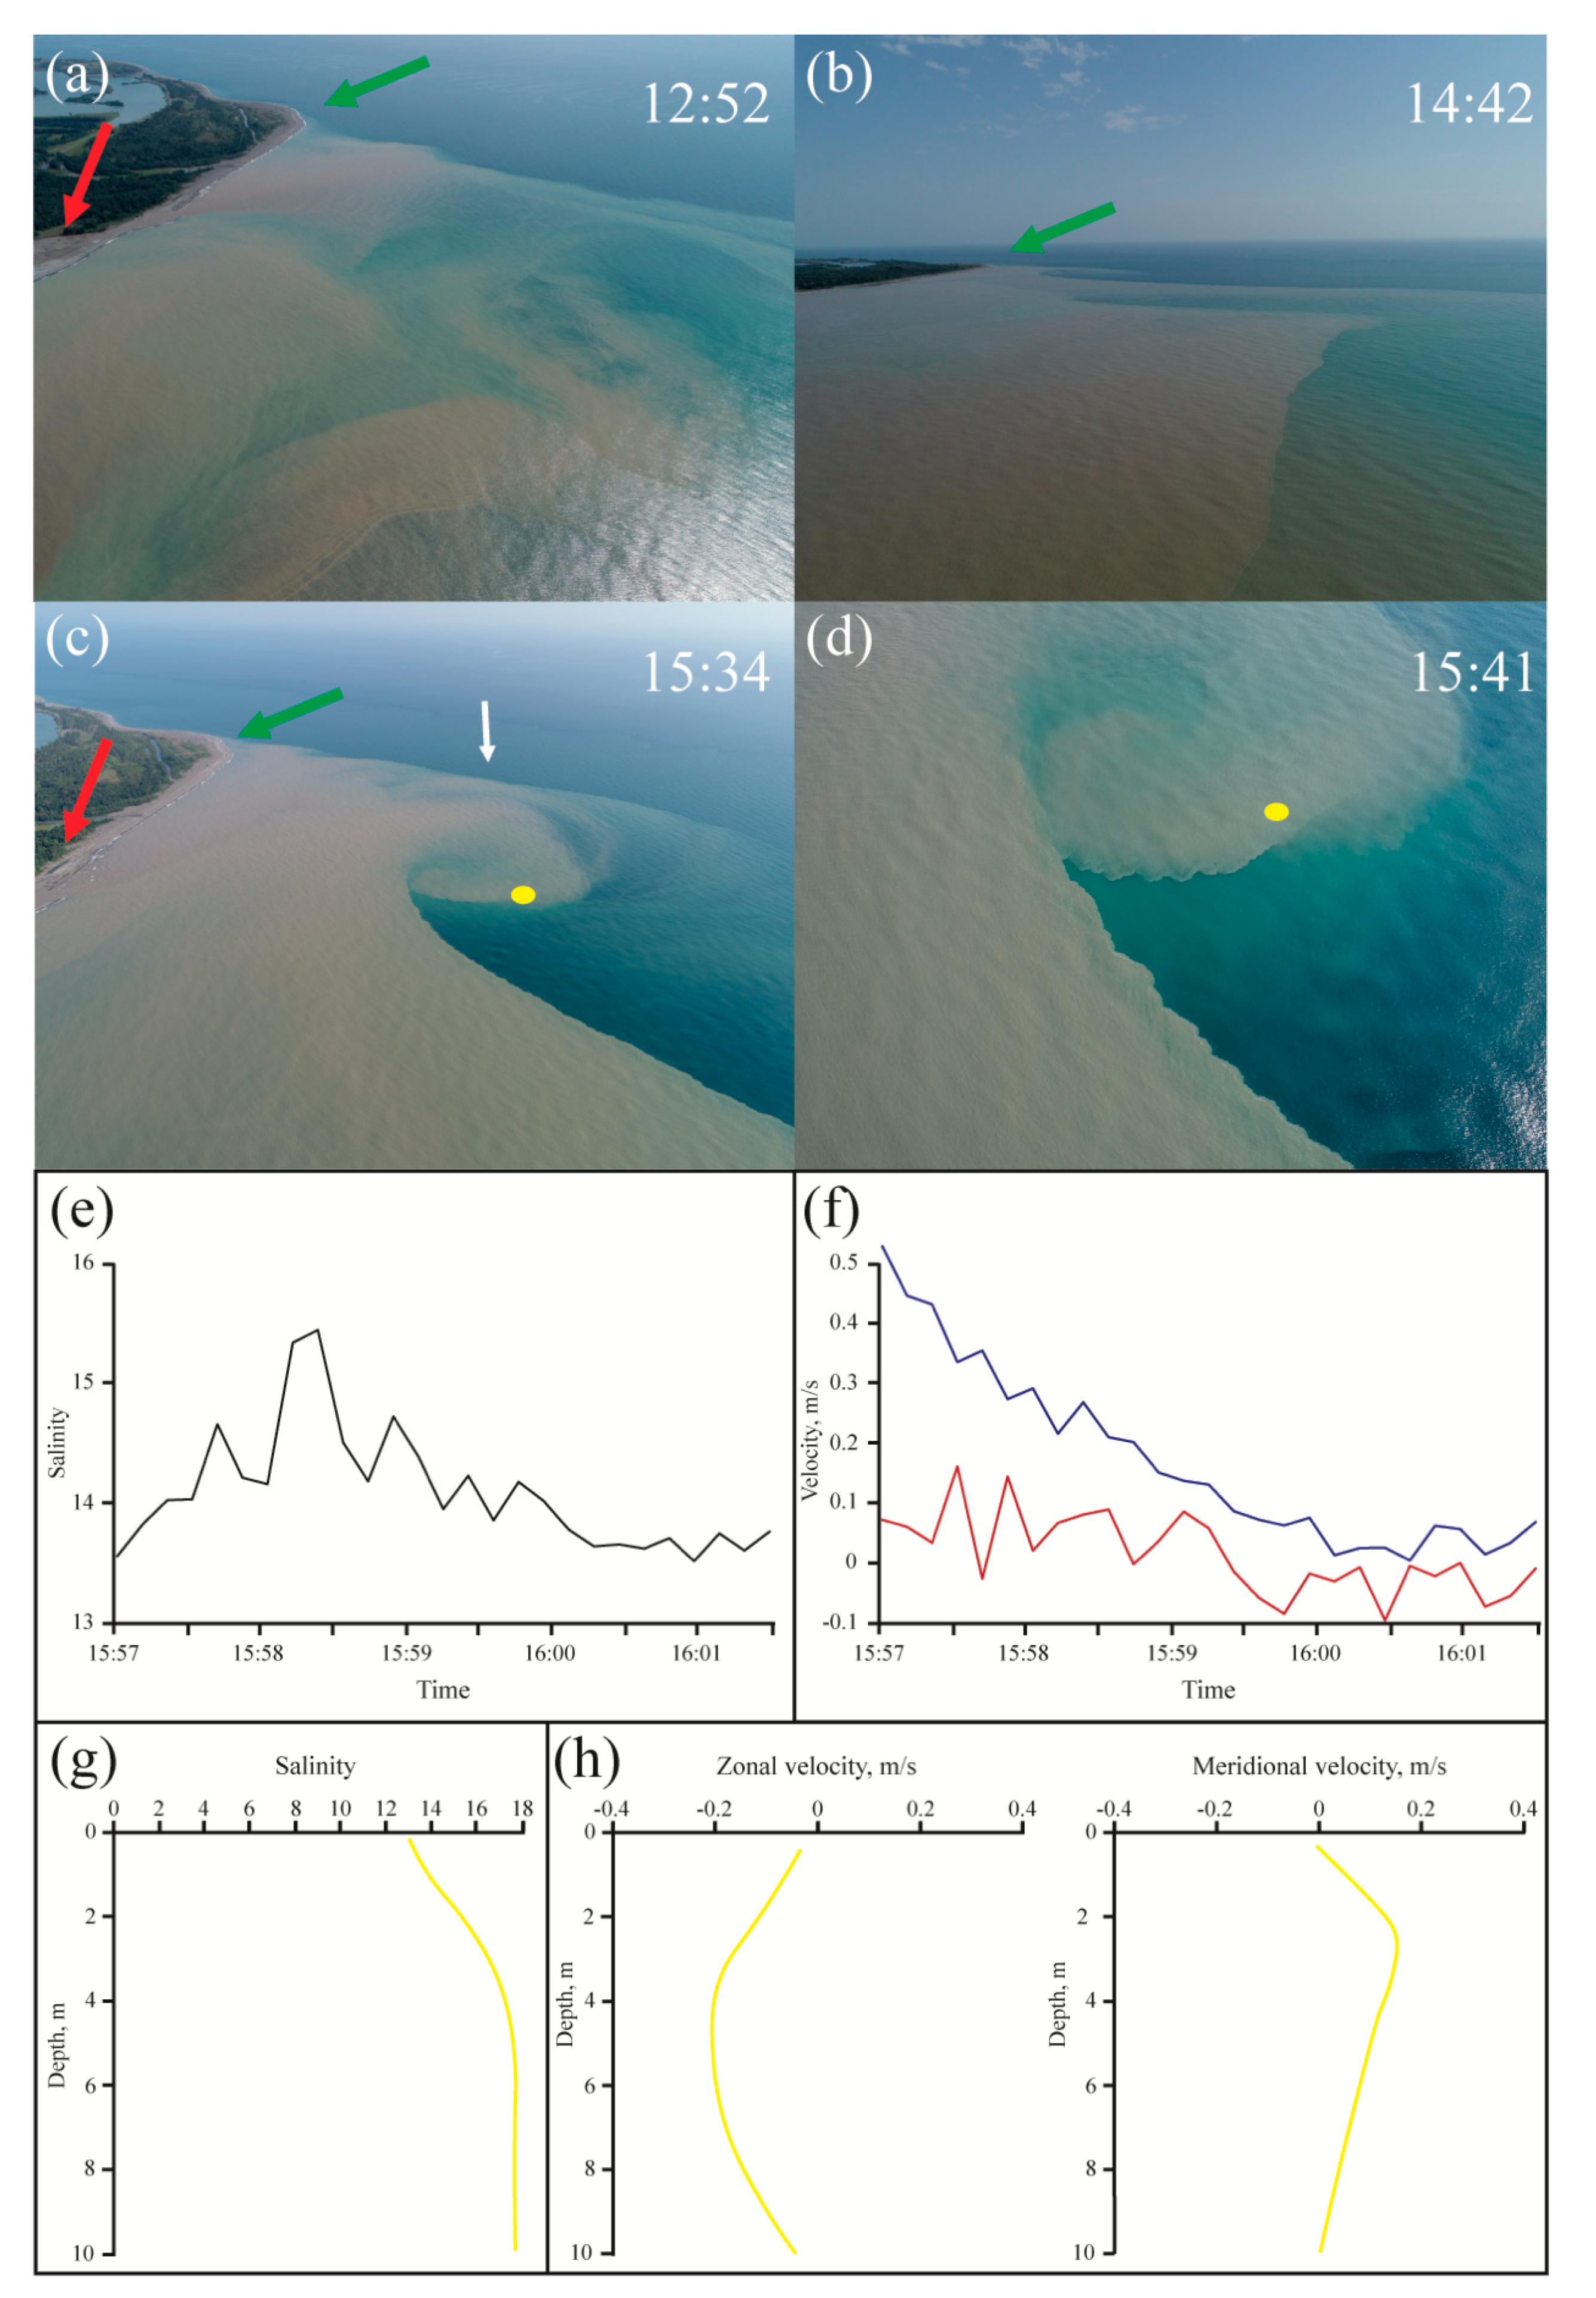
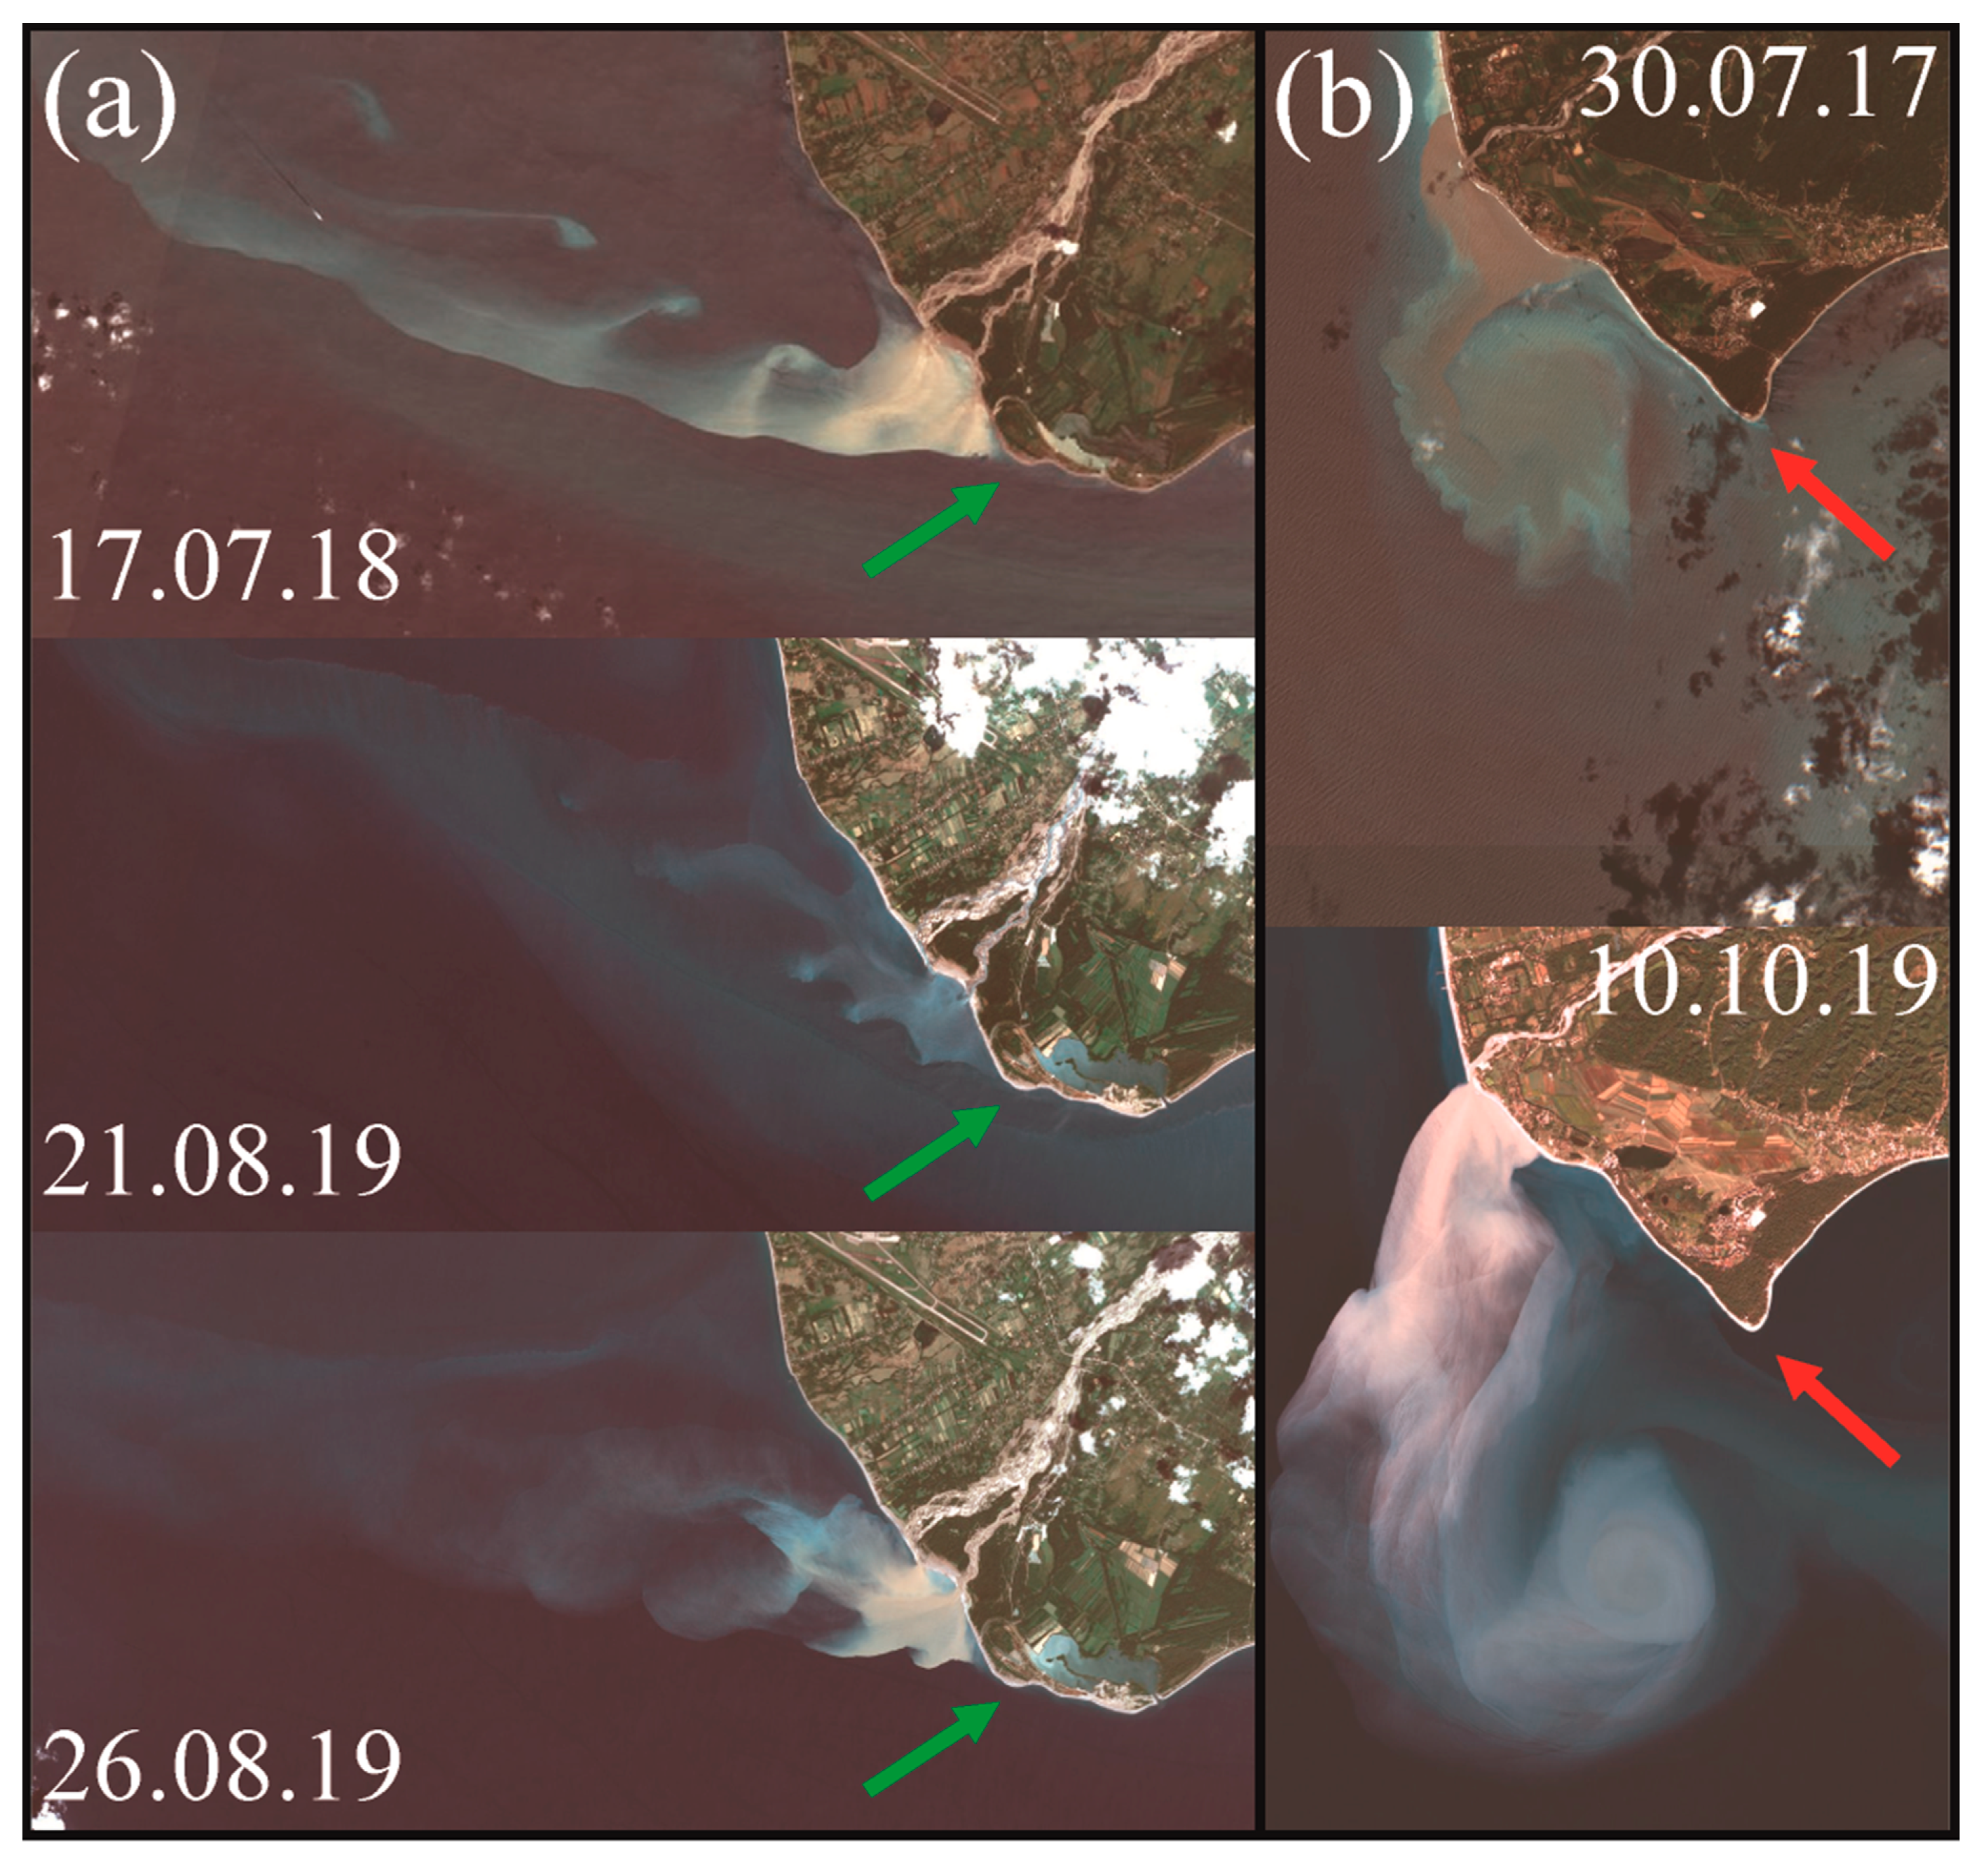

© 2020 by the authors. Licensee MDPI, Basel, Switzerland. This article is an open access article distributed under the terms and conditions of the Creative Commons Attribution (CC BY) license (http://creativecommons.org/licenses/by/4.0/).
Share and Cite
Osadchiev, A.; Barymova, A.; Sedakov, R.; Zhiba, R.; Dbar, R. Spatial Structure, Short-temporal Variability, and Dynamical Features of Small River Plumes as Observed by Aerial Drones: Case Study of the Kodor and Bzyp River Plumes. Remote Sens. 2020, 12, 3079. https://doi.org/10.3390/rs12183079
Osadchiev A, Barymova A, Sedakov R, Zhiba R, Dbar R. Spatial Structure, Short-temporal Variability, and Dynamical Features of Small River Plumes as Observed by Aerial Drones: Case Study of the Kodor and Bzyp River Plumes. Remote Sensing. 2020; 12(18):3079. https://doi.org/10.3390/rs12183079
Chicago/Turabian StyleOsadchiev, Alexander, Alexandra Barymova, Roman Sedakov, Roman Zhiba, and Roman Dbar. 2020. "Spatial Structure, Short-temporal Variability, and Dynamical Features of Small River Plumes as Observed by Aerial Drones: Case Study of the Kodor and Bzyp River Plumes" Remote Sensing 12, no. 18: 3079. https://doi.org/10.3390/rs12183079
APA StyleOsadchiev, A., Barymova, A., Sedakov, R., Zhiba, R., & Dbar, R. (2020). Spatial Structure, Short-temporal Variability, and Dynamical Features of Small River Plumes as Observed by Aerial Drones: Case Study of the Kodor and Bzyp River Plumes. Remote Sensing, 12(18), 3079. https://doi.org/10.3390/rs12183079


