Article

Automatic Detection of Maize Tassels from UAV Images by Combining Random Forest Classifier and VGG16

1
College of Land Science and Technology, China Agricultural University, Beijing 100083, China
2
Key Laboratory of Remote Sensing for Agri-Hazards, Ministry of Agriculture and Rural Affairs, Beijing 100083, China
*
Author to whom correspondence should be addressed.
Remote Sens. 2020, 12(18), 3049; https://doi.org/10.3390/rs12183049
Submission received: 17 July 2020 / Revised: 16 September 2020 / Accepted: 17 September 2020 / Published: 18 September 2020
(This article belongs to the Special Issue UAVs for Vegetation Monitoring)

Abstract

:
The tassel development status and its branch number in maize flowering stage are the key phenotypic traits to determine the growth process, pollen quantity of different maize varieties, and detasseling arrangement for seed maize production fields. Rapid and accurate detection of tassels is of great significance for maize breeding and seed production. However, due to the complex planting environment in the field, such as unsynchronized growth stage and tassels vary in size and shape caused by varieties, the detection of maize tassel remains challenging problem, and the existing methods also cannot distinguish the early tassels. In this study, based on the time series unmanned aerial vehicle (UAV) RGB images with maize flowering stage, we proposed an algorithm for automatic detection of maize tassels which is suitable for complex scenes by using random forest (RF) and VGG16. First, the RF was used to segment UAV images into tassel regions and non-tassel regions, and then extracted the potential tassel region proposals by morphological method; afterwards, false positives were removed through VGG16 network with the ratio of training set to validation set was 7:3. To demonstrate the performance of the proposed method, 50 plots were selected from UAV images randomly. The precision, recall rate and F1-score were 0.904, 0.979 and 0.94 respectively; 50 plots were divided into early, middle and late tasseling stages according to the proportion of tasseling plants and the morphology of tassels. The result of tassels detection was late tasseling stage > middle tasseling stage > early tasseling stage, and the corresponding F1-score were 0.962, 0.914 and 0.863, respectively. It was found that the model error mainly comes from the recognition of leaves vein and reflective leaves as tassels. Finally, to show the morphological characteristics of tassel directly, we proposed an endpoint detection method based on the tassel skeleton, and further extracted the tassel branch number. The method proposed in this paper can well detect tassels of different development stages, and support large scale tassels detection and branch number extraction.

Graphical Abstract

1. Introduction

Maize (Zea mays L.) is a monoecious crop, and the tassel is a branched structure atop the plan. The tassels’ size and shape (branch number, compactness, etc.) have influence on the yield and quality of maize through affect the amount of pollen produced, the plant nutrition supply and the light interception of lower leaves [1,2], and such influence will be more significant with the increase of planting density [3,4]. In addition, in order to ensure the purity and quality of maize hybrid seed, cross-pollination should be ensured in the tasseling stage of seed maize production field, so tassels of female plants have to be removed through artificial or mechanical process to prevent self-pollination [5,6,7]. Therefore, tassel development has always been one of the important phenotypic traits in maize breeding and seed production. Rapid and accurate detection of tassel development status and branch number during maize flowering stage is of great significant for maize production management, and it is also of practical value for the arrangement of detasseling.
The complex planting environment in the field, such as uneven illumination conditions, leaves covered tassels severely and obvious difference between varieties, has brought great challenges to the automatic detection of maize tassels. Traditional crop phenotype acquisition is dependent on artificial field measurement, which is labor-intensive and time-consuming [8,9], and moreover, there is no uniform standard for phenotypical data collection, so the data is subjective. With the improvement of computer performance and the development of image processing, it is possible to extract crop phenotypic traits quickly and automatically. According to the different data acquisition platforms, the tassels detection research in field environment is mainly based on fixed observation tower and unmanned aerial vehicles (UAVs) high-throughput phenotype platform [10,11,12,13,14].
Compared with platform based on ground vehicles [15], the acquisition of images by cameras installed on fixed observation tower or cable-suspend platform is not limited by crop types and soil conditions (for example, the irrigated soil will hinder the mobile vehicle to collect data), which is suitable for real-time monitoring in the field [16,17]. Lu Hao et al. obtained sequence images of maize tassels by using a camera installed on an observation tower, and each sequence covered the tasseling stage to the flowering stage. On this basis, they carried out studies on tassel identification [11], and maize tassels counting which was based on the local counts regression [18]. In terms of distinguishing features, Hue component image in Hue-Saturation-Intensity (HSI) color space has been proved to be able to distinguish tassels from leaves [12,19]. Mao Zhengchong et al. [12] successfully separated the approximate region of tassels through binarization processing and median filtering of Hue component image, and then used LVQ neural network to eliminate the false detection regions, with the final detection accuracy reaching 96.9%. This kind of method can achieve high accuracy, but it is difficult to apply to large scale breeding field because its data acquisition and processing methods are low throughput, and equipment is expensive.
In recent years, UAVs equipped with different sensors have attracted extensive attention from researchers and breeders due to their advantages such as flexibility, high spatial and temporal resolution, and relatively low cost [17,20]. UAVs high-throughput phenotype platform can realize phenotypic analysis on many breeding plots in real time and dynamically, and is regarded as an indispensable tool for plant breeding [21,22,23]. Some scholars have studied sorghum heads detection [24,25], digital counts of crop plants at early stage [26,27,28], tree canopy identification through UAV images [29,30], and crop disease monitoring [31,32]. There are two studies on maize tassels detection based on UAV platform, Zhang Qi [13] divided UAV image into several small objects by object oriented classification method, and then identified tassels with vegetation index and spectrum information, with the overall accuracy reaching 85.91%. Yunling Liu et al. [14] used faster region-based convolutional neural network (Faster R-CNN) with ResNet and VGGNet to detect maize tassels, founded that the ResNet as the feature extraction network, was better than the VGGNet, and the detection accuracy can reach 89.96%. Compared with fixed observation tower, UAVs high-throughput phenotype platform is flexible, low-cost and has the potential to be applied in large scale. However, the above methods did not identify tassels in different tasseling stages, which causes the detection scene is single and difficult to meet the demand of dynamic monitoring for tassel development. Moreover, these methods terminate in the detection stage, without more detailed analysis (such as the morphological characteristics of tassels etc.) that made it impossible to show the tassels’ development to breeders or production managers intuitively.
To know tassels’ development status in maize breeding fields and seed maize production fields in time, and also provide decision support for varieties selection and the detasseling arrangement, a novel tassels detection method suitable for complex scenes is urgently needed. Therefore, the objective of this study is to propose an accurate method for tassels detection that suitable for different maize varieties and tasseling stages based on time series UAV images (from tasseling begins to ends of all breeding plots). Considering that maize tassels vary greatly in shape and size as plant grow over time, and unsynchronized growth stage between the plots, etc. in this study, we first divided images into tassel regions and non-tassel regions by using random forest (RF), and then extracted the potential tassel region proposals by morphological method; afterwards, false positives were removed through VGG16 network, and the influence of different tasseling stages on the model accuracy was analyzed; finally, we proposed an endpoint detection method to explore how to apply detection results to the extraction of tassel branch number.

2. Materials and Methods

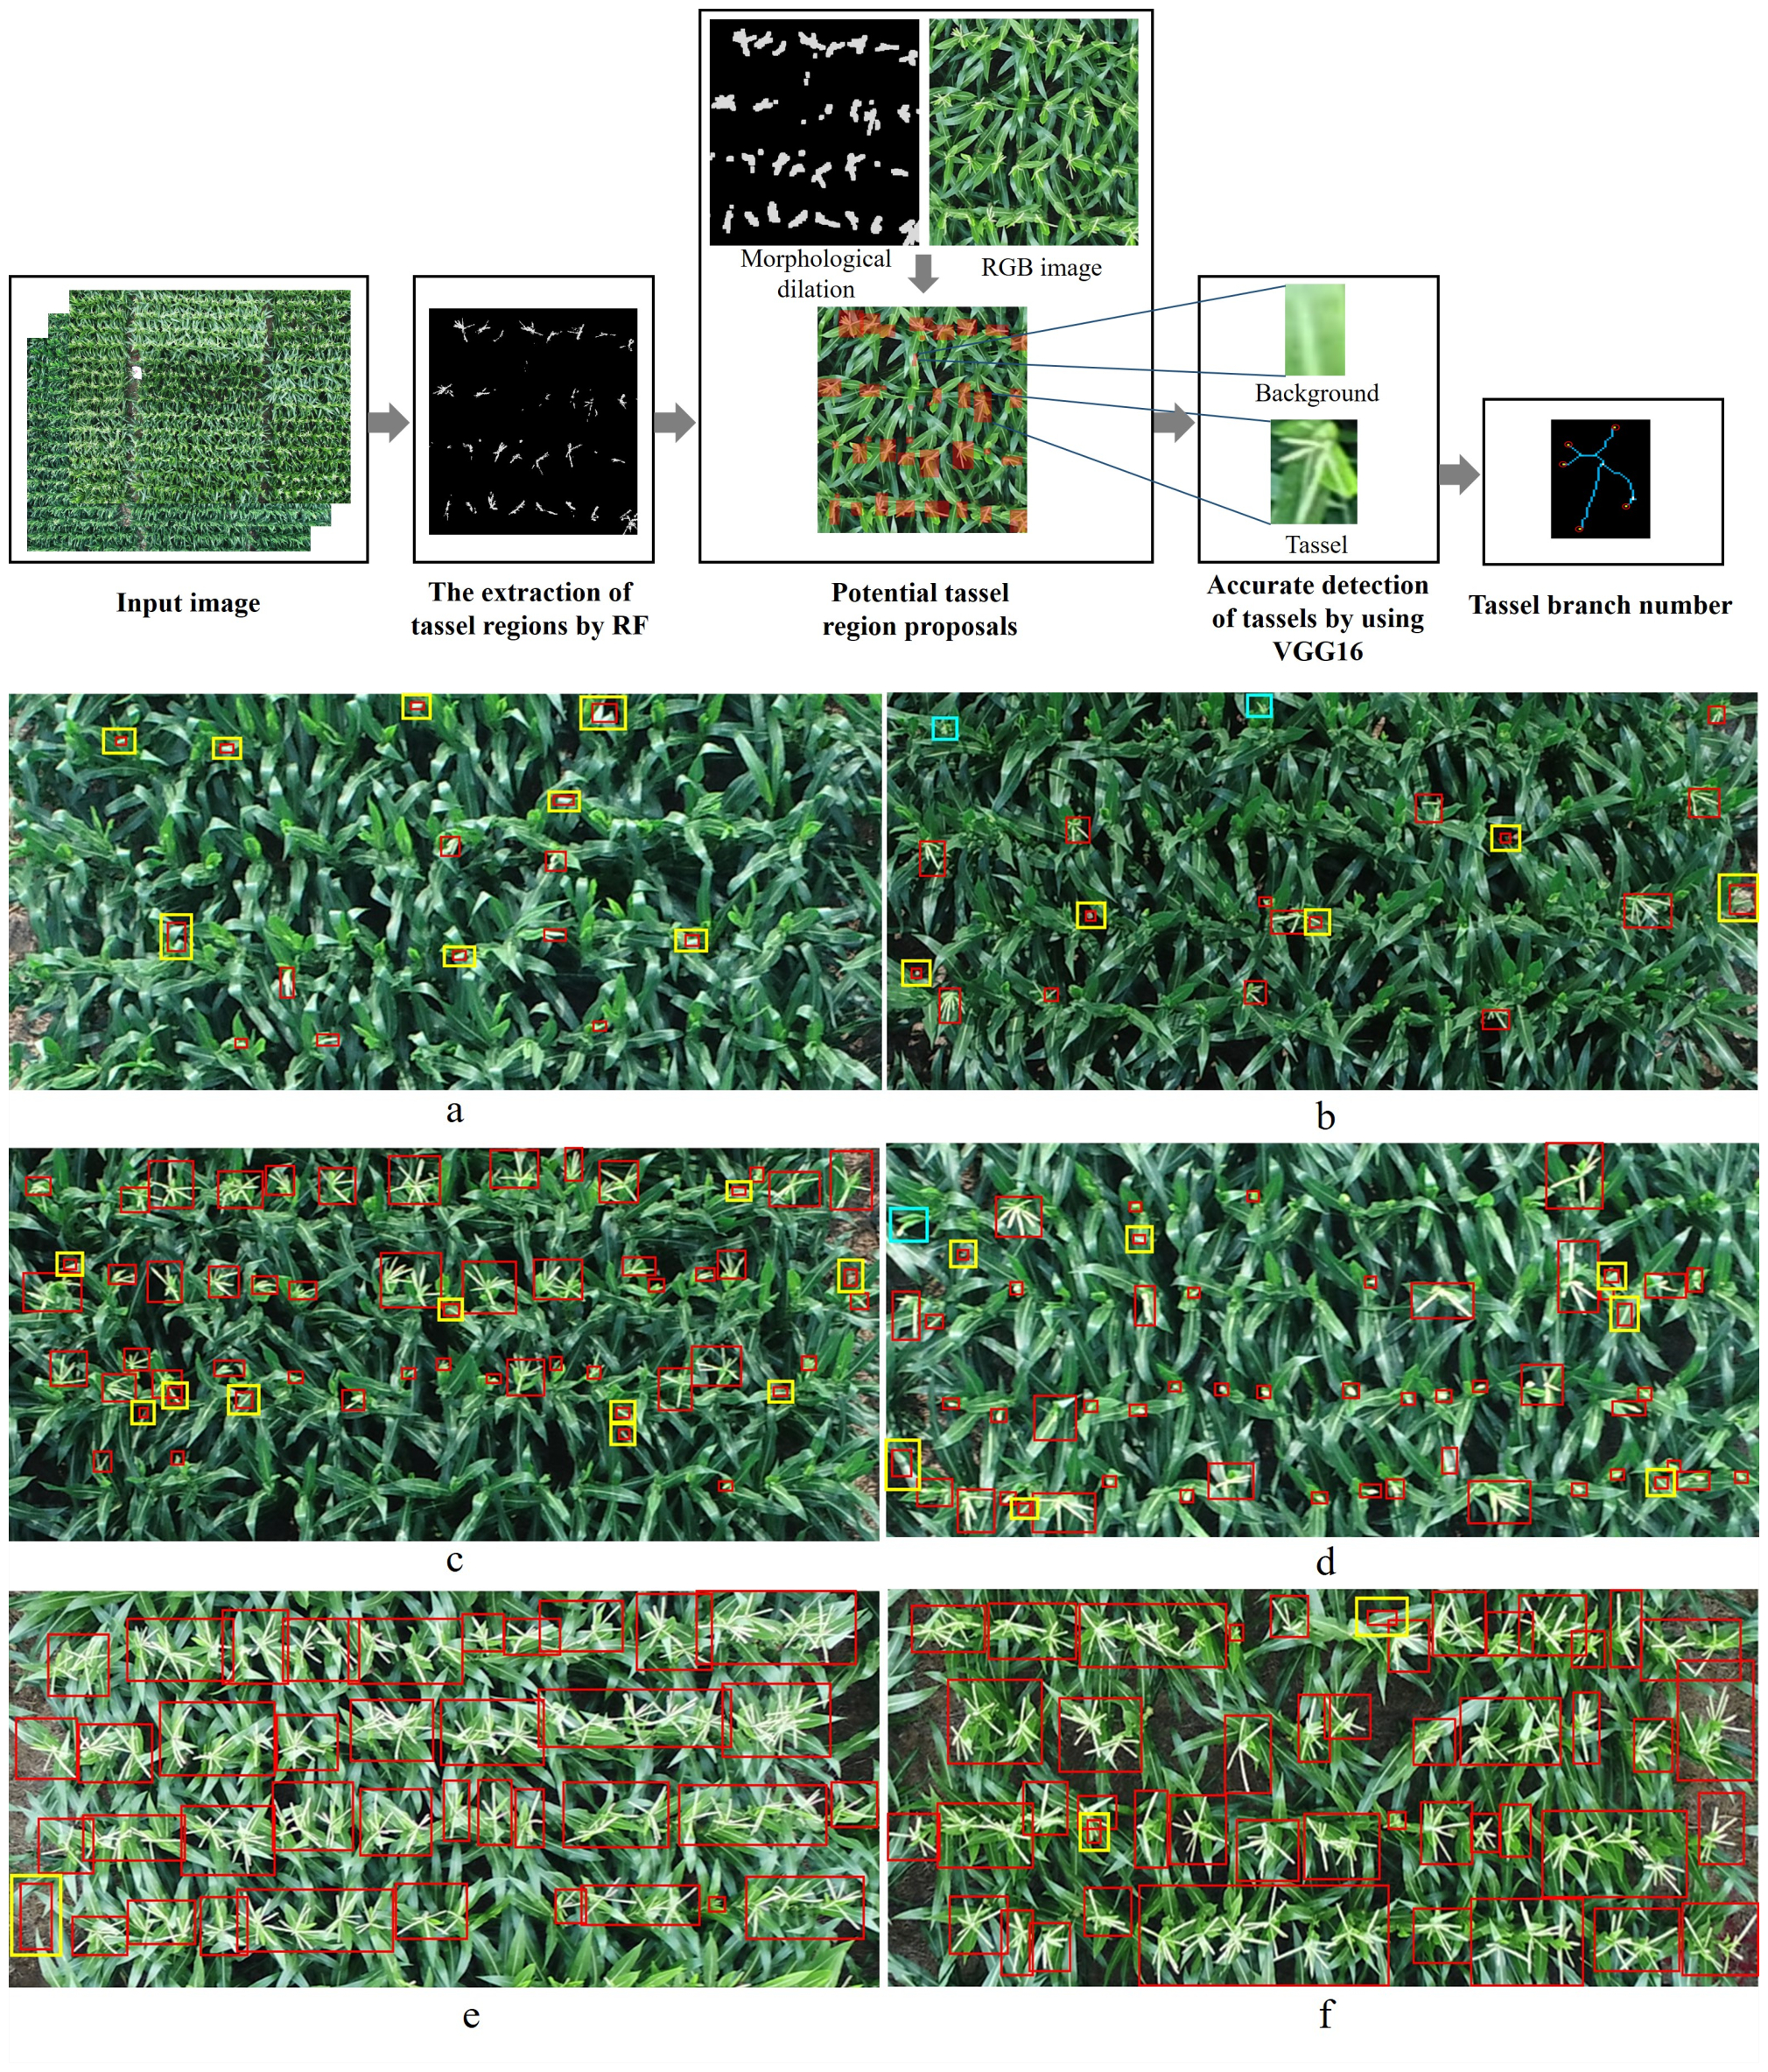
2.1. Data Acquisition

The field trial was in Juqiao Town, Hebi City, Henan Province, China. The trial area was approximately 34.5 m from north to south and 72 m from east to west, including 170 breeding plots with a size of 2.4 m × 5 m. The plant density of these plots was 67500 plants/ha, and the row spacing was 0.6 m. In this trial, 167 maize varieties of different genetic backgrounds were sown on 17 June 2019, among which Zhengdan958 was repeated 4 times as the check variety, while the others were not repeated (Figure 1).
To improve the image accuracy of UAV in this study, 15 square panels with the size of 50 cm × 50 cm were deployed in the field (Figure 1) to be used as ground control points (GCPs) and measured by Real-time kinematic (RTK) technology (i80, Shanghai Huace Navigation Technology Ltd., Shanghai, China) with centimeter-level accuracy. A DJI ZENMUSE X4s camera (resolution: 5472 × 3648, DJI-Innovations, Inc., Shenzhen, China) was installed on the DJI Inspire 2 drone (DJI-Innovations, Inc.) to record RGB images. The UAV’s flight path was set by DJI GSPro software in advance, with 85% forward overlap and 85% lateral overlap. To ensure that the model proposed in this study can realize the tassels detection of different varieties and different tasseling stages, we collected 5 groups of data for 4 days from 7 August 2019 to 12 August 2019 (no image data was collected on 10 and 11 August, due to the strong wind and light rain respectively, and 2 groups of image data were collected at 9:00 and 14:00 on 8 August). The flight altitude was set to 20 m, and about 500 digital images were collected for each flight, so a total of about 2500 images were collected.

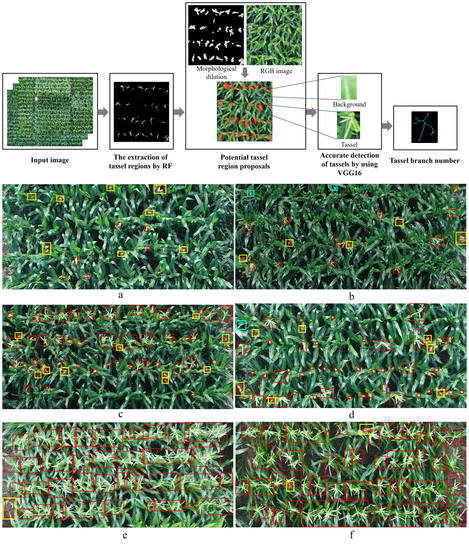
2.2. Schematic Diagram of Method

Compared to the controllable greenhouse environment, there are many challenges of monitoring maize tassels in field: (1) complex background (Figure 2a); (2) tassels vary in size, color and shape caused by light conditions, varieties and unsynchronized growth stage (Figure 2b); (3) other factors, such as tassel pose variations caused by wind during shooting (Figure 2c); (4) the newly grown tassels do not have special shape, and the color is similar to the reflective leaves, which further increases the difficulty of tassels detection.
In view of the problems to be solved and the challenges faced, we proposed an automatic tassels detection method combining RF and VGG16 network. Figure 3 shows the main process of this method. First, RF classifier was used to conduct pixel-based supervised classification of UAV images. The advantage of this process is that we can find tassels of any size, but it would also cause problems such as interference pixels and unconnected tassel regions; therefore, the morphological dilation method was used on unconnected regions belongs to tassels and noises, which are called the potential tassel region proposals; In the process of RF classification, pixels of other categories may be misidentified as tassels, so the potential region proposals have some wrong connected regions. To reduce the false positives, we used VGG16 network to re-classify the potential tassel region proposals and obtain accurate detection results; finally, we explored how to extract branch number of detected tassels.

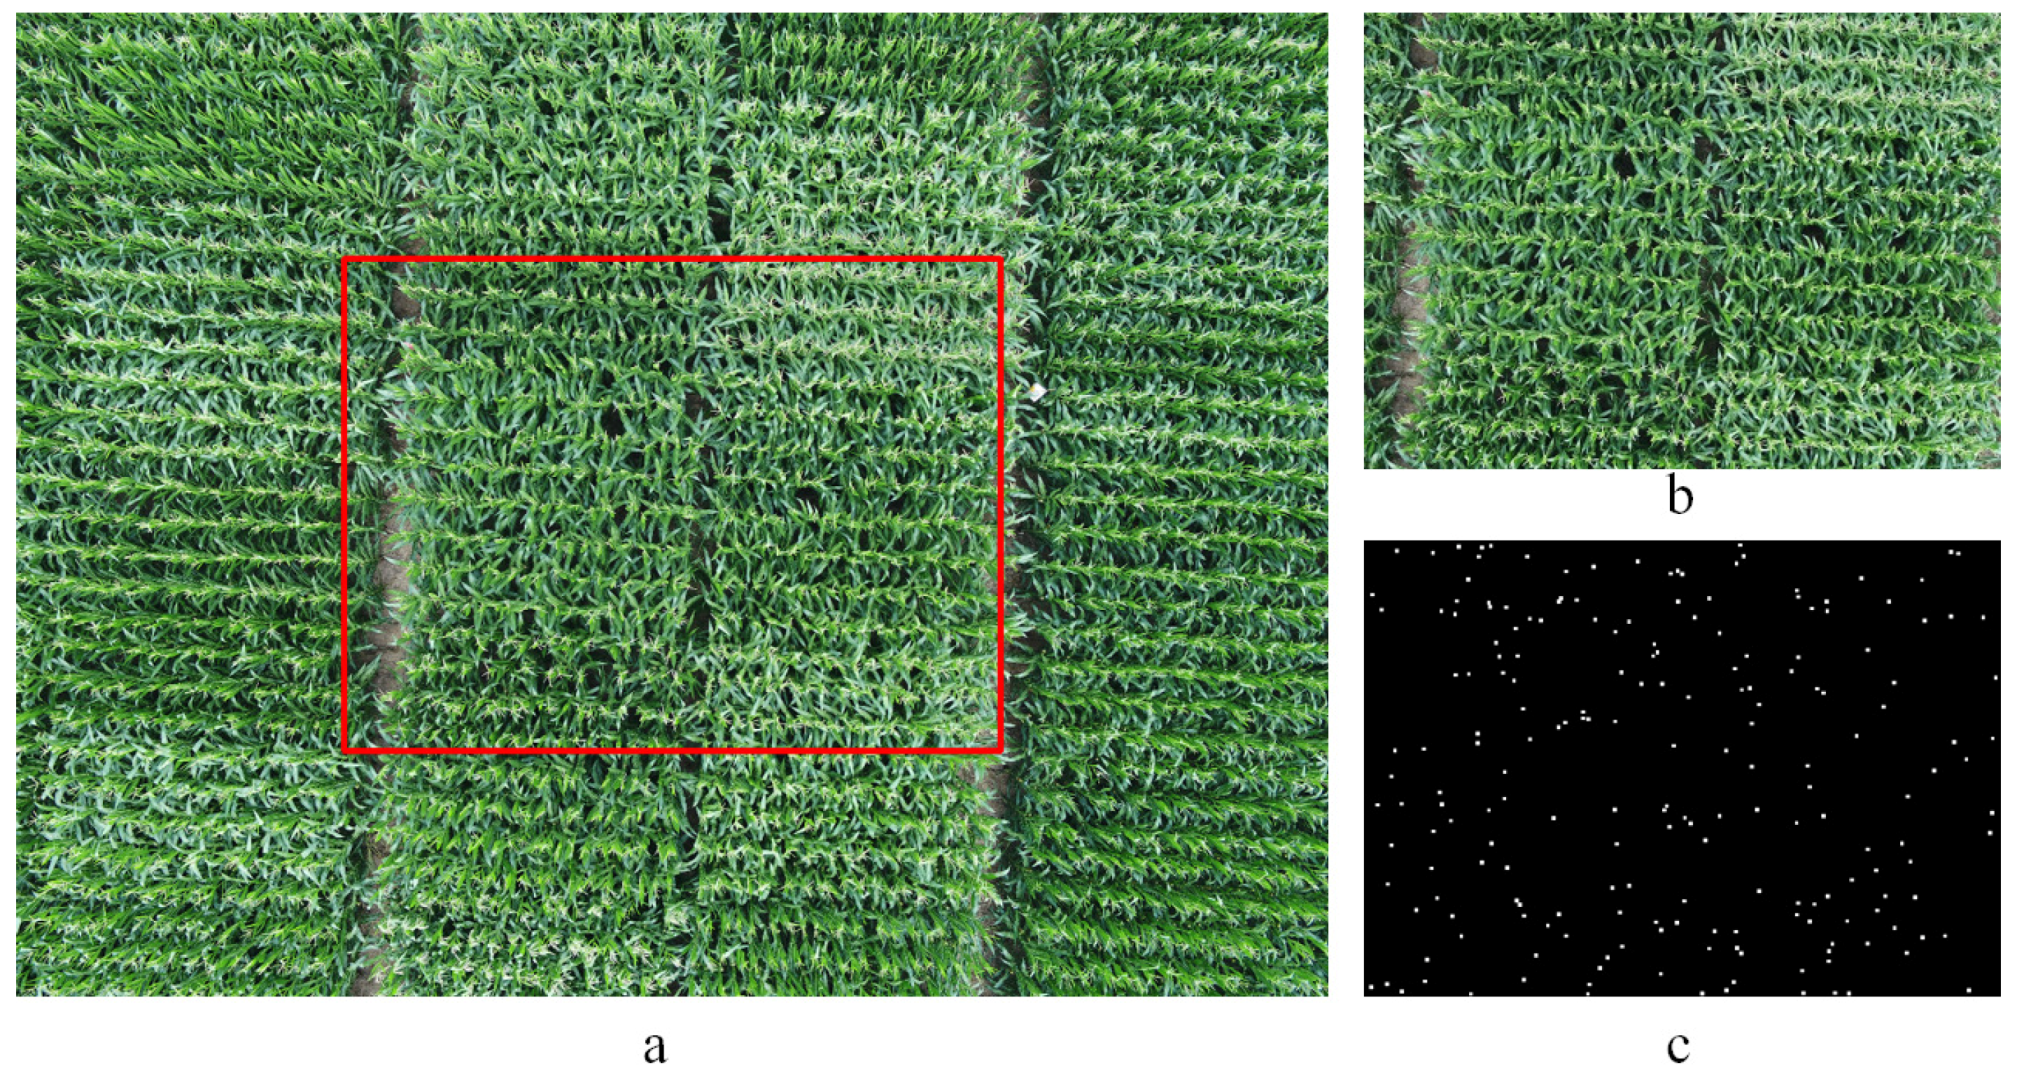
2.3. Potential Tassel Region Proposals by RF and Morphological Method

Both the dynamic monitor of tassels development in breeding field, and the detasseling arrangement of the seed maize all require the detection of tassels to have high timeliness. Selective search strategy is a common method in the field of object detection and becomes an essential element for fast detection. It extracts potential bounding boxes based on image segmentation and sub-region merging [33], which can effectively solve the problems of high computational complexity and multiple redundant bounding boxes in exhausted search [11]. Referring to the idea of selective search, we proposed a method for the extraction of potential tassel region proposals that is suitable for our study. This method consists of two stages, including the tassel regions extraction by RF, and the potential tassel region proposals through morphological methods.

2.3.1. The Extraction of Tassel Regions by RF

In this study, we not only need to accurately identify the position of maize tassels, but also to extract the morphological characteristics. We used the RF to separate tassels from the background environment first. RF is an effective integrated learning technology proposed by Breiman [34] in 2001, it can reduce the correlation between decision trees through random selection of features and samples. By combining multiple weak classifiers, the model has high precision and good generalization ability [35], and has been successfully applied to biomedical science, agricultural informatization and other fields [36,37,38,39].
Considering the diversity of light conditions, and tassels vary in size and shape, 4 images were randomly selected from 5 groups of UAV data, with a total of 20 images were selected to label samples. To minimize the influence of camera lens distortion, all these images were cropped to 25% of original size (Figure 4b). A total of 3835 sample points were labeled through generating random points (Figure 4c, in this way, samples can represent the actual distribution of field environment type), sample points were divided into 5 categories: leaves, tassels, field path, road (there were hardened roads in some images), and background shadow. Among them, tassel samples accounted for 6%. To compare the influence of different tassel sample proportions on the classification results, some tassel samples were added in the way of artificial labeling.
For each sample, a series of color features were calculated, including R, G, B, H (Hue), S (Saturation), V (Value), ExG (Equation (1)), ExR (Equation (2)) [40,41]. The ratio of training set to test set is 2:1, and the proportion of tassel samples (4%, 6%, 10%, 15%, 20%, and 25%) in training set was adjusted for multiple experiments. From the results of multiple experiments (Table 1), it can be found that the recall of tassel increased gradually while the precision decreased, as the proportion of tassel samples increases. This indicates that the classification model tends to categories with a large number of samples, and the classification results are obviously affected by the sample proportion. In this study, after the proportion of tassel samples reaches 10%, the identification performance of model for tassel tends to be stable, and based on the overall accuracy (OA), the proportion with 15% is considered to be the best.
E x G = 2 g r b
E x R = 2 r g b
The corresponding calculation equation of r, g, and b channel characteristics is as follows:
r = R R + G + B g = G R + G + B b = B R + G + B
According to the characteristics of the RF classifier, the importance of features could be evaluated. We applied the permutation importance method based on test set, which was evaluated by permuting the column values of a single feature, rerunning the trained model, and then calculating accuracy change as importance score [34,42]. This method is more reliable than the Gini importance [43]. The rfpimp package with python was used to complete this, and the feature importance obtained is shown in Figure 5. It can be found that ExR has the highest importance score, followed by G (green band), while the B (blue band) has the lowest importance score. Figure 6b shows the classification results of the UAV image, and tassels’ morphological characteristics are well displayed. After this, other categories except tassel were selected and integrated together to obtain binary image of tassels (Figure 6c), called tassel regions.

2.3.2. Potential Tassel Region Proposals Based on Morphological Processing

In the complex field environment, the mutual occlusion between top leaves and tassels is serious, leading to the fact that tassels in the binary image obtained in Section 2.3.1 were not connected regions (Figure 6c), and there is also the problem that other categories’ pixels were misidentified as tassels.
To remove some of noises, we applied morphological remove small objects on binary image, and then, used morphological dilation on unconnected pixel regions belongs to tassels and noises in order to obtain potential tassel region proposals (Figure 6d).

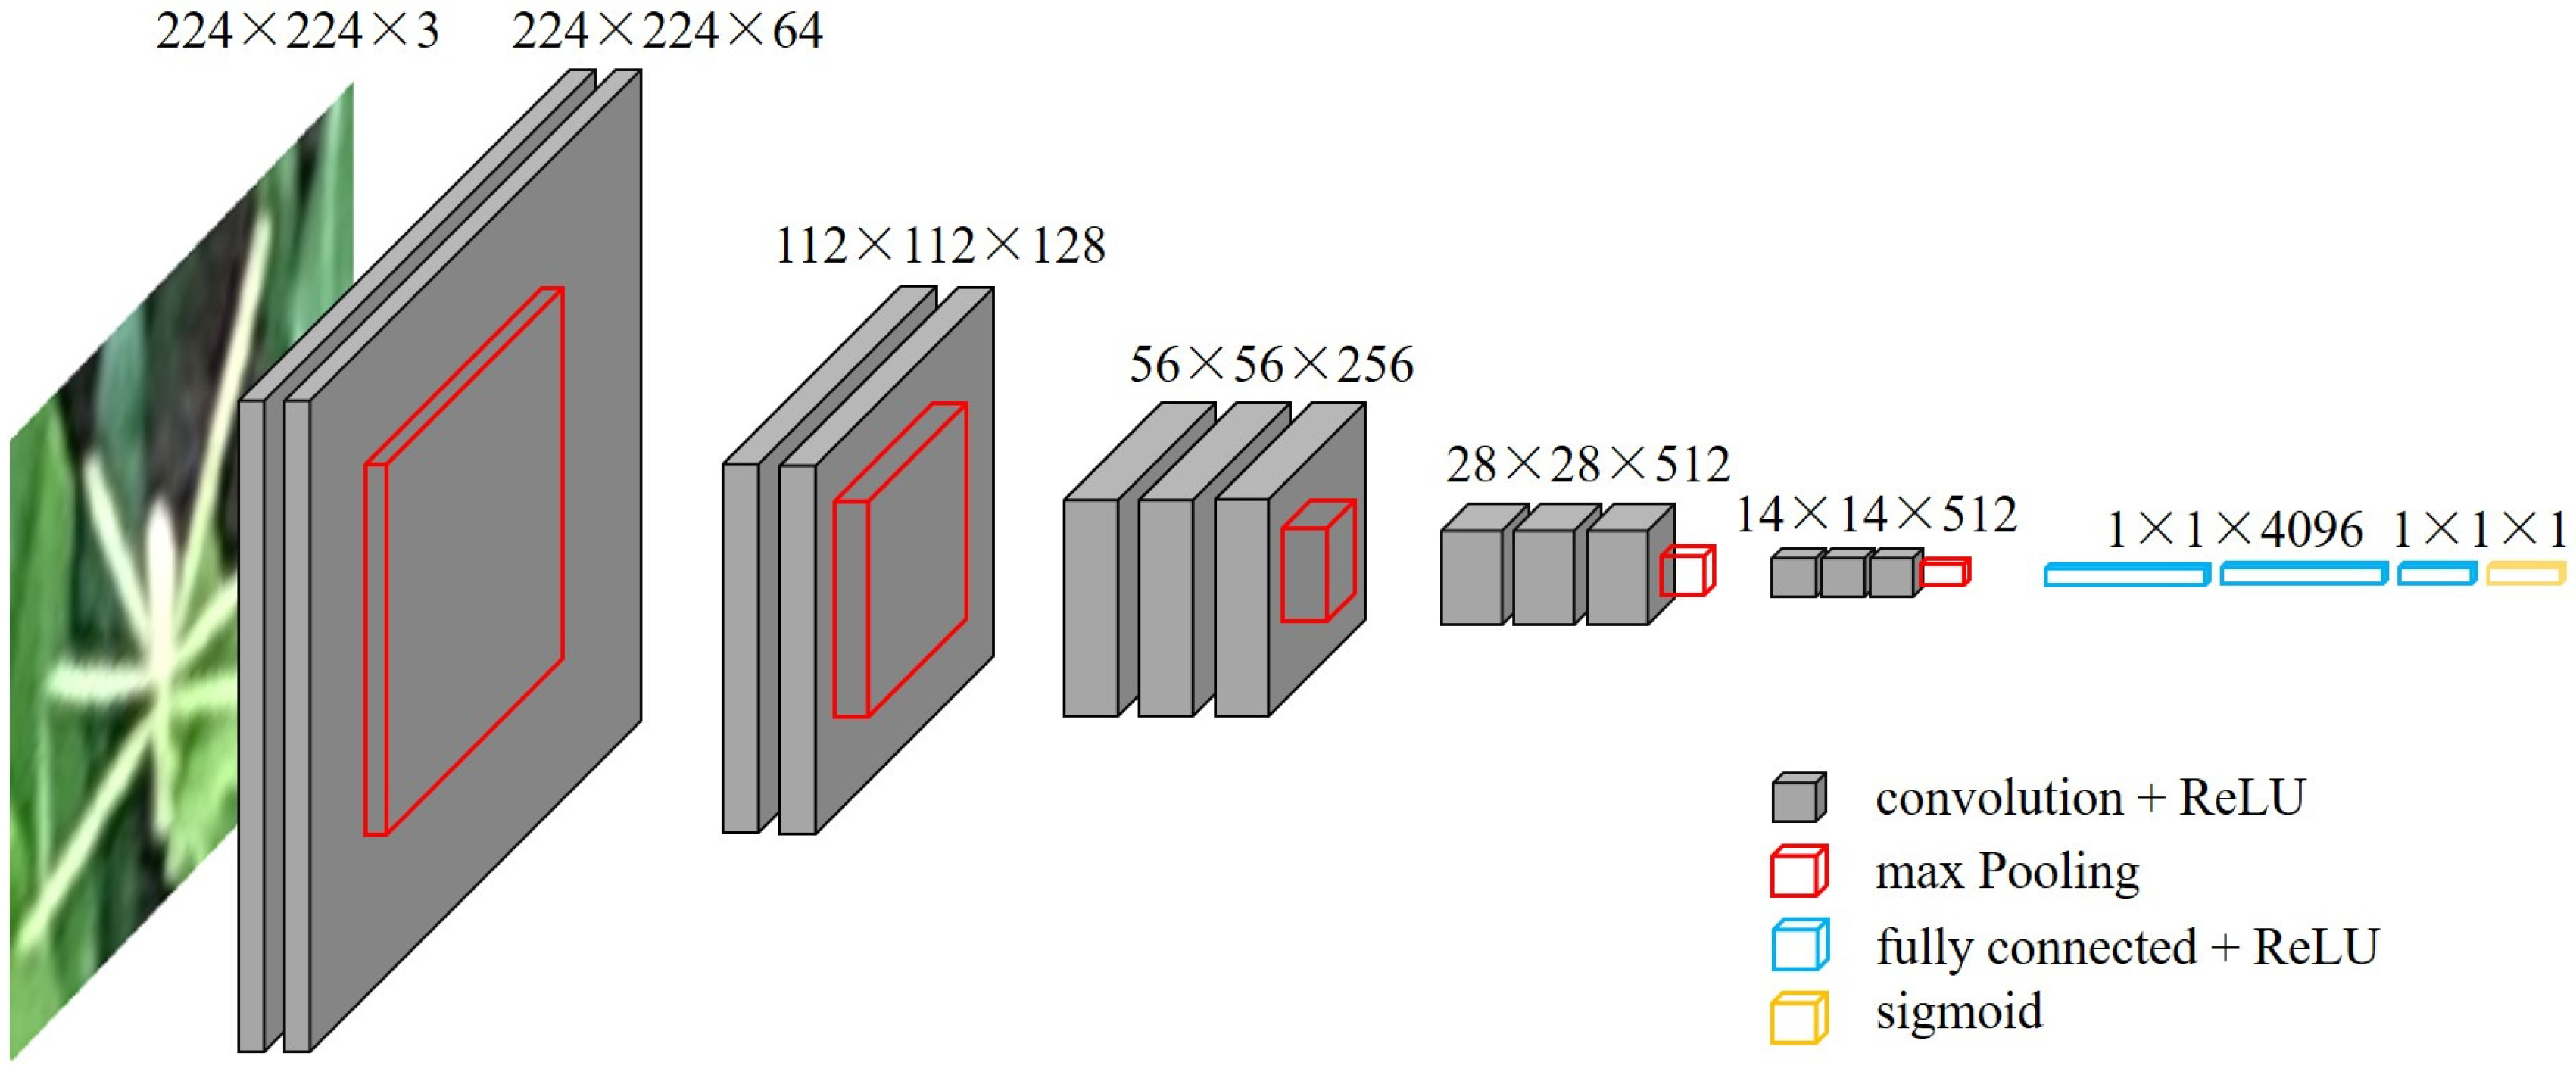
2.4. Fine Detection of Tassels by Using VGG16

To reduce the false positives, the potential tassel region proposals obtained after morphological processing were labeled, with 0 representing non-tassel connected region and 1 representing tassel connected region. A total of 2745 samples were labeled, including 1230 positive samples (tassel connected region) and 1515 negative samples (non-tassel connected region).
We found that many labeled samples contained less surrounding information due to the small area of the envelope rectangles, making it difficult for human eyes to recognize these samples. As shown in Figure 7, all the samples were labeled with human recognition attribute (called recognition), and analyzed the distribution of envelope rectangles’ pixel number. Almost all of (96%) the envelope rectangles out of unidentifiable samples (recognition = 0) are smaller than 600 pixels, so the envelope rectangles were expanded to 600 pixels according to the aspect ratio before put into VGG network, so that more information can be included. Although nearly half of the envelope rectangles out of identifiable samples (recognition = 1) are less than 600 pixels, after verification, almost all of these samples are non-tassel regions, which means they could be recognized because of their special color.
The VGG network was proposed by the Visual Geometry Group of Oxford University, and participated in the 2014 ImageNet Large Scale Visual Recognition Challenge (ILSVRC), won the first and second places in localization and classification tasks. VGG network adopts the superposition of multiple 3 × 3 convolution filters to replace a large convolution filter, which can increase the network depth and reduce the number of total parameters at the same time [44]. Therefore, the idea of 3 × 3 convolution filters has become the basis of various subsequent classification models. Two common structures in VGG networks are VGG16 and VGG19, they are differed in the number of convolutional layers that VGG16 has 13 convolutional layers while VGG19 has 16.
VGG16 network structure was selected in this paper, and we used the weight parameters from ImageNet’s pre-training model, to achieve better training results and reduce the running time. This study deals with binary classification, so replace the activation function of the output layer with the sigmoid (Figure 8). The ratio of training set to validation set was 7:3. To prevent overfitting due to limited samples and improve the model’s generalization, data augmentations through small random transformations with rotate and flip were used. The model’s iteration and batch size were 50 and 64, respectively, initial learning rate was 0.001 and adopted the learning rate decay strategy. We fine-tuned the obtained optimal model by releasing the deep network parameters, to make the model parameters more consistent with the data in this study.

2.5. Extraction of Tassel Branch Number

As an important factor determining tassel size and pollen quantity, the tassel branch number is one of the most important indicators in maize breeding. Some researchers placed tassels collected in the field in a portable photo boxes for taking pictures. Branch number was estimated by a series of circular arcs from the lowest branch node, the number of intersections between each circle and binary object was calculated, and the greatest value was taken as branch number [4]. However, the data acquisition of this method is low throughput, which is not suitable for large scale application. Moreover, this calculation method of branch number is also not suitable for the UAV images.
In this paper, the tassel branch number was extracted from the result of morphological dilatation (which can be extracted from Section 2.3.2). Skeleton extraction was performed first, and then an endpoint detection method suitable for tassels’ shape were proposed based on this (Figure 9). This method abstracts tassel skeleton into a matrix composed of 0 and 1 (0 is the background pixel and 1 represents the skeleton pixel). Based on the principle of most background pixels around the tassel endpoint, the number of background pixels in the window (3 × 3) with skeleton point as center was calculated. The tassels’ endpoints are those skeleton points that have the most background pixels.

2.6. Model Evaluation

To evaluate performance of the proposed method, accuracy, recall rate and F1-score were selected [45]. Precision refers to the proportion of correctly detected in all positive results returned by our model, with a ratio of 1.0 being perfect; recall (1.0 is perfect) indicates for all relevant samples, how many are correctly detected, and F1-score indicates the harmonic average of the precision and recall. The metrics were calculated as follows:
P r e c i s i o n = T P T P + F P
r e c a l l = T P T P + F N
F 1 s c o r e = 2 × P r e c i s i o n × r e c a l l P r e c i s i o n + r e c a l l
where T P , F P , and F N are the number of true positives, false positives and false negatives, respectively.

3. Results

3.1. Influence of the Envelope Rectangles’ Size on Model Accuracy

According to the description in Section 2.4, we have trained both the enlarged of envelope rectangles (for samples with envelope rectangle less than 600 pixels, we expanded them to 600 pixels according to the aspect ratio) and the direct use of original envelope rectangles. The iterations of model was set as 50. Figure 10 shows the loss and accuracy curve during model training after the expansion of envelope rectangles.
We fixed the shallow network parameters of the optimal model obtained during iteration, and released different number of deep networks for fine-tuning (Table 2). It can be found that no matter how many several layers of deep network were released, the recognition performance of the enlarged of envelope rectangles is better than original envelope rectangles. This is because the more surrounding information was included in samples, the more comprehensive model can learn (especially for the samples whose real category is small part of leaf, after the enlarged of envelope rectangles, it will be found that the surrounding scenes are different from the real tassels). Moreover, when the envelope rectangles were enlarged, the model obtained by releasing networks that are behind the eighth convolution layer has the highest validation accuracy, which is 0.954.

3.2. Influence of Different Tasseling Stages on Detection Accuracy

To demonstrate the performance of the proposed method, 50 plots were selected from the series UAV images randomly. The detection results of this method is shown in Figure 11. The red boxes, blue boxes, and yellow boxes in the figure represent automatically detection, absent detection, and incorrect detection by proposed method, respectively. It can be found that different shapes, sizes and even tassels that can just be observed by human eyes could be well detected (Figure 12). The precision, recall rate and F1-score were 0.904, 0.979 and 0.94, respectively (Table 3). It should be noted that some of tassels were covered by leaves severely, leading to the failure to connect these tassels through dilation processing of Section 2.3.2. Therefore, a small part of tassels’ branches were also marked in the final detection results, which were regarded as false positives by us. In addition, the model error mainly comes from the recognition of leaves vein and reflective leaves as tassels (Figure 12).
It was found that the detection effect was related to the tasseling stage of breeding plots, when analyzed the detection accuracy. Therefore, the tasseling stage of breeding plots were divided into early, middle and late tasseling stages according to the proportion of tasseling plants and whether the tassels have complete morphological characteristics. The definition of tasseling stages are as follows: tasseling proportion is less than half is early tasseling stage (Figure 11a,b); tasseling proportion is more than half, but most of them do not have complete morphological characteristics is middle tasseling stages (Figure 11c,d); tasseling proportion is more than half and tassels have complete morphological characteristics is late tasseling stage (Figure 11e,f).
According to Table 3, the detection effects of three different tasseling stages are as follows: late tasseling stage > middle tasseling stage > early tasseling stage, and the corresponding F1-score are 0.962, 0.914 and 0.863 respectively. The effect of early and middle tasseling stage was worse than that in the late stage, mainly reflected in the low precision. This is because the top leaves of maize plants in these two stages were not fully unfolded, and the high flexibility leads to the large inclination angle. Under the same light condition, the reflection phenomenon of such leaves would be more significant, which is easy to be misidentified as tassels. Moreover, no matter at which tasseling stage, the recall rate was always higher than precision, which indicates that there were fewer tassels missed by the proposed method, but have the phenomenon of other objects (mainly leaves vein and the reflective leaves, Figure 12) were identified as tassels.

3.3. The Calculation of Tassel Branch Number

Before extracting the tassel skeleton, we found that the envelope rectangles of detected tassels may contain partial branches of other tassels caused by the high planting density in the field, leading to some interference connected regions (the red boxes at the Figure 13b) in the result of morphological dilatation (which can be extracted from Section 2.3.2). Therefore, before skeleton extraction and endpoint detection, interference connected regions should be removed first.
The tassel branch number was calculated as follows (Figure 13c,d). The uppermost branch of tassel cannot be detected because our image is taken from orthographic angle. Therefore, the final branch number needs to add 1 to the endpoint detection result. In this example, the tassel branch is 7 endpoints plus the uppermost branch, making a total of 8 branches.

4. Discussion

4.1. Comparison of the Generation Method of Detection Boxes

The detection of tassels carried out in this paper can be regarded as a common object detection problem in the field of computer vision. Yunling Liu et al. [14] have realized the detection of tassels by using the Faster R-CNN. Faster R-CNN is a two-stage object detection algorithm proposed by Ren Shaoqing et al. [46], which changed the generation method of detection boxes based on Fast R-CNN and proposed the Region Proposal Networks (RPN) strategy. RPN has become a mainstream method, it form a series anchor boxes as initial region proposals by setting different anchor ratios and scales for each pixel on the feature map, which was obtained by the convolution neural network. RPN could improve the generation speed of region proposals, but the smallest anchor box (128 2 pixels) in RPN is also bigger than most of tassels, which will affect the detection accuracy of model [47]. Yunling Liu et al. [14] also payed attention to this problem, so the anchor size was adjusted from [128 2 , 256 2 , 512 2 ] to [85 2 , 128 2 , 256 2 ], and the final prediction accuracy of tassels increased from 87.27% to 89.96%.
In summary, the size setting of anchor boxes is particularly important in RPN, especially for the tassels detection problem in this paper that including different tasseling stages (tassel size changes significantly) and different shapes. The ratio of the width to height of the tassel samples was used to represent the tassel morphology, and Figure 14 shows the distribution of tassels morphology and size in this paper (tassel samples labeled in Section 2.4). We found that the width to height ratio (Figure 14b) is concentrated in (0.2, 2.0), and the default anchor ratios in RPN are 0.5, 1, 2, which can satisfy the requirements of different shape of tassels; the distributions of pixel width and height of tassel samples (Figure 14a) are mostly within the range of (11, 100), so the default size [128 2 , 256 2 , 512 2 ] in anchor parameter cannot cover tassels in our dataset. To better identify tassels, we can adjust the size of anchor and add additional anchor boxes while keeping the default anchor ratios. However, there is just a simple discussion, the optimal parameter setting needs to go through a series of experimental analysis.
Actually, in our proposed method, we divided the images into tassel regions and non-tassel regions by using random forest, and then extracted the potential tassel region proposals through morphological method is also an operation of forming detection boxes. This method can find the detection boxes of tassels at different tasseling stages, even including newly grown tassels (Figure 12), and there is no problem like RPN applied to small size objects. However, it spent more time in labeling samples compared with the object detection method, because we also need a large number of samples when training the random forest classifier.

4.2. Comparison of VGG16 and RF in Fine Detection

In the classification of the potential tassel region proposals, we compared the effect of RF and VGG16. The potential tassel region proposals extracted in Section 2.3 was selected, and RF classifier was used. The number of samples, training set and validation set were consistent with the input of VGG16 network, and the Histogram of Oriented Gradient (HOG) method was applied to extract features of each sample.
The results are shown in Table 4, the OA of RF classifier is 0.796, while VGG16 network is 0.954 (Table 2, validation accuracy was calculated in the same way as OA in RF), indicating that VGG16 performs significantly better than RF. The recall rate of tassel obtained by RF is very low, indicating that there are many tassels were missed, which is not suitable for our application scene. This may be caused by the small number of training sets; however, under the same sample size, VGG16 network performs better because we used the ImageNet’s pre-training model. This also reflects the advantage of deep learning to transfer existing model on the problem to be solved; moreover, we all know that it does not require feature engineering construction and feature optimization.

5. Conclusions

The extraction of tassels development in maize breeding fields and seed maize production fields rapidly and accurately can provide decision support for varieties selection and detasseling arrangement. However, due to the complex planting environment in the field, such as unsynchronized growth stage and tassels vary in size and shape caused by varieties, the detection of maize tassels remains challenging problem. In this paper, based on the time series UAV images of maize flowering stage, we proposed a detection method of maize tassels in complex scenes (different varieties, different tasseling stages) by combining RF and VGG16 network. The main conclusions are as follows:
(1)
The potential tassel region proposals with different sizes and shapes could be found by using RF and morphological methods, which is the key point to realize tassels detection in complex scenes. In addition, also the VGG16 network after fine-tuning can distinguish the false positives in the potential tassel region proposals well.
(2)
We divided breeding plots into early, middle and late tasseling stages according to the proportion of tasseling plants and whether the tassels have complete morphological characteristics, and found that the detection effect of tassels was highly correlated with the tasseling stages and the detection effect in late tasseling stage was better than that in middle and early stages.
(3)
According to the special morphological characteristics of maize tassels, the endpoint detection method based on tassel skeleton can extract the tassel branch number well.
(4)
Moreover, the model performance can be effectively improved after enlarged envelope rectangles of potential tassel region proposals (the threshold value determination needs to consider the actual situation of samples).
The detection method of maize tassels proposed in this paper has the advantages of high precision and fast data acquisition speed, which can be applied to large area of maize breeding fields and seed maize production fields. In the future research, we will carry out experiments on UAV images that collected at different periods of the day, flight heights and other sensors (like multispectral and hyperspectral sensors), and reduce the number of samples to propose a more efficient detection method for maize tassels. As for the problem of unsuccessful photogrammetric processing caused by high similarity of acquired images, we will also look for a solution to this problem, and then replace single images with orthophoto mosaics in the later work.

Author Contributions

Conceptualization, X.Z. (Xiaodong Zhang), S.L. and Z.L.; methodology, Z.L., W.S. and Y.Z.; formal analysis, X.Z. (Xuli Zan), and Z.L.; investigation, X.Z. (Xuli Zan), X.Z. (Xinlu Zhang) and W.L.; data curation, X.Z. (Xinlu Zhang), Z.X. and W.L.; writing—original draft preparation, X.Z. (Xuli Zan); writing—review and editing, Z.L. and X.Z. (Xuli Zan). All authors have read and agreed to the published version of the manuscript.

Funding

This research was funded by National Key Research and Development Plan of China, grant number 2018YFD0100803.

Conflicts of Interest

The authors declare no conflict of interest.

Abbreviations

The following abbreviations are used in this manuscript:
UAVunmanned aerial vehicle
RFrandom forest
GCPsground control points

References

  1. Lambert, R.; Johnson, R. Leaf angle, tassel morphology, and the performance of maize hybrids 1. Crop Sci. 1978, 18, 499–502. [Google Scholar] [CrossRef]
  2. Yulan, Y.; Min, Z.; Lei, Y.; Chunguang, L. Research Progress on the Impact of Maize Tassel on Yield. J. Maize Sci. 2010, 018, 150–152. [Google Scholar]
  3. Hunter, R.; Daynard, T.; Hume, D.; Tanner, J.; Curtis, J.; Kannenberg, L. Effect of tassel removal on grain yield of corn (Zea mays L.) 1. Crop Sci. 1969, 9, 405–406. [Google Scholar] [CrossRef]
  4. Gage, J.L.; Miller, N.D.; Spalding, E.P.; Kaeppler, S.M.; de Leon, N. TIPS: A system for automated image-based phenotyping of maize tassels. Plant Methods 2017, 13, 21. [Google Scholar] [CrossRef] [PubMed] [Green Version]
  5. Zhang, C.; Jin, H.; Liu, Z.; Li, Z.; Ning, M.; Sun, H. Seed maize identification based on texture analysis of GF remote sensing data. Trans. Chin. Soc. Agric. Eng. 2016, 32, 183–188. [Google Scholar]
  6. Kurtulmuş, F.; Kavdir, I. Detecting corn tassels using computer vision and support vector machines. Expert Syst. Appl. 2014, 41, 7390–7397. [Google Scholar] [CrossRef]
  7. Ren, T.; Liu, Z.; Zhang, L.; Liu, D.; Xi, X.; Kang, Y.; Zhao, Y.; Zhang, C.; Li, S.; Zhang, X. Early Identification of Seed Maize and Common Maize Production Fields Using Sentinel-2 Images. Remote Sens. 2020, 12, 2140. [Google Scholar] [CrossRef]
  8. Ribera, J.; He, F.; Chen, Y.; Habib, A.F.; Delp, E.J. Estimating phenotypic traits from UAV based RGB imagery. arXiv 2018, arXiv:1807.00498. [Google Scholar]
  9. Han, L.; Yang, G.; Dai, H.; Xu, B.; Yang, H.; Feng, H.; Li, Z.; Yang, X. Modeling maize above-ground biomass based on machine learning approaches using UAV remote-sensing data. Plant Methods 2019, 15, 10. [Google Scholar] [CrossRef] [Green Version]
  10. Madec, S.; Jin, X.; Lu, H.; De Solan, B.; Liu, S.; Duyme, F.; Heritier, E.; Baret, F. Ear density estimation from high resolution RGB imagery using deep learning technique. Agric. For. Meteorol. 2019, 264, 225–234. [Google Scholar] [CrossRef]
  11. Lu, H.; Cao, Z.; Xiao, Y.; Fang, Z.; Zhu, Y.; Xian, K. Fine-grained maize tassel trait characterization with multi-view representations. Comput. Electron. Agric. 2015, 118, 143–158. [Google Scholar] [CrossRef]
  12. Zhengchong, M.; Yahui, S. Algorithm of male tassel recognition based on HSI space. Transducer Microsyst. Technol. 2018, 37, 117–119. [Google Scholar]
  13. Qi, Z. The Research on Extraction of Maize Phenotypic Information Based on Unmanned Aerial Vehicle. Ph.D. Thesis, Northeast Agricultural University, Harbin, China, 2017. [Google Scholar]
  14. Liu, Y.; Cen, C.; Che, Y.; Ke, R.; Ma, Y.; Ma, Y. Detection of maize tassels from UAV RGB imagery with faster R-CNN. Remote Sens. 2020, 12, 338. [Google Scholar] [CrossRef] [Green Version]
  15. White, J.W.; Andrade-Sanchez, P.; Gore, M.A.; Bronson, K.F.; Coffelt, T.A.; Conley, M.M.; Feldmann, K.A.; French, A.N.; Heun, J.T.; Hunsaker, D.J.; et al. Field-based phenomics for plant genetics research. Field Crops Res. 2012, 133, 101–112. [Google Scholar] [CrossRef]
  16. Kirchgessner, N.; Liebisch, F.; Yu, K.; Pfeifer, J.; Friedli, M.; Hund, A.; Walter, A. The ETH field phenotyping platform FIP: A cable-suspended multi-sensor system. Funct. Plant Biol. 2017, 44, 154–168. [Google Scholar] [CrossRef]
  17. Yang, G.; Liu, J.; Zhao, C.; Li, Z.; Huang, Y.; Yu, H.; Xu, B.; Yang, X.; Zhu, D.; Zhang, X.; et al. Unmanned aerial vehicle remote sensing for field-based crop phenotyping: Current status and perspectives. Front. Plant Sci. 2017, 8, 1111. [Google Scholar] [CrossRef]
  18. Lu, H.; Cao, Z.; Xiao, Y.; Zhuang, B.; Shen, C. TasselNet: Counting maize tassels in the wild via local counts regression network. Plant Methods 2017, 13, 79. [Google Scholar] [CrossRef] [Green Version]
  19. Tang, W.; Zhang, Y.; Zhang, D.; Yang, W.; Li, M. Corn tassel detection based on image processing. In Proceedings of the 2012 International Workshop on Image Processing and Optical Engineering, Harbin, China, 9–10 June 2012; International Society for Optics and Photonics: The Hague, The Netherlands, 2012; Volume 8335. [Google Scholar]
  20. Shi, Y.; Thomasson, J.A.; Murray, S.C.; Pugh, N.A.; Rooney, W.L.; Shafian, S.; Rajan, N.; Rouze, G.; Morgan, C.L.; Neely, H.L.; et al. Unmanned aerial vehicles for high-throughput phenotyping and agronomic research. PLoS ONE 2016, 11, e0159781. [Google Scholar] [CrossRef] [Green Version]
  21. Watanabe, K.; Guo, W.; Arai, K.; Takanashi, H.; Kajiya-Kanegae, H.; Kobayashi, M.; Yano, K.; Tokunaga, T.; Fujiwara, T.; Tsutsumi, N.; et al. High-throughput phenotyping of sorghum plant height using an unmanned aerial vehicle and its application to genomic prediction modeling. Front. Plant Sci. 2017, 8, 421. [Google Scholar] [CrossRef] [Green Version]
  22. Zaman-Allah, M.; Vergara, O.; Araus, J.; Tarekegne, A.; Magorokosho, C.; Zarco-Tejada, P.; Hornero, A.; Albà, A.H.; Das, B.; Craufurd, P.; et al. Unmanned aerial platform-based multi-spectral imaging for field phenotyping of maize. Plant Methods 2015, 11, 35. [Google Scholar] [CrossRef] [Green Version]
  23. Jang, G.; Kim, J.; Yu, J.K.; Kim, H.J.; Kim, Y.; Kim, D.W.; Kim, K.H.; Lee, C.W.; Chung, Y.S. Review: Cost-Effective Unmanned Aerial Vehicle (UAV) Platform for Field Plant Breeding Application. Remote Sens. 2020, 12, 998. [Google Scholar] [CrossRef] [Green Version]
  24. Guo, W.; Potgieter, A.; Jordan, D.; Armstrong, R.; Lawn, K.; Kakeru, W.; Duan, T.; Zheng, B.; Iwata, H.; Chapman, S.; et al. Automatic detecting and counting of sorghum heads in breeding field using RGB imagery from UAV. In Proceedings of the CIGR-AgEng Conference—CIGR 2016, Aarhus, Denmark, 26–29 June 2016; pp. 1–5. [Google Scholar]
  25. Guo, W.; Zheng, B.; Potgieter, A.B.; Diot, J.; Watanabe, K.; Noshita, K.; Jordan, D.R.; Wang, X.; Watson, J.; Ninomiya, S.; et al. Aerial imagery analysis–quantifying appearance and number of sorghum heads for applications in breeding and agronomy. Front. Plant Sci. 2018, 9, 1544. [Google Scholar] [CrossRef] [PubMed] [Green Version]
  26. Gnädinger, F.; Schmidhalter, U. Digital counts of maize plants by unmanned aerial vehicles (UAVs). Remote Sens. 2017, 9, 544. [Google Scholar] [CrossRef] [Green Version]
  27. Reza, M.N.; Na, I.S.; Lee, K.H. Automatic Counting of Rice Plant Numbers after Transplanting Using Low Altitude UAV Images. Int. J. Contents 2017, 13, 1–8. [Google Scholar]
  28. Shuaibing, L.; Guijun, Y.; Chenquan, Z.; Haitao, J.; Haikuan, F.; Bo, X.; Hao, Y. Extraction of maize seedling number information based on UAV imagery. Trans. Chin. Soc. Agric. Eng. (Trans. CSAE) 2018, 34, 69–77. [Google Scholar]
  29. Wang, Y.; Zhu, X.; Wu, B. Automatic detection of individual oil palm trees from UAV images using HOG features and an SVM classifier. Int. J. Remote Sens. 2019, 40, 7356–7370. [Google Scholar] [CrossRef]
  30. Nevalainen, O.; Honkavaara, E.; Tuominen, S.; Viljanen, N.; Hakala, T.; Yu, X.; Hyyppä, J.; Saari, H.; Pölönen, I.; Imai, N.N.; et al. Individual tree detection and classification with UAV-based photogrammetric point clouds and hyperspectral imaging. Remote Sens. 2017, 9, 185. [Google Scholar] [CrossRef] [Green Version]
  31. Su, J.; Liu, C.; Coombes, M.; Hu, X.; Wang, C.; Xu, X.; Li, Q.; Guo, L.; Chen, W.H. Wheat yellow rust monitoring by learning from multispectral UAV aerial imagery. Comput. Electron. Agric. 2018, 155, 157–166. [Google Scholar] [CrossRef]
  32. Zhang, X.; Han, L.; Dong, Y.; Shi, Y.; Huang, W.; Han, L.; González-Moreno, P.; Ma, H.; Ye, H.; Sobeih, T. A deep learning-based approach for automated yellow rust disease detection from high-resolution hyperspectral uav images. Remote Sens. 2019, 11, 1554. [Google Scholar] [CrossRef] [Green Version]
  33. Uijlings, J.R.; Van De Sande, K.E.; Gevers, T.; Smeulders, A.W. Selective search for object recognition. Int. J. Comput. Vis. 2013, 104, 154–171. [Google Scholar] [CrossRef] [Green Version]
  34. Breiman, L. Random forests. Mach. Learn. 2001, 45, 5–32. [Google Scholar] [CrossRef] [Green Version]
  35. Liaw, A.; Wiener, M. Classification and regression by randomForest. R News 2002, 2, 18–22. [Google Scholar]
  36. Zhang, L.; Liu, Z.; Ren, T.; Liu, D.; Ma, Z.; Tong, L.; Zhang, C.; Zhou, T.; Zhang, X.; Li, S. Identification of Seed Maize Fields With High Spatial Resolution and Multiple Spectral Remote Sensing Using Random Forest Classifier. Remote Sens. 2020, 12, 362. [Google Scholar] [CrossRef] [Green Version]
  37. Waldner, F.; Lambert, M.J.; Li, W.; Weiss, M.; Demarez, V.; Morin, D.; Marais-Sicre, C.; Hagolle, O.; Baret, F.; Defourny, P. Land cover and crop type classification along the season based on biophysical variables retrieved from multi-sensor high-resolution time series. Remote Sens. 2015, 7, 10400–10424. [Google Scholar] [CrossRef] [Green Version]
  38. De Castro, A.I.; Torres-Sánchez, J.; Peña, J.M.; Jiménez-Brenes, F.M.; Csillik, O.; López-Granados, F. An automatic random forest-OBIA algorithm for early weed mapping between and within crop rows using UAV imagery. Remote Sens. 2018, 10, 285. [Google Scholar] [CrossRef] [Green Version]
  39. Li, M.; Ma, L.; Blaschke, T.; Cheng, L.; Tiede, D. A systematic comparison of different object-based classification techniques using high spatial resolution imagery in agricultural environments. Int. J. Appl. Earth Observ. Geoinf. 2016, 49, 87–98. [Google Scholar] [CrossRef]
  40. Meyer, G.E.; Neto, J.C. Verification of color vegetation indices for automated crop imaging applications. Comput. Electron. Agric. 2008, 63, 282–293. [Google Scholar] [CrossRef]
  41. Liu, T.; Li, R.; Zhong, X.; Jiang, M.; Jin, X.; Zhou, P.; Liu, S.; Sun, C.; Guo, W. Estimates of rice lodging using indices derived from UAV visible and thermal infrared images. Agric. For. Meteorol. 2018, 252, 144–154. [Google Scholar] [CrossRef]
  42. Strobl, C.; Boulesteix, A.L.; Kneib, T.; Augustin, T.; Zeileis, A. Conditional variable importance for random forests. BMC Bioinform. 2008, 9, 307. [Google Scholar] [CrossRef] [Green Version]
  43. Strobl, C.; Boulesteix, A.L.; Zeileis, A.; Hothorn, T. Bias in random forest variable importance measures: Illustrations, sources and a solution. BMC Bioinform. 2007, 8, 25. [Google Scholar] [CrossRef] [Green Version]
  44. Simonyan, K.; Zisserman, A. Very Deep Convolutional Networks for Large-Scale Image Recognition. arXiv 2014, arXiv:1409.1556. [Google Scholar]
  45. Davis, J.; Goadrich, M. The relationship between Precision-Recall and ROC curves. In Proceedings of the 23rd International Conference on Machine Learning, Pittsburgh, PA, USA, 25–29 June 2006; pp. 233–240. [Google Scholar]
  46. Ren, S.; He, K.; Girshick, R.B.; Sun, J. Faster R-CNN: Towards Real-Time Object Detection with Region Proposal Networks. IEEE Trans. Pattern Anal. Mach. Intell. 2015, 39, 1137–1149. [Google Scholar] [CrossRef] [PubMed] [Green Version]
  47. Ren, Y.; Zhu, C.; Xiao, S. Small object detection in optical remote sensing images via modified faster R-CNN. Appl. Sci. 2018, 8, 813. [Google Scholar] [CrossRef] [Green Version]
Figure 1. The layout of experimental field.
Remotesensing 12 03049 g001
Figure 2. Challenges of maize tassels detection in field. (a) Complex background: (1) soil background, (2) green leaf, (3) reflective leaf, (4) shadow. (b) Tassels vary in shape and size: (1) (2) tassels vary in shape, and (3) size; (c) Tassel pose variations caused by wind.
Remotesensing 12 03049 g002
Figure 3. Schematic diagram of method.
Remotesensing 12 03049 g003
Figure 4. Process of sample acquisition. (a) Original image. (b) Cropped image. (c) Random sample points (white points).
Remotesensing 12 03049 g004
Figure 5. Importance derived by permuting each feature and computing change in accuracy.
Remotesensing 12 03049 g005
Figure 6. The extraction of potential tassel region proposals. (a) Original image. (b) Classification result by RF. (c) Binary image of tassels (white is tassel regions, black is non-tassel regions). (d) Result of morphological dilation (white is tassel regions, black is non-tassel regions).
Remotesensing 12 03049 g006
Figure 7. The pixel number distribution of envelope rectangles.
Remotesensing 12 03049 g007
Figure 8. Architecture of VGG16 network.
Remotesensing 12 03049 g008
Figure 9. Endpoint detection of tassels. (a) 0, 1 matrix of tassel skeleton. (b) Matrix after applied padding, the blue box is a 3 × 3 window. (c) Pixel with the deepest color are the endpoints of tassel.
Remotesensing 12 03049 g009
Figure 10. Loss and accuracy curve.
Remotesensing 12 03049 g010
Figure 11. Detection results of tassels. The red boxes, blue boxes, and yellow boxes in the figure automatically represent detection, absent detection, and incorrect detection by proposed method respectively.
Remotesensing 12 03049 g011
Figure 12. Detailed diagram of detection results. Red boxes represent automatically detection by proposed method, (1) the newly grown tassels; (2) reflective leaf was misidentified as tassel; (3) and (4) leaves vein were misidentified as tassels.
Remotesensing 12 03049 g012
Figure 13. The calculation of tassel branch number. (a) Original image. (b) Binary image after morphological dilatation. (c) Tassel skeleton. (d) Endpoint detection.
Remotesensing 12 03049 g013
Figure 14. (a) The distributions of pixel width and height of tassels. (b) The distribution of tassels morphology.
Remotesensing 12 03049 g014
Table 1. Classification results under different proportions of tassel samples.
Proportions of Tassel SamplesPrecisionRecallF1-ScoreOA
4%0.940.700.800.877
6%0.930.720.810.881
10%0.890.800.840.886
15%0.890.800.850.891
20%0.860.840.850.888
25%0.850.840.840.880
Table 2. Validation accuracy of model under fine-tuning.
Envelope Rectangles’ SizeValidation Accuracy_6Validation Accuracy_8Validation Accuracy_10
original envelope rectangles0.9440.9350.935
600 pixels0.9520.9540.940
Validation accuracy_6 represents the validation accuracy of model obtained by releasing deep networks that are after the sixth convolution layer.
Table 3. Evaluation of tassels detection results.
Tasseling StageTPFPFNPrecisionRecallF1-Score
Early tasseling stage (include 11 breeding plots)584550.7780.9690.863
Middle tasseling stage (include 13 breeding plots)58586240.8720.9610.914
Late tasseling stage (include 26 breeding plots)134790150.9370.9890.962
Overall (include 50 breeding plots)2090221440.9040.9790.940
Table 4. The result of RF in fine detection of tassels.
CategoriesOAPrecisionRecallF1-Score
tassel0.7960.8230.6940.753
non-tassel 0.7800.8790.826

