Article

On the Characterization and Forecasting of Ground Displacements of Ocean-Reclaimed Lands

1
Key Laboratory of Geographical Information Science, Ministry of Education, East China Normal University, Shanghai 200062, China
2
Institute of Eco-Chongming (I.E.C.), East China Normal University, Shanghai 202162, China
3
School of Geographic Sciences, East China Normal University, Shanghai 200241, China
4
Institute for Electromagnetic Sensing of the Environment (IREA), Italian National Research Council, 328, Diocleziano, 80124 Napoli, Italy
5
Institute of Methodologies for Environmental Analysis (IMAA), Italian National Research Council, Tito Scalo, 85050 Potenza, Italy
6
School of Engineering, The University of Basilicata, 85100 Potenza, Italy
*
Author to whom correspondence should be addressed.
Remote Sens. 2020, 12(18), 2971; https://doi.org/10.3390/rs12182971
Submission received: 5 August 2020 / Revised: 6 September 2020 / Accepted: 6 September 2020 / Published: 12 September 2020
(This article belongs to the Special Issue Monitoring Sustainable Development Goals)

Abstract

:
In this work, we study ground deformation of ocean-reclaimed platforms as retrieved from interferometric synthetic aperture radar (InSAR) analyses. We investigate, in particular, the suitability and accuracy of some time-dependent models used to characterize and foresee the present and future evolution of ground deformation of the coastal lands. Previous investigations, carried out by the authors of this paper and other scholars, related to the zone of the ocean-reclaimed lands of Shanghai, have already shown that ocean-reclaimed lands are subject to subside (i.e., the ground is subject to settling down due to soil consolidation and compression), and the temporal evolution of that deformation follows a certain predictable model. Specifically, two time-gapped SAR datasets composed of the images collected by the ENVISAT ASAR (ENV) from 2007 to 2010 and the COSMO-SkyMed (CSK) sensors, available from 2013 to 2016, were used to generate long-term ground displacement time-series using a proper time-dependent geotechnical model. In this work, we use a third SAR data set consisting of Radarsat-2 (RST-2) acquisitions collected from 2012 to 2016 to further corroborate the validity of that model. As a result, we verified with the new RST-2 data, partially covering the gap between the ENV and CSK acquisitions, that the adopted model fits the data and that the model is suitable to perform future projections. Furthermore, we extended these analyses to the area of Pearl River Delta (PRD) and the city of Shenzhen, China. Our study aims to investigate the suitability of different time-dependent ground deformation models relying on the different geophysical conditions in the two areas of Shanghai and Shenzhen, China. To this aim, three sets of SAR data, collected by the ENV platform (from both ascending and descending orbits) and the Sentinel-1A (S1A) sensor (on ascending orbits), were used to obtain the ground displacement time-series of the Shenzhen city and its surrounding region. Multi-orbit InSAR data products were also combined to discriminate the up–down (subsidence) ground deformation time-series of the coherent points, which are then used to estimate the parameters of the models adopted to foresee the future evolution of the land-reclaimed ground consolidation procedure. The exploitation of the obtained geospatial data and products are helpful for the continuous monitoring of coastal environments and the evaluation of the socio-economical impacts of human activities and global climate change.

Graphical Abstract

1. Introduction

Many coastal cities have implemented land reclamation projects, which can effectively provide feasible conditions for the development of coastal cities [1,2,3,4,5]. However, land reclamation projects artificially change the landform and geological environment, possibly resulting in geological disasters. Moreover, natural disasters such as flooding [6], coastal erosion [7], and ground subsidence in coastal areas are further aggravated by the current global sea-level rise [8]. Ground subsidence is an inherent problem in reclamation areas, due to the engineering and physical properties of the reclaimed materials. Severe ground subsidence could lead to the damage of buildings, roads, and public infrastructures. Therefore, the long-term investigation of the ground displacements of the reclamation areas is indispensable to maintain the public safety and sustainability of the coastal regions.
The Shanghai metropolitan area reclaimed a total of 580 km2 from 1985 to 2010 [9]. Shenzhen, as an special economic zone, located on the south coast of China, has also reclaimed about 100 km2 of lands from the ocean since 1979 [3]. Based on the engineering and geological properties of the materials used for the reclamation projects, the ground subsidence can be distinguished into three stages. Among them, the secondary compression stage of the alluvial deposits is the indispensable observation stage, which can last for more than ten years after the end of reclamation projects. Interestingly, earth observation (EO) systems have monitored the ongoing surface displacement phenomena for dozens of years [10]. Therefore, synthetic aperture radar (SAR) datasets acquired by different satellites provide us with an excellent opportunity to recover the spatial-temporal evolution of ground deformation of the reclaimed lands.
With the development of time-series InSAR analysis, multi-temporal InSAR (MT-InSAR) techniques, including the small baseline subset (SBAS) [11] and persistent scatterer (PS) [12] mainstream algorithms, have efficiently been applied to monitor urban ground deformations [11,12,13,14,15,16,17,18,19,20,21,22]. However, many scholars are no longer limited to the generation of the MT-InSAR results, but rather establish deformation models based on the results of MT-InSAR to better describe the deformation processes and predict the ground deformation, especially those of reclaimed areas [23,24,25,26,27,28,29,30,31].
In previous work, Pepe et al. [23] applied a geotechnical model to link ENVISAT ASAR (ENV) (2007–2010) and COSMO-SkyMed (CSK) (2013–2016) ground deformation time-series of the Shanghai coastal area, thus generating long-term ENV+CSK surface displacement time-series [23]. However, there were no real InSAR-driven deformation measurements over the time gap between 2010 and 2013, but only information derived from the used geotechnical model to characterize the ground deformation signals from 2010 to 2013. The availability of additional SAR data covering the time gap is beneficial to shed light on the correctness of the ENV+CSK ground deformation time-series obtained, and the usefulness of the applied geotechnical model, to foresee the evolution of the ground displacement in the future, constrained by the available InSAR data. In particular, a new set of SAR data collected by the Radarsat-2 (RST-2) instrument, which is partially time-overlapped with the available CSK dataset (from January 2012 to October 2016), has been collected and processed. It is worth highlighting that the geotechnical model was built based on the specific dredger fill of the reclamation area of Shanghai [24]. Nevertheless, the applicability of such a geotechnical model to other reclamation areas and the rationality of the geotechnical model compared with other deformation models needs to be thoroughly investigated.
In this study, we performed an MT-InSAR analysis based on the application of the well-known small baseline subset (SBAS) technique [11] to the sets of SAR data available in both the Shanghai and Shenzhen areas. In particular, we first compared the RST2-SBAS and CSK-SBAS ground deformation time-series between December 2013 and March 2016 to check the agreement between the results of the two independent SAR datasets, assuming the ground deformation is mainly vertical (subsidence) in these areas, as demonstrated in the literature [32,33]. Then, we investigated the correctness of the geotechnical model used in Shanghai by comparing the combined ENV+CSK ground deformation time-series obtained using that model (see [23] for additional details) with those obtained by the independent set of RST-2 data. The engineering geology conditions of the Lingang New City, Shanghai were taken into account to identify the districts of the megacity that are more prone to subside, and be at risk of inundation in the future. In particular, we extend the work initially provided in [1,2,23] by testing the feasibility of the adopted model describing the ground subsidence against other potential time-dependent models.
Furthermore, we applied and extended these analyses to the area of the Pearl River Delta (PRD) and Shenzhen, China. First, by using two sets of ascending/descending ENV SAR data acquired between 2007 and 2010, we obtained the ground deformation time-series of the vertical (Up–Down) ground deformations by the use of the multi-temporal InSAR minimum acceleration combination (MinA) [34] technique. Then, we used the discriminated vertical ground deformations (i.e., subsidence) to foresee the temporal evolution of the deformation of the ocean-reclaimed platforms as dictated by three independent deformation models, including the geotechnical, the logarithmic, and the exponential decay models. Finally, we used a set of recently acquired Sentinel-1A (S1A) SAR data (ascending data track) to check the validity of the foreseen models. The results show that the independent SAR data and the forecasting models of the ground displacement are helpful for the continuous monitoring of coastal environments and the achievement of global sustainable development goals. There is evidence of a good agreement between the mean deformation velocities foreseen by the models constrained by the ENV data ten years ago and those obtained in the last year by the S1A data. The three models used are described in more detail in the paper.
The novel issues discussed in this paper concern: (i) the exploitation of InSAR data to constrain different ground deformation models, (ii) the cross-comparison and validation of the models used, (iii) the extension of the used models in another geographical area, and (iv) the characterization of the recent ground deformations of Shenzhen, China.

2. Study Areas and Datasets

2.1. Lingang New City of Shanghai
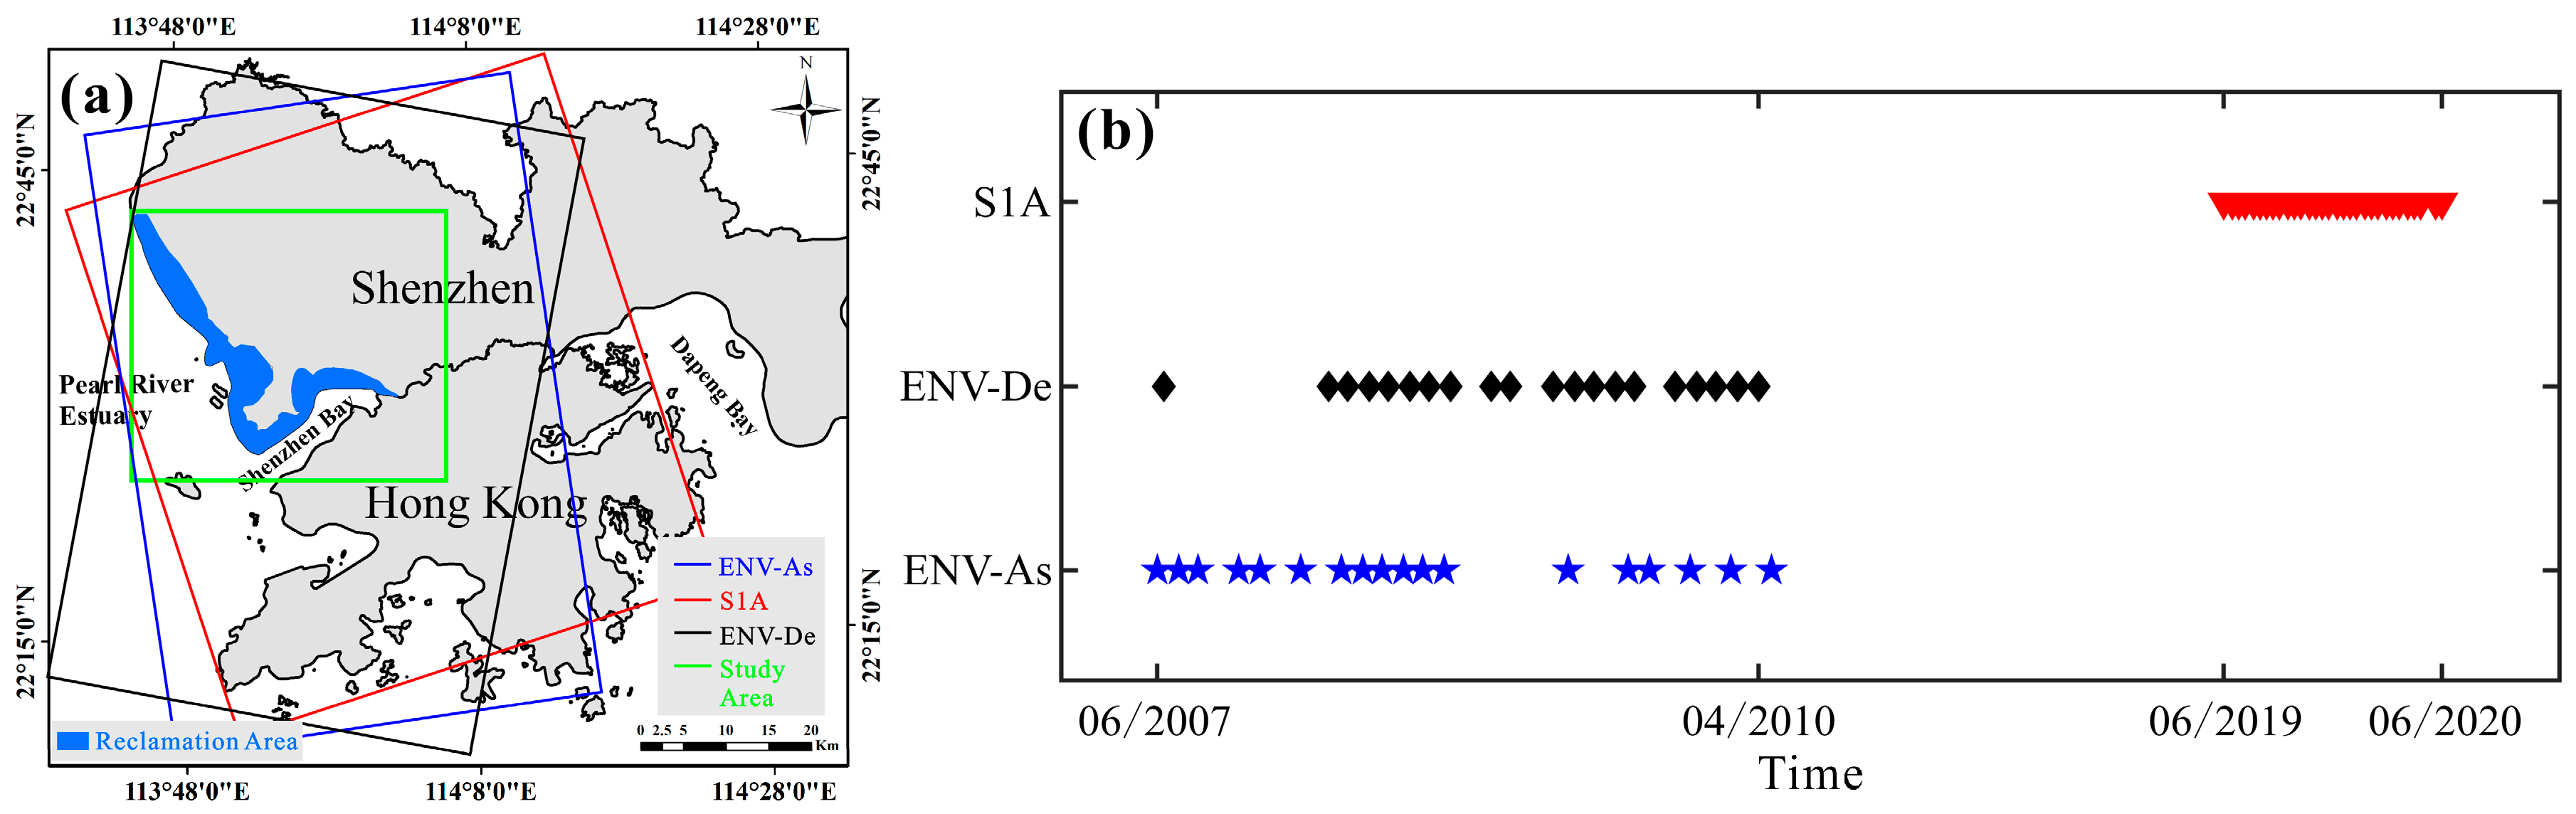
Lingang New City is located in the southeast corner of Shanghai, bounded to the south by Hangzhou Bay and to the east by the East China Sea (approximately longitudes from 121.8°E to 122°E and latitudes from 30.83°N to 31°N), as shown in Figure 1a. An abundant supply of sediment from the Yangtze River made it possible for Shanghai to reclaim new lands, as shown in Figure 1a. In particular, the reclamation procedure of Lingang New City started in 1994 and was almost completed in 2006 [35]. The reclamation project has reclaimed more than 130 km2 of new land for Lingang, which accounts for about 42% of the total area in Lingang New City. In addition to the previous area formed by sediment deposition before 1994, Lingang New City covers a total area of 315 km2 in the southeast corner of Pudong New District of Shanghai.
Three different SAR datasets were used for the Lingang New City of Shanghai. The first dataset consists of 35 images, collected by ENV sensor, from 26 February 2007, to 13 September 2010 (ascending passes, VV polarization, with an average revisit time of about 35 days, with a sensor side-looking and a satellite heading angle of about 23° and −12°, respectively). Table S1 in Supplementary Material lists the ENV dataset. The second dataset consists of 44 images, collected by RST-2 sensor, from 29 June 2012, to 22 October 2016 (descending passes, VV polarization, with an average revisit time of about 24 days, with a sensor side-looking and a satellite heading angle of about 25° and 195°, respectively). Table S3 in Supplementary Material lists the RST-2 dataset. The third dataset consists of 61 images, collected by CSK sensor, from 7 December 2013, to 18 March 2016 (descending passes, HH polarization, with an average revisit time of about 24 days, with a sensor side-looking and a satellite heading angle of about 29° and 8°, respectively). Table S2 in Supplementary Material lists the CSK dataset. The spatiotemporal coverages of the three datasets are shown in Figure 1.

2.2. Shenzhen

Shenzhen is located in the south of Guangdong province and the eastern side of Pearl River Delta (PRD), bounded to the south by Shenzhen Bay and Hong Kong, to the east by Daya Bay, and to the west by the Pearl River estuary and Dapeng Bay, as shown in Figure 2a. For the sake of urban development, about 100 km2 of lands have been reclaimed in Shenzhen since 1979 [3,36]. The consolidation settlement of the reclamation area also brings potential public safety risks to the Shenzhen coastal area.
Three different SAR datasets have been used to retrieve ground deformation of Shenzhen. The first dataset consists of 18 images, collected by ENV, from 13 June 2007, to 28 April 2010 (ascending passes, VV polarization). The second dataset consists of 20 images, also collected by ENV, from 24 June 2007, to 4 April 2010 (descending passes, VV polarization). Tables S4 and S5 in Supplementary Material list the ENV ascending and descending dataset respectively. The third dataset consists of 31 images, collected by S1A sensor, from 6 June 2019, to 12 June 2020 (ascending passes, VV polarization, with an average revisit time of about 12 days, with a sensor side-looking and a satellite heading angle of about 39° and 348°, respectively). Table S6 in Supplementary Material lists the S1A dataset. The spatiotemporal coverages of those three datasets are shown in Figure 2.

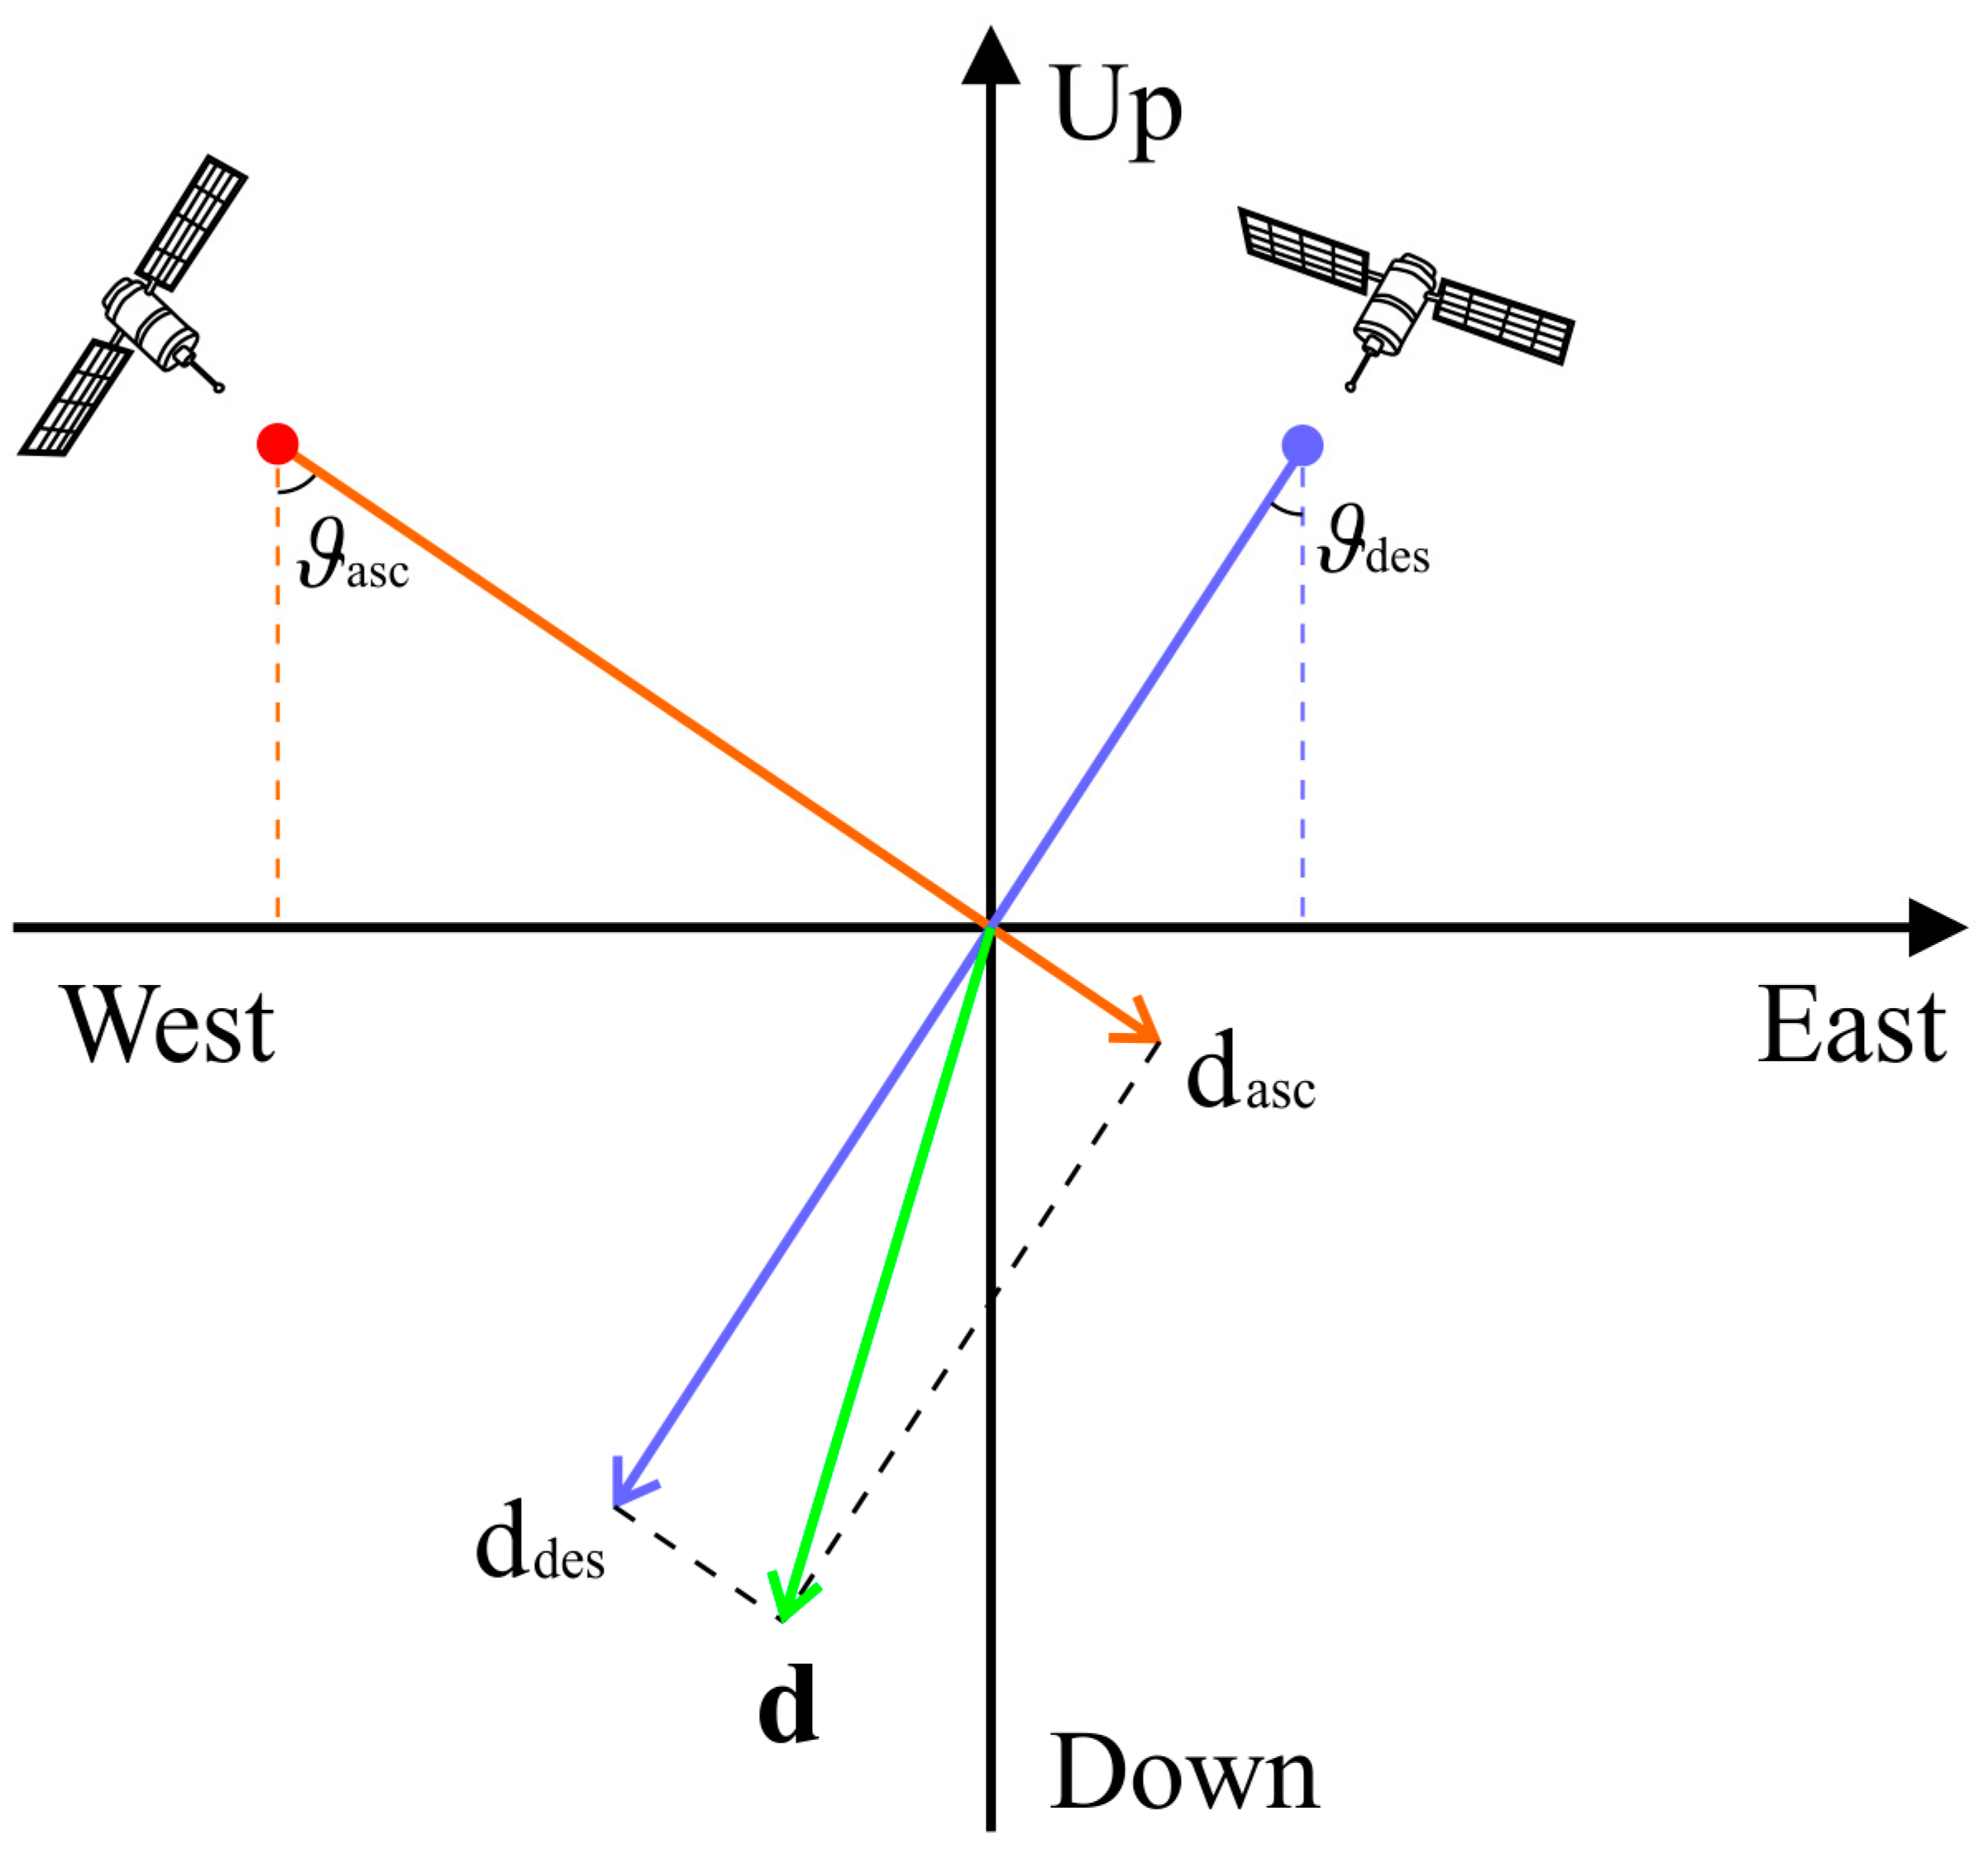
3. InSAR Algorithms for the Estimation of the Ground Displacement over Ocean-Reclaimed Lands

For our experiments, the small baseline subset (SBAS) technique [11] was applied for the generation of the line-of-sight (LOS)-projected ground displacement time-series and mean deformation velocity maps [11]. Here, we briefly describe the rationale of the SBAS technique. The algorithm is a widely used multi-temporal InSAR (MT-InSAR) approach that is based on the process of long-term sequences of multi-look interferograms. In particular, if we suppose a set of Q co-registered SAR images, acquired at ordered times [ t 1 , t 2 , , t Q ] T , the SBAS algorithm requires a proper selection of SAR acquisitions of data pairs characterized by short temporal (i.e., the time interval between two acquisitions) and spatial (i.e., the distance between two satellite orbits) baselines. The implementation of such constraints on the baselines allows one to reduce the noise related to decorrelation effects in the interferograms and, accordingly, to maximize the number of reliable measurement points.
On the other hand, such a preliminarily pre-selection step of the small baseline (SB) interferograms may lead to the SAR images being distributed into subsets, which are separated by large baselines and are independent each other, i.e., with no eligible interferograms connecting data belonging to different subsets. This circumstance gives rise to an undetermined problem for the ground deformation time-series inversion, which is addressed by searching for a minimum norm least-squares (LS) solution through the singular value decomposition (SVD) method [37]. In our study, we use an improved SBAS processing chain, which also includes the detection and correction of residual topographic errors related to the inaccurate digital elevation models (DEMs) used for computing the differential interferograms and the effects of orbital inaccuracies. The phase unwrapping (PhU) operations are performed with the well-known space-time extended minimum cost flow (EMCF) PhU technique initially presented in [38]. Finally, the obtained LOS-projected ground deformation time-series are cleaned from the atmospheric phase screen (APS) signals. Additional details on the SBAS algorithm and the SBAS processing chain, can be found in [39]. After the SBAS processing, the LOS ground displacement time-series related to different multiple-orbit (ascending/descending) data tracks are geocoded to a common spatial grid of high-coherent points. For our subsequent analyses, let d ( P ) = [ d 1 ( P ) , d 2 ( P ) , , d Q ( P ) ] T be the (geocoded) LOS deformation time-series, which is computed in correspondence with the generic pixel P. Therefore, a post-processing step, aimed at properly combining them to retrieve the East–West (E–W), and North–South (N–S), and up–down (U–D) components of the surface displacement [34], is applied. Indeed, LOS ground deformation values can be expressed as [34]
d ( P ) = sin ϑ ( P ) cos φ ( P ) e ( P ) + sin ϑ ( P ) sin φ ( P ) n ( P ) + cos ϑ ( P ) h ( P )
where e ( P ) = [ e 1 ( P ) , e 2 ( P ) , , e Q ( P ) ] T , n ( P ) = [ n 1 ( P ) , n 2 ( P ) , , n Q ( P ) ] T and h ( P ) = [ h 1 ( P ) , h 2 ( P ) , , h Q ( P ) ] T are the 3-D cumulative deformation components in the East–West, North–South, and vertical directions, respectively. Moreover, ϑ ( P ) is the radar-to-target incidence angle and φ ( P ) is the corresponding satellite-heading angle. The geometry of the multiple-angle SAR acquisitions (ascending/descending) is shown in Figure 3.
The adopted combination technique is known as the minimum acceleration (MinA) technique since it relies on imposing the constraint that the (unknown) 3-D deformation time-series has minimum acceleration. To decompose the preliminarily computed, LOS-projected, ground- displacement time-series into the 3-D ground-displacement time-series, we adopted the procedure fully detailed in [34]. It consists of connecting, pixel-by-pixel, the LOS-projected displacement time-series to the set of (unknown) 3-D velocities among consecutive SAR acquisitions, and the subsequent time integration of the 3-D velocities [34]. Mathematically, this operation translates into writing an underdetermined system of independent linear equations, which can be solved using LS minimization based on the SVD method. The obtained system of linear equations is regularized by imposing the additional constraint that the 3-D displacement components have minimum acceleration, i.e., that the difference between consecutive velocities is minimal. Finally, once estimated, the unknown 3-D velocities are time-integrated to recover the E–W, N–S, and U–D deformation time series. The capability of the novel MinA technique to allow detailed Earth surface deformation analyses is fully exploited here by profitably combining independent datasets acquired by different satellite SAR sensors (ENVISAT, RADARSAT-2, Cosmo-SkyMed) operating at different wavelengths (i.e., C, X), polarization (i.e., HH, VV), and looking angles [40]. In particular, in our paper, we applied a simplified version of the MinA technique, characterized by assuming the North–South components of the ground deformation are negligible in the measured LOS deformation time-series. Interested readers are invited to refer to [1] for a fully detailed characterization of the modified MinA approach, where an extensive statistical study of the error budget of the method is also presented.

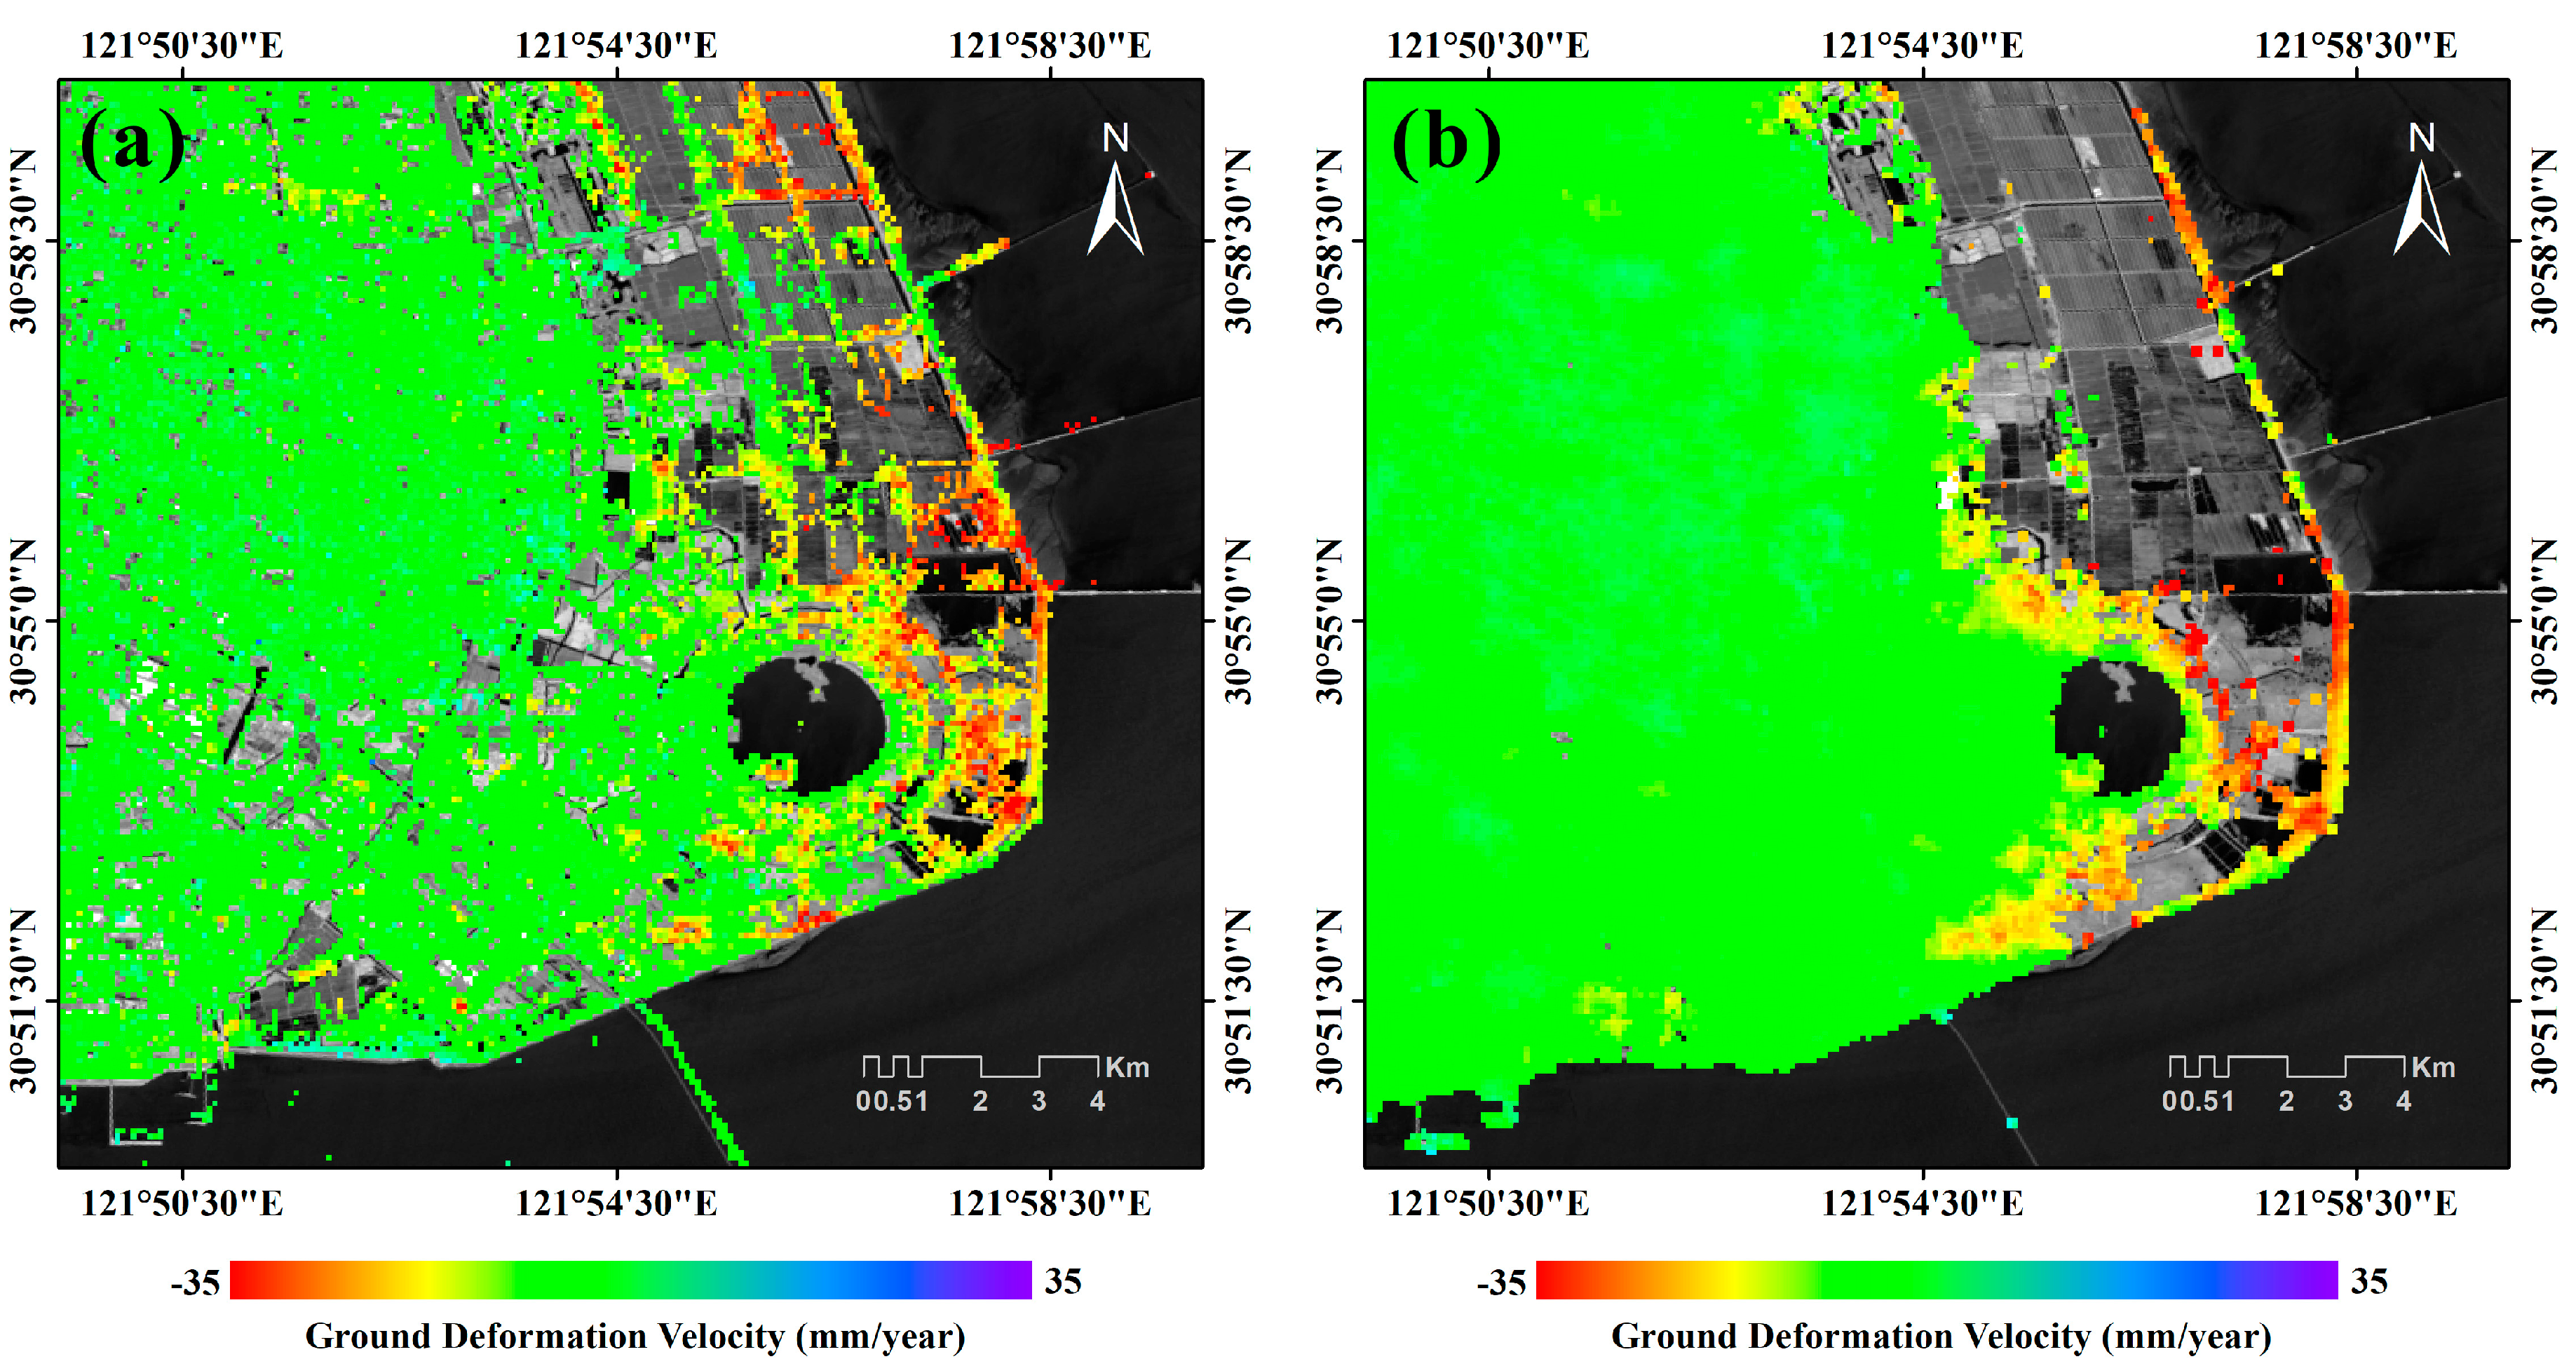
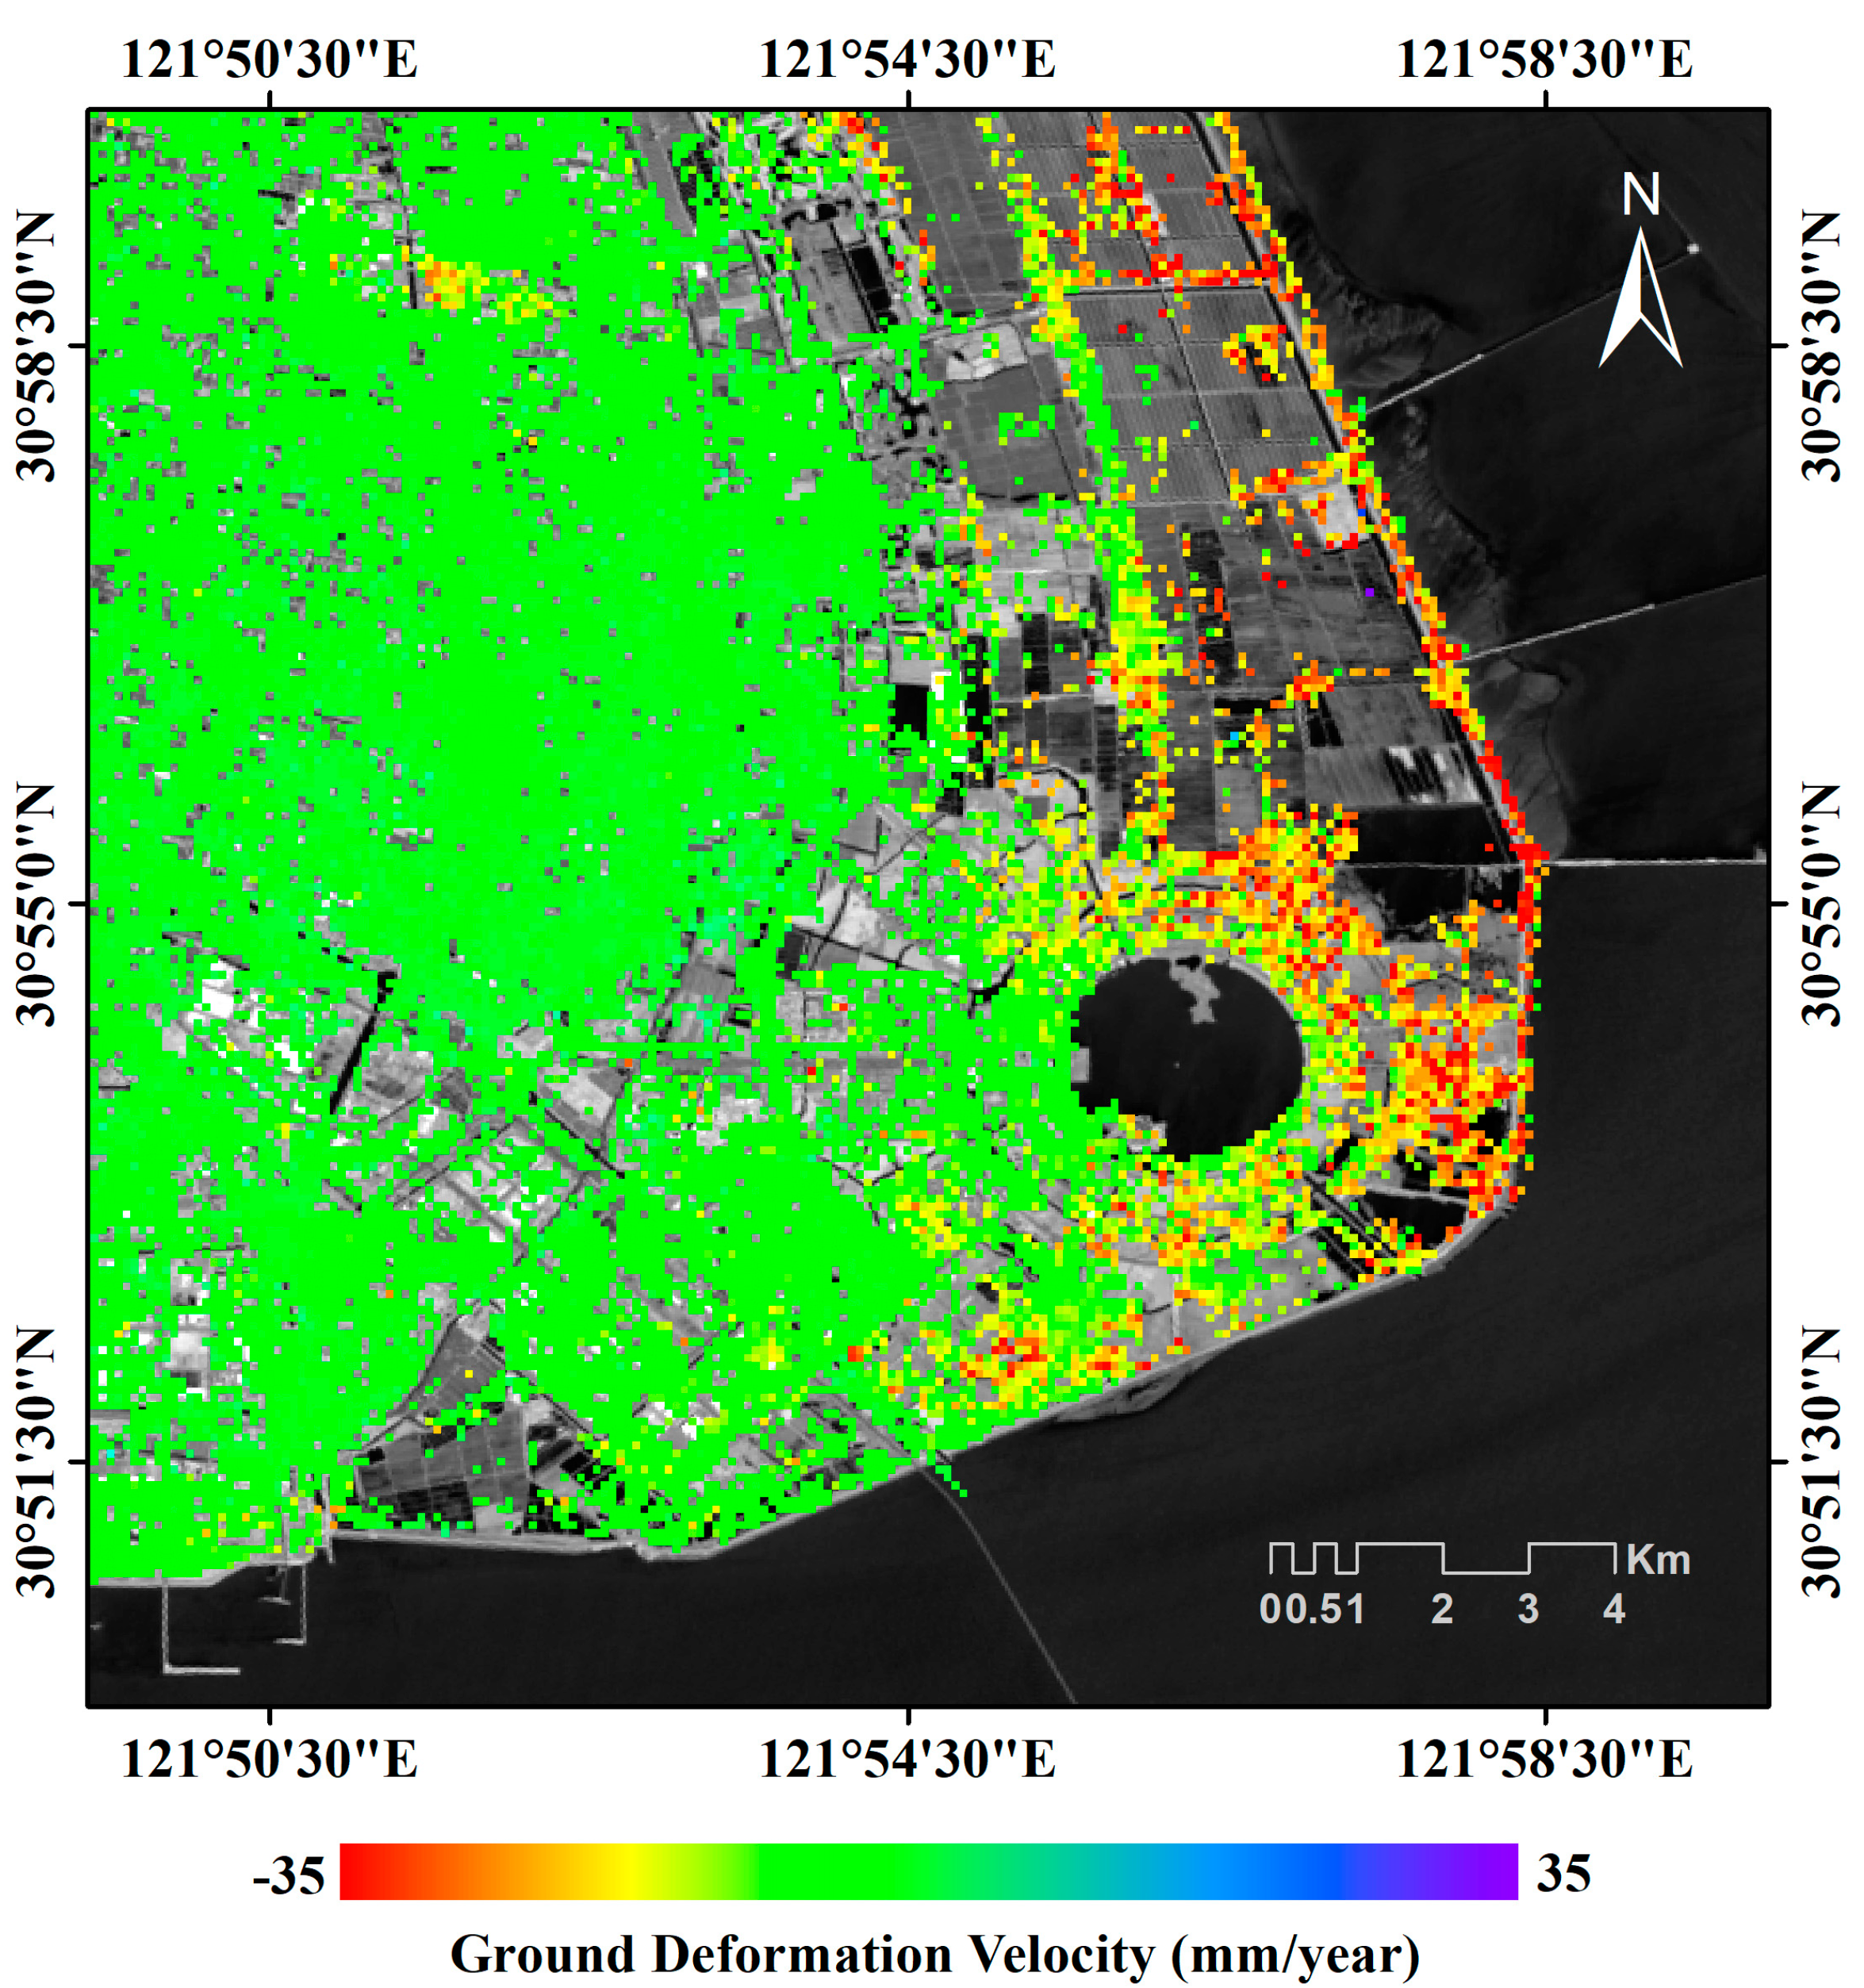
4. Ground Deformation Results of Shanghai and Analyses

This section is devoted to proving that the geotechnical model used to fill the time gap between the ENV and the CSK deformation time-series in [23] is sound. To this aim, the independent RST-2 SAR dataset and the ground deformation time-series, obtained by processing this new SAR dataset with the SBAS algorithm [11], represent the key to support this proof. As shown in Figure 4, the RST-2 and CSK datasets have a long overlap period from December 2013 to March 2016, and the RST-2 dataset partially fills the gap between the ENV and the CSK datasets, from January 2012 to December 2013. To compare the independent CSK and RST-2 InSAR ground deformation time-series, we assumed that the deformation of the terrain in the coastal regions of the city is mainly vertical (e.g., subsidence), as also assumed in previous investigations [19] and supported by evidence in the literature [32]. Under this hypothesis, the vertical ground deformation was obtained by merely re-projecting the line-of-sight (LOS) deformation into the vertical direction, as clarified in the following sub-section.

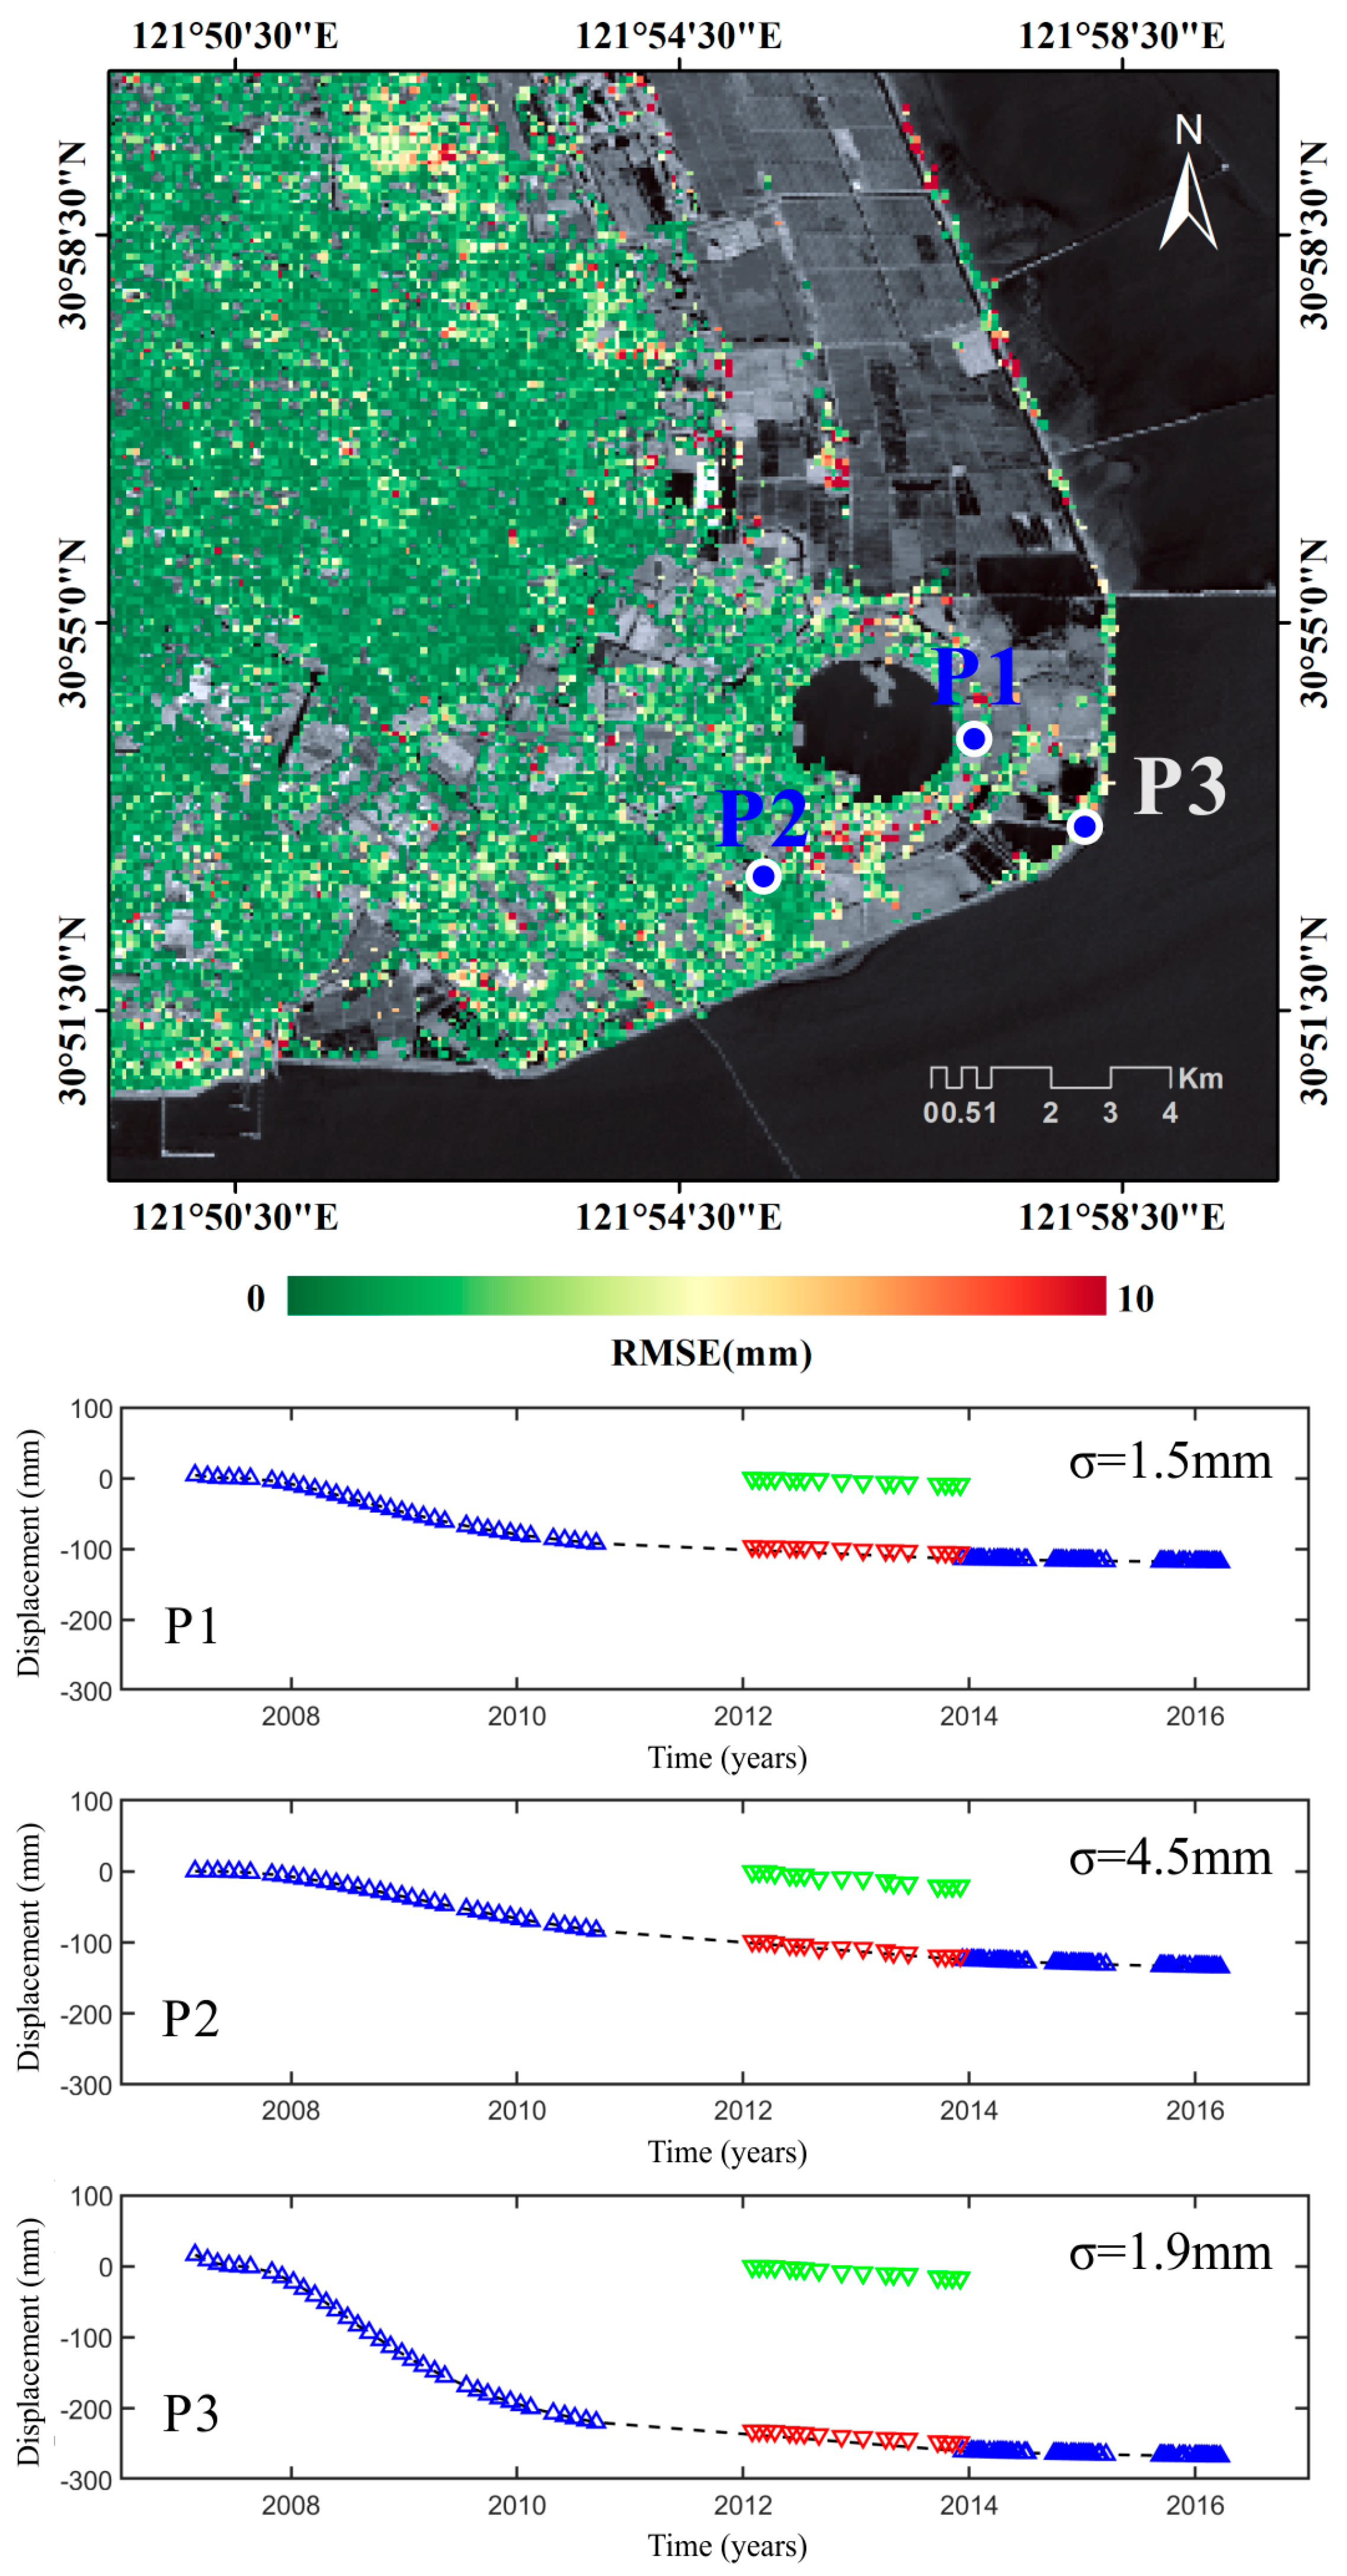
4.1. RST-2 Ground Deformation Time-Series: As the Third Party Inspection Data

The RST-2 dataset was processed using the SBAS algorithm [11] to obtain the line-of-sight (LOS)-projected displacement time-series, which were preliminarily geocoded to have a common spatial reference grid over which to perform the subsequent analyses. First, we generated 145 RST-2 differential SAR interferograms, selected by considering maximum perpendicular and temporal baseline values of 400 m and 180 days, respectively. Moreover, a complex multi-look operation, with four looks in the azimuth and twenty looks in the range direction, was performed for every interferogram to reduce the influence of the decorrelation noise. Correspondingly, we obtained 145 multi-looked interferograms with a resolution of about 90 × 90 m. All the interferograms were noise-filtered [41] and then unwrapped [38,42]. After that, we obtained the RST-2 LOS-projected displacement time-series. As earlier anticipated, it is well known that deformation is mainly vertical in Shanghai [32]. Thus, the RST-2 LOS displacement time-series were converted, pixel-by-pixel, into vertical movements as follows:
h = d / cos ϑ
where h is the vertical deformation, d is the LOS deformation, and ϑ is the radar side-looking angle. The CSK and RST-2 mean deformation velocity maps of the Lingang New City are shown in Figure 5.
Initially, we compared the RST-2 (vertical) surface deformation time-series with that provided by the (single) CSK displacement time-series during the overlapping time, i.e., from December 2013 to March 2016, to evaluate the consistency of the InSAR measurements obtained by the independently processed CSK and RST-2 SAR data. However, of course, the time acquisitions T 1 [ t ( 1 ) ,   t ( 2 ) ,   , t ( i ) ] (i = 1, 2, , M) of the CSK data are not the same as those of the RST-2 dataset, namely T 2 [ t ( 1 ) ,   t ( 2 ) ,   , t ( i ) ] (i = 1, 2, , N), with t ( i ) , with the time of the i-th SAR image for the two separate datasets being, from December 2013 to March 2016. Accordingly, we preliminarily (linearly) time-interpolated the CSK deformation time-series over the RST-2 acquisition times as follows:
d C S K ( t ( i ) ) = d C S K ( t r ( i ) ) d C S K ( t l ( i ) ) t r ( i ) t l ( i ) [ t ( i ) t l ( i ) ] + d C S K ( t l ( i ) )       i = 1 , 2 , , N
where d C S K ( t ( i ) ) is the CSK cumulative ground deformation at t ( i ) , where t ( i ) belongs to T 2 . Moreover, d C S K ( t r ( i ) ) and d C S K ( t l ( i ) ) are the CSK cumulative deformation at t r ( i ) and t l ( i ) , respectively, with t r ( i ) and t l ( i ) being the closest times to the right and left of t ( i ) , respectively. As a result, we obtained the interpolated CSK ground deformation time-series at the time acquisition vectors T 2 . However, the ground deformation time-series for every dataset is calculated relative to the earliest SAR image of the set (the earliest RST-2 image is 29 January 2012, and the earliest CSK image is 7 December 2013). Accordingly, to compare the two CSK and RST-2 datasets, the systematic ground deformation bias between the two SAR datasets was estimated for every point that was common to both datasets. Expressed in a mathematical formula, the following equation holds (see also Figure 4):
d C S K ( P , t ) d R S T 2 ( P , t ) = d R S T 2 ( P , t ) + Δ ( P )
where d C S K ( P , t ) is the CSK deformation time-series at the given point P into the overlapped spatial region between the two processed CSK and RST-2 slices (see Figure 1a), d R S T 2 ( P , t ) is the adjusted RST-2 ground-deformation time-series in the same point P, and d R S T 2 ( P , t ) is the corresponding, original RST-2 ground deformation time-series. Moreover, we calculated, for every point P, the unique value of the ground-deformation bias Δ that minimizes d C S K d R S T 2 ~ 2 . The mean value of root mean square error (RMSE) between the adjusted CSK and RST-2 ground deformation time-series, calculated at common coherent points between d C S K and d R S T 2 ~ , was estimated. Its average value over the scene is about 3.5 mm, which is in agreement with the expected accuracy of SBAS measurements, which is in the order of 5 mm for the ground-deformation time-series [43]. We also cross-compared the (vertical) mean ground deformation velocity values over the common coherent points of the RST-2 and CSK datasets, considering the overlapped period from December 2013 to March 2016. A consistency analysis between the two velocities maps was performed by least-square estimation using the total shared high-coherent pixels. The scatter plot is shown in Figure 6, which also portrays the corresponding mathematical expressions of the regression line between the RST-2 and the CSK ground-deformation velocities. Considering also the values of the ground deformation mean velocity, the agreement of the adjusted independent CSK and RST-2 SAR datasets is consistent.

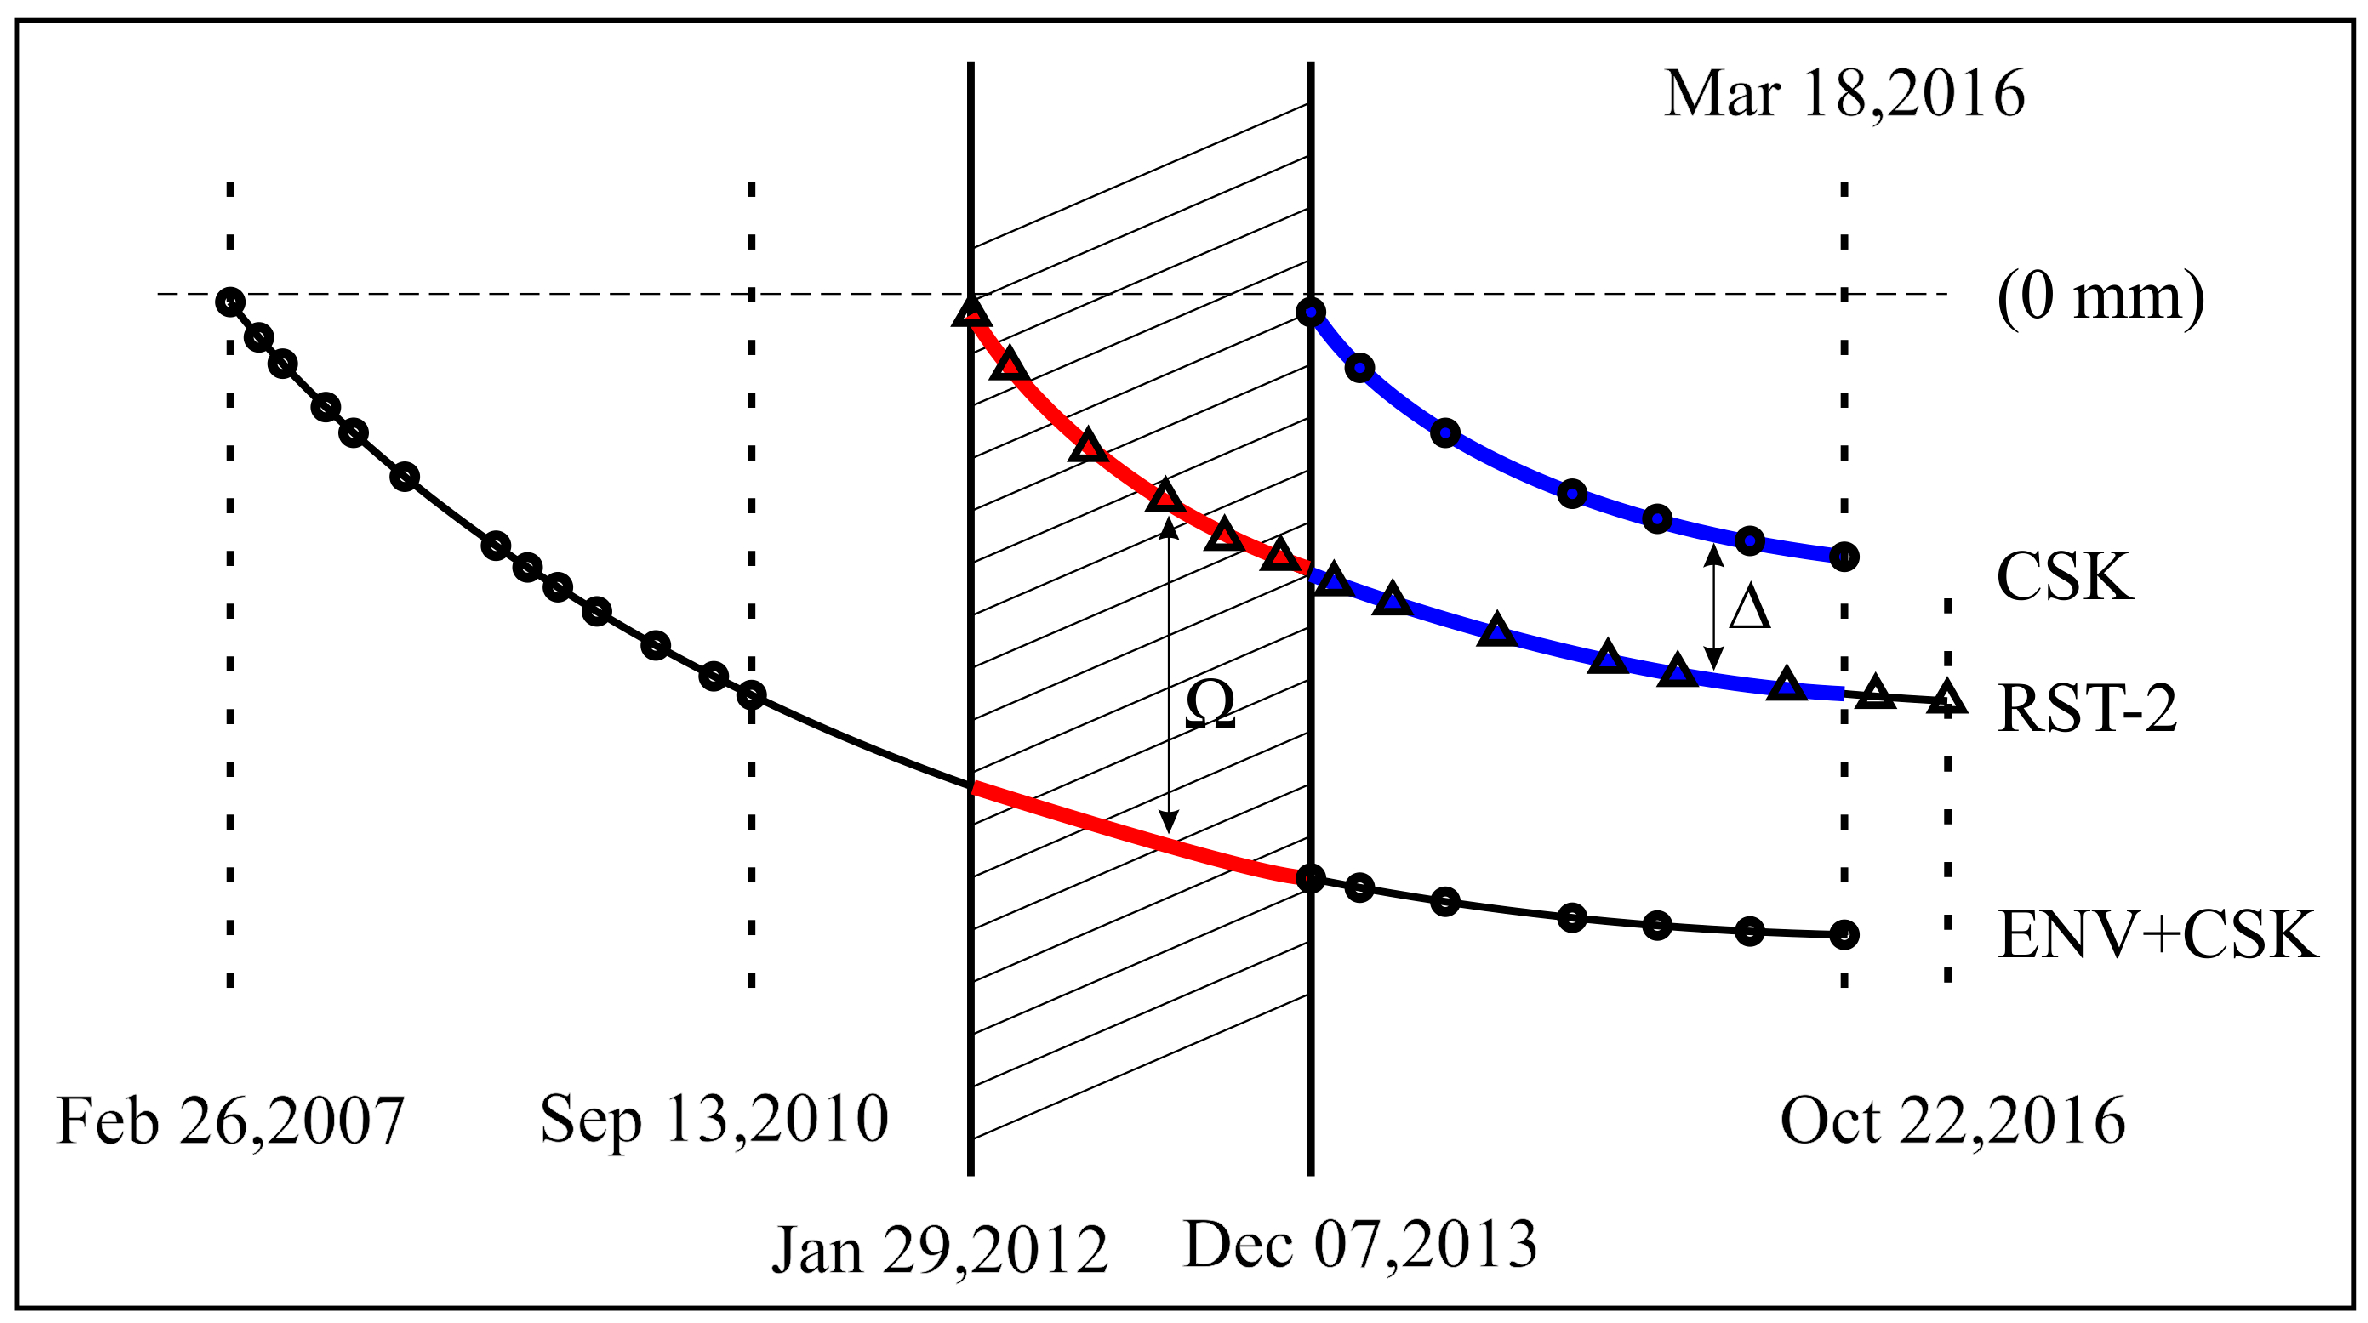
4.2. Analysis of Time-Gapped ENV+CSK and RST-2 Ground Displacement Time-Series

In the literature [23], a method to combine the time-gapped ENV and CSK displacement time-series, benefiting from the knowledge of a proper time-dependent geotechnical model, was initially developed. The method relied on the estimation of the model parameters by using the Levenberg–Marquadt optimization [44,45] to constrain the model to the ENV and CSK data simultaneously. In particular, the adopted geotechnical model was derived from laboratory tests that simulated, at a reduced scale, real scenarios and the kinematic parameters that could be related to dredger-fill soil characteristics (i.e., thickness, water content, void ratio). The time-dependent model has hyperbolic behavior, and its mathematical expression is as follows:
s ( t ) = S 0 ( t δ ) λ k λ + ( t δ ) λ
where t is the vector of the ordered times of the available SAR acquisitions, S0 is the asymptotic value of vertical deformation (theoretically assumed at infinite time), k and λ are two parameters that control the shape of a given curve among the family of all possible curves, and δ is a time-delay, which takes into account the uncertainty of the knowledge of the exact time when reclamation processes ended. Figure 7 reproduces the ground mean deformation velocity map of the Lingang New City from February 2007 to March 2016, as obtained by using the model (5) and the method to link time-gapped data presented in [23]. Note also that the model (5) represents a generalization of the model adopted in [46]. The RST-2 SAR data, however, partially time-overlap the CSK data sets (see the red region highlighted in Figure 4). This circumstance has led us to the idea of testing the validity of the retrieved best-fit models using this new independent set of RST-2 data. To this aim, we estimated and compensated, for every coherent point common to the ENV+CSK and RST-2 datasets, the ground deformation bias, namely Ω , existing between the best-fit model d m o d e l [23] and the new RST-2 ground deformation time-series in the period from January 2012 and December 2013. It is evident (see also Figure 4) that:
d ^ R S T 2 ( P , t ) = d R S T 2 ( P , t ) Ω ( P )
where d ^ R S T 2 is the corrected RST-2 deformation time-series adjusted to the model-driven ENV+CSK ground-deformation time-series already obtained and discussed in [23]. The bias Ω was estimated, for every point common to both SAR datasets, using a simple least-squares (LS) adjustment of the following problem:
d R S T 2 ( P , t ) Ω ( P ) = d E N V + C S K ( P , t )
Then, we calculated the RMSE between the adjusted RST-2 ground deformation time-series and the ENV+CSK displacement time-series at each common coherent point, which is shown in Figure 8. The results demonstrate, except for some noisy areas in the coastal regions afflicted by severe temporal decorrelation artifacts, that the ENV+CSK and RST-2 ground deformation products are in good agreement, thus making it evident that the model used in [23] was suitably correct.

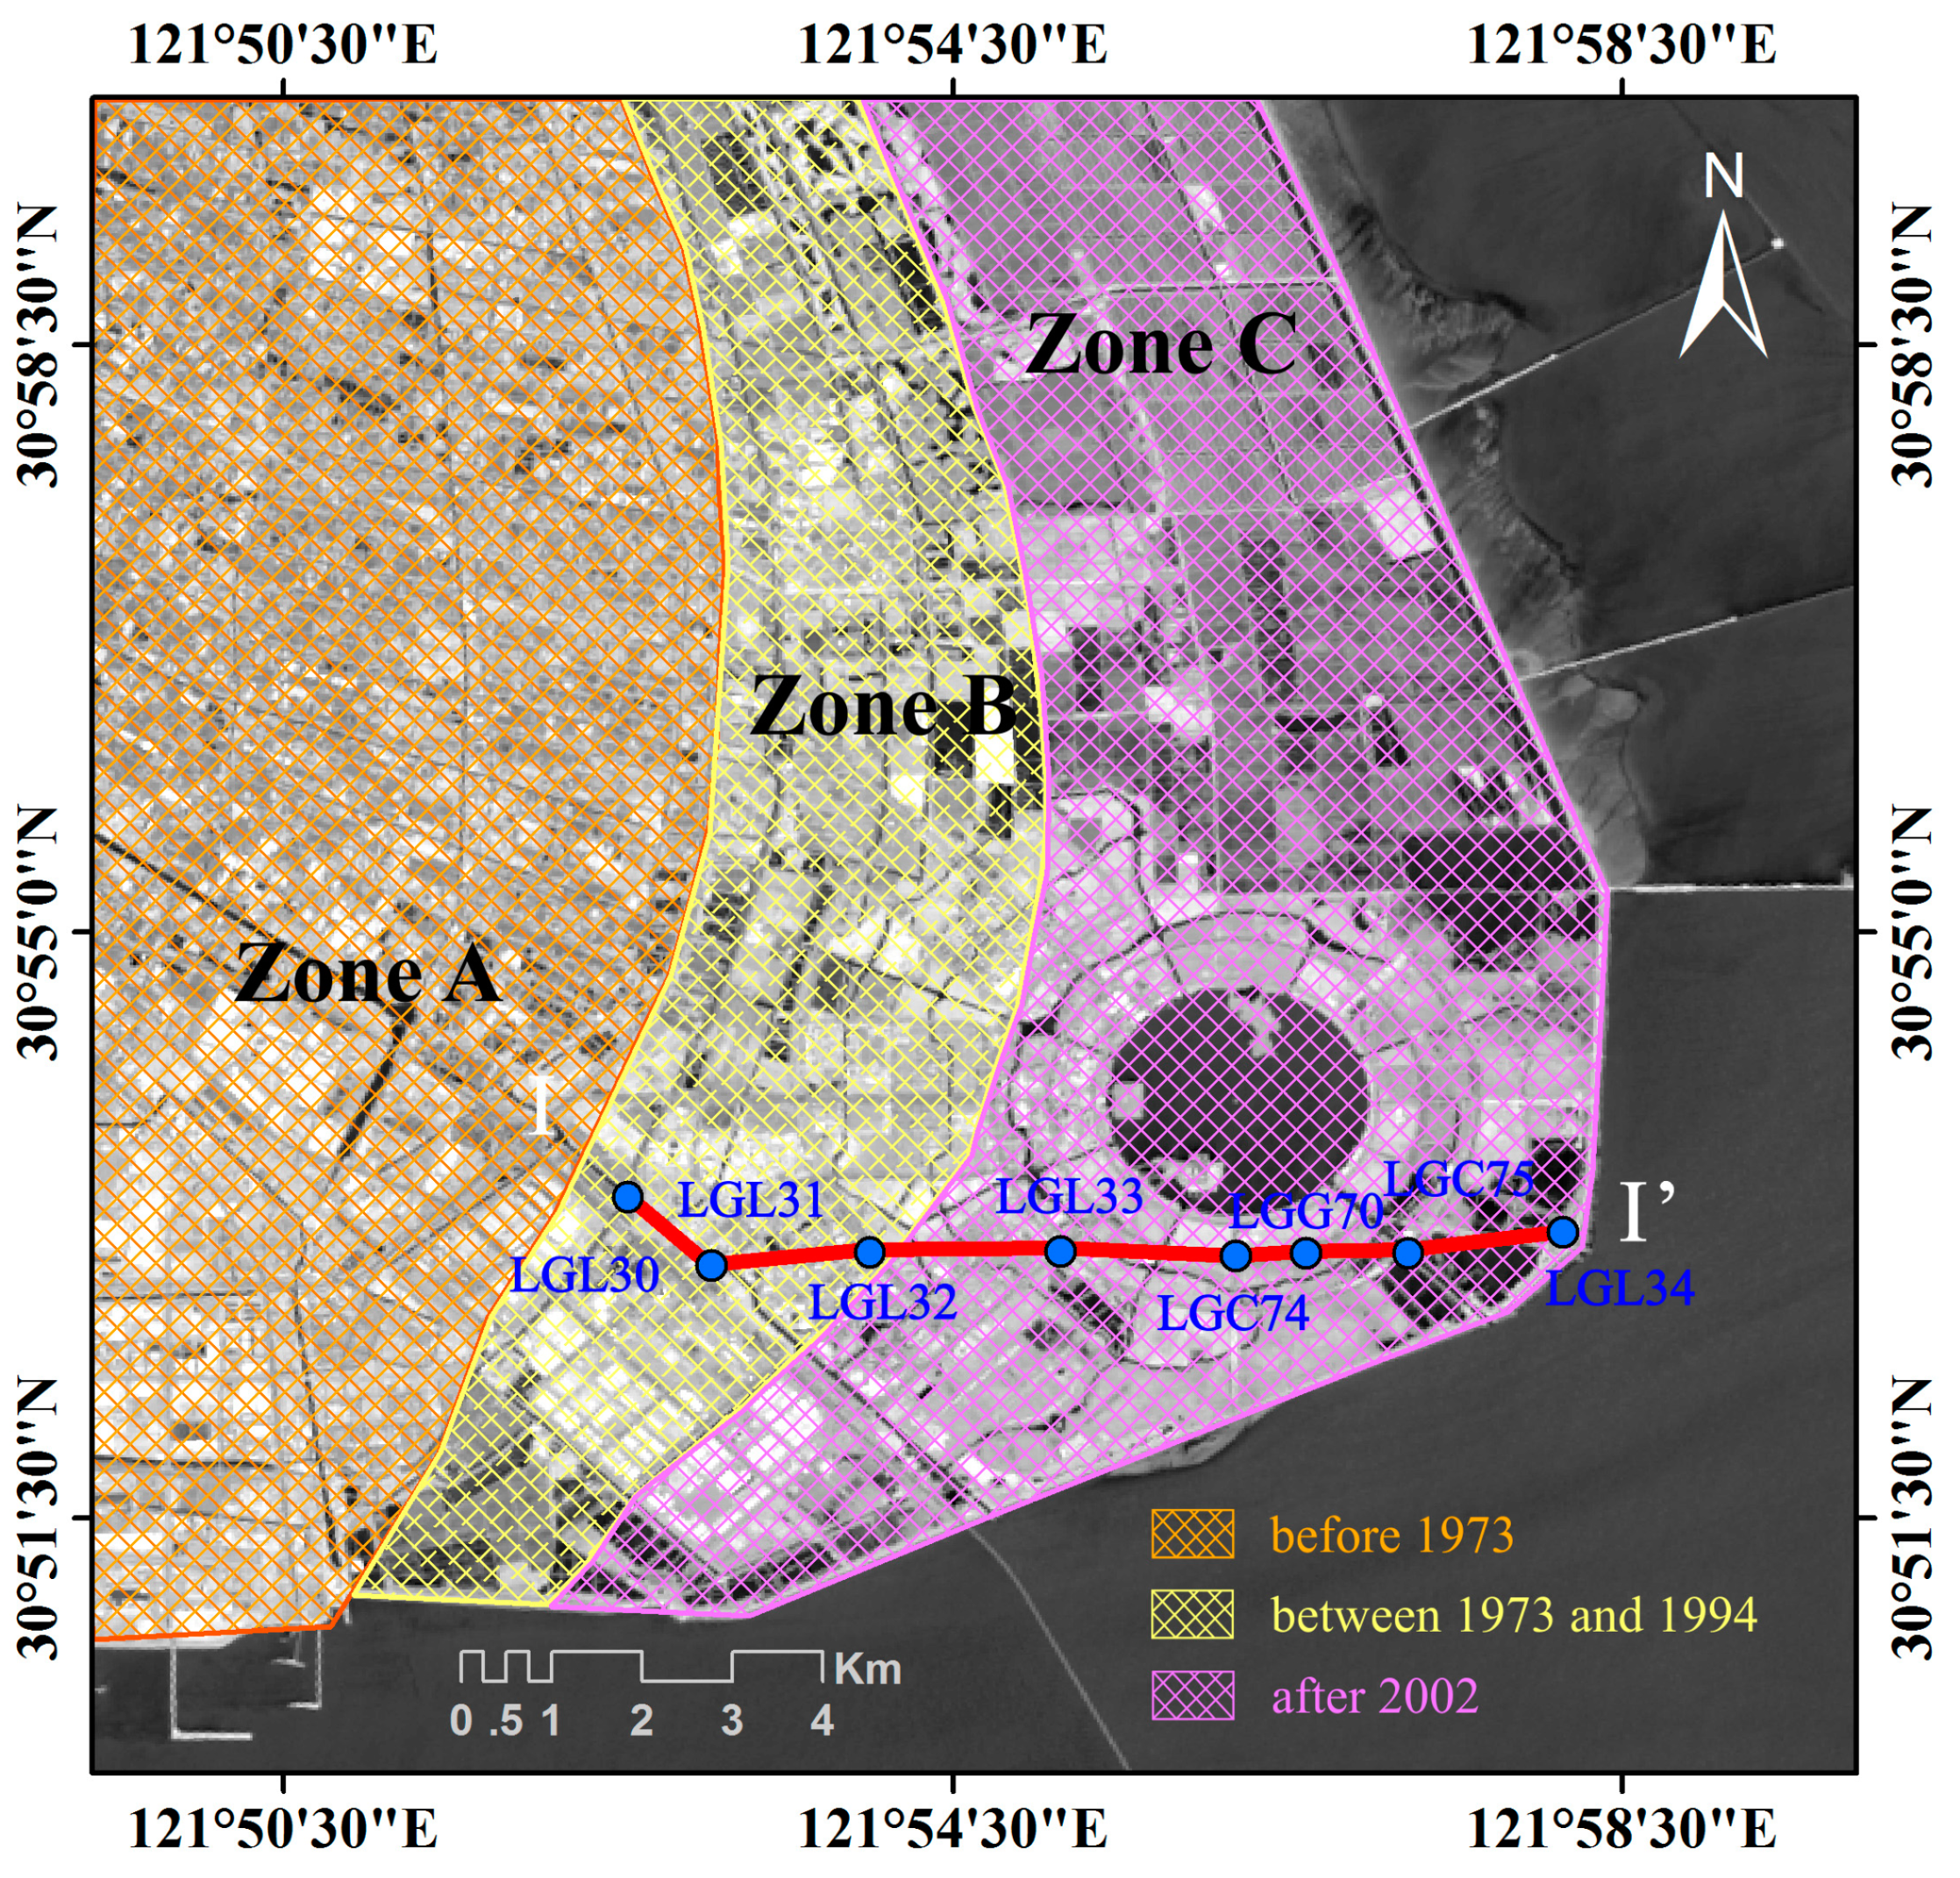
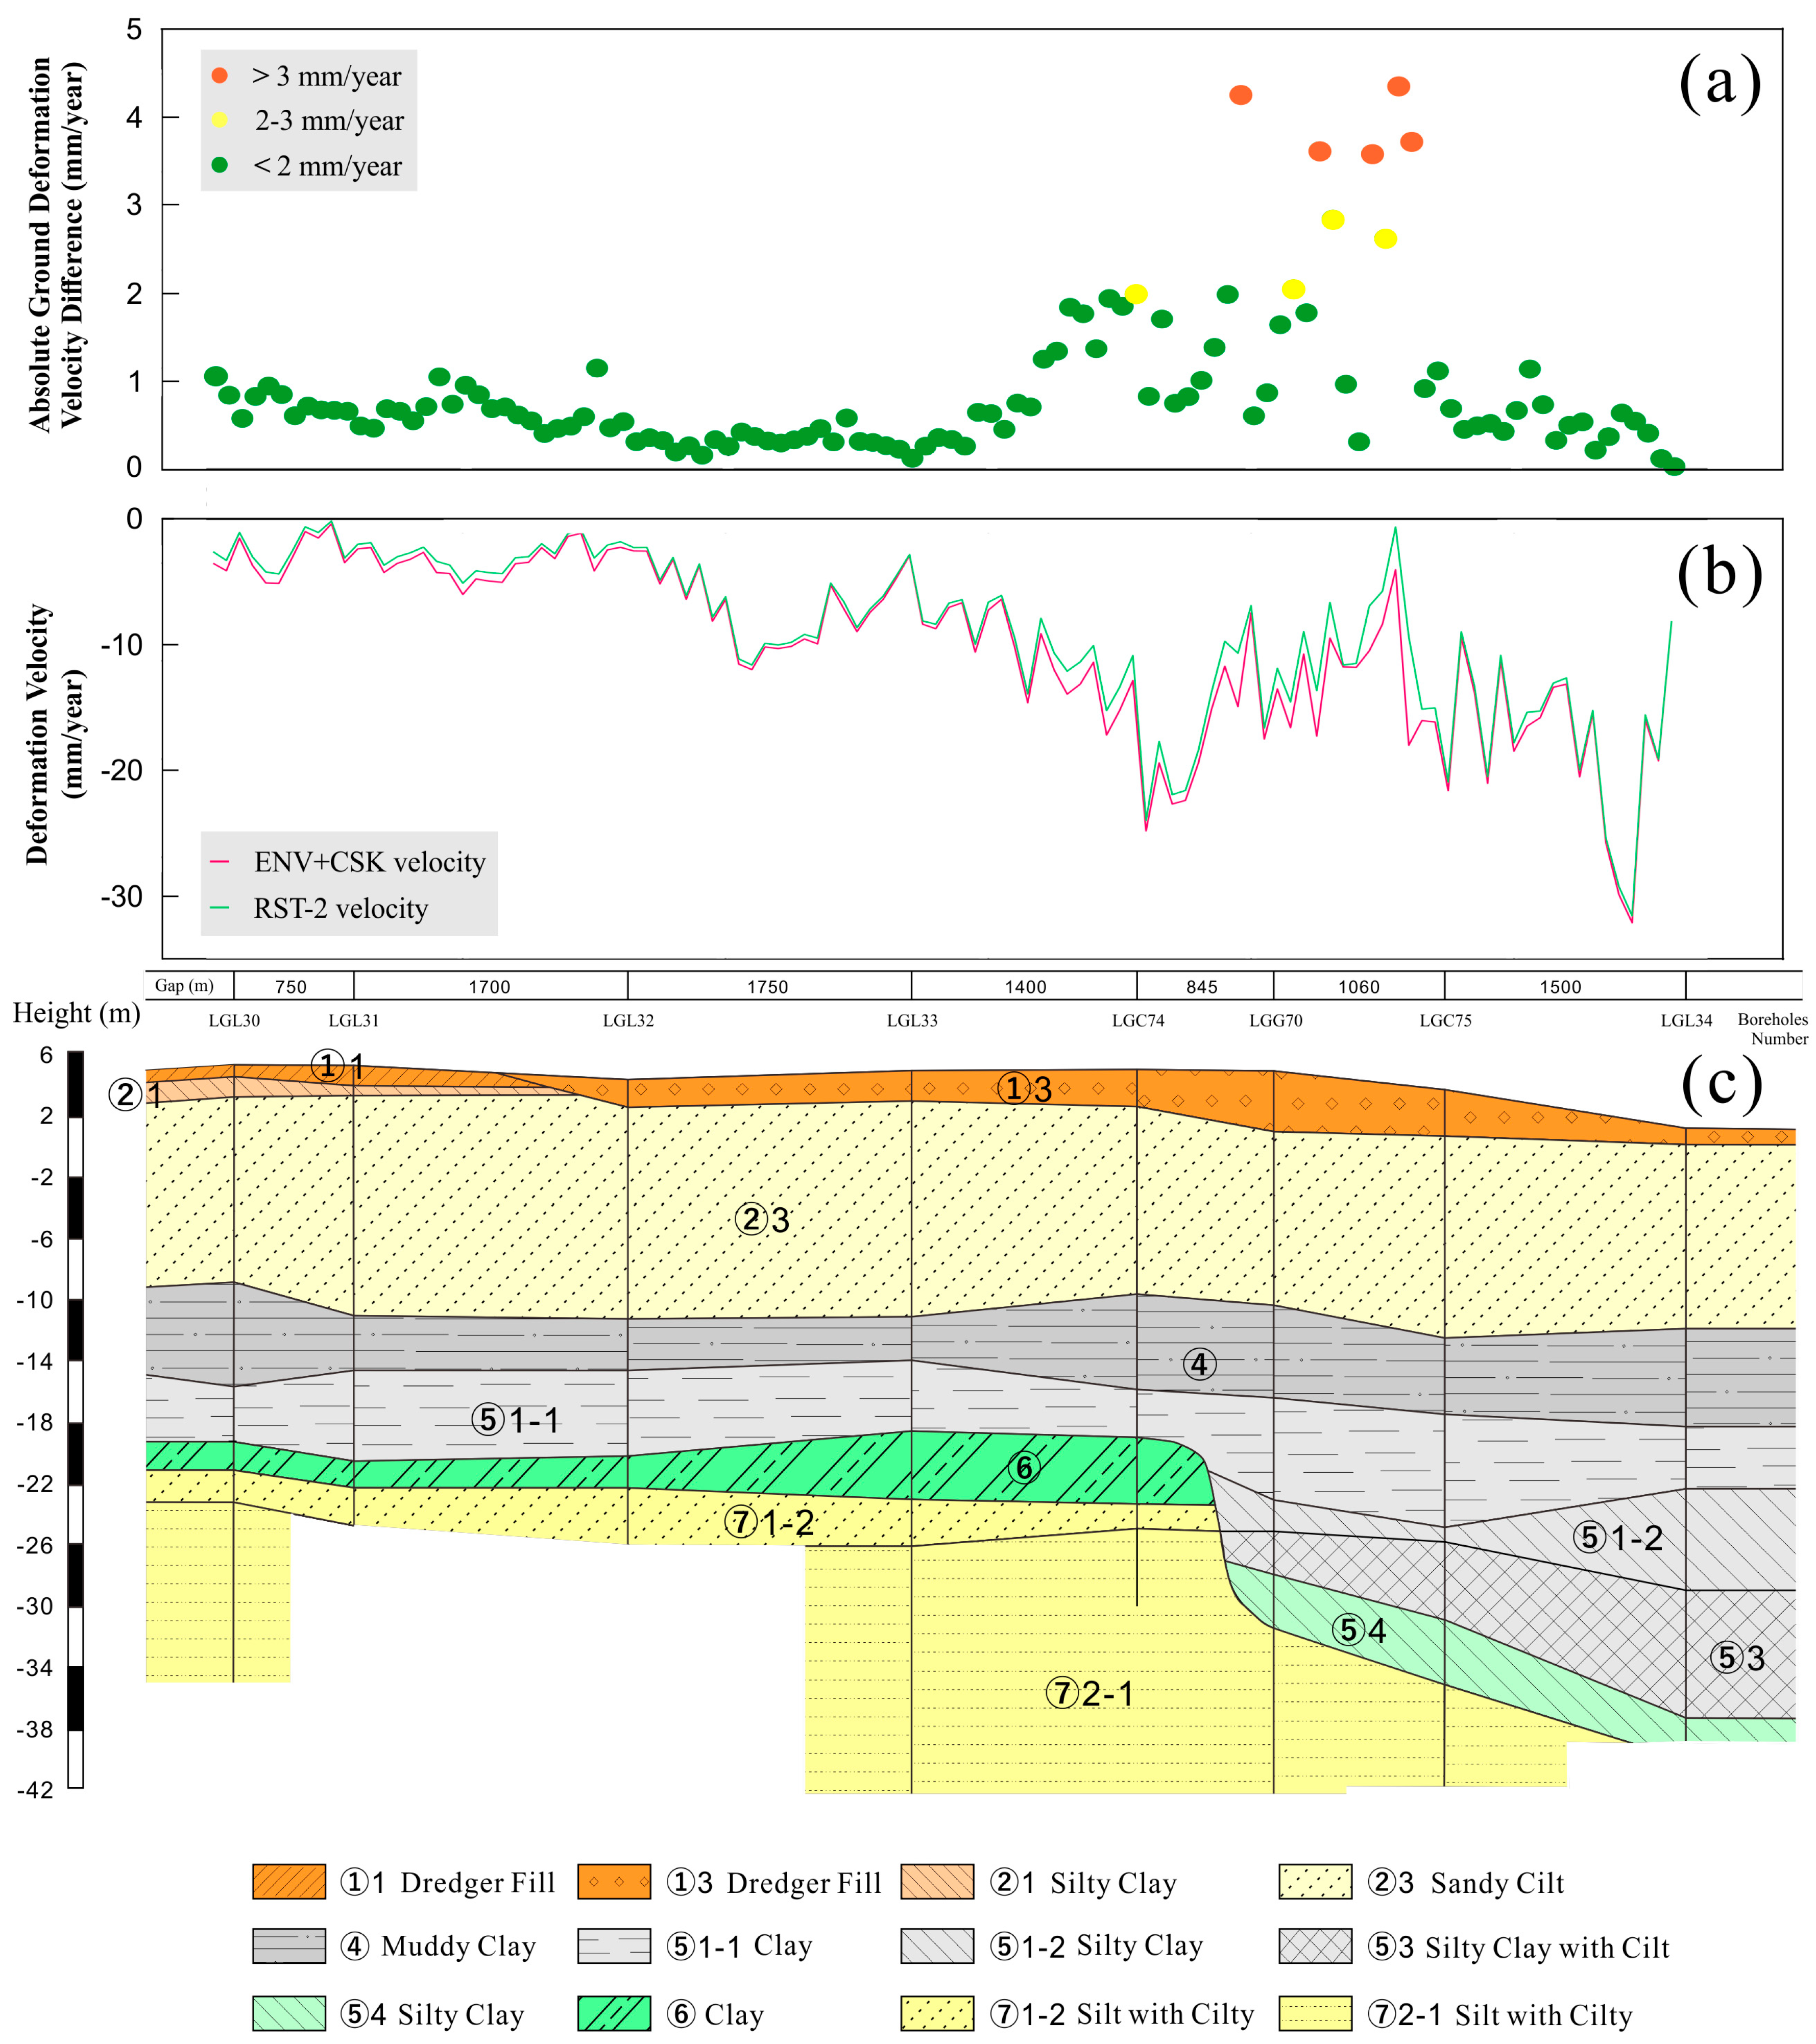
4.3. Engineering Geology Analyses

In this section, we analyze the ground deformation results derived by the SBAS and the geotechnical model, taking into account the engineering geology condition of Lingang New City. From 1994 to 2006, a series of reclamation projects were carried out from the west side to the east side of Lingang New City. Abundant dredger fill, which is a sort of unconsolidated soil with high compressibility, large void ratio, and high-water content, has been primarily filled in the intertidal areas along the Lingang New City coast.
Based on the geological environment and the magnitude of deformation velocity, Lingang New City can be roughly divided into three zones (A, B, and C), as shown in Figure 9. Zone A is located in the western part of the city, and it was reclaimed before 1973. The ground settlement of Zone A has been unremarkable. Zone B is located in the central part of Lingang New City, and it was reclaimed between 1973 and 1994. This area has experienced a phase of rapid consolidation. Zone C, which is the eastern part of Lingang New City, has been newly reclaimed since 2002. Unconsolidated dredger fill is primarily distributed in zone C. Our results show that Zone A is stable after about a half century consolidation time, Zone B has small ground subsidence values after two decades of the consolidation phase, and the newly reclaimed Zone C is still experiencing severe ground subsidence.
We also calculated the mean RMSE values between the modeled ENV+CSK and the adjusted RST-2 deformation time-series over the three zones. The RMSE values are listed in Table 1.
We also compared the ground measurements obtained by the geotechnical model and RST-2 SBAS-InSAR and the engineering geology condition on the profile from I to I’, which was derived from eight boreholes. The boreholes have a depth range from 30 to 50 m (as shown in Figure 9) and were collected to show the geological features of soil layers. The sub-soil in Lingang New City can be divided into six engineering geological layers, based on the geological ages and sub-soil properties.
We now discuss the map shown in Figure 10c. The dredger fill, layer ①3, is unevenly distributed in Lingang New City. It is mainly distributed in Zone B with a thickness not exceeding 3 m and evenly distributed in Zone C with a thickness ranging from 3 to 6 m. The silty clay, layer ②1, is relatively stable compared with ①3. It is mainly distributed in the west and north of Lingang New City. The sandy silt of layer ②3 has similar physical and mechanical properties as the dredger fill layer ①3. It is prone to compression, and is distributed in the whole area of Lingang New City. In addition, the sandy silt of layer ②3 is apt to form quicksand. The muddy clay layer ④ and the clay ⑤1 have high compressibility and are representative soft soil layers in Shanghai. Layers ④ and ⑤1 are sensitive to large-scale construction. Irregular construction may lead to an overwhelming ground deformation. However, the hard geological layers ⑥ and ⑦ are the stable soil layers. The consolidation of layers ①3, ②, ④, and ⑤ could mainly result in ground deformation [22].
We plotted in Figure 10 the absolute values of the mean ground deformation velocity obtained by the geotechnical model constrained by the time-gapped ENV and CSK SBAS-InSAR deformation time-series and the RST-2 SBAS-InSAR deformation measurements, as well as engineering geology of the profile from I to I’. Three boreholes, labeled as LGL30, LGL31, and LGL32, are located in Zone B. The other five boreholes, labeled as LGL33, LGC74, LGG70, LGC75, and LGL34, are located in the newly reclaimed Zone C. As shown in Figure 10, the velocity differences of the portion from LGL30 to LGL33 do not exceed 1 mm/year. Correspondingly, the thickness of the dredger fill layer in the portion from LGL30 to LGL33 does not exceed 2 m. The mean ground deformation velocity difference of the portion from LGL33 to LGC74 is smaller than 2 mm/year. This portion is the central part of the newly reclaimed area Zone C. As shown in Figure 10, along the profile the deformation velocity derived by both the geotechnical model and RST-2 SBAS-InSAR show an increasing trend. The portion from LGC74 to LGG75 has the thickest dredger fill. Correspondingly, it has relatively high deformation velocities and the highest ground deformation velocity differences. The deformation difference is higher than 3 mm/year and smaller than 5 mm/year. Since the portion from LGC75 to LGL34 is still under reclamation, although this portion has relatively thin dredger fills, it has the most significant ground subsidence values of the whole profile. The ground deformation difference values of the portion from LGC75 to LGL34 are smaller than 2 mm/year.

5. Ground Deformation Results of Shenzhen and Analyses

For the monitoring of reclaimed land regions, some time-dependent models have been developed to follow the ongoing evolution and foresee the future evolution of the ground deformations. In addition to the geotechnical model verified in this study, we also explored the suitability of other two time-dependent models with i) logarithmic and ii) exponential decay [26,48] to be used for ground deformations monitoring and forecasting. However, it is first worth exploring whether the geotechnical model used to characterize the area of Shanghai is still valid for other land-reclamation areas. To achieve our goal, we took Shenzhen, located east of the Pearl River Delta (PRD) region in China, into consideration. Since 1979, the coastal area of Shenzhen, which extends more than 100 km2 (as shown in Figure 2a), has been modified in its geomorphology [3,36] due to land reclamation activities. Thus, they are anthropogenic at most [49,50]. In this section, we test the validity of such different reclamation models in the Shenzhen area. To this aim, three SAR datasets (the ascending ENV, the descending ENV, and the S1A) were used.

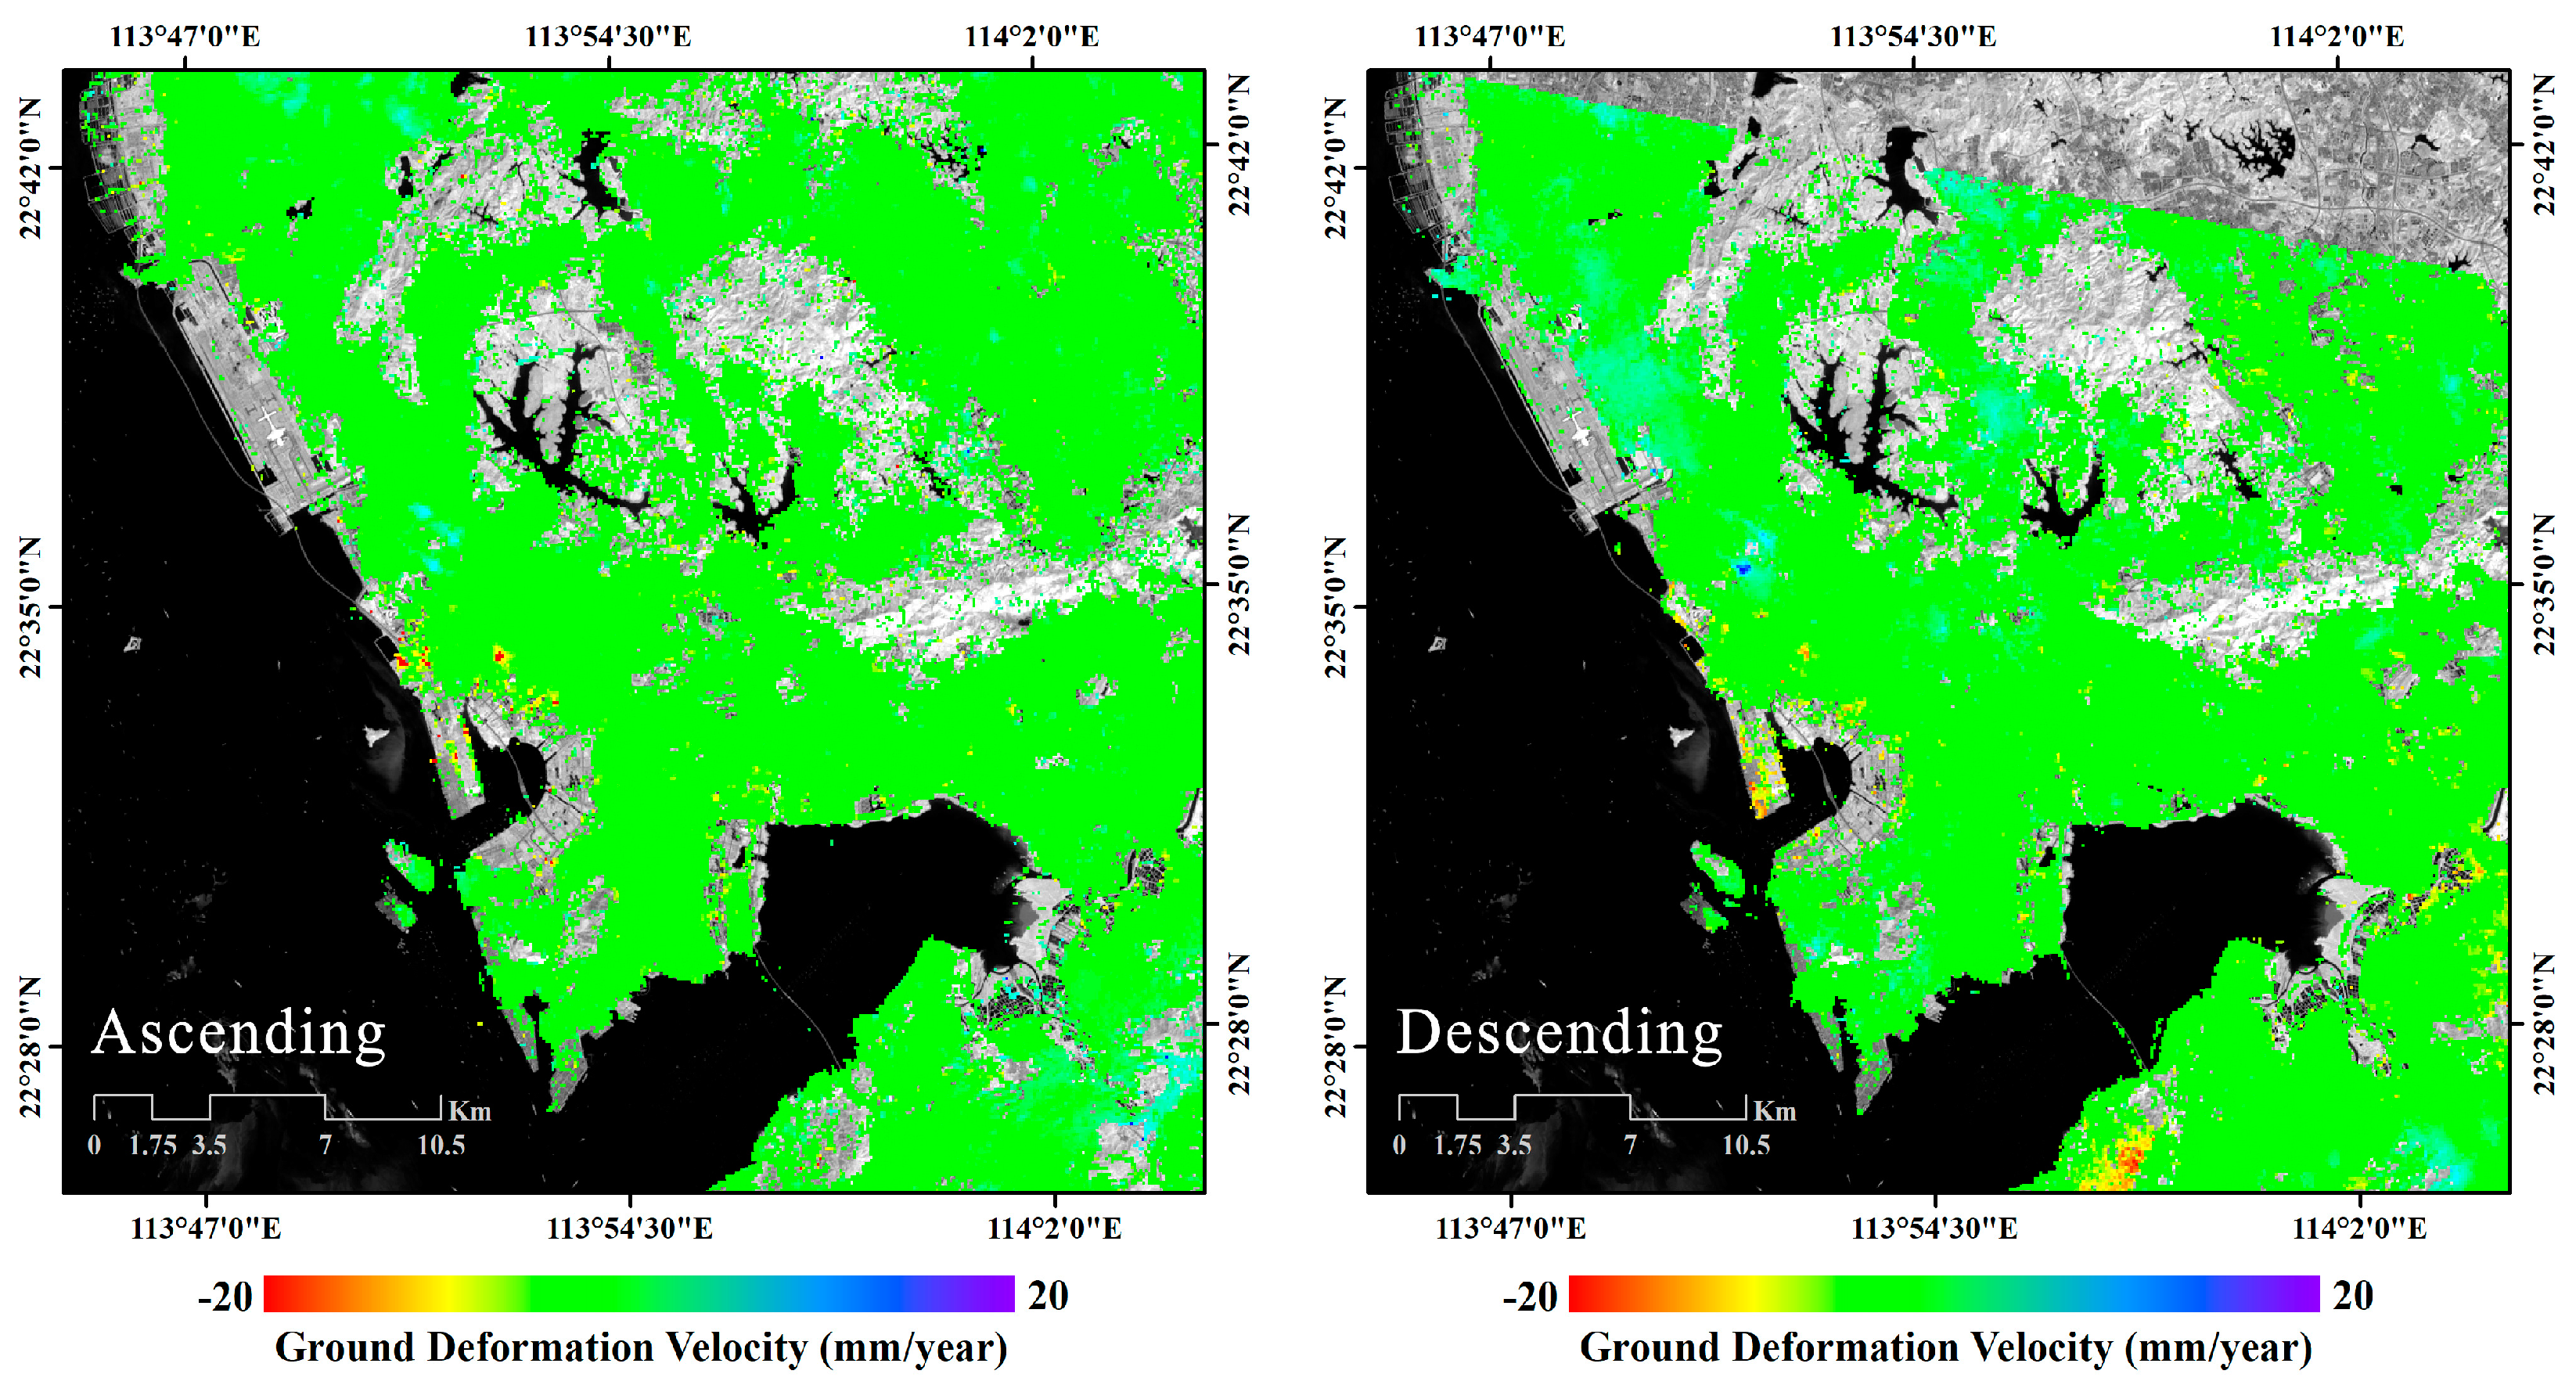
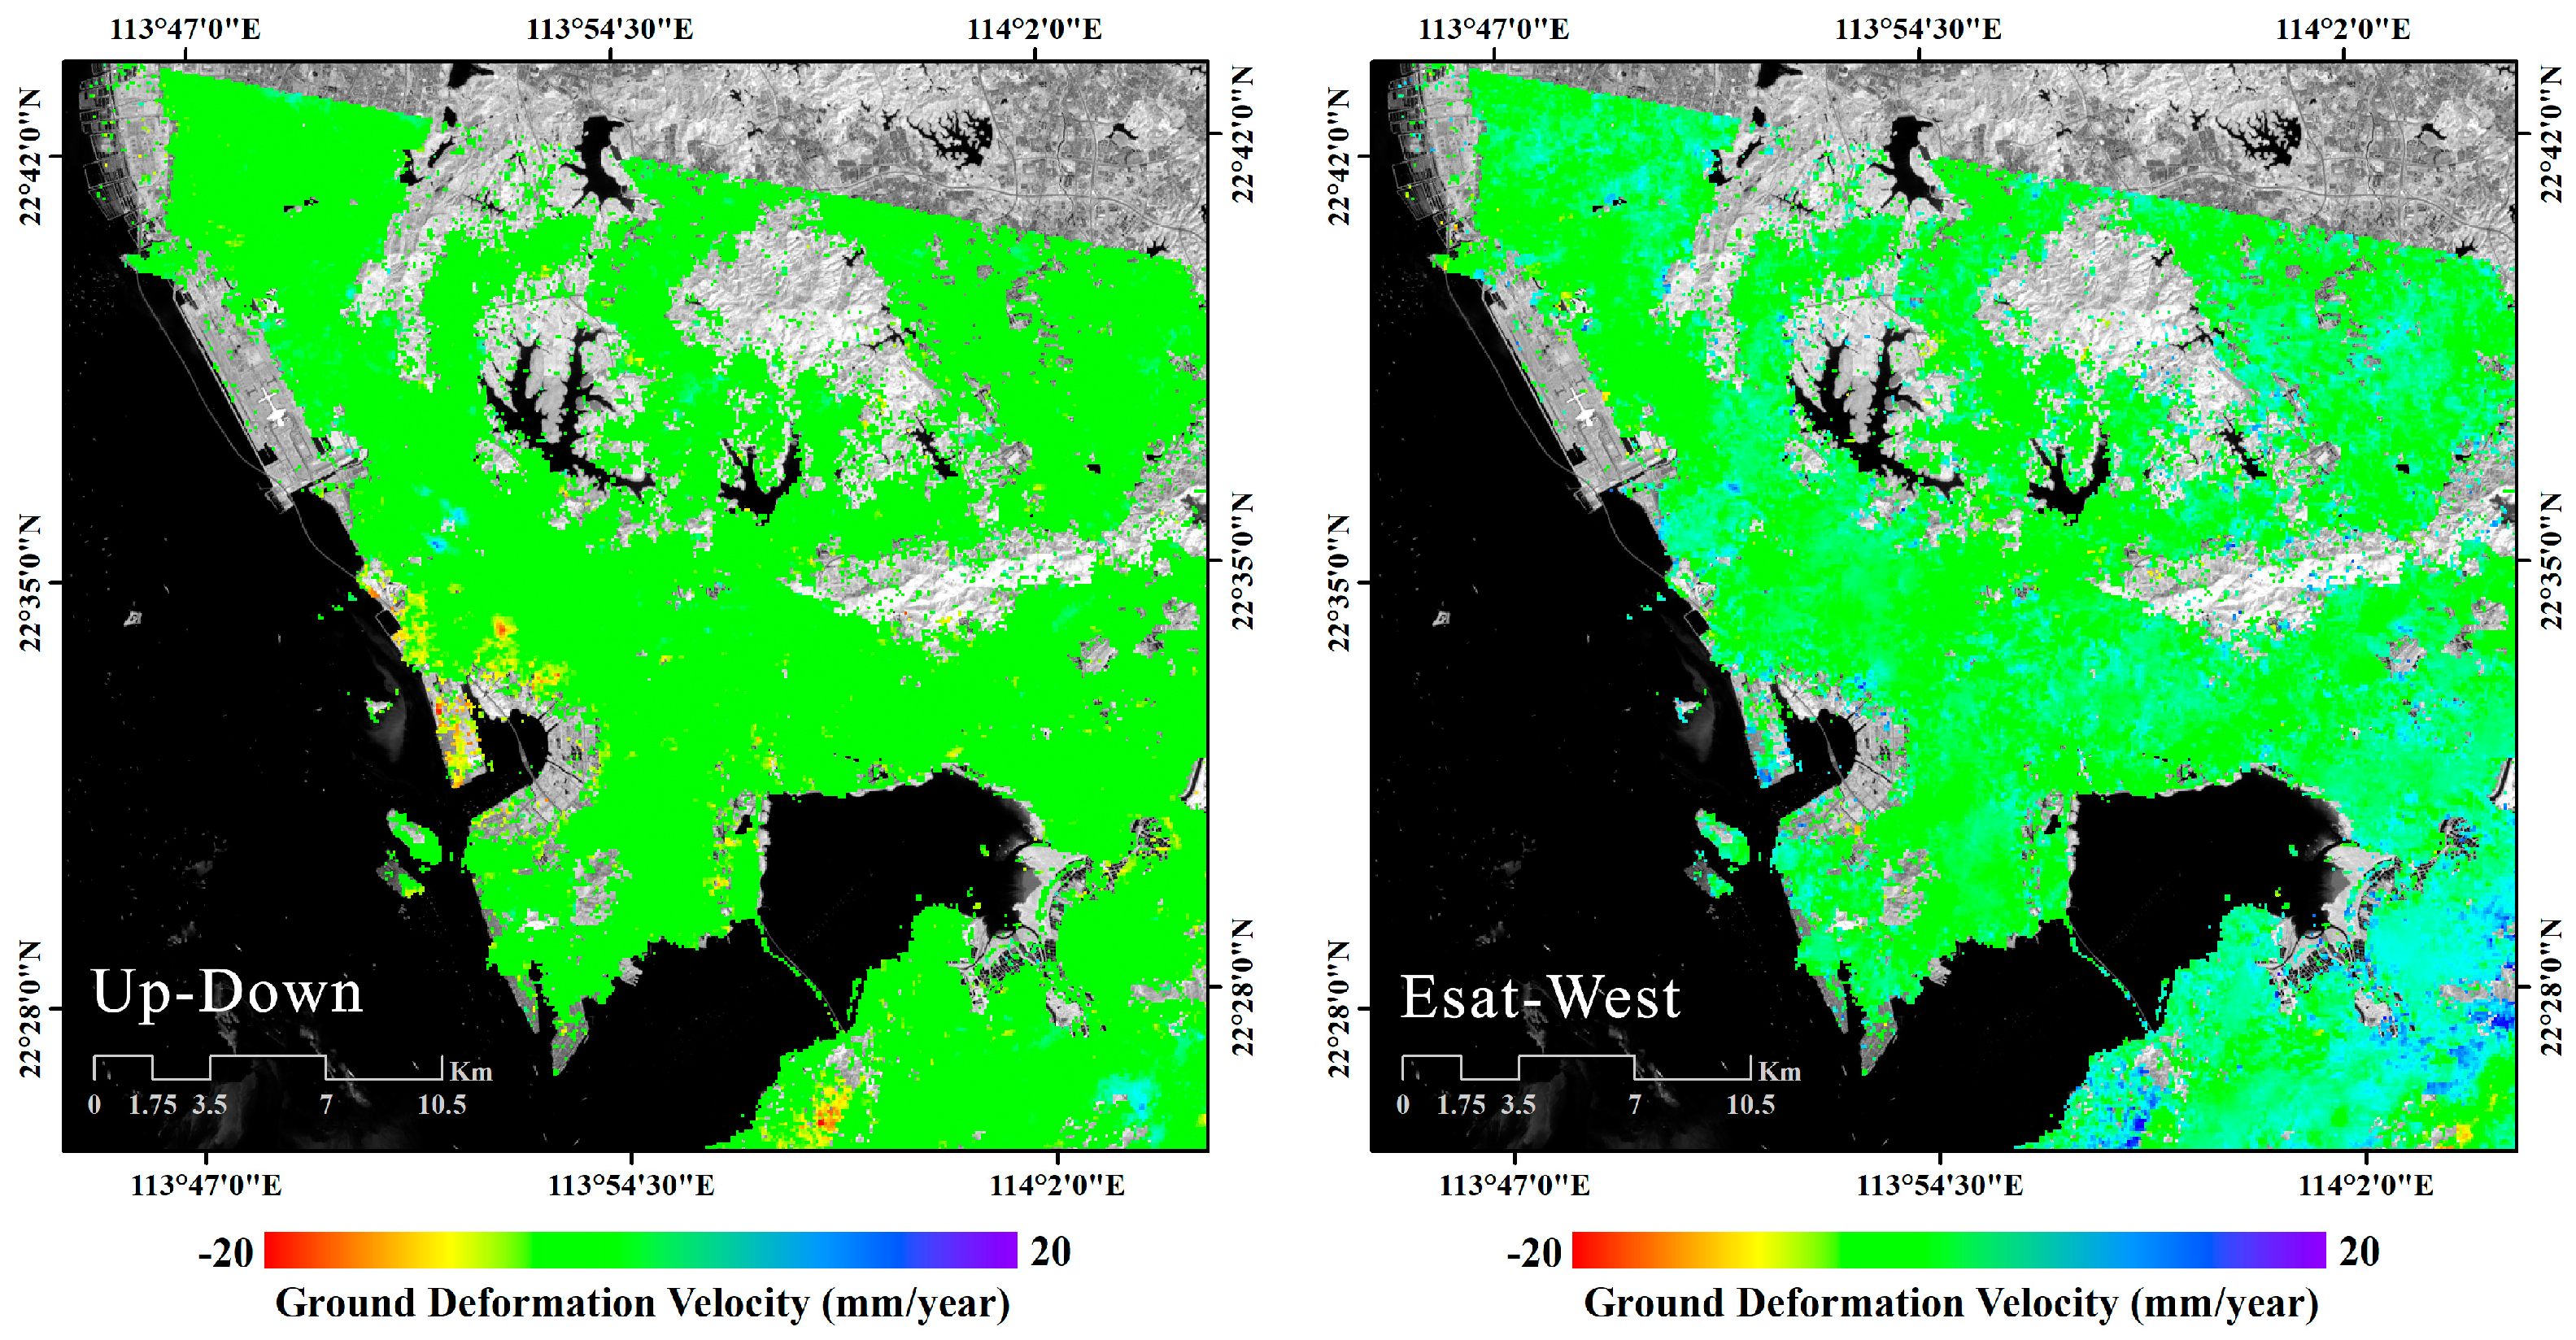
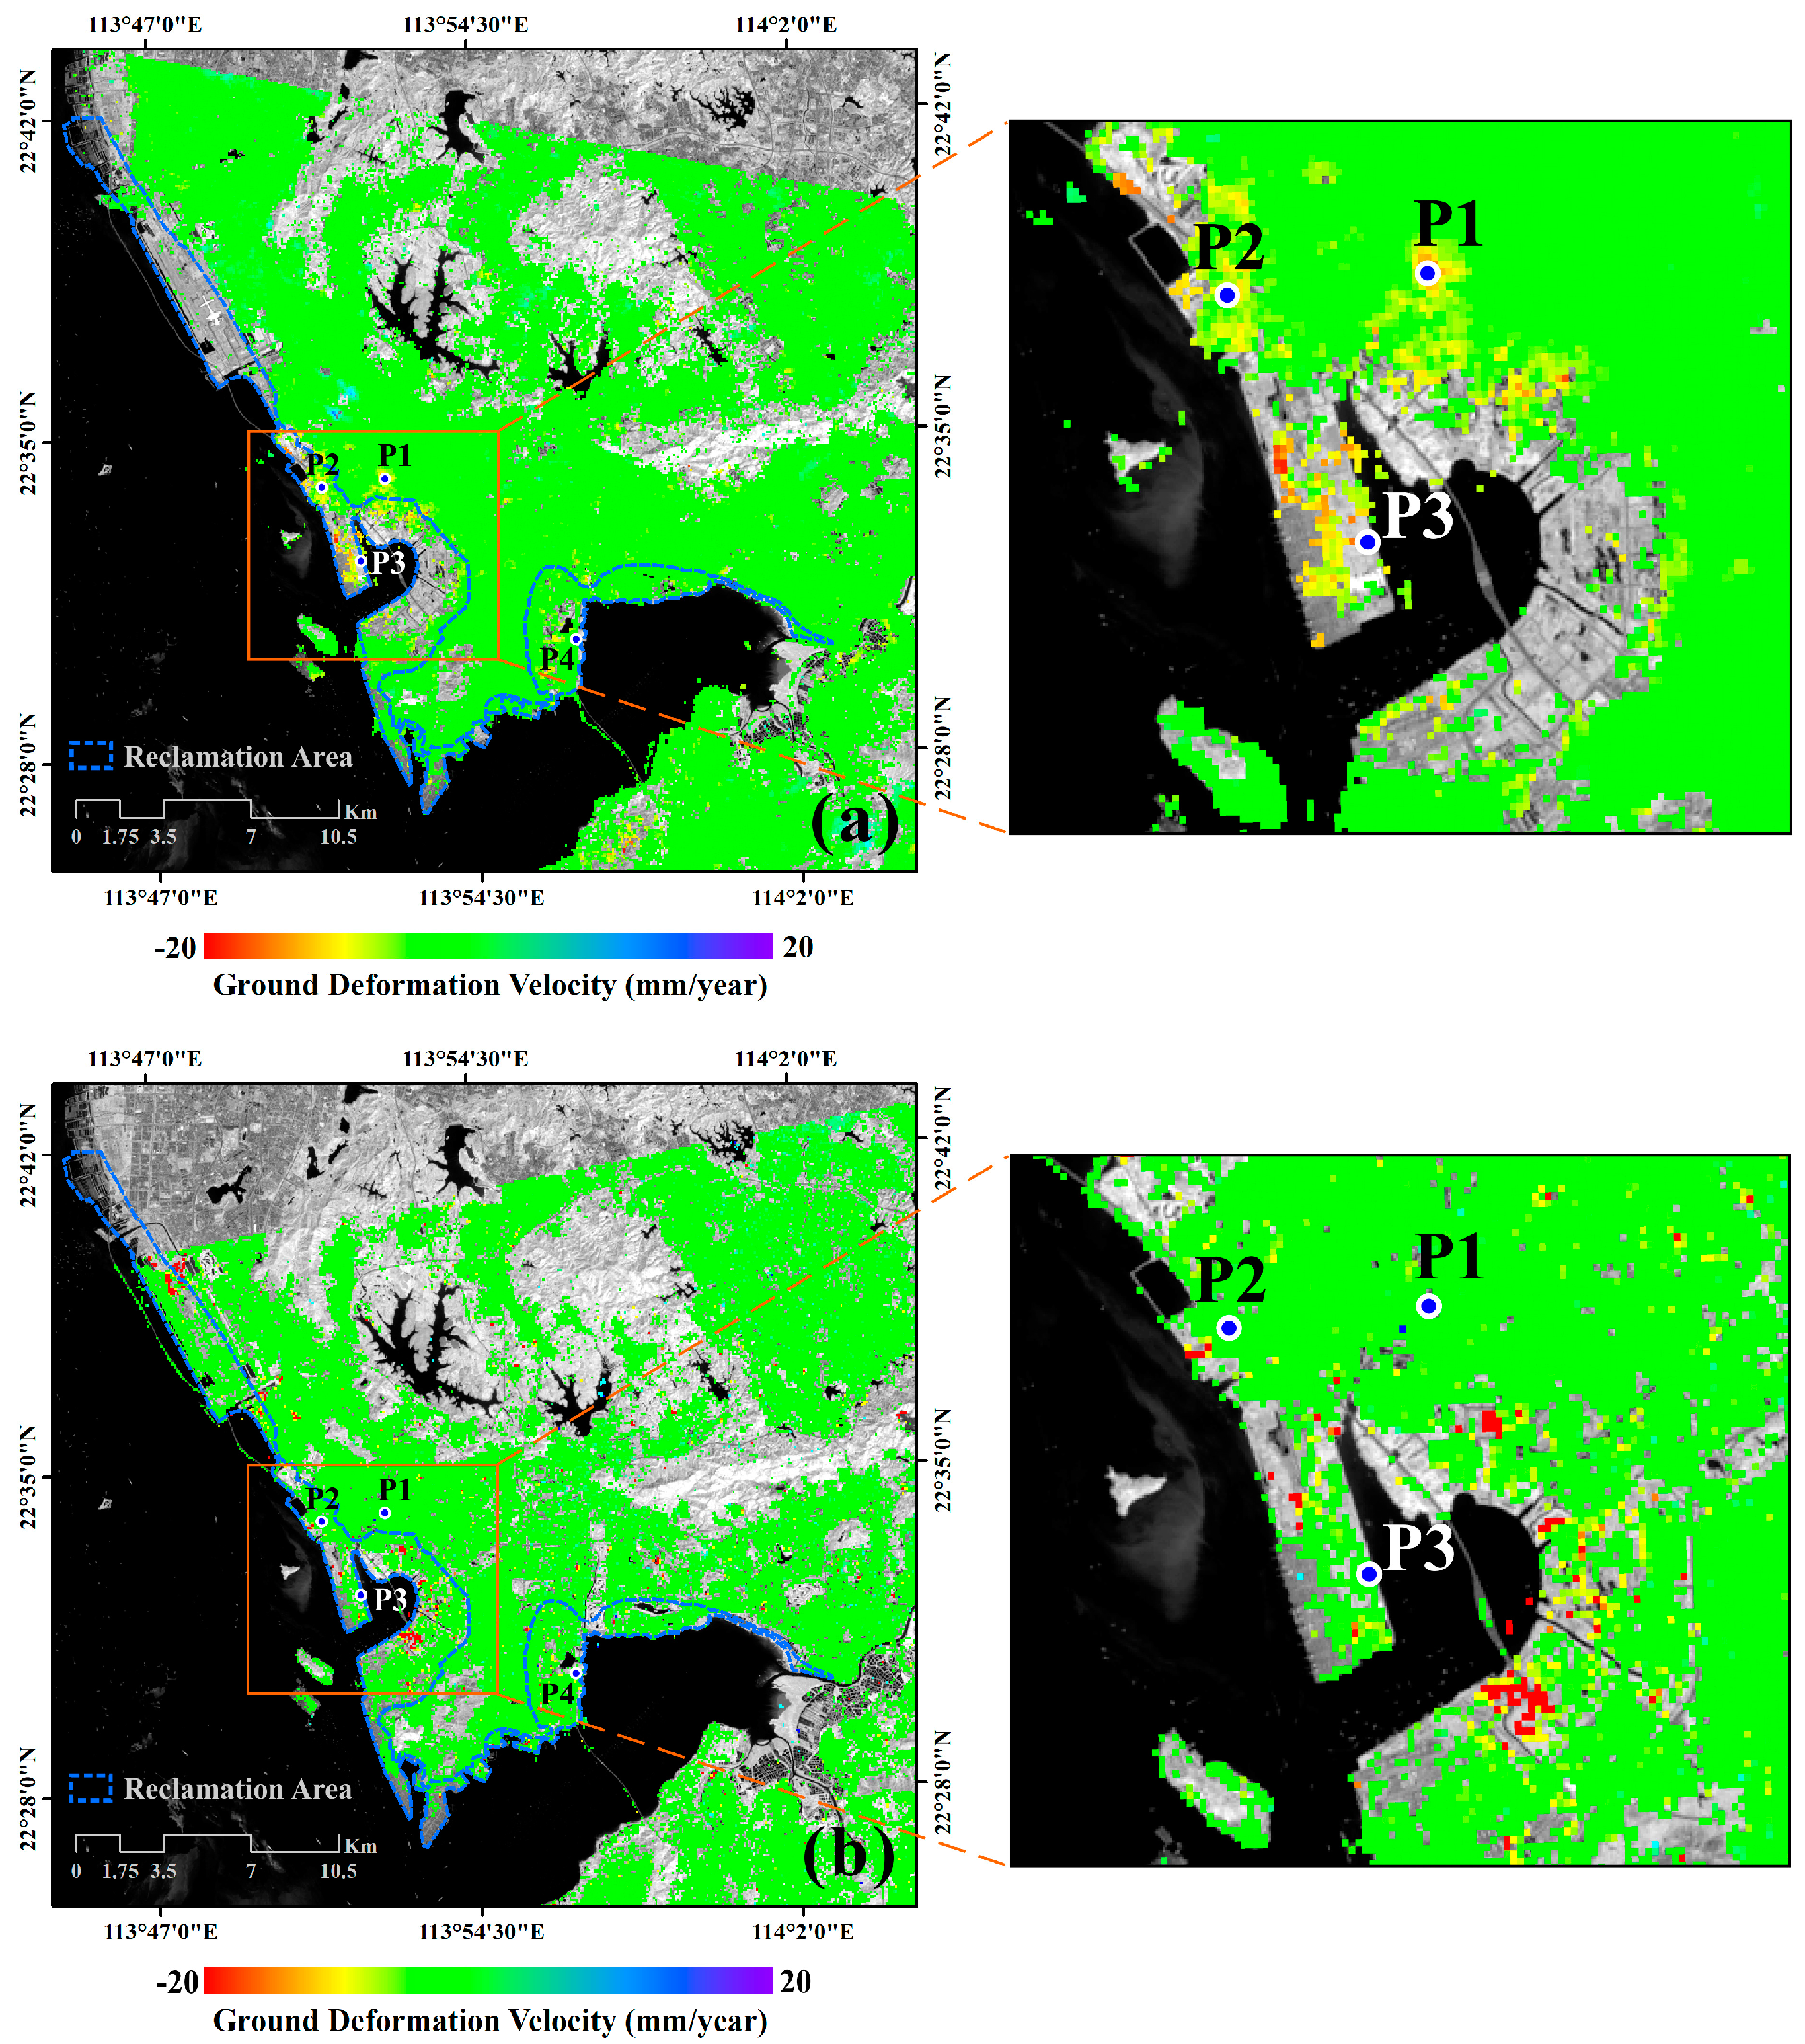
5.1. The Ground Deformation Results of Shenzhen City

The ascending ENV (A-ENV), descending ENV (D-ENV), and S1-A datasets were processed separately using the SBAS algorithm [11] to obtain the related line-of-sight (LOS)-projected deformation time-series. Accordingly, we have computed the mean ground deformation velocity maps for the A-ENV and D-ENV SAR datasets, which are shown in Figure 11. Subsequently, we have applied the multi-satellite MinA method [34] to recover the East–West (E–W) and the up–down (U–D) ground-deformation time-series. This procedure is fundamental for the subsequent analyses because it allows us to discriminate LOS-projected ground deformation measurements from the ground-subsidence signals (i.e., the U–D components of the terrain displacement) that are strictly related to the process of consolidation of the reclaimed lands. Figure 12 portrays the maps of 2-dimensional ground deformation velocity components. The areas with sensible vertical deformation (subsidence) are almost located in the reclamation regions. To correlate the identified deformation signals to the process of consolidation of the reclaimed terrains, we isolated and focused on the areas characterized by significant up–down ground deformations, from June 2007 to April 2010, as shown in Figure 13a. We masked those pixels whose absolute value of the East–West ground deformation was higher than 10 mm/year. Unfortunately, no descending S1A data are available for the Shenzhen area from June 2019 to June 2020. Thus, we can not retrieve the two-dimensional deformation of the terrain from June 2019 to June 2020 by the MinA method. To circumvent this problem, we have assumed that areas with no significant lateral movements in 2009 preserve this characteristic over time, and we have retrieved the vertical deformation of the terrain by simply re-projecting the LOS ground deformation of S1A using Equation (2) and the relevant side-looking angle ( ϑ = 39 ° ) of the Sentinel platform S1A sensor. As a result, Figure 13b portrays the map of S1A up–down ground deformation velocity components from June 2019 to June 2020.
We selected four points labelled as P1, P2, P3, and P4 to describe the ENV and S1A vertical deformation time-series, as shown in Figure 14. We can see that the deformation is relatively broad from June 2007 to April 2010. In contrast, the ground deformation slows down from June 2019 to June 2020.

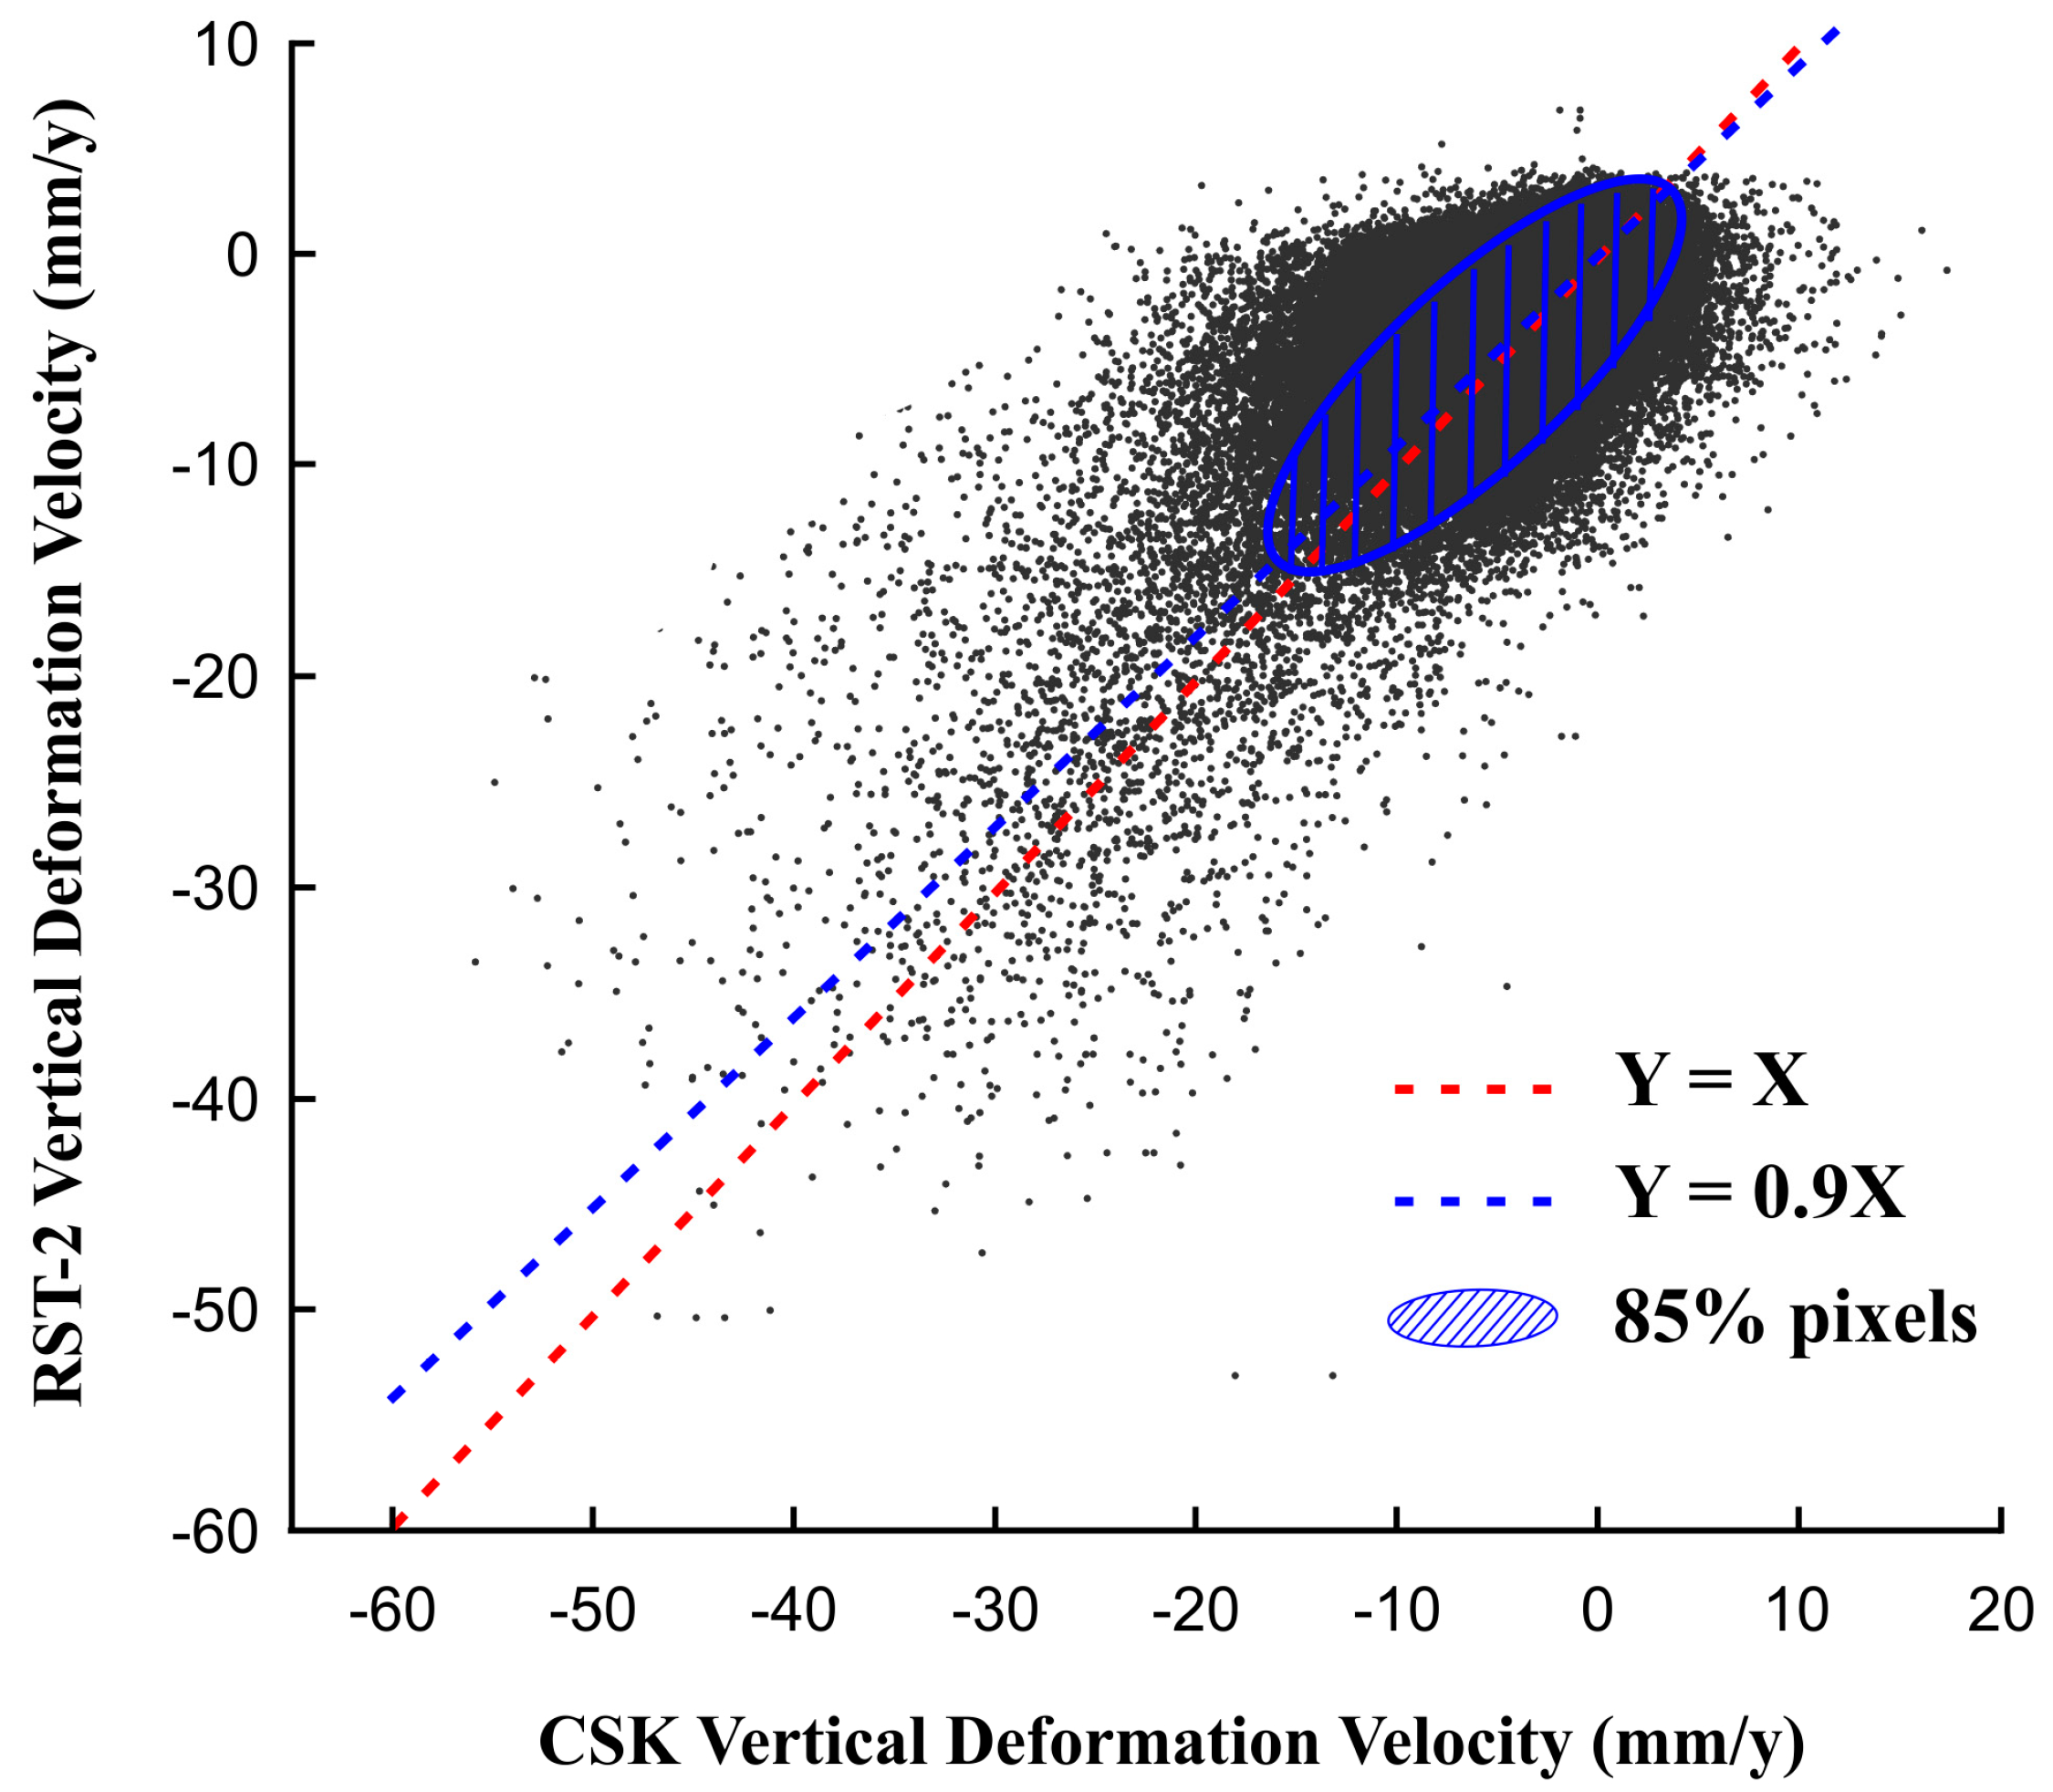
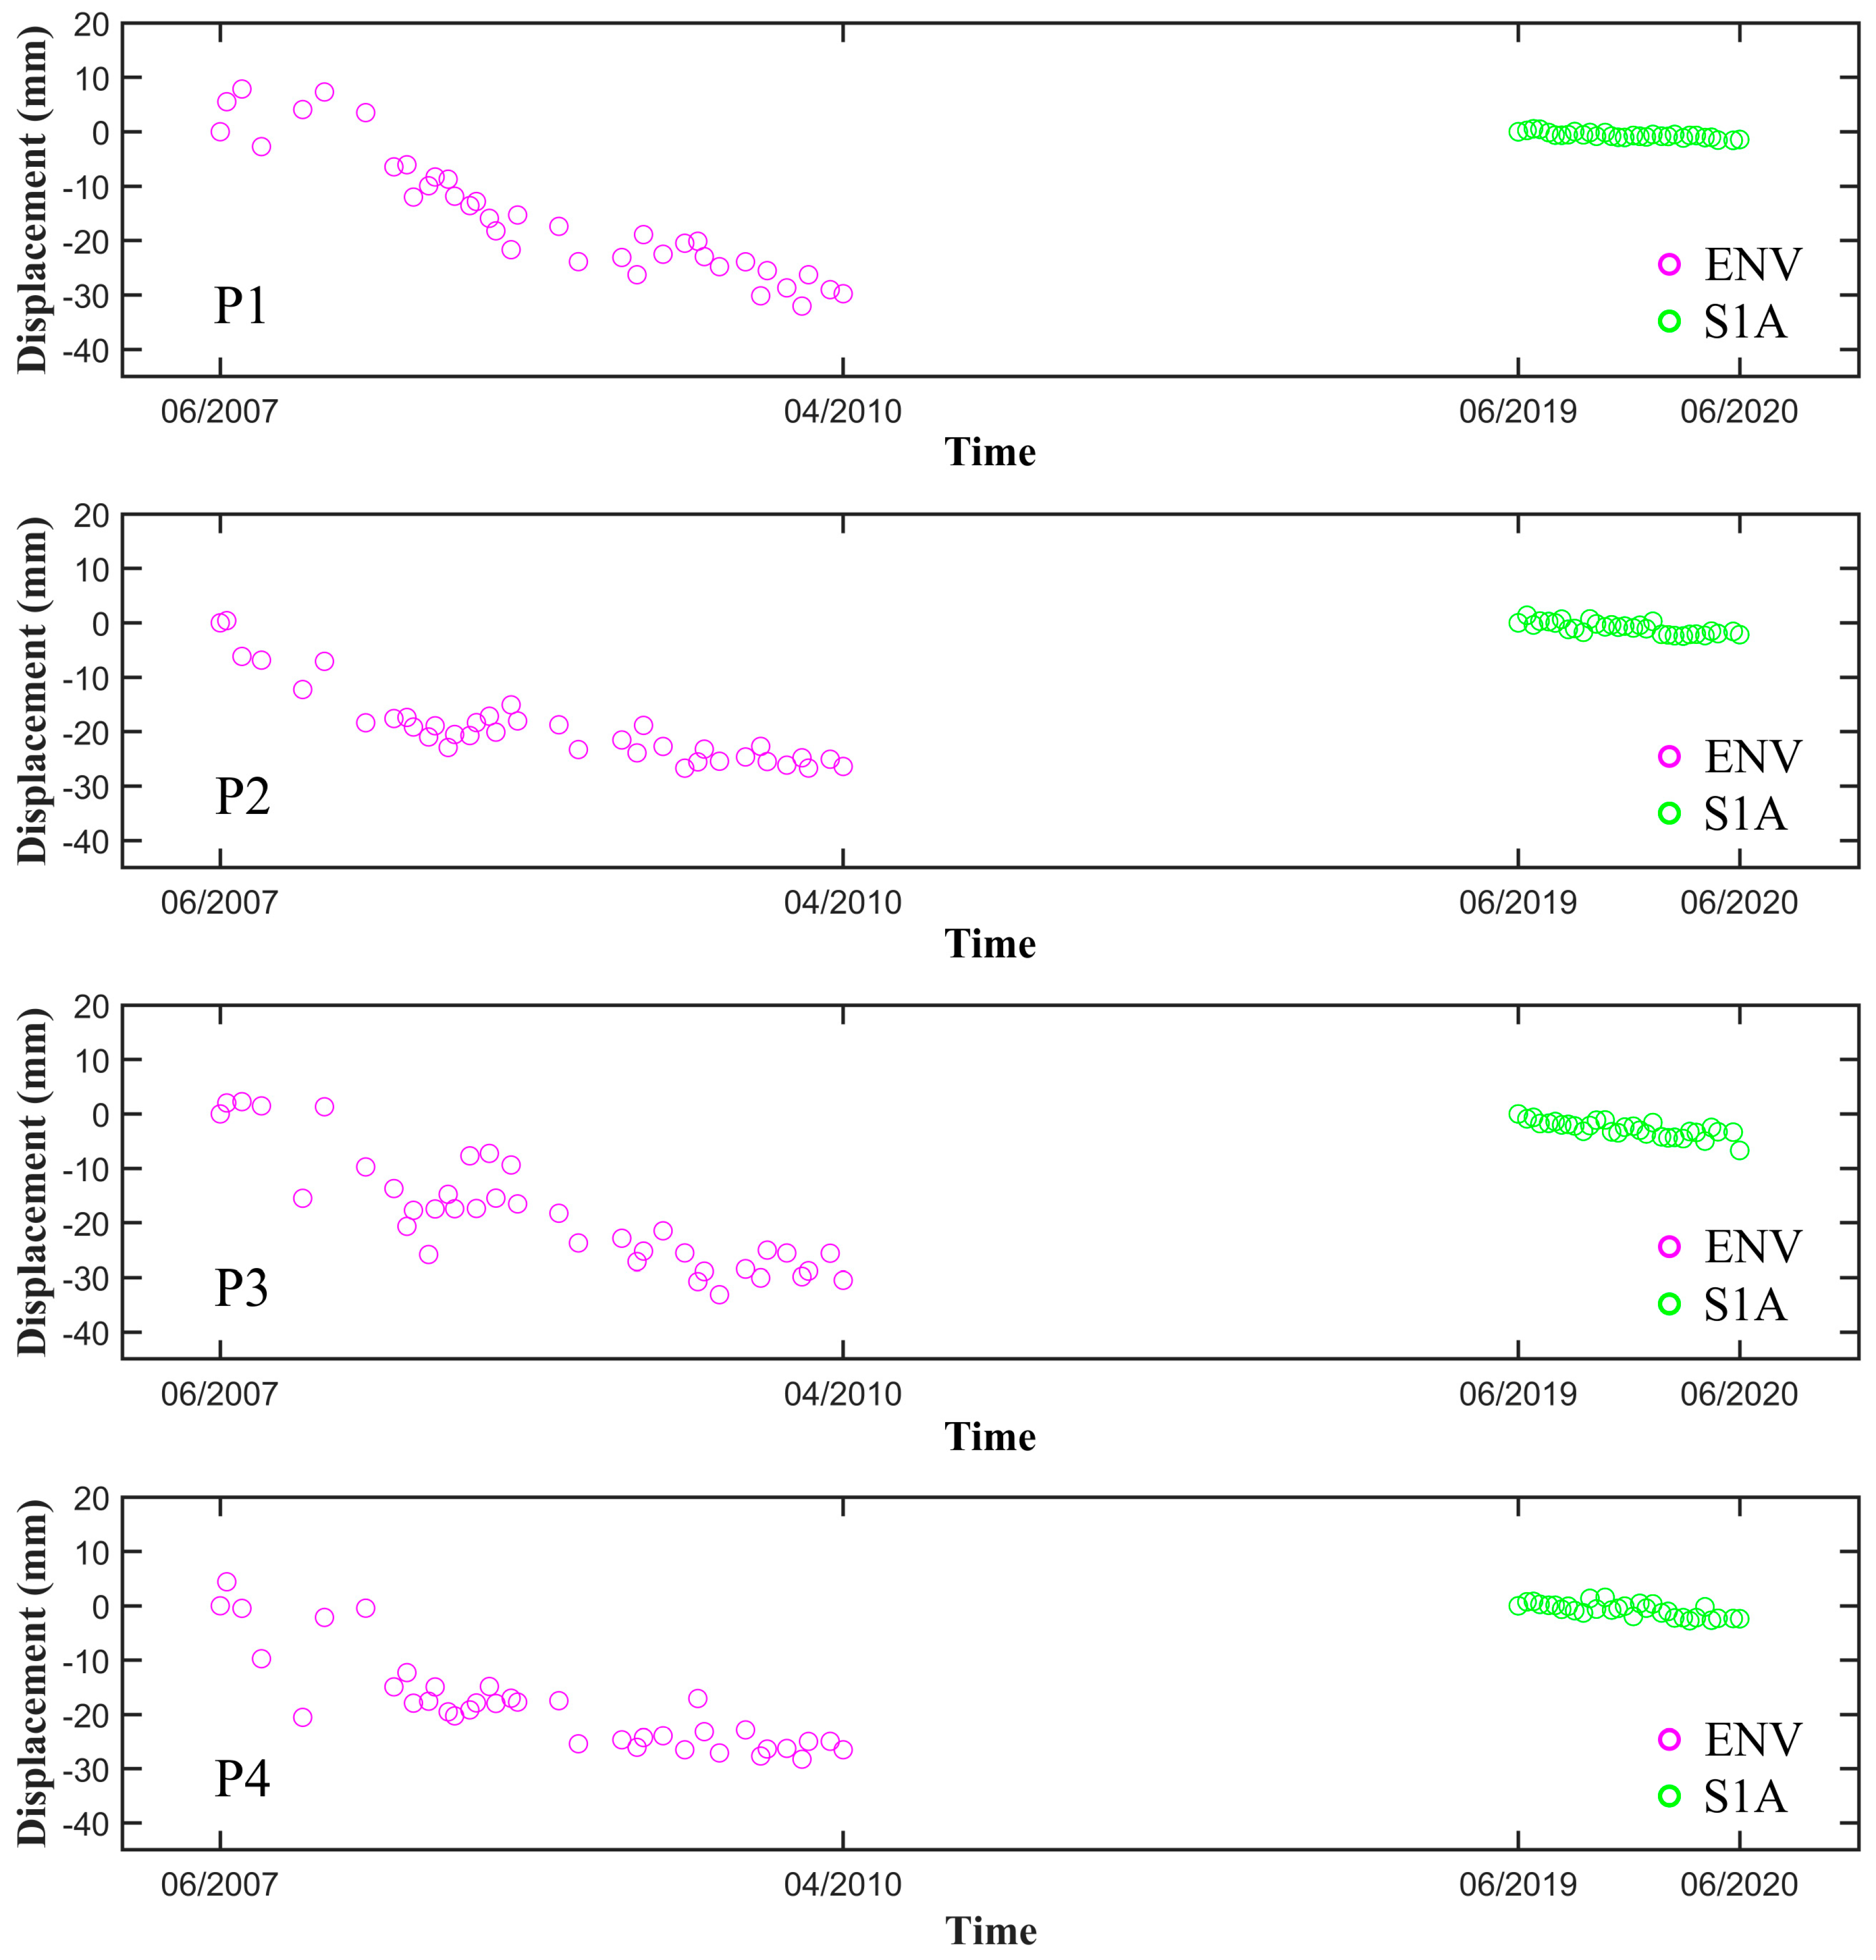
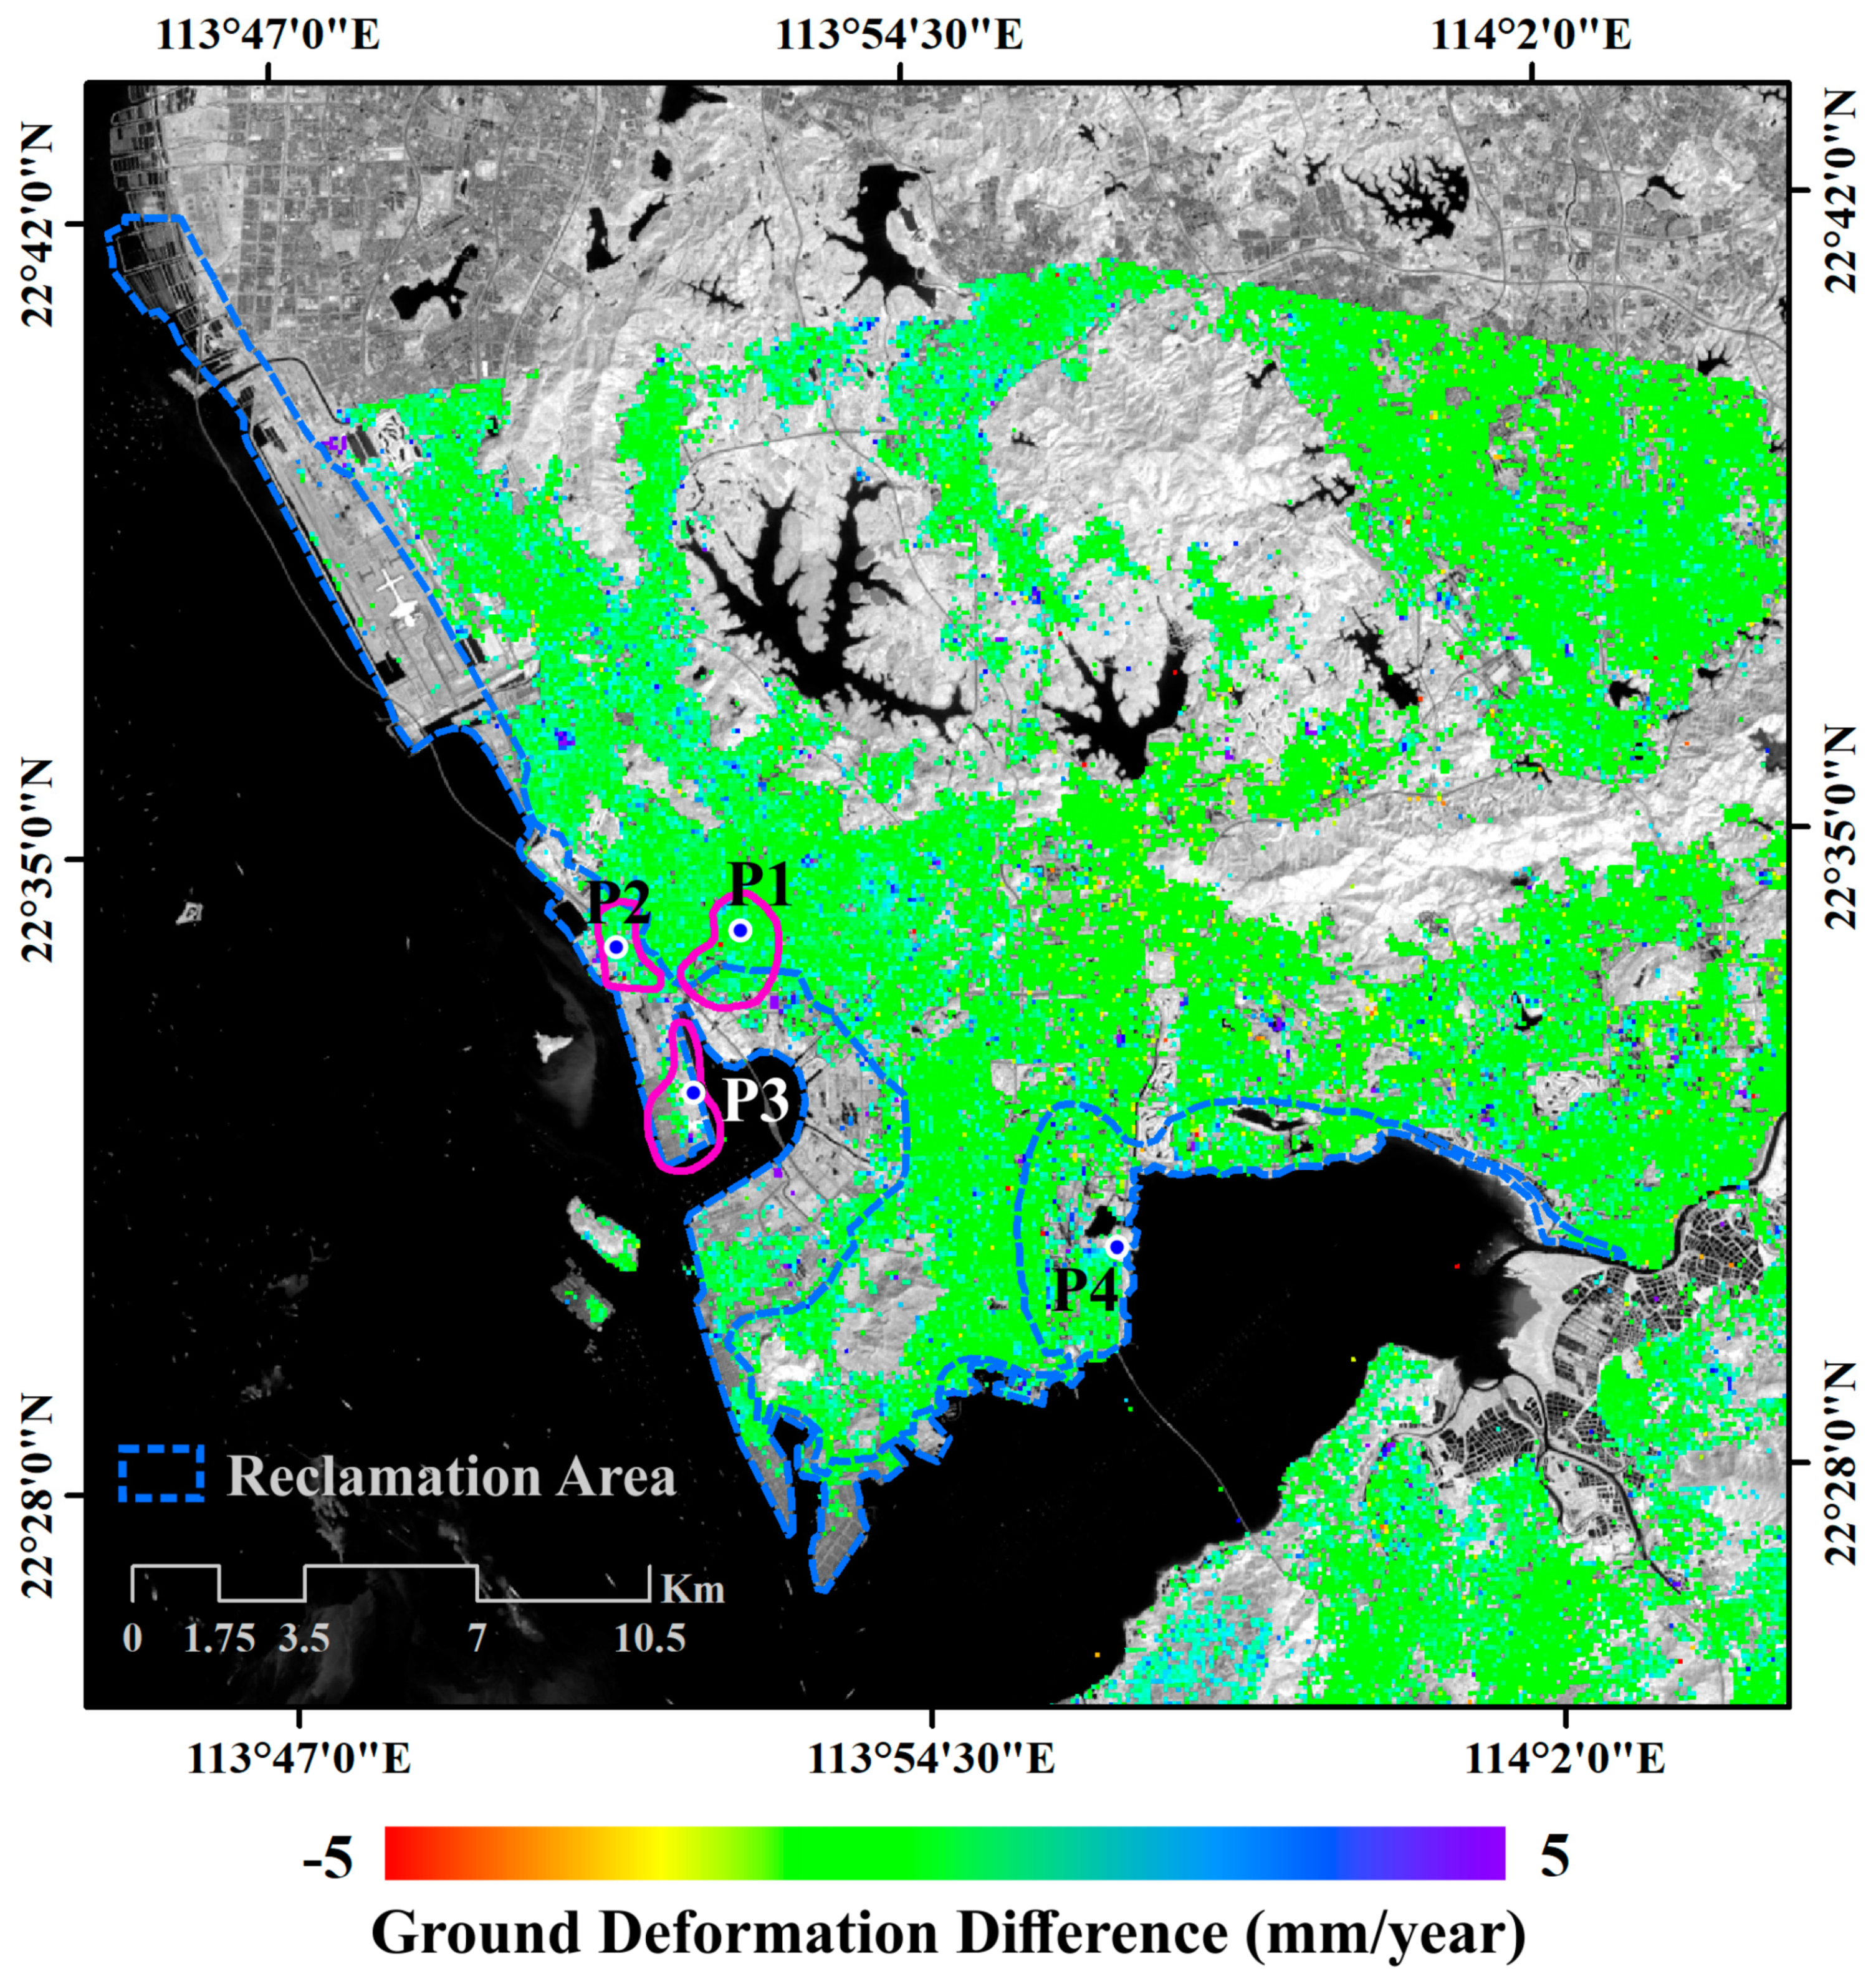
5.2. Comparison and Verification of the Geotechnical Model and Other Deformation Models in Shenzhen Reclamation Area

It is well known from the literature [26,27,46,48,51,52,53] that the consolidation process of a saturated clay layer in reclaimed lands involves two main stages: the primary consolidation and the secondary compression [48]. The primary consolidation is responsible for the most significant proportion of the total ground displacement that evolves quickly just after the end of reclamation projects. Conversely, the secondary compression and fill creep can last for decades after the end of the reclamation procedures and evolves slowly over time. This phenomenon can be explained by the well-known Terzaghi theory of consolidation [54] in terms of dissipation of excess pore pressures (i.e., the increase of significant stress) induced by the external loading in undrained conditions. Among others, the geotechnical model of Equation (5) was obtained by Yang et al. [24] from laboratory centrifuge tests based on the dredger fill characteristics of Shanghai. Through previous studies [19,23] and the verification analysis in Section 3 of our study, the model can commendably describe the secondary compression process of the dredger fill in the reclamation area of Shanghai. Moreover, the logarithmic model [26,48] and the exponential decay model [26] were used in the investigation of the long-term reclamation settlement of Hong Kong Airport. In the following, these two additional models are presented and discussed.
For a constant secondary compression index, the secondary compression displacement [48] can be obtained as:
S s = C α 1 + e 0 H 0 · log t t 0
where H0 is the initial thickness of the soil element or layer which has an initial void ratio e0, t0 is the time corresponding to the completion of primary consolidation, and t is any time beyond primary consolidation. From Equation (8), we can derive the following simplified logarithmic model:
S ( t ) = a · log t t 0
where S(t) is the dynamic ground deformation at time t calculated with respect to the reference at the starting time t0 = 0 (i.e., S(t0 = 0) ≡0), and a represents the shape parameters of the logarithmic curve.
From the literature [26], another model is derived, characterized by an exponential decay of the ground deformations as:
S ( t ) = S m a x ( 1 e b t )
where S(t) is the dynamic ground deformation at time t with respect to the reference at the starting time t0 = 0 (i.e., S(t0 = 0) ≡0), Smax denotes the maximum possible deformation, and Smax and b are the parameters of the used model.
For comparison, we estimated the ground-deformation time-series from June 2007 to April 2010 at the four points labeled P1, P2, P3, and P4 shown in Figure 13. Then, we obtained the three related best-fit models, which are shown in Figure 15. Then, the quality of the three reconstructed nonlinear curve fittings was evaluated by computing the RMSE of the difference between the InSAR-based (vertical) ground deformation time-series and the obtained best-fit model. We note that the RMSE values between the SBAS-InSAR deformation time-series and the best-fit geotechnical model are smaller than those of the other two models at the four selected points. These results indicate that the geotechnical model outperforms the other two models, also considering the test site in the area of the Shenzhen city.
We also estimated the deformation time-series from March 2010 to March 2024 based on the best-fit model parameters of three models at the points P1, P2, P3, and P4, as shown in Figure 15. Compared with the deformation from June 2007 to April 2010, the deformation predicted by the three models from June 2019 to June 2020 is significantly slowed down, and they are generally consistent with the S1A ground deformation measurements. At this stage, we used the independent set of S1A SAR data, collected from June 2019 to June 2020, to check if the measured ground deformation rate in 2020 is consistent with that foreseen by the best-fit models ten years later, based on three years of data collected by the ENVISAT ASAR sensor from 2007 to 2010. As evident, in this case, with a gap of almost ten years, the method proposed in [23] could become unstable and have only a mathematical meaning, so we simply compared the average predicted and measured ground deformation velocities from June 2019 to June 2020. We listed in Table 2 the ground deformation velocities obtained by the ENVISAT ASAR data from 2007 to 2010, those obtained by the S1A sensor from 2019 to 2020, and the ground deformation velocities estimated by the three models from 2019 to 2020. We note that the deformation velocities of S1A and three models are significantly slowed down with respect to the ENV deformation velocities. In terms of the difference between the velocities obtained by three models and S1A deformation velocities, it is evident that the geotechnical model and the logarithmic model are better than the exponential decay model.
Furthermore, the differences between the geotechnical model, the logarithmic model, and S1A deformation velocities are in the range of +/−2 mm/year. Moreover, the velocities obtained by the logarithmic model seem to be closer to S1A deformation velocities, especially at points P2, P3, and P4 into the reclamation area. These results indicate that the geotechnical model adopted for the Shanghai city is also suitable in the Shenzhen areas, even though the reclaimed materials are different. Of course, the provided analyses are not conclusive and thus require further efforts and the support of experts of the specific reclaimed-lands project in Shenzhen to relate the model parameters to physical properties of the reclaimed materials.
Finally, we estimated the deformation time-series using the geotechnical model from 2019 to 2020, at all the common pixels between the masked up-down ENV deformation (from 2007 to 2010) map and the vertical S1A deformation (from 2019 to 2020) map. Then, we calculated the ground-deformation velocity by the estimated deformation time-series from 2019 to 2020. To investigate the quality of the ground deformation predictions using the geotechnical model in the whole region, we computed the difference between the vertical S1A deformation velocity and the estimated deformation velocity. The results are shown in Figure 16. This figure evidences that the deformation velocity predicted by the geotechnical model is consistent with and the actual ground deformation velocity recorded in the last year after ten years by the data used for the prediction, obtained by the S1A SAR images. We note that the differences between the deformation velocity predicted by the geotechnical model and the deformation velocity obtained by the S1A SAR data are on average less than 1 mm/year. Accordingly, the results suggest that there is a good agreement between the two deformation velocities. We have also noticed that the deformations are more obvious (lower than −5 mm/year) from 2007 to 2010, while the deformations become very slow from 2019 to 2010 (−2~1 mm/year), especially in the area highlighted by the red polygons (in Figure 16). Thus, the geotechnical model is reasonable and useful for the deformation prediction of the reclamation area of Shenzhen. Our work, in synergy with the findings of other scholars [3,28,36] in the analyzed area of the city of Shenzhen, is useful to evaluate the risk to the population related to the mutual effects of terrain displacement and present-day sea-level rise (SLR) in coastal regions of highly urbanized cities.

6. Conclusions

In this work, we performed an extended investigation to characterize the residual ground displacement of the terrain due to secondary compression stages of unconsolidated ocean-reclaimed lands. In particular, our investigation enhances and extends the outcomes of other previous investigations to another area of interest, namely Shenzhen city, by studying the accuracy of the adopted ground deformation models in a more general context. A comparative analysis involving different sets of independent SAR images has been performed, and the potential and limits of different ground deformation models have been highlighted. We have shed light on the usefulness and applicability of the adopted models to forecast the future evolution of the terrain ground displacement. The results indicate that the geotechnical model used to characterize the deformation phenomena in the Shanghai area can also be successfully used for describing the deformation of other reclaimed areas even though the sub-soil characteristics are not entirely homogenous in the two investigated areas of Shanghai and Shenzhen. The current state of the ground deformations in the area of Shenzhen was obtained using a set of Sentinel-1A SAR data acquired in the last year. Then, the current ground deformation rates were compared with those predicted using sets of ENVISAT ASAR images collected more than ten years ago (from 2007 to 2010) over the same area and already used in investigations performed by other scholars. The results show that the geotechnical model and the logarithmic model are more reasonable in the prediction of the deformation in Shenzhen. Taking the results of Shanghai into account, they allow us to say that the geotechnical model is widely applicable to the description of the deformation in the reclamation area. Globally, the innovation potential of our investigation with respect to previous work [2,19,22,23,55,56,57] mainly concerns: (i) the corroboration with independent sets of SAR data of the congruence between the measured and the foreseen ground deformation of ocean-reclaimed platforms [2,23]; (ii) the comparative study of different time-dependent models of ground deformation [24,26,48]; (iii) the in-depth analysis of present-day ground displacement in the area of Shenzhen, which has highlighted the presence of newly spotted areas with significant displacement that can evolve over the time and represent a risk to the population [58]. The interrelations existing between the terrain deformation of the Shenzhen area and the present-day sea-level rise (SLR) phenomenon must be seriously taken into consideration. Indeed, even if the rate of the ground deformation of the coastal area is tiny, the results of our investigation reveal that more than a few millimeters of cumulative deformation is expected in the next years and, globally, the process of consolidation of ocean-reclaimed lands continue over an elapsed time of decades. This investigation, entirely based on interferometric synthetic aperture radar data and products, makes it evident that local authorities and scientists have to work more for the achievement of global sustainable development goals.

Supplementary Materials

The following are available online at https://www.mdpi.com/2072-4292/12/18/2971/s1. Table S1: ENVISAT ASAR Dataset used for Shanghai, Table S2: COSMO-SkyMed Dataset used for Shanghai, Table S3: RADASAT-2 Dataset used for Shanghai, Table S4: ENVISAT ASAR Ascending Dataset used for Shenzhen, Table S5: ENVISAT ASAR Descending Dataset used for Shenzhen, Table S6: Sentinel-1A Dataset used for Shenzhen.

Author Contributions

Conceptualization, Q.Z., A.P., and J.D.; Data curation, J.D. and M.T.; Formal analysis, J.D., Q.Z., and A.P.; Funding acquisition, Q.Z. and A.P.; Investigation, J.D., F.C., and V.Z.; Methodology, Q.Z., A.P., and J.D.; Project administration, Q.Z.; Resources, Q.Z.; Software, M.T.; Supervision, A.P. and M.L.; Validation, Q.Z.; Visualization, J.D., M.T. and F.F.; Writing—original draft, J.D., F.C., and V.Z.; Writing—review & editing, Q.Z., M.L., and A.P. All authors have read and agreed to the published version of the manuscript.

Funding

This research was funded by The National Key Research and Development Program of China, entitled “Studies of big geographical data applied to urban public safety in BRICS NATIONS”, grant number 2017YFE0100700, by the Natural Science Foundation of China, grant number 41801337, by the Research Grants of Science and Technology Commission of Shanghai Municipality, grant number 18ZR1410800, by the Fundamental Research Funds for the Central Universities of China, and by the Fund of the Director of the Key Laboratory of Geographic Information Science (Ministry of Education), East China Normal University, grant no. KLGIS2017C03.

Acknowledgments

This work was supported by The National Key Research and Development Program of China, entitled “Studies of big geographical data applied to urban public safety in BRICS NATIONS” (No. 2017YFE0100700), by the Natural Science Foundation of China (#41801337), by the Research Grants of Science and Technology Commission of Shanghai Municipality through Project 18ZR1410800, and by the Fundamental Research Funds for the Central Universities of China, by the Fund of the Director of the Key Laboratory of Geographic Information Science (Ministry of Education), East China Normal University (grant no. KLGIS2017C03). This work has been performed within the Dragon 4 ESA project ID 32294, entitled “Integrated analysis of the combined risk of ground subsidence, sea-level rise, and natural hazards in coastal delta regions”, and the Dragon 5 ESA project ID 58351, entitled “Global Climate Change, Sea Level Rise, Extreme Events and Local Ground Subsidence Effects in Coastal and River Delta Regions through Novel and Integrated Remote Sensing Approaches (GREENISH)”. The Italian Space Agency provided us with the CSK SAR images, whereas ENV data were obtained through the CAT-ESA project n. 11461.

Conflicts of Interest

The authors declare no conflict of interest.

References

  1. Wang, Q.; Zhao, Q.; Ding, J.; Fedotov, A.A.; Badenko, V.; Liu, M.; Pepe, A. Investigation of the ground displacement in Saint Petersburg, Russia, using multiple-track differential synthetic aperture radar interferometry. Int. J. Appl. Earth Obs. Geoinf. 2020, 87. [Google Scholar] [CrossRef]
  2. Zhao, Q.; Pepe, A.; Gao, W.; Lu, Z.; Bonano, M.; He, M.L.; Wang, J.; Tang, X. A DInSAR Investigation of the Ground Settlement Time Evolution of Ocean-Reclaimed Lands in Shanghai. IEEE J. Sel. Top. Appl. Earth Obs. Remote Sens. 2015, 8, 1763–1781. [Google Scholar] [CrossRef]
  3. Xu, B.; Feng, G.; Li, Z.; Wang, Q.; Wang, C.; Xie, R. Coastal Subsidence Monitoring Associated with Land Reclamation Using the Point Target Based SBAS-InSAR Method: A Case Study of Shenzhen, China. Remote Sens. 2016, 8, 652. [Google Scholar] [CrossRef] [Green Version]
  4. Suzuki, T. Economic and geographic backgrounds of land reclamation in Japanese ports. Mar. Pollut. Bull. 2003, 47, 226–229. [Google Scholar] [CrossRef]
  5. Breber, P.; Povilanskas, R.; Armaitienė, A. Recent evolution of fishery and land reclamation in Curonian and Lesina lagoons. Hydrobiologia 2008, 611, 105–114. [Google Scholar] [CrossRef]
  6. Yin, J.; Zhao, Q.; Yu, D.; Lin, N.; Kubanek, J.; Ma, G.; Liu, M.; Pepe, A. Long-term flood-hazard modeling for coastal areas using InSAR measurements and a hydrodynamic model: The case study of Lingang New City, Shanghai. J. Hydrol. 2019, 571, 593–604. [Google Scholar] [CrossRef] [Green Version]
  7. Syvitski, J.P.M. Impact of Humans on the Flux of Terrestrial Sediment to the Global Coastal Ocean. Science 2005, 308, 376–380. [Google Scholar] [CrossRef]
  8. Higgins, S.A. Review: Advances in delta-subsidence research using satellite methods. Hydrogeol. J. 2015, 24, 587–600. [Google Scholar] [CrossRef]
  9. Tian, B.; Wu, W.; Yang, Z.; Zhou, Y. Drivers, trends, and potential impacts of long-term coastal reclamation in China from 1985 to 2010. Estuar. Coast. Shelf Sci. 2016, 170, 83–90. [Google Scholar] [CrossRef]
  10. Panza, G.F.; Peresan, A.; Magrin, A.; Vaccari, F.; Sabadini, R.; Crippa, B.; Marotta, A.M.; Splendore, R.; Barzaghi, R.; Borghi, A.; et al. The SISMA prototype system: Integrating Geophysical Modeling and Earth Observation for time-dependent seismic hazard assessment. Nat. Hazards 2011, 69, 1179–1198. [Google Scholar] [CrossRef]
  11. Berardino, P.; Fornaro, G.; Lanari, R.; Sansosti, E. A new algorithm for surface deformation monitoring based on small baseline differential SAR interferograms. IEEE Trans. Geosci. Remote Sens. 2002, 40, 2375–2383. [Google Scholar] [CrossRef] [Green Version]
  12. Ferretti, A.; Prati, C.; Rocca, F. Permanent scatterers in SAR interferometry. IEEE Trans. Geosci. Remote Sens. 2001, 39, 8–20. [Google Scholar] [CrossRef]
  13. Hooper, A.; Segall, P.; Zebker, H. Persistent scatterer interferometric synthetic aperture radar for crustal deformation analysis, with application to Volcán Alcedo, Galápagos. J. Geophys. Res. 2007, 112. [Google Scholar] [CrossRef] [Green Version]
  14. Rui, Z.; Liu, G.; Tao, L.; Huang, L.; Bing, Y.; Qiang, C.; Li, Z.J.I.G.; Letters, R.S. An Integrated Model for Extracting Surface Deformation Components by PSI Time Series. IEEE Geosci. Remote Sens. Lett. 2013, 11, 544–548. [Google Scholar]
  15. Ferretti, A.; Prati, C.; Rocca, F. Nonlinear subsidence rate estimation using permanent scatterers in differential SAR interferometry. IEEE Trans. Geosci. Remote Sens. 2000, 38, 2202–2212. [Google Scholar] [CrossRef] [Green Version]
  16. Tizzani, P.; Berardino, P.; Casu, F.; Euillades, P.; Manzo, M.; Ricciardi, G.; Zeni, G.; Lanari, R. Surface deformation of Long Valley caldera and Mono Basin, California, investigated with the SBAS-InSAR approach. Remote Sens. Environ. 2007, 108, 277–289. [Google Scholar] [CrossRef]
  17. Casu, F.; Elefante, S.; Imperatore, P.; Zinno, I.; Manunta, M.; De Luca, C.; Lanari, R. SBAS-DInSAR Parallel Processing for Deformation Time-Series Computation. IEEE J. Sel. Top. Appl. Earth Obs. Remote Sens. 2014, 7, 3285–3296. [Google Scholar] [CrossRef]
  18. Pepe, A.; Zhao, Q.; Bonano, M.; Lu, Z.; Zhou, Y. The study of the deformation time evolution in coastal areas of Shanghai: A joint C/X-band SBAS-DInSAR analysis. In Proceedings of the IEEE International Geoscience and Remote Sensing Symposium (IGARSS), Milan, Italy, 26–31 July 2015. [Google Scholar] [CrossRef]
  19. Zhao, Q.; Ma, G.; Wang, Q.; Yang, T.; Liu, M.; Gao, W.; Falabella, F.; Mastro, P.; Pepe, A. Generation of long-term InSAR ground displacement time-series through a novel multi-sensor data merging technique: The case study of the Shanghai coastal area. ISPRS J. Photogramm. Remote Sens. 2019, 154, 10–27. [Google Scholar] [CrossRef]
  20. Werner, C.; Wegmuller, U.; Strozzi, T.; Wiesmann, A. Interferometric point target analysis for deformation mapping. In Proceedings of the IEEE International Geoscience and Remote Sensing Symposium, Toulouse, France, 21–25 July 2003. [Google Scholar] [CrossRef]
  21. Luo, Q.; Zhou, G.; Perissin, D. Monitoring of Subsidence along Jingjin Inter-City Railway with High-Resolution TerraSAR-X MT-InSAR Analysis. Remote Sens. 2017, 9, 717. [Google Scholar] [CrossRef] [Green Version]
  22. Yang, M.; Yang, T.; Zhang, L.; Lin, J.; Qin, X.; Liao, M. Spatio-Temporal Characterization of a Reclamation Settlement in the Shanghai Coastal Area with Time Series Analyses of X-, C-, and L-Band SAR Datasets. Remote Sens. 2018, 10, 329. [Google Scholar] [CrossRef] [Green Version]
  23. Pepe, A.; Bonano, M.; Zhao, Q.; Yang, T.; Wang, H. The Use of C-/X-Band Time-Gapped SAR Data and Geotechnical Models for the Study of Shanghai’s Ocean-Reclaimed Lands through the SBAS-DInSAR Technique. Remote Sens. 2016, 8, 911. [Google Scholar] [CrossRef] [Green Version]
  24. Yang, P.; Tang, Y.Q.; Zhou, N.Q.; Wang, J.X. Consolidation settlement of Shanghai dredger fill under self-weight using centrifuge modeling test. J. Cent. South Univ. Sci. Technol. 2008, 39, 862–866. (In Chinese) [Google Scholar]
  25. Jiang, L.; Lin, H. Integrated analysis of SAR interferometric and geological data for investigating long-term reclamation settlement of Chek Lap Kok Airport, Hong Kong. Eng. Geol. 2010, 110, 77–92. [Google Scholar] [CrossRef]
  26. Plant, G.W.; Covil, C.S.; Hughes, R.A. Geology, Surveying, Reclamation Settlement. In Site Preparation of the New Hong Kong International Airport, 1st ed.; Thomas Telford: London, UK, 1998; pp. 45, 387–416, 515–517. [Google Scholar]
  27. Tang, Y.; Zhou, J.; He, X.; Yang, P.; Wang, J. Theoretical and experimental study of consolidation settlement characteristics of hydraulic fill soil in Shanghai. Environ. Earth Sci. 2012, 67, 1397–1405. [Google Scholar] [CrossRef]
  28. Ma, P.; Wang, W.; Zhang, B.; Wang, J.; Shi, G.; Huang, G.; Chen, F.; Jiang, L.; Lin, H. Remotely sensing large- and small-scale ground subsidence: A case study of the Guangdong–Hong Kong–Macao Greater Bay Area of China. Remote Sens. Environ. 2019, 232. [Google Scholar] [CrossRef]
  29. Gao, G.D.; Wang, X.H.; Bao, X.W. Land reclamation and its impact on tidal dynamics in Jiaozhou Bay, Qingdao, China. Estuar. Coast. Shelf Sci. 2014, 151, 285–294. [Google Scholar] [CrossRef]
  30. Yu, Q.; Wang, Q.; Yan, X.; Yang, T.; Song, S.; Yao, M.; Zhou, K.; Huang, X. Ground Deformation of the Chongming East Shoal Reclamation Area in Shanghai Based on SBAS-InSAR and Laboratory Tests. Remote Sens. 2020, 12, 1016. [Google Scholar] [CrossRef] [Green Version]
  31. Wang, H.; Wright, T.J.; Yu, Y.; Lin, H.; Jiang, L.; Li, C.; Qiu, G. InSAR reveals coastal subsidence in the Pearl River Delta, China. Geophys. J. Int. 2012. [Google Scholar] [CrossRef] [Green Version]
  32. Yu, L.; Yang, T.; Zhao, Q.; Liu, M.; Pepe, A. The 2015–2016 Ground Displacements of the Shanghai Coastal Area Inferred from a Combined COSMO-SkyMed/Sentinel-1 DInSAR Analysis. Remote Sens. 2017, 9, 1194. [Google Scholar] [CrossRef] [Green Version]
  33. Jiang, Y.; Liao, M.; Wang, H.; Zhang, L.; Balz, T. Deformation Monitoring and Analysis of the Geological Environment of Pudong International Airport with Persistent Scatterer SAR Interferometry. Remote Sens. 2016, 8, 1021. [Google Scholar] [CrossRef] [Green Version]
  34. Pepe, A.; Solaro, G.; Calo, F.; Dema, C. A Minimum Acceleration Approach for the Retrieval of Multiplatform InSAR Deformation Time Series. IEEE J. Sel. Top. Appl. Earth Obs. Remote Sens. 2016, 9, 3883–3898. [Google Scholar] [CrossRef]
  35. Shen, S.L. Geological environmental character of Lin Gang New City and its influences to the construction. Shanghai Geol. 2008, 105, 24–28. (In Chinese) [Google Scholar]
  36. Liu, P.; Chen, X.; Li, Z.; Zhang, Z.; Xu, J.; Feng, W.; Wang, C.; Hu, Z.; Tu, W.; Li, H. Resolving Surface Displacements in Shenzhen of China from Time Series InSAR. Remote Sens. 2018, 10, 1162. [Google Scholar] [CrossRef] [Green Version]
  37. Strang, G. Linear Algebra and Its Applications; Harcourt Brace Jovanovich: Orlando, FL, USA, 1988. [Google Scholar]
  38. Pepe, A.; Lanari, R. On the extension of the minimum cost flow algorithm for phase unwrapping of multitemporal differential SAR interferograms. IEEE Trans. Geosci. Remote Sens. 2006, 44, 2374–2383. [Google Scholar] [CrossRef]
  39. Lanari, R.; Casu, F.; Manzo, M.; Zeni, G.; Berardino, P.; Manunta, M.; Pepe, A. An Overview of the Small BAseline Subset Algorithm: A DInSAR Technique for Surface Deformation Analysis. Pure Appl. Geophys. 2007, 164, 637–661. [Google Scholar] [CrossRef]
  40. Pepe, A.; Calò, F. A Review of Interferometric Synthetic Aperture RADAR (InSAR) Multi-Track Approaches for the Retrieval of Earth’s Surface Displacements. Appl. Sci. 2017, 7, 1264. [Google Scholar] [CrossRef] [Green Version]
  41. Goldstein, R.M.; Werner, C.L. Radar interferogram filtering for geophysical applications. Geophys. Res. Lett. 1998, 25, 4035–4038. [Google Scholar] [CrossRef] [Green Version]
  42. Costantini, M. A novel phase unwrapping method based on network programming. IEEE Trans. Geosci. Remote Sens. 1998, 36, 813–821. [Google Scholar] [CrossRef]
  43. Casu, F.; Manzo, M.; Lanari, R. A quantitative assessment of the SBAS algorithm performance for surface deformation retrieval from DInSAR data. Remote Sens. Environ. 2006, 102, 195–210. [Google Scholar] [CrossRef]
  44. Levenberg, K. A Method for the Solution of Certain Nonlinear Problems in Least Squares. Q. Appl. Math. 1994, 2, 164–168. [Google Scholar] [CrossRef] [Green Version]
  45. Marquardt, D. An Algorithm for Least-Squares Estimation of Nonlinear Parameters. SIAM J. Appl. Math. 1963, 11, 431–441. [Google Scholar] [CrossRef]
  46. Kim, S.-W.; Wdowinski, S.; Dixon, T.H.; Amelung, F.; Kim, J.W.; Won, J.-S. Measurements and predictions of subsidence induced by soil consolidation using persistent scatterer InSAR and a hyperbolic model. Geophys. Res. Lett. 2010, 37. [Google Scholar] [CrossRef] [Green Version]
  47. Shanghai Institute of Geological Survey (SIGS). The Geological Hazard Risk Assessment Report of Lingang New City (PD8); Shanghai Institute Geologocal Survey: Shanghai, China, 2006. (In Chinese) [Google Scholar]
  48. Smith, I. Smith’s Elements of Soil Mechanics; Blackwell Pub: Oxford, UK; Malden, MA, USA, 2006. [Google Scholar]
  49. Matano, F. Analysis and Classification of Natural and Human-Induced Ground Deformations at Regional Scale (Campania, Italy) Detected by Satellite Synthetic-Aperture Radar Interferometry Archive Datasets. Remote Sens. 2019, 11, 2822. [Google Scholar] [CrossRef] [Green Version]
  50. Peng, M.; Zhao, C.; Zhang, Q.; Lu, Z.; Bai, L.; Bai, W. Multi-Scale and Multi-Dimensional Time Series InSAR Characterizing of Surface Deformation over Shandong Peninsula, China. Appl. Sci. 2020, 10, 2294. [Google Scholar] [CrossRef] [Green Version]
  51. Shi, G.; Lin, H.; Bürgmann, R.; Ma, P.; Wang, J.; Liu, Y. Early soil consolidation from magnetic extensometers and full resolution SAR interferometry over highly decorrelated reclaimed lands. Remote Sens. Environ. 2019, 231. [Google Scholar] [CrossRef]
  52. Zanello, F.; Teatini, P.; Putti, M.; Gambolati, G. Long term peatland subsidence: Experimental study and modeling scenarios in the Venice coastland. J. Geophys. Res. 2011, 116. [Google Scholar] [CrossRef]
  53. Zhao, Q.; Lin, H.; Gao, W.; Zebker, H.A.; Chen, A.; Yeung, K. InSAR detection of residual settlement of an ocean reclamation engineering project: A case study of Hong Kong International Airport. J. Oceanogr. 2011, 67, 415–426. [Google Scholar] [CrossRef]
  54. Terzaghi, K.; Peck, R.B. Soil Mechanics in Engineering Practice, 2nd ed.; John Wiley: New York, NY, USA, 1967. [Google Scholar]
  55. Chen, J.; Wu, J.; Zhang, L.; Zou, J.; Liu, G.; Zhang, R.; Yu, B. Deformation Trend Extraction Based on Multi-Temporal InSAR in Shanghai. Remote Sens. 2013, 5, 1774–1786. [Google Scholar] [CrossRef] [Green Version]
  56. Yao, G.; Ke, C.-Q.; Zhang, J.; Lu, Y.; Zhao, J.; Lee, H. Surface deformation monitoring of Shanghai based on ENVISAT ASAR and Sentinel-1A data. Environ. Earth Sci. 2019, 78, 255. [Google Scholar] [CrossRef]
  57. Dong, S.; Samsonov, S.; Yin, H.; Huang, L. Two-Dimensional Ground Deformation Monitoring in Shanghai Based on SBAS and MSBAS InSAR Methods. J. Earth Sci. 2018, 29, 960–968. [Google Scholar] [CrossRef]
  58. Hu, B.; Chen, J.; Zhang, X. Monitoring the Land Subsidence Area in a Coastal Urban Area with InSAR and GNSS. Sensors 2019, 19, 3181. [Google Scholar] [CrossRef] [PubMed]
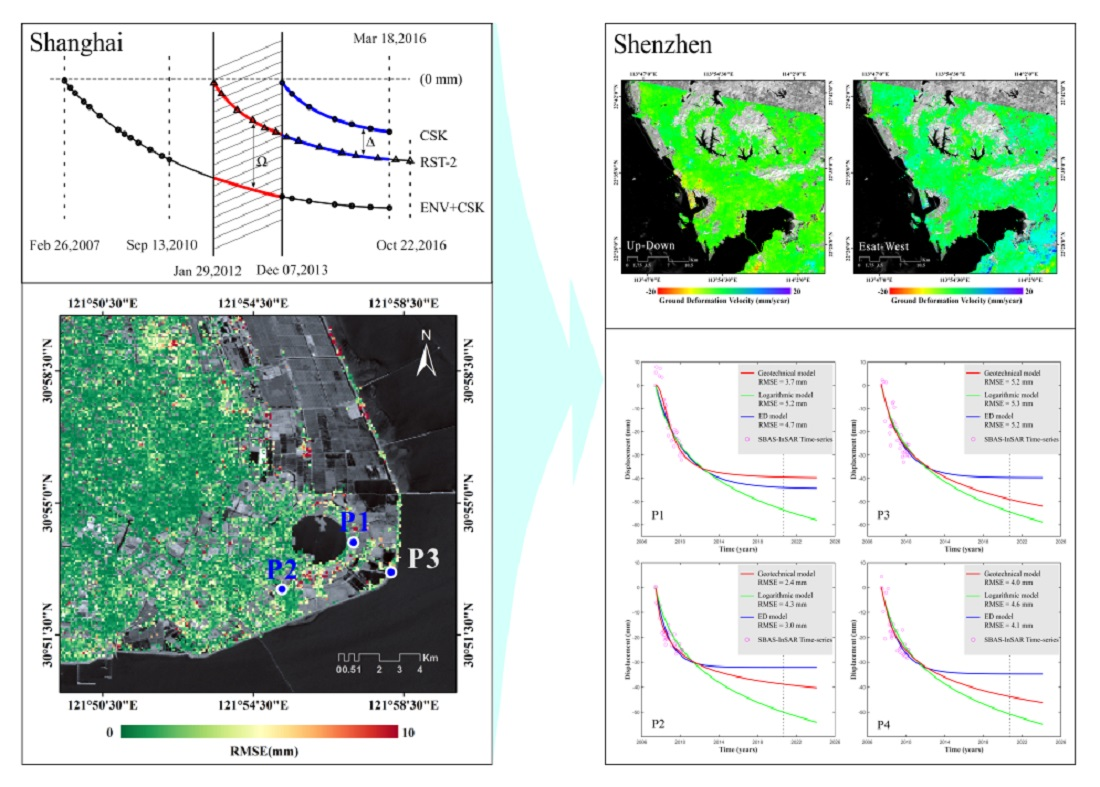
 [Green Version]
Figure 1. (a) Location of the Lingang New City of Shanghai, the coverages of the ENVISAT ASAR (ENV), Radarsat-2 (RST-2), and COSMO-SkyMed (CSK) synthetic aperture radar (SAR) datasets are depicted by the green, blue, black, and red rectangles, respectively. (b) Temporal distribution of the ENV, RST-2, and CSK datasets.
Remotesensing 12 02971 g001
Figure 2. (a) Location of Shenzhen, the coverages of the ascending ENV, descending ENV, and Sentinel-1A (S1A) SAR datasets used for Shenzhen are depicted by the green, blue, black and red rectangles, respectively. (b) Temporal distribution of those three SAR datasets used for Shenzhen.
Remotesensing 12 02971 g002
Figure 3. SAR observation geometries of the ascending (orange) and descending (blue) data tracks.
Remotesensing 12 02971 g003
Figure 4. Pictorial representation of the procedure adopted to align the vertical RST-2 ground deformation time-series with that of the ENV+CSK SAR data set.
Remotesensing 12 02971 g004
Figure 5. Lingang New City ground deformation. (a) Map of mean velocity calculated with the CSK vertical ground deformation time-series, from December 2013 to March 2016. (b) Map of mean velocity calculated with the RST-2 vertical ground deformation time-series, from January 2012 to October 2016.
Remotesensing 12 02971 g005
Figure 6. The comparison of CSK and RST-2 vertical deformation velocities at common coherent pixels. The blue line represents the linear fitting model by considering the 85% shared high-coherent pixels limited to the blue ellipse. The X axis stands for the CSK vertical deformation velocities, and the Y axis stands for the RST-2 vertical deformation velocities.
Remotesensing 12 02971 g006
Figure 7. Map of the mean (vertical) deformation velocity from 2007 to 2016 Lingang New City, as retrieved by combining the time-gapped ENV and CSK LOS displacement time-series.
Remotesensing 12 02971 g007
Figure 8. Map of RMSE between the adjusted RST-2 ground-deformation time-series and the combined ENV+CSK ground-deformation time-series at the common coherent points in the area of Lingang New City. The plots of the modeled vertical ENV+CSK deformation time-series (blue triangles), the vertical RST-2 deformation time-series (green triangles) from January 2012 to December 2013, and adjusted vertical RST-2 deformation time-series (red triangles), calculated in correspondence with the three pixels, labeled as P1, P2, and P3, respectively. The σ represents the RMSE between the modeled and adjusted time-series. The cumulative deformation at pixels P1, P2, and P3 is −118 mm, −134 mm, and −267 mm, respectively, from February 2007 to October 2016.
Remotesensing 12 02971 g008
Figure 9. Lingang New City. Map of three ocean-reclaimed zones and the location of eight boreholes (blue circles) along the profile (red line) from I to I’ considered for the presented analyses.
Remotesensing 12 02971 g009
Figure 10. Sub-soil characteristics of the Lingang New City area. (a) Scatter diagram of the absolute value of the difference between the ENV+CSK velocities and RST-2 velocities over the I-I’ profile. The average absolute value of the difference between the modeled and the measured RST-2 mean ground- deformation values were also calculated, and it equals 0.89 mm/year. (b) Plots of the ENV+CSK ground deformation velocities and the measured RST-2 ground deformation velocities over the I-I’ profile. (c) The profile of engineering geologic layers from I to I’ (refer to [47]).
Remotesensing 12 02971 g010
Figure 11. Shenzhen area results. Maps of ascending (left) and descending (right) mean deformation velocities retrieved by the ascending and descending ENV datasets. Only well-processed coherent SAR pixels exhibiting a temporal coherence larger than 0.6 were considered.
Remotesensing 12 02971 g011
Figure 12. Shenzhen area results. Maps of Up–Down (left) and East–West (right) mean deformation velocities retrieved by the ascending and descending ENV deformation time-series obtained using the MinA method.
Remotesensing 12 02971 g012
Figure 13. Shenzhen area results. (a) Map of masked Up–Down ENV deformation velocity from June 2007 to April 2010. (b) Map of Up–Down S1A deformation velocity from June 2019 to June 2020. The area within the blue curve is the reclamation area of Shenzhen.
Remotesensing 12 02971 g013
Figure 14. The plots of the ENV vertical deformation time-series (magenta circle) from June 2007 to April 2010 and the S1A vertical deformation time-series (green circle) from June 2019 to June 2020, at four points labeled as P1, P2, P3, and P4.
Remotesensing 12 02971 g014
Figure 15. The plots of the ENV (vertical) deformation time-series relative to the four pixels, labeled as P1, P2, P3, and P4, are shown. The ENV deformation time-series are plotted in pink circles, whereas the corresponding best-fit geotechnical models, logarithmic models, and exponential decay models are plotted by continuous red, green, and blue lines, respectively. The black vertical dotted lines correspond to the present stage (July 2020).
Remotesensing 12 02971 g015
Figure 16. Shenzhen area results. The difference between the estimated vertical ground deformation obtained by using the geotechnical model and the S1A vertical deformation products, from June 2019 to June 2020.
Remotesensing 12 02971 g016
Table 1. Mean RMSEs of the three zones.
ZoneMean RMSE (mm)
A1.2
B3.8
C5.6
Table 2. The vertical deformation velocities obtained by the ENV SAR data from 2007 to 2010, the vertical deformation velocities obtained by the S1A SAR data from 2019 to 2020, and the vertical deformation velocities estimated by three models from 2019 to 2020 at four pixels labeled as P1, P2, P3, and P4.
Velocity(mm/Year)\PointP1P2P3P4
ENV (2007~2010)−12.89−7.81−11.07−8.77
S1A (2019~2020)−0.13−1.62−2.97−2.11
Geotechnical Model−0.13−0.54−1.11−0.89
Logarithmic Model−1.54−1.44−1.57−1.46
Exponential Model−0.25−0.01−0.07−0.02

