Article

Studying Land Cover Changes in a Malaria-Endemic Cambodian District: Considerations and Constraints

1
Malaria Molecular Epidemiology Unit, Institut Pasteur du Cambodge, 5 Blvd Monivong, BP983, Phnom Penh 120 210, Cambodia
2
UMR Unité des Virus Emergents, UVE: Aix-Marseille Univ–IRD 190–Inserm 1207–IHU 5 Méditerranée Infection, 13005 Marseille, France
3
UMR ISEM, CNRS–University of Montpellier–IRD, F-34093 Montpellier, France
4
UMR ASTRE, CIRAD, F-34398 Montpellier, France
5
National Centre for Parasitology Entomology and Malaria Control (CNM), Phnom Penh 120 801, Cambodia
6
School of Public Health, National Institute of Public Health, Phnom Penh 120 104, Cambodia
7
Malaria: Parasites and Hosts Unit, Institut Pasteur, 28 rue du Dr. Roux, 75724 Paris, France
8
The Walter and Eliza Hall Institute of Medical Research, 1G Royal Parade, Parkville, VIC 3052, Australia
9
UMR ESPACE-DEV, IRD (IRD, Univ. Antilles, Univ. Guyane, Univ. Montpellier, Univ. Réunion), at Institut Pasteur du Cambodge, 5 Blvd Monivong, BP983, Phnom Penh 120 210, Cambodia
*
Author to whom correspondence should be addressed.
Remote Sens. 2020, 12(18), 2972; https://doi.org/10.3390/rs12182972
Submission received: 5 August 2020 / Revised: 28 August 2020 / Accepted: 1 September 2020 / Published: 12 September 2020

Abstract

:
Malaria control is an evolving public health concern, especially in times of resistance to insecticides and to antimalarial drugs, as well as changing environmental conditions that are influencing its epidemiology. Most literature demonstrates an increased risk of malaria transmission in areas of active deforestation, but knowledge about the link between land cover evolution and malaria risk is still limited in some parts of the world. In this study, we discuss different methods used for analysing the interaction between deforestation and malaria, then highlight the constraints that can arise in areas where data is lacking. For instance, there is a gap in knowledge in Cambodia about components of transmission, notably missing detailed vector ecology or epidemiology data, in addition to incomplete prevalence data over time. Still, we illustrate the situation by investigating the evolution of land cover and the progression of deforestation within a malaria-endemic area of Cambodia. To do so, we investigated the area by processing high-resolution satellite imagery from 2018 (1.5 m in panchromatic mode and 6 m in multispectral mode) and produced a land use/land cover map, to complete and homogenise existing data from 1988 and from 1998 to 2008 (land use/land cover from high-resolution satellite imagery). From these classifications, we calculated different landscapes metrics to quantify evolution of deforestation, forest fragmentation and landscape diversity. Over the 30-year period, we observed that deforestation keeps expanding, as diversity and fragmentation indices globally increase. Based on these results and the available literature, we question the mechanisms that could be influencing the relationship between land cover and malaria incidence and suggest further analyses to help elucidate how deforestation can affect malaria dynamics.

Graphical Abstract

1. Introduction

1.1. Foreword

The link between environmental variables and malaria transmission dynamics involves complex interactions, especially between vectors and land use, and its comprehension can be limited by the availability of environmental and epidemiological data. In this article, we examine methods available for understanding these interactions and discuss associated constraints. To do so, we chose to analyse land use in a malaria-endemic area of Cambodia. Based on this example, we further examine the considerations around malaria dynamics linked to anthropization in data-scarce conditions and potential methodologies for understanding vector exposure and its interaction with land use.

1.2. Background

Conflicting reports exist on the effect of deforestation on the transmission of vector-borne diseases [1]. This heterogeneity likely arises from the complexity of vector-borne disease transmission that involves numerous environmental, biological and ecological factors [1]. Modifications to the environment, such as changes in land use and deforestation, greatly alter the density and activity of mosquito populations and as a result the dynamics of associated diseases [2,3].
As malaria is a vector-borne disease, its transmission is closely tied to the environment [4,5]. Deforestation greatly alters the breeding, abundance and species composition of Anopheles malaria vectors [5,6]. This is mediated by changes in the availability of breeding sites for the immature stages [7], as well as differences in resources, predation [8,9], survival [10], fecundity [10] and ecological community structures [7]. These factors are known to affect vector species quantitatively more so than nonvector species [1]. Deforestation and associated phenomena, such as forest fragmentation, have also been associated with greater contact between sylvatic mosquito vectors and human hosts [7,11,12,13]. Indeed, deforestation does not only imply the loss of forest cover but also has an impact on landscape heterogeneity and diversity. Heterogeneity represents the repartition, abundance and size of the different habitat patches within a landscape. Heterogeneity can be affected by fragmentation, the process of a homogenous patch of habitat evolving into smaller and disjoined patches [14]. Another aspect of deforestation is landscape diversity, which corresponds to the proportion of patches from different classes. Usually as deforestation expands, it is replaced by agricultural land or left vacant, increasing landscape diversity [15]. A potentially associated phenomenon is the loss of biodiversity [16], which can be associated with higher malaria burden [17,18] through the decline of the “dilution effect” [19,20] though this theory remains controversial [19,21]. Overall, even with variations among ecological groups and individual species [22], extensive anthropization substantially impacts malaria dynamics [17].

1.3. Malaria and Deforestation

Many studies have investigated the link between deforestation and malaria using remote sensing and landscape analyses. A study that analysed data from 67 nations showed that in developing nations, at country level, a higher deforestation rate is associated with a higher malaria burden [2]. However, this is only a general trend based on global measurements of deforestation using FAO estimates of natural forest areas [2] and may not be valid for all countries. At a more local scale, in the Peruvian Amazon, processed 30-m Landsat imagery showed that deforestation favoured malaria transmission by increasing Anopheles darlingi human biting [23]. Furthermore, a controversial publication stated that forest conservation efforts in the Brazilian Amazon could increase malaria burden in humans, based on an annual estimation of forest cover from Landsat imagery [24]. The study found a correlation between greater forest cover in a 20-km radius around cities and higher number of reported malaria cases [24]. However, to perform this analysis, some data was excluded and part of the land use data was too approximate, i.e., land cover classes associated to different malaria risk were aggregated. Consequently, the publication was criticized as this methodology could result in potential ecological fallacies [25]. In a local study in Thailand, land use maps were produced with photointerpretation and their landscape indices were computed, which allowed to confirm that the primary malaria vectors, Anopheles maculatus and Anopheles minimus, were more abundant in forests than in agricultural landscapes [26]. Interestingly, a recent report has demonstrated a feedback loop between malaria incidence and deforestation in the Brazilian Amazon whereby forest loss is associated with an increase in malaria incidence, and this increase, in turn, leads to a decrease in the rate of deforestation. The different geographic scales and the quality of land cover data, ranging from global estimates of forest area to precise mapping at high spatial resolution, are important parameters. In addition, studies based on spatial correlations do not indicate cause and effect relationships. Some studies using aggregated data, at a scale including whole jurisdictions rather than population or vector scale, can be subject to biases and ecological fallacies [27]. Publicly available forest cover maps usually have a resolution of 20–30 m, typical of LANDSAT imagery [28,29].

1.4. Issues When Studying the Relationship between Deforestation and Malaria

To produce a land cover classification, a variety of methodologies can be used. Numerous remote sensing sources are available, and their classification can either be automated, supervised or manual, or even done by photointerpretation—all these options are applicable from a wide panel of different software [30,31]. Choices made regarding the methodology, landscape indices or analyses all influence the interpretation of results. Additionally, interpretation can be impacted by the oversimplification of the vector-borne disease paradigm as described in the analyses [1]. Nevertheless, a meaningful analysis of deforestation and associated human risk is fundamental to contribute to the malaria effort.
The link between deforestation and malaria risk in South-East Asia (SEA) has not been completely elucidated [11]. Indeed, the complexity of this linkage arises from the many different vectors adapted to forest or deforested areas, with populations in a steady, close contact to the forest, unlike other malaria-endemic parts of the world [11]. On one hand, deforestation could decrease malaria risk by limiting the availability of vector habitats, thus reducing the abundance of primary vectors [11]. Conversely, deforestation may increase malaria transmission as it encourages contact with primary vectors and induces higher densities of secondary vectors that are often more adapted to deforested areas [32]. Additionally, malaria risk depends on deforestation effect or edge proximity, more than the forest extent. Therefore, intense deforestation can lead to higher fragmentation indices and then augmented malaria transmission. The socioeconomic effects of deforestation also impact malaria risk. Notably, newly arrived low-immunity populations that settle in deforestation sites, with high exposure to vectors but potentially no access to appropriate prevention tools or health services, along with possibly higher transmission due to increased parasites densities [33]. Though, higher wages arising from deforestation profit can allow better vector prevention in these populations [33,34].
Another difficulty lays in the various temporal and spatial scales needed in the analysis of the interaction between forest cover change and malaria dynamics [35]. For example, the Amazon Basin is characterized by frontier malaria [36], where deforestation often takes place for farming and mining, with new populations settling in and creating an environment with high malaria risk in the first years of colonization. The process was shown to be transitory, as social and economic factors eventually cancel out environmental effects, decreasing malaria incidence, usually after 6–8 years [36]. A recent analysis on malaria prevalence, deforestation, land cover, environmental, sociodemographic, health services accessibility and housing data on individuals’ data from 17 sub-Saharan countries showed that their “aggregate and survey wave-specific results imply the absence of a geographically generalizable relationship between deforestation and malaria, and between forest cover and malaria, across the countries studied.” These results suggest that Africa’s deforestation effects likely differ from Asia’s and Latin America’s [33]. Overall, the SEA paradigm is complex, not yet completely defined, and likely differs from situations described in Africa and the Americas [11].

1.5. Situation in Cambodia

In Cambodia, the decline in malaria cases has come to a halt, and the estimated number of malaria cases has been increasing since 2017 [37]. The rise in case numbers could be attributed to the emergence of various resistant [38,39] and multiresistant [40] Plasmodium falciparum strains in the last decade, although these are not the only obstacles in the way of malaria elimination. Substandard clinical practices [41] and vector resistance to insecticides [37] may also contribute to the persistence of malaria.
The main malaria vectors are classically considered to be An. dirus and An. minimus, usually found in forest and forest fringes [42,43], and to a lesser extent An. maculatus which is associated with hilly and mountainous areas [44]. The larval stages of An. dirus are typically found in small sites, such as streams, ditches, dips and prints in the ground, whereas An. minimus’ larvae can be found in small natural sites (pools and streams) or large man-made ones (notably rice paddies). An. maculatus’ larvae are found in a variety of environments; small or large, man-made or natural sites [42], limiting the effectiveness of landscape analyses to link mosquito risk to standing water.
In Cambodia, forests and their fringes are the primary contact sites for human and vector populations, making forest activities the most important malaria risk factor [45,46,47], with a disease often referred as ”forest malaria.” Thus, the primary at-risk population corresponds to the forest goers that spend a lot of time in and around the forest [48]. However, literature lacks exhaustive and recent data about mosquito ecology and precise epidemiology in Cambodia. Indeed, a substantial gap exists in vector ecology data compared to other parts of the world, notably due to the high diversity of vector species exhibiting a large spatial heterogeneity in distribution and behavioural patterns both between and within species [42,44]. In addition, the type of forest, and notably the distinction between primary and secondary forests, or even between plantation forest and natural forest, is not explored in available studies. Compared to other parts of the world and notably the Amazon, investigations in Cambodia are limited by the absence of detailed data about vectors and epidemiology of the disease, but also by other constraints, such as the difficulty to gather prevalence data over time. The Khmer Rouge regime in the seventies has had a long-lasting influence on the country and prevented the collection of any kind of malaria prevalence records [49]. A national malaria information system was developed in 2009 to gather prevalence data from health centres. In 2013, a network of village malaria workers was implemented to improve malaria detection and treatment access at the village level [50]. Additionally, private health practitioners that are allowed to treat uncomplicated malaria cases are widely spread across the country, although cases are not always reported to the national information system [51]. Overall, an aggregated and homogenous malaria dataset is not available in Cambodia and exhaustive malaria prevalence data at a fine scale is difficult to obtain, increasing the challenges when it comes to studying the disease. In this data-scarce environment, we can assess trends, formulate hypotheses and suggest methods adapted to this specific context. However, the lack of homogenous, small-scale data reduces the possibilities of further analysis.
As deforestation progresses in Cambodia and induces drastic landscape changes [52,53], effects on malaria transmission are to be expected. The alarming deforestation rate is predominantly caused by large land concessions where companies buy large plots of land to make way for agriculture [52]. In particular, this has been observed in the north-eastern province of Mondulkiri. This situation highlights how short-term economic plans lead to long-term impacts on environment stability and are already threatening forest sustainability [52]. Local communities engage in deforestation through “slash and burn” methods (Figure 1), allowing them to extend their agriculture parcels [47]. Another form of forest exploitation that occurs at a slower pace is “selective logging,” where forest goers search for and cut down specific trees without affecting the surrounding trees. This form of deforestation is more difficult to keep track of, particularly by remote sensing [54]. Beneficial effects have been observed from allowing local communities to own and manage nearby forests, compared to large land concessions [55]. Community forests had higher forest cover persistence and lower rates of forest cover loss [55].

1.6. Objectives

This article aims to discuss methodologies and constraints associated with studying land cover changes and malaria dynamics using Cambodia as a case study. Available data is used to investigate trends in malaria prevalence over time and space, at country and provincial levels. In addition, we use high resolution satellite imagery of a chosen malaria-endemic area to produce land use/land cover maps from 2018, completing available classifications from 1988 and from 1998 to 2008 of the same locality. Based on these classifications, we quantify land use and land cover characteristics and modifications over these three decades. From the results of this study, we provide insight about appropriate study scale, satellite imagery treatment, landscape metrics interpretation and adapted statistical analysis in such a context and discuss their limitations.

2. Materials and Methods

2.1. Considerations for Methodological Choices
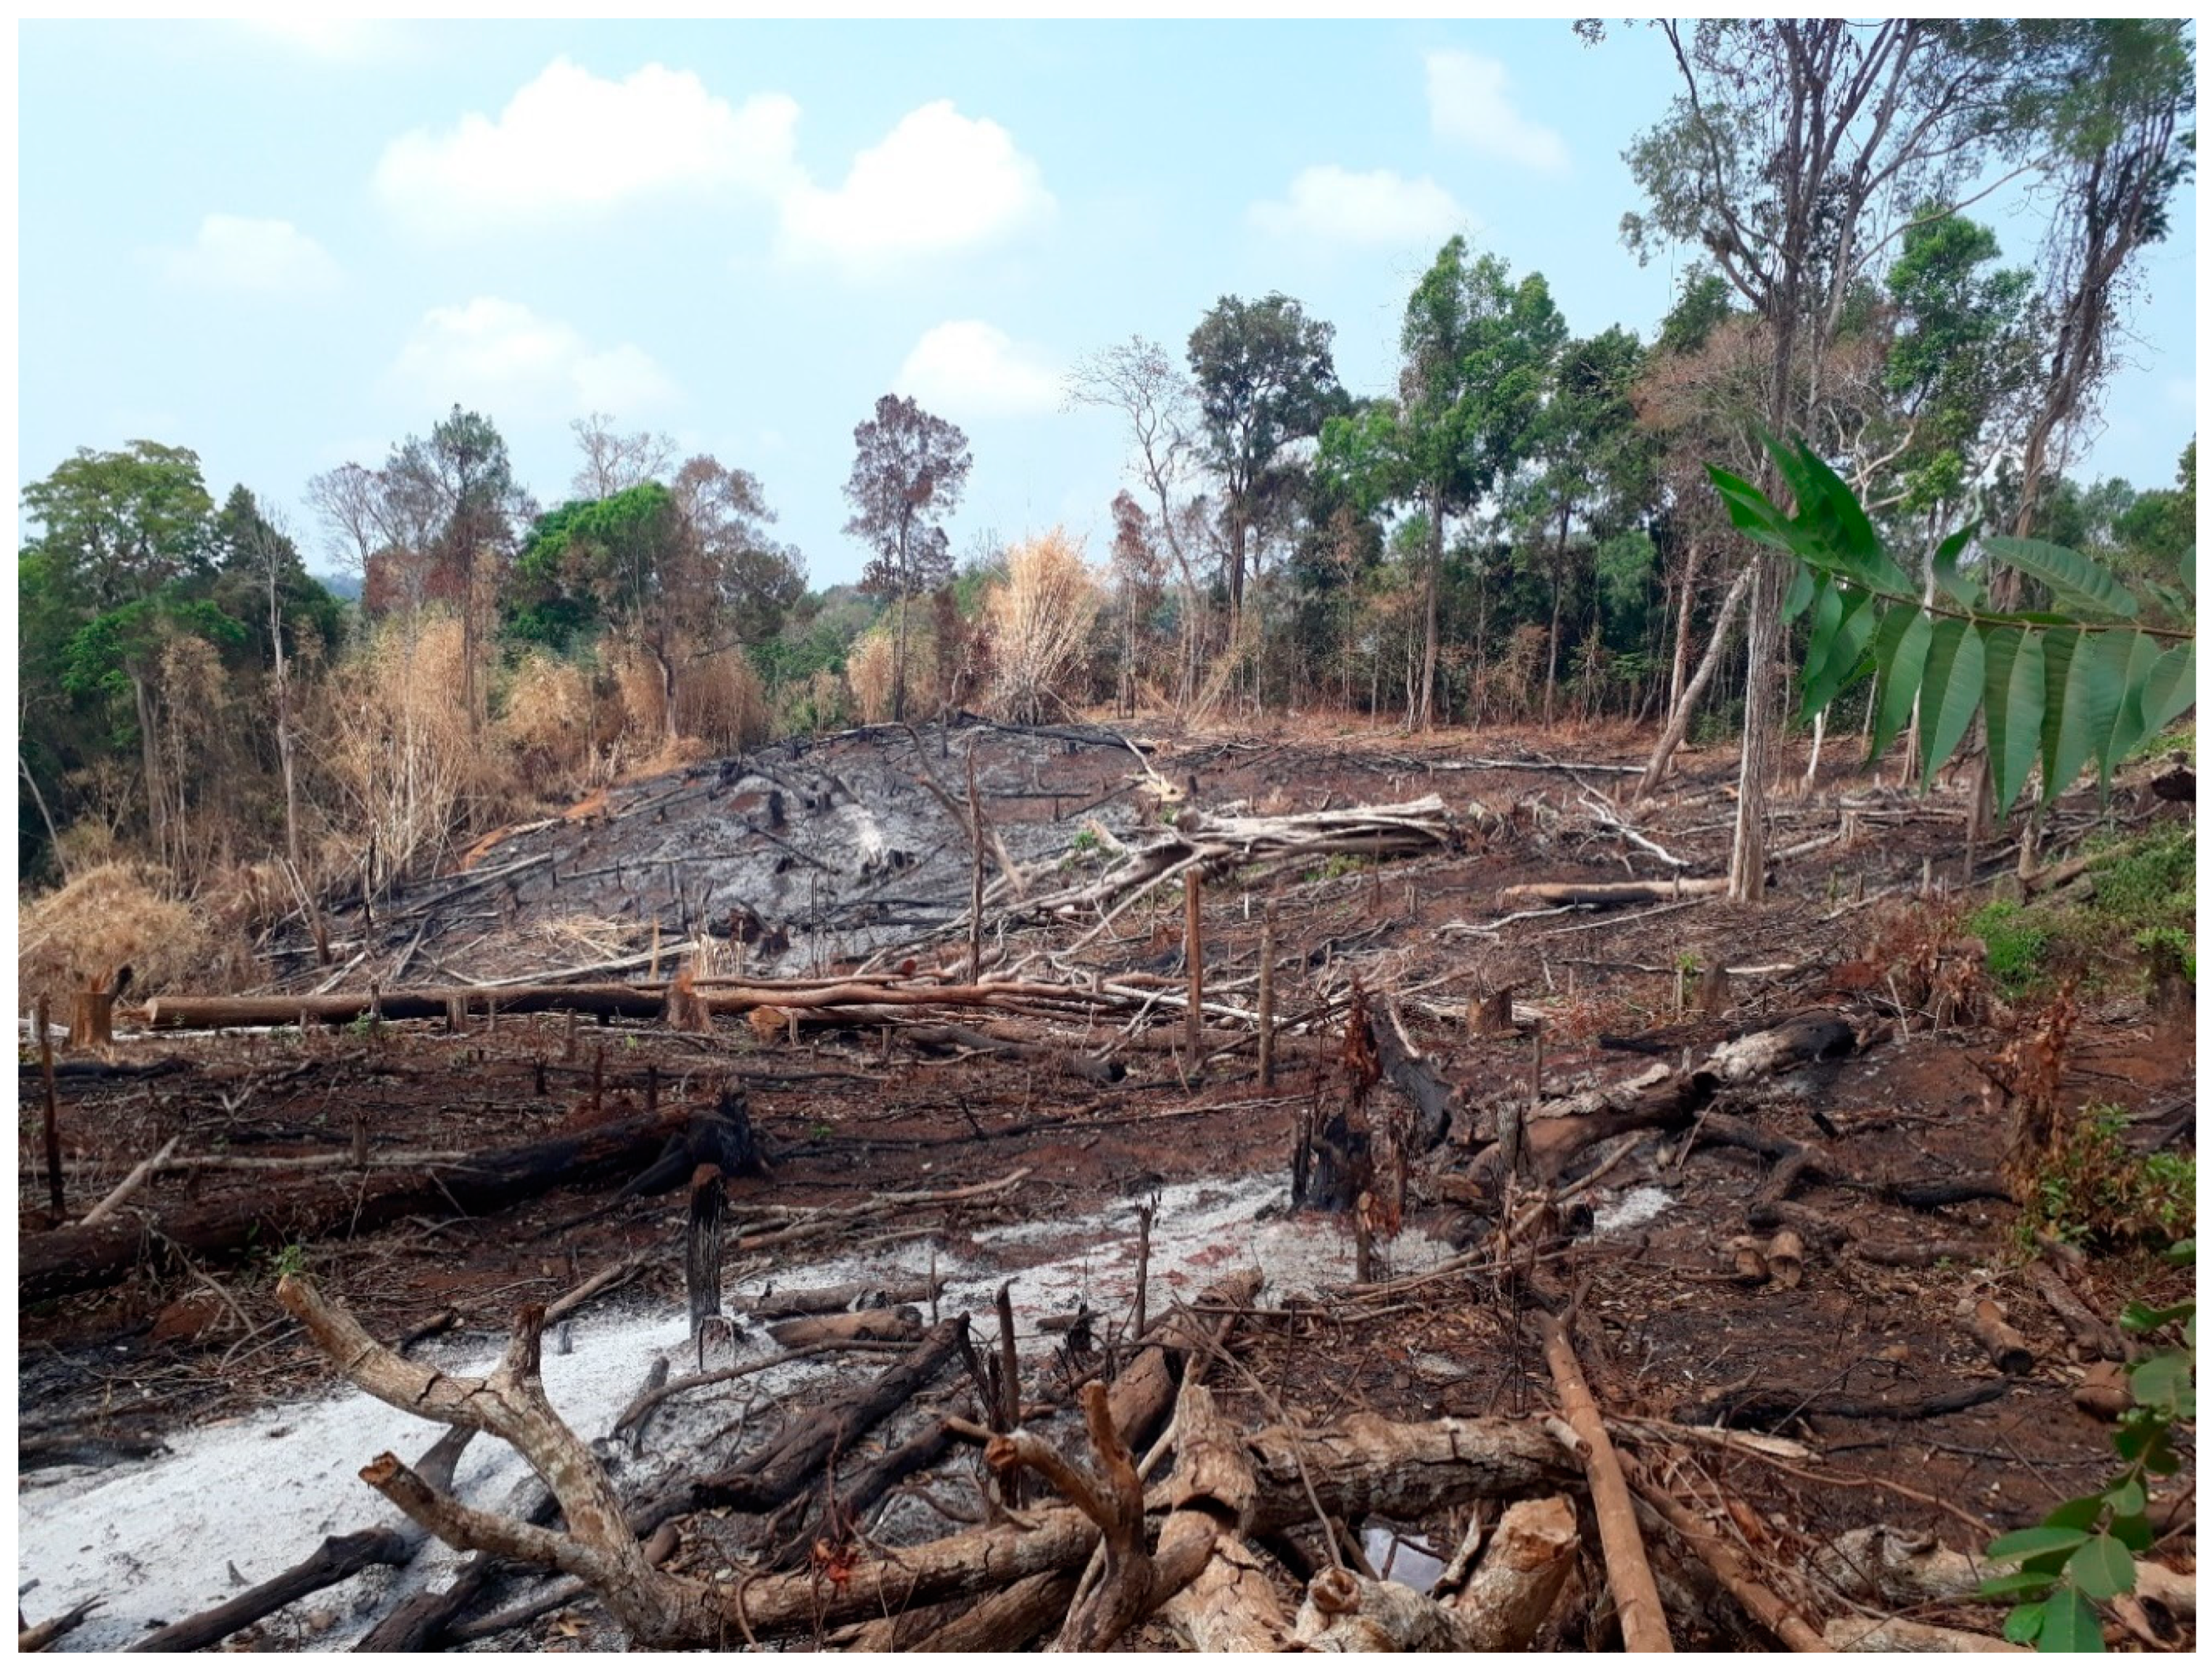
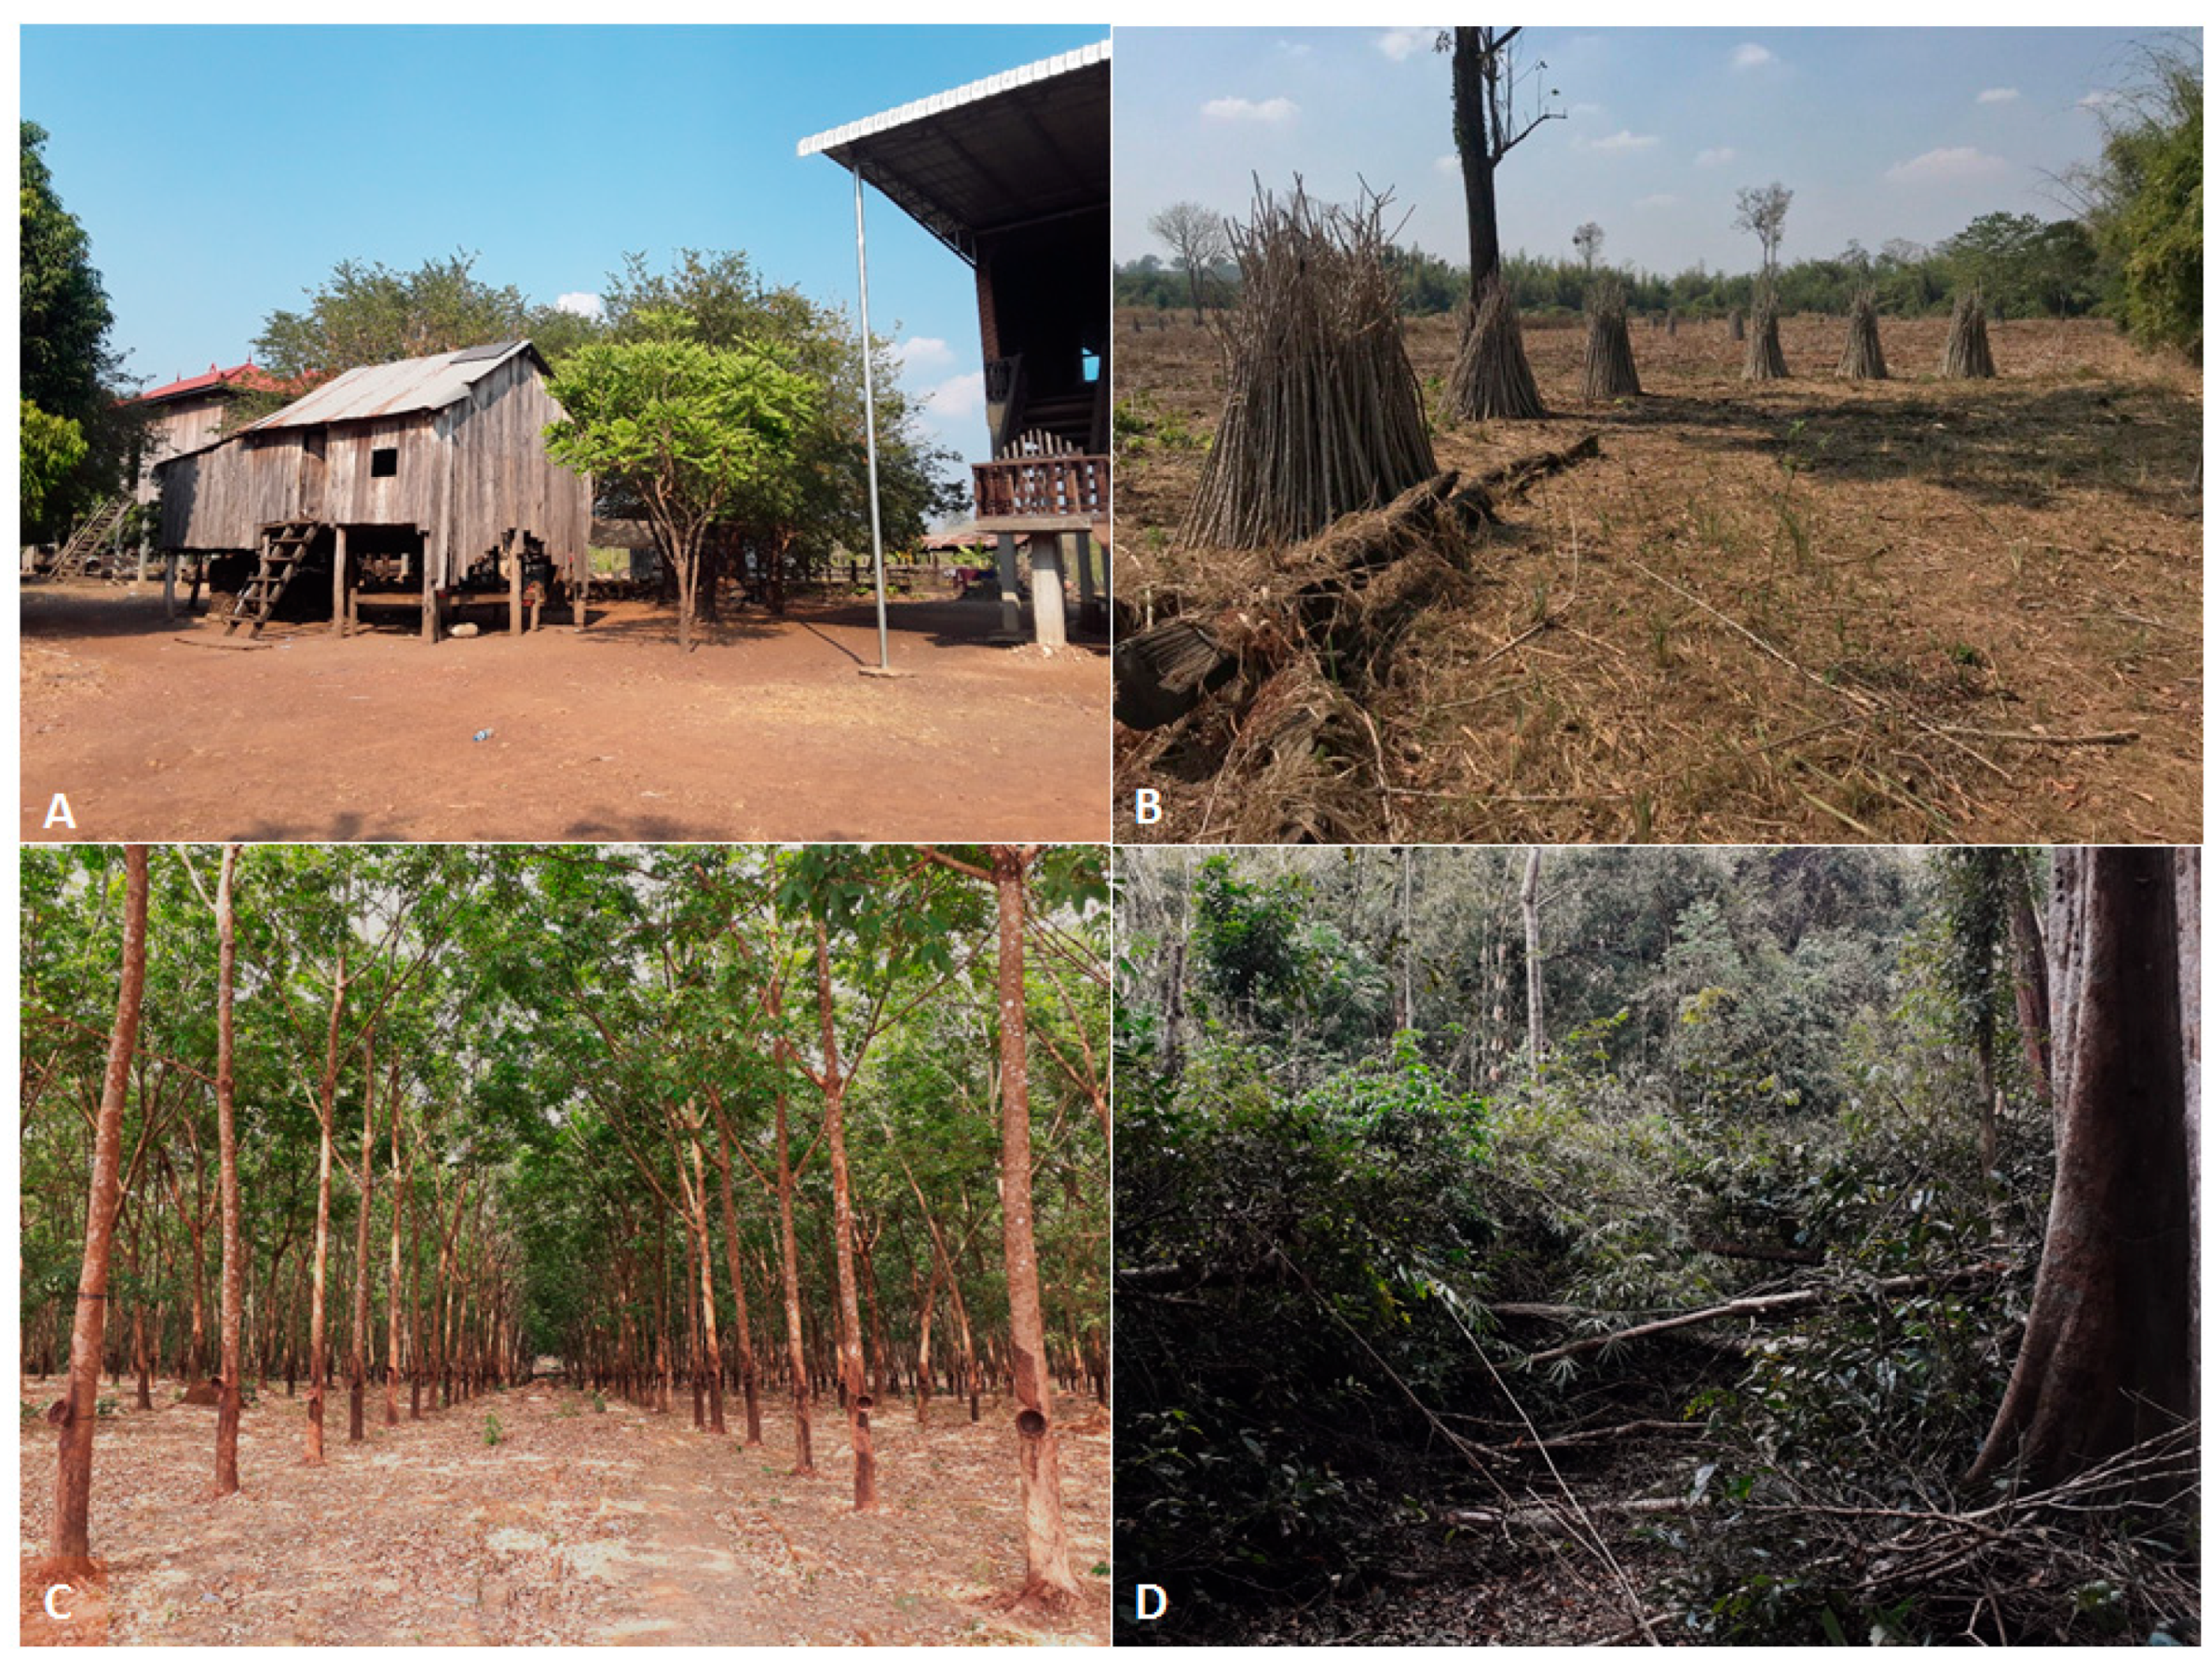
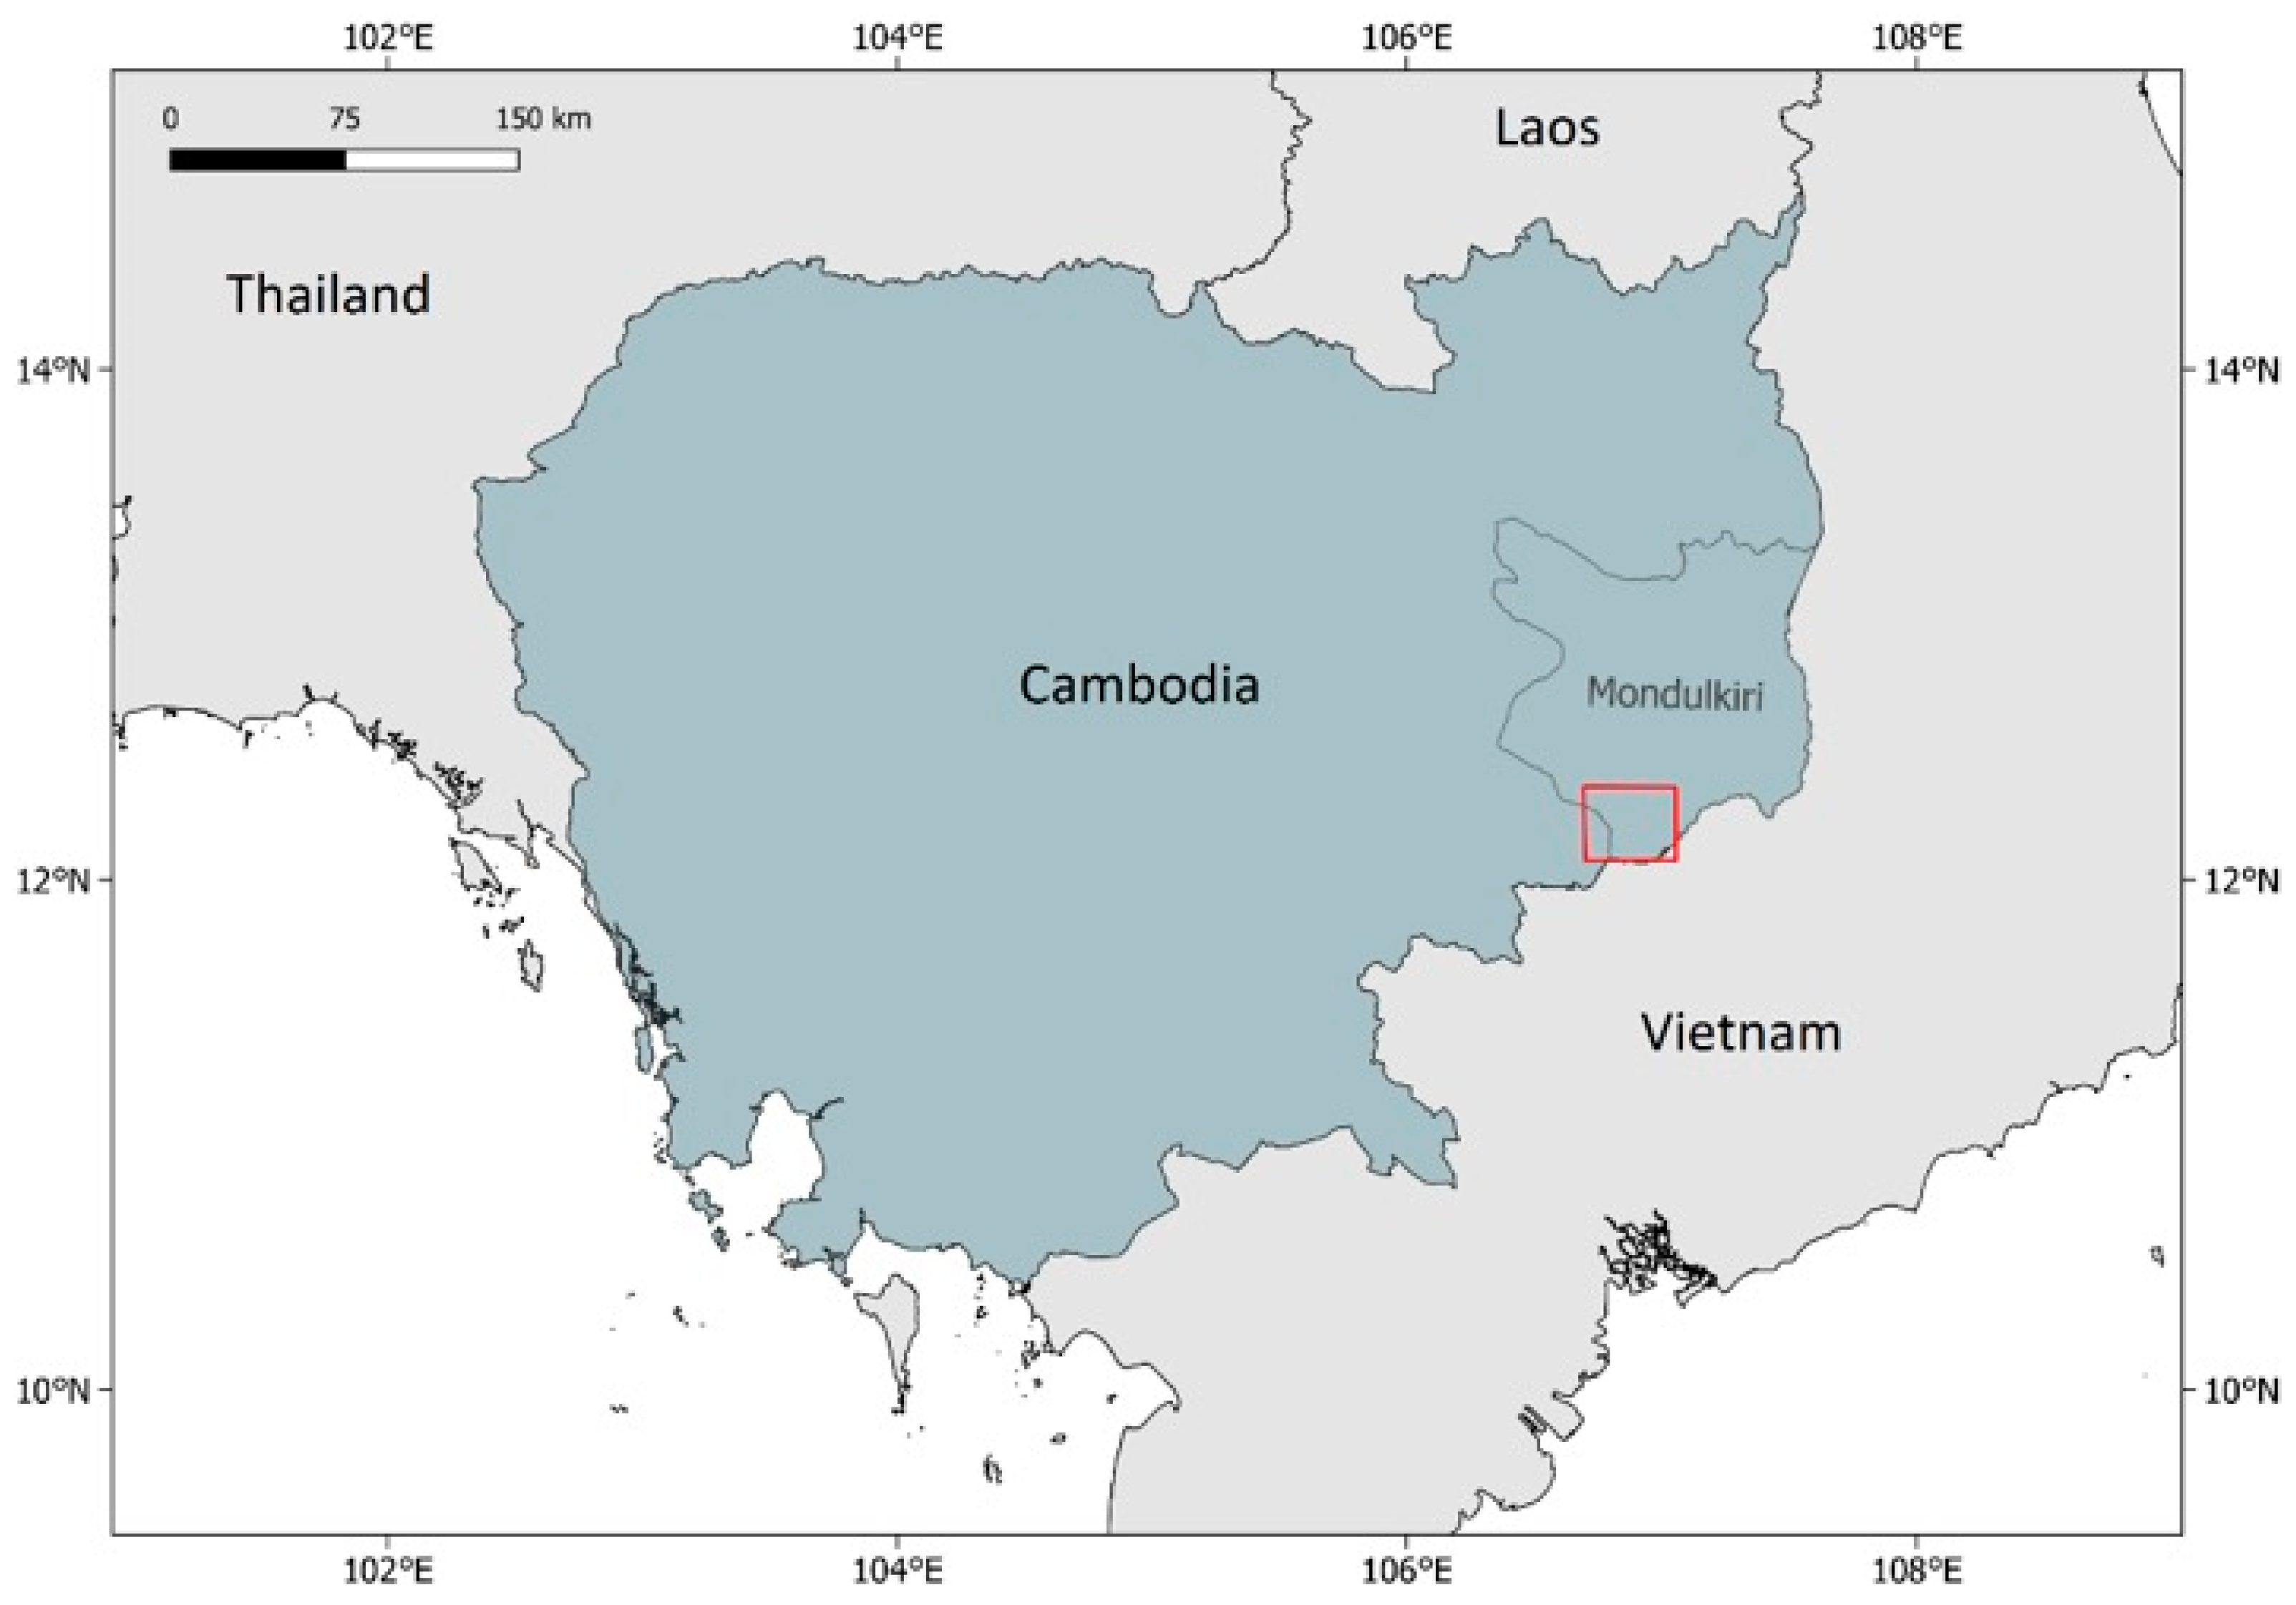
To understand malaria vector ecology, land use/land cover classes and study scales need to be carefully determined. Rather than taking a “traditional” approach to land use classification where a high number of classes are defined, a simpler, more easily attainable classification could better depict Anopheles ecology by grouping environments into classes based on their relevance to malaria transmission. Forest is highlighted as the most important risk area in Cambodia as this is the main habitat of malaria vectors [45,46,47]. Appropriate land use classes include forest, plantations, fields and built-up areas (Figure 2). Forest can include any type of primary or secondary forest cover that is high and dense enough to form a canopy. Separating plantations, referring to tree plantations (notably Hevea sp., Musa sp. and Anacardium sp.) from forests can be beneficial because malaria risk in those environments differs from that in forests. However, if plantations are separated from forests, they can also be separated from other agricultural areas, as plantations in Mondulkiri have a substantial higher malaria risk in comparison to other kind of crops [56]. Agriculture areas that are not trees, such as rice paddies or cassava fields, should ideally correspond to another class, defined in this study as “Fields.” Lastly, built-up areas stand out as lands that are irreversibly urban in character (houses, buildings, roads, etc.).
Scale is also an important parameter to consider; as seen from previous publications, using insufficient resolution or inappropriate scale can lead to fallacies or misinterpretations [27]. To select the optimal scale for analysis, several parameters must be known or estimated, such as the extent of the human and mosquito populations’ mobility. Flight distance of Cambodian vectors remains hypothetical. A study in Malaysia showed that An. maculatus’ flight distance could reach 1.6 km [57], but this parameter remains undetermined for the other vectors. Consequently, with such limited knowledge, the minimal resolution needed for delimitating all potential habitat patches for vectors is speculative and dispersal capacity of malaria vectors in the Cambodian context cannot be estimated.

2.2. Study Site

We chose a study area in north-eastern Cambodia where the incidence of malaria is high and the rate of deforestation has been fast. We also had the opportunity to choose an area where deforestation had been previously studied, in 1988 and 1998 and 2008 [53], which gave us the chance to update the situation 10 years later. The study site spans 32 km from north to south and 39 km from west to east, within Kaev Seima district, in Mondulkiri province (Figure 3). The population is mostly engaged in agriculture, notably cassava, rice, cashew nut and rubber production. Forest activities, such as wood logging and hunting, are part of daily life. Families spend nights at their huts if work requires them to and these huts are typically located in open areas, cultivated areas or forest.

2.3. Malaria Data

At national level, the estimated number of malaria cases in Cambodia was gathered from the latest annual WHO World Malaria Reports from 2019 [37]. The values from a single report were preferred rather than aggregating data from various sources. At a provincial level, the CNM (National Centre for Parasitology Entomology and Malaria Control) has provided data on malaria incidence from Mondulkiri since 2008 (Dysoley, personal communication). Long-term, provincial-level prevalence data is difficult to access in Cambodia and data prior to 2008 could not be retrieved. District data was too miscellaneous to be presented.

2.4. Satellite Imagery and Processing

In order to compare recent land use with that of the former study, we chose to acquire images in 2018. In the former study, different spatial resolutions were used, the SPOT1 images from 1988 to 1998 having a 20 m resolution and the SPOT5 image from 2008 having a resolution of 2.5 m for panchromatic mode and 10 m for multispectral mode [53]. The land use/land cover maps were produced using object-based image analysis with eCognition software. Since we could not access this software, we chose to describe the 2018 land use/land cover by photointerpretation using the same classes. This method, simple to set up but time consuming, allowed us to find objects that are homogeneous from the point of view of their pixels but with fine contours for comparison with other classifications. This required the acquisition of high spatial resolution images. Therefore, the GEOSUD Equipex project provided SPOT 6/7 satellite images of the study area (© Airbus DS 2018) acquired between 8th and 28th of March 2018. These images have a high spatial resolution of 1.5 m for panchromatic mode and 6 m for multispectral mode. Cloud-free images were chosen as much as possible.
The objective of the 2018 classification was to find the three main classes that allowed for comparisons of the former classifications: forests, plantations, fields and built-up areas. For the purpose of future studies, we chose to separate wooded areas into forests and plantations. We produced the 2018 land use/land cover map by photointerpreting the satellite images, displayed in true colours using GIS software. We used QGIS software (QGIS Development Team, 2020. QGIS Geographic Information System v3. Open Source Geospatial Foundation Project. qgis.osgeo.org) and SavGIS software (Souris M., 2020. SavGIS Geographic Information System v9. www.savgis.org).

2.5. Ground Truthing and Accuracy Measurement

A ground truth survey was conducted to assess the accuracy of the 2018 land use/land cover map. In the field, a minimum of 32 locations for each class were randomly described. We used the Locus Map (www.locusmap.eu) Android application in order to use a Google Earth background and GIS vector information to better visualize the environment once in the field. This also allowed us to place description points in the middle of the environments (the phone provides the GPS location and the recorded point can be shifted to the location described). These records were imported into QGIS and compared to the land use classification. We computed a confusion matrix and calculated the overall accuracy and the Kappa index to assess the classification accuracy [58].

2.6. Comparison between Maps and Landscape Metrics

In order to compare the 2018 map with those produced from 1988 and between 1998 and 2008, the “Forests” and “Plantations” classes were merged into a single class defined as “Wooded areas.” This step allowed us to incorporate the land use data from 2018 into the dataset built from 1988 and between 1998 and 2008, adding a temporal scale to the spatial observation of the area. We then clipped the extent of all the raster maps at their intersection, in order to compute indices over the same frame of the widest area possible.
To reflect landscape diversity and its evolution since 1988, we computed the same landscape indices over the three decades. These indices are: Shannon’s Diversity Index (SHDI) [59], Simpson’s Diversity Index (SIDI) [60], Edge Density (ED) and Patch Density (PD) at landscape level for all classes. SHDI and SIDI quantify diversity, whereas patch and edge density indices can be interpreted as fragmentation indices quantifying heterogeneity. SHDI, the most popular diversity index, is used as a relative index for comparing different landscapes or the same landscape at different times [61]. SHDI increases as the number of different patch types (i.e., patch richness) increases and/or the proportional distribution of area among patch types becomes more even. SIDI is another popular diversity measure that is less sensitive to the presence of rare types. Specifically, the SIDI value represents the probability that any two cells selected at random would be different. Thus, the higher the value, the greater the likelihood that any two randomly drawn cells would have different values. As SIDI is a probability, it can be interpreted in both absolute and relative terms. SIDI reaches 1 as the number of different patch types (i.e., patch richness) increases and the proportional distribution of area among patch types becomes more equitable [61]. Additionally, the percentage of landscape that belonged to each land use category was computed at a class level.
Once all classifications from 1988 to 2018 were produced and homogenised, the landscape metrics mentioned above were calculated using FRAGSTATS software (McGarigal, Cushman, and Ene, 2012. FRAGSTATS v4: Spatial Pattern Analysis Program for Categorical and Continuous Maps. www.umass.edu/landeco/research/fragstats/fragstats.html).

3. Results

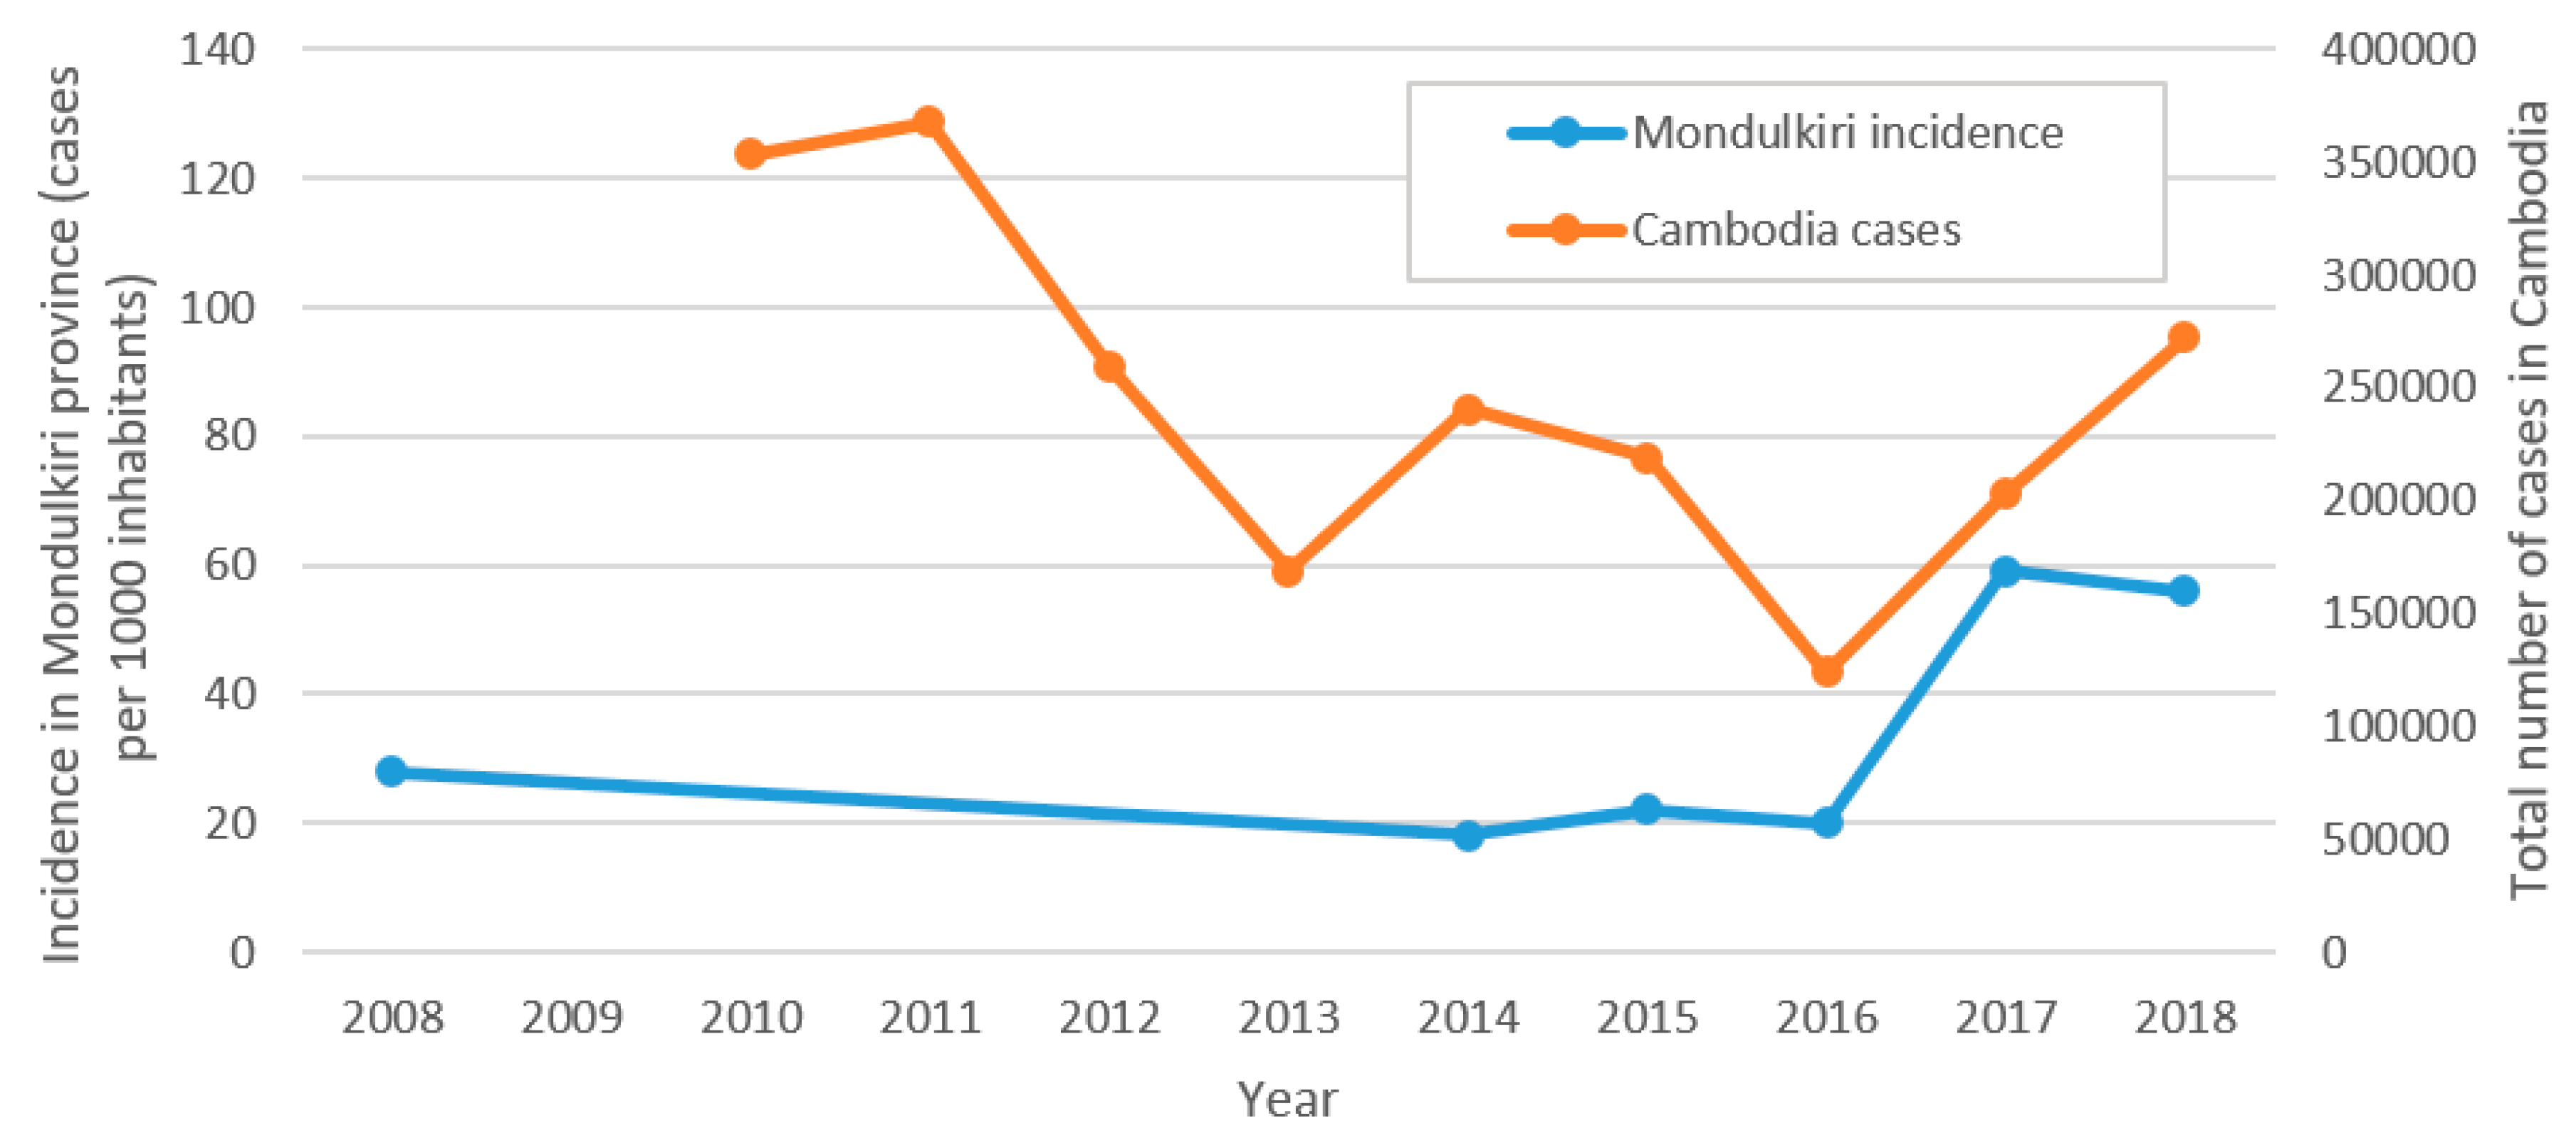
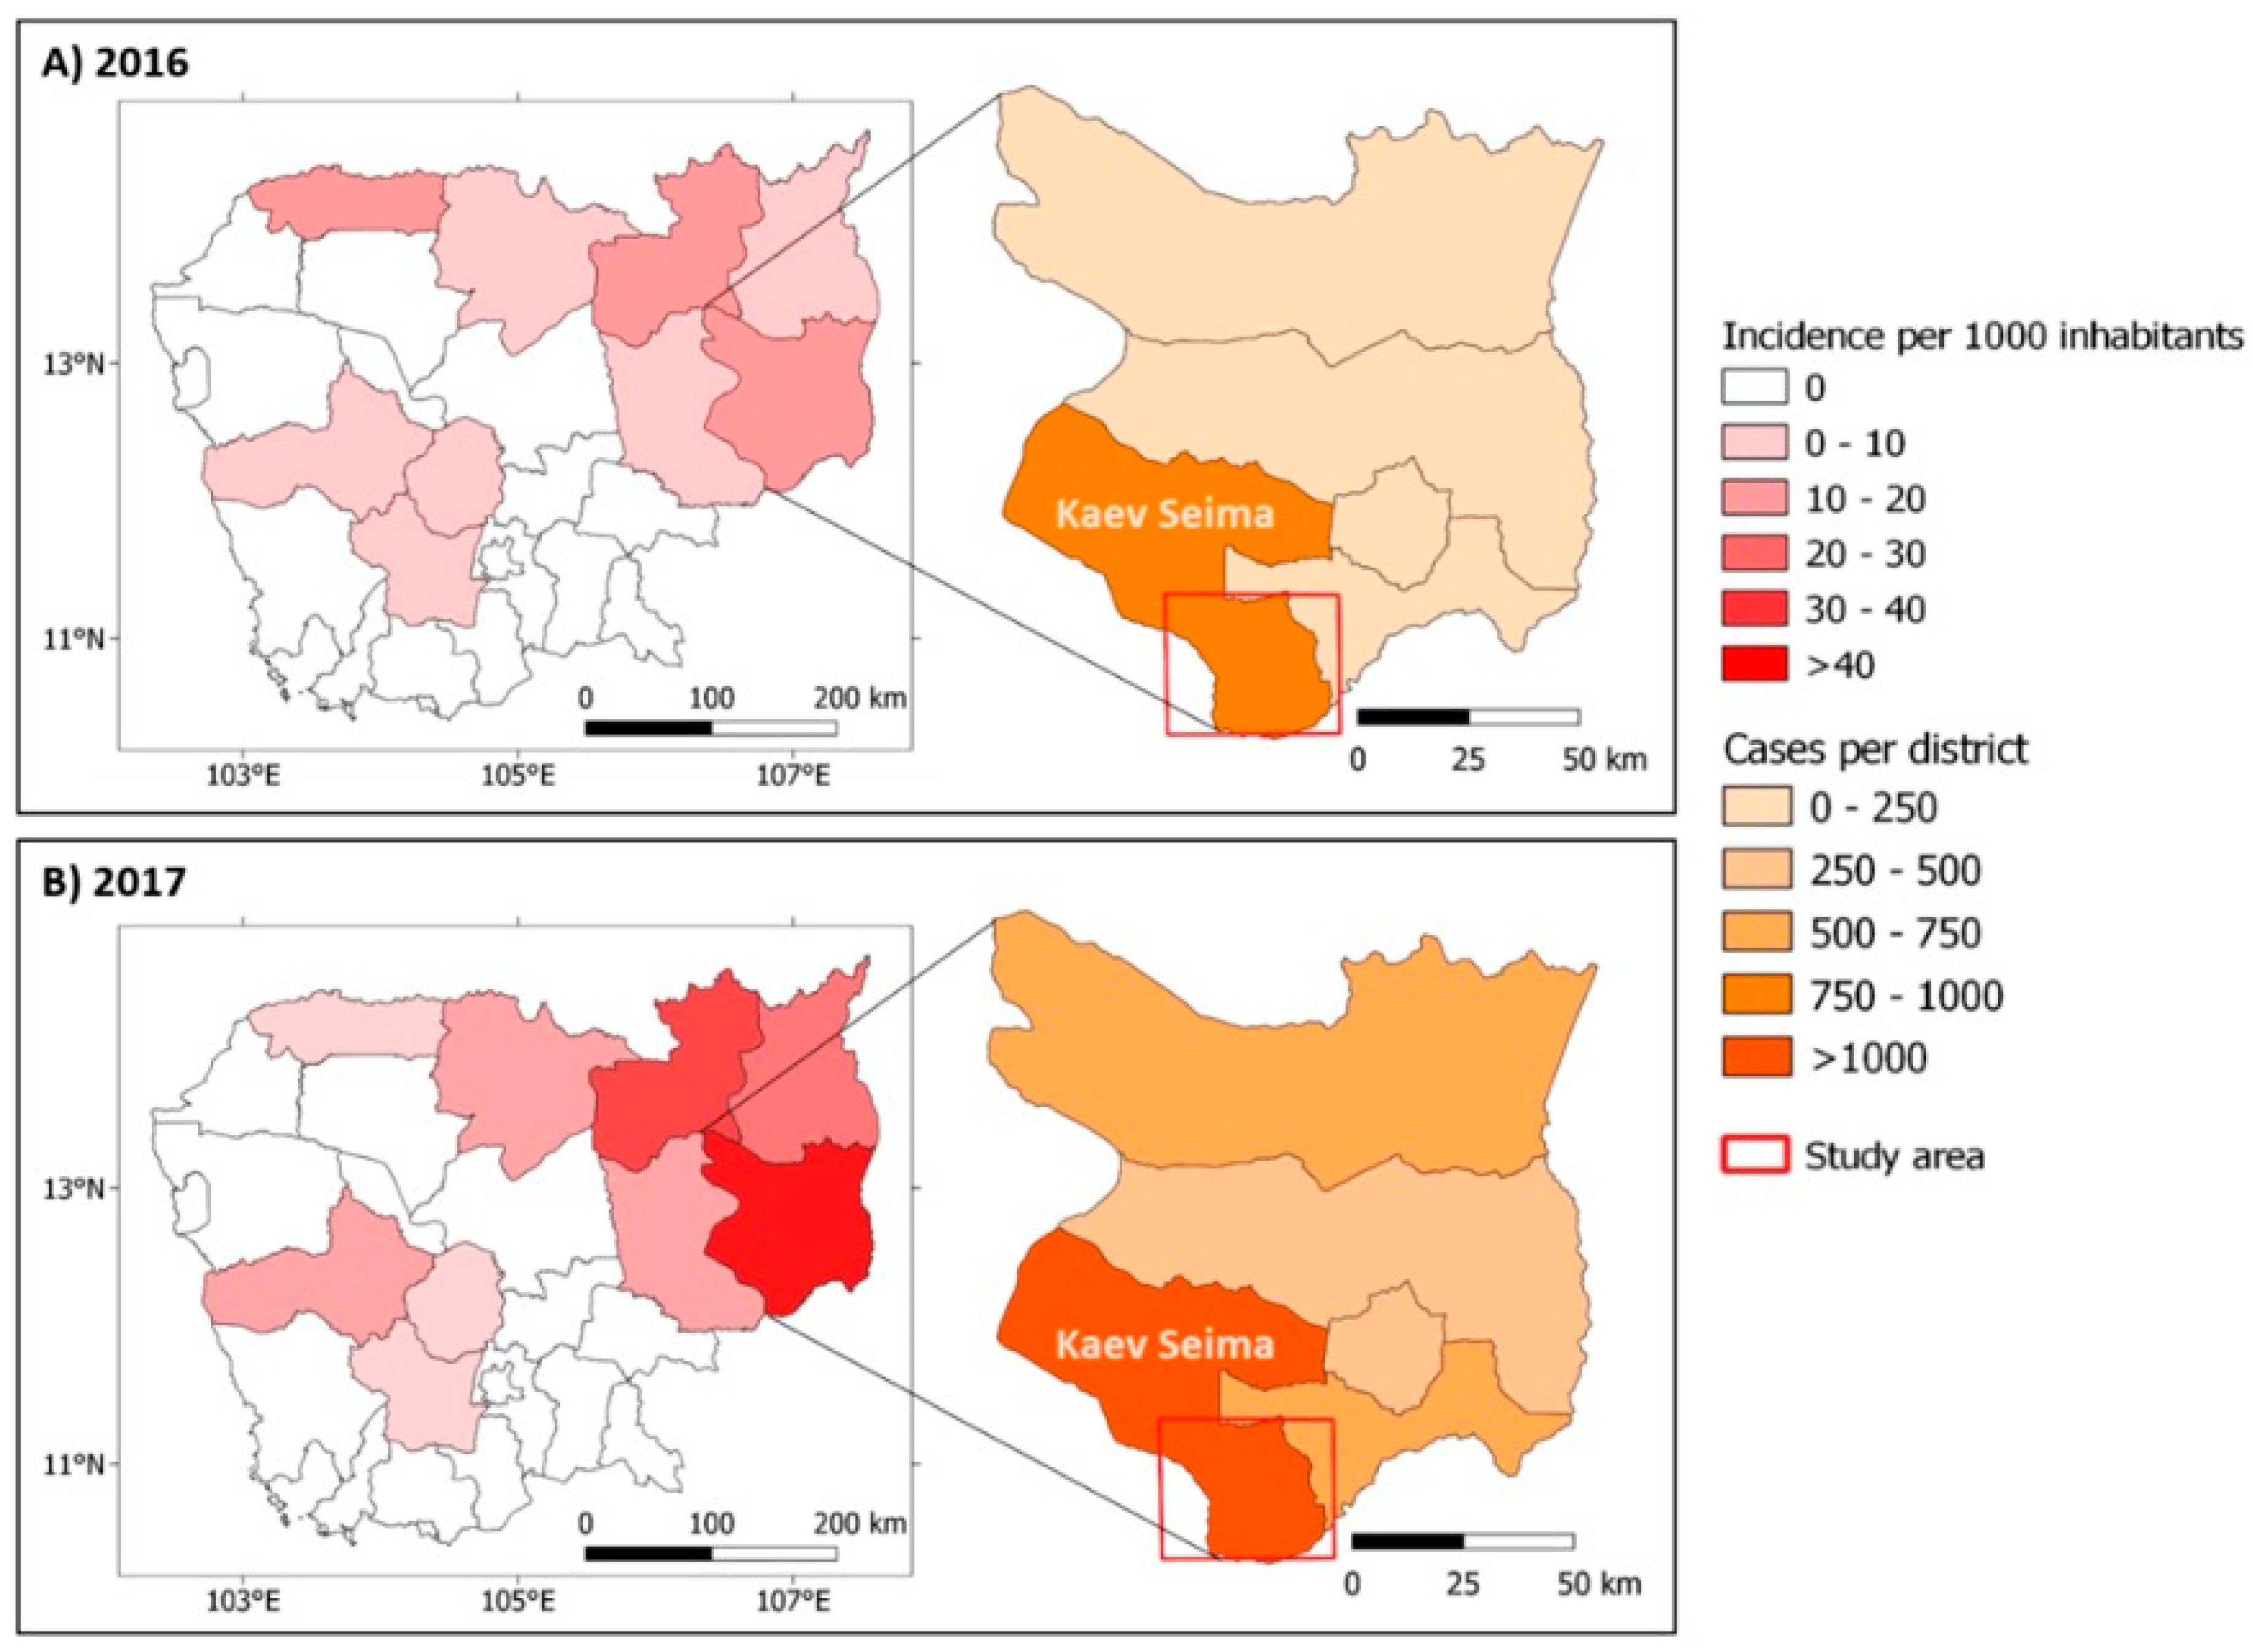
3.1. Malaria Situation in Mondulkiri Province

Although malaria control efforts achieved a diminution of estimated cases in Cambodia until 2016 (124,137 cases or 8 per 1000 inhabitants), a sharp increase occurred in 2017 and 2018 (202,696 cases or 13 per 1000 inhabitants, and 272,272 cases or 17 per 1000 inhabitants, Figure 4) [37]. In Mondulkiri, malaria incidence was stable from 2008 to 2016, ranging from 18 to 28 cases per 1000 inhabitants. The incidence tripled in 2017 and 2018, reaching 59 and 56 cases per 1000 inhabitants, respectively (National Centre for Parasitology Entomology and Malaria Control, unpublished data).
From the available CNM data, Mondulkiri had a malaria prevalence of 17.2‰ in 2016 and 52.3‰ in 2017, while prevalence in other provinces ranged from 1.4‰ to 11.95‰ in 2016 and 2.8‰ to 34.1‰ in 2017, indicating that Mondulkiri experienced the highest malaria burden out of all the Cambodian provinces from 2016 to 2017 (Figure 5). Within Mondulkiri, the Kaev Seima health centre registered the highest number of malaria cases in 2016 and 2017 reporting 839 and 1669 cases, respectively. Comparatively, the average number of malaria cases reported in other districts was 134 and 505 cases per year per health centre in 2016 and 2017, respectively.

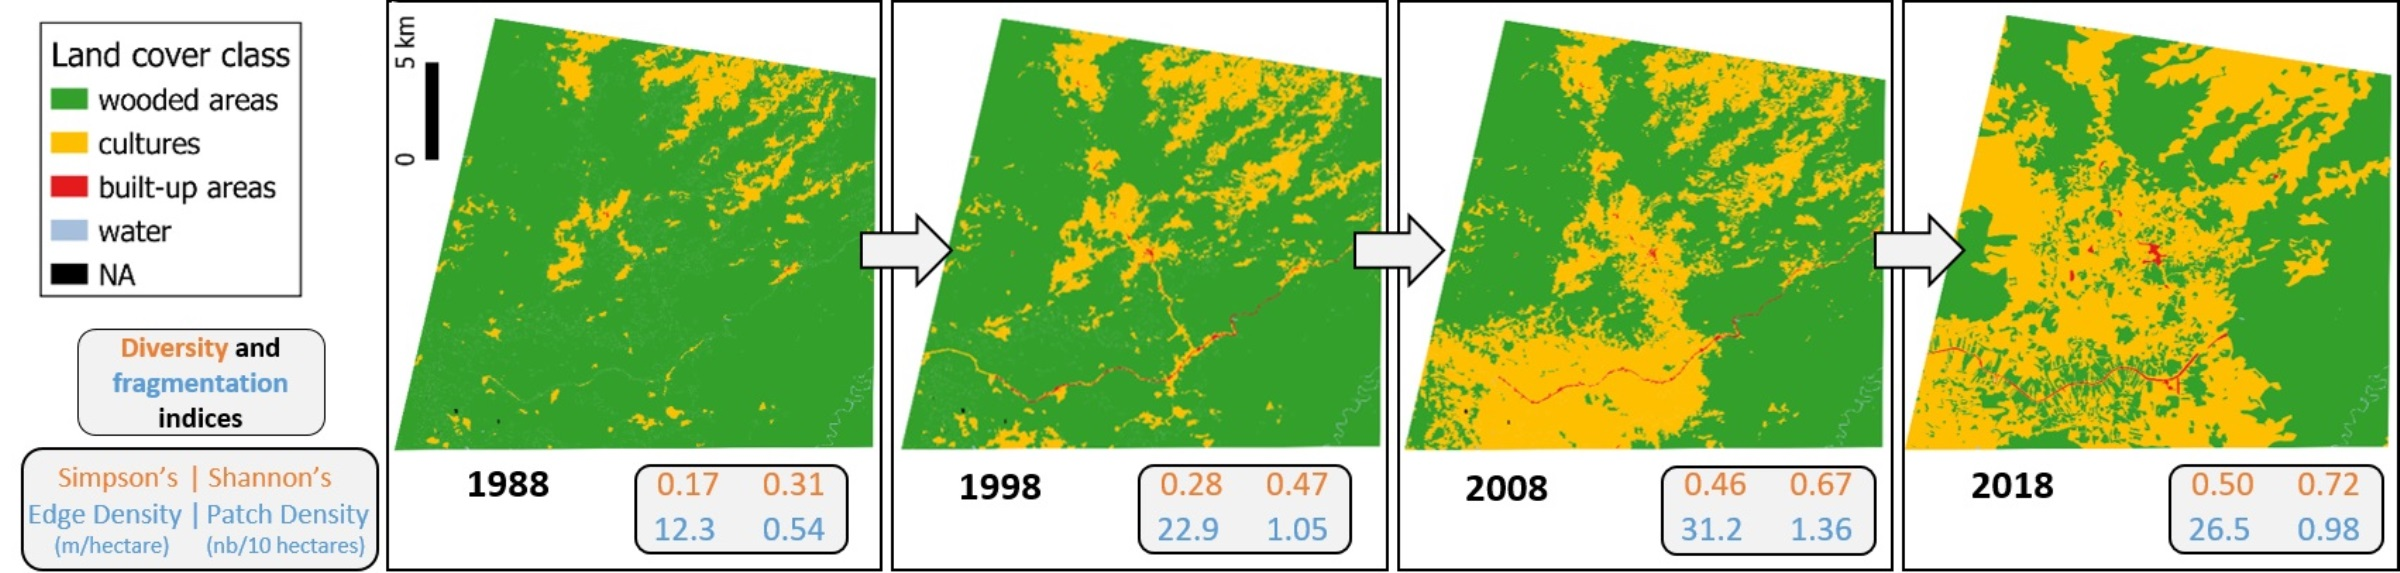
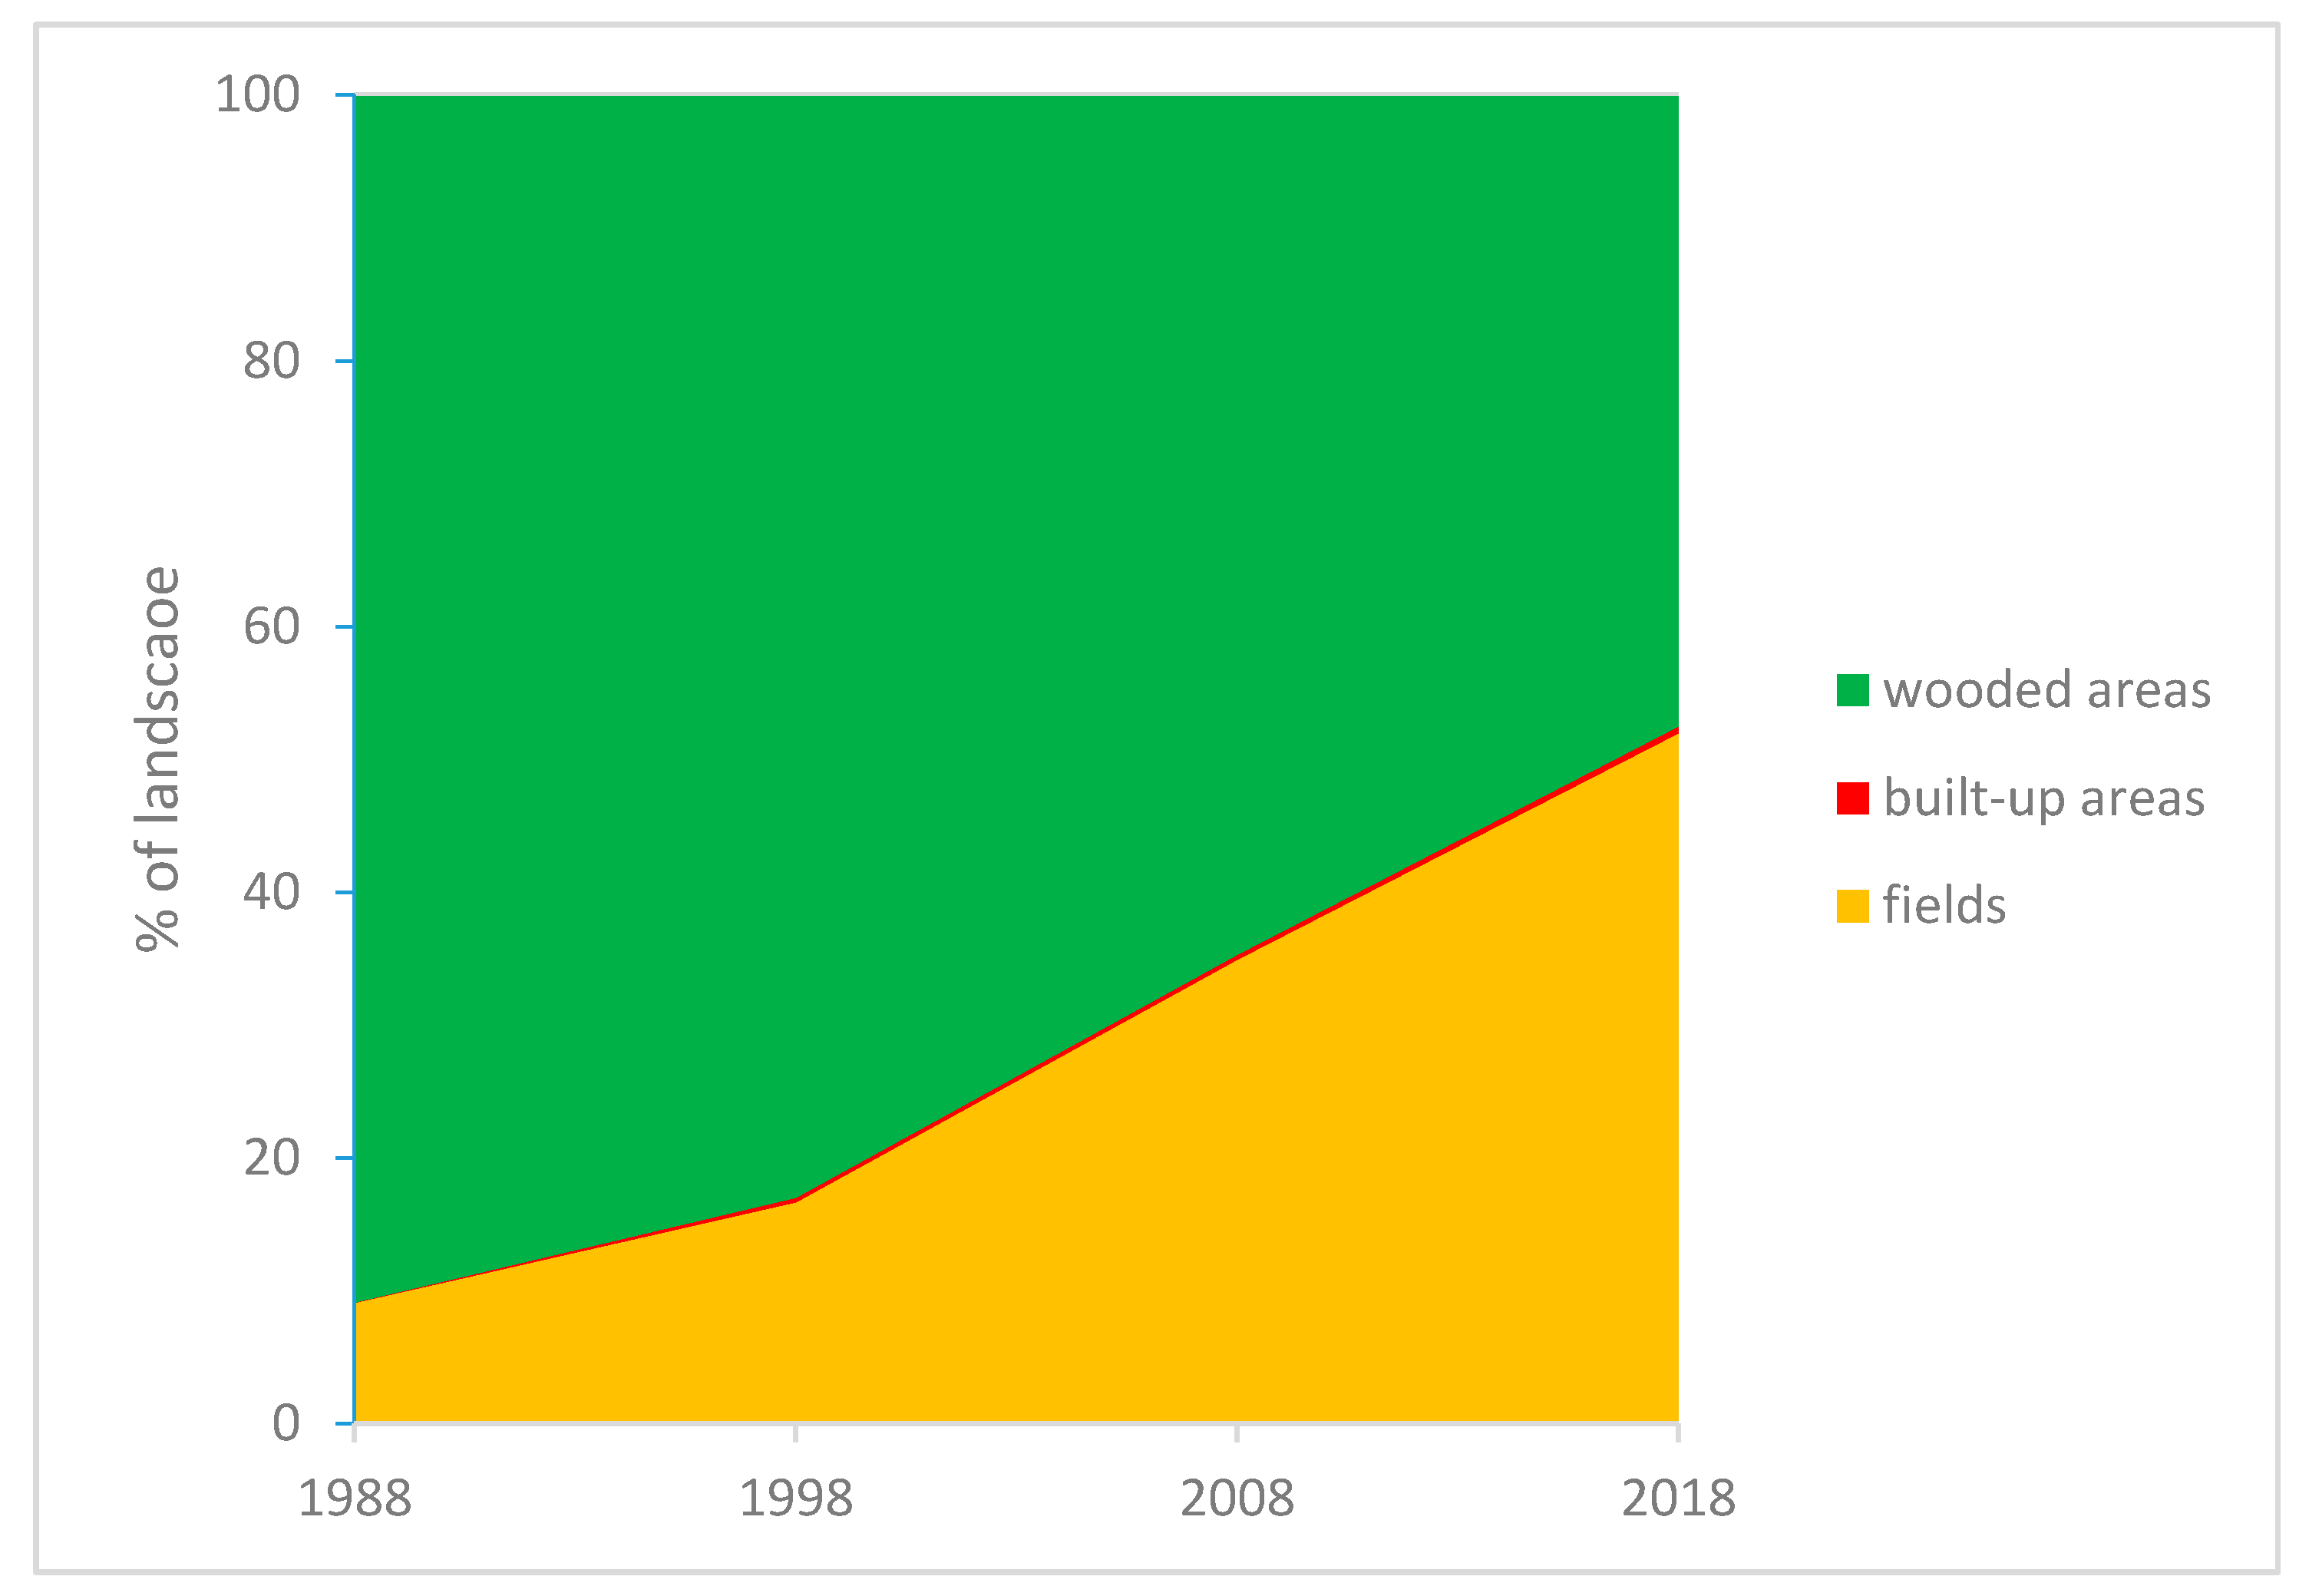
3.2. Land Use/Land Cover Classification

The 2018 classification based on forest, plantations, fields and built-up areas classes permitted the production of a malaria-relevant map, a useful resource for potential upcoming investigations in the study area. The land use/land cover classifications from 2018 are represented in Figure 6. The predominant class identified was “Fields” accounting for 47.9% of the study area, followed by “Forests” (38.1%), “Plantations” (13.7%) and finally “Built-up areas” (0.3%).
In October 2019, we recorded 149 control observations from the study area, attributing 32–43 points to each class (Table 1).
Overall, accuracy between remote sensing classification and reference test was 74%. From the same values, weighted Kappa’s index was 0.67 (5% confidence interval: 0.55–0.79). Although there is no standardized interpretation of the Kappa’s index, this value indicates that the classification accuracy is “substantial” according to Landis and Koch’s scale (0–0.20 = slight, 0.21–0.40 = fair, 0.41–0.60 = moderate, 0.61–0.80 = substantial, and 0.81–1 = almost perfect) [58].

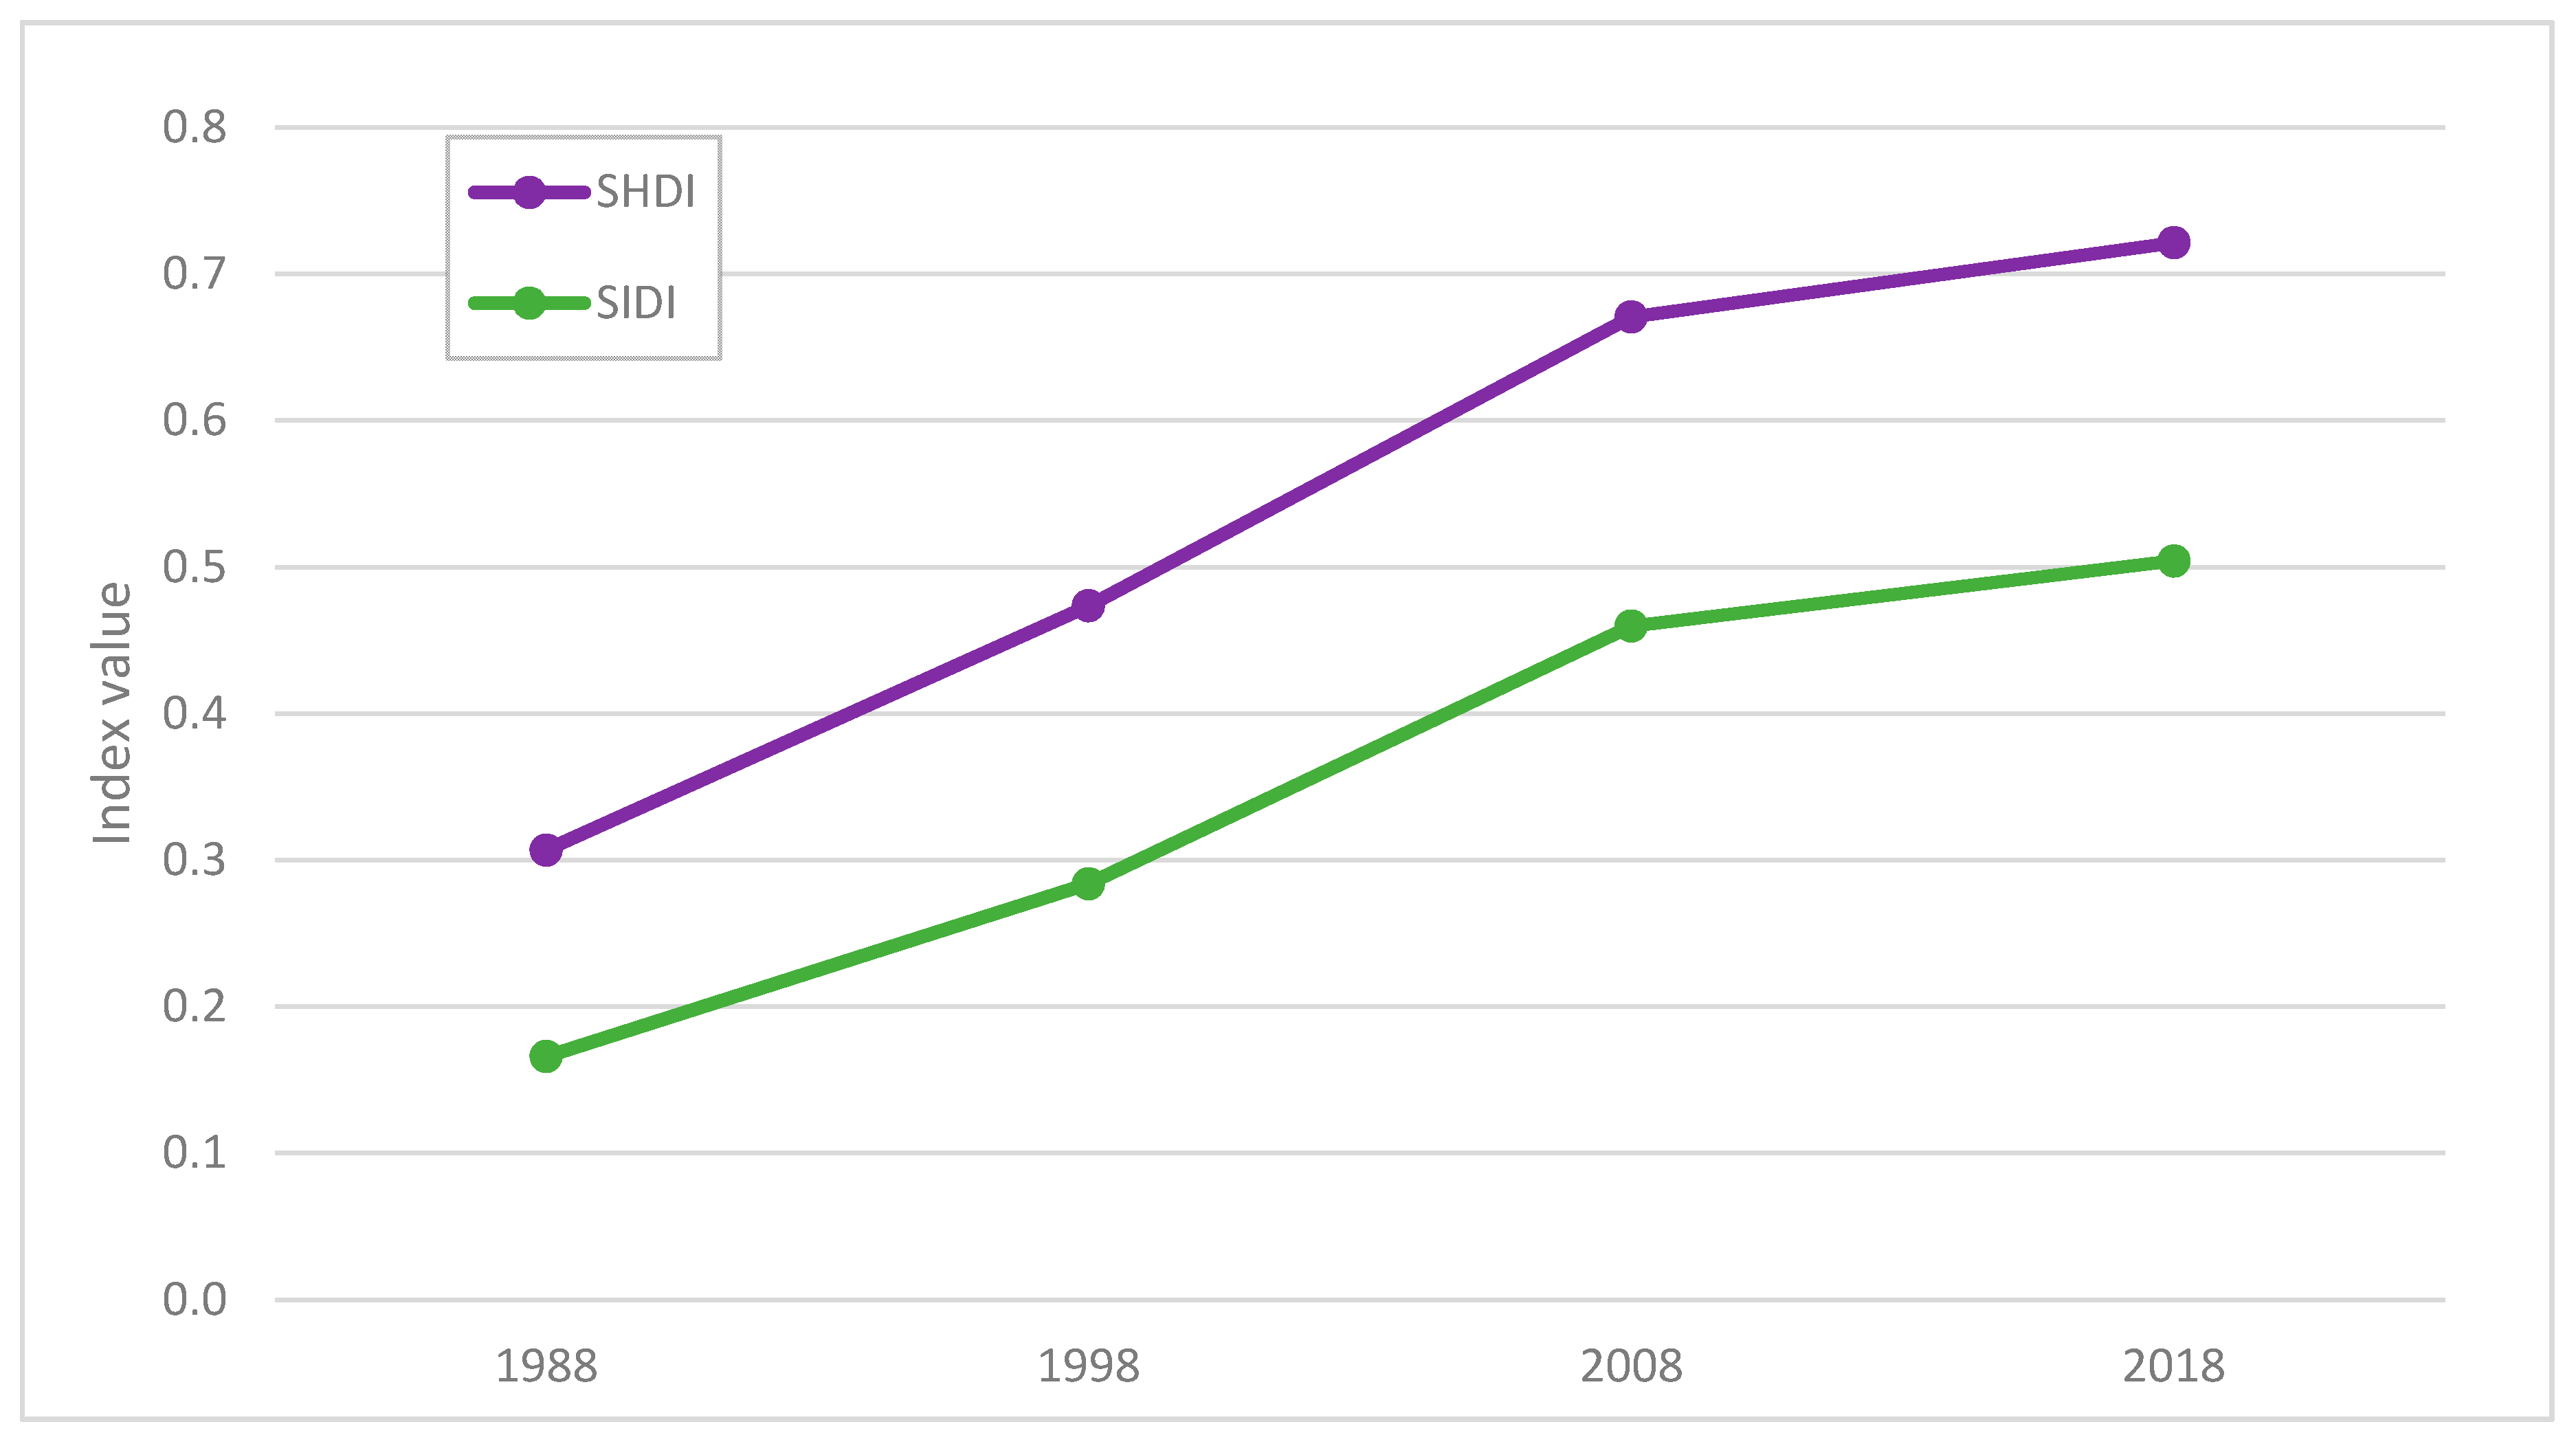
3.3. Comparison between Maps

Once all maps were clipped at their intersection, the final size of the area spanned 24 km from north to south and 25 km from west to east (Figure 7).
Deforestation keeps expanding (Figure 8); from 1988 to 2018, the extent of wooded areas decreased from 90.78% to 47.41% while the percentage of landscape classified as fields increased from 9.11% to 51.98%. Built-up areas also increased from 0.018% in 1988 to 0.531% in 2018, extending the existing patches as a consequence of urbanization and the development of villages and roads.
SHDI and SIDI diversity indices also increased over time (Figure 9). From 1988 to 2018, SHDI increased from 0.31 to 0.72, whereas SIDI increased from 0.17 to 0.50. PD and ED (Figure 10) demonstrate quite a different pattern as they regularly increased until 2008 (PD: from 0.54 number per 100 hectares in 1988 to 1.36 in 2008 and ED: from 12.31 in 1988 to 31.21 m per hectare in 2008) and then both decreased in 2018 (PD to 0.98 and ED to 26.52).

4. Discussion

The spatial resolution of the imagery was fine enough to separate relevant patches at human and mosquito scale. A smaller resolution would be more difficult to obtain and might highlight unnecessary patches, too small to be of biological interest, i.e., groups of trees not extensive enough to represent a suitable environment for a vector population, whereas a larger resolution would not have been fine enough for delimitating all potential patches of interest. Within the confusion matrix, most of the agreement errors arose from the “Fields” class where only 58.7% were rightly attributed (compared with the field control points). Indeed, the producer’s accuracy of this class is particularly low (41.3%). These fields were classified either as Forests (17.5%), Plantations (12.7%) or Built-up areas (11.1%). The incorrect assignment of sites to the “Forests” or “Plantations” classes may have occurred as a consequence of the 18 months delay between the date the satellite images were taken and the collection of control points, particularly in this context where fast pace deforestation occurs, often as the result of “slash and burn” activities. For future classifications, ground truthing and accuracy assessment should be performed immediately after the production of the classification.
Landscape metrics indices showed a consistent evolution of deforestation rate, along with the progress of cultivated areas and built-up areas. Shannon and Simpson’s indices are still increasing through the years, demonstrating an increasing landscape diversity which is emerging from the diversification of patches within the study area. However, even if fragmentation appears to be increasing, the edge density and patch density decreased from 2008 to 2018. This result can usually be linked to (1) a decrease in the number of patches within the landscape (which is not the case here because SHDI is increasing during this time interval) and/or (2) shorter edges on average, arising from more homogenous patches. We can propose at least three hypotheses to explain these results. First, with the cultivated areas extending further every year, an actual homogenization between patches might be occurring, with shorter edges as agriculture spreads and/or as various patches of agriculture that were disconnected now being connected as cultivated areas surfaces expand. Second, the imagery resolution changed in 2018 and might have affected the map output and therefore, the edge density and the patch density values. Lastly, this tendency could arise from the different methodology used in 2018, giving smoother edges, leading to an underestimation of the indices. If the photointerpretation method used in 2018 appears appropriate for quantifying classes’ abundance and repartition, it might estimate fragmentation indices differently than the object-oriented classification. Indeed, during an object-oriented classification, the user defines the parameters for segmentation, which are compactness, shape and scale. Their values are decisive for edge length, as they determine the level of compactness of the patches and the degree of fineness of the edges. Consequently, the resulting edges might appear differently between object-oriented or photointerpretation methods (Figure 11), leading to a different estimation of fragmentation indices.
It is worth noting that along with edge density, patch density is also decreasing between 2008 and 2018. The latter index is less sensitive to the method used; as it counts the number of patches and does not take into account the coarseness or shape of these patches. Thus, if patch density is decreasing, we can assume that fragmentation may have decreased between 2008 and 2018, a phenomenon that could be explained through the hypothesis previously mentioned of an actual homogenisation, which might result from the extension of fields that join the existing parcels between them.
Obviously, difficulties arise when attempting to compare images from different dates, and this is amplified by the different methodology used in 2018. For future studies, analysis and interpretation would be eased by using a homogenous classification method. In the case of malaria context and understanding its mechanisms, photointerpretation appears to be a valid approach, notably because it allows the separation between the different wooded areas. Yet, this technique requires very high-resolution satellite imagery, which is not always available. The technique is, in the context of this study, an uncomplicated way to complete an available dataset with free, accessible methodology. Since the 1980s, remote sensing has deeply evolved, as we can observe from the satellite resolutions used between 1988 and 2008 in the study by Dupuy et al. [53], with panchromatic resolution varying from 10 to 2.5 m between SPOT1 and SPOT5. Over the years, satellite technology and their resolution have improved [31], bringing some challenge for studies spanning various decades. As such, depending on the hypothesis, a protocol could focus on (i) getting data with identical resolutions and methodologies from a limited timeframe or (ii) coping with variability within dataset but allowing a larger time frame. In the case of this study, we aim to give an update about deforestation on a rather long timeframe, thus opting for the latter option. In the case of a more detailed analysis, a smaller time frame would probably fit better, with satellite imagery of a consistent resolution.
Over the last decades in Cambodia, it has been assessed and quantified that deforestation has been increasing in every province [15,62]. On the other side, Mondulkiri province has shown a rather slow malaria decrease over time compared to countrywide data, with a rebound in 2017, concomitant to the national increase. Literature shows indeed that malaria does not always follow linearly deforestation expanse. It is important to consider that malaria is a multifactorial dynamic system, not only driven by deforestation, and that temporal scale matters. More variables, and over a smaller time scale, such as yearly data would be needed to allow a thorough multivariate analysis.
Multivariate models have been used on yearly data with variables such as malaria count, human development index, deforestation rate, sociocultural and land cover factors, with spatial scales at the province, municipality or health district levels. Scale has a considerable effect on results of such analyses [63] and consequently, these methods can create ecological fallacies. It has been stated that health district scale would be the most appropriate to conduct such analyses [25,64]—a radically different scale than most studies in literature at province levels.
However, this sort of multivariate model would be hardly applicable to the Cambodian context, due to the lack of data at a relevant scale. Indeed, in the Amazon Basin, organisations such as the SIVEP-Malaria, recording individually malaria cases at municipality level [65], or the Brazil’s National Institute for Space Research (INPE), mapping deforestation since 1988, are supporting the design of malaria studies and allowed to explain the frontier malaria paradigm. Such recording is essential to allow in-depth investigation of the effect of deforestation on malaria dynamics. However, Cambodia’s geopolitical context makes it difficult to obtain exhaustive malaria data, and almost impossible for long-term data at a relevant scale, as a consequence of the Khmer Rouge regime [49]. Nevertheless, over the last decade, the census data observes net improvements and future studies would probably be able to rely on more complete malaria prevalence. Additionally, future studies must be able to rely on substantial vector data, gathered from mosquito collections. This would ultimately lead to defined transmission-prone environments and allow in-depth investigation on malaria dynamics. Indeed, prevalence data alone is subject to biases—individual immunity, treatment availability and efficacy, control interventions and diagnostic sensibility—and, as such, must be completed by vector data relevant to the study area.
Without formal malaria data, statistical analysis should not be undertaken, but trends can be observed from the observation of land cover changes and the situation of the area under study. First, selective logging might be one reason for the difficulty to formulate a relevant hypothesis. Forest goers create a situation arduous to measure and to model as selective logging induces very low-level to undetectable deforestation [54], while potentially maintaining high malaria prevalence [66]. This highlights the necessity of high geographical precision, attainable with a very fine scale of analysis. A follow-up of this risk population aiming to characterize their mobility and activities within the forest would help to quantify their exposure and their effect on the forest. In addition, an estimation of true forest versus plantations within the wooded areas over time would be a valuable dataset. From the increase in wooded areas near the main road between 2008 and 2018, we can suggest that there was a relative increase of plantation versus forest over the least 10 years. This hypothesis would correlate with the recent investment into rubber and cashew trees observed in the area. Methodologies categorizing the different types of forest are highly valuable in this context, as plantations might have been the land cover category that has extended the most in this landscape. A specific quantification of this increase is required to fully understand malaria dynamics, as some plantations, notably rubber, have been correlated to malaria exposure in Thailand [67] and Cambodia [56].
Second, some forested areas might represent untouched malaria hotbeds that deforestation affects little, where malaria incidence would then mostly depend on other factors. Those include diagnostic efficacy, which might induce bias in the observed incidence, as well as availability of treatments [41], drug efficacy [40] or even long-lasting insecticidal nets real coverage and use [68], which are substantial determinants in malaria dynamics evolution and completely independent from deforestation. In addition, deforestation—even when occurring fast—is a slow process (here observed over 30 years) compared to other factors that could affect malaria incidence (e.g., climatic variation, national control program performance, drug supply, etc.), which can vary from year to year.
Overall, studying the evolution of land use is quite a simple methodology quantifying the forest cover and the anthropogenic changes of the environment. Complementary field approaches would be useful to understand spatiotemporal patterns of exposure to vectors and to ultimately guide efforts towards malaria control and elimination [69]. Techniques relying on active follow-up of populations could favour such an understanding [70]. For example, tracking by GPS data-loggers, coupled with clinical follow-ups and questionnaires to define at-risk behaviours, have revealed great efficiency to determine the conditions for transmission and helped identify malaria hotspots, risk behaviours and modalities of transmission [71,72]. Following up with Cambodians most exposed to vectors in this area, such as forest goers, coupled with characterization of environments as we did, should provide precious information about malaria transmission modalities and help characterize transmission hotspots. Altogether, predicting the direction of pathogen responses to anthropogenic land use change requires an understanding of the biology and natural history of the pathogen as well as identifying the mechanisms of disease transmission in different epidemiologic situations [73]. Using a GIS approach, some malaria control strategies and elimination programmes have improved their efficacy [74,75,76]. These approaches must be transdisciplinary and include spatiotemporal, ecological as well as social perspectives in order to develop prevention methods able to break the transmission cycle [16].

5. Conclusions

This investigation illustrates the tremendous anthropogenic land use changes happening in the study area in Cambodia, affecting humans, vectors and their interactions. Indeed, this analysis highlights rapidly growing deforestation in one district of a Cambodian province, along with an increasing diversity of the landscape. The collated malaria data suggests that the interaction between incidence and deforestation is not linear nor easy to decipher. The lack of detailed ecological, environmental and epidemiological data in the area hinders any in-depth analysis. However, the use of fine-scale satellite imagery, photointerpretation, relevant classification and landscape metrics indices not only show their potential but also their limitations for the analysis of the disease dynamics. To further understand malaria transmission dynamics, the temporal and spatial scales should be carefully chosen in order to correctly address the problem. Additionally, multiple factors such as diagnostic efficacy, availability of treatments, drug efficacy or current fit of control strategies must be considered. Future research programs should also utilise remote sensing methodologies with multidisciplinary approaches in order to quantify malaria exposure and eventually grasp how land cover impacts human exposure to vectors.

Author Contributions

Conceptualization, A.P., A.V. and V.H.; data curation, A.P.; formal analysis, A.P.; funding acquisition, A.V., I.M. and B.W.; investigation, A.P.; methodology, A.P., M.S. and V.H.; project administration, A.V.; resources, S.M., D.L., B.W. and V.H.; software, A.P. and M.S.; supervision, A.V. and V.H.; validation, A.V., B.W. and V.H.; visualization, A.P.; writing—original draft, A.P.; writing—review and editing, M.S., A.V., S.M., I.M., B.W. and V.H. All authors have read and agreed to the published version of the manuscript.

Funding

This study was funded by the National Institutes of Health program International Centres of Excellence for Malaria Research, grant 1U19AI129392-01 “Understanding, tracking and eliminating malaria transmission in the Asia-Pacific Region”. A.P. was funded by the Institut Pasteur International Network Calmette and Yersin Ph.D. scholarship, grant MHL/MJ/N°212/18. SPOT images were provided upon request through the GEOSUD Equipex project and are material of © Airbus DS 2018.

Acknowledgments

We want to thank Annika Suttie that accepted to proofread and edit our manuscript as a native English speaker.

Conflicts of Interest

The authors declare no conflict of interest. The funders had no role in the design of the study; in the collection, analyses, or interpretation of data; in the writing of the manuscript; or in the decision to publish the results.

References

  1. Burkett-Cadena, N.D.; Vittor, A.Y. Deforestation and vector-borne disease: Forest conversion favors important mosquito vectors of human pathogens. Basic Appl. Ecol. 2018, 26, 101–110. [Google Scholar] [CrossRef]
  2. Austin, K.F.; Bellinger, M.O.; Rana, P. Anthropogenic forest loss and malaria prevalence: A comparative examination of the causes and disease consequences of deforestation in developing nations. AIMS Environ. Sci. 2017, 4, 217. [Google Scholar] [CrossRef]
  3. Tucker Lima, J.M.; Vittor, A.; Rifai, S.; Valle, D. Does deforestation promote or inhibit malaria transmission in the Amazon? A systematic literature review and critical appraisal of current evidence. Philos. Trans. R. Soc. Lond. B Biol. Sci. 2017, 372. [Google Scholar] [CrossRef] [PubMed] [Green Version]
  4. Lewis, S.L.; Maslin, M.A. Defining the Anthropocene. Nature 2015, 519, 171–180. [Google Scholar] [CrossRef] [PubMed]
  5. Norris, D.E. Mosquito-borne Diseases as a Consequence of Land Use Change. EcoHealth 2004, 1, 19–24. [Google Scholar] [CrossRef]
  6. Takken, W.; Vilarinhos, P.D.T.R.; Schneider, P.; Santos, F.D. Effects of environmental change on malaria in the Amazon region of Brazil. Frontis 2005, 9, 113–123. [Google Scholar]
  7. Yasuoka, J.; Levins, R. Impact of deforestation and agricultural development on anopheline ecology and malaria epidemiology. Am. J. Trop. Med. Hyg. 2007, 76, 450–460. [Google Scholar] [CrossRef] [Green Version]
  8. Kweka, E.J.; Zhou, G.; Gilbreath, T.M.; Afrane, Y.; Nyindo, M.; Githeko, A.K.; Yan, G. Predation efficiency of Anopheles gambiae larvae by aquatic predators in western Kenya highlands. Parasit. Vectors 2011, 4, 128. [Google Scholar] [CrossRef] [Green Version]
  9. Yanoviak, S.P.; Paredes, J.E.R.; Lounibos, L.P.; Weaver, S.C. Deforestation alters phytotelm habitat availability and mosquito production in the Peruvian Amazon. Ecol. Appl. 2006, 16, 1854–1864. [Google Scholar] [CrossRef]
  10. Afrane, Y.A.; Zhou, G.; Lawson, B.W.; Githeko, A.K.; Yan, G. Life-table analysis of Anopheles arabiensis in western Kenya highlands: Effects of land covers on larval and adult survivorship. Am. J. Trop. Med. Hyg. 2007, 77, 660–666. [Google Scholar] [CrossRef] [Green Version]
  11. Guerra, C.A.; Snow, R.W.; Hay, S.I. A global assessment of closed forests, deforestation and malaria risk. Ann. Trop. Med. Parasitol. 2006, 100, 189–204. [Google Scholar] [CrossRef] [PubMed]
  12. Fischer, J.; Lindenmayer, D.B. Landscape modification and habitat fragmentation: A synthesis. Glob. Ecol. Biogeogr. 2007, 16, 265–280. [Google Scholar] [CrossRef]
  13. Taubert, F.; Fischer, R.; Groeneveld, J.; Lehmann, S.; Müller, M.S.; Rödig, E.; Wiegand, T.; Huth, A. Global patterns of tropical forest fragmentation. Nature 2018, 554, 519–522. [Google Scholar] [CrossRef] [PubMed]
  14. Wang, X.; Blanchet, F.G.; Koper, N. Measuring habitat fragmentation: An evaluation of landscape pattern metrics. Methods Ecol. Evol. 2014, 5, 634–646. [Google Scholar] [CrossRef]
  15. Hughes, A.C. Understanding the drivers of Southeast Asian biodiversity loss. Ecosphere 2017, 8, e01624. [Google Scholar] [CrossRef]
  16. Davidson, G.; Chua, T.H.; Cook, A.; Speldewinde, P.; Weinstein, P. The Role of Ecological Linkage Mechanisms in Plasmodium knowlesi Transmission and Spread. Ecohealth 2019. [Google Scholar] [CrossRef]
  17. Morand, S.; Jittapalapong, S.; Suputtamongkol, Y.; Abdullah, M.T.; Huan, T.B. Infectious diseases and their outbreaks in Asia-Pacific: Biodiversity and its regulation loss matter. PLoS ONE 2014, 9, e90032. [Google Scholar] [CrossRef] [Green Version]
  18. Cardinale, B.J.; Duffy, J.E.; Gonzalez, A.; Hooper, D.U.; Perrings, C.; Venail, P.; Narwani, A.; Mace, G.M.; Tilman, D.; Wardle, D.A.; et al. Biodiversity loss and its impact on humanity. Nature 2012, 486, 59–67. [Google Scholar] [CrossRef]
  19. Ostfeld, R.S. A Candide response to Panglossian accusations by Randolph and Dobson: Biodiversity buffers disease. Parasitology 2013, 140, 1196–1198. [Google Scholar] [CrossRef]
  20. Laporta, G.Z.; Lopez de Prado, P.I.K.; Kraenkel, R.A.; Coutinho, R.M.; Sallum, M.A.M. Biodiversity can help prevent malaria outbreaks in tropical forests. PLoS Negl. Trop. Dis. 2013, 7, e2139. [Google Scholar] [CrossRef] [Green Version]
  21. Halsey, S. Defuse the dilution effect debate. Nat. Ecol. Evol. 2019, 3, 145. [Google Scholar] [CrossRef] [PubMed]
  22. Laurance, W.F.; Camargo, J.L.C.; Fearnside, P.M.; Lovejoy, T.E.; Williamson, G.B.; Mesquita, R.C.G.; Meyer, C.F.J.; Bobrowiec, P.E.D.; Laurance, S.G.W. An Amazonian rainforest and its fragments as a laboratory of global change. Biol. Rev. 2018, 93, 223–247. [Google Scholar] [CrossRef] [PubMed]
  23. Vittor, A.Y.; Gilman, R.H.; Tielsch, J.; Glass, G.; Shields, T.; Lozano, W.S.; Pinedo-Cancino, V.; Patz, J.A. The effect of deforestation on the human-biting rate of Anopheles darlingi, the primary vector of Falciparum malaria in the Peruvian Amazon. Am. J. Trop. Med. Hyg. 2006, 74, 3–11. [Google Scholar] [CrossRef] [PubMed] [Green Version]
  24. Valle, D.; Clark, J. Conservation Efforts May Increase Malaria Burden in the Brazilian Amazon. PLoS ONE 2013, 8, e57519. [Google Scholar] [CrossRef] [Green Version]
  25. Hahn, M.B.; Olson, S.H.; Vittor, A.Y.; Barcellos, C.; Patz, J.A.; Pan, W. Conservation Efforts and Malaria in the Brazilian Amazon. Am. J. Trop. Med. Hyg. 2014, 90, 591–594. [Google Scholar] [CrossRef] [Green Version]
  26. Overgaard, J.H.; Ekbom, B.; Suwonkerd, W.; Takagi, M. Effect of landscape structure on anopheline mosquito density and diversity in northern Thailand: Implications for malaria transmission and control. Landsc. Ecol. 2003, 18, 605–619. [Google Scholar] [CrossRef]
  27. Piantadosi, S.; Byar, D.P.; Green, S.B. The ecological fallacy. Am. J. Epidemiol. 1988, 127, 893–904. [Google Scholar] [CrossRef]
  28. Hansen, M.C.; Potapov, P.V.; Moore, R.; Hancher, M.; Turubanova, S.A.; Tyukavina, A.; Thau, D.; Stehman, S.V.; Goetz, S.J.; Loveland, T.R.; et al. High-Resolution Global Maps of 21st-Century Forest Cover Change. Science 2013, 342, 850–853. [Google Scholar] [CrossRef] [Green Version]
  29. Saah, D.; Tenneson, K.; Matin, M.; Uddin, K.; Cutter, P.; Poortinga, A.; Nguyen, Q.H.; Patterson, M.; Johnson, G.; Markert, K.; et al. Land Cover Mapping in Data Scarce Environments: Challenges and Opportunities. Front. Environ. Sci. 2019, 7. [Google Scholar] [CrossRef] [Green Version]
  30. Palaniyandi, M. The role of remote sensing and GIS for spatial prediction of vector-borne diseases transmission: A systematic review. J. Vector Borne Dis. 2012, 49, 197–204. [Google Scholar]
  31. Kalluri, S.; Gilruth, P.; Rogers, D.; Szczur, M. Surveillance of arthropod vector-borne infectious diseases using remote sensing techniques: A review. PLoS Pathog. 2007, 3, 1361–1371. [Google Scholar] [CrossRef] [PubMed]
  32. Durnez, L.; Mao, S.; Denis, L.; Roelants, P.; Sochantha, T.; Coosemans, M. Outdoor malaria transmission in forested villages of Cambodia. Malar. J. 2013, 12, 329. [Google Scholar] [CrossRef] [PubMed] [Green Version]
  33. Bauhoff, S.; Busch, J. Does deforestation increase malaria prevalence? Evidence from satellite data and health surveys. World Dev. 2020, 127, 104734. [Google Scholar] [CrossRef]
  34. Busch, J.; Ferretti-Gallon, K. What Drives Deforestation and What Stops It? A Meta-Analysis. Rev. Environ. Econ. Policy 2017, 11, 3–23. [Google Scholar] [CrossRef] [Green Version]
  35. Singer, B.; de Castro, M.C. Enhancement and suppression of malaria in the Amazon. Am. J. Trop. Med. Hyg. 2006, 74, 1–2. [Google Scholar] [CrossRef] [Green Version]
  36. De Castro, M.C.; Monte-Mór, R.L.; Sawyer, D.O.; Singer, B.H. Malaria risk on the Amazon frontier. Proc. Natl. Acad. Sci. USA 2006, 103, 2452–2457. [Google Scholar] [CrossRef] [Green Version]
  37. WHO. World Malaria Report 2019; World Health Organization: Geneva, Switzerland, 2019; ISBN 978-92-4-156572-1. [Google Scholar]
  38. Noedl, H.; Se, Y.; Schaecher, K.; Smith, B.L.; Socheat, D.; Fukuda, M.M. Artemisinin Resistance in Cambodia 1 (ARC1) Study Consortium Evidence of artemisinin-resistant malaria in western Cambodia. N. Engl. J. Med. 2008, 359, 2619–2620. [Google Scholar] [CrossRef]
  39. Ariey, F.; Witkowski, B.; Amaratunga, C.; Beghain, J.; Langlois, A.-C.; Khim, N.; Kim, S.; Duru, V.; Bouchier, C.; Ma, L.; et al. A molecular marker of artemisinin-resistant Plasmodium falciparum malaria. Nature 2014, 505, 50–55. [Google Scholar] [CrossRef]
  40. Leang, R.; Taylor, W.R.J.; Bouth, D.M.; Song, L.; Tarning, J.; Char, M.C.; Kim, S.; Witkowski, B.; Duru, V.; Domergue, A.; et al. Evidence of Plasmodium falciparum Malaria Multidrug Resistance to Artemisinin and Piperaquine in Western Cambodia: Dihydroartemisinin-Piperaquine Open-Label Multicenter Clinical Assessment. Antimicrob. Agents Chemother. 2015, 59, 4719–4726. [Google Scholar] [CrossRef] [Green Version]
  41. Gryseels, C.; Kuijpers, L.M.F.; Jacobs, J.; Grietens, K.P. When ‘substandard’ is the standard, who decides what is appropriate? Exploring healthcare provision in Cambodia. Crit. Public Health 2019, 29, 460–472. [Google Scholar] [CrossRef] [Green Version]
  42. Sinka, M.E.; Bangs, M.J.; Manguin, S.; Chareonviriyaphap, T.; Patil, A.P.; Temperley, W.H.; Gething, P.W.; Elyazar, I.R.; Kabaria, C.W.; Harbach, R.E.; et al. The dominant Anopheles vectors of human malaria in the Asia-Pacific region: Occurrence data, distribution maps and bionomic précis. Parasites Vectors 2011, 4, 89. [Google Scholar] [CrossRef] [PubMed] [Green Version]
  43. Sinka, M.E.; Bangs, M.J.; Manguin, S.; Rubio-Palis, Y.; Chareonviriyaphap, T.; Coetzee, M.; Mbogo, C.M.; Hemingway, J.; Patil, A.P.; Temperley, W.H.; et al. A global map of dominant malaria vectors. Parasites Vectors 2012, 5, 69. [Google Scholar] [CrossRef] [PubMed] [Green Version]
  44. Hii, J.; Rueda, L.M. Malaria vectors in the Greater Mekong Subregion: Overview of malaria vectors and remaining challenges. Southeast Asian J. Trop. Med. Public Health 2013, 44 (Suppl. 1), 73–165. [Google Scholar] [PubMed]
  45. Incardona, S.; Vong, S.; Chiv, L.; Lim, P.; Nhem, S.; Sem, R.; Khim, N.; Doung, S.; Mercereau-Puijalon, O.; Fandeur, T. Large-scale malaria survey in Cambodia: Novel insights on species distribution and risk factors. Malar. J. 2007, 6, 37. [Google Scholar] [CrossRef] [Green Version]
  46. Kar, N.P.; Kumar, A.; Singh, O.P.; Carlton, J.M.; Nanda, N. A review of malaria transmission dynamics in forest ecosystems. Parasit. Vectors 2014, 7, 265. [Google Scholar] [CrossRef] [Green Version]
  47. Sluydts, V.; Heng, S.; Coosemans, M.; Van Roey, K.; Gryseels, C.; Canier, L.; Kim, S.; Khim, N.; Siv, S.; Mean, V.; et al. Spatial clustering and risk factors of malaria infections in Ratanakiri Province, Cambodia. Malar. J. 2014, 13, 387. [Google Scholar] [CrossRef] [Green Version]
  48. Peeters Grietens, K.; Gryseels, C.; Dierickx, S.; Bannister-Tyrrell, M.; Trienekens, S.; Uk, S.; Phoeuk, P.; Suon, S.; Set, S.; Gerrets, R.; et al. Characterizing Types of Human Mobility to Inform Differential and Targeted Malaria Elimination Strategies in Northeast Cambodia. Sci. Rep. 2015, 5, 16837. [Google Scholar] [CrossRef] [Green Version]
  49. Kiernan, B. The Pol Pot Regime: Race, Power, and Genocide in Cambodia under the Khmer Rouge, 1975–1979, 3rd ed.; Yale University Press: New Haven, CT, USA, 2014; Volume 1, ISBN 978-0-300-14434-5. [Google Scholar]
  50. Fu, C.; Lopes, S.; Mellor, S.; Aryal, S.; Sovannaroth, S.; Roca-Feltrer, A. Experiences from Developing and Upgrading a Web-Based Surveillance System for Malaria Elimination in Cambodia. JMIR Public Health Surveill. 2017, 3. [Google Scholar] [CrossRef] [Green Version]
  51. Cox, J.; Sovannaroth, S.; Dy Soley, L.; Ngor, P.; Mellor, S.; Roca-Feltrer, A. Novel approaches to risk stratification to support malaria elimination: An example from Cambodia. Malar. J. 2014, 13, 371. [Google Scholar] [CrossRef] [Green Version]
  52. Davis, K.; Yu, K.; Rulli, M.C.; Pichdara, L.; D’Odorico, P. Accelerated deforestation driven by large-scale land acquisitions in Cambodia. Nat. Geosci. 2015, 8, 772–775. [Google Scholar] [CrossRef] [Green Version]
  53. Dupuy, S.; Herbreteau, V.; Feyfant, T.; Morand, S.; Tran, A. Land-Cover Dynamics in Southeast Asia: Contribution of Object-Oriented Techniques for Change Detection. In Proceedings of the 4th International Conference on GEographic Object-Based Image Analysis (GEOBIA), Rio de Janeiro, Brazil, 7–9 May 2012; pp. 217–222. [Google Scholar]
  54. Singh, M.; Evans, D.; Chevance, J.-B.; Tan, B.S.; Wiggins, N.; Kong, L.; Sakhoeun, S. Evaluating the ability of community-protected forests in Cambodia to prevent deforestation and degradation using temporal remote sensing data. Ecol. Evol. 2018, 8, 10175–10191. [Google Scholar] [CrossRef] [PubMed] [Green Version]
  55. Singh, M.; Tokola, T.; Hou, Z.; Notarnicola, C. Remote sensing-based landscape indicators for the evaluation of threatened-bird habitats in a tropical forest. Ecol. Evol. 2017, 7, 4552–4567. [Google Scholar] [CrossRef] [PubMed]
  56. Thomson, R.; Sochea, P.; Sarath, M.; MacDonald, A.; Pratt, A.; Poyer, S.; Allen, H.; Kunthy, S.; Chamroeun, S.; Daro, K.; et al. Rubber plantations and drug resistant malaria: A cross-sectional survey in Cambodia. Malar. J. 2019, 18, 379. [Google Scholar] [CrossRef] [PubMed] [Green Version]
  57. Chiang, G.L.; Loong, K.P.; Chan, S.T.; Eng, K.L.; Yap, H.H. Capture-recapture studies with Anopheles maculatus Theobald (Diptera: Culicidae) the vector of malaria in peninsular Malaysia. Southeast Asian J. Trop. Med. Public Health 1991, 22, 643–647. [Google Scholar] [PubMed]
  58. Foody, G.M. Status of land cover classification accuracy assessment. Remote Sens. Environ. 2002, 80, 185–201. [Google Scholar] [CrossRef]
  59. Shannon, C.; Weaver, W. The Mathematical Theory of Communication. ACM Sigmobile Mobile Comput. Commun. Rev. 1949, 1, 131. [Google Scholar]
  60. Simpson, E.H. Measurement of Diversity. Nature 1949, 163, 688. [Google Scholar] [CrossRef]
  61. McGarigal, K.; Marks, B.J. FRAGSTATS: Spatial Pattern Analysis Program for Quantifying Landscape Structure; U.S. Department of Agriculture, Forest Service, Pacific Northwest Research Station: Portland, OR, USA, 1995.
  62. Wilcove, D.S.; Giam, X.; Edwards, D.P.; Fisher, B.; Koh, L.P. Navjot’s nightmare revisited: Logging, agriculture, and biodiversity in Southeast Asia. Trends Ecol. Evol. 2013, 28, 531–540. [Google Scholar] [CrossRef]
  63. Wiens, J.A. Spatial Scaling in Ecology. Funct. Ecol. 1989, 3, 385–397. [Google Scholar] [CrossRef]
  64. Olson, S.H.; Gangnon, R.; Silveira, G.A.; Patz, J.A. Deforestation and malaria in Mâncio Lima County, Brazil. Emerg. Infect. Dis. 2010, 16, 1108–1115. [Google Scholar] [CrossRef]
  65. Oliveira-Ferreira, J.; Lacerda, M.V.; Brasil, P.; Ladislau, J.L.; Tauil, P.L.; Daniel-Ribeiro, C.T. Malaria in Brazil: An overview. Malar. J. 2010, 9, 115. [Google Scholar] [CrossRef] [PubMed] [Green Version]
  66. Hahn, M.B.; Gangnon, R.E.; Barcellos, C.; Asner, G.P.; Patz, J.A. Influence of Deforestation, Logging, and Fire on Malaria in the Brazilian Amazon. PLoS ONE 2014, 9, e85725. [Google Scholar] [CrossRef] [PubMed] [Green Version]
  67. Bhumiratana, A.; Sorosjinda-Nunthawarasilp, P.; Kaewwaen, W.; Maneekan, P.; Pimnon, S. Malaria-associated rubber plantations in Thailand. Travel Med. Infect. Dis. 2013, 11, 37–50. [Google Scholar] [CrossRef] [PubMed]
  68. Gryseels, C.; Bannister-Tyrrell, M.; Uk, S.; Set, S.; Sokha, S.; Gerrets, R.; Peeters Grietens, K. A Critical Enquiry into Variability of Insecticidal Net Use in Cambodia: Implications for Assessing Appropriateness of Malaria Elimination Interventions. Am. J. Trop. Med. Hyg. 2019. [Google Scholar] [CrossRef] [PubMed] [Green Version]
  69. Sriwichai, P.; Karl, S.; Samung, Y.; Sumruayphol, S.; Kiattibutr, K.; Payakkapol, A.; Mueller, I.; Yan, G.; Cui, L.; Sattabongkot, J. Evaluation of CDC light traps for mosquito surveillance in a malaria endemic area on the Thai-Myanmar border. Parasit. Vectors 2015, 8, 636. [Google Scholar] [CrossRef] [Green Version]
  70. Drame, P.M.; Poinsignon, A.; Besnard, P.; Cornelie, S.; Mire, J.L.; Toto, J.-C.; Foumane, V.; Dos-Santos, M.A.; Sembène, M.; Fortes, F.; et al. Human Antibody Responses to the Anopheles Salivary gSG6-P1 Peptide: A Novel Tool for Evaluating the Efficacy of ITNs in Malaria Vector Control. PLoS ONE 2010, 5, e15596. [Google Scholar] [CrossRef]
  71. Fornace, K.M.; Alexander, N.; Abidin, T.R.; Brock, P.M.; Chua, T.H.; Vythilingam, I.; Ferguson, H.M.; Manin, B.O.; Wong, M.L.; Ng, S.H.; et al. Local human movement patterns and land use impact exposure to zoonotic malaria in Malaysian Borneo. eLife 2019, 8, e47602. [Google Scholar] [CrossRef]
  72. Hast, M.; Searle, K.M.; Chaponda, M.; Lupiya, J.; Lubinda, J.; Sikalima, J.; Kobayashi, T.; Shields, T.; Mulenga, M.; Lessler, J.; et al. The use of GPS data loggers to describe the impact of spatio-temporal movement patterns on malaria control in a high-transmission area of northern Zambia. Int. J. Health Geogr. 2019, 18, 19. [Google Scholar] [CrossRef] [Green Version]
  73. Gottdenker, N.L.; Streicker, D.G.; Faust, C.L.; Carroll, C.R. Anthropogenic Land Use Change and Infectious Diseases: A Review of the Evidence. EcoHealth 2014, 11, 619–632. [Google Scholar] [CrossRef]
  74. Barbieri, A.F.; Sawyer, I.O.; Soares-Filho, B.S. Population and Land Use Effects on Malaria Prevalence in the Southern Brazilian Amazon. Hum. Ecol. 2005, 33, 847–874. [Google Scholar] [CrossRef]
  75. Bui, T.Q.; Pham, H.M. Web-based GIS for spatial pattern detection: Application to malaria incidence in Vietnam. Springerplus 2016, 5. [Google Scholar] [CrossRef] [PubMed] [Green Version]
  76. Souris, M.; Marcombe, S.; Laforet, J.; Brey, P.T.; Corbel, V.; Overgaard, H.J. Modeling spatial variation in risk of presence and insecticide resistance for malaria vectors in Laos. PLoS ONE 2017, 12, e0177274. [Google Scholar] [CrossRef] [PubMed] [Green Version]
Figure 1. Forest recently cut down and burnt to clear space for agriculture, by using the “slash and burn” method, Kaev Seima district, Mondulkiri Province, Cambodia (photo: A.P.).
Remotesensing 12 02972 g001
Figure 2. Example of the main environments within the study area. (A) Built-up area in a village. (B) Field used for cassava culture photographed after the collection of cassava plants. (C) Rubber tree plantation. (D) Primary forest.
Remotesensing 12 02972 g002
Figure 3. Location of Mondulkiri province and study area (red rectangle).
Remotesensing 12 02972 g003
Figure 4. Malaria incidence data for Cambodia (total number of estimated cases) and Mondulkiri province (cases per 1000 inhabitants).
Remotesensing 12 02972 g004
Figure 5. Incidence for 1000 inhabitants per province and number of cases per district of Mondulkiri province for years 2016 (A) and 2017 (B).
Remotesensing 12 02972 g005
Figure 6. Land use map from 2018 SPOT 6/7 satellite imagery.
Remotesensing 12 02972 g006
Figure 7. Evolution of land cover between 1988 and 2018 with (a) Land cover in 1988; (b) Land cover in 1998; (c) Land cover in 2008; (d) Land cover in 2018 (NA: not attributed).
Remotesensing 12 02972 g007
Figure 8. Evolution of landscape percentage for each land use/land cover class over time, between 1988 and 2018.
Remotesensing 12 02972 g008
Figure 9. Evolution of the diversity indices, Shannon’s Diversity Index (SHDI) and Simpson’s Diversity Index (SIDI), from 1988 to 2018.
Remotesensing 12 02972 g009
Figure 10. Evolution of the fragmentation indices, Patch Density (PD, number per 100 hectares) and Edge Density (ED, metres per hectares), as a function of time, from 1988 to 2018.
Remotesensing 12 02972 g010
Figure 11. A detail of the land use/land cover map from 2008 with object-oriented method (a) and from 2018 with photointerpretation (b). In addition to the difference of wooded areas surface, edges appear coarser on (a), while on (b), patches are more compact, with shorter edges.
Remotesensing 12 02972 g011
Table 1. Confusion matrix including user’s accuracy, relative omission error, producer’s accuracy and relative commission error.
Reference Test Accuracy
FieldsForestsPlantationsBuilt-Up AreasTotalUser’s AccuracyRelative Omission Error
Remote sensing ClassificationFields37321430.860.14
Forests111722320.530.47
Plantations81290380.760.24
Built-up Areas70128360.780.22
Total63213431149
Producer’s Accuracy0.590.810.850.90
Relative Commission Error0.410.190.150.10

