Abstract
Change detection (CD) is an important tool in remote sensing. CD can be categorized into pixel-based change detection (PBCD) and object-based change detection (OBCD). PBCD is traditionally used because of its simple and straightforward algorithms. However, with increasing interest in very-high-resolution (VHR) imagery and determining changes in small and complex objects such as buildings or roads, traditional methods showed limitations, for example, the large number of false alarms or noise in the results. Thus, researchers have focused on extending PBCD to OBCD. In this study, we proposed a method for detecting the newly built-up areas by extending PBCD results into an OBCD result through the Dempster–Shafer (D–S) theory. To this end, the morphological building index (MBI) was used to extract built-up areas in multitemporal VHR imagery. Then, three PBCD algorithms, change vector analysis, principal component analysis, and iteratively reweighted multivariate alteration detection, were applied to the MBI images. For the final CD result, the three binary change images were fused with the segmented image using the D–S theory. The results obtained from the proposed method were compared with those of PBCD, OBCD, and OBCD results generated by fusing the three binary change images using the major voting technique. Based on the accuracy assessment, the proposed method produced the highest F1-score and kappa values compared with other CD results. The proposed method can be used for detecting new buildings in built-up areas as well as changes related to demolished buildings with a low rate of false alarms and missed detections compared with other existing CD methods.
1. Introduction
The most important social transformation in human history is regarded as urbanization, in which cities play an important role [1]. Although only 3% of the Earth’s land is occupied by cities, 3.5 billion people live in cities, and it will rise to over 5 billion by 2030, making it 95% of the urban expansion. This rapid urbanization results in 60–80% of energy consumption and carbon emissions [2,3]. The development of sustainable cities is becoming crucial because of the challenges associated with urban growth and urbanization. The United Nations Sustainable Development Goals include sustainable cities and communities (i.e., Goal 11) that require a focus on safe and sustainable human settlement [4]. Most of the sustainable development goals are related to urban decision making [5].
In remote sensing technology, detecting changes in land cover and land use is considered to be important because of its practical use in land management, urbanization, eco-change, deforestation, damage assessment, and disaster monitoring [6]. Change detection (CD) is the process of identifying changes that have occurred over a period of time on the surface of the Earth or in the state of an object using images acquired of the same region or object at different time points [7]. The development in remote sensing technology and the availability of very-high-resolution (VHR) imagery has opened a wide range of new opportunities for analysts to use CD for detecting changes in small and complex objects such as buildings [8,9]. Accurate CD results can be obtained because of the high spatial and spectral resolution of VHR imagery [10].
The CD techniques can be categorized into pixel-based change detection (PBCD) and object-based change detection (OBCD). PBCD is most often used because of its simple and straightforward algorithms. In PBCD, the change intensity image is generated by comparing the multitemporal images pixel by pixel. The most common techniques of PBCD for generating the change intensity are change vector analysis (CVA), image differencing, and image ratio [11,12,13]. However, the accuracy of the PBCD algorithm is low, limiting the results of the CD when applied to VHR imagery [14]. Because PBCD uses an individual pixel as its basic unit without considering the spatial context of an image, it is prone to salt-and-pepper noise in CD results [15]. Moreover, PBCD generates a large number of false alarms because of scene brightness [16]. Using an object rather than a pixel as a basic unit for CD may minimize the problems caused by PBCD when applied to VHR imagery because an object is generated by a group of pixels that are spatially and spectrally similar to each other [17,18].
OBCD creates meaningful objects using a group of pixels with similar spatial and spectral resolutions by segmenting multitemporal images. Consequently, OBCD is compatible with CD to analyze the changes in an object by comparing image objects at different times [19]. The OBCD technique can be performed by fusing the spatial features (e.g., texture, shape, and topology) of an object during the CD process [20,21], and using an object as a processing unit for the completeness and correctness of the final CD result [22,23]. Recently, analysts have been developing more accurate techniques for the feature extraction process using hyperspectral imagery [24]. Many analysts have focused on using the spatial or spectral features of an object to detect the changes in the state of an object or region in multitemporal images. Moreover, analysts have addressed the problem with spectral variability of hyperspectral imagery and introduced various techniques for resolving these problems [25]. However, detecting changes in small and complex objects requires VHR images, while it is difficult to acquire high-resolution hyperspectral images for the CD of buildings and other small objects.
Many studies have been conducted to improve the accuracy of CD results using spatial features of objects [26]. However, it is difficult to recognize the proper features for the CD process because of the complexity of images and change patterns. Moreover, the spatial features of small and complex objects such as buildings highly depend on the shape and size of the objects determined by the segmentation result. Therefore, extending PBCD to OBCD has been recently employed wherein PBCD results are fused and extended to OBCD using techniques such as major voting or ensemble learning. For example, Xiao et al. [27] proposed a method for detecting the changes in built-up lands by combining PBCD and OBCD. Their method is completely based on textural features, spectral features, and morphological operations. At the pixel level, they calculated the textural features and spectral features for each band of both images and then generated textural and spectral changed images. Then, these images were combined using a logical operator for generating a final change mask. The morphological closing and opening operations were applied to the final change mask for converting from PBCD to OBCD and for the complete shape of changed objects (e.g., buildings). In another study, using a major voting technique, PBCD was extended to OBCD [28], and the decision of a changed or unchanged object was taken on the basis of calculating the ratio of changed and unchanged pixels in an object. For improving the accuracy of the CD result, several studies combined and extended PBCD results in OBCD [22,23,29].
However, fusing CD results often causes uncertainty in results. Researchers addressed this problem using the Dempster–Shafer (D–S) theory with a segmented image to generate OBCD results [30]. It is necessary to assign the certainty weight manually while calculating change, nochange, and uncertainty objects when implementing the D–S theory. Keeping in mind the uncertainty problem while applying the D–S theory and the problem with assigning the certainty weight, we derived a method that automatically calculates and assigns the certainty weight for each binary CD result while calculating the change, nochange, and uncertainty [31].
With the availability and development of VHR imagery, the applications of the CD are increasing, and detecting the changes in complex objects are becoming the main focus, including buildings, which is one of the main applications of CD. For detecting building changes, Liu et al. [32] proposed a method in which shape and spatial features were utilized to amplify the ability of features. Im et al. [33] proposed an OBCD method, which is based on the fact that the brightness value of an object is correlated when there is no change and uncorrelated when there is a change in multitemporal images. This method is based on image segmentation and correlation analysis. Dalla Mura et al. [8] proposed an unsupervised method for CD by utilizing morphological operations and CVA and proved that the proposed method outperforms the pixel-based CVA. In another study, a building CD method based on morphological building index (MBI), spectral, and shape conditions was proposed in [34]. Moreover, an automatic building CD method based on a morphological attribute profile was proposed by Li et al. [35]. Leichtle et al. presented a CD method by using VHR images and focusing on individual buildings [36]. A multi-level 3D building CD method for megacities was proposed in [37]. A 3D building roof reconstruction and building CD method is proposed in [38]. An unsupervised OBCD approach focusing on individual buildings in an urban environment using VHR imagery is proposed in [36]. Zhang et al. [39] proposed an OBCD approach with separate segmentation of multitemporal high-resolution imagery focusing on building CD in an urban area. They individually conducted segmentation for each multitemporal imagery and extracted change features for generating changed objects. In [40], building a CD from VHR imagery by combining MBI and slow feature analysis was proposed. A multi-index-based automatic CD method was proposed for high-resolution imagery [41]. A multi-level approach for building CD was proposed in [42] that utilizes the MBI and mutual information together.
Although many studies have focused on CD for urban development, it is still a challenging issue in the field of remote sensing because of its diverse and complex cases. Moreover, detecting small and complex objects, such as buildings in altered areas, has received insignificant attention from analysts because most studies that extend PBCD to OBCD and use only OBCD or PBCD techniques have focused on detecting all changes. Studies regarding building changes using MBI have generated a binary change image using one PBCD classifier (i.e., CVA or image differencing method) and converted PBCD to OBCD using morphological operations such as morphological closing and opening operations. The problem with morphological closing and opening operations is the selection of the best structural element for the dataset; for instance, a large structural element will extract unnecessary areas such as buildings. However, very small structural elements will miss parts of buildings and result in incomplete building shapes. Consequently, the CD result can be influenced by severe false alarms or missed detections.
In this study, we proposed an OBCD method for VHR imagery, focusing only on newly built buildings in changed areas by fusing the results of different PBCD classifiers and segmented image using the D–S theory. First, we conducted the object segmentation of multitemporal VHR imagery. Next, the building feature maps were generated from VHR multitemporal imagery using MBI [43]. The advantage of using MBI is that the effect of shadows of buildings on CD results can be effectively removed. Then three change intensity images were implemented by using principal component analysis (PCA) [44], CVA [11], and iteratively reweighted multivariate alteration detection (IRMAD) [45]. A threshold is generated and applied to the three change intensity images, and binary change images are conducted. The three binary change images were fused with the segmented image by using the D–S theory to generate the OBCD map. Finally, the accuracy assessment of the proposed CD technique was conducted by using a manually digitized map. To verify the superiority of the proposed method, we applied the proposed method to the multitemporal VHR images from the KOMPSAT-3 satellite with a spatial resolution of 2.8 m [46]. The results from the proposed method were compared with the results from extended PBCD to OBCD of the three classifiers. Moreover, the OBCD result was generated by fusing PBCD results from the three classifiers with the segmented image by using the major voting technique.
The study aims to focus on the United Nations Sustainable Development Goal 11. The proposed method can be used for the planning and development of cities and for updating maps. To detect rapid changes in the urban development areas using remote sensing technology, we concentrated on detecting the changes in building areas using VHR images while minimizing the false alarms that may occur during the application of general CD methods. In particular, for reducing the detection changes regardless of urban development (e.g., seasonal changes, shadows, and vegetation), we used various difference images generated by applying PBCD techniques (i.e., CVA, PCA, and IRMAD) to MBI feature images, instead of using difference images generated using CD techniques applied to original images. To minimize the false alarms of CD results, we used the D–S theory based on the fusion method to extend PBCD to OBCD. Here, we automatically derived threshold for the certainty weight to be applied in any case without manual interruption. A detailed result analysis of the proposed method, including the segmentation effect on the performance, visual inspection, and numerical assessment by comparing with other PBCD and OBCD results, is conducted to verify the effectiveness of the proposed method.
2. Methodology
The procedure for the proposed method is shown in Figure 1. The primary steps are as follows:
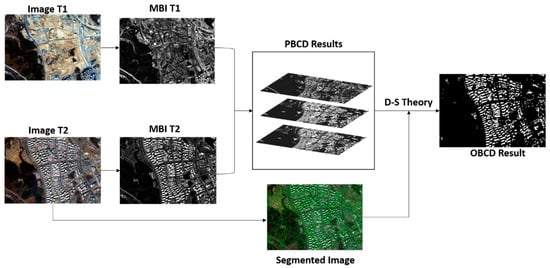
Figure 1.
Flowchart of the proposed method.
- image segmentation using an image acquired at time two (image T2)
- creation of MBI feature maps using images from both times
- implementation of the three PBCD methods (i.e., CVA, PCA, and IRMAD) and application of an appropriate threshold for building detection to obtain binary change results, and
- fusion of the three binary CD results with a segmented object map using the D–S theory to obtain a final OBCD result.
2.1. Multiresolution Segmentation
The multiresolution segmentation is an iterative process that minimizes the average heterogeneity of objects. The heterogeneity used in this algorithm has spatial and spectral components. The spectral component is defined by using the spectral response of the pixels contained in a segment. The spatial component is based on two shape features, which are smoothness and compactness. The compactness is defined as the ratio between the perimeter of the segment and the square root of the number of pixels it contains. The smoothness is defined as the ratio between the perimeter of the object and the perimeter of the minimum boundary rectangle [47].
The eCognition software is used to conduct the multiresolution segmentation of VHR multitemporal imagery [48]. The multiresolution segmentation integrated into the eCognition software uses the bottom-up strategy [49], starting by creating single-pixel objects and grouping those objects until a given threshold is reached [50]. The threshold is given by setting a scale parameter that is weighted with shape and compactness parameters. The scale parameter controls the spectral variations within the object and affects the segmentation size of an image. The shape parameter is a weight between object shape and its spectral color. The smaller value of the shape parameter means that the spectral characteristics are considered more than shape during the segmentation process. The compactness parameter is the ratio of boundary and area of an object. Among the three parameters in eCognition software, scale parameters have a great impact on the CD performance [51]. In this study, for conducting multiresolution segmentation, only the image T2 is used because we focused on buildings only; therefore, we generated the segmentation by using the image, which had newly constructed buildings. For generating segmentation, the scale parameter was set to 60, whereas shape and compactness parameters were left as default values, 0.1 and 0.5, respectively.
2.2. Morphological Building Index (MBI)
The primary concept of MBI is to form a relation between the spectral and spatial characteristics of buildings (i.e., brightness, size, and contrast) and morphological transformations (i.e., top-hat transformation (THT), granulometry, and directionality) [34]. In this study, the MBI introduced in [44] was calculated step-by-step as follows.
The calculation of the brightness value is the first step, which reduces the multispectral bands used in the calculation of MBI. In this study, for the calculation of brightness, only visible bands are used since they have the most significant contribution to the spectral information of buildings [52]. The maximum of each pixel in each visible band is recorded as a brightness value by using Equation (1):
where represents the brightness value of pixel l, is the spectral value of pixel l at band m, and M is the total number of bands used.
The second step is to determine the information regarding the contrast of buildings. THT is a difference in brightness image, and its morphological opening profile which is mostly used because it is capable of highlighting bright structures with a size less than or equal to a predefined value [34].
The third and fourth steps are to determine the THT and its differential morphological profiles (DMPs). Buildings in VHR images indicate complicated spatial arrangements such as different sizes. Multiscale THT based on DMPs [53] is used to generate the building index. Moreover, a linear structural element is used while generating MBI because it is effective in extracting the information regarding the directionality of local structures [54]. Equation (2) is used to calculate the multiscale and multidirectional DMPs of the THT:
While is calculated by using Equations (3) and (4):
and
where indicates the THT of the brightness image B, is the opening by reconstruction of the brightness image B and is defined based on two basic morphological operations (erosion and dilation ), d represents the directionality of the structural element, and s () indicates the scale parameter of a structural element and is used to extract objects with different sizes [48], and is the interval of the profile.
The final step is to calculate MBI. The MBI feature image () is determined as the average of the multiscale and multidirectional by using Equation (5).
where and denote the value of directionality and that of the scale of profiles, respectively. Four directions ( = 4) were considered from 0 to 135 with a delay of 45 because an increase in directionality does not lead to an increase in accuracy [54]. The value of the scale of profile is calculated using the expression: = (( − )/) + 1, where and should be determined according to the spatial characteristics of the buildings and spatial resolution (in this study, = 2, 52 with = 5) [55].
2.3. Pixel-Based Change Detection (PBCD)
Due to the complexity of the multitemporal VHR images, it is difficult to obtain an accurate CD result from one PBCD method. Therefore, we utilized three independent PBCD methods and fused their CD results with a segmented image by using the D–S theory. Three commonly used and effective unsupervised PBCD methods, including CVA, IRMAD, and PCA, were considered.
CVA is the most commonly used method by researchers for CD purposes. Change vectors are obtained by subtracting the MBI feature images, which are generated from bi-temporal images using MBI. For determining the change intensity using CVA, the Euclidean distance between pixels was used [11]. The change intensity using CVA is generated using Equation (6):
where is the change intensity of CVA and and are the MBI feature images.
In the PCA method, the difference image is generated by the absolute-valued difference image. For extracting the eigenvectors, the difference image is divided into h × h (h = 4 used in this study) non-overlapping blocks. Then the difference image vector set is projected onto the eigenvector space to produce a feature vector space [44]. The change intensity using the PCA method is calculated using Equation (7).
with
where indicates the eigenvector of the covariance matrix, is the average pixel value, and is the difference image.
The IRMAD is based on the principle of canonical correlation analysis. The Chi-squared distance is used to calculate the change intensity of IRMAD [45]. During the iteration process in IRMAD for reducing the negative outcome of the changed pixels, the high weights are assigned to the unchanged pixels. The change intensity using IRMAD is generated by Equation (9).
and
where is the standard deviation of the used band, and a and b are the transformation vectors calculated from the canonical correlation analysis.
The three change intensity images (i.e., , , and ) were normalized to 0 and 1, and a threshold is applied to the three change intensity images to generate the three binary change images:
where PBCD is the change intensity images generated by k classifiers.
2.4. Dempster–Shafer (D–S) Theory
Fusing multiple CD results causes uncertainty in the CD result. In order to solve the problem of uncertainty and for improving accuracy of the CD result and decreasing the false alarms, the D–S theory is employed. The D–S evidence theory measures the probability of an event by fusing the probability of each evidence [56]. In [30], the D–S theory was used to fuse different PBCD results with segmented images and generated an OBCD result. However, in their study, certainty weights while calculating the change, nochange, and uncertainty were manually assigned. In [31], we automatically calculated and assigned the certainty weight for each segmented object. In this study, for assigning the certainty weight while calculating the change, nochange, and uncertainty, the same concept as in [31] is utilized. The PBCD results were combined with the segmented image and the certainty weight is calculated.
A simple technique to generate the certainty weight is to calculate CD accuracies by comparing them with a manually digitized reference map while changing the values of the certainty weight. However, the construction of the reference map in practical CD applications is difficult. The certainty weight () of the evidence i (i.e., CVA, PCA, and IRMAD) for each object j is calculated using Equation (12):
where is the standard deviation of the change intensity in object j acquired by the binary PBCD result, i.e., the evidence. If the change intensity is homogeneous in the object, the certainty weight value will be large, and vice versa. Accordingly, the certainty weight can be automatically calculated while considering the stability of the change intensity of each object.
Then the probability of change (, nochange (, and uncertainty ( are calculated using Equation (13):
where shows the number of changed pixels in object j of the PBCD result i, shows the number of unchanged pixels in object j of the PBCD result i, and is the total number of pixels in an object j.
If the changed pixels in an object j are greater than or equal to unchanged and uncertainty, then the object will be declared a changed object. This condition can be expressed as follows:
3. Experimental Results
For the detection of only buildings in the changed area, the experiments were carried out on a pair of KOMPSAT-3 multispectral images of Sejong City, South Korea, with a spatial resolution of 2.8 m acquired in 2013 (image T1) and 2019 (image T2). Both the images had four bands, three visible bands and one near-infrared band. Large-scale developments have taken place in this area since 2013, including high-rise newly built-up buildings. To detect the buildings in the changed area and check the effectiveness of the proposed method, we selected two subsets from the KOMPSAT-3 imagery.
Before conducting the proposed approach, we carried out co-registration between VHR imagery to minimize the geometric misalignment as mentioned in [31]. A phase correlation method was used to detect conjugate points for the transformation model construction. The local templates were constructed over the image T1 for detecting the conjugate points. On the basis of the coordinate information from the metadata, the location of the corresponding templates of image T2 was derived. For determining the similarity peak, the phase correlation was calculated, which can detect the translation difference between the images in x and y directions. The peak location of the phase correlation between the template images was used to extract well-distributed conjugate points. Then, the corresponding conjugate point’s position for the template image T2 was determined as a shifted location from the centroid of the template to the amount showing the highest similarity value of the phase correlation. After extracting the conjugate points, and improved piecewise linear transformation [57] was used to warp the image T2 to the coordinates of the image T1.
After carrying out co-registration, the MBI feature images were generated from each image in each subset using only visible bands because they correlate with the spectral property of buildings [54]. Then from the MBI feature images, the three PBCD intensity images were generated using the classifiers CVA, PCA, and IRMAD. Then a threshold () was applied to the three intensity images for generating the binary change images. The three binary change images were then fused with the segmented image using the D–S theory, and the OBCD result was generated. The proposed CD result was compared with the OBCD results generated by fusing the same three binary change maps with the segmented image using the major voting technique. In addition, the proposed CD result was compared with the PBCD results from the three classifiers and their extended OBCD results generated by using major voting techniques and segmented image as used for the proposed method. For the quantitative evaluation of CD performance, the F1-score, kappa, miss rate (MR), and false alarm rate (FAR) were calculated using each CD result and the manually digitized reference map.
F1-score is the harmonic mean of precision and recall. Precision is the correct positive results divided by all positive results, whereas recall is the number of correct positive results divided by all possible positive results. The higher F1-score means the best performance of the classifier. The kappa coefficient can be determined by using the observed accuracy and random accuracy. FAR is calculated using the total number of false alarms divided by the total number of unchanged samples in the reference map, and MR is calculated using the total number of missed detections divided by the total number of changed samples in the reference map.
The segmented image was generated in eCognition software using a scale parameter, shape, and compactness of 60, 0.1, and 0.5, respectively. The same scale parameter for both subsets was selected after generating and evaluating results for both subsets. The detailed analysis of the scale parameters affecting the CD performance will be given in Section 4. Moreover, the running time of the process was measured. It highly depends on the number of objects in the segmented image. It took 132 s and 40 s for experiments 1 and 2 that have 9253 and 4977 objects, respectively.
3.1. Experiment 1
The first experiment was conducted on the subset of multitemporal VHR images of the KOMPSAT-3 satellite with a size of 925 × 637 pixels. Figure 2 shows both the multispectral images. Several changes have taken place in the area during the period from 2013 to 2019, but we aimed to detect only the newly built-up buildings.
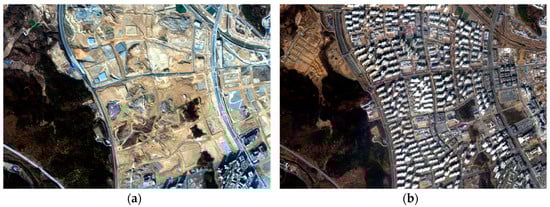
Figure 2.
The first subset from KOMPSAT-3 images acquired over Sejong City, South Korea, in (a) 16 November 2013, and (b) 26 February 2019.
From Figure 2, it can be seen that the study area has roads, trees, soil, and buildings. Therefore, MBI feature images were generated using the above images to highlight the buildings and to filter out other areas such as trees. For generating the MBI feature images, the parameters mentioned before (e.g., d = 0, 45, 90, 135 and s from 2 to 52 with an interval of 5) were used on the basis of the sizes, shapes, and spectral characteristics of buildings. Figure 3 shows the MBI feature images of image T1 and image T2.
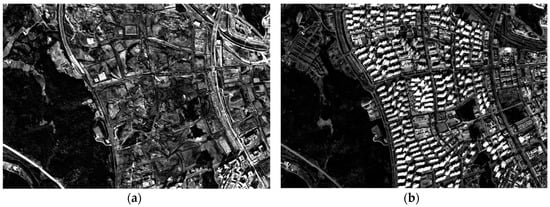
Figure 3.
Morphological building index (MBI) feature images of the first subset: (a) MBI T1 and (b) MBI T2.
Three intensity images were generated by using CVA, PCA, and IRMAD. Then a threshold ( = 0.3) was applied for generating the pixel-based binary change images. Binary change images were fused with the segmented image to generate the OBCD result by applying the D–S theory. The CD results from three PBCD classifiers (a–c), their OBCD results (d–f), OBCD result from fusing these three classifiers using major voting (g), the result generated using the proposed method (h), and CD reference map (i) are shown in Figure 4. It can be seen from Figure 4a–c that PBCD results generated many false alarms and salt-and-pepper noise. However, these aspects were minimized when PBCD results were extended to OBCD (Figure 4d–f). From Figure 4g–h, the noises and false alarms were minimized further when PBCD results were fused by using major voting techniques and the proposed method. However, the shapes of the buildings in the result generated by major voting were not proper because it failed to detect most parts of the buildings.
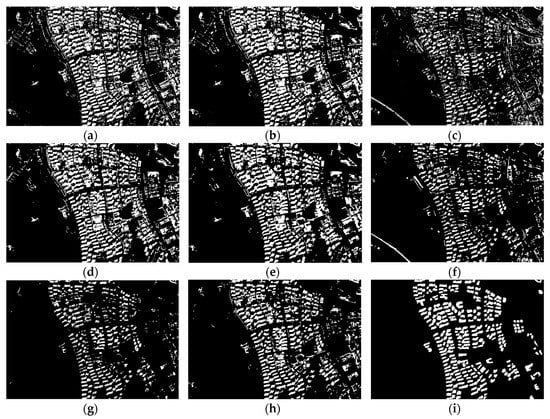
Figure 4.
Change detection results of the first subset: (a) pixel-based change detection (PBCD) using change vector analysis (CVA), (b) PBCD using principal component analysis (PCA), (c) PBCD using iteratively reweighted multivariate alteration detection (IRMAD), (d) object-based change detection (OBCD) using CVA, (e) OBCD using PCA, (f) OBCD using IRMAD, (g) OBCD using major voting, (h) OBCD using the proposed method, and (i) the reference map.
The numerical results of the first experiment are listed in Table 1. From the table, extending the PBCD results to OBCD improved the accuracy of CD. The F1-score of CVA, PCA, and IRMAD increased from 0.1622, 0.6386, and 0.5130 to 0.6247, 0.6526, and 0.5694, respectively. Moreover, kappa improved steadily while extending from PBCD to OBCD, and FAR was smaller for OBCD compared with that for PBCD. However, because of the over-detection in PBCD, MR was smaller for PBCD than that for OBCD.

Table 1.
Accuracy assessment of change detection results of the first experiment.
The OBCD result using the major voting technique to fuse the results from the three classifiers showed a lower F1-score than the object-based results of CVA, PCA, and IRMAD. Furthermore, the FAR of the major voting technique is less than all the other results because of the under-extraction of the changed regions. Moreover, the PCA-based PBCD result over-extracted the changed regions, which is confirmed by the fact that it has larger FAR and smaller MR compared with other PBCD results. On the other hand, the FAR and MR of the proposed method are quite reasonable, with the values of 0.0586 and 0.315. Moreover, the proposed method showed the highest F1-score and kappa with 0.6759 and 0.6194, respectively.
3.2. Experiment 2
The second experiment was conducted on the subset from KOMPSAT-3 satellite imagery with a size of 477 × 710 pixels, as shown in Figure 5. In this area, several changes have also taken place such as from trees to bare soil and from bare soil to buildings or roads. As we focus on buildings only, the same strategy in experiment 1 was used in this experiment.
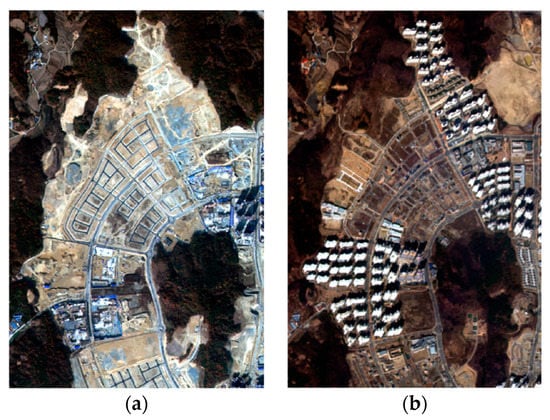
Figure 5.
The second subset from KOMPSAT-3 images acquired over Sejong City, South Korea, in (a) 16 November 2013, and (b) 26 February 2019.
The MBI feature images were generated to highlight the buildings only and to filter out other areas. The same parameters used in experiment 1 for generating MBI feature images were used. Figure 6 shows the MBI feature images for the second subset.
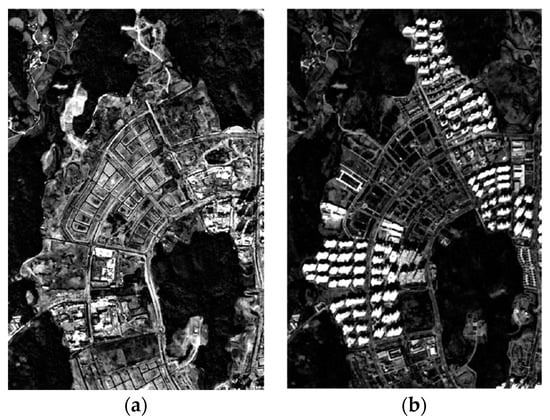
Figure 6.
MBI feature images of the second subset: (a) MBI T1 and (b) MBI T2.
Three change intensity images were generated using the three classifiers (e.g., CVA, PCA, and IRMAD) as in experiment 1. However, for converting the change intensity images to binary change images, the threshold ( = 0.4) was applied. The three binary change images were fused with the segmented image (conducted with the same parameters as experiment 1) using the D–S theory, and the OBCD result was generated. Furthermore, the OBCD was generated by fusing three binary change images with the segmented image using the major voting technique. The three binary change images were also extended to OBCD for the comparison with the proposed method. Figure 7 shows the three PBCD results, their extended OBCD results, the result of major voting technique, the result generated by the proposed method, and a change reference map. As similarly shown in experiment 1, the PBCD results on the second subset extracted more false alarms and salt-and-pepper noises compared with OBCD results. The noises are further minimized by the proposed method by reducing the missed detections and false alarms.
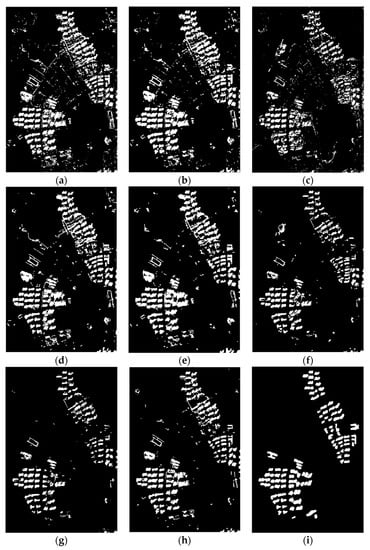
Figure 7.
Change detection results of the second subset: (a) PBCD using CVA, (b) PBCD using PCA, (c) PBCD using IRMAD, (d) OBCD using CVA, (e) OBCD using PCA, (f) OBCD using IRMAD, (g) OBCD using major voting, (h) OBCD using the proposed method, and (i) the reference map.
Table 2 shows the quantitative evaluation of the second subset. Overall, similarly to experiment 1, the performance of OBCD was better than the PBCD. The MR of pixel-based PCA was smaller compared with the MR of other results, including both the PBCD and OBCD, whereas the FAR was higher in pixel-based PCA as well as in other PBCD results because of the over-detection of changed areas. The FAR of the major voting technique was lower than those obtained by other results, whereas its MR was the highest, leading to the under-detection of changed areas. However, the proposed method can significantly detect the newly built-up buildings in changed areas, achieving the highest F1-score and kappa values as 0.6905 and 0.6613, respectively.
Table 2.
Accuracy assessment of change detection results of the second experiment.
4. Discussion
Among the three parameters in eCognition software, scale parameters have a great impact on the CD performance [51]. Therefore, for analyzing the effect of the scale parameter in the segmentation process, the F1-score was calculated for the proposed OBCD method and major voting technique while changing the values of the scale parameter from 20 to 100 with an interval of 10. Figure 8 shows the effect of the scale parameter on the CD performance. From Figure 8a, it can be seen that the proposed method showed a higher F1-score than the major voting technique and remained almost constant during the whole range of the scale parameters. Furthermore, the scale parameter had less effect on the result of the proposed method. A similar pattern was shown in experiment 2 (Figure 8b). The F1-score was highest at scale 60. Based on the sensitivity analysis of the scale parameter, we selected the scale parameter as 60 for both experiments.
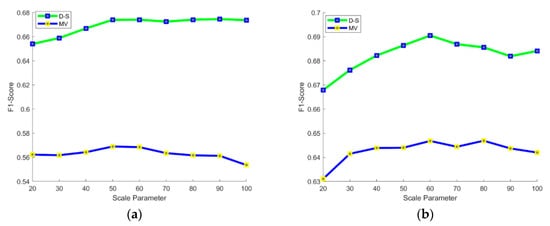
Figure 8.
Sensitivity analysis of the scale parameter: (a) experiment 1 and (b) experiment 2.
Figure 9 shows the F1-score of the proposed method and major voting by changing from 0.1 to 0.9 with an interval of 0.1. Overall, the graph illustrates that the proposed method showed a better result than the major voting technique. In experiment 1, the proposed method yielded the highest F1-score at ; in experiment 2 the proposed method yielded the highest F1-score at . According to these results, we selected a threshold with the highest F1-score for experiments 1 ( and 2 (. Moreover, we generated the results for both subsets using the automatic threshold selection method, such as the Otsu method. The F1-sore generated by applying the Otsu method instead of in experiments 1 and 2 was 0.6742 and 0.6884, respectively. The F1-scores of experiments 1 and 2 generated using are 0.6759 and 0.6905, respectively. The thresholds generated by the Ostu method for the three PBCD techniques using both subsets are between 0.3 and 0.45. Hence, we propose a range from 0.3 to 0.45 because a very small threshold will detect unnecessary areas such as changes in trees or soil and result in many false alarms, while a high threshold will result in a large number of missed detections. Furthermore, the proposed method can be applied to different datasets using automatic threshold selection methods as well.
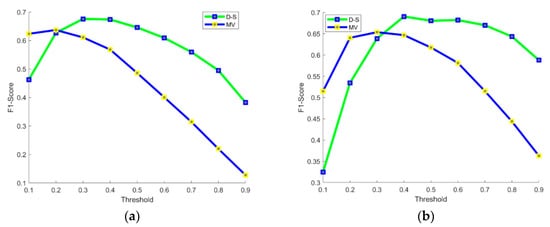
Figure 9.
Sensitivity analysis of the threshold for OBCD: (a) experiment 1 and (b) experiment 2.
Moreover, the effectiveness of the proposed method can be analyzed by comparing the F1-score and kappa of the proposed method with other CD results. The proposed method can effectively detect the recently constructed high-rise buildings with complete shapes and can minimize the detection of roads or soil having the same spectral characteristics with buildings. Moreover, MBI effectively filtered out building shadows and improved the accuracy of the CD results.
To prove the effectiveness of the proposed method, we conducted experiments using the four bands (red, green, blue, and near infrared) of original images (i.e., images T1 and T2) without considering MBI. The OBCD results for both subsets were generated by CVA, IRMAD, and PCA applied to the original images using the D–S theory method [31] and major voting techniques. The OBCD results are presented in Figure 10. The F1-scores of the first subset using the major voting and D–S theory were 0.2971 and 0.3299, respectively, whereas the F1-scores of the second subset using the major voting and D–S theory were 0.3248 and 0.3647, respectively. The reason behind the low F1-score is that both methods detect shadows as the changed objects as well as changes in trees and soil that are unrelated to buildings. Table 3 and Table 4 show the accuracy evaluation performance of the first and second subsets, respectively.
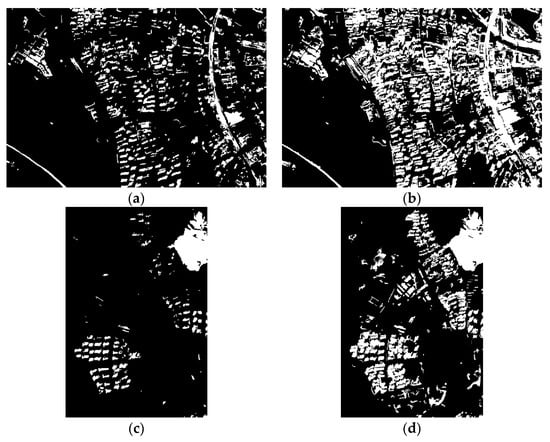
Figure 10.
OBCD results without using MBI: (a) OBCD result of the first subset using major voting, (b) OBCD result of the first subset using D–S theory, (c) OBCD result of the second subset using major voting, and (d) OBCD result of the second subset using D–S theory.
Table 3.
Accuracy assessment of change detection for first subset results generated without using MBI and by the proposed method.
Table 4.
Accuracy assessment of change detection for second subset results generated without using MBI and by the proposed method.
Furthermore, the FAR is minimized in the CD result along with the acceptable MR. However, in other CD results, if the FAR is lower than the MR is higher and vice versa. The reason for the missed detection in the proposed method is the small buildings having the same spectral characteristics as the background of the high-rise buildings in both subsets and being filtered out by MBI as background but being included in the reference map (Figure 11). Moreover, the buildings in both images (i.e., image T1 and image T2) had different spectral characteristics as well as different shooting angles. The buildings in the first subset have different shooting angles. Moreover, the buildings in the second subset (image T1) had almost the same spectral characteristics with the background in that area and were recognized as background by the MBI process. Therefore, they were detected as newly built-up buildings by the CD process but were not included in the CD reference map. As a result, FAR is improved in the CD results (Figure 12), and the accuracy of the CD result is reduced.
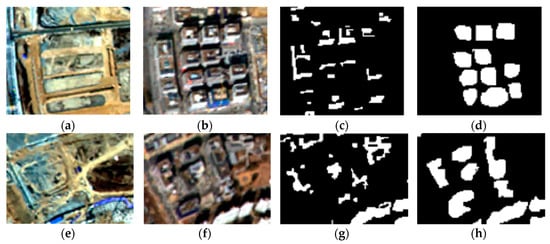
Figure 11.
Examples of missed detection cases in experiment 1 (a–d) and experiment 2 (e–h): (a) image T1 of the first subset, (b) image T2 of the first subset, (c) the result of the first subset by the proposed method, (d) the reference map of the first subset, (e) image T1 of the second subset, (f) image T2 of the second subset, (g) the result of the second subset by the proposed method, and (h) the reference map of the second subset.
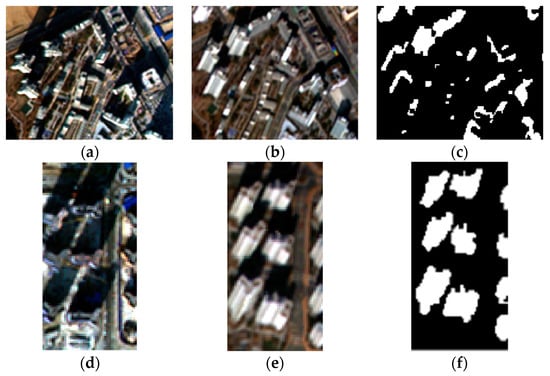
Figure 12.
Examples of false alarms in experiment 1 (a–c) and experiment 2 (d–f), (a) image T1 of the first subset, (b) image T2 of the first subset, (c) the result of the first subset by the proposed method, (d) image T1 of the second subset, (e) image T2 of the second subset, and (f) the result of the second subset by the proposed method.
5. Conclusions
We proposed a method for object-based building CD by using D–S theory to fuse multiple PBCD results with the segmented image. MBI feature images were generated from the multitemporal VHR imagery. Then, the three PBCD results were generated from MBI feature images. In the D–S theory, certainty weight is automatically calculated and assigned while calculating change, nochange, and uncertainty. The proposed method can detect new buildings and, with the use of MBI, the CD results were improved by eliminating shadows effects or other similar objects such as roads. The impacts of false and missed detections of changes irrespective to buildings can be effectively minimized using MBI. Moreover, the proposed method can achieve reliable object-based CD results, irrespective of the scale parameter in the segmented image. For developing the proposed method, two subsets from VHR multitemporal images were used. The comparison of the proposed method with existing PBCD and OBCD methods proved the superiority of the proposed method over existing CD methods by achieving the highest F1-score and kappa value.
The proposed method can detect changes related to newly built-up regions as well as partially and totally demolished buildings in the suburban and urban areas using the VHR imagery. Therefore, the proposed method can contribute to the United Nations Sustainable Development Goal 11 by detecting the changes related to modified buildings as well as new buildings in urban areas, which can help plan the development of sustainable cities in the future. However, proper parameter selection is vital depending on the sizes and spectral characteristics of the buildings in the study areas. Furthermore, if the proposed method is applied to datasets with different acquisition angles, the CD result will contain falsely detected changed buildings.
In our future work, we will consider avoiding the shortcomings which affect the CD result of the VHR multitemporal dataset, such as the missed detection of buildings because of their having the same spectral characteristics as the background or falsely detecting buildings as changed buildings because of the different acquisition angles. Furthermore, we will apply the proposed method to datasets related to building changes acquired by different satellite sensors.
Author Contributions
Conceptualization, Methodology, A.J. and Y.H.; Software, A.J. and S.J.; Validation, A.J. and Y.H.; Investigation, S.J. and W.H.L.; Writing—Original Draft Preparation, A.J.; Writing—review and editing, Y.H. All authors have read and agreed to the published version of the manuscript.
Funding
This work was supported by the National Research Foundation of Korea (NRF) grant funded by the Korean government (MSIP) (2017R1C1B2005744).
Conflicts of Interest
The authors declare no conflict of interest.
References
- Bai, X.; Shi, P.; Liu, Y. Society: Realizing China’s urban dream. Nat. News 2014, 509, 158. [Google Scholar] [CrossRef]
- Grubler, A.; Bai, X.; Buettner, T.; Dhakal, S.; Fisk, D.J.; Ichinose, T.; Keirstead, J.E.; Sammer, G.; Satterthwaite, D.; Schulz, N.B.; et al. Chapter 18-Urban Energy Systems. In Global Energy Assessment; Cambridge University Press: Cambridge, UK; International Institute for Applied Systems Analysis: Laxenburg, Austria, 2012; pp. 1307–1400. [Google Scholar]
- Seto, K.C.; Dhakal, S.; Bigio, A.; Blanco, H.; Delgado, G.C.; Dewar, D.; Huang, L.; Inaba, A.; Kansal, A.; Lwasa, S.; et al. Human Settlements, Infrastructure and Spatial Planning; Cambridge University Press: Cambridge, UK; New York, NY, USA, 2014. [Google Scholar]
- United Nations Development Program (UNDP). UNDP Support to the Implementation of the 2030 Agenda for Sustainable Development; UNDP Policy and Programme Brief: New York, NY, USA, 2016. [Google Scholar]
- Le Blanc, D. Towards integration at last? The sustainable development goals as a network of targets. Sustain. Dev. 2015, 23, 176–187. [Google Scholar] [CrossRef]
- Hussain, M.; Chen, D.; Cheng, A.; Wei, H.; Stanley, D. Change detection from remotely sensed images: From pixel-based to object-based approaches. ISPRS J. Photogramm. Remote Sens. 2013, 80, 91–106. [Google Scholar] [CrossRef]
- Singh, A. Review article digital change detection techniques using remotely-sensed data. Int. J. Remote Sens. 1989, 10, 989–1003. [Google Scholar] [CrossRef]
- Dalla Mura, M.; Benediktsson, J.A.; Bovolo, F.; Bruzzone, L. An unsupervised technique based on morphological filters for change detection in very high resolution images. IEEE Geosci. Remote Sens. Lett. 2008, 5, 433–437. [Google Scholar] [CrossRef]
- Falco, N.; Dalla Mura, M.; Bovolo, F.; Benediktsson, J.A.; Bruzzone, L. Change detection in VHR images based on morphological attribute profiles. IEEE Geosci. Remote Sens. Lett. 2012, 10, 636–640. [Google Scholar] [CrossRef]
- Liu, S.; Du, Q.; Tong, X.; Samat, A.; Bruzzone, L. Unsupervised change detection in multispectral remote sensing images via spectral-spatial band expansion. IEEE J. Sel. Top. Appl. Earth Obs. Remote Sens. 2019, 12, 3578–3587. [Google Scholar] [CrossRef]
- Bovolo, F.; Bruzzone, L. A theoretical framework for unsupervised change detection based on change vector analysis in the polar domain. IEEE Trans. Geosci. Remote Sens. 2006, 45, 218–236. [Google Scholar] [CrossRef]
- Ridd, M.K.; Liu, J. A comparison of four algorithms for change detection in an urban environment. Remote Sens. Environ. 1998, 63, 95–100. [Google Scholar] [CrossRef]
- Liu, S.; Marinelli, D.; Bruzzone, L.; Bovolo, F. A review of change detection in multitemporal hyperspectral images: Current techniques, applications, and challenges. IEEE Geosci. Remote Sens. Mag. 2019, 7, 140–158. [Google Scholar] [CrossRef]
- Carvalho Júnior, O.A.; Guimarães, R.F.; Gillespie, A.R.; Silva, N.C.; Gomes, R.A.T. A new approach to change vector analysis using distance and similarity measures. Remote Sens. 2011, 3, 2473–2493. [Google Scholar] [CrossRef]
- Lu, J.; Li, J.; Chen, G.; Zhao, L.; Xiong, B.; Kuang, G. Improving pixel-based change detection accuracy using an object-based approach in multitemporal SAR Flood Images. IEEE J. Sel. Top. Appl. Earth Obs. Remote Sens. 2015, 8, 3486–3496. [Google Scholar] [CrossRef]
- Chen, G.; Hay, G.J.; Carvalho, L.M.; Wulder, M.A. Object-based change detection. Int. J. Remote Sens. 2012, 33, 4434–4457. [Google Scholar] [CrossRef]
- Bovolo, F.; Bruzzone, L.; Marchesi, S. Analysis and adaptive estimation of the registration noise distribution in multitemporal VHR images. IEEE Trans. Geosci. Remote Sens. 2009, 47, 2658–2671. [Google Scholar] [CrossRef]
- Zhou, Z.; Ma, L.; Fu, T.; Zhang, G.; Yao, M.; Li, M. Change detection in coral reef environment using high-resolution images: Comparison of object-based and pixel-based paradigms. ISPRS Int. J. Geo Inf. 2018, 7, 441. [Google Scholar] [CrossRef]
- Keyport, R.N.; Oommen, T.; Martha, T.R.; Sajinkumar, K.S.; Gierke, J.S. A comparative analysis of pixel-and object-based detection of landslides from very high-resolution images. Int. J. Appl. Earth Obs. Geoinf. 2018, 64, 1–11. [Google Scholar] [CrossRef]
- Tang, Y.; Zhang, L.; Huang, X. Object-oriented change detection based on the Kolmogorov–Smirnov test using high-resolution multispectral imagery. Int. J. Remote Sens. 2011, 32, 5719–5740. [Google Scholar] [CrossRef]
- Ma, L.; Li, M.; Blaschke, T.; Ma, X.; Tiede, D.; Cheng, L.; Chen, Z.; Chen, D. Object-based change detection in urban areas: The effects of segmentation strategy, scale, and feature space on unsupervised methods. Remote Sens. 2016, 8, 761. [Google Scholar] [CrossRef]
- Cui, G.; Lv, Z.; Li, G.; Atli Benediktsson, J.; Lu, Y. Refining land cover classification maps based on dual-adaptive majority voting strategy for very high resolution remote sensing images. Remote Sens. 2018, 10, 1238. [Google Scholar] [CrossRef]
- Cai, L.; Shi, W.; Zhang, H.; Hao, M. Object-oriented change detection method based on adaptive multi-method combination for remote-sensing images. Int. J. Remote Sens. 2016, 37, 5457–5471. [Google Scholar] [CrossRef]
- Rasti, B.; Hong, D.; Hang, R.; Ghamisi, P.; Kang, X.; Chanussot, J.; Benediktsson, J. Feature extraction for hyperspectral imagery: The evolution from shallow to deep (overview and toolbox). IEEE Geosci. Remote Sens. Mag. 2020. [Google Scholar] [CrossRef]
- Hong, D.; Yokoya, N.; Chanussot, J.; Zhu, X.X. An augmented linear mixing model to address spectral variability for hyperspectral unmixing. IEEE Trans. on Image Proces. 2019, 28, 1923–1938. [Google Scholar] [CrossRef] [PubMed]
- Wu, J.; Li, B.; Ni, W.; Yan, W. An adaptively weighted multi-feature method for object-based change detection in high spatial resolution remote sensing images. Remote Sens. Lett. 2020, 11, 333–342. [Google Scholar] [CrossRef]
- Xiao, P.; Zhang, X.; Wang, D.; Yuan, M.; Feng, X.; Kelly, M. Change detection of built-up land: A framework of combining pixel-based detection and object-based recognition. ISPRS J. Photogramm. Remote Sens. 2016, 119, 402–414. [Google Scholar] [CrossRef]
- Lv, Z.; Liu, T.; Wan, Y.; Benediktsson, J.A.; Zhang, X. Post-processing approach for refining raw land cover change detection of very-high-resolution remote sensing images. Remote Sens. 2018, 10, 472. [Google Scholar] [CrossRef]
- Zheng, Z.; Cao, J.; Lv, Z.; Benediktsson, J.A. Spatial–spectral feature fusion coupled with multi-scale segmentation voting decision for detecting land cover change with VHR remote sensing images. Remote Sens. 2019, 11, 1903. [Google Scholar] [CrossRef]
- Luo, H.; Liu, C.; Wu, C.; Guo, X. Urban change detection based on dempster–shafer theory for multitemporal very-high-resolution imagery. Remote Sens. 2018, 10, 980. [Google Scholar] [CrossRef]
- Han, Y.; Javed, A.; Jung, S.; Liu, S. Object-Based Change Detection of Very High Resolution Images by Fusing Pixel-Based Change Detection Results Using Weighted Dempster–Shafer Theory. Remote Sens. 2020, 12, 983. [Google Scholar] [CrossRef]
- Liu, H.; Yang, M.; Chen, J.; Hou, J.; Deng, M. Line-constrained shape feature for building change detection in VHR remote sensing imagery. ISPRS Int. J. Geo-Inf. 2018, 7, 410. [Google Scholar] [CrossRef]
- Im, J.; Jensen, J.R.; Tullis, J.A. Object-based change detection using correlation image analysis and image segmentation. Int. J. Remote Sens. 2008, 29, 399–423. [Google Scholar] [CrossRef]
- Huang, X.; Zhang, L.; Zhu, T. Building change detection from multitemporal high-resolution remotely sensed images based on a morphological building index. IEEE J. Sel. Top. Appl. Earth Obs. Remote Sens. 2013, 7, 105–115. [Google Scholar] [CrossRef]
- Li, J.; Cao, J.; Feyissa, M.E.; Yang, X. Automatic building detection from very high-resolution images using multiscale morphological attribute profiles. Remote Sens. Lett. 2020, 11, 640–649. [Google Scholar] [CrossRef]
- Leichtle, T.; Geiß, C.; Wurm, M.; Lakes, T.; Taubenböck, H. Unsupervised change detection in VHR remote sensing imagery–an object-based clustering approach in a dynamic urban environment. Int. J. Appl. Earth Obs. Geoinf. 2017, 54, 15–27. [Google Scholar] [CrossRef]
- Cao, S.; Du, M.; Zhao, W.; Hu, Y.; Mo, Y.; Chen, S.; Cai, Y.; Peng, Z.; Zhang, C. Multi-level monitoring of three-dimensional building changes for megacities: Trajectory, morphology, and landscape. ISPRS J. Photogramm. Remote Sens. 2020, 167, 54–70. [Google Scholar] [CrossRef]
- Awrangjeb, M.; Gilani, S.A.N.; Siddiqui, F.U. An effective data-driven method for 3-d building roof reconstruction and robust change detection. Remote Sens. 2018, 10, 1512. [Google Scholar] [CrossRef]
- Zhang, X.; Xiao, P.; Feng, X.; Yuan, M. Separate segmentation of multi-temporal high-resolution remote sensing images for object-based change detection in urban area. Remote Sens. Environ. 2017, 201, 243–255. [Google Scholar] [CrossRef]
- Huang, X.; Zhu, T.; Zhang, L.; Tang, Y. A novel building change index for automatic building change detection from high-resolution remote sensing imagery. Remote Sens. Lett. 2014, 5, 713–722. [Google Scholar] [CrossRef]
- Wen, D.; Huang, X.; Zhang, L.; Benediktsson, J.A. A novel automatic change detection method for urban high-resolution remotely sensed imagery based on multiindex scene representation. IEEE Trans. Geosci. Remote Sens. 2015, 54, 609–625. [Google Scholar] [CrossRef]
- Sheikh, M.A.A.; Kole, A.; Maity, T. A multi-level approach for change detection of buildings using satellite imagery. Int. J. Artif. Intell. Tools 2018, 27, 1850031. [Google Scholar] [CrossRef]
- Huang, X.; Zhang, L. A multidirectional and multiscale morphological index for automatic building extraction from multispectral GeoEye-1 imagery. Photogramm. Eng. Remote Sens. 2011, 77, 721–732. [Google Scholar] [CrossRef]
- Celik, T. Unsupervised change detection in satellite images using principal component analysis and K-means clustering. IEEE Geosci. Remote Sens. Lett. 2009, 6, 772–776. [Google Scholar] [CrossRef]
- Nielsen, A.A. The regularized iteratively reweighted MAD method for change detection in multi-and hyperspectral data. IEEE Trans. Image Process. 2007, 16, 463–478. [Google Scholar] [CrossRef] [PubMed]
- Lee, H.; Seo, D.; Ahn, K.; Jeong, D. Positioning accuracy analysis of KOMPSAT-3 satellite imagery by RPC adjustment. J. Korean Soc. Surv. Geod. Photogramm. Cartogr. 2013, 31, 503–509. [Google Scholar] [CrossRef][Green Version]
- Happ, P.N.; Ferreira, R.S.; Bentes, C.; Costa, G.A.O.P.; Feitosa, R.Q. Multiresolution segmentation: A parallel approach for high resolution image segmentation in multicore architectures. Int. Arch. Photogramm. Remote Sens. Spat. Inf. Sci. 2010, 38, C7. [Google Scholar]
- Zhang, Y.; Maxwell, T.; Tong, H.; Dey, V. Development of a Supervised Software Tool for Automated Determination of Optimal Segmentation Parameters for Ecognition. In Proceedings of the ISPRS TC VII symposium-100 Years ISPRS, Vienna, Austria, 5–7 July 2010. [Google Scholar]
- Belgiu, M.; Drǎguţ, L. Comparing supervised and unsupervised multiresolution segmentation approaches for extracting buildings from very high resolution imagery. ISPRS J. Photogramm. Remote Sens. 2014, 96, 67–75. [Google Scholar] [CrossRef]
- Drăguţ, L.; Csillik, O.; Eisank, C.; Tiede, D. Automated parameterisation for multi-scale image segmentation on multiple layers. ISPRS J. Photogramm. Remote Sens. 2014, 88, 119–127. [Google Scholar] [CrossRef]
- Ma, L.; Li, M.; Ma, X.; Cheng, L.; Du, P.; Liu, Y. A review of supervised object-based land-cover image classification. ISPRS J. Photogramm. Remote Sens. 2017, 130, 277–293. [Google Scholar] [CrossRef]
- Huang, X.; Zhang, L. Morphological building/shadow index for building extraction from high-resolution imagery over urban areas. IEEE J. Sel. Top. Appl. Earth Obs. Remote Sens. 2011, 5, 161–172. [Google Scholar] [CrossRef]
- Pesaresi, M.; Benediktsson, J.A. A new approach for the morphological segmentation of high-resolution satellite imagery. IEEE Trans. Geosci. Remote Sens. 2001, 39, 309–320. [Google Scholar] [CrossRef]
- Soille, P.; Talbot, H. Directional morphological filtering. IEEE Trans. Pattern Anal. Mach. Intell. 2001, 23, 1313–1329. [Google Scholar] [CrossRef]
- You, Y.; Wang, S.; Ma, Y.; Chen, G.; Wang, B.; Shen, M.; Liu, W. Building detection from VHR remote sensing imagery based on the morphological building index. Remote Sens. 2018, 10, 1287. [Google Scholar] [CrossRef]
- Shafer, G. Dempster-shafer theory. Encycl. Artif. Intell. 1992, 1, 330–331. [Google Scholar]
- Han, Y.; Kim, T.; Yeom, J. Improved piecewise linear transformation for precise warping of very-high-resolution remote sensing images. Remote Sens. 2019, 11, 2235. [Google Scholar] [CrossRef]
© 2020 by the authors. Licensee MDPI, Basel, Switzerland. This article is an open access article distributed under the terms and conditions of the Creative Commons Attribution (CC BY) license (http://creativecommons.org/licenses/by/4.0/).