Impacts of Drought on Vegetation Assessed by Vegetation Indices and Meteorological Factors in Afghanistan

 ,
, 
 ,
, 
 ,
, 

Abstract
1. Introduction
2. Study Area and Material and Methods
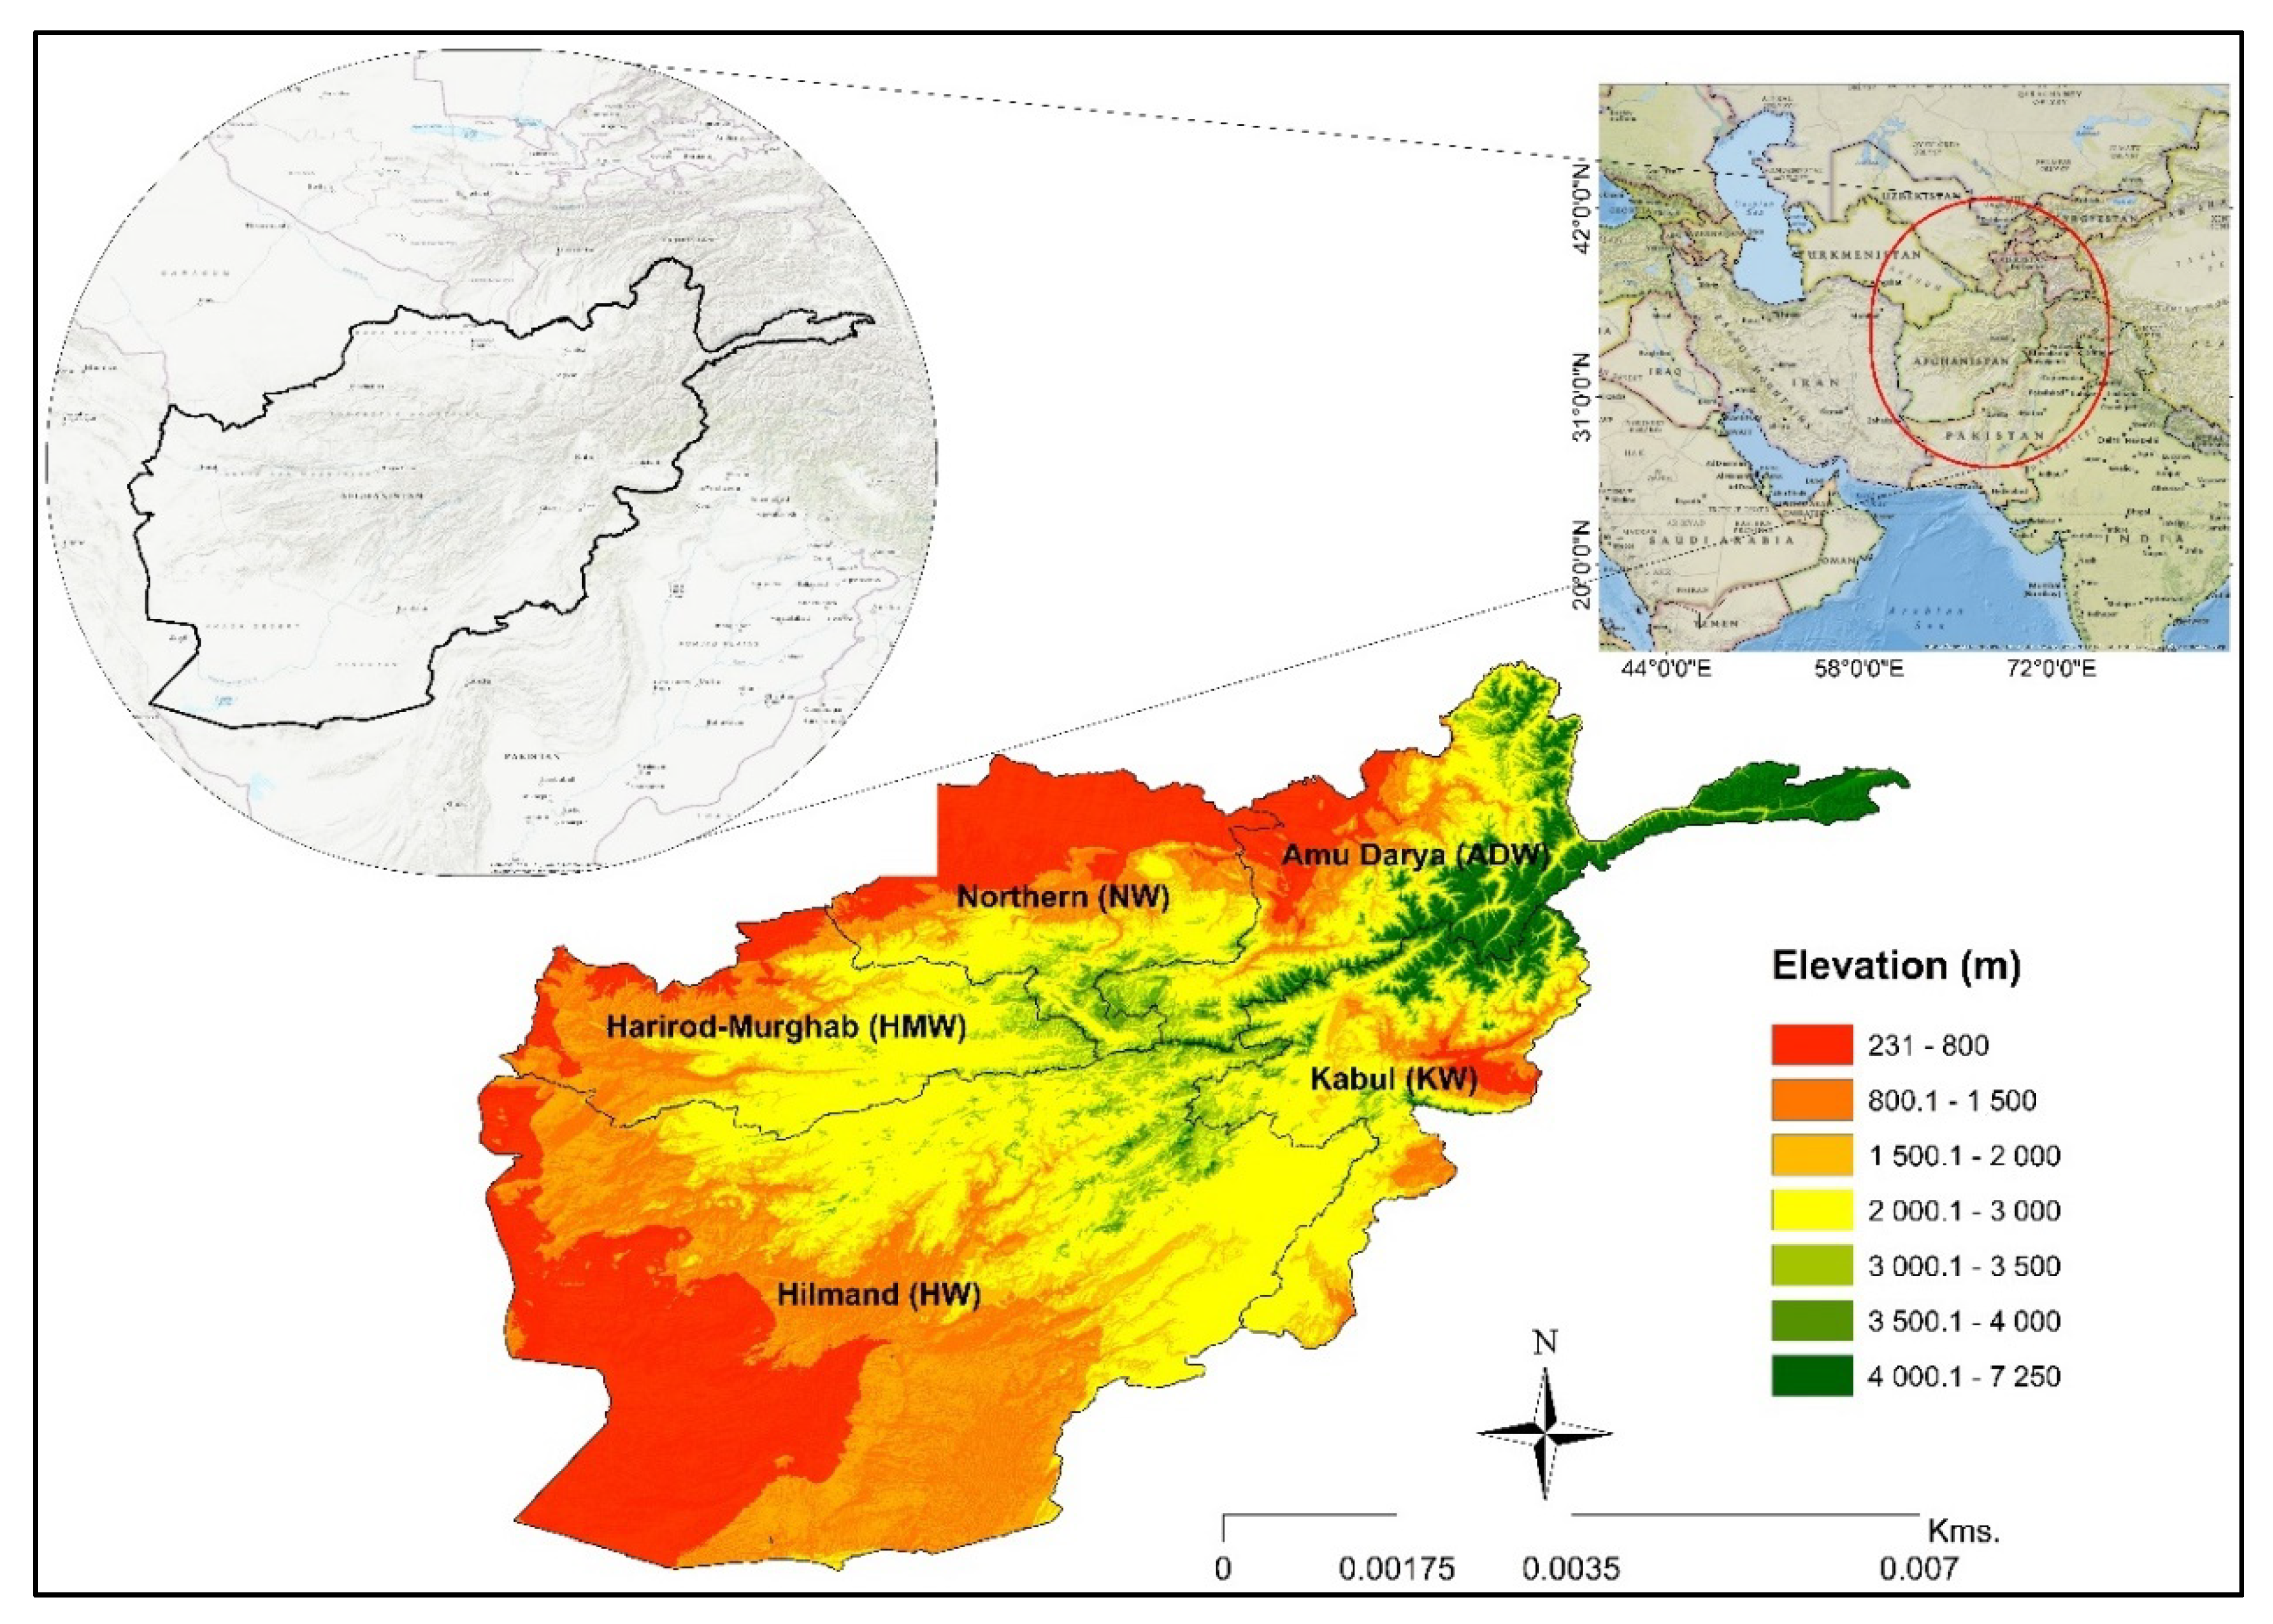
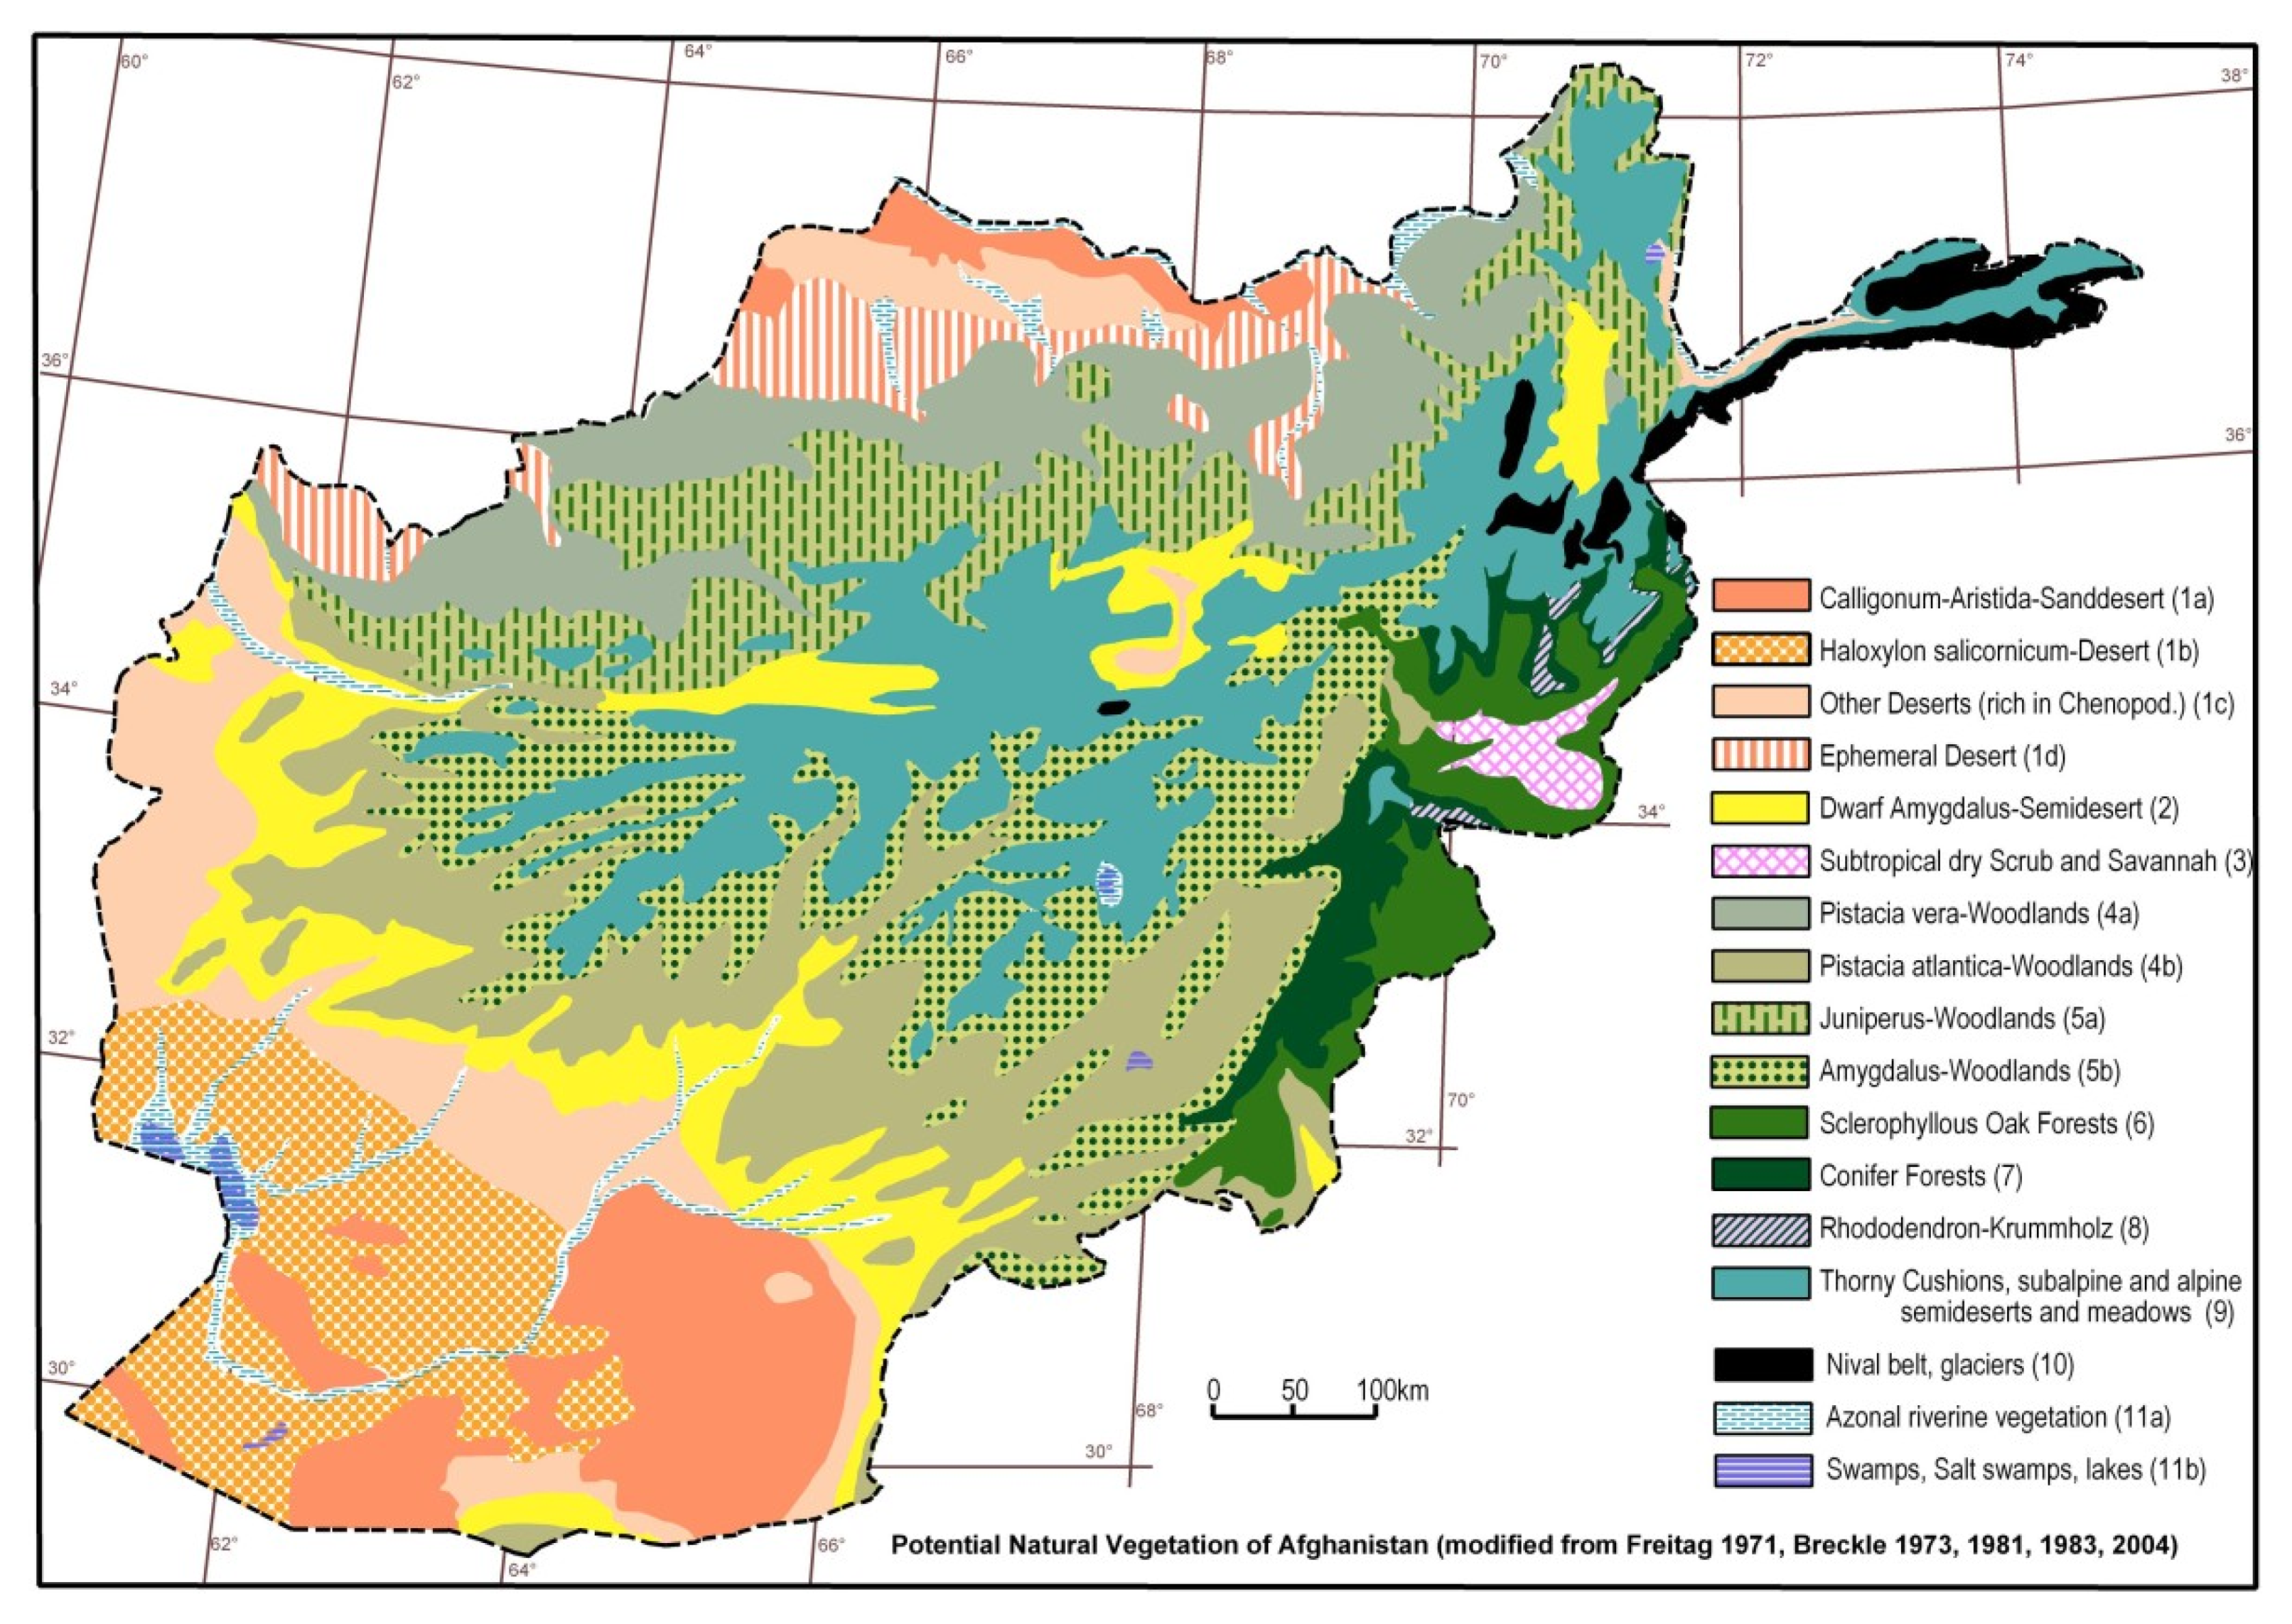
2.1. Study Area
2.2. Data and Methodology
2.2.1. Normalized Difference Vegetation Index (NDVI)
2.2.2. TRMM
Standardized Precipitation Index (SPI)
2.2.3. Land Surface Temperature (LST)
2.2.4. Vegetation Condition Index (VCI)
2.2.5. Linear Regression
3. Results and discussion
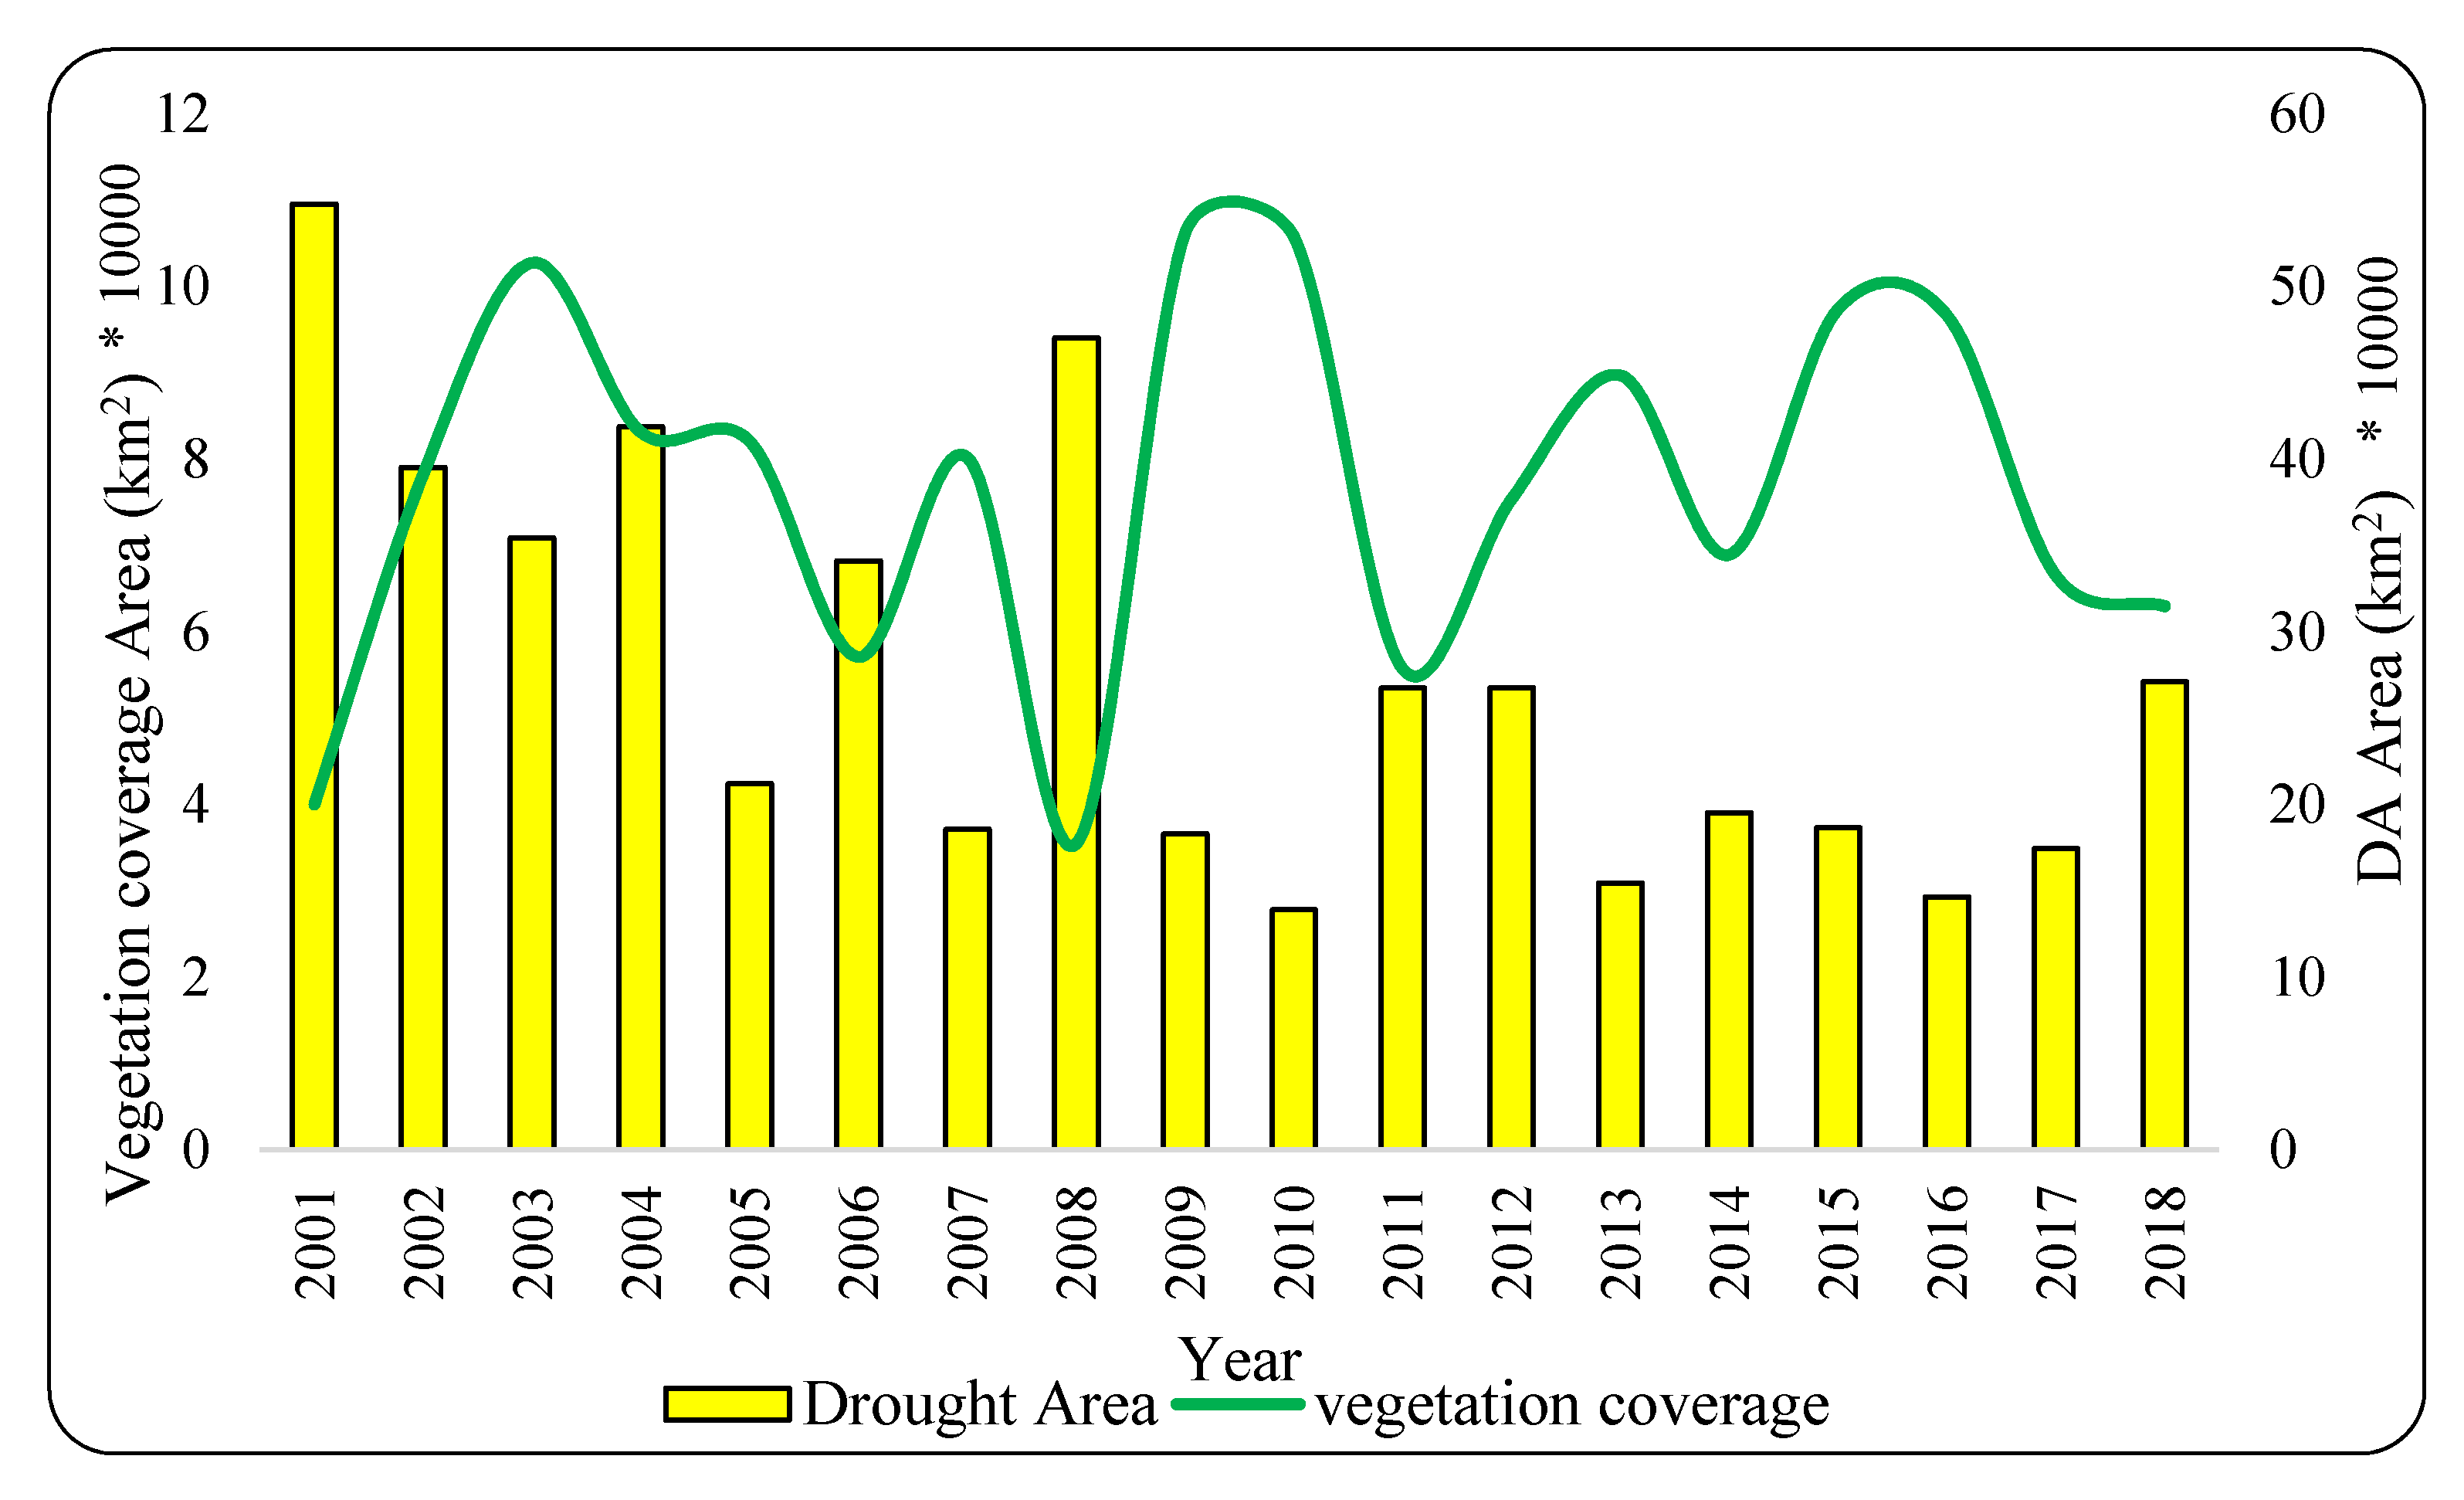
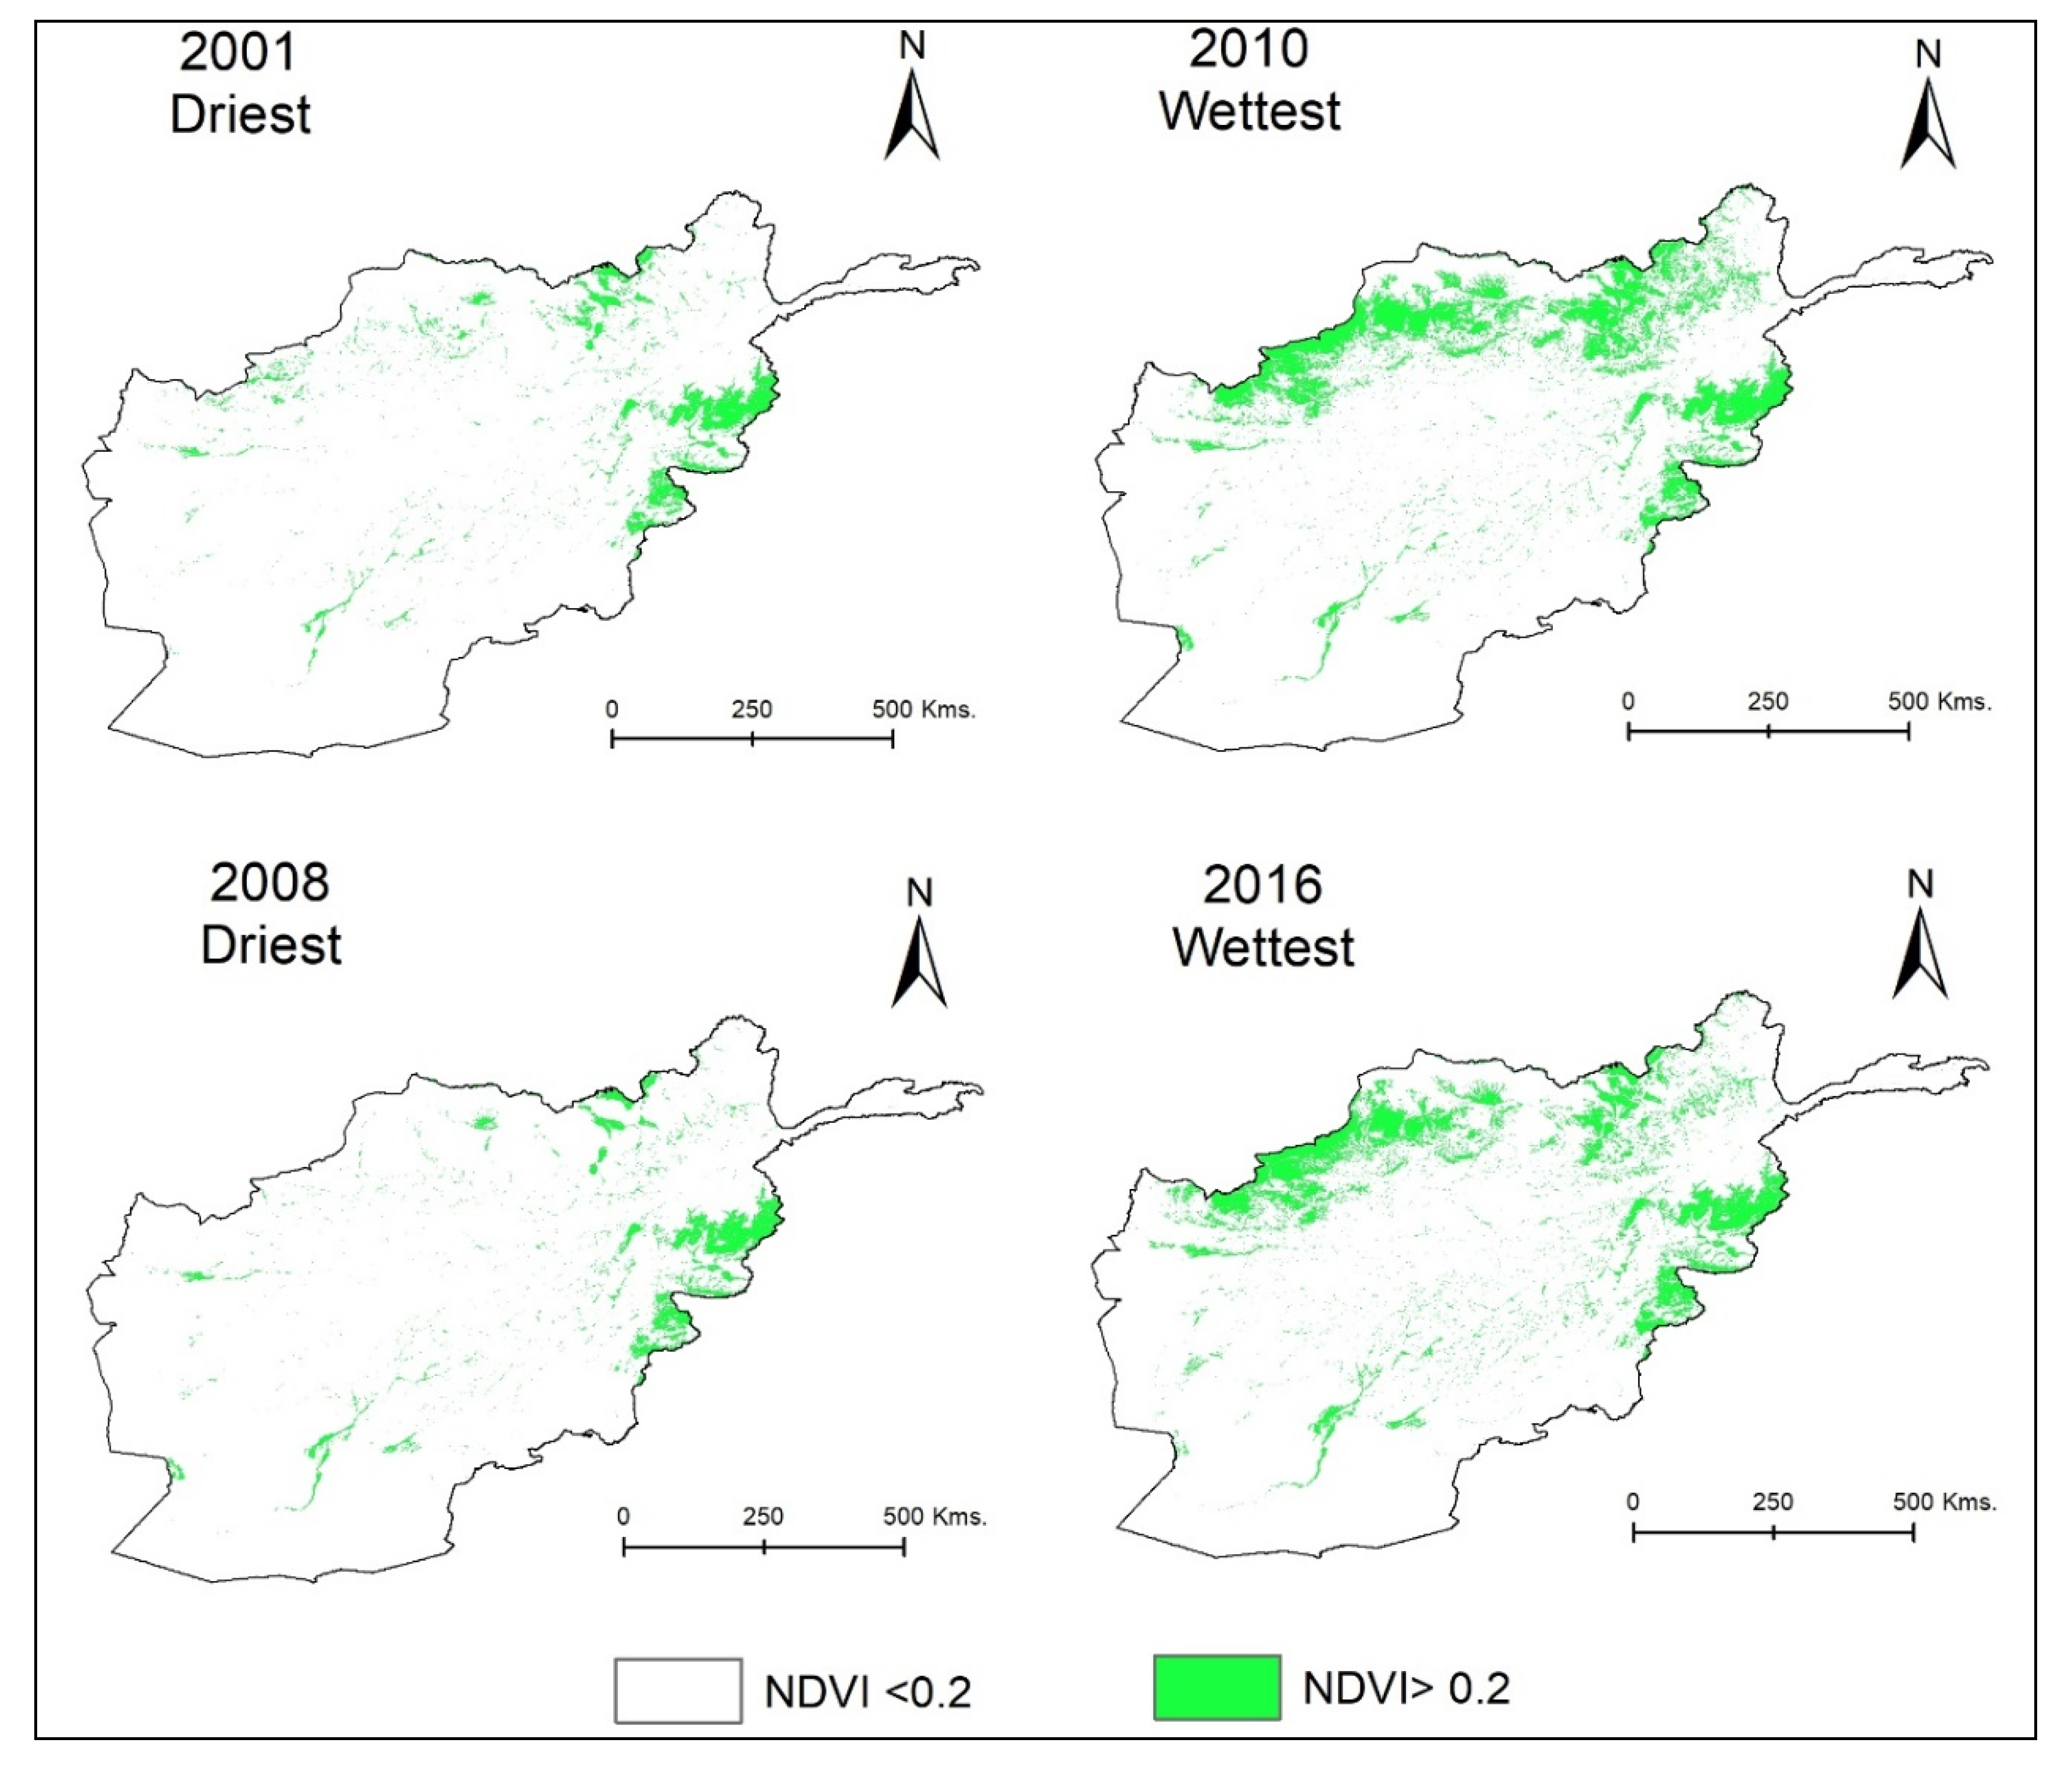
3.1. NDVI Change
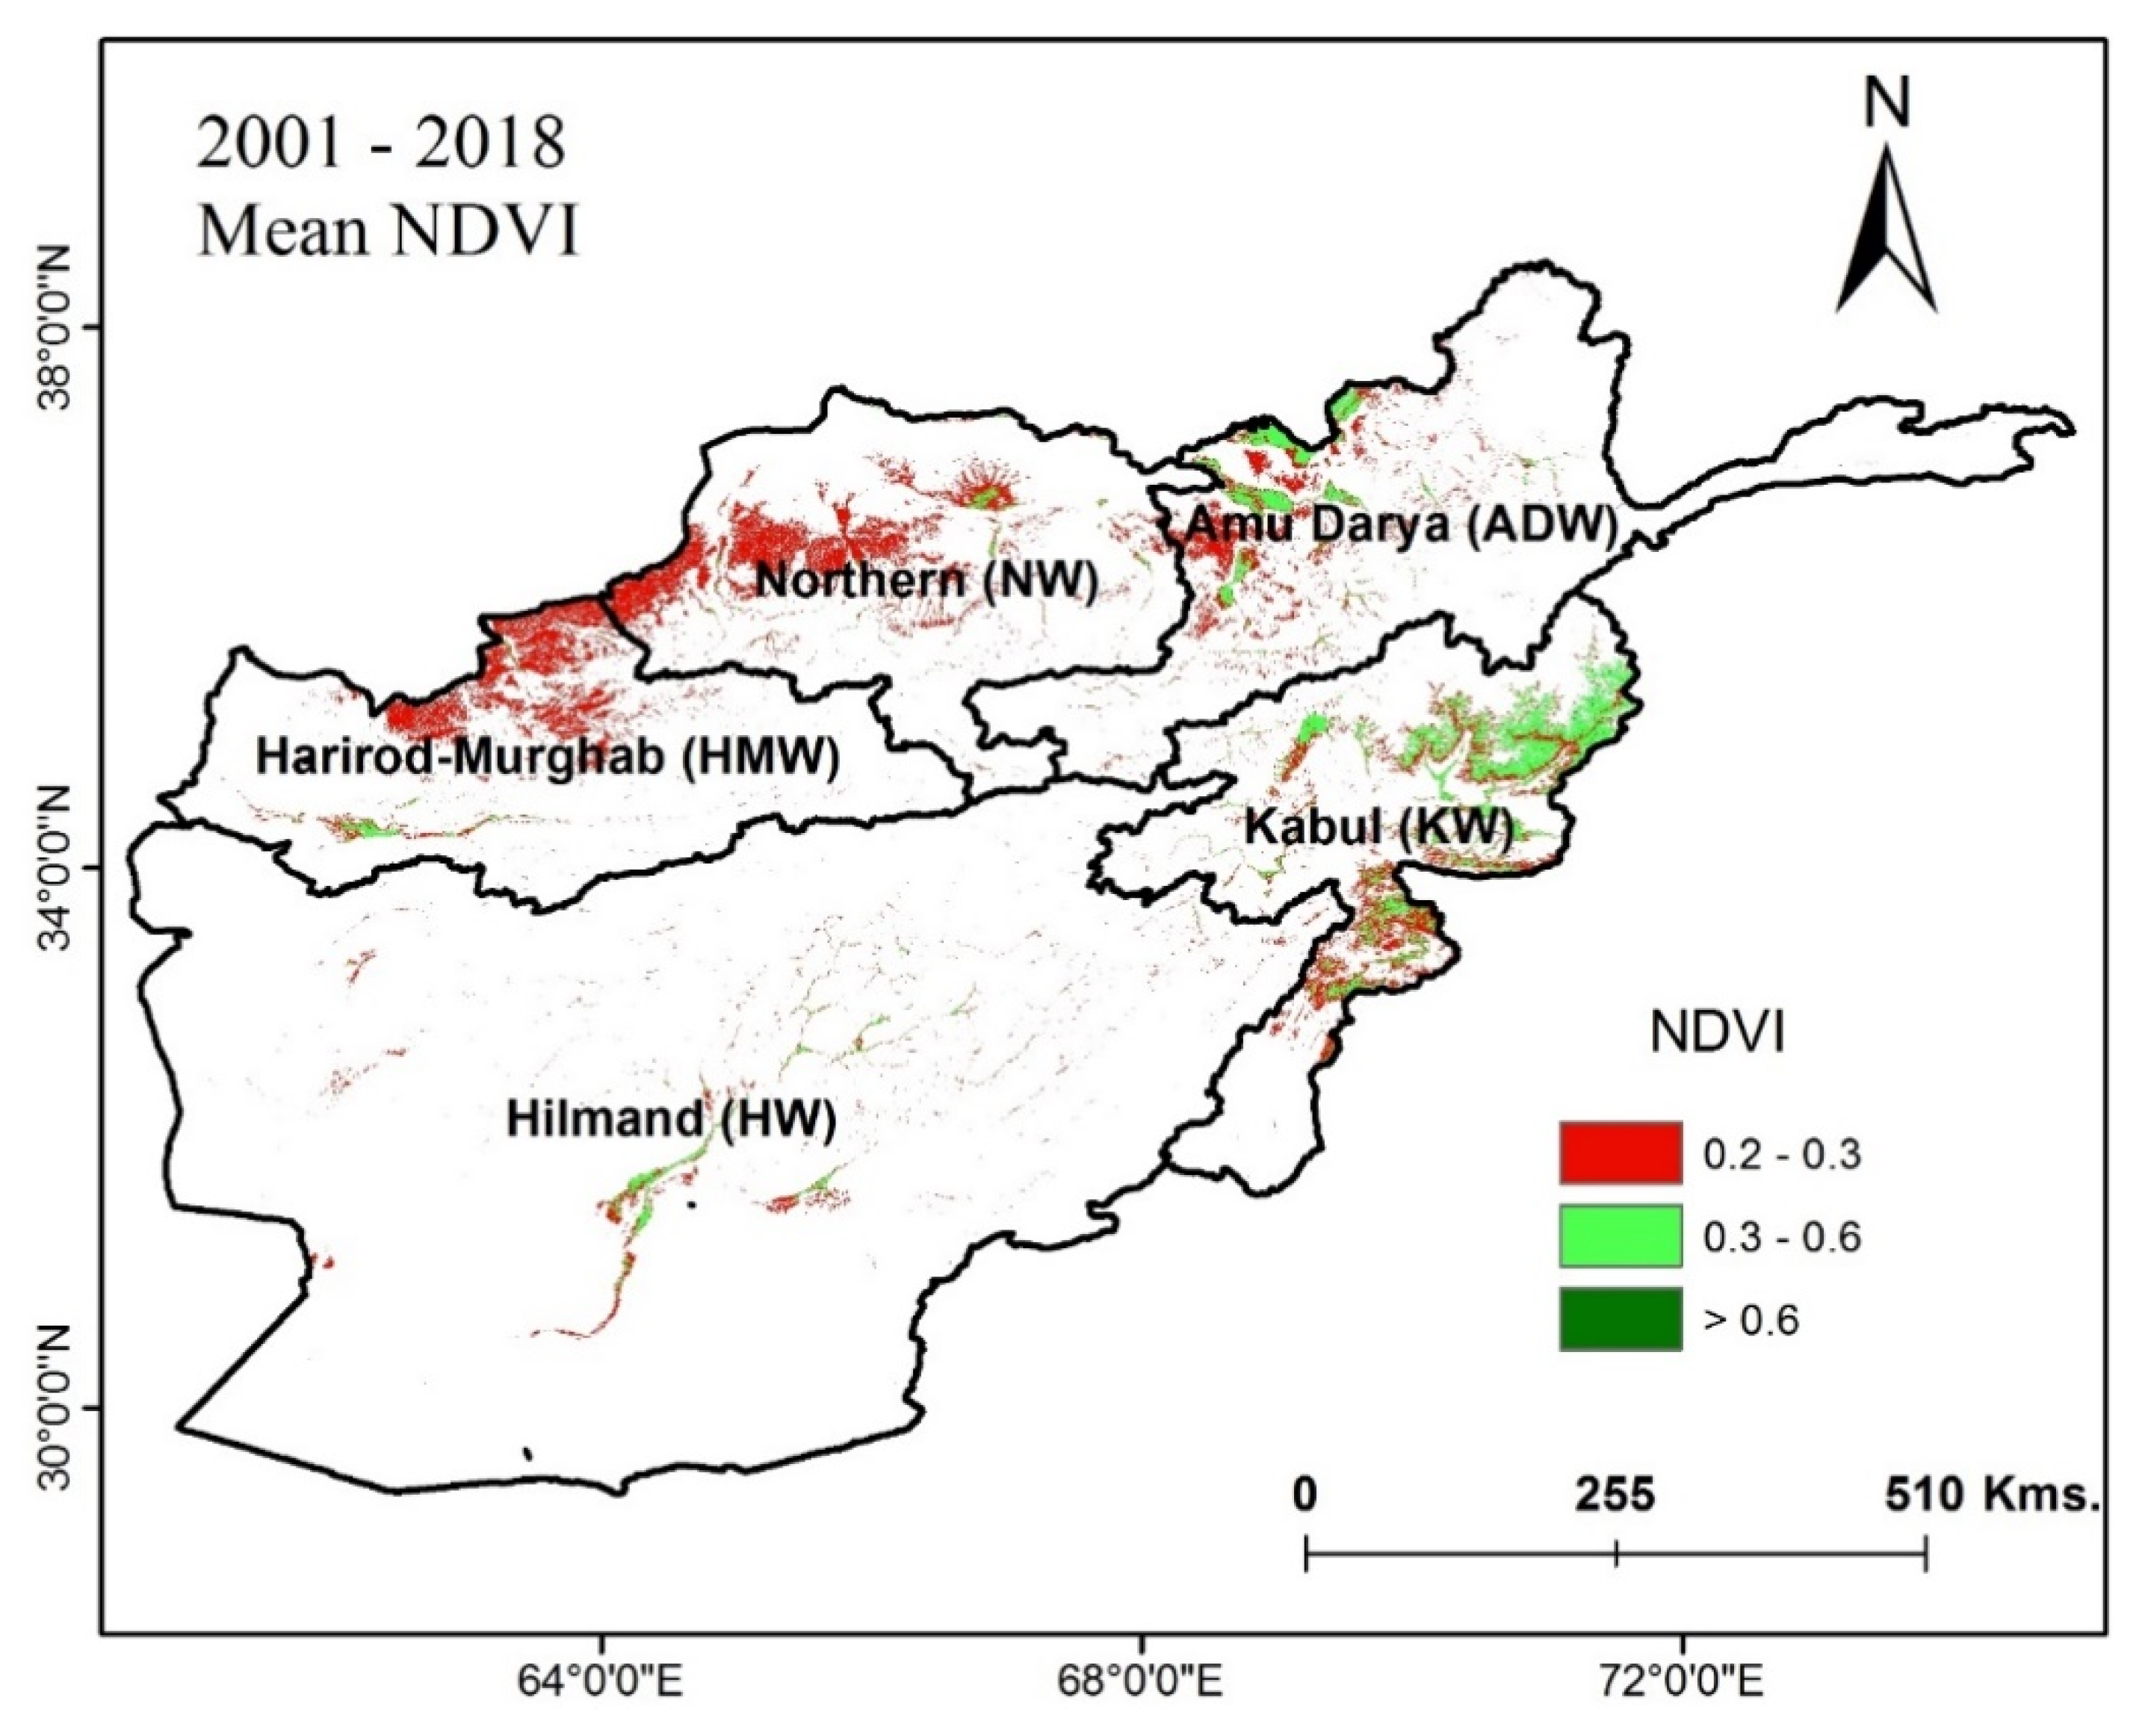
3.2. Watershed NDVI Variation
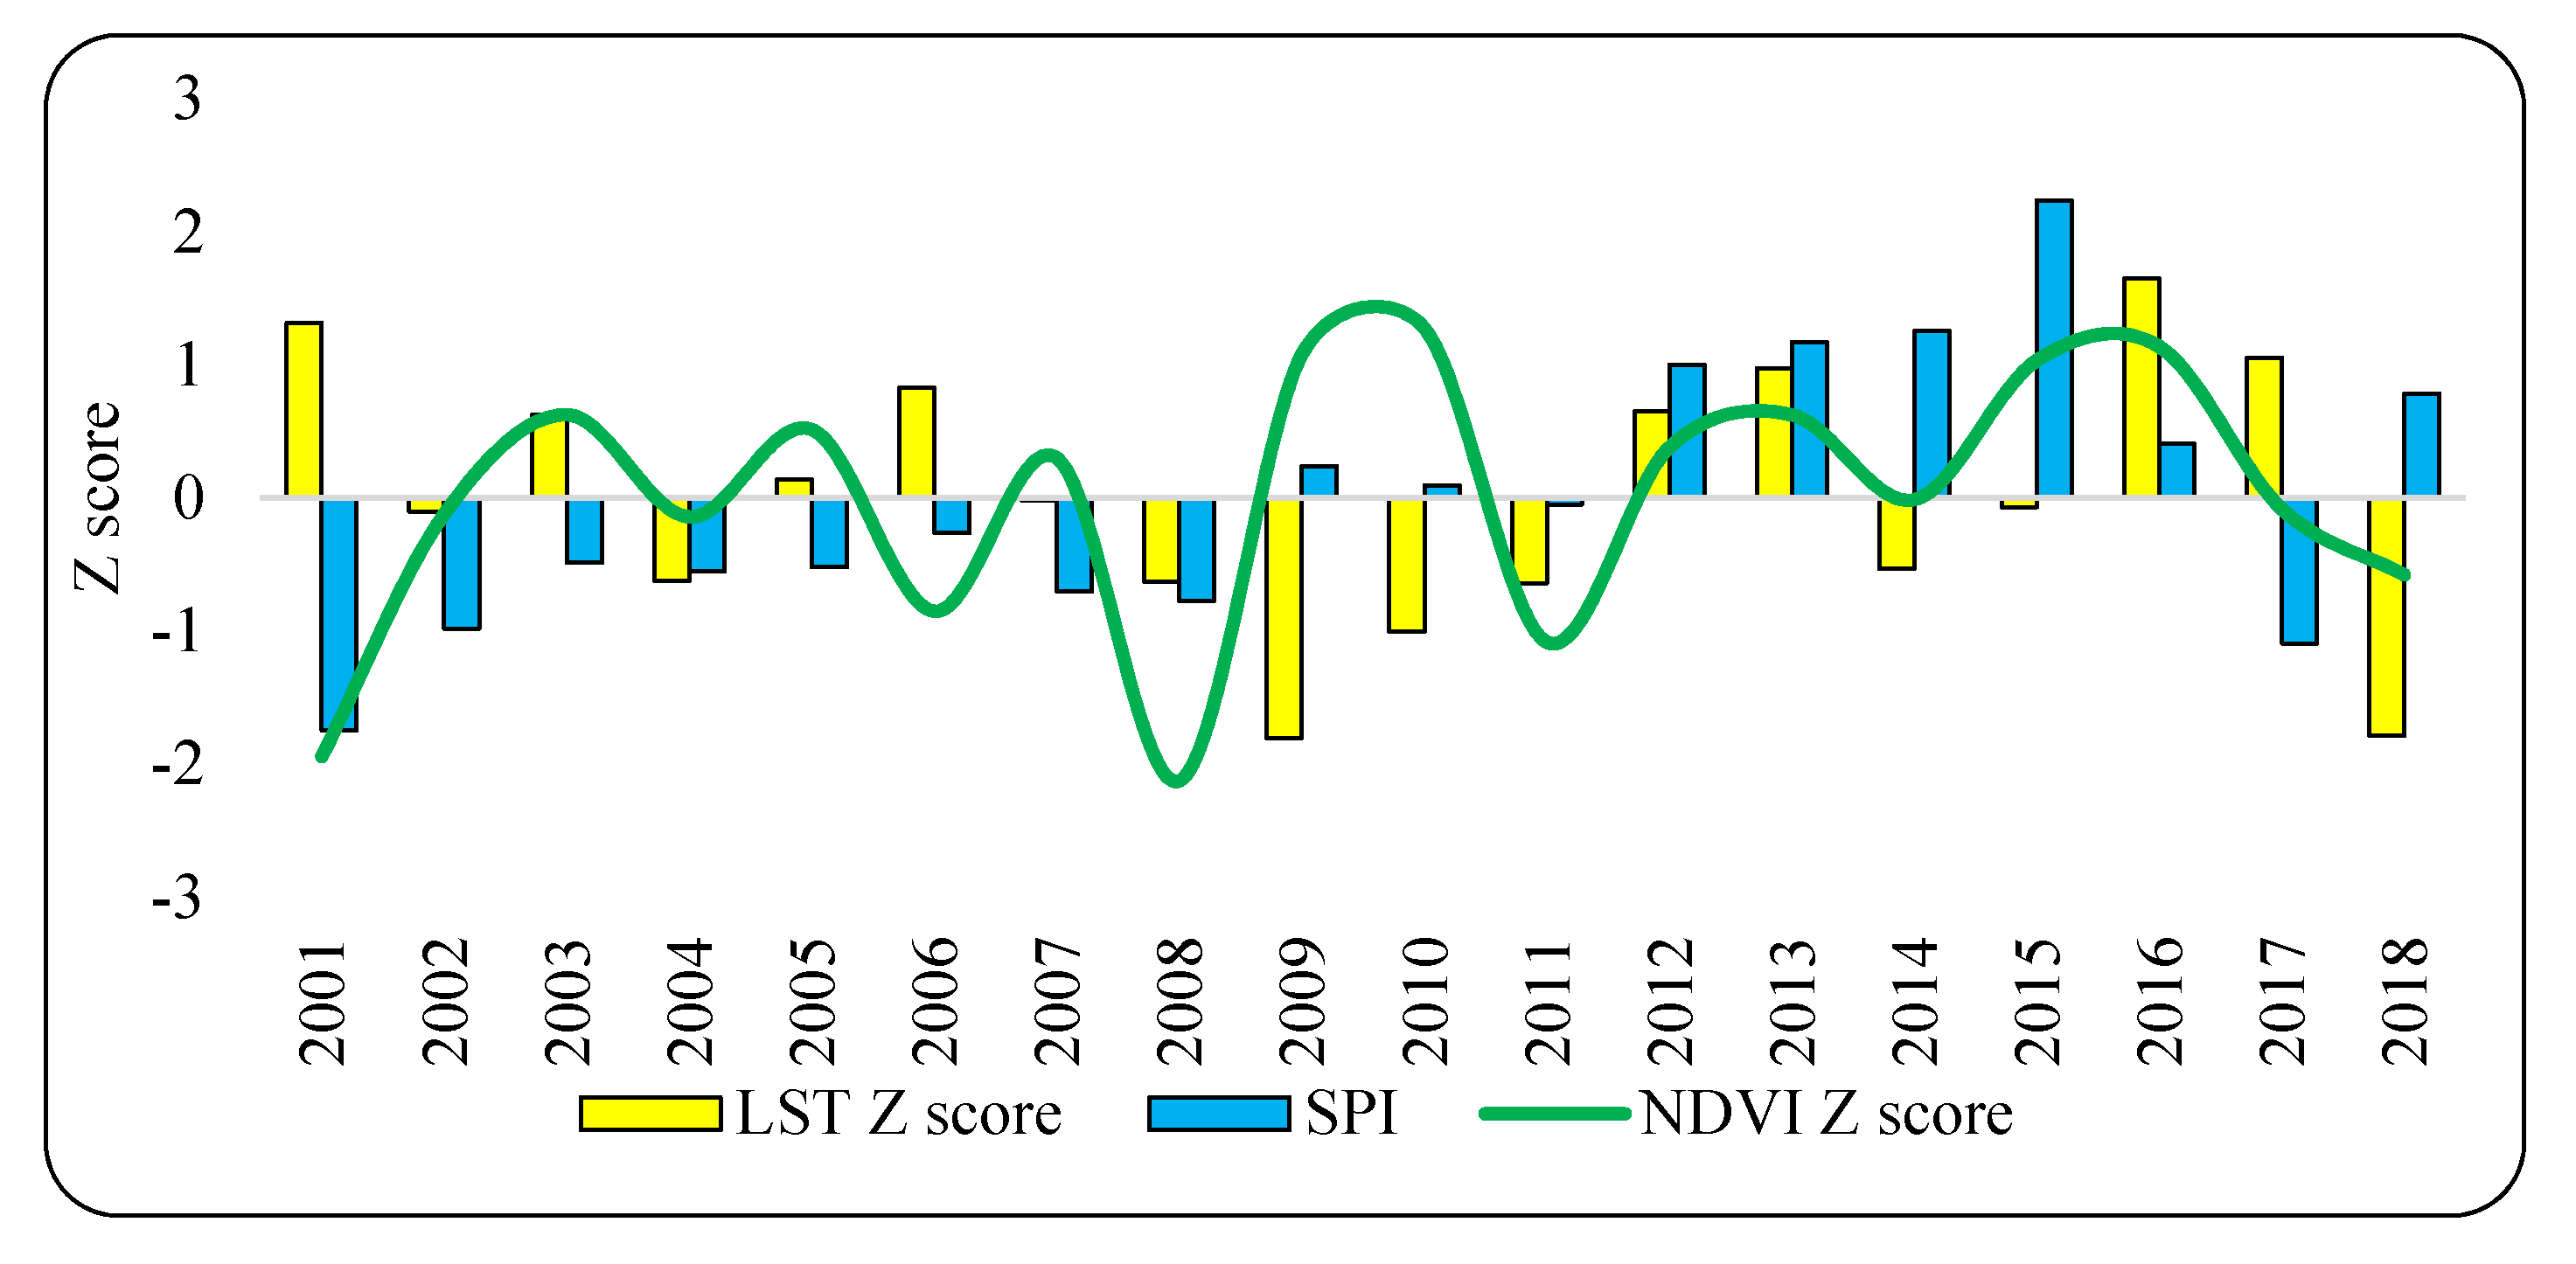
3.3. Relationship Between NDVI with Precipitation and LST
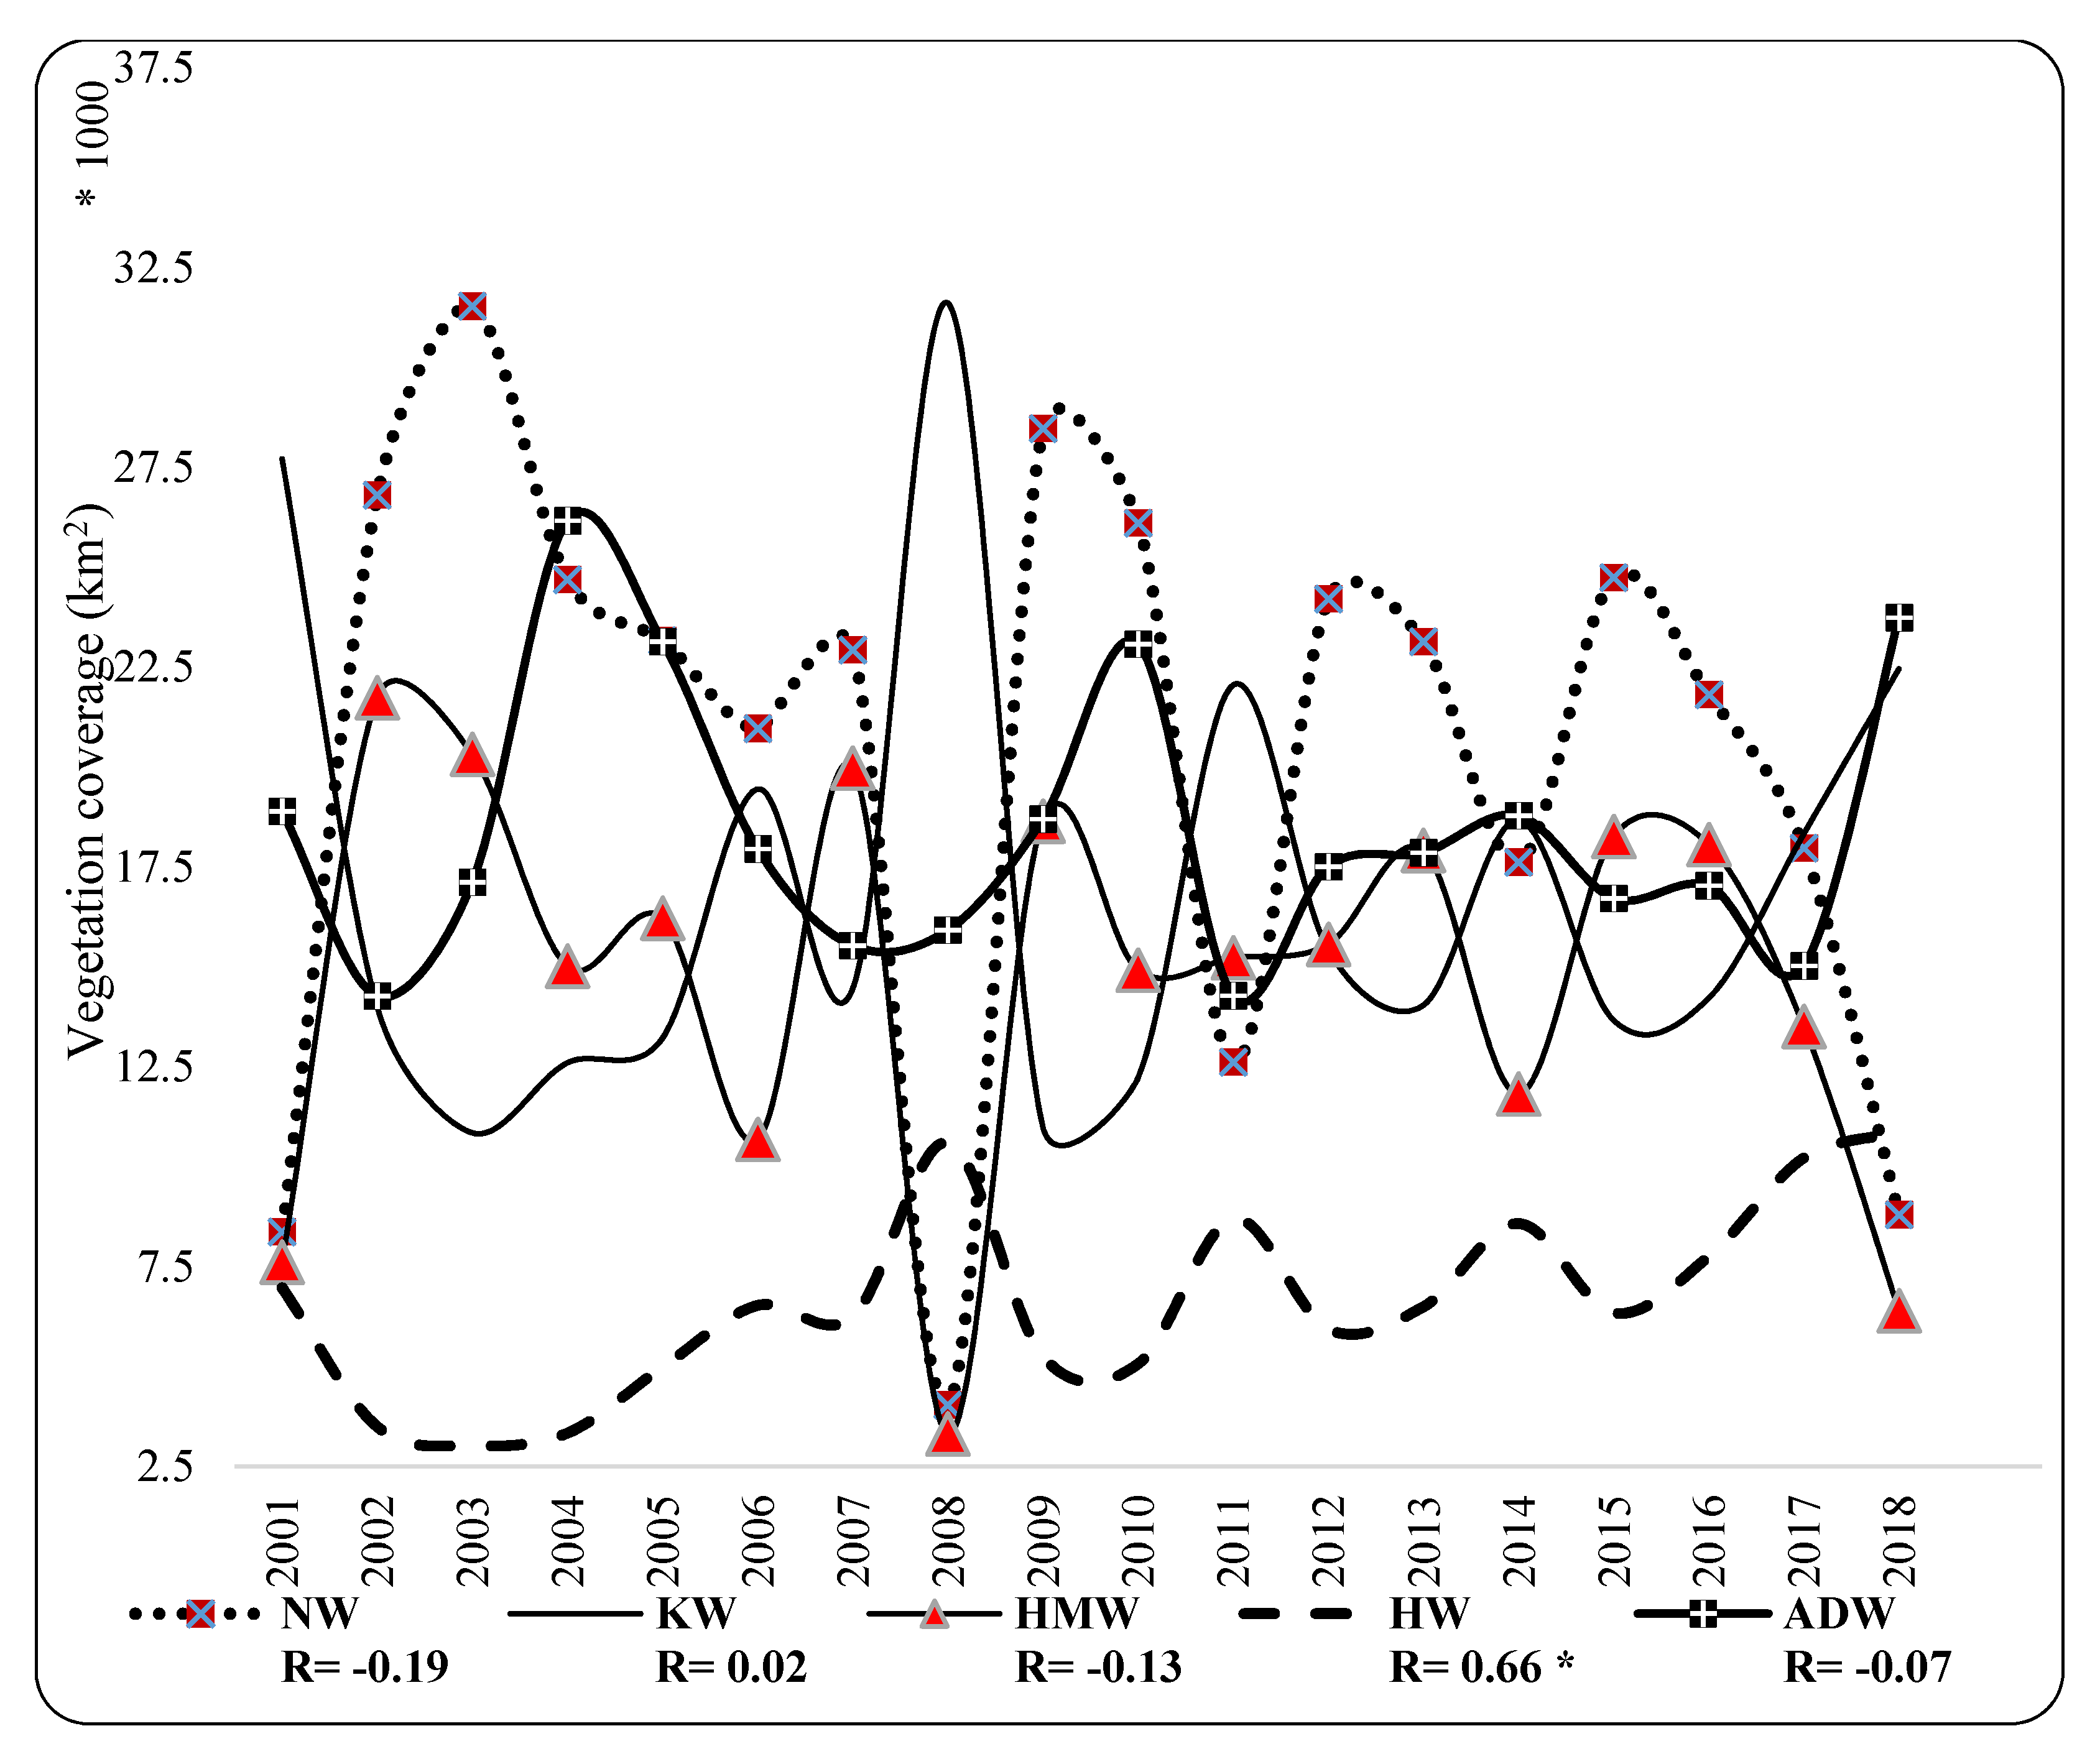
3.4. Watershed Vegetation Coverage and Precipitation
4. Conclusions
Author Contributions
Funding
Acknowledgments
Conflicts of Interest
References
- Bhuiyan, C.; Singh, R.; Kogan, F. Monitoring drought dynamics in the Aravalli region (India) using different indices based on ground and remote sensing data. Int. J. Appl. Earth Obs. Geoinf. 2006, 8, 289–302. [Google Scholar] [CrossRef]
- Zhang, N.; Hong, Y.; Qin, Q.; Zhu, L. Evaluation of the visible and shortwave infrared drought index in China. Int. J. Disaster Risk Sci. 2013, 4, 68–76. [Google Scholar] [CrossRef]
- Rousta, I.; Nasserzadeh, M.; Jalali, M.; Haghighi, E.; Ólafsson, H.; Ashrafi, S.; Doostkamian, M.; Ghasemi, A. Decadal spatial-temporal variations in the spatial pattern of anomalies of extreme precipitation thresholds (case study: Northwest iran). Atmosphere 2017, 8, 135. [Google Scholar] [CrossRef]
- Dorjsuren, M.; Liou, Y.-A.; Cheng, C.-H. Time series MODIS and in situ data analysis for Mongolia drought. Remote Sens. 2016, 8, 509. [Google Scholar] [CrossRef]
- Denli, H.H.; Denli, G.O. The use of soil and water resources at the Mediterranean region in Turkey. Fresenius Environ. Bull. 2017, 26, 520–526. [Google Scholar]
- Rousta, I.; Doostkamian, M.; Olafsson, H.; Ghafarian-Malamiri, H.; Zhang, H.; Taherian, A.; Sarif, M.; Gupta, R.; Monroy-Vargas, E. On the relationship between the 500 hPa height fluctuations and the atmosphere thickness over Iran and the Middle East. TETHYS-J. Mediterr. Meteorol. Climatol. 2019, 3–14. [Google Scholar] [CrossRef]
- Rousta, I.; Javadizadeh, F.; Dargahian, F.; Olafsson, H.; Shiri-Karimvandi, A.; Vahedinejad, S.H.; Doostkamian, M.; Monroy Vargas, E.R.; Asadolahi, A. Investigation of vorticity during prevalent winter precipitation in Iran. Adv. Meteorol. 2018, 2018, 1–13. [Google Scholar] [CrossRef]
- Anderson, J.R.; Hardy, E.E.; Roach, J.T.; Witmer, R.E. A Land Use and Land Cover Classification System for Use with Remote Sensor Data; US Government Printing Office: Washington, DC, USA, 1976; Volume 28.
- Gu, Y.; Brown, J.F.; Verdin, J.P.; Wardlow, B. A five-year analysis of MODIS NDVI and NDWI for grassland drought assessment over the central Great Plains of the United States. Geophys. Res. Lett. 2007, 34, 1–6. [Google Scholar] [CrossRef]
- Reed, B.C.; Brown, J.F.; VanderZee, D.; Loveland, T.R.; Merchant, J.W.; Ohlen, D.O. Measuring phenological variability from satellite imagery. J. Veg. Sci. 1994, 5, 703–714. [Google Scholar] [CrossRef]
- Peters, A.J.; Walter-Shea, E.A.; Ji, L.; Vina, A.; Hayes, M.; Svoboda, M.D. Drought monitoring with NDVI-based standardized vegetation index. Photogramm. Eng. Remote Sens. 2002, 68, 71–75. [Google Scholar]
- Rousta, I.; Khosh Akhlagh, F.; Soltani, M.; Modir Taheri, S.S. Assessment of blocking effects on rainfall in northwestern Iran. In Proceedings of the COMECAP 2014, Heraklion Crete, Greece, 28–31 May 2014; Volume 291. [Google Scholar]
- Hazaymeh, K.; Hassan, Q.K. A remote sensing-based agricultural drought indicator and its implementation over a semi-arid region, Jordan. J. Arid Land 2017, 9, 319–330. [Google Scholar] [CrossRef]
- Cheng, C.-H.; Nnadi, F.; Liou, Y.-A. A regional land use drought index for Florida. Remote Sens. 2015, 7, 17149–17167. [Google Scholar] [CrossRef]
- Dutta, D.; Kundu, A.; Patel, N.; Saha, S.; Siddiqui, A. Assessment of agricultural drought in Rajasthan (India) using remote sensing derived Vegetation Condition Index (VCI) and Standardized Precipitation Index (SPI). Egypt. J. Remote Sens. Space Sci. 2015, 18, 53–63. [Google Scholar] [CrossRef]
- Liou, Y.-A.; Mulualem, G.M. Spatio–temporal Assessment of Drought in Ethiopia and the Impact of Recent Intense Droughts. Remote Sens. 2019, 11, 1828. [Google Scholar] [CrossRef]
- AghaKouchak, A.; Farahmand, A.; Melton, F.; Teixeira, J.; Anderson, M.; Wardlow, B.D.; Hain, C. Remote sensing of drought: Progress, challenges and opportunities. Rev. Geophys. 2015, 53, 452–480. [Google Scholar] [CrossRef]
- Zhang, X.; Wu, S.; Yan, X.; Chen, Z. A global classification of vegetation based on NDVI, rainfall and temperature. Int. J. Climatol. 2017, 37, 2318–2324. [Google Scholar] [CrossRef]
- Gamon, J.A.; Field, C.B.; Goulden, M.L.; Griffin, K.L.; Hartley, A.E.; Joel, G.; Peñuelas, J.; Valentini, R. Relationships between NDVI, canopy structure, and photosynthesis in three Californian vegetation types. Ecol. Appl. 1995, 5, 28–41. [Google Scholar] [CrossRef]
- Drori, R.; Dan, H.; Sprintsin, M.; Sheffer, E. Precipitation-Sensitive Dynamic Threshold: A New and Simple Method to Detect and Monitor Forest and Woody Vegetation Cover in Sub-Humid to Arid Areas. Remote Sens. 2020, 12, 1231. [Google Scholar] [CrossRef]
- Liu, Q.; Zhang, S.; Zhang, H.; Bai, Y.; Zhang, J. Monitoring drought using composite drought indices based on remote sensing. Sci. Total Environ. 2020, 711, 134585. [Google Scholar] [CrossRef]
- Rouse, J.; Haas, R.; Schelle, J.; Deering, D.; Harlan, J. Monitoring the Vernal Advancement or Retrogradation of Natural Vegetation; NASA/GSFCType IIIFinal Report Green-BeltMD; Texas University Press: Austin, TX, USA, 1974; Volume 371. [Google Scholar]
- Tucker, C.J. Red and photographic infrared linear combinations for monitoring vegetation. Remote Sens. Environ. 1979, 8, 127–150. [Google Scholar] [CrossRef]
- Chen, D.; Brutsaert, W. Satellite-sensed distribution and spatial patterns of vegetation parameters over a tallgrass prairie. J. Atmos. Sci. 1998, 55, 1225–1238. [Google Scholar] [CrossRef]
- Gao, B.-C.; Goetzt, A.F. Retrieval of equivalent water thickness and information related to biochemical components of vegetation canopies from AVIRIS data. Remote Sens. Environ. 1995, 52, 155–162. [Google Scholar] [CrossRef]
- Kogan, F.N. Droughts of the late 1980s in the United States as derived from NOAA polar-orbiting satellite data. Bull. Am. Meteorol. Soc. 1995, 76, 655–668. [Google Scholar] [CrossRef]
- Yang, L.; Wylie, B.K.; Tieszen, L.L.; Reed, B.C. An analysis of relationships among climate forcing and time-integrated NDVI of grasslands over the US northern and central Great Plains. Remote Sens. Environ. 1998, 65, 25–37. [Google Scholar] [CrossRef]
- Ji, L.; Peters, A.J. Assessing vegetation response to drought in the northern Great Plains using vegetation and drought indices. Remote Sens. Environ. 2003, 87, 85–98. [Google Scholar] [CrossRef]
- Wan, Z.; Wang, P.; Li, X. Using MODIS land surface temperature and normalized difference vegetation index products for monitoring drought in the southern Great Plains, USA. Int. J. Remote Sens. 2004, 25, 61–72. [Google Scholar] [CrossRef]
- Ghafarian Malamiri, H.; Rousta, I.; Olafsson, H.; Zare, H.; Zhang, H. Gap-Filling of MODIS Time Series Land Surface Temperature (LST) Products Using Singular Spectrum Analysis (SSA). Atmosphere 2018, 9, 334. [Google Scholar] [CrossRef]
- Rundquist, B.C.; Harrington, J.A., Jr. The effects of climatic factors on vegetation dynamics of tallgrass and shortgrass cover. GeoCarto Int. 2000, 15, 33–38. [Google Scholar] [CrossRef]
- Wang, J.; Price, K.; Rich, P. Spatial patterns of NDVI in response to precipitation and temperature in the central Great Plains. Int. J. Remote Sens. 2001, 22, 3827–3844. [Google Scholar] [CrossRef]
- Ji, L.; Peters, A.J. Lag and seasonality considerations in evaluating AVHRR NDVI response to precipitation. Photogramm. Eng. Remote Sens. 2005, 71, 1053–1061. [Google Scholar] [CrossRef]
- Liu, W.; Kogan, F. Monitoring regional drought using the vegetation condition index. Int. J. Remote Sens. 1996, 17, 2761–2782. [Google Scholar] [CrossRef]
- Kogan, F.; Yang, B.; Wei, G.; Zhiyuan, P.; Xianfeng, J. Modelling corn production in China using AVHRR-based vegetation health indices. Int. J. Remote Sens. 2005, 26, 2325–2336. [Google Scholar] [CrossRef]
- Salazar, L.; Kogan, F.; Roytman, L. Using vegetation health indices and partial least squares method for estimation of corn yield. Int. J. Remote Sens. 2008, 29, 175–189. [Google Scholar] [CrossRef]
- Martiny, N.; Camberlin, P.; Richard, Y.; Philippon, N. Compared regimes of NDVI and rainfall in semi-arid regions of Africa. Int. J. Remote Sens. 2006, 27, 5201–5223. [Google Scholar] [CrossRef]
- Almazroui, M. Calibration of TRMM rainfall climatology over Saudi Arabia during 1998–2009. Atmos. Res. 2011, 99, 400–414. [Google Scholar] [CrossRef]
- Islam, M.N.; Uyeda, H. Use of TRMM in determining the climatic characteristics of rainfall over Bangladesh. Remote Sens. Environ. 2007, 108, 264–276. [Google Scholar] [CrossRef]
- Moffitt, C.B.; Hossain, F.; Adler, R.F.; Yilmaz, K.K.; Pierce, H.F. Validation of a TRMM-based global Flood Detection System in Bangladesh. Int. J. Appl. Earth Obs. Geoinf. 2011, 13, 165–177. [Google Scholar] [CrossRef]
- Rousta, I.; Olafsson, H.; Moniruzzaman, M.; Ardö, J.; Zhang, H.; Mushore, T.D.; Shahin, S.; Azim, S. The 2000–2017 Drought risk Assessment of the Western and Southwestern Basins in Iran. Modeling Earth Syst. Environ. 2020, 6, 1201–1221. [Google Scholar] [CrossRef]
- Du, L.; Tian, Q.; Yu, T.; Meng, Q.; Jancso, T.; Udvardy, P.; Huang, Y. A comprehensive drought monitoring method integrating MODIS and TRMM data. Int. J. Appl. Earth Obs. Geoinf. 2013, 23, 245–253. [Google Scholar] [CrossRef]
- Parenti, C. Flower of war: An environmental history of opium poppy in Afghanistan. SAIS Rev. Int. Aff. 2015, 35, 183–200. [Google Scholar] [CrossRef]
- Price, R. Climate change as a driver of conflict in Afghanistan and other Fragile and Conflict Affected States; Institute of Development Studies: Brighton, UK, 2019; Volume 18. [Google Scholar]
- Snetkov, A. The Regional Dimensions to Security: Other Sides of Afghanistan; Springer: Zurich, Switzerland, 2013; Volume 273. [Google Scholar]
- Saba, D.S. Afghanistan: Environmental degradation in a fragile ecological setting. Int. J. Sustain. Dev. World Ecol. 2001, 8, 279–289. [Google Scholar] [CrossRef]
- Savage, M.; Dougherty, B.; Hamza, M.; Butterfield, R.; Bharwani, S. Socio-Economic Impacts of Climate Change in Afghanistan; Stockholm Environment Institute Press: Stockholm, Sweden, 2009; Volume 44. [Google Scholar]
- Flohn, H. Zum Klima und Wasserhaushalt des Hindukuschs und der benachbarten Hochgebirge (The Climate and Water-Budget of the Hindu Kush and Neighbouring Mountain Ranges). Erdkunde 1969, 3, 205–215. [Google Scholar]
- Breckle, S.-W. Flora and vegetation of Afghanistan. Basic Appl. Dryland Res. 2007, 1, 155–194. [Google Scholar] [CrossRef]
- Rathjens, C. Die Wälder von Nuristan und Paktia. Standortbedingungen und Nutzung der ostafghanischen Waldgebiete. Geogr. Z. 1974, 2, 295–311. [Google Scholar]
- McSweeney, C.; New, M.; Lizcano, G. UNDP climate change country profiles: Afghanistan. pp. 1–26. Available online: https://www.geog.ox.ac.uk/research/climate/projects/undp-cp/ (accessed on 20 May 2019).
- Kamal, G.M. River Basins and Watersheds of Afghanistan; Afghanistan Information Management Services (AIMS): Kabul, Afghanistan, 2004; Volume 1, pp. 1–7. [Google Scholar]
- Akhtar, F.; Awan, U.K.; Tischbein, B.; Liaqat, U.W. Assessment of Irrigation Performance in Large River Basins under Data Scarce Environment—A Case of Kabul River Basin, Afghanistan. Remote Sens. 2018, 10, 972. [Google Scholar] [CrossRef]
- Najmuddin, O.; Deng, X.; Siqi, J. Scenario analysis of land use change in Kabul river basin–a river basin with rapid socio-economic changes in Afghanistan. Phys. Chem. EarthParts A/B/C 2017, 101, 121–136. [Google Scholar] [CrossRef]
- Mack, T.J.; Chornack, M.P.; Taher, M.R. Groundwater-level trends and implications for sustainable water use in the Kabul Basin, Afghanistan. Environ. Syst. Decis. 2013, 33, 457–467. [Google Scholar] [CrossRef]
- Rathjens, C. Fragen der horizontalen und vertikalen Landschaftsgliederung in Hochgebirgessytem des Hindykusch. Erdwiss. Forsch. 1972, 4, 205–220. [Google Scholar]
- Favre, R.; Kamal, G.M. Watershed atlas of Afghanistan, working document for planners, parts I and II, 1st edn. Kabul: Government of Afghanistan, Ministry of Irrigation. Water Resour. Environ. 2004, 60, 1–40. [Google Scholar]
- Zandbergen, P. Applications of shuttle radar topography mission elevation data. Geogr. Compass 2008, 2, 1404–1431. [Google Scholar] [CrossRef]
- Gitelson, A.A.; Viña, A.; Arkebauer, T.J.; Rundquist, D.C.; Keydan, G.; Leavitt, B. Remote estimation of leaf area index and green leaf biomass in maize canopies. Geophys. Res. Lett. 2003, 30, 1–4. [Google Scholar] [CrossRef]
- Martínez, B.; Gilabert, M.A. Vegetation dynamics from NDVI time series analysis using the wavelet transform. Remote Sens. Environ. 2009, 113, 1823–1842. [Google Scholar] [CrossRef]
- Moulin, S.; Kergoat, L.; Viovy, N.; Dedieu, G. Global-scale assessment of vegetation phenology using NOAA/AVHRR satellite measurements. J. Clim. 1997, 10, 1154–1170. [Google Scholar] [CrossRef]
- Mushore, T.D.; Dube, T.; Manjowe, M.; Gumindoga, W.; Chemura, A.; Rousta, I.; Odindi, J.; Mutanga, O. Remotely sensed retrieval of Local Climate Zones and their linkages to land surface temperature in Harare metropolitan city, Zimbabwe. Urban Clim. 2019, 27, 259–271. [Google Scholar] [CrossRef]
- Running, S.W.; Loveland, T.R.; Pierce, L.L.; Nemani, R.R.; Hunt, E.R., Jr. A remote sensing based vegetation classification logic for global land cover analysis. Remote Sens. Environ. 1995, 51, 39–48. [Google Scholar] [CrossRef]
- Broge, N.H.; Leblanc, E. Comparing prediction power and stability of broadband and hyperspectral vegetation indices for estimation of green leaf area index and canopy chlorophyll density. Remote Sens. Environ. 2001, 76, 156–172. [Google Scholar] [CrossRef]
- Rouse, J.; Haas, R.; Schell, J.; Deering, D. Monitoring vegetation systems in the Great Plains with ERTS. NASA Spec. Publ. 1974, 351, 309. [Google Scholar]
- Didan, K. MOD13Q1 MODIS/Terra Vegetation Indices 16-day L3 global 250 m SIN Grid V006. NASA EOSDIS Land Process. DAAC 2015. Available online: https://lpdaac.usgs.gov/ (accessed on 12 February 2019).
- Duan, Z.; Bastiaanssen, W. First results from Version 7 TRMM 3B43 precipitation product in combination with a new downscaling–calibration procedure. Remote Sens. Environ. 2013, 131, 1–13. [Google Scholar] [CrossRef]
- Deng, G.; Zhang, H.; Guo, X.; Ying, H. Assessment of Drought in Democratic People’s Republic of Korea in 2017 Using TRMM Data. In Proceedings of the 2018 Fifth International Workshop on Earth Observation and Remote Sensing Applications (EORSA), Xi’an, China, 18–20 June 2018; Volume 474. [Google Scholar]
- Kummerow, C.; Barnes, W.; Kozu, T.; Shiue, J.; Simpson, J. The tropical rainfall measuring mission (TRMM) sensor package. J. Atmos. Ocean. Technol. 1998, 15, 809–817. [Google Scholar] [CrossRef]
- Mossad, A.; Alazba, A. Determination and prediction of standardized precipitation index (SPI) using TRMM data in arid ecosystems. Arab. J. Geosci. 2018, 11, 132. [Google Scholar] [CrossRef]
- Nastos, P.; Kapsomenakis, J.; Philandras, K. Evaluation of the TRMM 3B43 gridded precipitation estimates over Greece. Atmos. Res. 2016, 169, 497–514. [Google Scholar] [CrossRef]
- Huffman, G.J.; Adler, R.F.; Arkin, P.; Chang, A.; Ferraro, R.; Gruber, A.; Janowiak, J.; McNab, A.; Rudolf, B.; Schneider, U. The global precipitation climatology project (GPCP) combined precipitation dataset. Bull. Am. Meteorol. Soc. 1997, 78, 5–20. [Google Scholar] [CrossRef]
- Huffman, G.; Stocker, E.; Bolvin, D.; Nelkin, E.; Jackson, T. GPM IMERG Final Precipitation L3 Half Hourly 0.1 Degree × 0.1 Degree V06, Greenbelt, MD, Goddard Earth Sciences Data and Information Services Center (GES DISC). 2019. Available online: https://disc.gsfc.nasa.gov/datasets (accessed on 12 February 2019).
- McKee, T.B.; Doesken, N.J.; Kleist, J. The relationship of drought frequency and duration to time scales. In Proceedings of the 8th Conference on Applied Climatology, Anaheim, CA, USA, 17–22 January 1993; pp. 179–183. [Google Scholar]
- Thom, H.C. A note on the gamma distribution. Mon. Weather Rev. 1958, 86, 117–122. [Google Scholar] [CrossRef]
- Cancelliere, A.; Di Mauro, G.; Bonaccorso, B.; Rossi, G. Drought forecasting using the standardized precipitation index. Water Resour. Manag. 2007, 21, 801–819. [Google Scholar] [CrossRef]
- Shah, R.; Bharadiya, N.; Manekar, V. Drought index computation using standardized precipitation index (SPI) method for Surat District, Gujarat. Aquat. Procedia 2015, 4, 1243–1249. [Google Scholar] [CrossRef]
- Unganai, L.S.; Kogan, F.N. Drought monitoring and corn yield estimation in Southern Africa from AVHRR data. Remote Sens. Environ. 1998, 63, 219–232. [Google Scholar] [CrossRef]
- Thenkabail, P.S.; Gamage, M. The Use of Remote Sensing Data for Drought Assessment and Monitoring in Southwest Asia; Iwmi: Colombo, Sri Lanka, 2004; Volume 85, p. 25. [Google Scholar]
- Jain, S.K.; Keshri, R.; Goswami, A.; Sarkar, A.; Chaudhry, A. Identification of drought-vulnerable areas using NOAA AVHRR data. Int. J. Remote Sens. 2009, 30, 2653–2668. [Google Scholar] [CrossRef]
- Chen, J.; Jönsson, P.; Tamura, M.; Gu, Z.; Matsushita, B.; Eklundh, L. A simple method for reconstructing a high-quality NDVI time-series data set based on the Savitzky–Golay filter. Remote Sens. Environ. 2004, 91, 332–344. [Google Scholar] [CrossRef]
- Song, K.-B.; Baek, Y.-S.; Hong, D.H.; Jang, G. Short-term load forecasting for the holidays using fuzzy linear regression method. IEEE Trans. Power Syst. 2005, 20, 96–101. [Google Scholar] [CrossRef]
- Pervez, M.S.; Budde, M.; Rowland, J. Mapping irrigated areas in Afghanistan over the past decade using MODIS NDVI. Remote Sens. Environ. 2014, 149, 155–165. [Google Scholar] [CrossRef]
- Shokory, J.A.N.; Tsutsumi, J.-i.G.; Yamada, H.; Kløve, B. Intra-seasonal Variation of Rainfall and Climate Characteristics in Kabul River Basin. Cent. Asian J. Water Res. (CAJWR) Центральноазиатский Журнал Исследований Водных Ресурсов 2017, 3, 2689. [Google Scholar]


| Index Value | Class | Description |
|---|---|---|
| Non Drought | SPI ≥ 2.00 | Extremely wet |
| 1.50 ≤ SPI < 2.00 | Very wet | |
| 1.00 ≤ SPI < 1.50 | Moderately wet | |
| −1.00 ≤ SPI < 1.00 | Near normal | |
| Drought | −1.50 ≤ SPI < −1.00 | Moderate drought |
| −2.00 ≤ SPI < −1.50 | Severe drought | |
| SPI < −2.00 | Extreme drought |
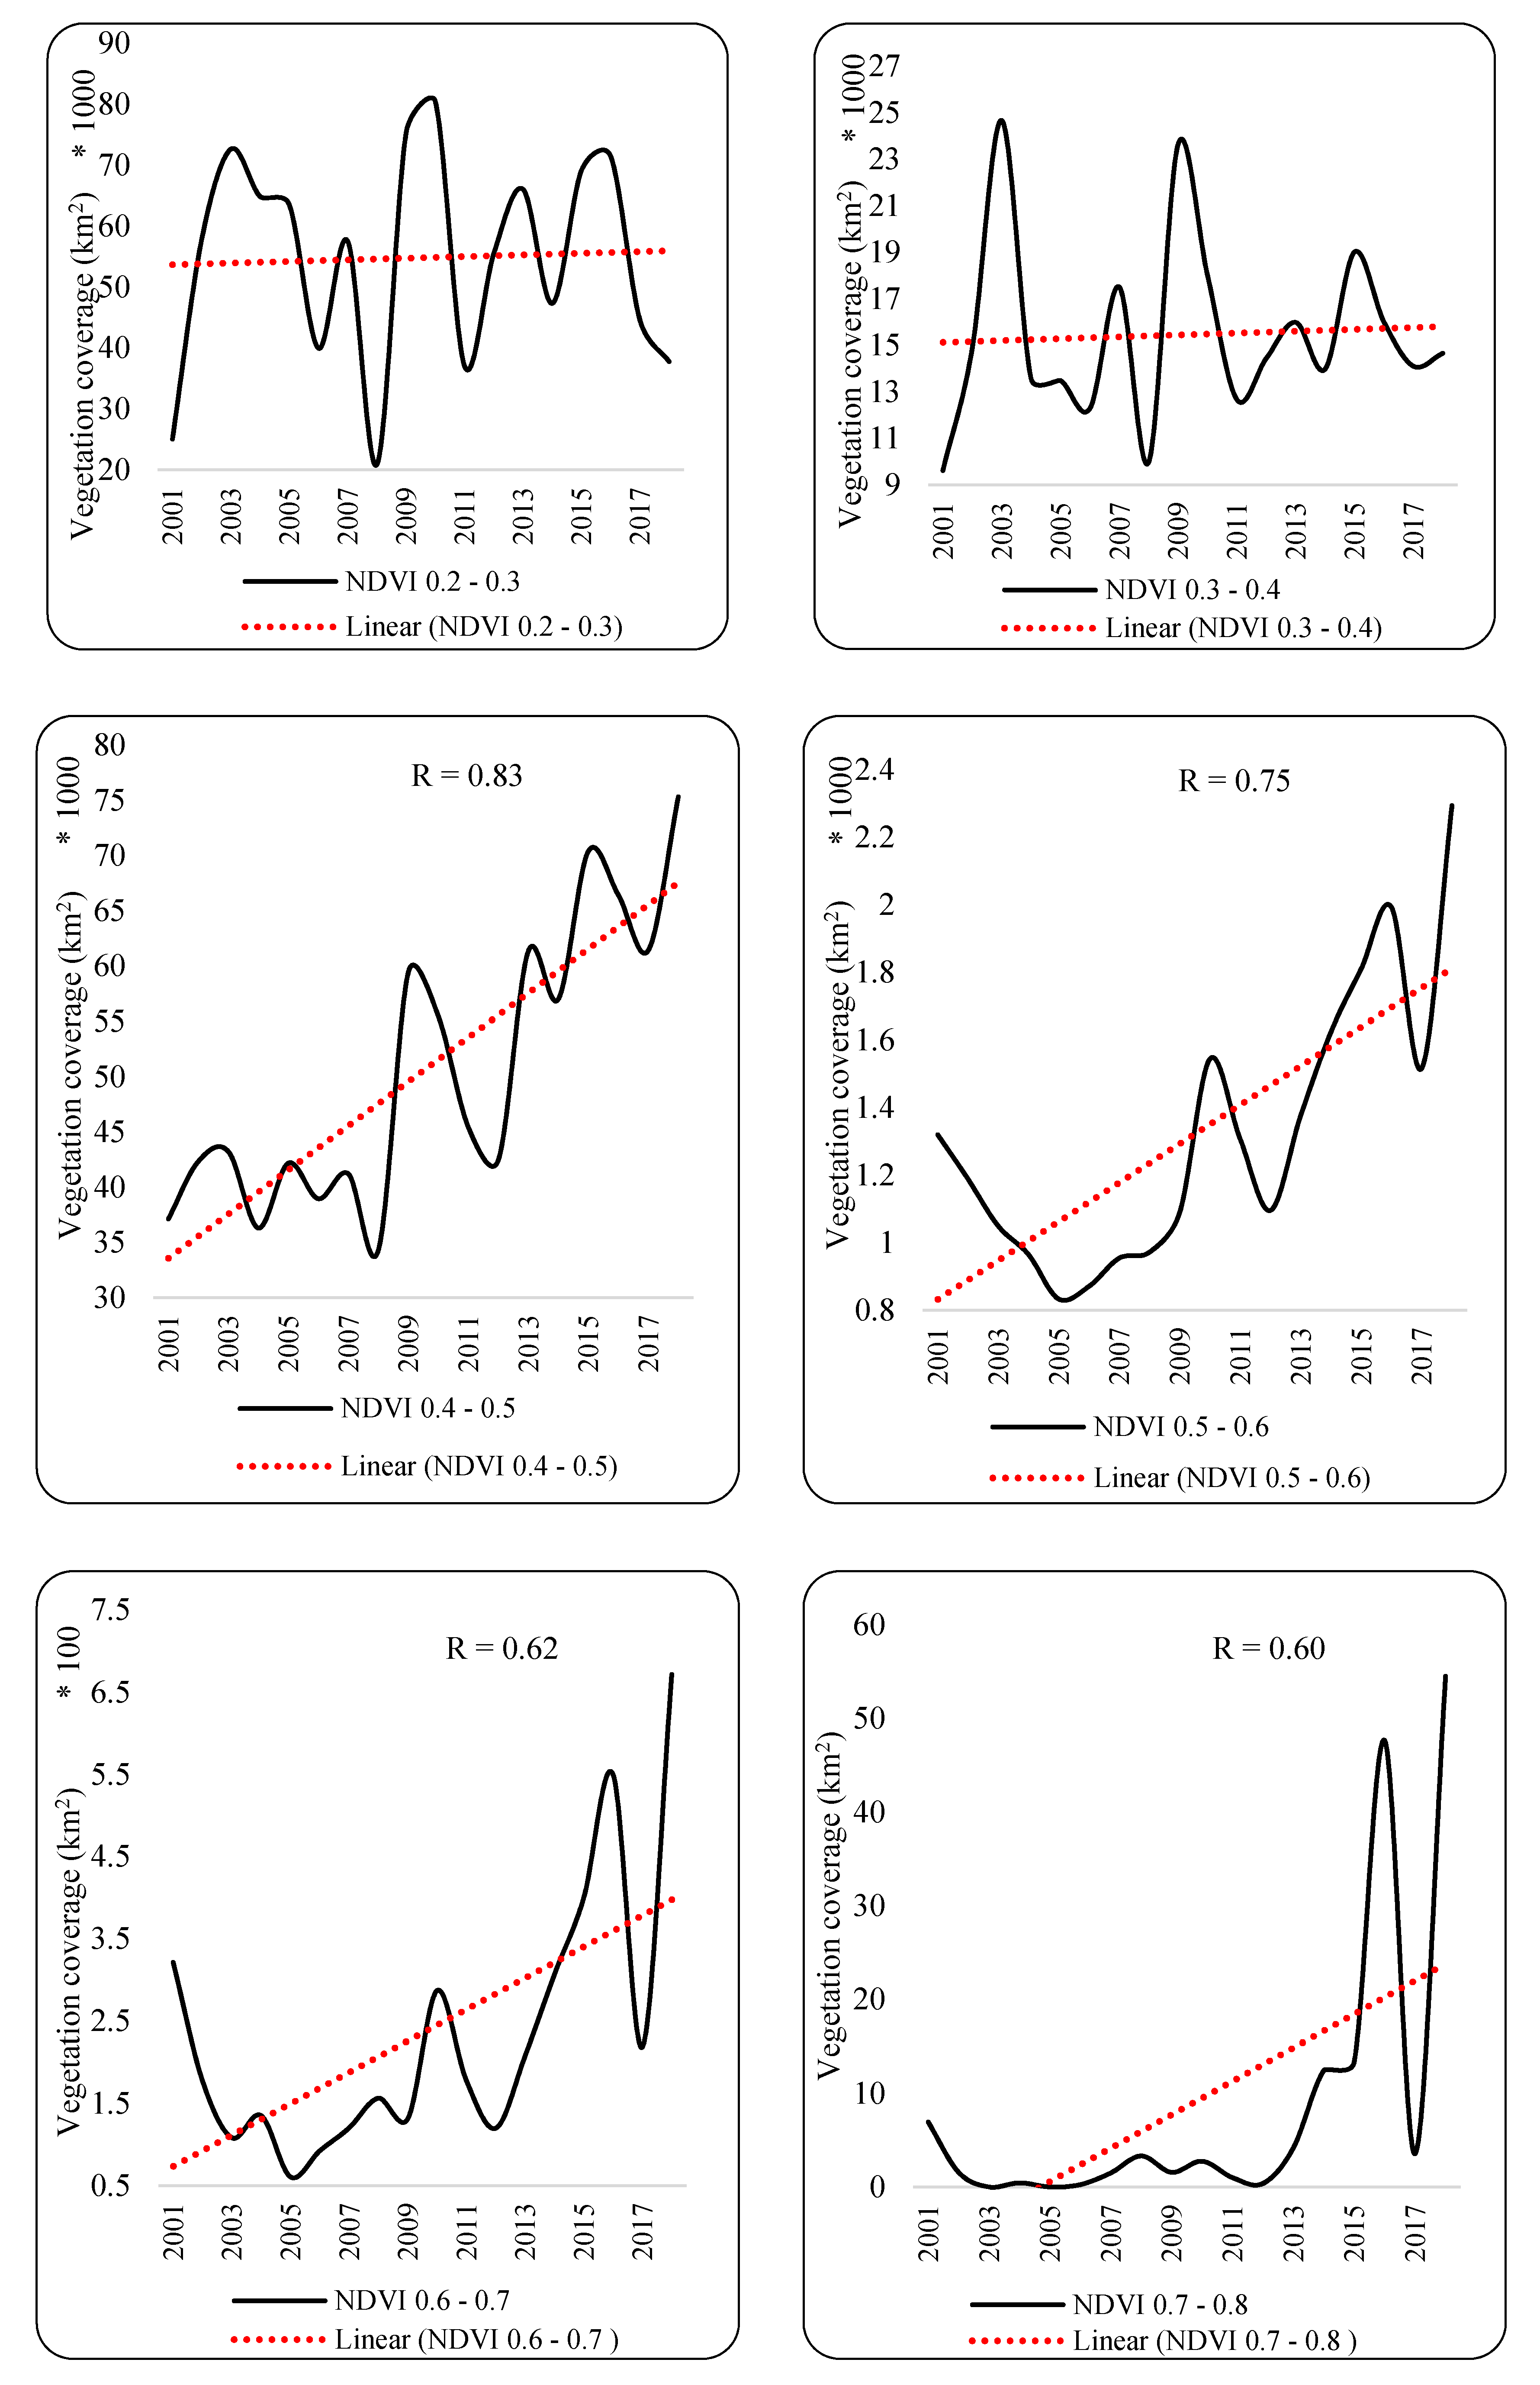
| Year | NDVI 0.2–0.3 | NDVI 0.3–0.4 | NDVI 0.4–0.5 | NDVI 0.5–0.6 | NDVI 0.6–0.7 | NDVI 0.7–0.8 |
|---|---|---|---|---|---|---|
| 2001 | 25,036 | 9613 | 3712 | 1320 | 321 | 7 |
| 2002 | 57,744 | 14,884 | 4235 | 1189 | 177 | 2 |
| 2003 | 72,583 | 24,661 | 4323 | 1049 | 108 | 0 |
| 2004 | 64,816 | 13,560 | 3630 | 965 | 135 | 0 |
| 2005 | 63,457 | 13,476 | 4218 | 833 | 61 | 0 |
| 2006 | 39,943 | 12,282 | 3896 | 871 | 92 | 0 |
| 2007 | 57,467 | 17,498 | 4120 | 954 | 120 | 2 |
| 2008 | 20,916 | 9978 | 3431 | 972 | 156 | 3 |
| 2009 | 75,356 | 23,642 | 5944 | 1090 | 131 | 2 |
| 2010 | 80,358 | 17,998 | 5545 | 1544 | 287 | 3 |
| 2011 | 36,993 | 12,657 | 4543 | 1307 | 177 | 1 |
| 2012 | 55,481 | 14,436 | 4246 | 1096 | 120 | 0 |
| 2013 | 65,988 | 15,982 | 6135 | 1377 | 208 | 4 |
| 2014 | 47,301 | 13,978 | 5699 | 1624 | 307 | 12 |
| 2015 | 69,112 | 19,007 | 7038 | 1810 | 400 | 13 |
| 2016 | 71,390 | 15,998 | 6642 | 1992 | 549 | 48 |
| 2017 | 44,531 | 14,097 | 6141 | 1517 | 219 | 4 |
| 2018 | 37,759 | 14,656 | 7531 | 2293 | 672 | 55 |
| Average | 54,791 | 15,467 | 5057 | 1322 | 236 | 9 |
| NDVI 0.2–0.3 | NDVI 0.3–0.4 | NDVI 0.4–0.5 | NDVI 0.5–0.6 | NDVI 0.6–0.7 | NDVI 0.7–0.8 | |
|---|---|---|---|---|---|---|
| DA | −0.59 * | −0.46 * | −0.68 * | −0.37 | −0.19 | −0.21 |
| Watersheds | NW | KW | HMW | HW | ADW |
|---|---|---|---|---|---|
| NW | 1 | ||||
| KW | −0.96 * | 1 | |||
| HMW | 0.87 * | −0.87 * | 1 | ||
| HW | −0.82 * | 0.73 * | −0.69 * | 1 | |
| ADW | 0.06 | −0.19 | −0.23 | −0.21 | 1 |
| NDVI 0.2–0.3 | NDVI 0.3–0.4 | NDVI 0.4–0.5 | NDVI 0.5–0.6 | NDVI 0.6–0.7 | NDVI 0.7–0.8 | |
|---|---|---|---|---|---|---|
| WINTER | −0.22 | −0.25 | −0.14 | −0.02 | 0.01 | −0.07 |
| SPRING | −0.37 | −0.40 | −0.29 | −0.25 | −0.24 | −0.22 |
| SUMMER | −0.40 | −0.40 | −0.47 * | −0.50 * | −0.46 * | −0.38 |
| FALL | −0.24 | −0.29 | −0.26 | −0.22 | −0.21 | −0.18 |
© 2020 by the authors. Licensee MDPI, Basel, Switzerland. This article is an open access article distributed under the terms and conditions of the Creative Commons Attribution (CC BY) license (http://creativecommons.org/licenses/by/4.0/).
Share and Cite
Rousta, I.; Olafsson, H.; Moniruzzaman, M.; Zhang, H.; Liou, Y.-A.; Mushore, T.D.; Gupta, A. Impacts of Drought on Vegetation Assessed by Vegetation Indices and Meteorological Factors in Afghanistan. Remote Sens. 2020, 12, 2433. https://doi.org/10.3390/rs12152433
Rousta I, Olafsson H, Moniruzzaman M, Zhang H, Liou Y-A, Mushore TD, Gupta A. Impacts of Drought on Vegetation Assessed by Vegetation Indices and Meteorological Factors in Afghanistan. Remote Sensing. 2020; 12(15):2433. https://doi.org/10.3390/rs12152433
Chicago/Turabian StyleRousta, Iman, Haraldur Olafsson, Md Moniruzzaman, Hao Zhang, Yuei-An Liou, Terence Darlington Mushore, and Amitesh Gupta. 2020. "Impacts of Drought on Vegetation Assessed by Vegetation Indices and Meteorological Factors in Afghanistan" Remote Sensing 12, no. 15: 2433. https://doi.org/10.3390/rs12152433
APA StyleRousta, I., Olafsson, H., Moniruzzaman, M., Zhang, H., Liou, Y.-A., Mushore, T. D., & Gupta, A. (2020). Impacts of Drought on Vegetation Assessed by Vegetation Indices and Meteorological Factors in Afghanistan. Remote Sensing, 12(15), 2433. https://doi.org/10.3390/rs12152433